decathlonsm moderate index - algomodels.comalgomodels.com/pdf/decathlon_moderate.pdf · standard...
TRANSCRIPT

Objective and Approach:
Using a dynamic asset allocation strategy, Decathlon Moderate Index seeks to pro-vide the upside of the equity market with the downside risk of the bond market
Decathlon Moderate Index holds ten equally-weighted exchange-traded funds selected from a broad-based universe of 112 ETFs. The index composition is re-balanced on a 5-week cycle basis.
Features:
Seeks growth in a smooth and resilient fashion through a novel loss adverse investment framework
Incorporates innovative applications of Behavioral Finance and Artificial Intelli-gence
Serves Investors who:
Desire to increase capital and are comfortable with a risk level be-tween the bond and equity mar-ket
Have a time horizon of 3 years or more and can tolerate principal volatility
$62,950
DecathlonSM Moderate Index
Performance (Avg Compound Annual Return) 1 Year 3 year 5 year 10 Year 6-15-2000 to 6-30-2015
Decathlon Moderate Index 6.94% 9.15% 10.57% 18.04% 14.48%
AIM Universe (Equal-weighted return of 112 ETFs) -2.30% 8.29% 8.10% 6.86% 6.55%
Barclays Aggregate Bond Index 2.26% 1.77% 3.32% 4.51% 5.41%
S&P 500 Total Return 7.07% 18.39% 17.28% 7.60% 4.24%
MSCI World ex US -4.89% 12.83% 9.31% 5.72% 3.88%
ETF Universe: 98 iShares, 5 SPDRs & 9 Others
Fixed Income 24
Real Estate 3
US Equity 27
Commodities 3
International Equity 48
Currency 7
Disclaimer:
Indices are unmanaged and cannot be invested in directly. Returns rep-
resent past hypothetical performance, are not a guarantee of future
performance, and are not indicative of any specific investment. Index
statistics are exclusive of management fees and transactions costs and
are not directly comparable to mutual funds and ETFs. The indices have
been published daily since 12-23-2011; prior data is backcast.
Algorithmic Investment Models, LLC [email protected] www.algomodels.com

DecathlonSM Moderate Index
The AIM Decathlon indices have been more efficient than major market indices as well as the individual ETFs in the Decathlon Universe pool. The purple dots in the figure below are the return and risk of the ETFs that are the build-ing blocks of the AIM indices. AIM’s results are due to their tactical allocation, equal weights, and defensive focus.
6-15-2000 to 6-30-2015 AIM
Moderate
AIM
Universe
Barclays Aggre-
gate Bond S&P 500 TR
MSCI World
Ex US GR
Maximum Drawdown -21.27% -42.89% -3.82% -50.95% -52.61%
Max Span down (Months) 35 37 12 73 70
Percentage of Up Months 67.4% 59.7% 68.5% 61.9% 55.8%
Standard Deviation 9.9% 13.6% 3.5% 15.5% 19.4%
Alpha 11.2% 2.7% 3.8% 0 2.8%
Beta .35 .80 -.02 1 .3
Up Capture Ratio 75.5% 87.1% 9.3% 100% 46.6%
Down Capture Ratio 26.1% 78.6% -20.4% 100% 47.6%
Sharpe Ratio 1.3 .4 1.1 .2 .2
Information Ratio .7 .3 0 0 0
R-Squared .29 .83 .01 1 .06
The Algorithmic Investment Model's (AIM) Decathlon series of indices is built on quantitative investment formulas devel-
oped using over 20 years of daily price returns. Looking out five weeks, AIM's algorithms rank Exchange-Traded Funds
(ETFs) on a variety of criteria including, but not limited to, maximizing the ratio of return to risk, minimizing the probability
of a loss, and maximizing the likelihood of exceeding some threshold return. Given the criteria rankings for each ETF, AIM
applies a composite scoring algorithm similar to an investment committee to arrive at final rankings for each ETF. The top
10 ranked ETFs are placed in the index each period.

DecathlonSM Moderate Index
Decathlon’s formulaic investment foundation combined with AIM’s proprietary software platform “Quarry” enables multi-faceted performance and risk analysis with confidence intervals. Shown below are the distributions of annual returns and index statistics of the Decathlon Moderate Index and other well-known indices based on 100,000 Mon-te Carlo simulations using data from 6-15-2000 to 6-30-2015.
On average, the Decathlon Moderate Index held 50.5% in equity-like ETFs, but it tended to own more when the S&P 500 rose and less and occasionally none when it fell.
Avg Std Avg / Std Prob of Loss 10th Pct 90th Pct
Decathlon Moderate Index 15.5% 11.1% 1.4 6.0% 2.6% 29.5%
Decathlon Universe 9.0% 15.3% 0.6 27.6% -10.1% 28.5%
Barclays Agg Bond Index 5.4% 3.7% 1.5 7.1% 0.7% 10.1%
S&P 500 Total Return 9.1% 17.7% .5 30.6% -13.2% 31.8%
MSCI World Ex US 6.4% 20.9% .3 38.9% -19.7% 33.5%
Compared with the S&P 500 TR, Decathlon Moderate’ s distribu-tion is shifted to the right. The average return is higher and the probability of loss (the area un-der the curve to the left of 0%) is lower.

DecathlonSM Moderate Index
Equity-oriented ETFs (all but Fixed
Income and Currencies) comprised
50.5% of the portfolio, but contrib-
uted 76.9% of the returns.
(Data from 6-15-2000 to 6-30-2015)

DecathlonSM Moderate Index
The algorithmic formulas underlying the Decathlon Moderate Index have historically exhibited statistical structure. The 3-D chart below displays the frequency of outcome in Z-scores of predicted (Model Ranking) vs. outcomes (Performance). As can be seen top ranks have landed in the top, middle ranks, in the middle, and low ranks, at the bottom. Thus the algorithms are not only good at selecting top performers, they are also good at predicting all out-comes.
The Chart below shows the change in volatility (or the variability around the return) of the ETFs prior and post pur-chase. Interestingly, not only have the algorithms historically selected good performers, the good performers them-selves have lower volatility during the time period they are held.
(Data from 6-15-2000 to 6-30-2015)
Common Questions and Answers
What information and process were used to create the mathematical formula underlying the AIM Decathlon Moderate Index?
AIM’s models are based on an expansive set of customary and proprietary return-oriented variables. These factors are derived from a survivor-free database of ETF and index pric-es. The Decathlon Family of investment models was discov-ered using AIM's self-developed financial data mining platform. The framework creates and tests algorithmic in-vestment rules employing a computerized version of Dar-winian evolution. The fund scoring formula underlying the AIM Decathlon Moderate Index is the cumulative evolution-ary winner of many generations of a "survival of the fittest"
financial competition involving more than a million invest-ment algorithms.
How does the investment process work?
On a daily basis, AIM updates its database of equity prices and derived-variables and then re-scores and re-ranks the individual exchange-traded funds according to the AIM De-cathlon Moderate Index’s formula. If an ETF’s rank drops below the 10th rank, it is replaced with the highest ranked ETF not held.
What innovations make your investment software technology unique?
AIM has made both conceptual and technological break-throughs. Regarding portfolio construction and risk-
DecathlonSM Moderate Index
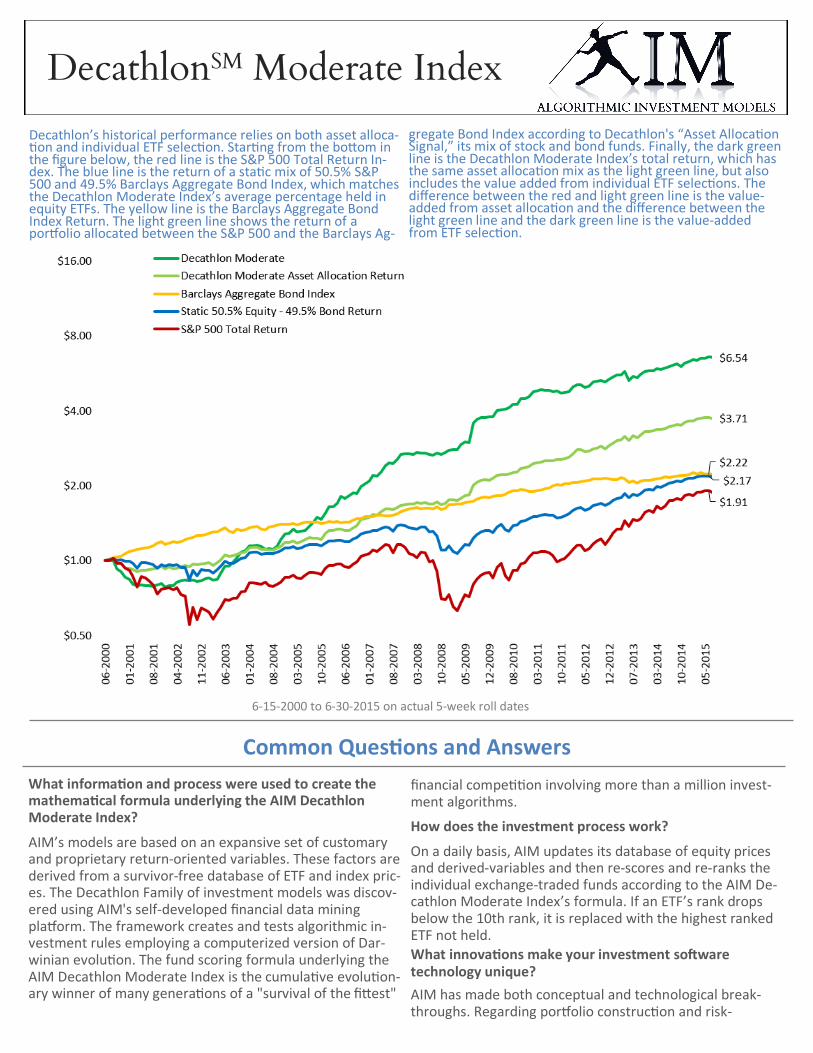
Decathlon’s historical performance relies on both asset alloca-tion and individual ETF selection. Starting from the bottom in the figure below, the red line is the S&P 500 Total Return In-dex. The blue line is the return of a static mix of 50.5% S&P 500 and 49.5% Barclays Aggregate Bond Index, which matches the Decathlon Moderate Index’s average percentage held in equity ETFs. The yellow line is the Barclays Aggregate Bond Index Return. The light green line shows the return of a portfolio allocated between the S&P 500 and the Barclays Ag-
gregate Bond Index according to Decathlon's “Asset Allocation Signal,” its mix of stock and bond funds. Finally, the dark green line is the Decathlon Moderate Index’s total return, which has the same asset allocation mix as the light green line, but also includes the value added from individual ETF selections. The difference between the red and light green line is the value-added from asset allocation and the difference between the light green line and the dark green line is the value-added from ETF selection.
6-15-2000 to 6-30-2015 on actual 5-week roll dates

management, AIM has successfully integrated into the for-mulation process key concepts from Behavioral Finance relating to the asymmetry of people’s emotional response to gains and losses. As a result, in historical backtests, the Decathlon Family of products provided superior downside protection compared with competing ETFs and produced gains more smoothly and reliably. AIM has also discovered a novel investment factor that unifies the momentum and value approaches thereby generating extraordinary histori-cal returns. On the technological front, AIM has developed a financial analysis and data mining platform that is notable for its robustness, novel analytics, and its sheer parallel computational power. The system is searching for better models and new financial patterns 24 x 7.
How often does the portfolio turnover?
On average, the AIM Decathlon Moderate Index turns over 4 of every 10 ETFs held upon the completion of the 5 week hold period. This corresponds to an annual turnover rate nearly 400%.
Why is there so much trading activity?
Principals
77% of the AIM Decathlon Moderate Index’s historical per-formance was generated by 51% of the investments it made in equity and specialized sector ETFs. This ability to identify when individual equity ETFs and the equity market in general offered compelling short-term returns for mod-est risk was the AIM Decathlon Moderate Index's key in-vestment "edge". From a statistical and games of chance perspective, the more frequently we are able to trade and thereby "recycle" our bets, the larger our statistical sample becomes, and the more likely we will be able to achieve the historical annual return attributable to the investment edge assuming that past patterns persist in the future.
What about after-tax returns?
The AIM Decathlon Moderate Index seeks to be efficient from a return / risk perspective and not necessarily from a tax perspective. While ideally suited for retirement ac-counts, the after-tax returns still make it an attractive vehi-cle for non-qualified accounts. Especially given that even non-qualified accounts will eventually have to pay taxes at distribution.
Gordon Bennett
Mr. Bennett has worked in the financial markets for over 25 years as a trader, insti-tutional portfolio manager, and investment advisor. A graduate of Harvard Univer-sity with a degree in East Asian Languages and Civilizations, Mr. Bennett also earned a MA in Economics from New York University and is a CFA charter holder.
Todd Rice
Mr. Rice has designed billion dollar institutional products for major Wall Street firms, worked as an equity portfolio manager, and ran a hedge fund. He holds a Math degree from the University of Chicago and a MPP from the Kennedy School at Harvard University.
Mr. Bennett and Mr. Rice collectively hold two software patents in Genetic Pro-gramming (6,634,019 and 6,973,560).
DecathlonSM Moderate Index
Index data quoted represents hypothetical results from 6-15-2000 through 6-30-2015. Past index returns are not a guarantee of future results. Returns are exclusive of management fees and any commissions and trading costs. Beaumont Financial Partners licenses the Algo-rithmic Investment Models (AIM) indices, and manage portfolios utilizing the model’s signals. Actual investment returns may vary from model returns.
iShares does not endorse or sponsor and is not affiliated with AIM.