deammonification efficiency in combined uasb and ifas system …1120235/... · 2017-07-05 ·...
TRANSCRIPT

INOM EXAMENSARBETE MILJÖTEKNIK,AVANCERAD NIVÅ, 30 HP
, STOCKHOLM SVERIGE 2017
Deammonification efficiency in combined UASB and IFAS system for mainstream WWT
NOUREDDINE KHAYI
KTHSKOLAN FÖR ARKITEKTUR OCH SAMHÄLLSBYGGNAD


Deammonification efficiency in combined UASB and IFAS system for
mainstream WWT
Noureddine Khayi

ii
TRITA LWR Degree Project
ISSN 1651-064X
LWR-EX 2017:07
i
Abstract The study is about Nitrogen removal from the low concentrated mainstream wastewater after Upflow Anaerobic Sludge Blanket reactor process (UASB) by single-stage Partial Nitritation/Anammox process in a pilot scale reactor at Hammarby Sjöstad in Stockholm.
A mixture of various concentrations of dissolved oxygen and different aeration methods have been tested in the pilot scale reactor in five months divided into five periods where the temperature was set at 15° C throughout the study. The best result was in period 4, the average nitrogen removal efficiency was 52% varying between 40 and 60 % with aeration method of the ratio R = 1/3 (R = 20 minutes with aeration to 40 minutes without aeration) and a dissolved oxygen concentration of 1.3 mg/L.
Partial nitritation/Anammox is considered more environmentally friendly due to reduced energy requirements for aeration, no need for an external carbon source. The process also allows for a more cost-effective nitrogen removal from wastewater.
Key words:
Ammonium; Nitrite; Nitrate; Deammonification; UASB; MBBR; DO; Aeration, monitoring; on-line control

ii

iii
Sammanfattning Vatten är nödvändigt för existensen av allt liv på jorden och spelar en avgörande roll i alla mänskliga aktiviteter. Antropogena aktiviteter förorenar denna viktiga resurs och medför stor risk för människors och djurs hälsa samt växter. Kvävebelastning från jordbruket och avloppsvatten i mark- eller vattenmiljön har resulterat till övergödning, vilket är ett miljö- och ekonomiskt problem på grund av en obalans mellan ekosystemtillförseln och den naturliga näringsförbrukningen.
I denna studie behandlades avloppsvatten i en pilotskala reaktor med en integrerad fastfilm aktiverat slam (IFAS) som drivs med ett enstegs partial nitritation/Anammox-process. Kväverening från den lågkoncentrerade huvudström avloppsvatten efter Uppflöde Anaerob Slam Blankett reaktor process (UASB) undersöktes. En blandning av olika koncentrationer av upplöst syre och olika luftningsmetoder har testats i pilotskala reaktorn i fem månader uppdelad i fem perioder där temperaturen sattes vid 15° C under hela studien.
De bästa resultaten i kväve reningseffektivitet var 52 % i genomsnitt i period 4 varierande mellan 40 och 60 %, luftningsmetod med ett förhållande av R = 1/3 (R = 20 minuter med luftning till 40 minuter utan luftning) och ett upplöst syre Koncentration av 1,3 mg/l. Jämförelsen tog hänsyn till alla former av utsläpp av kväve- och energikostnader för luftning.
Under de senaste decennierna har vattenbehandlingsprocesserna haft många positiva utvecklingar, vilket har lett till en kvalitetsförbättring av vatten samtidigt som kostnaden för kväveavlägsnande från avloppsvatten har minskat. För närvarande flyttar kvävereningsteknik från konventionell

iv
nitrifikations/denitrifikationsprocessen till partiell nitritation/Anammox (PN/A) -processen kallad deammonification. Det verkar som om den största svårigheten är att upprätthålla en stabil ackumulation av nitrit medan man försöker delvis med nitritation av ammonium. Partiell nitritation/Anammox (PN/A) anses vara mer kostnadseffektivt avlägsnande av kväve från avloppsvatten, mer miljövänligt än konventionella nitrifikations-denitrifikationsprocesser på grund av minskat energibehov för luftning och inget behov av en yttre källa av kol.

v
Preface It is a pleasure to thank my supervisor Professor Elżbieta Płaza who made this interesting thesis possible. It allowed me to investigate a subject of current importance and to learn a lot, from both theoretical and practical points of view. I appreciate your support, constructive advices and suggestions. Thank you for many ‘brain storm’ discussions.
I am also thankful Dr. Józef Trela for the leadership of deammonification project and devoting lots of his time on discussion about the Anammox tests and sharing his experience about experimental work and his contribution regarding the pilot plant reactor.
Thanks, go also to Jesper Karlsson and many others from Swedish Environmental Research Institute (IVL), for their kindness, assistance and help when needed and for creating a friendly and pleasant atmosphere at the Hammarby Sjöstadsverk research facility.
Finally, I am deepest thankful to my family, this thesis would not be possible without the support of my wife and my children by helping me every time I need it. I wish to acknowledge all people, whom I might have not mentioned here and who have either directly or indirectly affected my professional life.
Noureddine Khayi
Stockholm, April 2017

vi

vii
Summary in English Water is necessary for the existence of all life on earth and plays a decisive role in all human activities. Anthropogenic activities pollute this important resource and cause a great risk to the health of human, animal and plant. Nitrogen load from agricultural areas and wastewater wastes into the soil or aquatic environment has resulted in eutrophication, which is an environmental and economic problem due to an imbalance between the ecosystem supply and natural nutrient consumption.
In this study, wastewater was treated in a pilot scale reactor with an integrated fixed film activated sludge (IFAS) operated with a one-stage partial nitritation/Anammox process. Nitrogen removal from the low concentrated mainstream wastewater after Upflow Anaerobic Sludge Blanket reactor process (UASB) was investigated. A mixture of various concentrations of dissolved oxygen and different aeration methods have been tested in the pilot scale reactor in five months divided into five periods where the temperature was set at 15 ° C throughout the study.
The best outcomes in nitrogen removal efficiency was 52% on average in period 4 varying between 40 to 60%, aeration method with a ratio of R = 1/3 (R = 20 minutes with aeration to 40 minutes without aeration) and a dissolved oxygen concentration of 1.3 mg/L. The comparison took into account of all forms of emissions of nitrogen and energy costs for aeration. Over the last few decades, water treatment processes havehad many positive developments, which have led to a quality improvement of water sources while reducing the cost of nitrogen removal from wastewater. At present, nitrogen removal technology is moving from conventional Nitrification/Denitrification process to partial nitritation/Anammox (PN/A) process called deammonification. Optimizing the process of halting

viii
nitrification at the nitrite stage sometimes can be difficult. It appears that the greatest difficulty is maintaining a stable accumulation of nitrites while attempting to partially nitritation of the ammonia. Partial nitritation/Anammox (PN/A) is considered to be more cost-effective removal of nitrogen from sewage, more environmentally friendly than conventional nitrification-denitrification processes due to reduced energy requirements for the aeration and no need for an external source of carbon.

ix
Contents Abstract ............................................................................................... i
Sammanfattning ............................................................................... iii
Preface ................................................................................................. v
Summary in English ........................................................................ vii
Contents .............................................................................................ix
List of Figures ................................................................................. xiii
List of Tables .................................................................................... xiv
Abbreviations and symbols .............................................................. xv
1. Introduction ............................................................................... 1
1.1 Nitrogen in the ecosystem ............................................... 1
1.2 Environmental problems related to nitrogen discharges 2
1.3 Legislative requirements for nitrogen removal from wastewater ..................................................................................... 2
2. Nitrogen removal processes in wastewater treatment ............ 3
2.1 Involved bacteria in two steps nitrification .................... 4
2.2 Involved bacteria in denitrification ................................ 4
2.3 Conventional nitrification/denitrification ......................5
2.3.1 Nitrification .......................................................................5
2.3.2 Nitritation .........................................................................5
2.3.3 Nitratation ....................................................................... 6
2.3.4 Denitrification ................................................................. 6
2.4 Anammox ........................................................................ 6
2.5 Partial nitritation/ Anammox (PN/A) - Deammonification ....................................................................... 8
2.6 High rate activated sludge (HRAS) + PN/A ................... 9

x
2.7 Upflow anaerobic sludge blanket reactor (UASB) + PN/A ……………………………………………………………………………..9
3. Factors affecting the process efficiency (PN/A) .................... 10
3.1 Dissolved oxygen (DO) .................................................. 10
3.2 pH .................................................................................... 11
3.3 Temperature ...................................................................12
3.4 Chemical oxygen demand (COD) ...................................12
3.5 The hydraulic retention time .........................................13
3.6 Total suspended solids TSS ............................................13
3.7 Redox ............................................................................. 14
4. Aim of study ............................................................................ 14
5. Materials and methods ........................................................... 16
5.1 Hammarby Sjöstadsverket ............................................ 16
5.2 Experimental strategy ................................................... 16
5.3 Scheme flow for study ................................................... 18
5.4 Pilot reactor description ................................................ 18
5.5 On-line measurements - Adjustment and calibration . 20
5.6 Laboratory analysis ........................................................21
5.7 Difficulties ...................................................................... 22
6. Results and discussion ........................................................... 22
6.1 Evaluation of (UASB) based on laboratory analysis …………………………………………………………………….22
6.2 Evaluation of pilot scale reactor based on laboratory analysis 23
6.2.1 Nitrogen conversions ..................................................... 23
6.2.2 Nitrogen removal efficiency .......................................... 24
6.2.3 Nitrogen removal efficiency, NO2-N and NO3-N ......... 25

xi
6.2.4 Influence of dissolved oxygen on pH and Nitrogen removal ................................................................................... 26
6.2.5 Nitrogen removal and COD/ influent Nitrogen (NH4-N) ..................................................................................................27
6.2.6 Nitrogen removal and MLSS ........................................ 28
6.2.7 Nitrogen removal and NO3-N produced/ NH4-N removed .................................................................................. 28
6.2.8 Influence of COD on Nitrogen removal efficiency ....... 29
6.2.9 Influence of alkalinity on nitrogen removal efficiency 30
6.2.10 NL (nitrogen load) and NRR (nitrogen removal rate) 31
6.3 Aeration strategy and DO concentration ..................... 32
6.3.1 Influence on nitrogen removal efficiency .................... 32
6.3.2 Comparison of different aeration periods with the same DO concentration ................................................................... 34
6.4 Evaluation of the aeration strategy and DO based on on-line measurements ...................................................................... 34
6.5 Summary ....................................................................... 39
7. Conclusions .............................................................................. 41
8. References ............................................................................... 43
9. Appendix ..................................................................................47

xii

xiii
List of Figures Figure 1: Mainstream deammonification (UL 2007) ....................... 8
Figure 2: High Rate Activated Sludge and PN/A (Ghent University 2017) ................................................................................................... 9
Figure 3b: The pilot reactor and Kaldnes carrier K1 ....................... 19
Figure 4: Influent and effluent COD from UASB reactor and Nitrogen removal efficiency in pilot reactor ................................... 23
Figure 5: Nitrogen conversions ....................................................... 24
Figure 6: Nitrogen removal efficiency- Average value during the study ................................................................................................. 25
Figure 7: Nitrogen removal efficiency and effluent Nitrite and Nitrate .............................................................................................. 26
Figure 8: Influence of pH on Nitrogen removal ............................. 26
Figure 9: Pilot reactors COD in/ NH4-N and Nitrogen removal efficiency ...........................................................................................27
Figure 10: Mixed liquor suspended solids and Nitrogen removal efficiency .......................................................................................... 28
Figure 11: Nitrogen removal and the ratio of NO3-N produced to NH4-N removed ............................................................................... 29
Figure 12: Influent and effluent COD from the pilot reactor and nitrogen removal efficiency ............................................................. 30
Figure 13: Influence of Alkalinity on NR efficiency ........................ 31
Figure 14: Nitrogen removal rate, nitrogen load, Nitrogen removal efficiency and NRR/NL ................................................................... 32
Figure 15: Nitrogen removal efficiency and selected periods (T1-T4) .......................................................................................................... 35
Figure 16: On-line measurements data of NH4-N, NO3- N and DO ........................................................................................................... 37
Figure 17: On-line measurement data of NH4-N, NO3-N, DO and NO2-N ............................................................................................... 38

xiv
Figure 18: On-line measurement data of NH4-N, NO3- N and DO 39
List of Tables Table 1 Tested variable in different periods ..................................... 17
Table 2 Energy costs and ranking of periods .................................. 34
Table 3 Effluent nitrogen and Nitrogen removal efficiency ........... 40

xv
Abbreviations and symbols ANAMMOX ANaerobic AMMonium OXidation AOB Ammonium Oxidizing Bacteria NOB Nitrite Oxidizing Bacteria
PN/A Partial Nitrification/ Anammox = Deammonification
HRT Hydraulic Retention Time SRT Sludge Retention Time MLSS Mixed Liquor Suspended Solids IFAS Integrated Fixed Film Activated Sludge N2 Nitrogen gas NH4-N Nitrogen in Ammonium form NO2-N Nitrogen in Nitrite form NO3-N Nitrogen in Nitrate form COD Chemical Oxygen Demand HRAS High Rate Activated Sludge UASB Upflow Anaerobic Sludge Blanket Reactor MBBR Moving Bed Biofilm Reactor NR Nitrogen Removal WWTP Waste Water Treatment Plant (p.e.) population equivalents


1 l Introduction
1. Introduction Water is essential for the existence of all life on earth and it plays a crucial role in all human activities. In the modern world, anthropogenic activities are polluting this crucial resource and poses a major risk to the health of humans, animals and plants (Townsend 2015). Excess nitrogen loading from agricultural runoff and wastewater discharges in the terrestrial or aquatic environment has resulted in eutrophication, which is an environmental and economic problem due to an imbalance between supply and natural nutrient consumption by the ecosystem.
Past few decades, water treatment processes have seen many positive developments, which have led to quality improvement of water sources while reducing cost of nitrogen removal from wastewater. Currently, nitrogen removal technology is moving from conventional Nitrification/Denitrification process to partial nitritation/Anammox (PN/A) called deammonification. PN/A treatment setup is considered more environmental friendly compared to conventional nitrification/denitrification processes due to; decreased energy requirements, exclusion of external carbon source and lower emission of greenhouse gases. The PN/A treatment process is relatively more cost effective while showing higher nitrogen removal efficiency (Strous 1999).
1.1 Nitrogen in the ecosystem Nitrogen constitutes 78% of the atmospheric air and is essential for life. However, excess nitrogen in water is potentially toxic to living organisms. The nitrogen cycle is a biogeochemical cycle which describes the succession of changes in the forms of neutral nitrogen into reactive forms of nitrogen, nitrate, nitrite, ammonia and organic nitrogen (Townsend 2015). The conversion of nitrogen is done either through biological or physical processes and the cycle
Introduction l 2
include various processes (fixation, ammonification, nitrification, and denitrification) as different forms of nitrogen circulates through atmosphere, soil, water, plants and animals (Lin et al. 2000). Human activity such as fossil fuel emission, use of nitrogen containing chemical fertilizers in agriculture and nitrogen in wastewater etc. affect the global nitrogen cycle (Moss et al. 2013).
1.2 Environmental problems related to nitrogen discharges
Nitrogen oxides and phosphates are believed to play an important role in eutrophication. This causes to a phenomenon of degradation of an aquatic environment. This is usually caused by an increase in the nutrients present, from natural sources (e.g. forests, moist) or anthropogenic e.g. agricultural fertilizers, emissions from the residential, municipal, agricultural and industrial sectors (Barrett 1972). The abundance of nutrients in the water and favourable weather conditions, heat and abundant sunshine increases production of algae and results in subsequent lack of oxygen. This can lead to the death of aquatic organisms if the concentration of dissolved oxygen becomes too low. This quickly converts lakes to the wetlands and the ecosystem loses many eco species(Chapman D.V.2008).
1.3 Legislative requirements for nitrogen removal from wastewater
European wastewater directive requires member States processing plants, in terms of nitrogen removal. Nitrogen requirements mean the following(Neal & Heathwaite 2005):
• The effluent nitrogen level should be below a certain level.
• Nitrogen reduction of nitrogen should exceed a certain percent level.

3 l Nitrogen removal processes in waste water treatment
All member States have pledged to the EU to reduce the nitrogen concentration in the wastewater discharge. Each country can set the level of focus, but cannot exceed the dictates of guidance. This means that wastewater treatment from 10,000 to 100,000 population equivalents (p.e.) must meet the following conditions for content or reduced to meet the directive to eliminate nitrogen requirements. The total effluent nitrogen content of the wastewater treatment plant must not exceed 15 mg N/L and 10mg N/Labove 100 000 population equivalents or decrease in the proportion of nitrogen in some sensitive areas, and retention of nitrogen must be at least 70 percent, this means reduction in relation between load and effluent nitrogen(Neumann et al. 2011).
The Swedish authorities have decided to set a minimum according to Swedish maximum level of nitrogen in the drainage of water and should not exceed 10 mg N/L. These are of course minimum requirements (Lundberg 2011).
2. Nitrogen removal processes in waste water treatment
Nitrogen is separated from the wastewater by different mechanisms: physical by decantation when the nitrogen is bound to suspended solids. Physicochemical stripping in the form of ammonia gas when the pH is basic and nitrification-denitrification process.
Most of the treatment is linked to physical processes (decantation, sequestration) and especially the traditional biological process (nitrification and denitrification) or partial nitratation followed by Anaerobic Ammonium Oxidation (Anammox). This two-phase process, known as partial nitratation/ Anammox (PN/A) or deammonification were been achieved in two-steps and one single-stage systems (Strous 1999). Deammonification process can optimize the treatment process and assure a high nitrogen

Nitrogen removal processes in waste water treatment l 4
removal and has additional advantages as aeration cost reduction and no need for an external source of carbon.
2.1 Involved bacteria in two steps nitrification
The traditional method of nitrogen removal is based on nitrification and denitrification using biological process. Nitrification process involves the oxidation of ammonium to nitrates in two steps. In the first step, ammonium is oxidized to nitrite with the help of ammonia oxidizing bacteria (AOB) called Nitrosomonas (Alzate Marin et al. 2016).
NH+4+ 1.5O2 →NO−
2+ 2H++ H2O (1) Along the reaction, energy is formed which is used for new biomass production. In the second step, nitrite is oxidized to nitrates in the presence of nitrate oxidizing bacteria (NOB) called Nitrobacter (He et al. 2016).
NO−2+ 0.5O2 →NO−
3(2)
2.2 Involved bacteria in denitrification The denitrification process breaks down nitrates and nitrites to nitrogen gas with the help of heterotrophic bacteria using carbon compound as energy and nitrates as electron acceptor. The process takes place in anoxic condition(Knowles 1982).
NO3→NO2→NO→N 2O→N 2 (3) Denitrification only occurs significantly if the concentration of dissolved oxygen in the medium is close to zero. This lack of oxygen is necessary for the bacteria to adopt a more complex, slow and energetically more expensive metabolic pathway than that directly using dissolved oxygen(Yang et al. 2015).
5 l Nitrogen removal processes in waste water treatment
2.3 Conventional nitrification/denitrification Nitrification-denitrification process can be configured either in post-denitrification or pre-denitrification mode, depending whether to the organic source is exogenous or endogenous. Although both configurations have their own pros and cons, pre-denitrification mode is still the preferred configuration in most biological nutrients removal treatment plants. 2.3.1 Nitrification Nitrification consists of the biological oxidation of ammonium nitrogen to nitrates. This transformation is carried out in two stages: nitritation, followed by nitratation. It is carried out in the presence of oxygen by autotrophic bacteria which use ammonium nitrogenNH4-N and carbonates (HCO−
3) as an energy source(Alzate Marin et al. 2016). 2.3.2 Nitritation Nitritation is the oxidation of ammonium N +
4 to nitrite NO
−2 by autotrophic bacteria- Nitrosomonas, Nitrosococcus
or Nitrospira. The ammonium nitrogen transformation is described in the chemical equation(1)(Gilbert et al. 2015). The biological equation that describes synthesis of nitrifying bacteria is, 80.7 NH+
4 + 114.55 O2 + 160.4HCO3 →C5H7NO2 + 79.7 NO−2
+ 82.7 H2O + 155.4 H2CO3 (4)
The reaction is accompanied by a theoretical production of nitrite biomass and shows a decrease in the alkalinity of the culture medium.

Nitrogen removal processes in waste water treatment l 6
2.3.3 Nitratation Bacteria of the genus Nitrobacter oxidize the nitrites (NO−
2) to nitrates (NO−
3), the chemical reaction (2). The stoichiometric equation of nitrification finally described as (Henze et al.1995),
NH+4 + 1.86 O2 + 1.98 HCO−
3- ----> 0.020 C3H7NO2 + 0.98
NO−3 + 1.88 H2CO2 + 1.04 H2O (5)
2.3.4 Denitrification Denitrification consists of a reduction of nitrates to gaseous nitrogen by heterotrophs bacteria of the species Pseudomonas in the absence of dissolved oxygen with presence of nitrates (Pelmont 1993). Organic matter used as a source of carbon and nitrates as electron acceptors. The stoichiometric equation of the biological reaction is,
NO−3 + 0.0714 C18H19O9N + H+---> 0.5 N2 + 1.214 CO2 +
0.0714 HCO+3 + 0.0714 NH+
4 + H2O (6)
2.4 Anammox The anammox process allows the conversion of ammonium to nitrogen gas using nitrite as an electron acceptor. It was discovered in 1995 in a wastewater treatment plant and now appears to be omnipresent in suboxic environments all around the globe (Thamdrup et al. 2012). It contributes significantly to the formation of nitrogen gas in oxygen-poor areas of the water column and anoxic sediments. It is recognized as having a great importance in the nitrogen cycle in the marine environment (30 to 50% of the molecular nitrogen produced) and in the field of wastewater treatment. The anammox process linked to a monophyletic

7 l Nitrogen removal processes in waste water treatment
group of bacteria belonging to the phylum of the Planctomycetes. The bacteria carrying out this process still poorly known, but unique. They contain a specific intracellular compartment, the anammoxosome, which occupies a large volume of cells and is where the anammox process takes place. The membrane of this vesicle consists of lipids possessing a particular chemical structure, which consists of three or five cyclobutane cycles joined. These molecules with constrained geometry form an extremely dense barrier, thus greatly reducing membrane permeability to small molecules, notably hydrazine N2H4, an intermediate and highly toxic product of the anammox reaction (Kuenen 2008). In the biological process, the ammonium cation NH4
+ oxidizes nitrite anion NO2
− to give N2 , this process contributes 30 to 50 % of the nitrogen produced in the oceans:
NH4+ + NO2
− → N2 +2H2O (7) The first step is the partial nitritation, half of ammonium to nitrite by bacteria such as Nitrosomonas, In the second step Anammox, bacteria convert ammonium NH4
+ and nitrite NO2− to nitrogen N2 and about 15 % of
nitrateNO−3.
Both processes can take place in a single reactor in which the two bacteria form compact granules (Duan et al. 2011). Influent ammonium and nitrite concentrations play a major role in Anammox speed reaction. The abundance of ammonium and in particular nitrite can inhibit the Anammox reaction. In a previous research report (Trela et al. 2008):
( gNm−2 d−1) = k1 · (NH4-N)1/2· (NO2-N)1/2
Nitrogen removal processes in waste water treatment l 8
Where,
NH4-N= Ammonium, g Nm-3 (mgNL-1) (NH4-N)
NO2-N = Nitrite, g Nm−3(mgNL−1)(NO2-N)
k1 = constant rate, m d−1
2.5 Partial nitritation/Anammox (PN/A) - Deammonification
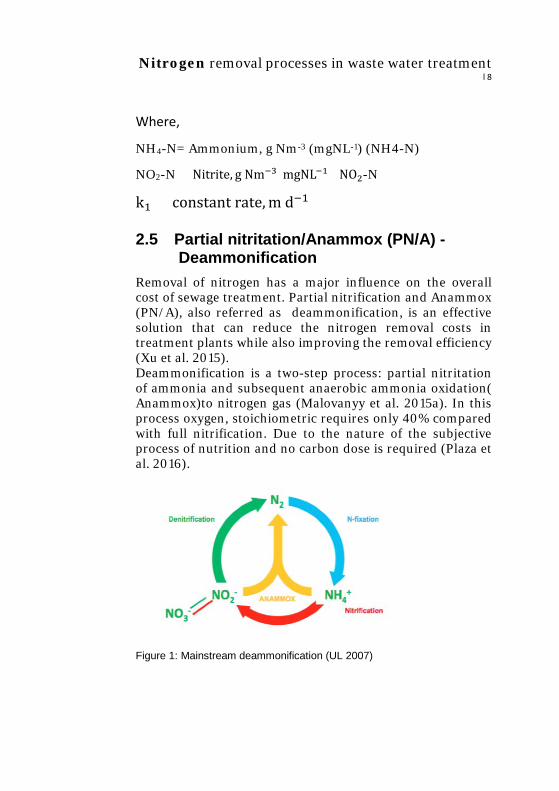
Removal of nitrogen has a major influence on the overall cost of sewage treatment. Partial nitrification and Anammox (PN/A), also referred as deammonification, is an effective solution that can reduce the nitrogen removal costs in treatment plants while also improving the removal efficiency (Xu et al. 2015). Deammonification is a two-step process: partial nitritation of ammonia and subsequent anaerobic ammonia oxidation( Anammox)to nitrogen gas (Malovanyy et al. 2015a). In this process oxygen, stoichiometric requires only 40% compared with full nitrification. Due to the nature of the subjective process of nutrition and no carbon dose is required (Plaza et al. 2016).
Figure 1: Mainstream deammonification (UL 2007)
9 l Nitrogen removal processes in waste water treatment
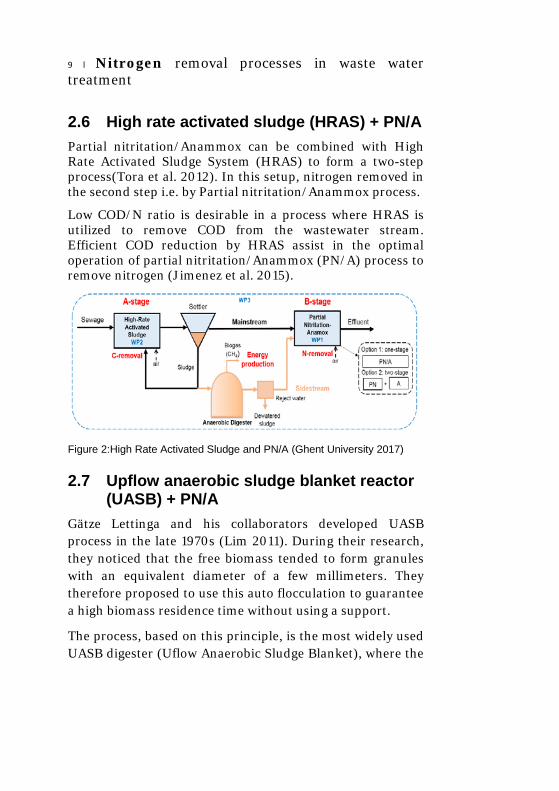
2.6 High rate activated sludge (HRAS) + PN/A Partial nitritation/Anammox can be combined with High Rate Activated Sludge System (HRAS) to form a two-step process(Tora et al. 2012). In this setup, nitrogen removed in the second step i.e. by Partial nitritation/Anammox process.
Low COD/N ratio is desirable in a process where HRAS is utilized to remove COD from the wastewater stream. Efficient COD reduction by HRAS assist in the optimal operation of partial nitritation/Anammox (PN/A) process to remove nitrogen (Jimenez et al. 2015).
Figure 2:High Rate Activated Sludge and PN/A (Ghent University 2017)
2.7 Upflow anaerobic sludge blanket reactor (UASB) + PN/A
Gätze Lettinga and his collaborators developed UASB process in the late 1970s (Lim 2011). During their research, they noticed that the free biomass tended to form granules with an equivalent diameter of a few millimeters. They therefore proposed to use this auto flocculation to guarantee a high biomass residence time without using a support.
The process, based on this principle, is the most widely used UASB digester (Uflow Anaerobic Sludge Blanket), where the

Factors affecting the process efficiency (PN/A) l 10
upward flow balances the tendency of the aggregates to sediment, and ensures the suspension of the biomass (Malovanyy et al. 2015b). A liquid/gas/ solid separation system placed at the top of the digester makes it possible to retain the biomass in the reactor. The recirculation serves to agitate and to homogenize the medium, which fits perfect the deammonification process to remove nitrogen(Qiu et al. 2013).
Outflow water from UASB flows through the filters and sludge tank before reaching the pilot scale reactor. There four filters that designed to keep particles of greater consistency. The first filter is constructed of stainless steel metal mesh, the second and the third filter is composed of fibers and the forth one is in polyester. The filters are washed twice a week, and fiber filter replaced once a month.
3. Factors affecting the process efficiency (PN/A)
3.1 Dissolved oxygen (DO) Dissolved oxygen is used as terminal electron acceptor for Nitrifying bacteria to perform the reactions of nitrification. Thereby a dissolved oxygen deficiency can lead to a slowing and even stopping of the reaction (Trela 2000).
Dissolved oxygen measured in milligrams of oxygen per liter of water (mg/L) or as a percentage of saturation. Dissolved oxygen and ammonia nitrogen are essential reagents for nitrification. When it is present in a non-limiting quantity, the growth of the Autotrophic bacteria is maximum. When one of the two reagents become restrictive, it slows down the growth rate of bacteria (Henze et al.1995).
11 l Factors affecting the process efficiency (PN/A)
Some main factors that can cause dissolved oxygen to vary:
- Temperature of water, cold water generally contains more dissolved oxygen than hot water
- Greater stirring of the water increases the contact of water with air and consequently increases dissolved oxygen level
- Consumption by bacteria that degrade organic matter decreases the dissolved oxygen content.
3.2 pH pH influences directly the growth of nitrifying bacteria (Antoniou et al.1990; Shammas 1986). The highest activity is reached for pH values between 8 and 9 but it´s often not significantly affected to a pH of 7. Beyond these optimal pH values are 7 to 9, the rate of growth of the biomass Nitrifying drops significantly reflecting partial inhibition of its activity. The pH-related constraints can be summarized as follows (Fajardo et al. 2014):
For a pH greater than 9, the predominant species of the NH4
+ / NH3 pair is ammonia NH3, which is toxic to Nitrobacter and Nitrosomonas bacteria(Yang et al. 2015).
For a pH below 6, the predominant species of the couple HNO2 / NO2
− is nitrous acid HNO2which is toxic to Nitrobacter bacteria. When the pH differs from optimal values, the bacteria adapt their growth. The pH is considered to be optimum in the range of 6.5-7.5 (Xu et al. 2015).
pH values change due to changes in ammonium hydrogen carbonate concentration (Plaza et al. 2011).pH 7 benefits most growth rate of NOB, which is eight times higher than AOB if compared to pH 8. Variations in pH affect the solution in the pilot scale reactor to an alkaline environment that benefits most Anammox. It produced more NH3 at
Factors affecting the process efficiency (PN/A) l 12
higher pH as substrate for AOB and less HNO2 as substrate for NOB (Zhang et al. 2014).
3.3 Temperature Pilot reactors temperature was set to 15°C throughout the study. Tempering was made by means of a thermostat set at 15°C with two electrodes stopped in the reactor and controlled by a portable thermometer; any change in temperature has an immediate impact on the activity of the Nitrifying biomass. However, adaptation time is required for autotrophic bacteria to take their final growth rate(Fajardo et al. 2014).
In a sudden increase in temperature, there is an increase in growth rate. When temperature decreases, there is a rapid and amplified decrease in the growth rate and the impact of a sudden change in temperature on the autotrophic growth rate (Henze et al. 1995).
Studies have shown that most of processes have been achieved the best results in the nitrogen removal above 15 °C (Clippeleir et al. 2013). At high temperature starts Ammonium Oxidizing Bacteria (AOB) to compete with Nitrite Oxidizing Bacteria (NOB)(Zhang et al. 2014).
3.4 Chemical oxygen demand (COD) The chemical oxygen demand (COD) expressed in milligrams of oxygen per liter. It represents the total oxidable material in the wastewater. COD is the use of dioxygen by chemical oxidants to oxidize organic and inorganic substances in the wastewater. This makes it possible to evaluate the pollutant load of wastewater. The ratio COD/N of influent wastewater directly influences competition between autotrophic and heterotrophic organisms in the reactor (Zhang et al. 2015).

13 l Factors affecting the process efficiency (PN/A)
COD is one of the most important parameters in wastewater treatment but to be more specific, it is recommended to use the Total Organic Carbon (TOC) that is much more reliable and can be measured online (Tran et al. 2015)
3.5 The hydraulic retention time The hydraulic retention time (HRT) is the average time that the influent water remains inside the reactor (Boonnorat et al. 2016) before reaching the sedimentation tank (Cydzik-Kwiatkowska et al. 2014). In this study, the incoming flow to the 200-liter pilot reactor is 13.8 L/h, which results in a HRT of 14 hours and 48 minutes.
HRT =Volume of aeration tank (m3)
Influent flowrate �m3
h �
Increase in HRT generally leads to a lower yield of biomass concentration and in a reduction in average biomass grain size(Joselin Herbert & Unni Krishnan 2016).
3.6 Total suspended solids TSS The total suspended solids (TSS) are those unsolved solids present in a wastewater sample expressed in mg/L of a diameter larger than 1 micron in water, which collected on the filter paper because of the filtering of the sample. They include both inorganic and organic substances and settle spontaneously (Gilbert et al. 2015).
TSS of wastewater closely related to the use of the land from which they originate and the story of their transformation according to the hydrological and climatic conditions and season. They include all the undissolved substances suspended in runoff in case if this water mixed up with sewage in the same pipes to the treatment plant (Malovanyy et al. 2015a).

Aim of study l 14
3.7 Redox Like the pH, redox makes it possible to qualify an aqueous solution and to classify it in solution rather oxidizing (presence of oxygen) or rather reductive (lack of oxygen). Oxidation means that an ion or molecule loses electrons. An oxidation automatically accompanied by a reduction or gain of electrons. The measurement of this electronic activity called the oxido-reduction or redox potential, which expressed in mv. Unlike pH, there are no chemical or paper tests to determine this parameter (Zhang et al. 2016).
Redox measurements in the treatment reactor are one of the most important readings to monitor. The measurement of the redox potential in the pilot reactor makes it possible to visualize the sum of the oxidation and reduction processes between the electrode and the water measured with all dissolved materials. Due to the long period, it takes electrodes to adapt; the redox measurements taken continuously over several days or weeks.
4. Aim of study The aim of this master thesis work is to evaluate pilot scale experiments and find the optimal aeration time with optimal dissolved oxygen (DO) concentrations level that can yield the maximum nitrogen removal efficiency at 15°C. The evaluation is done by collecting the data from on-line measurements and laboratory analysis during a five-month period. The studied technology is based on the existing deammonification process combined with UASB reactor for treatment of mainstream wastewater. The results are based on a comparison of the best outcomes of the nitrogen removal efficiency during five different periods with different aeration methods and different dissolved oxygen concentrations. To obtain an accurately measured data two different measurement data are used, laboratory analyzes
15 l Aim of study
and on-line measurements which are important both for precise and continuously measuring data and monitoring of the process in a pilot scale reactor.
To carry out the thesis work some tasks were made as following:
• Evaluation and review of literature and references to remove nitrogen from wastewater using partial Nitritation and Anammox process.
• Comparison of nitrogen removal efficiency processes.
• Finding facts and key solutions to the Partial nitritation/Anammox process for mainstream wastewater after UASB reactor.
To get an accurate and reliable parameters measurement data of the pilot scale reactor.
• Laboratory analysis, adjustment and calibration of on-line instruments for continuously measurement data and permanent monitoring of the process were performed.
Evaluation of a system based on UASB and a pilot scale reactor with an integrated fixed film activated sludge (IFAS) operated as a one-stage partial nitritation/Anammox process included:
• Advantages and disadvantages of the combined system UASB and IFAS.
• Find right combination of aeration method and DO concentration for Partial Nitritation and Anammox process.
• Analysis and control of UASB parameters which are very important for the Pilot Scale deammonification reactor.
Materials and methods l 16
5. Materials and methods
5.1 HammarbySjöstadsverket Hammarby Sjöstadverket is a research plant built in 2003. It is located in central Stockholm next to Henriksdal Wastewater Treatment Plant. The facility created for education and research is operated by Royal Institute of Technology (KTH) and Swedish Environmental Research Institute (IVL) since 2007. A number of companies and graduate students run their studies, tests and research in the plant.
5.2 Experimental strategy The biological treatment of water involves a wide variety of microorganisms, mainly bacteria. These microorganisms converts biodegradable organic matter by absorption of the soluble and suspended constituents contained in the waste water into simple products such as carbon dioxide and additional biomass or nitrate and nitrogen gas when the necessary conditions are met (Malovanyy et al. 2015a). A biological pilot reactor with access to aeration in which the microorganisms responsible for the purification are cultured (MBBR). The pilot scale reactor process includes also a clarifier that usually ensures solid-liquid separation and a device for recirculating the sludge recovered in the clarifier to the pilot reactor IFAS (Malovanyyet al. 2015b).
The experimental trials described in this report were carried out at the research facility Hammarby Sjöstadsverk.
Aeration was provided automatically, start and stop automatically by means of a digital timer and solenoid valves inside the reactor via a hose and a permanent agitator ensuring complete mixture of the mixed liquor. During the experiments, the concentration of DO was maintained in period 1, 2 and 5 at 1 mg/L and during period 3 and 4 at 1.3
17 l Materials and methods
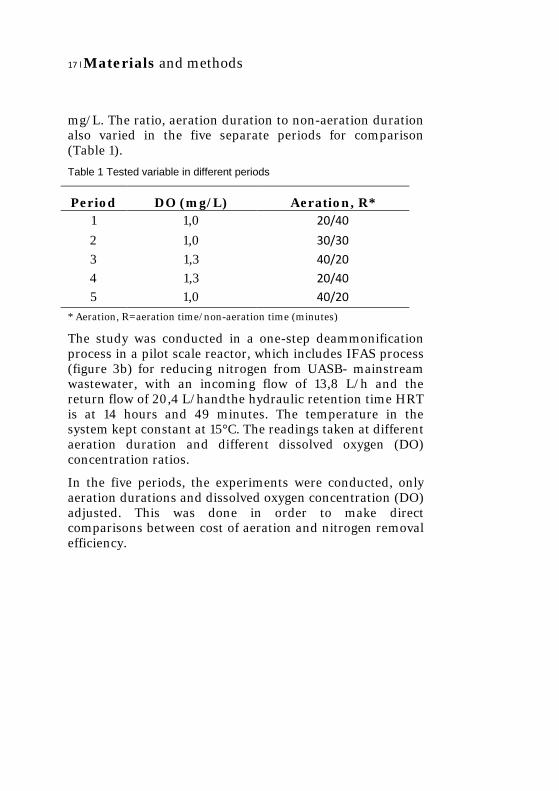
mg/L. The ratio, aeration duration to non-aeration duration also varied in the five separate periods for comparison (Table 1).
Table 1 Tested variable in different periods
Period DO (mg/L) Aeration, R* 1 1,0 20/40 2 1,0 30/30 3 1,3 40/20 4 1,3 20/40 5 1,0 40/20
* Aeration, R=aeration time/non-aeration time (minutes)
The study was conducted in a one-step deammonification process in a pilot scale reactor, which includes IFAS process (figure 3b) for reducing nitrogen from UASB- mainstream wastewater, with an incoming flow of 13,8 L/h and the return flow of 20,4 L/handthe hydraulic retention time HRT is at 14 hours and 49 minutes. The temperature in the system kept constant at 15°C. The readings taken at different aeration duration and different dissolved oxygen (DO) concentration ratios.
In the five periods, the experiments were conducted, only aeration durations and dissolved oxygen concentration (DO) adjusted. This was done in order to make direct comparisons between cost of aeration and nitrogen removal efficiency.
Materials and methods l 18
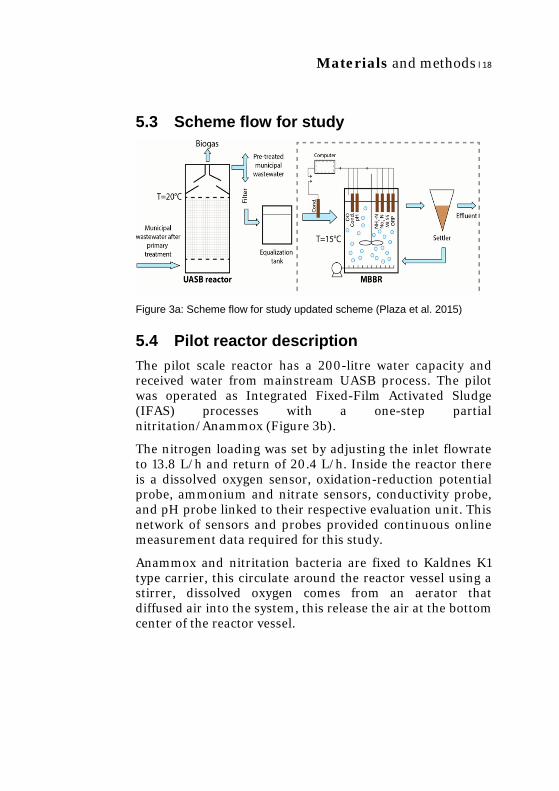
5.3 Scheme flow for study
Figure 3a: Scheme flow for study updated scheme (Plaza et al. 2015)
5.4 Pilot reactor description The pilot scale reactor has a 200-litre water capacity and received water from mainstream UASB process. The pilot was operated as Integrated Fixed-Film Activated Sludge (IFAS) processes with a one-step partial nitritation/Anammox (Figure 3b).
The nitrogen loading was set by adjusting the inlet flowrate to 13.8 L/h and return of 20.4 L/h. Inside the reactor there is a dissolved oxygen sensor, oxidation-reduction potential probe, ammonium and nitrate sensors, conductivity probe, and pH probe linked to their respective evaluation unit. This network of sensors and probes provided continuous online measurement data required for this study.
Anammox and nitritation bacteria are fixed to Kaldnes K1 type carrier, this circulate around the reactor vessel using a stirrer, dissolved oxygen comes from an aerator that diffused air into the system, this release the air at the bottom center of the reactor vessel.
19 l Materials and methods
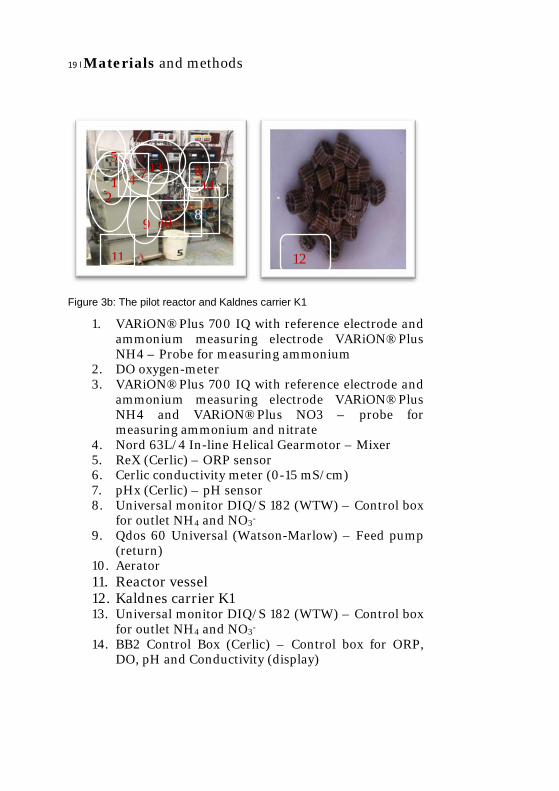
Figure 3b: The pilot reactor and Kaldnes carrier K1
1. VARiON®Plus 700 IQ with reference electrode and ammonium measuring electrode VARiON®Plus NH4 – Probe for measuring ammonium
2. DO oxygen-meter 3. VARiON®Plus 700 IQ with reference electrode and
ammonium measuring electrode VARiON®Plus NH4 and VARiON®Plus NO3 – probe for measuring ammonium and nitrate
4. Nord 63L/4 In-line Helical Gearmotor – Mixer 5. ReX (Cerlic) – ORP sensor 6. Cerlic conductivity meter (0-15 mS/cm) 7. pHx (Cerlic) – pH sensor 8. Universal monitor DIQ/S 182 (WTW) – Control box
for outlet NH4 and NO3- 9. Qdos 60 Universal (Watson-Marlow) – Feed pump
(return) 10. Aerator 11. Reactor vessel 12. Kaldnes carrier K1 13. Universal monitor DIQ/S 182 (WTW) – Control box
for outlet NH4 and NO3- 14. BB2 Control Box (Cerlic) – Control box for ORP,
DO, pH and Conductivity (display)
1 2 3
4 5
6 7
8 9 10
11 12
13 14

Materials and methods l 20
5.5 On-line measurements-Adjustment and calibration
It´s important to have measurements data in real time to ensure seamless monitoring and control of dynamic processes. Research, innovation and applied engineering experience has led to remarkable on-line system for their precision, efficiency and profitability.
On-line measurement in this study have been used to measure dissolved oxygen, pH, conductivity, temperature, reduction potential and all the nitrogen in the form of ammonium, nitrate and nitrite.
On-line measurement has become increasingly important as calibration and adjustment were done frequently and regularly. Calibration means checking the readings to laboratory analysis and adjustment is to adjust the on-line measurements against laboratory analyzes using offset or gain factor for mechanical measurement technique. The optical measurement used to monitor the pilot reactor for measuring of Nitrogen. It´s a measure of the attenuation of a fluorescence signal in a certain period, a measure of the time that is the basis for the measurement. So, that time is the most accurate, the optical system of the sensor adjusted to the speed of light. This natural constant C defined as the time taken for a light beam to travel from A to B; this is the speed of light. To calibrate these sensors, it requires two analyzes of two laboratory parameters, potassium K+ and Chloride Cl¯.
The most important parameter in the process is the dissolved oxygen measurement; this measurement done by the electrochemical method. DO diffuses through the membrane of the probe. Oxygen transformed in contact with electrolyte during a chemical reaction. This process involves some current consumption. This current consumption being
21 l Materials and methods
linearly proportional to the quantity of oxygen, it is possible to visualize the concentration of oxygen through it.
In order to be able to provide an accuracy results, the probe operated in the following conditions:
• The probe should be calibrated once a week with a portable oxygen-meter and adjusted to atmospheric pressure
• The membrane was rinsed with distilled water every day.
5.6 Laboratory analysis An important part of the wastewater treatment is to remove Nitrogen-containing compounds. The most effective is to combine analysis in the laboratory and measurement technology. To ensure the quality of nitrogen reduction a number of samples have been collected and analyzed 2 times a week in the laboratory (Tables, Appendix).
Laboratory analyzes were done by using a Hach spectrophotometer, which was a safe way to analyze the chemical composition of the pilot influent and effluent wastewater. The liquid was filtered before analysis with two fiber filters 1.6 and 0.45 μm for to ensure no volatile solids coming with and disturbing. Sample handling done by using pre-prepared cuvettes that contains the chemicals and measurement areas as the following:
COD: WTW (10-150 mg/L COD)
Alkalinity, acid capacity: WTW (0.4-8.0 mmol/L)
NH4-N: WTW (0.01-2.0 mg / L); (0.5 to 16 mg/L) and (4.0 to 80 mg/L)
NO2-N: WTW (0.01-0.7 mg /L NO2-N) and (1.0-90.0 mg/L NO2-N)
Results and discussion l 22
NO3-N: WTW (1.0-50.0 mg /L NO3-N) and (1.0-90.0 mg/L NO2-N)
K+: WTW (5-50 mg/L K)
Cl-: WTW (5-125 mg/L Cl-)
5.7 Difficulties Aside from mechanical failures of sensors, other issues/problems were identified during the study. These problems have occurred due to an operation failures in the UASB process, which resulted in COD level of the tested water to increase to ~180 mg/L from the normal figure of ~85 mg/L. This was due to a leakage of granules from UASB reactors to the pilot reactor through the filters. Granules turned the tested water black and probably introduced other bacteria into system that competed with Anammox bacteria. This has happened in the middle of the study period 2 and eventually has fixed at the end of period 3. Meanwhile the pH has fallen to 5.6 which has been adjusted to pH 7.0 by NaOH. Nitrogen removal efficiency stabilized at 33% average. Aeration was changed from an R=1 in period 2 (30 minutes with aeration and 30 minutes without aeration) to R = 2/3 in period 3 (40 minutes with aeration and 20 minutes without aeration).
6. Results and discussion
6.1 Evaluation of (UASB) based on laboratory analysis
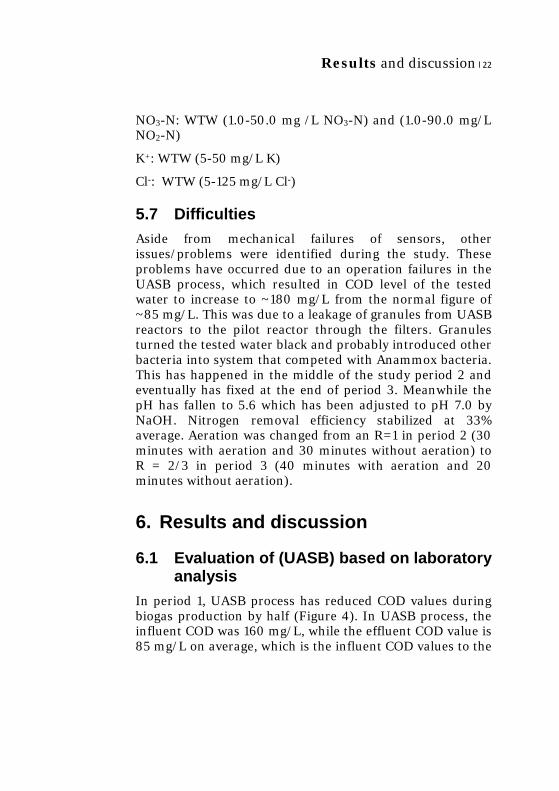
In period 1, UASB process has reduced COD values during biogas production by half (Figure 4). In UASB process, the influent COD was 160 mg/L, while the effluent COD value is 85 mg/L on average, which is the influent COD values to the
23 l Results and discussion
pilot reactor process. This low COD value in the first period reflected on nitrogen removal efficiency positively.
This scenario repeated during period, four and five where the COD values reduced in UASB. During the last half of period 2 and period 3 was a different scenario, this was because of the failure in the process that was discussed in Section5.7. Due to this issue, the nitrogen removal efficiency dropped to the lowest level of 33% in the pilot reactor. This is possibly due to the large amounts of COD in the pilot reactor influent. The influent also probably contained other bacteria that compete with Anammox bacteria.
Figure 4: Influent and effluent COD from UASB reactor and Nitrogen removal efficiency in pilot reactor
6.2 Evaluation of pilot scale reactor based on laboratory analysis
6.2.1 Nitrogen conversions The graph in Figure 5isdivided into five periods with different parameters. During the experiment (Figure 5), the best results are shown in periods 1 and 4where the process has responded well with the ideal target values of dissolved

Results and discussion l 24
oxygen and aeration ratio parameters, the only difference between periods 1 and 4 are dissolved oxygen concentrations respectively 1.0 and 1.3 mg /L. It had been found that the best period is four because of efficiency of nitrogen removal and lower effluent nitrates.
Figure 5: Nitrogen conversions
6.2.2 Nitrogen removal efficiency The average of nitrogen removal efficiency during the period 4was 52 % and in period 1 was 51%, while in period 5was 45 %, in period2 was 35% and in the period 3 was 33% that was due to problems with influent water from UASB process. Period 1 had a lower dissolved oxygen concentration at 1.0 mg/L than in period four at 1.3 mg/Land an aeration conditions of R = 1/3 for both periods (Figure 6). This means that in period four parameters are best for this particular process considering nitrogen efficiency. Comparison should take into account effluent Nitrogen in the form of NO3-N, NO2-N and energy costs for aeration.

25 l Results and discussion
Figure 6:Nitrogen removal efficiency- Average value during the study
6.2.3 Nitrogen removal efficiency, NO2-N and NO3-N
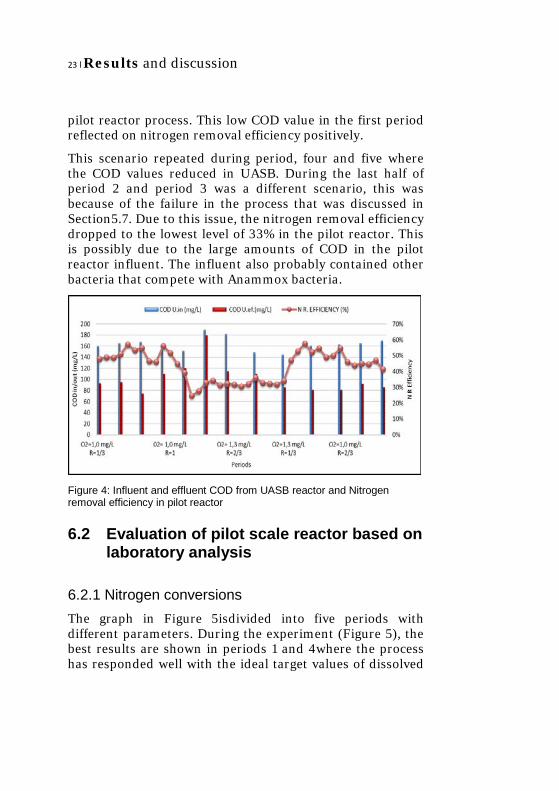
In period 1, Figure 7 shows that the nitrogen removal efficiency is on average 51 % but NO3-N was at between 2 and 18 mg/L, which is high levels and this affects the environment adversely. High levels of Nitrates are due to the aeration method and dissolved oxygen concentration that favors the second step of nitrification (Nitratation) to produce nitrates.
Period 5 had higher nitrogen content in the form of NO3-N and NO2-N. This is due to the aeration method in the period 5 which was of a ratio R = 2/3 (40 minutes with aeration and 20 minutes without aeration), this leads to more dissolved oxygen that favors the production of nitrites and nitrates.
Results and discussion l 26
Figure 7:Nitrogen removal efficiency and effluent Nitrite and Nitrate
6.2.4 Influence of dissolved oxygen on pH and Nitrogen removal
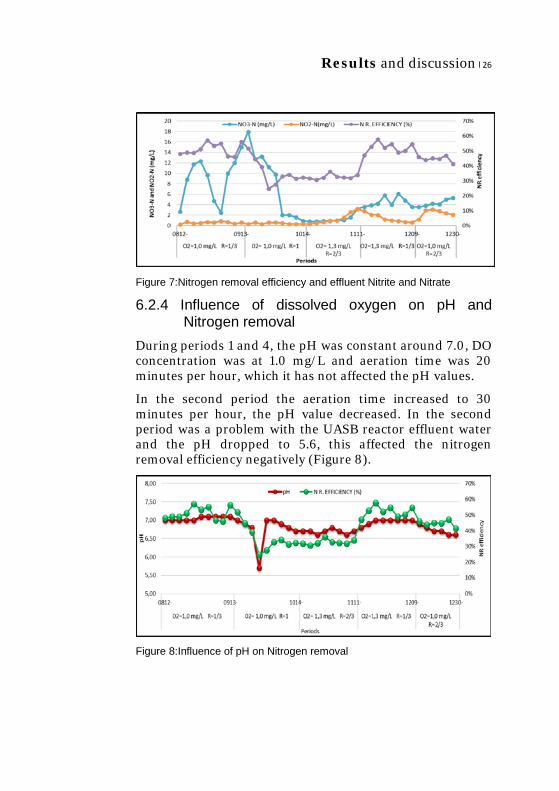
During periods 1 and 4, the pH was constant around 7.0, DO concentration was at 1.0 mg/L and aeration time was 20 minutes per hour, which it has not affected the pH values.
In the second period the aeration time increased to 30 minutes per hour, the pH value decreased. In the second period was a problem with the UASB reactor effluent water and the pH dropped to 5.6, this affected the nitrogen removal efficiency negatively (Figure 8).
Figure 8:Influence of pH on Nitrogen removal

27 l Results and discussion
During periods3 and 4, pH values dropped even further because the aeration time raised to 40 minutes per hour (Figure 8). More oxygen content in the water decreases the pH; this is due to a by-product H+ hydrogen extraction see equation (1). 6.2.5 Nitrogen removal and COD/ influent Nitrogen
(NH4-N) The influent COD to the pilot reactor ranged from 78 to 180 mg/L, this is also the effluent COD value from the UASB reactor. When the ratio (COD/influent nitrogen in form of NH4-N) was below 2.0, the nitrogen removal efficiency was around 50%.
Figure 9: Pilot reactors COD in/ NH4-N and Nitrogen removal efficiency
All values of ratio influent COD/ N (in form of NH4-N) over 2.0 have been largely associated with the UASB reactor, like the case in period 2the ratio was 3,6 due to the effluent COD from UASB that reached 180mg/Land nitrogen removal efficiency dropped to 33%, the lowest of all five periods (Figure 9). This means that the UASB has failed to halve the COD value before it came to the pilot scale reactor.

Results and discussion l 28
6.2.6 Nitrogen removal and MLSS MLSS have been for the most part in this study between 900 and 1200 mg/L. Figure 10 shows that the effect of lower MLSS values on nitrogen removal efficiency was greater than with the highest MLSS. Sufficient quantities of microorganisms and a sufficiently HRT for the degradation of the organic substances are also part of this compatibility.
Figure 10: Mixed liquor suspended solids and Nitrogen removal efficiency
A high value of MLSS can lead to a decrease of nitrogen removal efficiency, this means that all values exceeding the average of 1200 mg/L is too much for the process, and the low value could mean that the process is not working properly because of lack of activated sludge in the system. 6.2.7 Nitrogen removal and NO3-N produced/ NH4-N
removed The nitrates curve is following the trend of the removed nitrogen. In periods one and two the proportion of nitrates from removed nitrogen in the form of NH4-N was relatively high between 10% and 50%. In periods 3 and 5, it was between 5 and 20% (Figure 11).
In period 1 nitrates levels are up and down between 2 to 18 mg/L, this is due to bacteria of the genus Nitrobacter that

29 l Results and discussion
oxidize the nitrites NO−2formed in first step into nitrate NO−
3 which is produced in the second step of Nitrification, this occurs with presence of dissolved oxygen.
Figure 11: Nitrogen removal and the ratio of NO3-N produced to NH4-N removed
6.2.8 Influence of COD on Nitrogen removal efficiency Figure 12 shows variation of COD as a function of time for influent COD and effluent COD in the IFAS pilot plant. In the first period, the average COD removal efficiency values are at 68% and the average nitrogen removal is at 51%. In the second period, the reduction of COD has decreased over time, partly because of the change of aeration time and the process has not performed optimally. UASB effluent COD values were high because of the problems that have arisen with the UASB reactor. Nitrogen removal efficiency has dropped below 30% and then stabilize at around 33% in the middle of the second period and the entire third period (Figure 12).
Results and discussion l 30
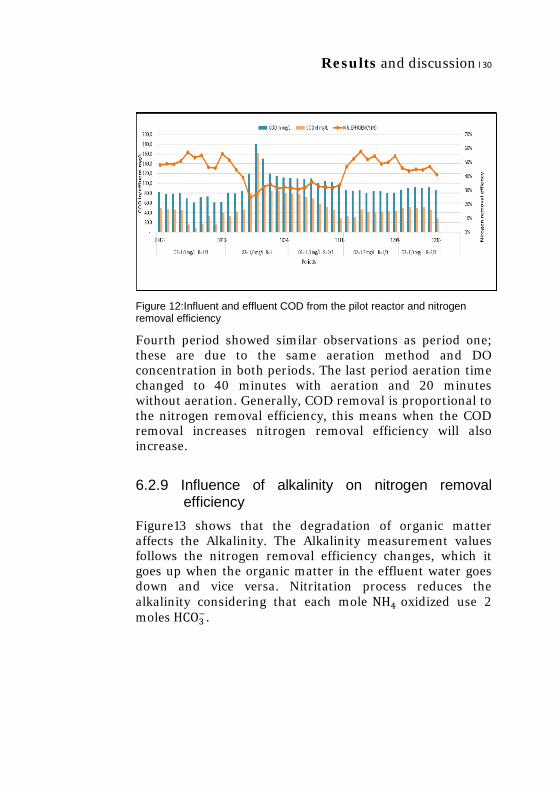
Figure 12:Influent and effluent COD from the pilot reactor and nitrogen removal efficiency
Fourth period showed similar observations as period one; these are due to the same aeration method and DO concentration in both periods. The last period aeration time changed to 40 minutes with aeration and 20 minutes without aeration. Generally, COD removal is proportional to the nitrogen removal efficiency, this means when the COD removal increases nitrogen removal efficiency will also increase.
6.2.9 Influence of alkalinity on nitrogen removal
efficiency Figure13 shows that the degradation of organic matter affects the Alkalinity. The Alkalinity measurement values follows the nitrogen removal efficiency changes, which it goes up when the organic matter in the effluent water goes down and vice versa. Nitritation process reduces the alkalinity considering that each mole NH4 oxidized use 2 moles HCO3
−.

31 l Results and discussion
Figure 13: Influence of Alkalinity on NR efficiency
Alkalinity can be used as a control parameter in a one-stage deammonification process given the rationale behind the change in alkalinity associated with the degradation of organic matter and turn with nitrogen removal.
6.2.10 NL (nitrogen load) and NRR (nitrogen removal
rate) Average of the nitrogen load in all five periods is 0.39 gN/m3d and nitrogen removal rate lies at 0.15 gN/m3d. During the first period, and the fourth, the gap between the curves dropped on an average of (0.36 / 0.18), which is a sign that the process has worked optimally. In the last part of the second period and the entire period 3, the gap between the curves increased to a maximum level throughout the study and an average of (0.42 / 0.14), this is because of the problem that has arisen in the UASB process. In period five the gap increased, nitrogen load has gone up in comparison with the previous period and nitrogen removal dropped to an average of (0.41 / 0.14). The difference between the last periods is big due to the aeration methods and different DO concentration (Figure 14).

Results and discussion l 32
Figure 14: Nitrogen removal rate, nitrogen load, Nitrogen removal efficiency and NRR/NL
6.3 Aeration strategy and DO concentration 6.3.1 Influence on nitrogen removal efficiency Period 1
Period 1 comprised of 31 days, the DO concentration was 1.0 mg/L and aeration ratio was 20 minutes with aeration to 40 minutes without aeration. During this period, nitrogen removal reached 51% on average. This aeration method fits PN/A deammonification that optimized the treatment process and assured a high nitrogen removal. Additional advantages are aeration cost reduction and avoidance of an external source of carbon.
Period 2
Period 2 comprised of 30 days, the DO concentration was 1.0 mg/L, and aeration ratio changed to 30 minutes with aeration and 30 minutes without aeration. With these parameters nitrogen removal efficiency decreased to 46% before the problem started with the UASB-reactor. The high aeration duration in this period means higher energy costs.

33 l Results and discussion
Period 3
Period 3 comprised of 29 days, the DO concentration was raised to 1.3 mg/L and aeration ratio adjusted to 40 minutes with aeration and 20 minutes without aeration. The pH in this period raised from 5.6 to 7.0 using NaOH. In this period was a problem of granules from UASB reactor and Nitrogen removal efficiency has decreased to 33%, which is the lowest level in the study. Longer aeration period means relatively higher energy cost.
Period 4
Period 4 comprised of 30 days, DO level was left at 1.3 mg/L but aeration ratio was changed to 20 minutes with aeration and 40 minutes without aeration as in the first period, but the nitrogen removal efficiency was 52 % on average, which was higher than in period 1. Yet the energy consumption was higher relative to period 1, this means higher energy costs given that DO concentration was 1.3 mg/L instead of 1.0 mg/L used in period 1.
Period 5
Period 5 comprised of 24 days, the DO was reduced to 1.0 mg/L and aeration regiment was 40 minutes with aeration and 20 minutes without aeration. These adjustments did not improve the nitrogen removal process, which decreased to 45% while significantly more cost incurred due to increase in aeration energy.
Table 2 shows the aeration energy costs during the 5 tested periods and their corresponding ranking (1 being the best and 5 being the worst).
Results and discussion l 34
Table 2 Energy costs and ranking of periods
Period DO mg/L
Aeration, R*
Nitrogen removal efficiency lab. Analysis (%)
Energy costs**
Ranking (1= best to 5=worst)
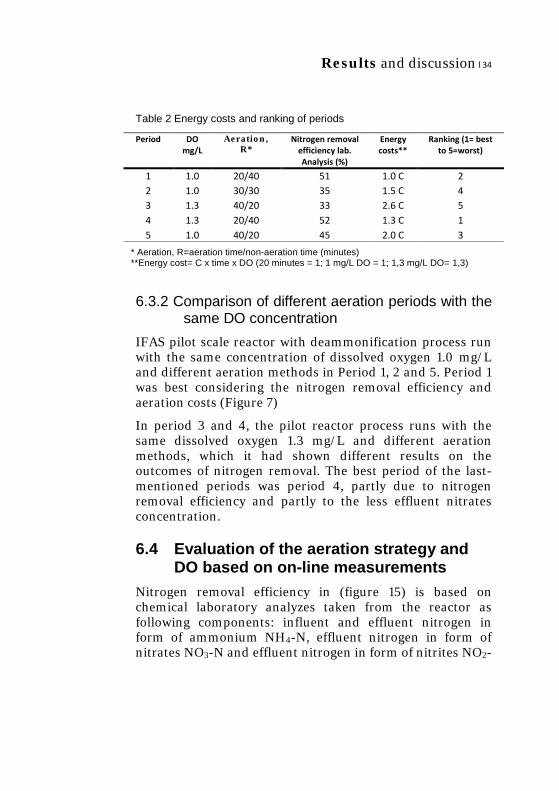
1 1.0 20/40 51 1.0 C 2 2 1.0 30/30 35 1.5 C 4 3 1.3 40/20 33 2.6 C 5 4 1.3 20/40 52 1.3 C 1 5 1.0 40/20 45 2.0 C 3
* Aeration, R=aeration time/non-aeration time (minutes) **Energy cost= C x time x DO (20 minutes = 1; 1 mg/L DO = 1; 1,3 mg/L DO= 1,3)
6.3.2 Comparison of different aeration periods with the
same DO concentration IFAS pilot scale reactor with deammonification process run with the same concentration of dissolved oxygen 1.0 mg/L and different aeration methods in Period 1, 2 and 5. Period 1 was best considering the nitrogen removal efficiency and aeration costs (Figure 7)
In period 3 and 4, the pilot reactor process runs with the same dissolved oxygen 1.3 mg/L and different aeration methods, which it had shown different results on the outcomes of nitrogen removal. The best period of the last-mentioned periods was period 4, partly due to nitrogen removal efficiency and partly to the less effluent nitrates concentration.
6.4 Evaluation of the aeration strategy and DO based on on-line measurements
Nitrogen removal efficiency in (figure 15) is based on chemical laboratory analyzes taken from the reactor as following components: influent and effluent nitrogen in form of ammonium NH4-N, effluent nitrogen in form of nitrates NO3-N and effluent nitrogen in form of nitrites NO2-

35 l Results and discussion
N. With these analyzes Nitrogen removal efficiency calculated as follows:
Nitrogen removal efficiency = ((𝑁𝑁𝑁𝑁4-N in - (𝑁𝑁𝑁𝑁4-N effluent+ 𝑁𝑁𝑁𝑁3-N + 𝑁𝑁𝑁𝑁2-N)) / 𝑁𝑁𝑁𝑁4-N in
Sampling and laboratory analyzes were done 2 times a week which is so little to monitor the process to ensure the quality of nitrogen purification continuously. Therefore, on-line instruments play a big role in monitoring the process continuously. This required a calibration and adjustment of these instruments every week and rinsing of sensors every day to get a credible online measurement data.
Nitrogen removal rate curve (Figure 15) of the whole study were divided into five periods and was chosen some periods (T1-T4) for further analysis using the on-line measurement data.
Figure 15: Nitrogen removal efficiency and selected periods (T1-T4)
T1: Period 1 and 2
Unlike average dissolved oxygen, content also leads to a difference in the outcome of the effluent nitrogen. Moderate DO leads to exactly required amount of nitrites for Anammox and lower levels of nitrates, but in this period NO3-N production exceeded 10 mg NO3-N /L and NO2-N did not exceed 1.0 mg NO2-N/L from laboratory analysis. This

Results and discussion l 36
is due to a cumulative DO concentration of the process leading to more nitrates concentration and to lower levels of the effluent nitrogen.
Partial nitritation requires oxygen and therefore limited aeration is required. During partial nitritation, 50% of the ammonia is converted biologically to nitrite, using nitrifying bacteria. Ammonia and nitrite are biologically converted into nitrogen gas, but if the dissolved oxygen concentration was, high it may lead to further more oxidation of NO2-Nto NO3-N in a nitratation process using nitrite bacteria (NOB) and available oxygen.
It is possible to control the process by means of online DO measurements. Considering technical issues that also leads to wrong measurement of the oxygen. DO instrument tend to show low or high measurement values, are they right or wrong?
1. Low readings are due to: • When it sticks debris on the membrane and
protects dissolved oxygen permeates through the membrane. In this case, the instrument displays low readings.
• often happens that there are holes in the membrane due to sharp debris in wastewater and electrolyte flows out through the hole, this leads to no contact between the anode and cathode and, if so, the instrument displays measurements around 0 ppm.
2. High readings are due to: • Problems with the incoming wastewater or
with the process itself when dissolved oxygen becomes a cumulative content in the reactor.
37 l Results and discussion
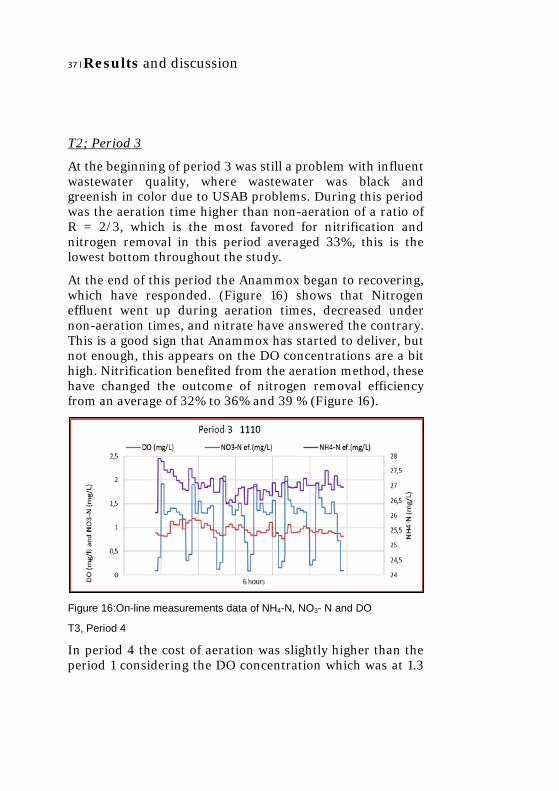
T2; Period 3
At the beginning of period 3 was still a problem with influent wastewater quality, where wastewater was black and greenish in color due to USAB problems. During this period was the aeration time higher than non-aeration of a ratio of R = 2/3, which is the most favored for nitrification and nitrogen removal in this period averaged 33%, this is the lowest bottom throughout the study.
At the end of this period the Anammox began to recovering, which have responded. (Figure 16) shows that Nitrogen effluent went up during aeration times, decreased under non-aeration times, and nitrate have answered the contrary. This is a good sign that Anammox has started to deliver, but not enough, this appears on the DO concentrations are a bit high. Nitrification benefited from the aeration method, these have changed the outcome of nitrogen removal efficiency from an average of 32% to 36% and 39 % (Figure 16).
Figure 16:On-line measurements data of NH4-N, NO3- N and DO
T3, Period 4
In period 4 the cost of aeration was slightly higher than the period 1 considering the DO concentration which was at 1.3

Results and discussion l 38
mg/L to 1.0 mg/L in period 1. Nitrogen removal efficiency was 52% on average throughout the period 4.
During this period, on-line measurement of NO2-N data was transferred to a USB stick and adjusted with an offset value towards the lab analyzes in an excel file because NO2-N on-line instrument was not connected to the network system. After this overlapped exact start times of the NO2-N on-line measurements and (NH4-N, NO3-N and DO on-line measurements) to each other (Figure 17). Transmitted data was for a cycle of six hours and the ratio of aeration method in this period is R = 1/3 this means 20 minutes with aeration and 40 minutes non-aeration per hour.
The curves of nitrogen in the form of NH4-N and nitrogen in the form of NO2-N just follow the trend of dissolved oxygen concentrations curve, which is perfect and nitrogen in the form of NO3-N curve have gone in opposite direction of dissolved oxygen curve that is also perfect.
Figure 17:On-line measurement data of NH4-N, NO3-N, DO and NO2-N

39 l Results and discussion
T4, Period 5
In period 5, dissolved oxygen concentration was changed back to 1.0 mg/L and aeration method was changed to 40 minutes with aeration and 20 minutes without aeration, this means that Anammox reaction had less time to react, this means less time for an anoxic environment which Anammox reaction react fully. Nitrogen removal efficiency decreased to an average of 45% and removed nitrogen decreased as well, (summary, figure 19).
Figure 18:On-line measurement data of NH4-N, NO3- N and DO
Figure 18 is taken from on-line data, period 5 shows the classic trends of the DO, NH4-N and NO3-N where the outflow of nitrogen in the form of NH4-N in the anoxic period goes down and then goes up when the aeration was started.
6.5 Summary A mixture of various concentrations of dissolved oxygen and different aeration methods have been tested in the pilot scale reactors for 5 months divided into 5 periods where the temperature was set at 15°C throughout the study. The best result was in period four, the average nitrogen removal efficiency was 52% with aeration method of the ratio R = 1/3

Results and discussion l 40
and a dissolved oxygen concentration of 1.3 mg/L (Figure 19). It is wrong to compare directly only nitrogen removal efficiency given that it must be taken into account all forms of effluent nitrogen and energy costs. Sometimes higher nitrogen removal includes also higher effluent nitrogen in the form of NO3-N and NO2-N, which can also, affects the environment.
Table 3Effluent nitrogen and Nitrogen removal efficiency
Method Average effluent (mg/L) Nitrogen Removal efficiency (%)
Rank
O2 (mg/L) R (ratio)
NH4-N (1)
NO3-N (2)
NO2-N (3)
Min. Max. Average (4)
1,0 1/3
11.07 8.94 0.57 45.95 57.03 51.0 2
1,0 1
21.47 7.92 0.42 27.55 51.64 35.0 4
1,3 2/3
27.40 1.30 1.30 30.63 36.00 33.0 5
1,3 1/3
15.20 4.80 1.40 47.01 57.67 52.0 1
1,0 2/3
17.90 4.20 2.40 41.33 46.95 45.0 3
The best nitrogen removal efficiency was in period 4 (Figure 19). The aeration costs were a little higher in the period 4 because it costs a little more to run an aeration of 1.3 mg/L in period 4 than 1,0 mg/L in period 1, but it is worth considering the higher levels of NO3-N in the effluent water in period 1, which it costs more for environmental impact. Therefore, I choose period four as best period during this study (Table 3).

41 l Conclusions
Figure 19: Effluent NO2-N, NO3-N and NH4-N, Aeration costs and Nitrogen removal efficiency
7. Conclusions This study was conducted to evaluate pilot scale experiments and find the optimal aeration time with optimal dissolved oxygen (DO) concentrations level that can yield the maximum nitrogen removal efficiency at 15°C, which means high nitrogen removal efficiency and low levels of effluent nitrogen outcomes in the form ofNO2-N, NO3-N and NH4-N. The studied system for treatment of mainstream wastewater was based on the deammonification process combined with UASB reactor. Mainstream wastewaterwas characterized by low nitrogen influent containing 35 to 50 mg NH4-N mg/L and a COD on 61-120 mg/L. This wastewater was treated in a pilot scale reactor with integrated fixed film activated sludge (IFAS) and operated as one stage partial nitritation / Anammox.

Conclusions l 42
The conclusion is based on a comparison of the best outcomes of the nitrogen removal efficiency during 5 different periods with different aeration methods and different dissolved oxygen concentrations in a pilot scale reactor located at Hammarby Sjöstad.
It has been shown that period 4 with an aeration period of (20 minutes with aeration to 40 minutes without aeration) and dissolved oxygen (DO) concentration of 1.3 mg/L had the best outcomes in nitrogen removal efficiency on 52% in average varying between 40 and 60%. The ranking took into account of all forms of emissions of nitrogen forms and energy costs.
Optimizing the process of halting nitrification at the nitrite stage sometimes can be difficult. It appears that the main difficulty step of the process is to maintain a stable accumulation of nitrites while seeking complete partial nitritation of the ammonia.In this study, Partial nitritation/Anammox (PN/A) is considered to be more environmentally friendly due to reduced energy requirements for aeration, especially in the period of 4 and 1. The process also allows for a more cost-effective nitrogen removal from wastewater.
43 l References
8. References Alzate Marin, J.C., Caravelli, A.H. & Zaritzky, N.E., 2016.
Nitrification and aerobic denitrification in anoxic-aerobic sequencing batch reactor. Bioresource Technology, 200, pp.380–387.
Barrett, M.. J.., 1972. Predicting the Effect of Pollution in Estuaries Author ( s ): M . J . Barrett Source : Proceedings of the Royal Society of London . Series B , Biological Sciences , Vol . 180 , No . 1061 , A Discussion on Freshwater and Estaurine Studies of the Effects of. The Rolay Society, 180(1061), pp.511–520.
Boonnorat, J. et al., 2016. Effects of hydraulic retention time and carbon to nitrogen ratio on micro-pollutant biodegradation in membrane bioreactor for leachate treatment. Bioresource Technology, 219, pp.53–63. Available at: http://dx.doi.org/10.1016/j.biortech.2016.07.094.
Clippeleir, H. De et al., 2013. One-stage partial nitritation / anammox at 15 ° C on pretreated sewage : feasibility demonstration at lab-scale. , pp.10199–10210.
Cydzik-Kwiatkowska, A. et al., 2014. Structure of nitrogen-converting communities induced by hydraulic retention time and COD/N ratio in constantly aerated granular sludge reactors treating digester supernatant. Bioresource Technology, 154, pp.162–170.
Deborah V. Chapman, Eutrophication - The Global Environment - Chapman - Wiley Online Library.
Duan, X. et al., 2011. Application of low intensity ultrasound to enhance the activity of anammox microbial consortium for nitrogen removal. Bioresource Technology, 102(5), pp.4290–4293. Available at: http://dx.doi.org/10.1016/j.biortech.2010.12.050.
Fajardo, C. et al., 2014. Cross effect of temperature, pH and free ammonia on autotrophic denitrification process with sulphide as electron donor. Chemosphere, 97, pp.10–15. Available at: http://dx.doi.org/10.1016/j.chemosphere.2013.10.028.

References l 44
Gilbert, E.M. et al., 2015. Comparing different reactor configurations for Partial Nitritation/Anammox at low temperatures. Water Research, 81, pp.92–100. Available at: http://dx.doi.org/10.1016/j.watres.2015.05.022.
He, T. et al., 2016. Heterotrophic nitrification and aerobic denitrification by Pseudomonas tolaasii Y-11 without nitrite accumulation during nitrogen conversion. Bioresource Technology, 200, pp.493–499.
Jimenez, J. et al., 2015. High-rate activated sludge system for carbon management - Evaluation of crucial process mechanisms and design parameters. Water Research, 87, pp.476–482.
Joselin Herbert, G.M. & Unni Krishnan, A., 2016. Quantifying environmental performance of biomass energy. Renewable and Sustainable Energy Reviews, 59, pp.292–308. Available at: http://dx.doi.org/10.1016/j.rser.2015.12.254.
Knowles, R., 1982. No3-, no2). , 46(1), pp.43–70.
Kuenen, J.G., 2008. Anammox bacteria: from discovery to application. Nature reviews. Microbiology, 6(4), pp.320–326.
Lim, S.J., 2011. Comparisons between the UASB and the EGSB reactor. Iowa State University publication, 17(1969), pp.1–17.
Lin, B.-L. et al., 2000. Modelling a global biogeochemical nitrogen cycle in terrestrial ecosystems. Ecological Modelling, 135(135), pp.89–110.
Lundberg, K., 2011. A systems thinking approach to environmental follow-up in a Swedish central public authority: Hindrances and possibilities for learning from experience. Environmental Management, 48(1), pp.123–133.
Malovanyy, A., Yang, J., et al., 2015. Combination of upflow anaerobic sludge blanket (UASB) reactor and partial nitritation/anammox moving bed biofilm reactor (MBBR) for municipal wastewater treatment. Bioresource Technology, 180, pp.144–153. Available at: http://dx.doi.org/10.1016/j.biortech.2014.12.101.
45 l References
Malovanyy, A., Trela, J. & Plaza, E., 2015. Mainstream wastewater treatment in integrated fixed film activated sludge (IFAS) reactor by partial nitritation/anammox process. Bioresource Technology, 198, pp.478–487. Available at: http://dx.doi.org/10.1016/j.biortech.2015.08.123.
Moss, B. et al., 2013. Nitrogen, macrophytes, shallow lakes and nutrient limitation: Resolution of a current controversy? Hydrobiologia, 710(1), pp.3–21.
Neal, C. & Heathwaite, A.L., 2005. Nutrient mobility within river basins: A European perspective. Journal of Hydrology, 304(1–4), pp.477–490.
Neumann, A., Torstensson, G. & Aronsson, H., 2011. Losses of nitrogen and phosphorus via the drainage system from organic crop rotations with and without livestock on a clay soil in southwest Sweden. Organic Agriculture, 1(4), pp.217–229.
Plaza, E., Trela, J. & Hultman, B., 2011. Swedish Experience With Deammonification Process in Biofilm System. Water Resources, pp.31–40.
Qiu, G. et al., 2013. Combination of upflow anaerobic sludge blanket (UASB) and membrane bioreactor (MBR) for berberine reduction from wastewater and the effects of berberine on bacterial community dynamics. Journal of Hazardous Materials, 246–247, pp.34–43.
Strous, M., 1999. Key Physiology of Anaerobic Ammonium Oxidation Key Physiology of Anaerobic Ammonium Oxidation. Applied and environmental microbiology, 65(7), pp.0–3.
Thamdrup, B., Dalsgaard, T. & Revsbech, N.P., 2012. Widespread functional anoxia in the oxygen minimum zone of the Eastern South Pacific. Deep Sea Reseach I, 65, pp.36–45. Available at: c:%5CPDFs%5C2012_0647.pdf.
Tora, J.A. et al., 2012. Fast start-up and controlled operation during a long-term period of a high-rate partial nitrification activated sludge system. Environmental Technology, 33(12), pp.1361–1366.

References l 46
Townsend, A.R. 2003, 2015. Annamox at low termperatures: Potential for energy neutral wastewater treatment. Biotechnology and Bioengineering, 112(1), pp.vi–vi.
Tran, N.H. an et al., 2015. A critical review on characterization strategies of organic matter for wastewater and water treatment processes. Bioresource technology, 193, pp.523–533. Available at: http://dx.doi.org/10.1016/j.biortech.2015.06.091.
Trela et al, 2008, Mätteknik för att styra och optimera deammonifikation.
Xu, G. et al., 2015. The challenges of mainstream deammonification process for municipal used water treatment. Applied Microbiology and Biotechnology, 99(6), pp.2485–2490.
Yang, J. et al., 2015. Intermittent aeration in one-stage partial nitritation/anammox process. Ecological Engineering, 75, pp.413–420. Available at: http://dx.doi.org/10.1016/j.ecoleng.2014.11.016.
Yang, Q., Zhao, H. & Liang, H.H., 2015. Denitrification of overlying water by microbial electrochemical snorkel. Bioresource Technology, 197, pp.512–514. Available at: http://dx.doi.org/10.1016/j.biortech.2015.08.127.
Zhang, H. et al., 2016. Self-powered denitration of landfill leachate through ammonia/nitrate coupled redox fuel cell reactor. Bioresource Technology, 203, pp.56–61. Available at: http://dx.doi.org/10.1016/j.biortech.2015.12.009.
Zhang, X. et al., 2015. E ff ect of in fl uent COD / N ratio on performance and N 2 O emission of partial nitri fi cation treating high- strength nitrogen wastewater. RSC Advances, 5, pp.61345–61353.
Zhang, X. et al., 2014. Performance and microbial community of completely autotrophic nitrogen removal over nitrite (CANON) process in two membrane bioreactors (MBR) fed with different substrate levels. Bioresource Technology, 152, pp.185–191. Available at: http://dx.doi.org/10.1016/j.biortech.2013.10.110.
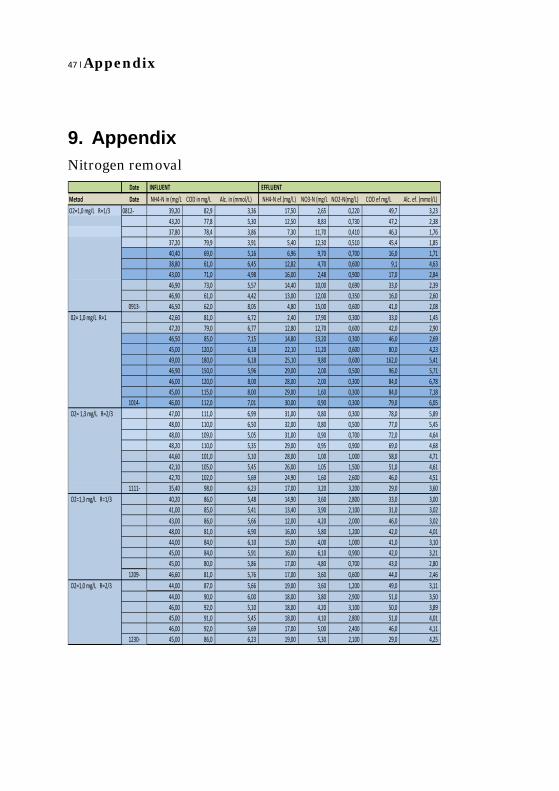
47 l Appendix
9. Appendix Nitrogen removal
Date INFLUENT EFFLUENTMetod Date NH4-N in (mg/L) COD in mg/L Alc. in (mmol/L) NH4-N ef.(mg/L) NO3-N (mg/L) NO2-N(mg/L) COD ef mg/L Alc. ef. (mmol/L)O2=1,0 mg/L R=1/3 0812- 39,20 82,9 3,36 17,50 2,65 0,220 49,7 3,23
43,20 77,8 5,30 12,50 8,83 0,730 47,2 2,38 37,80 78,4 3,86 7,30 11,70 0,410 46,3 1,76 37,20 79,9 3,91 5,40 12,30 0,510 45,4 1,85 40,40 69,0 5,16 6,96 9,70 0,700 16,0 1,71 38,80 61,0 6,45 12,82 4,70 0,600 9,1 4,63 43,00 71,0 4,98 16,00 2,48 0,900 17,0 2,84 46,90 73,0 5,57 14,40 10,00 0,690 33,0 2,39 46,90 61,0 4,42 13,00 12,00 0,350 16,0 2,60
0913- 46,50 62,0 8,05 4,80 15,00 0,600 41,0 2,08 02= 1,0 mg/L R=1 42,60 81,0 6,72 2,40 17,90 0,300 33,0 1,45
47,20 79,0 6,77 12,80 12,70 0,600 42,0 2,90 46,50 85,0 7,15 14,80 13,20 0,300 46,0 2,69 45,00 120,0 6,18 22,10 11,20 0,600 80,0 4,23 49,00 180,0 6,18 25,10 9,80 0,600 162,0 5,41 46,90 150,0 5,96 29,00 2,00 0,500 96,0 5,71 46,00 120,0 8,00 28,00 2,00 0,300 84,0 6,78 45,00 115,0 8,00 29,00 1,60 0,300 84,0 7,18
1014- 46,00 112,0 7,01 30,00 0,90 0,300 79,0 6,05 O2= 1,3 mg/L R=2/3 47,00 111,0 6,99 31,00 0,80 0,300 78,0 5,89
48,00 110,0 6,50 32,00 0,80 0,500 77,0 5,45 48,00 109,0 5,05 31,00 0,90 0,700 72,0 4,64 48,20 110,0 5,35 29,00 0,95 0,900 69,0 4,68 44,60 101,0 5,10 28,00 1,00 1,000 58,0 4,71 42,10 105,0 5,45 26,00 1,05 1,500 51,0 4,61 42,70 102,0 5,69 24,90 1,60 2,600 46,0 4,51
1111- 35,40 98,0 6,23 17,00 3,20 3,200 29,0 3,60 O2=1,3 mg/L R=1/3 40,20 86,0 5,48 14,90 3,60 2,800 33,0 3,00
41,00 85,0 5,41 13,40 3,90 2,100 31,0 3,02 43,00 86,0 5,66 12,00 4,20 2,000 46,0 3,02 48,00 81,0 6,90 16,00 5,80 1,200 42,0 4,01 44,00 84,0 6,10 15,00 4,00 1,000 41,0 3,10 45,00 84,0 5,91 16,00 6,10 0,900 42,0 3,21 45,00 80,0 5,86 17,00 4,80 0,700 43,0 2,80
1209- 46,60 81,0 5,76 17,00 3,60 0,600 44,0 2,46 O2=1,0 mg/L R=2/3 44,00 87,0 5,66 19,00 3,60 1,200 49,0 3,11
44,00 90,0 6,00 18,00 3,80 2,900 51,0 3,50 46,00 92,0 5,10 18,00 4,20 3,100 50,0 3,89 45,00 91,0 5,45 18,00 4,10 2,800 51,0 4,01 46,00 92,0 5,69 17,00 5,00 2,400 46,0 4,11
1230- 45,00 86,0 6,23 19,00 5,30 2,100 29,0 4,25

Appendix l 48
UASB data
COD, NRR and NL
Date UASB INFLUENT UASB EFFLUENTMetod Date NH4-N USAB in mg/L COD U.in (mg/L) Alc. U.in mg/L NH4-N U.ef.mg/L COD U.ef.(mg/L) Alc. U.ef. mg/LO2=1,0 mg/L R=1/3 August 12-2016 39,70 160,0 3,92 40,80 93,0 4,42
41,00 165,0 4,11 41,10 95,0 4.14O2= 1,3 mg/L R=2/3 October 14-2016 41,00 168,0 4,05 41,03 74,0 4,31
42,10 152,0 3,91 42,30 120,0 3,62 45,00 190,0 4,00 44,30 180,0 3.44
O2=1,3 mg/L R=1/3 November 11-2016 54,00 182,0 6,15 53,00 115,0 6,10 41,10 149,0 4,50 42,60 110,0 4,10 37,00 145,0 4,10 37,10 86,0 3,90
O2=1,0 mg/L R=2/3 December 09-2016 36,50 161,0 6,90 36,50 81,0 4,00 44,00 163,0 6,01 44,20 81,0 4,99 43,00 165,0 5,55 43.2 92,0 4,45
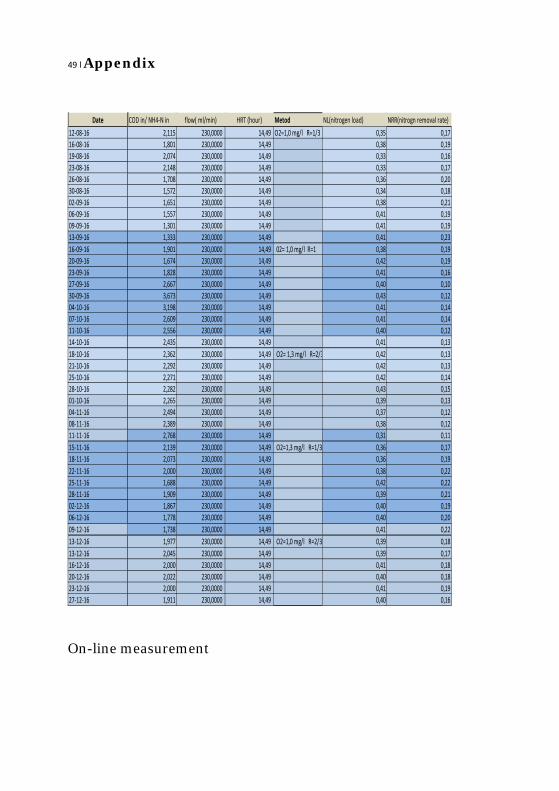
49 l Appendix
On-line measurement
Date COD in/ NH4-N in flow( ml/min) HRT (hour) Metod NL(nitrogen load) NRR(nitrogn removal rate)12-08-16 2,115 230,0000 14,49 O2=1,0 mg/l R=1/3 0,35 0,1716-08-16 1,801 230,0000 14,49 0,38 0,1919-08-16 2,074 230,0000 14,49 0,33 0,1623-08-16 2,148 230,0000 14,49 0,33 0,1726-08-16 1,708 230,0000 14,49 0,36 0,2030-08-16 1,572 230,0000 14,49 0,34 0,1802-09-16 1,651 230,0000 14,49 0,38 0,2106-09-16 1,557 230,0000 14,49 0,41 0,1909-09-16 1,301 230,0000 14,49 0,41 0,1913-09-16 1,333 230,0000 14,49 0,41 0,2316-09-16 1,901 230,0000 14,49 02= 1,0 mg/l R=1 0,38 0,1920-09-16 1,674 230,0000 14,49 0,42 0,1923-09-16 1,828 230,0000 14,49 0,41 0,1627-09-16 2,667 230,0000 14,49 0,40 0,1030-09-16 3,673 230,0000 14,49 0,43 0,1204-10-16 3,198 230,0000 14,49 0,41 0,1407-10-16 2,609 230,0000 14,49 0,41 0,1411-10-16 2,556 230,0000 14,49 0,40 0,1214-10-16 2,435 230,0000 14,49 0,41 0,1318-10-16 2,362 230,0000 14,49 O2= 1,3 mg/l R=2/3 0,42 0,1321-10-16 2,292 230,0000 14,49 0,42 0,1325-10-16 2,271 230,0000 14,49 0,42 0,1428-10-16 2,282 230,0000 14,49 0,43 0,1501-10-16 2,265 230,0000 14,49 0,39 0,1304-11-16 2,494 230,0000 14,49 0,37 0,1208-11-16 2,389 230,0000 14,49 0,38 0,1211-11-16 2,768 230,0000 14,49 0,31 0,1115-11-16 2,139 230,0000 14,49 O2=1,3 mg/l R=1/3 0,36 0,1718-11-16 2,073 230,0000 14,49 0,36 0,1922-11-16 2,000 230,0000 14,49 0,38 0,2225-11-16 1,688 230,0000 14,49 0,42 0,2228-11-16 1,909 230,0000 14,49 0,39 0,2102-12-16 1,867 230,0000 14,49 0,40 0,1906-12-16 1,778 230,0000 14,49 0,40 0,2009-12-16 1,738 230,0000 14,49 0,41 0,2213-12-16 1,977 230,0000 14,49 O2=1,0 mg/l R=2/3 0,39 0,1813-12-16 2,045 230,0000 14,49 0,39 0,1716-12-16 2,000 230,0000 14,49 0,41 0,1820-12-16 2,022 230,0000 14,49 0,40 0,1823-12-16 2,000 230,0000 14,49 0,41 0,1927-12-16 1,911 230,0000 14,49 0,40 0,16

Appendix l 50
ONLINE Metod Date NH4 on-l mg/L NO3 on-l mg/L N R EFFICIEN T °C DO mg/L pH NH4-N removed mg/L MLSS mg/L NH4 R. EFFO2=1,0 mg/L R= 0812- 21,1 3,2 37,45% 15,3 1,50 7,30 21,70 1 058,00 55,36%
6,9 8,2 63,36% 15,2 1,40 7,40 30,70 1 250,00 71,06%10,6 9,2 46,53% 15,2 1,40 7,30 30,50 1 219,00 80,69%12,8 11,8 32,50% 15,1 1,50 6,90 31,80 1 290,00 85,48%
8,9 8,9 54,21% 15,1 1,30 7,20 33,44 1 180,00 82,77%5,30 5,4 70,88% 14,9 1,50 7,30 25,98 1 010,00 66,96%
24,10 2,33 36,44% 15,0 1,30 7,40 27,00 1 230,00 62,79%14,00 16,30 33,92% 15,0 1,00 7,10 32,50 1 180,00 69,30%15,00 16,70 31,66% 15,0 1,00 7,10 33,90 1 410,00 72,28%
0913- 4,00 17,10 53,33% 15,0 1,00 7,10 41,70 1 380,00 89,68%02= 1,0 mg/L R=1 3,00 17,80 50,47% 15,0 1,00 7,00 40,20 1 350,00 94,37%
15,00 12,00 41,53% 15,0 1,00 7,10 34,40 1 210,00 72,88%11,00 10,60 52,90% 15,0 1,00 7,40 31,70 1 410,00 68,17%15,00 13,40 35,56% 15,0 1,50 5,80 22,90 1 050,00 50,89%30,00 2,65 32,14% 15,0 3,10 7,50 23,90 1 015,00 48,78%26,00 2,32 38,55% 15,0 3,00 7,10 17,90 1 210,00 38,17%20,00 1,80 51,96% 15,0 2,80 7,00 18,00 1 250,00 39,13%22,00 1,70 46,67% 15,0 1,90 7,00 16,00 1 380,00 35,56%
1014- 29,00 1,60 32,83% 15,3 1,70 6,70 16,00 1 145,00 34,78%O2= 1,3 mg/L R=2/3 28,00 1,40 36,81% 15,2 1,40 6,70 16,00 945,00 34,04%
28,00 1,30 37,92% 15,1 1,40 6,70 16,00 910,00 33,33%28,00 1,60 36,88% 15,1 1,70 6,90 17,00 980,00 35,42%28,00 1,70 36,51% 14,8 1,70 6,90 19,20 1 262,00 39,83%26,00 1,80 35,43% 15,1 1,90 6,90 16,60 1 190,00 37,22%23,00 1,90 37,29% 15,0 1,70 6,80 16,10 1 210,00 38,24%21,00 3,10 37,47% 15,0 1,70 6,90 17,80 1 110,00 41,69%
1111- 16,00 3,10 37,01% 15,0 1,70 6,70 18,40 1 420,00 51,98%O2=1,3 mg/L R=1/3 15,0 3,20 47,76% 15 1,5 6,6 25,30 1 340,00 62,94%
15,0 3,80 49,02% 15 1,5 6,6 27,60 1 230,00 67,32%14,0 4,30 52,79% 15 1,4 6,7 31,00 980,00 72,09%21,0 3,1 47,29% 15 1,2 6,9 32,00 1 010,00 66,67%
23,00 2,30 40,23% 15,0 1,30 7,00 29,00 987,00 65,91%19,00 1,60 52,22% 15,0 1,00 7,00 29,00 1 150,00 64,44%21,00 1,20 49,11% 15,0 1,1 7,00 28,00 1 178,00 62,22%
1209- 21,00 1,20 51,07% 15,00 1,00 7,00 29,60 110,00 63,52%O2=1,0 mg/L R=2/3 18,00 3,40 48,64% 15,00 1,2 7,00 25,00 1 090,00 56,82%
16,00 3,2 49,77% 15,00 1,00 7,00 26,00 910,00 59,09%15,00 3,1 53,91% 15,00 1,30 7,00 28,00 1 060,00 60,87%13,00 3 58,22% 15,00 1,40 7,00 27,00 1 130,00 60,00%12,00 2,8 62,61% 15,00 1,60 7,00 29,00 980,00 63,04%
1230- 10,00 1,3 70,22% 15,00 1,50 7,00 26,00 920,00 57,78%


TRITA LWR Degree Project
ISSN 1651-064X LWR-EX 2017:07
www.kth.se