dealing with disruption - oracle blogscdn.app.compendium.com/uploads/user/a33eed35-8a44-4da7... ·...
TRANSCRIPT

IHS QUARTERLY Q4-2014
DEALING WITH DISRUPTIONGeopolitics, technology, demographics, the environment, competitors.
Disruption is everywhere. Are you prepared?
WHY TESLA MATTERS Challenging the old order
P62
RETHINKING PRODUCTION 3D printing gains traction
P30
SHIFTING BORDERS Redrawing the world map
P36
NEW ENERGY SCENARIO Rivalry defines the future
P46
NANOTECH ACCELERATES From the lab to the market
P54

Your source for comprehensive insight, information, and expertise on key topics shaping today’s global business landscape.
We invite you to continue the conversation...
IHS QUARTERLY Q4-2014
main red
PMS 1795CC0 M96 Y90 K2
YOUTUBE LOGO SPECS
PRINTgradient bottom
PMS 1815CC13 M96 Y81 K54
on dark backgroundson light backgrounds
standard
no gradients
watermark
stacked logo (for sharing only)
standard
no gradients
watermark
stacked logo (for sharing only)
white
WHITEC0 M0 Y0 K0
black
BLACKC100 M100 Y100 K100
Visit and subscribe: ihs.com/IHSQ14
Contact: [email protected]
Join the conversation: @IHS
Engage: #IHSQuarterly

IHS Quarterly | Q4-2014 | 3
IHS QUARTERLY Q4-2014
FEATURES
WHEN MACROECONOMICS AND GLOBAL SUPPLY CHAINS COLLIDE Economics, geopolitics, and demographics influence global trade and impact the supply chains that are its lifeblood. Understanding the interaction of these macro-phenomena and their implications provides an edge that global companies need to stay competitive.By Chris G. Christopher, Jr. and David Deull
P 18
REELING IN ILLEGAL FISHING It is estimated that one-third of all fish caught on the high seas is done illegally. Global action to combat the crisis is now focusing on the establishment of an identification scheme for all fishing vessels.By Alex Gray
P 24
A NEW MANUFACTURING BLUEPRINT? 3D printing has already made inroads in a number of industries, enabling the creation of highly complex shapes and unprecedented customization. As printer costs fall and new competitors emerge, “traditional” industrial production models and their supply chains will be threatened.By Alex Chausovsky
P 30
NEW DIMENSIONS, NEW MAPS: SHIFTING BORDERS, BOUNDARIES, AND SOVEREIGNTY From Western Europe to the Western Pacific, state and non-state actors alike are challenging existing land and maritime borders. What are the implications for the defense, security, and business communities?By Tate Nurkin
P 36
THE RIVALRY ERA: A BRIEF HISTORY OF THE ENERGY INDUSTRY FROM 2015 TO 2040 Dateline 2041: The energy rivalry of the past 25 years has profoundly impacted the energy industry. Oil no longer holds a monopoly as a transport fuel. Use of renewable energy has grown rapidly—and demand for gas has soared.By Jim Burkhard
P 46
VERY SMALL PARTICLES WITH VERY BIG IMPLICATIONS Nanotechnology has been in commercial products for some time, but the pace of development of new nanomaterials is accelerating. The field could prove transformative for many industries, including the one responsible for producing the nanomaterials: chemicals.By Michelle Lynch, Mark Morgan, and Jagdish Rebello
P 54
TESLA MOTORS: A CASE STUDY IN DISRUPTIVE INNOVATION The IHS Technology Teardown Team took apart a 2013 Tesla Model S and found systems and components unique in the auto industry. But Tesla’s disruptive influence goes beyond semiconductors. It’s about a vision for the car that is helping shape the future of the century-old auto industry.By Mark Boyadjis
P 62
DEALING WITH DISRUPTIONIHS provides global corporations with information, insight, and expertise to help them manage disruption and their businesses. Whether it is a tactical operational challenge or a strategic bet-the-company shift, we help businesses deal with disruption by paying attention to the smallest details and by showing them the big picture. IHS Quarterly reflects this mission by providing insight and expertise from our thought leaders to help readers deal with disruption no matter what their industry, be it aerospace, defense & security, automotive, chemicals, energy, maritime, or technology. Our depth and breadth can elevate your understanding of complex issues and give you an edge.

IHS QUARTERLY
COPYRIGHT NOTICE AND LEGAL DISCLAIMER© 2014 IHS No portion of this publication may be reproduced, reused, or otherwise distributed in any form without prior written consent of IHS. Content reproduced or redistributed with IHS’s permission must display IHS legal notices and attributions of authorship. The information contained herein is from sources considered reliable but its accuracy and completeness are not warranted, nor are the opinions and analyses which are based upon it, and to the extent permitted by law, IHS shall not be liable for any errors or omissions or any loss, damage or expense incurred by reliance on information or any statement contained herein. For more information, contact IHS at [email protected], +1 800 IHS CARE (from North American locations), or +44 (0) 1344 328 300 (from outside North America). TRADEMARKSIHS Quarterly and the IHS globe design are trademarks of IHS. Other trademarks appearing in this publication are the property of IHS or their respective owners.
4 | IHS Quarterly | Q4-2014
#IHSQuarterly
VISIONTHE YIN AND YANG OF DISRUPTION By Scott Key P 5
INSIGHTSShale gas could drive economics of hydrogen fuel-cell vehicles P 6
Cyber threats against industry: Are asset owners prepared? P 7
Naphtha outlook in limbo amid shifting crude, chemical markets P 8
Home health technologies look to reshape patient care P 9
Emerging countries drive a hard bargain in defense market P 10
Escalating costs drive diminishing returns for oil companies P 11
Scrubbers gain favor as shipowners gird for SOx regulations P 12
US utilities test business case for behind-the-meter storage P 13
A new home for homeless hydrocarbons? P 14
China’s ‘green fence’ pressures recyclers to upgrade operations P 15
ANALYTICSCHEMICALS ON THE MOVE Source: IHS P 16
OUTLOOKGLOBAL GDP, CAPITAL INVESTMENT, AND TECHNOLOGY SPENDING Source: IHS P 70
NUMBERS11 METRICS THAT MATTER Source: IHS P 72
SPOTLIGHTLIFE IN THE VERY FAST LANE By Dale Ford P 74
IHS QUARTERLY Q4-2014
IHS Inc.
Scott KeyPresident & Chief Executive Officer
Jonathan GearSenior Vice President – Industrials
Anurag GuptaExecutive Vice President – Strategy, Products & Operations
IHS Quarterly
Sheri RhodineVice President, Integrated Marketing
John WardSenior Director, Thought Leadership
Bruce RaynerEditorial Director, IHS Quarterly
Thomas GoodfellowSenior Strategist, Thought Leadership
John SimpsonSenior Editor, IHS Quarterly
Peter BeddowCreative Director, IHS Quarterly
IHS Global Editing, Design, and Production Team
IHS Quarterly Editorial Council
Tim ArmstrongVice President, IHS Automotive
Atul AryaSenior Vice President, IHS Energy
Nariman BehraveshChief Economist, IHS
Richard ClaytonChief Maritime Analyst IHS Maritime & Trade
Mark EramoVice President, IHS Chemical
Dale FordVice President, IHS Technology
Chad HawkinsonVice President, IHS Product Design
Scott LockhartSenior Vice President, IHS OperationalExcellence & Risk Management
Tate NurkinManaging Director, IHS Aerospace, Defense & Security
Zbyszko TabernackiVice President, IHS Economics & Country Risk

IHS Quarterly | Q4-2014 | 5
VISION
The yin and yang of disruption
Disruption is a part of life, whether small interruptions to our daily schedules or life-changing events that put us on a new path. In business, disruption is often defined as an unplanned—and often unanticipated—externality that increases risk and cost. But just as in life, business disruptions can create new opportunities that, if managed well, lead to new products, services, and business models. At the core of the yin and yang of disruption is the opportunity to learn.
This issue of IHS Quarterly tackles disruption head on. In Shifting borders, boundaries, and sovereignty, Tate Nurkin explores the causes for and implications of some of the challenges to borders we are seeing unfolding around the world. Beyond the human cost, these shifts can have profound and long-lasting impacts on global businesses. To survive and thrive in this unsettled environment, companies need sophisticated tools and techniques to help them prepare for and respond to shifting borders.
Two articles explore the disruptive impact of emerging technologies: one on 3D printing and another on nanotechnology. In both articles, the authors discuss the implications of these technologies for companies across the value chain and provide roadmaps for how these technologies will move from novelty to ubiquity. How companies choose to adapt to these disruptions will likely shape their futures for the next decade and beyond.
Written from the perspective of 2041, Jim Burkhard’s article, The Rivalry Era, looks back over the past 25 years to document the changes within the energy industry wrought by the emergence of new energy resources. As the acceptance of natural gas and renewables grew, crude oil’s share of the energy market declined. This new energy “rivalry” is one possible version of the future that lies ahead and is IHS Energy’s new planning scenario to help energy companies understand and prepare for the disruptions to come in the next 25 years.
Our feature on Tesla Motors provides a case study in disruption occurring within the automotive industry. The article draws from the wealth of information gathered by the IHS Technology Teardown Team from its dissection of a 2013 Model S to uncover the design, manufacturing, and service innovations Tesla has built into the car. While Tesla may be in the spotlight, the rest of the auto industry is busy learning from the disruption.
Analyzing and interpreting the impact disruption has on business operations are what IHS does every day. Applying insight and expertise to help companies learn from disruption is our business.
Scott Key President and Chief Executive Officer IHS
6 | IHS Quarterly | Q4-2014
INSIGHTS
The development of fuel cell-powered vehicles (FCVs) is most directly linked to mandates for zero-emission vehicles. In fact, plentiful natural gas from the shale revolution may provide an economic underpinning to such mandates.
Given increased demand for clean fuels and cost-competitive petrochemical feedstocks, North American shale gas production is forecast to continue growing. While cost-advantaged chemical feedstocks, such as ethane, propane, and butane, will likely either be monetized as raw materials for chemical and polymer applications domestically or exported to regions with higher-cost raw materials, natural gas will most likely be consumed domestically for heating fuel and power generation, as well as to produce hydrogen, ammonia/urea, and methanol. With crude oil trading at roughly four times the price of natural gas on an energy-equivalent basis, liquid fuels derived from natural gas, including hydrogen, could provide economical diversification in the North American energy mix.
Due to the abundance of natural gas in North America, future gas prices are expected to range around $4–6 per million BTUs (MMBtu). As a result, hydrogen produced from steam reforming of natural gas could be attractive as a vehicle fuel—not the least because it emits no greenhouse gases at its point of end use. With hydrogen produced on an industrial scale for ammonia production and refineries, increasing its production is now feasible with su¡cient demand.
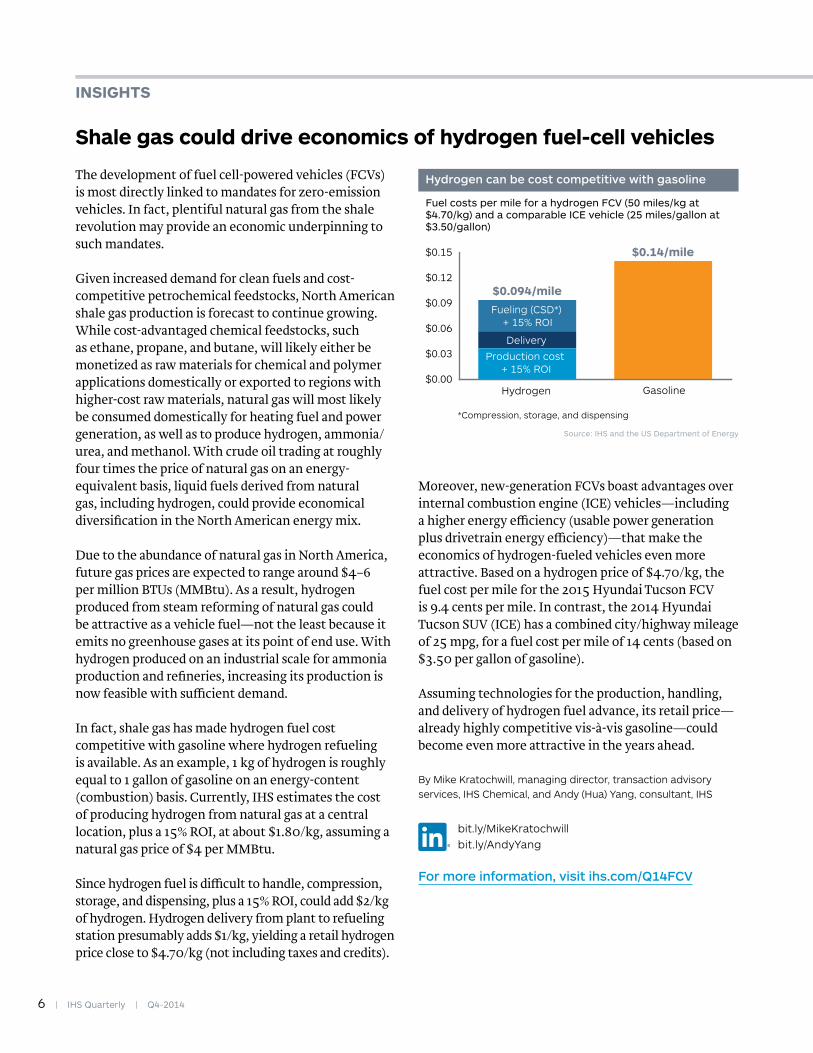
In fact, shale gas has made hydrogen fuel cost competitive with gasoline where hydrogen refueling is available. As an example, 1 kg of hydrogen is roughly equal to 1 gallon of gasoline on an energy-content (combustion) basis. Currently, IHS estimates the cost of producing hydrogen from natural gas at a central location, plus a 15% ROI, at about $1.80/kg, assuming a natural gas price of $4 per MMBtu.
Since hydrogen fuel is di¡cult to handle, compression, storage, and dispensing, plus a 15% ROI, could add $2/kg of hydrogen. Hydrogen delivery from plant to refueling station presumably adds $1/kg, yielding a retail hydrogen price close to $4.70/kg (not including taxes and credits).
Moreover, new-generation FCVs boast advantages over internal combustion engine (ICE) vehicles—including a higher energy e¡ciency (usable power generation plus drivetrain energy e¡ciency)—that make the economics of hydrogen-fueled vehicles even more attractive. Based on a hydrogen price of $4.70/kg, the fuel cost per mile for the 2015 Hyundai Tucson FCV is 9.4 cents per mile. In contrast, the 2014 Hyundai Tucson SUV (ICE) has a combined city/highway mileage of 25 mpg, for a fuel cost per mile of 14 cents (based on $3.50 per gallon of gasoline).
Assuming technologies for the production, handling, and delivery of hydrogen fuel advance, its retail price—already highly competitive vis-à-vis gasoline—could become even more attractive in the years ahead.
By Mike Kratochwill, managing director, transaction advisory services, IHS Chemical, and Andy (Hua) Yang, consultant, IHS
bit.ly/MikeKratochwill bit.ly/AndyYang
For more information, visit ihs.com/Q14FCV
Fuel costs per mile for a hydrogen FCV (50 miles/kg at $4.70/kg) and a comparable ICE vehicle (25 miles/gallon at $3.50/gallon)
Hydrogen can be cost competitive with gasoline
Source: IHS and the US Department of Energy
$0.00
$0.03
$0.06
$0.09
$0.12
$0.15 $0.14/mile
Hydrogen Gasoline
$0.094/mile
Delivery
Production cost + 15% ROI
Fueling (CSD*) + 15% ROI
*Compression, storage, and dispensing
Shale gas could drive economics of hydrogen fuel-cell vehicles

IHS Quarterly | Q4-2014 | 7
Cyber attacks targeting retailers may garner more media attention, but threats to industrial control systems are a growing concern. The US Department of Homeland Security responded to 257 such incidents in 2013—up from 198 in 2012 and 130 in 2011—over half of them attacks on energy infrastructure.
While the vulnerability of business-critical operations is widely known, the investment needed to secure them has not been made. An IHS survey of 12 major asset-owning industries, including energy, automotive, and chemical, shows high awareness of the threats faced at the operations level but a resistance to investing in cybersecurity measures because of their cost (see figure).
Global revenues of hardware, software, and services to secure automation/production networks across the surveyed industries are estimated at $600 million for 2013. While that market is projected to grow 12% annually, to $1.2 billion by 2019, cybersecurity products will still account for only 1% of all automation spending.
Holding back investment is the perceived lack of return associated with it. As it is virtually impossible to know whether a cybersecurity investment helped prevent an attack, security is viewed as a sunk cost less attractive to management than competing projects that provide measurable returns—although after-the-fact remediation is staggeringly expensive.
Several initiatives may encourage a change in thinking. Among those is the development of IEC 62243, an international standard aiming to establish best practices for securing operational technologies covering all aspects of industrial cybersecurity during an asset’s lifecycle.
Such a standard could apply across geographically dispersed facilities. And, unlike existing regulations such as NERC-CIP—which uses a prescriptive approach to secure assets critical to the operation of the US electric grid—IEC 62243 is risk based, allowing asset owners to prioritize investment and solutions rather than work through a list of mandatory requirements.
In the long run, the standard may bear more directly on automation suppliers—limiting their certification
work and driving them to develop products that are secure by design.
Another factor that may drive asset owners’ adoption of cybersecurity products is the changing attitude to cyber risk by insurers, who in assessing the risks of unsecured control systems are o©ering reduced premiums to companies that implement cybersecurity measures. As yet, asset owners surveyed by IHS ranked “lower insurance premiums” among the least important factors driving their cybersecurity spending. However, that attitude could change dramatically in the event of a damaging, high-profile cyber attack against a critical infrastructure asset.
By Toby Colquhoun, senior analyst, discrete and process automation, IHS Technology
bit.ly/TobyColquhoun
For more information, visit ihs.com/Q14CyberSecurity
Cyber threats against industry: Are asset owners prepared?
May 2014 survey results of companies in major asset-owning industries asked to rank factors hindering investment in cybersecurity: 5 = strongly agree; 1 = strongly disagree
Biggest hurdle to securing cyberspace: cost
Source: IHS
0% 10% 20% 30% 40% 50% 60% 70% 80% 90% 100%
Cost of software is too high
Cost of services is too high
Cost of hardware is too high
Senior management has low awareness of cybersecurity threats
Decision making hampered by limited tech knowledge of cybersecurity
Tension between IT and Engineering on overall project responsibility
Operations/IT/Engineering have low awareness of cybersecurity threats
5 4 3 2 1
8 | IHS Quarterly | Q4-2014
INSIGHTS
Naphtha—a refined petroleum product marketed in “heavy” and “light” varieties—plays a key role in the production of petrochemicals and gasoline. Heavy naphtha is a feedstock for high-octane gasoline and to produce the aromatic chemicals used to make PET bottles and polyester fiber. Lighter “para¡nic” naphtha is a gasoline blend-stock and a feedstock used to produce the olefins ethylene and propylene.
Light and heavy naphtha yield 40% of the global gasoline pool. Supply, demand, and prices of para¡nic and heavy naphtha are linked, as both are made from crude oil and are major gasoline constituents.
In 2012-13 aromatics manufacturers expressed concern over potential shortages of heavy naphtha for the new aromatics capacity expected in 2014-16. Their rationale was that oversupply of light naphtha from US unconventional oil/gas would spur demand for heavy naphtha required to blend sub-octane para¡nic naphtha. IHS analysis in “The Impact of Tight Oil and Shale Gas on Refining and Petrochemicals” concluded that North American light and heavy naphtha supplies were in fact balanced, and the impact of lower-quality heavy naphtha would be mostly diluted in about 7 million barrels of US Gulf Coast refining capacity. By 2014 tight oil production had accelerated, which when combined with weaker downstream demand in the short term has created some surplus, particularly in para¡nic naphtha.
While strong petrochemical demand and gasoline seasonality may push heavy naphtha prices above those of gasoline, in the long run they are likely to trend below gasoline prices. Similarly, light naphtha prices can fall below crude prices, but subsequent poor or negative refining margins as well as decreased crude processing tend to rebalance prices.
Self-balancing mechanisms are also in play on the global market. While naphtha demand as a feedstock in US petrochemical plants is being displaced by lower-cost ethane, demand for US ethane, propane, and butane (EPB) by European and Asian steam crackers will tend to boost prices of EPB feeds and steam cracking co-products, improving naphtha cracking economics over time.
IHS believes several factors will undergird naphtha demand, including:• In the United States, light naphtha and natural
gasoline prices will be supported by their gasoline-blend values and strong demand from Alberta bitumen crude blending.
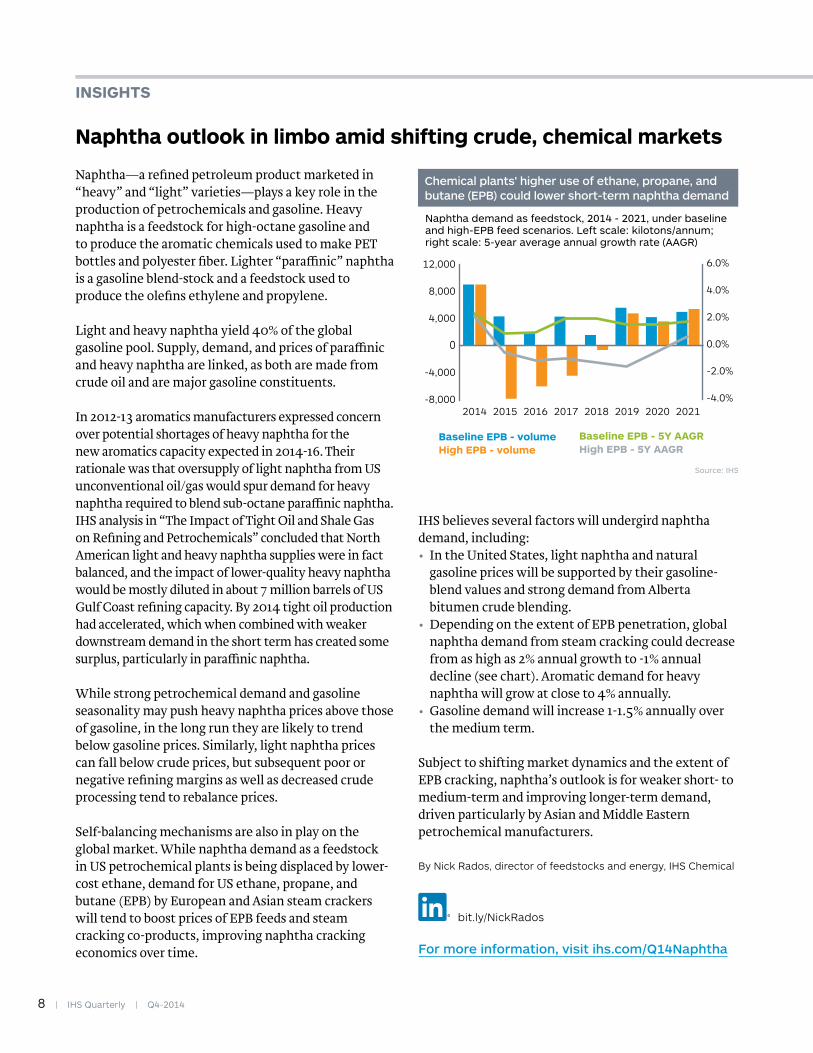
• Depending on the extent of EPB penetration, global naphtha demand from steam cracking could decrease from as high as 2% annual growth to -1% annual decline (see chart). Aromatic demand for heavy naphtha will grow at close to 4% annually.
• Gasoline demand will increase 1-1.5% annually over the medium term.
Subject to shifting market dynamics and the extent of EPB cracking, naphtha’s outlook is for weaker short- to medium-term and improving longer-term demand, driven particularly by Asian and Middle Eastern petrochemical manufacturers.
By Nick Rados, director of feedstocks and energy, IHS Chemical
bit.ly/NickRados
For more information, visit ihs.com/Q14Naphtha
Naphtha demand as feedstock, 2014 - 2021, under baseline and high-EPB feed scenarios. Left scale: kilotons/annum; right scale: 5-year average annual growth rate (AAGR)
Chemical plants' higher use of ethane, propane, and butane (EPB) could lower short-term naphtha demand
Source: IHS
-8,000
-4,000
0
4,000
8,000
12,000
20212020201920182017201620152014
Baseline EPB - 5Y AAGRHigh EPB - 5Y AAGR
Baseline EPB - volumeHigh EPB - volume
-4.0%
-2.0%
0.0%
2.0%
4.0%
6.0%
Naphtha outlook in limbo amid shifting crude, chemical markets

IHS Quarterly | Q4-2014 | 9
Soaring costs in the care of patients with chronic diseases are compelling health care providers to look at technologies such as telehealth for solutions.
Telehealth involves the remote exchange of physiological data between patient and doctor using phone lines or wireless technology to assist in diagnosis and monitoring. A home gateway unit aggregates readings from vital-signs monitors for remote clinical review. Telehealth is one of several emerging health technologies and initiatives (independent living, consumer medical devices, personal emergency response systems, wearables, and health gaming are others) designed to provide a holistic approach to patient care and reduce readmission and mortality rates.
Demographic and disease trends highlight telehealth’s importance in the future. The proportion of the US population aged 65 or older will double by 2050—over 90% of whom will have a chronic health condition. Worldwide, 1.4 billion people are overweight, and within 20 years diabetes prevalence is expected to increase 55% to almost 600 million people.
Moreover, a shortage of health care personnel is projected. The World Health Organization estimates 4.3 million more medical sta© will be needed by the end of 2015 to maintain health care levels globally.
In response, health care is moving from the fee-for-service model to quality of care to improve e¡ciency. Quality of care refers to services that increase the likelihood of desired health outcomes. US health care organizations are increasingly adopting the Accountable Care Organization model, which focuses on population health management (PHM)—facilitating preventive care to healthy patients, changing the behavior of those at risk for chronic diseases, and managing the health of people with chronic diseases.
Home health care technologies such as telehealth are at the center of this movement. For PHM to succeed, providers need patient-generated data—and the more structured the data, the more e¡ciently care can be administered. Home health technologies also boost patients’ engagement and
receptiveness to care because most prefer their homes to hospitals.
In the US, the A©ordable Care Act is helping drive both telehealth and the movement toward quality of care. Under the law, starting in October 2014 health care providers will lose 3% of their reimbursement for readmissions within 30 days. The UK has also implemented a readmission reduction program.
According to the US Center for Medicare and Medicaid Services, one in seven patients is readmitted within 30 days at an average cost of $9,600 and a cumulative cost of $28 billion annually. The American Medical Association estimates that 78% of ER, urgent care, and doctor visits can be avoided though remote care.
While the telehealth market has been slow to develop, it is expected to expand quickly (see figure) as technologies become less expensive and more widely available across standard smart devices—and as physicians realize the time and cost savings they a©ord.
By Roeen Roashan, analyst, medical devices & health care IT, IHS Technology
bit.ly/RoeenRoashan
For more information, visit ihs.com/Q14Telehealth
Telehealth patients globally by condition, 2013 - 2018 (000s)
Remote monitoring of chronic diseases set to take o�
0
2,000
4,000
6,000
8,000
201820172016201520142013
Source: IHS
Chronic obstructive pulmonary diseaseHypertensionOthers
Congestive heart failureDiabetesMental health
Home health technologies look to reshape patient care
10 | IHS Quarterly | Q4-2014
INSIGHTS
Among the consequences of emerging countries’ growing share of the global defense procurement market has been an accompanying rise in their use of o©sets in the award of defense contracts. Twenty-six countries have introduced formal o©set programs since 2000, bringing to 80 the number of governments imposing some form of obligation in kind on defense contractors from whom they purchase equipment.
O©sets are direct or indirect compensation intended to counter the financial burden of a defense purchase incurred by the acquiring government. And as emerging markets’ procurement budgets grow, they increasingly are leveraging their position to demand o©sets—often tied to economic growth objectives.
As o©set programs proliferate and their conditions grow more demanding, so grows the burden on defense contractors. And as purchasers’ thresholds—the minimum contract size that commands an o©set—remain static, the inflation-adjusted size of such contracts shrinks, squeezing defense suppliers’ profits.
O©sets may be direct (relating directly to the main procurement program through sub-contracting), semi-direct (relating to analogous military domains but not the actual procurement program), or indirect (typically completely unrelated programs, often in civilian areas). Inevitably, they incorporate one or more of the following features: program joint development, direct investment/facilitation of investment, technology transfer, placement of contracts with the buyer’s national industrial base, export/sales facilitation, or sub-contracting/work share.
The benefits of o©set for the procuring government are many and can include gaining access to technologies, improving foreign direct investment, easing trade imbalances, and countering foreign currency outflows.
O©sets can appear expensive—with the procuring government at times requesting o©sets equal to or greater than the value of the purchased equipment. In such cases, multipliers are typically used (e.g., $1 invested in, say, alternative energy earns an o©set credit of $10) to steer investment to priority areas.
While emerging markets have become more assertive in attaching o©sets to their defense contract awards, developed nations are moving in the opposite direction. The WTO’s Government Procurement Agreement prohibits o©set demands by members but allows them to be employed when deemed necessary to protect security interests. A 2011 EU directive contains a similar loophole.
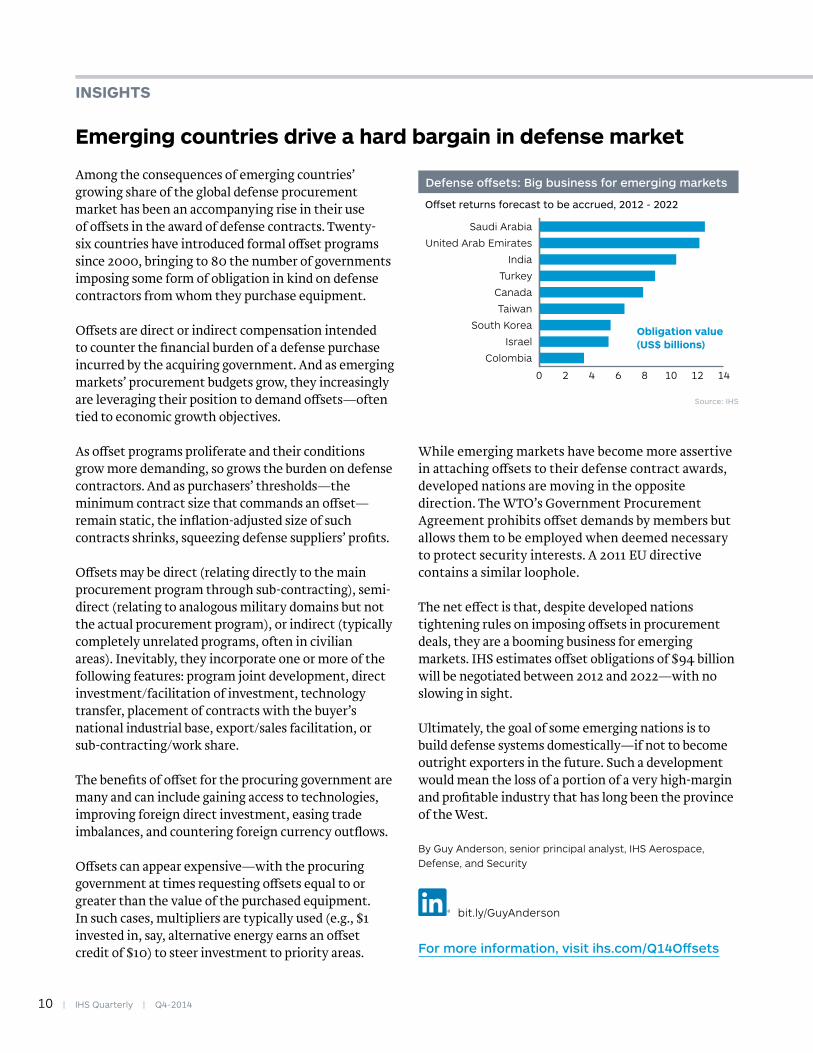
The net e©ect is that, despite developed nations tightening rules on imposing o©sets in procurement deals, they are a booming business for emerging markets. IHS estimates o©set obligations of $94 billion will be negotiated between 2012 and 2022—with no slowing in sight.
Ultimately, the goal of some emerging nations is to build defense systems domestically—if not to become outright exporters in the future. Such a development would mean the loss of a portion of a very high-margin and profitable industry that has long been the province of the West.
By Guy Anderson, senior principal analyst, IHS Aerospace, Defense, and Security
bit.ly/GuyAnderson
For more information, visit ihs.com/Q14O�sets
O�set returns forecast to be accrued, 2012 - 2022
Defense o�sets: Big business for emerging markets
0 2 4 6 8 10 12 14
Colombia
Israel
South Korea
Taiwan
Canada
Turkey
India
United Arab Emirates
Saudi Arabia
Source: IHS
Obligation value (US$ billions)
Emerging countries drive a hard bargain in defense market

IHS Quarterly | Q4-2014 | 11
Escalating costs drive diminishing returns for oil companies
Despite higher crude prices, oil companies’ returns on average capital employed (ROACE) are lower now than in 2001, when prices were less than one-third their current level. That could spell trouble for companies that fail to enact cost containment measures or exercise greater discipline around the return on their capital investments—particularly if oil prices decline.
ROACE is a useful metric for analyzing the performance of businesses in capital-intensive industries, such as oil. Companies that produce higher profits from a given investment will have a higher ROACE than those that are not as e¡cient in converting capital into profit.
Analysis of performance and capital returns on 80 oil and gas companies by IHS Energy shows that, collectively, oil companies averaged an 11% ROACE in 2012 and 8.6% in 2013, both of which are weaker than the ROACE achieved in 2001 when the West Texas Intermediate (WTI) crude oil price hovered at just under $27 per barrel. The WTI crude oil price averaged $94 per barrel in 2012 and $98 per barrel in 2013.
While returns—net income (after-tax profits) adjusted for financing costs—increased by 400% from 2000 to 2012, capital employed rose 535% over the same period, squeezing margins. Returns actually outstripped the rate of increase in capital employed between 2004 and 2008 as oil prices surged. But earnings were slammed in 2009 by the collapse of commodity prices while the capital base continued to rise.
The culprit is cost escalation. In the upstream sector, which comprises the majority of business of the companies analyzed, lifting costs, or the cost of producing oil and gas after drilling is complete, have more than quadrupled since 2000 to more than $21 per barrel. Finding and developing costs have followed a similar trajectory, reaching nearly $22 per barrel of oil equivalent in 2013. Moreover, government fiscal take (based on financial disclosure) increased from 49% of pretax profits in 2000 to 60% in 2013.
Integrated oil companies have fared better than pure exploration and production (E&P) companies—earning a 15% ROACE since 2000 compared with 11%—which
is largely a function of their geographically and functionally diversified portfolios, more disciplined capital spending programs, and the lower cost basis of the legacy assets that comprise a large portion of their operations. Integrated oil companies have also grown their profits faster, up 350% since 2000 compared with a doubling by the E&Ps—attributable to their upstream portfolios generally being more oil weighted and less exposed to North American natural gas markets and their diversified asset base, which includes refining, midstream, and chemicals businesses that, on balance, have enjoyed good market fundamentals and profit margins in recent years.
Capital investment among oil companies is typically highest in times of rising crude prices. While WTI prices have climbed most of the way back from their 10-year lows of February 2009, ROACE has not followed. Companies that are not now paring back their capital investments prudently are likely to see ROACE diminished further if oil prices retreat.
By Nicholas Cacchione, director of energy equity research, IHS
bit.ly/NCacchione
For more information, visit ihs.com/Q14ROACE
Left scale: return on average capital employed (%) Right scale: price per barrel of West Texas Intermediate (US$)
Oil companies' ROACE sag while crude prices surge
0
5
10
15
20
25
2013e2011200920072005200320010
20
40
60
80
100
Source: IHS
Return on average capital employed (%)WTI price (US$/bbl)

12 | IHS Quarterly | Q4-2014
INSIGHTS
As enforcement of new emission regulations draws closer for the maritime industry, vessel operators are weighing their compliance options.
Beginning January 2015, the sulfur oxide (SOx) content of emissions from all vessels operating within emission control areas (ECAs), of which there are currently four—North America (including Hawaii), US Caribbean, North Sea, and Baltic Sea—will be required not to exceed 0.1%. The current 1% limit was set in 2010 under MARPOL Annex VI.
One option is to burn fuel with lower sulfur content, which is estimated to cost 70% more than the higher-sulfur fuel now used. For vessels already in service, however, the installation of “scrubbers,” SOx abatement systems, appears to be an attractive second option. With scrubbers in place, vessels will be able to operate on higher-sulfur fuel and remain compliant under the emission regulations.
While scrubbing technology has been employed in power generation and other industries for a number of years, it is relatively new to the maritime sector. On ships, scrubbers work on the principle of spraying seawater as mist into the exhaust gases to neutralize the acids. In an open-loop scrubber, the wastewater is discharged overboard, where the natural alkalinity of the seawater neutralizes the acidic discharge. In a closed-loop scrubber, the washwater is mixed with a strong alkaline (caustic), which reacts with the acidic (sulfur) particles. The waste is then stored on board in sludge tanks for later disposal onshore.
Hybrid scrubbers provide flexibility for ships to switch between open and closed loop, permitting zero discharge where local regulations prevent such actions. In Europe, ferry operator DFDS Seaways has led the way in installing this technology. The Tor Ficaria (later renamed Ficaria Seaways) was installed with a hybrid system developed by Aalborg Industries (now part of Alfa-Laval) in May 2009, which laid the foundation for a large-scale fleet investment. Thus far, 11 of the company’s vessels that service routes in the Baltic Sea and North Sea have been retrofitted with the system.
While DFDS’ decision is driven largely by the fact that its operations are almost entirely within ECA zones, other owners have been mulling the decision to install scrubbers to provide operational flexibility. Carnival Corporation has committed to retrofit over 70 of its vessels with scrubbers. The cruise ship giant will install a proprietary “compact” scrubber unit on vessels in its Princess Cruises, Cunard, Aida Cruises, Costa Crociere, and Holland America brands. This will enable its fleet to transit in and out of ECA areas without having to switch fuels.
Retrofitting a vessel with a scrubber can be done reasonably quickly—as little as 10 days in some cases—as the units can be preassembled before installation on board. While scrubbers add weight to a vessel, their ability to allow ships to run on cheaper fuel, for now, appears to be making them the compliance option of choice for cost-conscious maritime operators.
By Krispen Atkinson, principal analyst, IHS Maritime & Trade
bit.ly/KrispenAtkinson
For more information, visit ihs.com/Q14Scrubbers
Number of vessels, by category, that have scrubbers installed to meet new emissions requirements
Cruise ships account for almost half of all vessels now outfitted with SO scrubbers
Source: IHS
Cruise ship 69
Ro-ro cargo ship 31
Tanker 12
Bulk carrier 11
LPG tanker 6
Dry cargo ship 5
Ferry 5
Vehicles carrier 4
Container ship 2
x
Scrubbers gain favor as shipowners gird for SOx regulations
IHS Quarterly | Q4-2014 | 13
Will customer-sited, grid-connected batteries eliminate the need for construction of new power plants to meet peak electricity demand? Utilities in some of the most densely populated US corridors are experimenting to see if batteries could play such a role, encouraging customers to install behind-the-meter storage to serve as capacity to help shave peak demand loads.
In February 2014, New York utility Consolidated Edison introduced a demand management program that includes incentives of $2,100/kW for battery storage systems sited on customer premises that charge during o© hours and discharge during peak periods. The initiative followed the largest request for proposal for storage resources to date: Southern California Edison’s 2013 call for at least 50 MW of storage capacity, primarily for the Los Angeles area. Both moves were prompted by regulators’ reliability concerns amid the looming closure of nuclear power plants.
Faced with growing regulatory and cost restrictions a©ecting their siting of peaking units—particularly in urban areas—utilities are increasingly considering storage for incremental capacity needs. With steadily improving cost and e¡ciency, batteries are becoming a promising option in these high-density service areas. In ConEd’s case, IHS estimates its storage incentive is roughly equal to the New York Independent System Operator’s estimated “cost of new entry” for a gas peaking unit.
ConEd’s program is attracting project developers whose core business models are predicated on developing, owning, and operating behind-the-meter storage. These companies are following the path of early movers in the distributed solar PV industry: leveraging state incentives, targeting commercial and industrial (C&I) customers, o©ering financing, and streamlining installation processes.
To make project economics work, developers are banking on a combination of utility incentives and customer savings on peak demand charges, which can account for over one-third of C&I customers’ electricity costs. By identifying customers with especially “peaky” load and carefully sizing their battery o©erings,
developers are signing contracts with a variety of customers to provide peak load management.
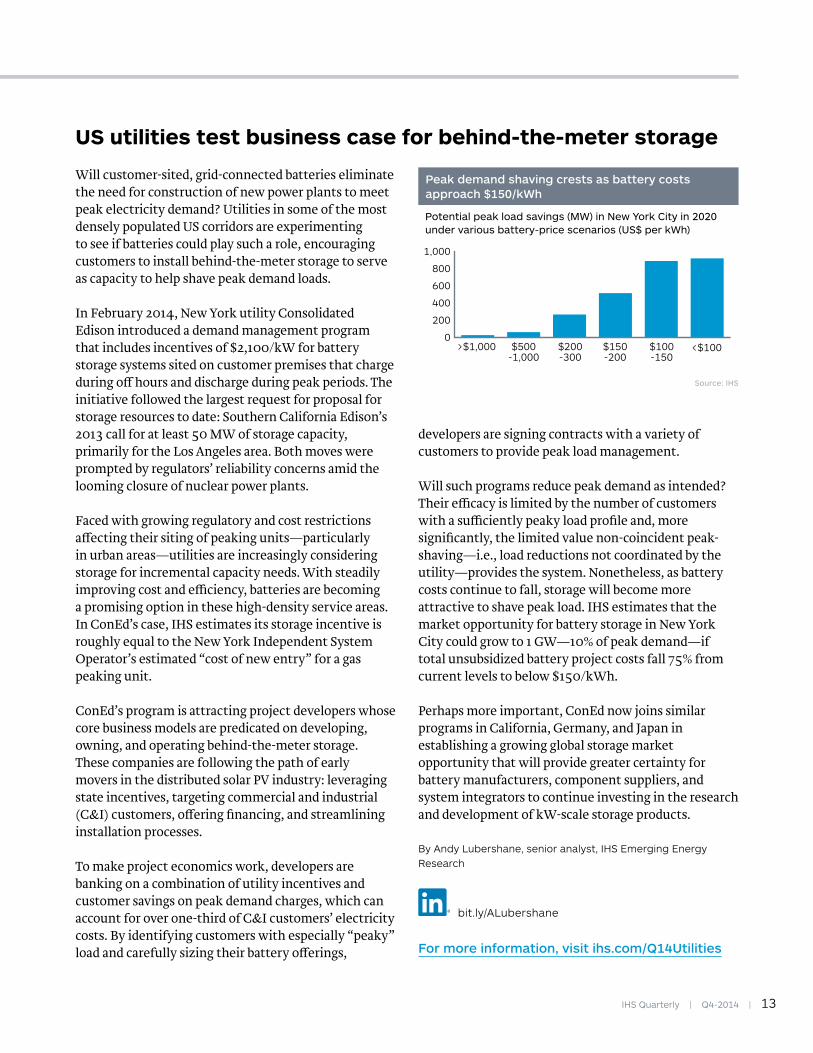
Will such programs reduce peak demand as intended? Their e¡cacy is limited by the number of customers with a su¡ciently peaky load profile and, more significantly, the limited value non-coincident peak-shaving—i.e., load reductions not coordinated by the utility—provides the system. Nonetheless, as battery costs continue to fall, storage will become more attractive to shave peak load. IHS estimates that the market opportunity for battery storage in New York City could grow to 1 GW—10% of peak demand—if total unsubsidized battery project costs fall 75% from current levels to below $150/kWh.
Perhaps more important, ConEd now joins similar programs in California, Germany, and Japan in establishing a growing global storage market opportunity that will provide greater certainty for battery manufacturers, component suppliers, and system integrators to continue investing in the research and development of kW-scale storage products.
By Andy Lubershane, senior analyst, IHS Emerging Energy Research
bit.ly/ALubershane
For more information, visit ihs.com/Q14Utilities
Potential peak load savings (MW) in New York City in 2020 under various battery-price scenarios (US$ per kWh)
Peak demand shaving crests as battery costs approach $150/kWh
0
200
400
600
800
1,000
$500-1,000
$200-300
$150-200
$100-150
<$100>$1,000
Source: IHS
US utilities test business case for behind-the-meter storage
14 | IHS Quarterly | Q4-2014
INSIGHTS
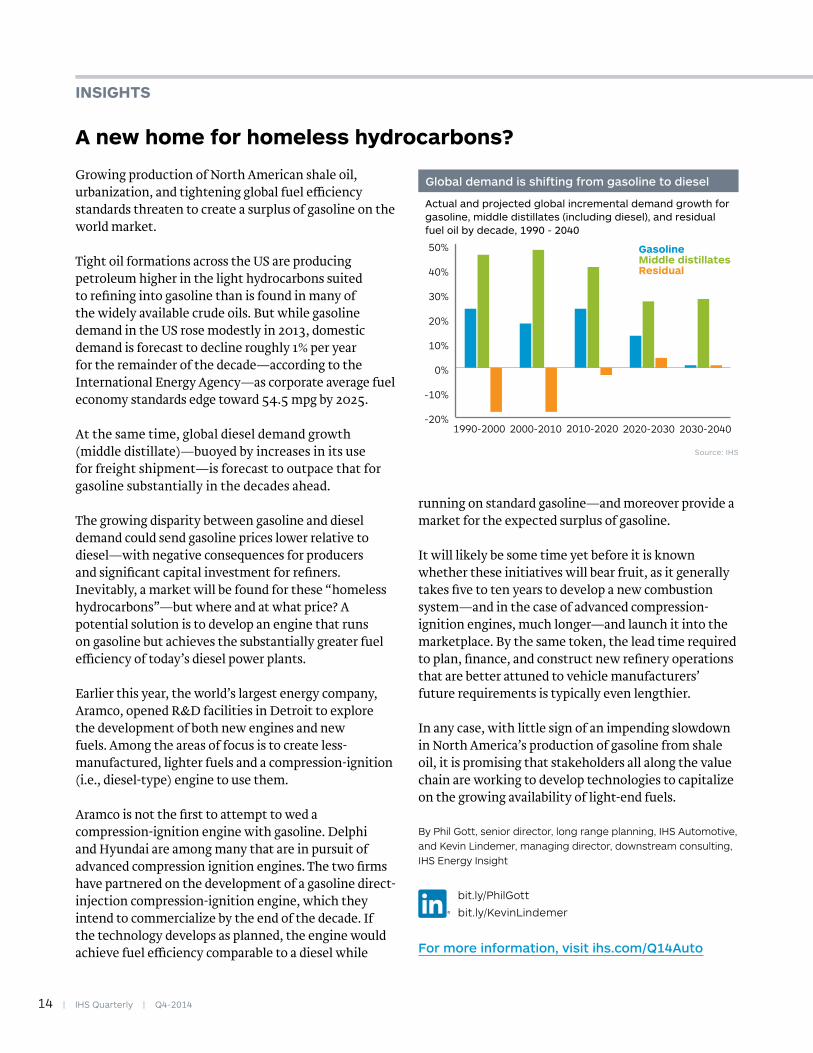
Growing production of North American shale oil, urbanization, and tightening global fuel e¡ciency standards threaten to create a surplus of gasoline on the world market.
Tight oil formations across the US are producing petroleum higher in the light hydrocarbons suited to refining into gasoline than is found in many of the widely available crude oils. But while gasoline demand in the US rose modestly in 2013, domestic demand is forecast to decline roughly 1% per year for the remainder of the decade—according to the International Energy Agency—as corporate average fuel economy standards edge toward 54.5 mpg by 2025.
At the same time, global diesel demand growth (middle distillate)—buoyed by increases in its use for freight shipment—is forecast to outpace that for gasoline substantially in the decades ahead.
The growing disparity between gasoline and diesel demand could send gasoline prices lower relative to diesel—with negative consequences for producers and significant capital investment for refiners. Inevitably, a market will be found for these “homeless hydrocarbons”—but where and at what price? A potential solution is to develop an engine that runs on gasoline but achieves the substantially greater fuel e¡ciency of today’s diesel power plants.
Earlier this year, the world’s largest energy company, Aramco, opened R&D facilities in Detroit to explore the development of both new engines and new fuels. Among the areas of focus is to create less-manufactured, lighter fuels and a compression-ignition (i.e., diesel-type) engine to use them.
Aramco is not the first to attempt to wed a compression-ignition engine with gasoline. Delphi and Hyundai are among many that are in pursuit of advanced compression ignition engines. The two firms have partnered on the development of a gasoline direct-injection compression-ignition engine, which they intend to commercialize by the end of the decade. If the technology develops as planned, the engine would achieve fuel e¡ciency comparable to a diesel while
running on standard gasoline—and moreover provide a market for the expected surplus of gasoline.
It will likely be some time yet before it is known whether these initiatives will bear fruit, as it generally takes five to ten years to develop a new combustion system—and in the case of advanced compression-ignition engines, much longer—and launch it into the marketplace. By the same token, the lead time required to plan, finance, and construct new refinery operations that are better attuned to vehicle manufacturers’ future requirements is typically even lengthier.
In any case, with little sign of an impending slowdown in North America’s production of gasoline from shale oil, it is promising that stakeholders all along the value chain are working to develop technologies to capitalize on the growing availability of light-end fuels.
By Phil Gott, senior director, long range planning, IHS Automotive, and Kevin Lindemer, managing director, downstream consulting, IHS Energy Insight
bit.ly/PhilGott
bit.ly/KevinLindemer
For more information, visit ihs.com/Q14Auto
Actual and projected global incremental demand growth for gasoline, middle distillates (including diesel), and residual fuel oil by decade, 1990 - 2040
Global demand is shifting from gasoline to diesel
-20%
-10%
0%
10%
20%
30%
40%
50%
1990-2000 2000-2010 2030-20402020-20302010-2020
Source: IHS
GasolineMiddle distillatesResidual
A new home for homeless hydrocarbons?

IHS Quarterly | Q4-2014 | 15
China’s recent crackdown on the importation of contaminated scrap has served warning to US and European recyclers that they will have to improve their processing facilities or turn elsewhere for their waste disposal.
For years, China has been the global leader in scrap recycling—importing up to 70% of the world’s post-consumer plastic waste alone. For China, the plastics provide a ready, low-cost resin supply for the country’s thriving manufacturing sector. Exporting countries, for their part, can divert a portion of their waste that might otherwise be landfilled or incinerated. Shipowners have benefitted as well, as the very container ships used to haul manufactured goods from China can be refilled with scrap for the return passage.
In 2013, however, China enacted the “Green Fence Initiative,” carrying out intensive inspections of scrap shipments at its ports for contamination—including insects, food, and medical and animal waste—as well as improperly mixed scrap. In some instances, shippers have been charged fees for the added inspection time, while in others their scrap bales have been denied entry entirely.
The driving factors behind China’s enforcement of regulations that actually date to 1996 are to reduce environmental degradation and customs corruption. Mixed plastic and film bales are under particular scrutiny, as Chinese recyclers buy #3 to #7 plastics in mixed bales seeking polypropylene content (#4 and #5) and discard PVC (#3), polystyrene (#6), dirty film, and other resins (#7) in the country’s bloated and increasingly toxic landfills.
The situation leaves many municipalities—particularly in the United States—in a bind. China’s ready acceptance of municipal waste has meant that many communities have neglected to develop their own recycling infrastructure to reprocess the ever-increasing volumes of plastic scrap. The proportion of US plastics waste that is landfilled today stands at 75-80%.
Western Europe has a more advanced plastic-recycling infrastructure, with more than 35% of
plastic scrap used for energy recovery and an overall plastics reclamation rate (i.e., including recycling) above 60%. Additionally, as European manufacturers face comparatively high polyethylene production expenses, there is a relatively healthy market for the use of recycled plastic as a feedstock in place of virgin chemicals.
With requirements to ship cleaner and more segregated plastic waste, scrap recyclers face new pressures to improve their collection and sorting processes—a challenge made more costly and di¡cult by the unrelenting introduction of new plastic packaging materials with unique compositions tailored to provide superior performance for specific applications.
By Jim Glauser, specialty chemicals analyst, IHS Chemical
bit.ly/JimGlauser
For more information, visit ihs.com/Q14Recycling
China’s ‘green fence’ pressures recyclers to upgrade operations
0
2
4
6
8
10
12
14
2014*201320122011
Chinese imports of plastic scrap, 2011 - 2014 (millions of metric tons)
Fencing out unwanted waste
Source: IHS*Estimated
ChinaHong Kong

16 | IHS Quarterly | Q4-2014
0
13
26
39
52
65
78
91
104
117
130
Ethylene
Propylene
Methanol
United StatesSaudi ArabiaChina
Source: IHS
0
12
24
36
48
60
72
84
96
108
120
0
12
24
36
48
60
72
84
96
108
120
United StatesSaudi ArabiaChina
0
35
70
105
140
175
210
245
280
315
350
Saudi ArabiaUSChinaWorld
0
35
70
105
140
175
210
245
280
315
350
Saudi ArabiaUSChinaWorld
0
35
-35
70
105
140
175
210
245
280
315
350
0
13
26
39
52
65
78
91
104
117
130
United StatesSaudi ArabiaChina
GLOBAL PRODUCTION TREND
GLOBAL PRODUCTION TREND
0
13
26
39
52
65
78
91
104
117
130
ET
HY
LEN
EP
RO
PY
LEN
EM
ET
HA
NO
L
ETHYLENE
PROPYLENE
METHANOL Chlorine
Benzene
WorldChina
US Saudi Arabia
CAPACITY UTILIZATION RATES IN 2020
Global production of ethylene, propylene, and methanol in 2020 is projected to be 385 million metric tons, while global capacity will reach 478 million metric tons, resulting in a utilization rate of 81%.
CHINA IS DRIVING GLOBAL CHEMICAL DEMAND
From relative obscurity in 2000, China’s demand for the three basic chemicals has grown rapidly and is forecast to account for 39% of global demand by 2020, making it the largest consumer of chemicals in the world by a significant margin. The Middle East & Africa, and South America, have seen strong growth as well. (Percent growth of equivalent demand for the three basic chemicals by region, 2000 to 2020. Equivalent demand includes net trade of chemical derivatives)
WHERE CAPACITY IS BEING ADDED
China, the US, and Saudi Arabia account for 63% of the projected 283 million metric tons in global chemical capacity investment for the three basic chemicals between 2000 and 2020. China dominates at 45% of the total as it strives to reduce dependence on imports. The US is a distant second at 10%, trailed by Saudi Arabia at 8.5%. (Millions of metric tons added, 2000 to 2020)
0 100 200 300 400 500 600 700 800
0 40 80 120 160 2000.0 40.4 80.8 121.2 161.6 202.0
503350
2000 2010 2020ethylene propylene methanol
50
117
76
32
95
49
0
10
20
30
40
50
60
70
80
90
100
GLOBAL PRODUCTION TREND
WHAT CHEMICALS ARE MADE FROM
Feedstocks are changing around the world. China is investing in coal and methanol-to-olefins technology; the US is tapping cheap domestic ethane from natural gas; and high-cost crude oil is causing a decline in the use of naphtha. (Feedstocks as a percent of total production for 2000 (inside ring), 2010 (middle ring), and 2020 (outside ring))
BIG INVESTMENTS IN CAPACITY
Global capacity of the three basic chemicals is expected to more thandouble between 2000 and 2020. (Global production trend line in millions of metric tons for 2000, 2010, and 2020. Bar chart is global capacity in millions of metric tons for 2000 and 2020)
Chemicals on the moveThe next five years will see accelerated growth in the global supply of three key chemical building blocks—ethylene, propylene, and methanol—as advantaged feedstock availability drives significant investment in China, the United States, and Saudi Arabia. What these chemicals will be made from, where they will be produced, and where they will be consumed are all in motion. China dominates all categories of growth, playing a significant role in determining future market conditions for the industry.
ANALYTICS
ETHYLENE
89%PROPYLENE
82%METHANOL
67%
250%
Europe
29
0
50
100
150
200
250
300
350
0
50
100
150
200
250
300
350
NaphthaEthanePropaneButaneCoal to olefinsGas oilMethanol to olefinsOthers
Steam crackersFCC splittersDehydroCoal to olefinsMetathesisHS FCCMethanol to olefinsCoal to propyleneOlefin crackingOthers on-purpose
Natural gasHeavy liquidsCoal to methanolOther
2000
2020
98194
2000
2020
60142
2000
2020
37142
0
50
100
150
200
250
300
350
400
China
579Middle
East & Africa
246South
America
113
World
125
Asia (excluding China)
102North
America
7
91
173
122
utilization rate
81%

IHS Quarterly | Q4-2014 | 17
0
13
26
39
52
65
78
91
104
117
130
Ethylene
Propylene
Methanol
United StatesSaudi ArabiaChina
Source: IHS
0
12
24
36
48
60
72
84
96
108
120
0
12
24
36
48
60
72
84
96
108
120
United StatesSaudi ArabiaChina
0
35
70
105
140
175
210
245
280
315
350
Saudi ArabiaUSChinaWorld
0
35
70
105
140
175
210
245
280
315
350
Saudi ArabiaUSChinaWorld
0
35
-35
70
105
140
175
210
245
280
315
350
0
13
26
39
52
65
78
91
104
117
130
United StatesSaudi ArabiaChina
GLOBAL PRODUCTION TREND
GLOBAL PRODUCTION TREND
0
13
26
39
52
65
78
91
104
117
130
ET
HY
LEN
EP
RO
PY
LEN
EM
ET
HA
NO
L
ETHYLENE
PROPYLENE
METHANOL Chlorine
Benzene
WorldChina
US Saudi Arabia
CAPACITY UTILIZATION RATES IN 2020
Global production of ethylene, propylene, and methanol in 2020 is projected to be 385 million metric tons, while global capacity will reach 478 million metric tons, resulting in a utilization rate of 81%.
CHINA IS DRIVING GLOBAL CHEMICAL DEMAND
From relative obscurity in 2000, China’s demand for the three basic chemicals has grown rapidly and is forecast to account for 39% of global demand by 2020, making it the largest consumer of chemicals in the world by a significant margin. The Middle East & Africa, and South America, have seen strong growth as well. (Percent growth of equivalent demand for the three basic chemicals by region, 2000 to 2020. Equivalent demand includes net trade of chemical derivatives)
WHERE CAPACITY IS BEING ADDED
China, the US, and Saudi Arabia account for 63% of the projected 283 million metric tons in global chemical capacity investment for the three basic chemicals between 2000 and 2020. China dominates at 45% of the total as it strives to reduce dependence on imports. The US is a distant second at 10%, trailed by Saudi Arabia at 8.5%. (Millions of metric tons added, 2000 to 2020)
0 100 200 300 400 500 600 700 800
0 40 80 120 160 2000.0 40.4 80.8 121.2 161.6 202.0
503350
2000 2010 2020ethylene propylene methanol
50
117
76
32
95
49
0
10
20
30
40
50
60
70
80
90
100
GLOBAL PRODUCTION TREND
WHAT CHEMICALS ARE MADE FROM
Feedstocks are changing around the world. China is investing in coal and methanol-to-olefins technology; the US is tapping cheap domestic ethane from natural gas; and high-cost crude oil is causing a decline in the use of naphtha. (Feedstocks as a percent of total production for 2000 (inside ring), 2010 (middle ring), and 2020 (outside ring))
BIG INVESTMENTS IN CAPACITY
Global capacity of the three basic chemicals is expected to more thandouble between 2000 and 2020. (Global production trend line in millions of metric tons for 2000, 2010, and 2020. Bar chart is global capacity in millions of metric tons for 2000 and 2020)
Chemicals on the moveThe next five years will see accelerated growth in the global supply of three key chemical building blocks—ethylene, propylene, and methanol—as advantaged feedstock availability drives significant investment in China, the United States, and Saudi Arabia. What these chemicals will be made from, where they will be produced, and where they will be consumed are all in motion. China dominates all categories of growth, playing a significant role in determining future market conditions for the industry.
ANALYTICS
ETHYLENE
89%PROPYLENE
82%METHANOL
67%
250%
Europe
29
0
50
100
150
200
250
300
350
0
50
100
150
200
250
300
350
NaphthaEthanePropaneButaneCoal to olefinsGas oilMethanol to olefinsOthers
Steam crackersFCC splittersDehydroCoal to olefinsMetathesisHS FCCMethanol to olefinsCoal to propyleneOlefin crackingOthers on-purpose
Natural gasHeavy liquidsCoal to methanolOther
2000
2020
98194
2000
2020
60142
2000
2020
37142
0
50
100
150
200
250
300
350
400
China
579Middle
East & Africa
246South
America
113
World
125
Asia (excluding China)
102North
America
7
91
173
122
utilization rate
81%

18 | IHS Quarterly | Q4-2014
When macroeconomicsand global supply chains collidePopulation dynamics, geopolitics, income flows, and shifts in production and
consumption around the world influence global trade and directly a�ect the supply
chains that are its lifeblood. A nuanced understanding of the interaction of these
macro-phenomena and their long-term implications provides an edge that global
corporations need to stay competitive.
By Chris G. Christopher, Jr. and David Deull
Sh
utt
erst
ock

IHS Quarterly | Q4-2014 | 19
G lobal trade and its many supply chains are continually subject to shifts in economic conditions, geopolitical regimes, and
demographics. Anticipating these changes is essential for companies that depend on their supply chains to adapt and thrive. Several global macroeconomic and demographic trends have emerged recently that are a©ecting trade flows and have the potential to disrupt those supply chains.
Chief among them is the slowdown of emerging market growth. A number of emerging markets have experienced a rapid deterioration in their economic performance over the last few years. There are four reasons for this slowdown. First, the hyper-globalization of the last 20 years is over, replaced by a more modest and perhaps sustainable growth path. Second, the related surge in commodity prices, known as the commodity super cycle, has come to an end for now. Third, emerging markets no longer have access to credit at historically low rates. And fourth, global trade liberalization has not made much progress recently.
As a consequence, life for supply chain executives is becoming more complicated. Easy opportunities for cost savings in sourcing materials and labor, and rapid growth in new emerging markets, are harder to come by. Growth will be more incremental in the future and depend on closely monitoring economic and political trends to identify new sourcing and demand opportunities.

20 | IHS Quarterly | Q4-2014
The emerging market slowdownMuch has been made of the extraordinary growth of emerging markets—in particular, the BRIC countries (Brazil, Russia, India, and China) during the 2000s—as US and European companies en masse moved manufacturing operations overseas. But during these boom years, many emerging markets failed to institute the necessary structural reforms that would enable them to transition to a slower but more sustainable and stable pace of economic growth.
China is still maintaining relatively strong growth—last year real GDP growth was 7.7% and this year it is projected to be approximately 7.5%—but Brazil, Russia, and India have all entered economic slowdowns. Russia is closely tied to the ups and downs of oil markets and now is being impacted by Western sanctions. India faces a much slower GDP growth rate due to declining fixed investment and factor productivity. Brazil’s real GDP growth for 2013 was just 2.5%. The country slipped into recession in the first half of 2014 due to declining investment, the end of the commodity super cycle, and a slowdown in private sector consumption.
As the pace of growth slows for these economies, the biggest impact is felt by the new middle class and the still high number of households living in poverty, which devote a significant proportion of their income to food, housing, and other daily necessities.
India’s annual GDP per capita is about $1,500, compared to $6,800 in China and $54,000 in the US. As a result, a national economic slowdown would have a greater impact on the average Indian family’s quality of life than the average American or even Chinese family. As growth slows in countries with low personal income per household or low GDP per capita, it feels like a recession.
The result is slowing demand growth for non-essential consumer goods, which will likely continue and perhaps worsen if structural changes are not addressed. If global companies fail to understand the causes of the slowdown in emerging markets and do not correctly forecast the implications, it will adversely impact their businesses. For frontline companies serving these markets, that means a hit to sales and an increase in finished goods inventory.
Further up the supply chain—distributors, wholesalers, manufacturers, and component and materials
suppliers—the consequences can be amplified, a phenomenon commonly referred to as the “bull-whip e©ect.” That is, as the shock wave of the slowdown ripples back through the supply chain, the impact on sales, inventory, and manufacturing operations grows.
Western markets strugglingDeveloped markets are struggling in their own ways. Real GDP growth in the US averaged 3.2% annually between 1980 and 2007. Since the end of the Great Recession in June 2009, the recovery has been anemic, with real GDP growth averaging 2.2% annually. As a consequence, real median household income has been flat for two years and is now 8% below the 2007 level.
In the European Union, the recovery has been hampered by the two-tiered growth performance of the northern and southern countries. The north is relatively stable economically, while the south is slowly digging out of a deep economic hole. Income inequality between the two tiers is rising.
Declining real median household income, elevated poverty rates, and the rise of income inequality in both the US and Europe have caused a bifurcation of consumer spending patterns. Luxury and discount stores are doing well, while the middle-tier retailers are having a hard time regaining traction.
The combination of the slowdown in emerging markets and stagnation of US and Western European economic performance has slowed world trade growth. While IHS expects global real GDP growth to accelerate in 2014 and 2015, globalization—defined as the share of world imports as a percentage of global GDP—is not expected to follow suit. Instead, globalization will hover around 30%, where it has been since 2010 (see figure above).
World imports as a percent of GDP
Long-term growth in world trade is expected to flatten out
20
25
30
35
40
1997 2002 2007 2012 2017 2022Source: IHS

Supply and demand balancingIn 2014, China’s GDP is expected to represent 13% of global GDP, while the US will account for almost a quarter. However, by 2024 China and the US are likely to be even at about 20% each, which is expected to balance global production more uniformly between East and West.
It is likely that US consumers will still claim the highest percentage share of global consumption for the next few years, but emerging market consumers are closing the gap. The rise of China’s consumer class is likely to propel its economy to a much greater share of global consumption over the next six to eight years, fueled by accumulating wealth and an increasing number of middle-income households. In fact, IHS expects consumption in the BRICs to surpass Western Europe by 2019 and the US by 2020.
On a per capita basis, China and other emerging markets have a long way to go to catch up with the advanced economies, but the signs of their increasing influence are clear. In 2004, Chinese consumers were responsible for only 4% of global consumer spending. By 2014, they are likely to account for 8% and, by 2024, 15%. This means that the Chinese consumer’s share of global private consumption will have increased by nearly a factor of four in two decades.
By contrast, American consumer spending is expected to decline from 33% of global GDP in 2004 to 28% in 2014 and to less than 20% a decade later. Consumer spending in Western Europe peaked in 2004 at nearly 18% and continues to decline. IHS predicts that by 2020, US and Western European consumer spending combined will account for only 24% of world GDP, down considerably from 38% in 2002. As the disparity
in production and consumption between emerging markets and the West diminishes, these levels will come into relative balance (see figure at left).
These changing international trade, production, and consumption patterns have several implications for global supply chain managers. First, the relative decrease in the US consumer’s importance to global trade will serve to reduce production volatility. As global producers become less reliant on one market, they will be able to spread market risk around the world in a more balanced way.
Second, the major trading blocs are becoming increasingly connected and their performance correlated. As retailers struggle for market share in the West, the growth of the middle classes in China and India has also slowed. A strategy that considers relative growth opportunities across multiple markets will enable global corporations to maximize their market opportunities.
Evidence of the relative importance of emerging markets abounds. Some computer manufacturers launch their products in emerging markets before the US. Some American automobile manufacturers have been introducing new models in Asia before they hit the US market. Even Hollywood has responded to the production and consumption balancing by releasing some films in emerging markets prior to their US launch.
Demography has spoken In the late 1970s and early 1980s, many demographers and economists were asking whether it would be possible to prevent the world’s population from reaching 25 billion by the end of the 21st century. Current estimates now project a world population of around 10 billion by 2050 with little increase thereafter. This slowing of the world’s population growth will lead to an uneven slowing in the global economy.
The reason for the population growth slowdown is falling fertility rates. Globally, women and families are choosing to have fewer children than in the past. This is because as a country urbanizes and industrializes, the need for large families to work the farm decreases. Approximately 70% of all nations have child-bearing rates below or approaching the replacement level in developed countries of 2.1 children per woman. Coupled with longer life expectancies, this e©ect is turning the traditional population pyramid on its head.
IHS Quarterly | Q4-2014 | 21
Domestic consumption as a share of world GDP (%)
As emerging markets mature, consumer spending rises to match Western countries
0
5
10
15
20
25
2000 2005 2010 2015 2020
Western EuropeUS
BRIC
Source: IHS

22 | IHS Quarterly | Q4-2014
Some regions are seeing a particularly strong aging e©ect (see figure above). In China, for example, the one-child policy, coupled with increasing urbanization, has taken a toll on population growth. In Japan, the working-age population has started to shrink because of the aging of the overall population. Since 2006, the number of deaths in Japan has outpaced the number of births. And in Central and Eastern Europe, population growth rates are close to 0% and expected to remain there for the foreseeable future.
Declining population growth and increased urbanization have implications for trade and supply chains as well. Increasing levels of urbanization and the emergence of megacities will require increased productivity of the food supply chain. They will also necessitate improvements in both intra- and inter-city logistics. This e©ect is pronounced in China, where increased urbanization and an aging population combine with a large and growing middle class.
In most developed countries, urbanization stabilized last century, but emerging markets are catching up. The global urbanization rate
surpassed 50% sometime between 2000 and 2004 (see figures at right).
Who’s next?Nations that show promise in terms of their end-use or sourcing potential are emerging. Chief among the contenders are Mexico and Vietnam.
Mexico’s increased competitiveness is helping the country regain its share of US imports at China’s expense. In 2001, China’s entry into the WTO caused a major shift in trade as China quickly outpaced Mexico in exports to the US. Between 2001 and 2005, Mexico’s share of US imports of manufactured goods fell from 12.1% to 10.4%, while China’s share rose from 11% to 19.2%. But Mexico staged a comeback in 2005. By 2009, China’s share of US manufactured goods imports leveled o© at around 26%, while Mexico’s share grew to 13% by 2013.
There are several reasons for Mexico’s rebound. First and foremost is its proximity to the US. The relatively stronger US recovery after the Great Recession benefited Mexico disproportionately. The relatively high cost of ocean shipping compared to that of an
China no longer has the cost advantage that made it the world’s manufacturer. There is growing concern about broader risks, such as civil instability, shadow banking, a real estate bubble, and military adventurism.
Compound annual average growth rate (%)
Regional population growth rates around the world are declining
Source: IHS
Sub-Saharan
Africa
Mideast&
N. Africa
OtherAsia-
Pacific
JapanEmergingEurope
WesternEurope
-1
0
1
2
31990–19992000–2009
2010–20192020–2029
NAFTA OtherAmericas

IHS Quarterly | Q4-2014 | 23
improved north-south transportation infrastructure between the US and Mexico was a contributing factor as well.
Mexico’s diligent observance of the principles of the 1992 North American Free Trade Agreement (NAFTA) and its adherence to international standards of intellectual property rights have also been factors. And as China’s middle class grows, wage inflation in its manufacturing sector is outpacing that of many competing emerging markets, including Mexico.
China can no longer boast the same cost advantages that allowed it to become a dominant player in global manufacturing. Not only are labor costs rising, but there is growing concern about broader macroeconomic and political risks, such as civil instability, shadow banking, a real estate bubble, and military adventurism. These factors have ignited a reassessment by Western companies of their reliance on China.
This concern is helping to drive growth in Vietnam, China’s southern neighbor. The country has been a member of the WTO since 2007 and its manufacturing wages are roughly half those paid in China. These advantages have triggered a recent surge in manufacturing foreign direct investment and led to a tenfold increase in the value of Vietnam’s merchandise exports since 2000, with shipments in 2014 expected to hit $150 billion.
The African continent, and especially the sub-Saharan region, has been another surprise winner as demographics shift. Improving social and economic fundamentals in many African nations have placed the continent on many multinationals’ radar screens. IHS forecasts that between 2013 and 2017, sub-Saharan
African economies are likely to outpace every major regional economic bloc except China in real GDP growth and projects that the region will lead the world in population growth.
All the social metrics are pointing in the right direction for Africa. Improving health outcomes and strengthening civil society are responsible for an improving development picture. HIV infections and infant mortality rates are falling, while life expectancies and enrollment rates for primary school all the way through college are on the rise. From the late 1980s to the early 1990s, few African nations were considered a democracy; today, the vast majority of the 55 African states enjoy some form of multi-party democracy.
The long arc of changing global production and consumption patterns should have generally positive implications for global supply chains. On the consumption side of the equation, a more regionally balanced demand for goods around the world reduces dependence on any one market and lowers overall supply chain risk. Likewise, on the production side, the emergence of viable regional manufacturing centers—in Asia, the Americas, Africa, and elsewhere—will distribute and perhaps minimize the risks for downstream manufacturers, distributors, suppliers, and other members of the global supply chain.
Chris G. Christopher, Jr. is director of US Macroeconomics and Global Consumer Markets, IHS Economics, and David Deull is a US economist, IHS Economics
bit.ly/ChrisChristopher
bit.ly/DavidDeull
For more information, visit ihs.com/Q14SupplyChain
Millions of urban dwellers
China leads the world in urban population…
0
200
400
600
800
2000 20202005 2010 2015
China
India
US
EU4*
Source: IHS*France, Germany, Italy, and UK
Percent of population that are urban dwellers
But the US and Europe lead in urban density
0%
20%
40%
60%
80%
100%
2000 20202005 2010 2015
China
India
US
EU4*
Source: IHS*France, Germany, Italy, and UK

24 | IHS Quarterly | Q4-2014
M ore people are giving thought to where their food comes from, and
there is perhaps no better example than seafood. With the power of global logistics, it is possible to enjoy fresh lobster, fish, shrimp, and other delicacies of the deep in a restaurant thousands of miles from the nearest coast. However, eco-conscious consumers increasingly want to know where their food originated and whether it was harvested in an environmentally sustainable fashion.
While seafood is a luxury for some, more than one billion people around the world rely on the oceans for their daily nutritional intake. Worldwide, an average of 17 kilograms (kg) of seafood is consumed per person annually, according to the United Nations
Food and Agriculture Organization (FAO), making marine wild-capture fisheries one of the most important human food and protein sources. FAO’s charter includes improving global maritime and environmental conditions.
However, these resources are being depleted rapidly due to poor management and overfishing. Globally, more than 30% of fishery catches are illegal, unreported, and unregulated (IUU). Black-market IUU activities undermine the economic and environmental sustainability of global fisheries and fish stocks and impact all countries.
Shining the light of transparencyA global e©ort is now under way to increase the transparency of the global fishing fleet to
reduce the environmental and economic impacts of IUU fishing activities. The primary focus is on establishing a global record of fishing, which would require a permanent unique vessel identifier (UVI) scheme like the 27-year-old United Nations International Maritime Organization (IMO) ship identification system that tracks the world’s large merchant vessels.
Under the IMO system, all seagoing merchant vessels of 100 gross tons or more, including container ships, tankers, bulk carriers, and cruise liners, are assigned and must display a seven-digit number throughout their service life, from the construction berth to the breaker’s yard. The number remains assigned to that vessel through changes in ownership, name, and flag state. Vessels identified in this
Reeling in
illegal fishing It is estimated that one-third of all fish caught on the high seas is done illegally.
Unregulated vessels that do not report their catches are a major contributor to
the depletion of fish stocks the world over—to the point that some species may
never recover. Global action to combat the crisis is now focusing on the
establishment of an identification scheme for fishing vessels.
By Alex Gray

IHS Quarterly | Q4-2014 | 25
Sh
uttersto
ck
manner can be tracked and monitored at sea and in port for regulatory and security oversight.
Originally established and maintained by Lloyd’s Register, the number issuance scheme is now administered for the IMO by IHS Maritime & Trade. It has been accepted as the best available global identification system because each number is connected with data about the vessel and managed by an independent third party that is held responsible for continually updating and verifying data against multiple sources.
Prior to 2014, fishing vessels were exempt from the requirement to be issued an IMO number. In 2013, the IMO General Assembly removed the exemption for fishing vessels of 100 gross tons or greater, e©ective in 2014. This means that IMO member states, regional fisheries management organizations (RFMOs), coastal states, and flag states could require an IMO number on fishing vessels in this class. This is the first step in establishing the IMO number as the fundamental building block for transparency of the international fishing fleet.
Top 20 fishing fleets of vessels 100 gross tons and larger by flag as of January 2014
Half the world's large fishing vessels are registered in four countries: US, Russia, South Korea, and Japan
0 700 1,400 2,100 2,800 3,500
AustraliaChile
MexicoIndonesia
FranceCanada
ArgentinaUnited Kingdom
PeruHondurasMoroccoNorway
PhilippinesChina
Chinese TaipeiSpainJapan
South KoreaRussia
United States
Source: IHS
Gross tonnage (total)No. of vessels
421,8991,390,187
698,266
248,426286,685
282,132286,127
147,941364,901142,420102,840133,560139,332162,525104,589111,75975,960
168,75149,792
82,036
Top 20 fishing fleets of vessels 1,000 gross tons and larger by ownership nation as of January 2014
Russia accounts for one-fifth of the world's super-sized fishing vessels
0 100 200 300 400
PhilippinesUkraine
PortugalGhana
CanadaDenmark
South AfricaChina
New ZealandFrance
NetherlandsUnited Kingdom
MexicoChile
United StatesSouth Korea
IcelandNorway
SpainRussia
Source: IHS
Gross tonnage (total)No. of vessels
158,290210,362
957,406
110,983109,996
105,93649,554
57,11733,132
111,82242,95239,72373,84647,41240,55426,50820,994
42,79114,522
21,113

26 | IHS Quarterly | Q4-2014
But there is a long way to go. To date, about 22,000 fishing vessels of 100 tons or more have voluntarily acquired an IMO number. Industry estimates suggest there could be as many as 185,000 fishing vessels of that size and possibly three times as many smaller vessels. IHS plans to help boost the database capture of vessels by linking electronic data exchanges among parties that have their own localized fishing vessel databases, such as tuna RFMOs.
The current lack of a universal IMO numbering scheme for the fishing industry means that the operator of a large, ocean-going fishing vessel can easily alter its identity by filing basic paperwork to change its name, radio call sign, and/or registration with another flag state. This makes it di¡cult, if not impossible, for regulators and law enforcement bodies to monitor fishing catches, vessel movements, fishing rights acquisitions, and other activities for thousands of vessels, especially those whose operators do not wish to be tracked.
Without the transparency and accountability bestowed by an IMO number, fishing vessels are free to engage in a wide range of illegal activities, from direct illegal fishing to associated document fraud, tax evasion and money laundering, tra¡cking of people, human rights abuses, and illegal working arrangements for crew members.
The absence of a unique identity for fishing vessels has been cited as a major reason that port o¡cials have failed to maintain oversight against illegal fishing operators. Research by the Pew Charitable Trusts found that RFMOs were unable to maintain consistent and accurate records in fishing areas under their purview. Investigators found instances of the same vessel
listed under multiple flag states with di©erent names, tonnages, and other specifications and the same radio call sign assigned to many vessels. In other cases, vessels that were reported as sunk were still authorized to fish.
Global fishing stocks under pressureWhile fishing has been an important source of food for millennia, only since the advent of onboard refrigeration and large factory ships has it had a globally
destructive impact. Today, fishing vessels can deploy lines up to 60 kilometers (km) long, at depths of more than 2,000 meters, according to the Global Ocean Commission Report 2014. Trawlers track fish by sonar, which can cause extensive damage to coral and other fragile habitats, and capture tons of vulnerable deep-sea species for which there is no commercial market.
Fishing fleets have become larger and more advanced, due in part to more than $30 billion in government subsidies, according to the report. The e¡ciency of these factory fleets has launched a cycle of diminishing returns with larger and more expensive vessels chasing smaller and smaller catches. The Commission estimates the size of the world’s fleet is two-and-a-half times larger than necessary to sustainably catch fish stocks.
According to the FAO, the amount of wild-caught marine fish increased from 3 million metric tons in 1900 to 16.8 million in 1950, reaching a peak of 86.4 million metric tons in 1996. For the past two decades, the catch has remained fairly constant at about 80 million metric tons annually—with the result that 87% of the world’s marine stocks are now fully exploited, over exploited, or depleted. Stocks of some of the largest fish, including tuna and swordfish, are more than 90% below their
Fishing-related vessels with IMO numbers in the 'live' fleet as of January 2014, by category
A good start: About 12% of the world's fishing vessels have acquired IMO numbers
Source: IHS
Fishing vessel 12,965Stern trawler 4,712Trawler 3,064Fish carrier 531Factory stern trawler 433Fisheries research vessel 229Live fish carrier (well boat) 186Fisheries patrol vessel 173
x
Fish factory 54Fisheries support vessel 18Fish farm support 17Whale catcher 6Seal catcher 6Pearl shells carrier 3Kelp dredger 1
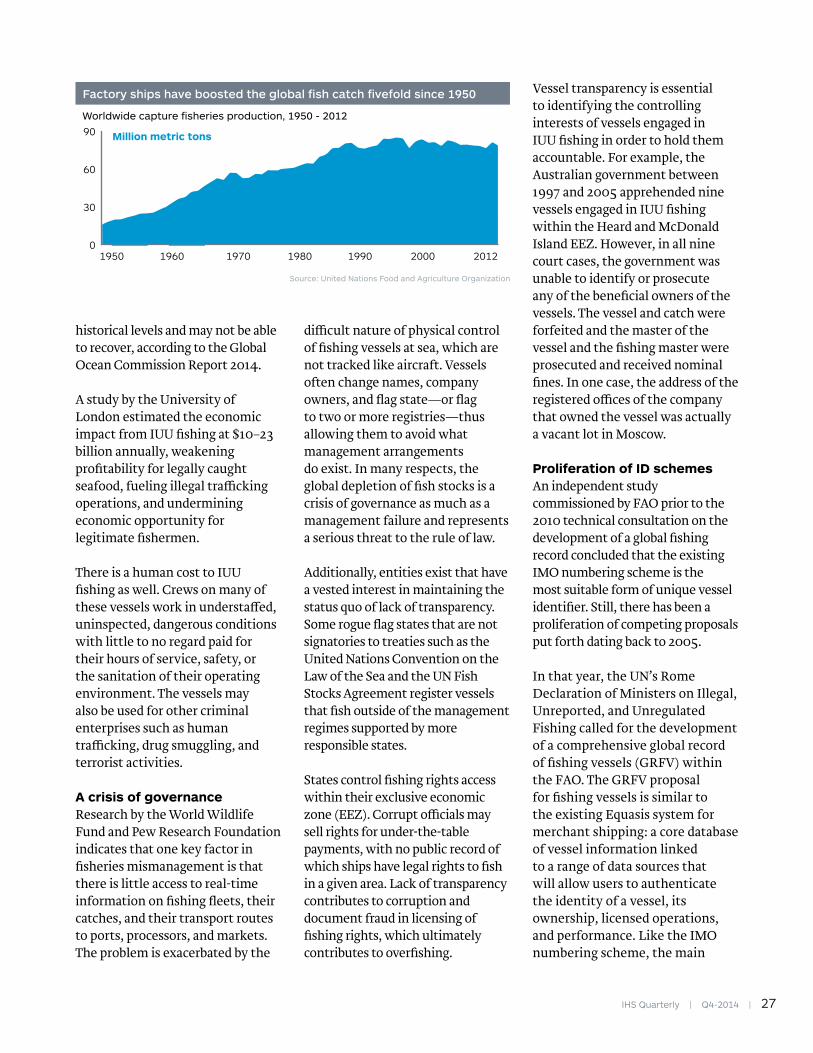
IHS Quarterly | Q4-2014 | 27
historical levels and may not be able to recover, according to the Global Ocean Commission Report 2014.
A study by the University of London estimated the economic impact from IUU fishing at $10–23 billion annually, weakening profitability for legally caught seafood, fueling illegal tra¡cking operations, and undermining economic opportunity for legitimate fishermen.
There is a human cost to IUU fishing as well. Crews on many of these vessels work in understa©ed, uninspected, dangerous conditions with little to no regard paid for their hours of service, safety, or the sanitation of their operating environment. The vessels may also be used for other criminal enterprises such as human tra¡cking, drug smuggling, and terrorist activities.
A crisis of governanceResearch by the World Wildlife Fund and Pew Research Foundation indicates that one key factor in fisheries mismanagement is that there is little access to real-time information on fishing fleets, their catches, and their transport routes to ports, processors, and markets. The problem is exacerbated by the
di¡cult nature of physical control of fishing vessels at sea, which are not tracked like aircraft. Vessels often change names, company owners, and flag state—or flag to two or more registries—thus allowing them to avoid what management arrangements do exist. In many respects, the global depletion of fish stocks is a crisis of governance as much as a management failure and represents a serious threat to the rule of law.
Additionally, entities exist that have a vested interest in maintaining the status quo of lack of transparency. Some rogue flag states that are not signatories to treaties such as the United Nations Convention on the Law of the Sea and the UN Fish Stocks Agreement register vessels that fish outside of the management regimes supported by more responsible states.
States control fishing rights access within their exclusive economic zone (EEZ). Corrupt o¡cials may sell rights for under-the-table payments, with no public record of which ships have legal rights to fish in a given area. Lack of transparency contributes to corruption and document fraud in licensing of fishing rights, which ultimately contributes to overfishing.
Vessel transparency is essential to identifying the controlling interests of vessels engaged in IUU fishing in order to hold them accountable. For example, the Australian government between 1997 and 2005 apprehended nine vessels engaged in IUU fishing within the Heard and McDonald Island EEZ. However, in all nine court cases, the government was unable to identify or prosecute any of the beneficial owners of the vessels. The vessel and catch were forfeited and the master of the vessel and the fishing master were prosecuted and received nominal fines. In one case, the address of the registered o¡ces of the company that owned the vessel was actually a vacant lot in Moscow.
Proliferation of ID schemesAn independent study commissioned by FAO prior to the 2010 technical consultation on the development of a global fishing record concluded that the existing IMO numbering scheme is the most suitable form of unique vessel identifier. Still, there has been a proliferation of competing proposals put forth dating back to 2005.
In that year, the UN’s Rome Declaration of Ministers on Illegal, Unreported, and Unregulated Fishing called for the development of a comprehensive global record of fishing vessels (GRFV) within the FAO. The GRFV proposal for fishing vessels is similar to the existing Equasis system for merchant shipping: a core database of vessel information linked to a range of data sources that will allow users to authenticate the identity of a vessel, its ownership, licensed operations, and performance. Like the IMO numbering scheme, the main
Worldwide capture fisheries production, 1950 - 2012
Factory ships have boosted the global fish catch fivefold since 1950
Source: United Nations Food and Agriculture Organization
Million metric tons
0
30
60
90
2012200019901980197019601950
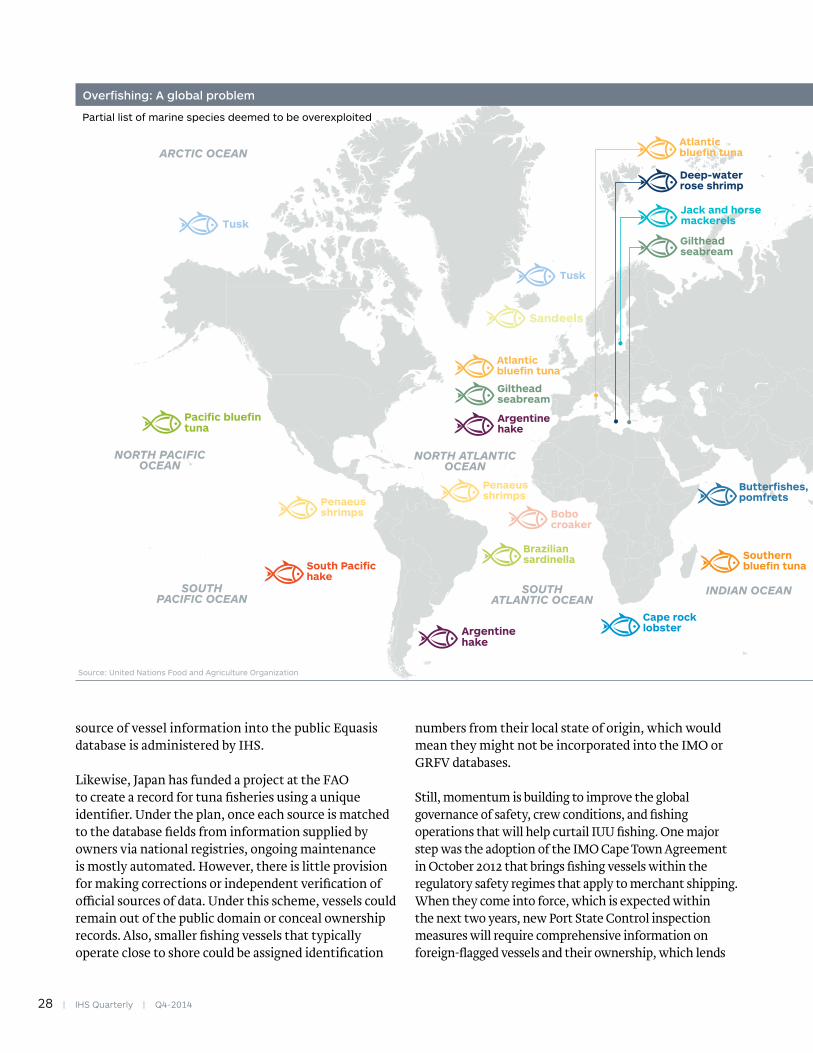
28 | IHS Quarterly | Q4-2014
Deep-water rose shrimp
Partial list of marine species deemed to be overexploited
Overfishing: A global problem
Source: United Nations Food and Agriculture Organization
Tusk
Gilthead seabream
Butterfishes, pomfrets
Bobo croaker
Brazilian sardinella
Pacific bluefin tuna
Southern bluefin tuna
Sandeels
Cape rock lobster
Jack and horse mackerels
Penaeus shrimps
South Pacific hake
Argentine hake
Southern bluefin tuna
Atlantic bluefin tuna
Tusk
Argentine hake
Penaeus shrimps
Pacific bluefin tuna
Gilthead seabream
Atlantic bluefin tuna
NORTH PACIFIC OCEAN
SOUTHPACIFIC OCEAN
SOUTHATLANTIC OCEAN
INDIAN OCEAN
NORTH ATLANTICOCEAN
ARCTIC OCEAN
Jack and horse mackerels
source of vessel information into the public Equasis database is administered by IHS.
Likewise, Japan has funded a project at the FAO to create a record for tuna fisheries using a unique identifier. Under the plan, once each source is matched to the database fields from information supplied by owners via national registries, ongoing maintenance is mostly automated. However, there is little provision for making corrections or independent verification of o¡cial sources of data. Under this scheme, vessels could remain out of the public domain or conceal ownership records. Also, smaller fishing vessels that typically operate close to shore could be assigned identification
numbers from their local state of origin, which would mean they might not be incorporated into the IMO or GRFV databases.
Still, momentum is building to improve the global governance of safety, crew conditions, and fishing operations that will help curtail IUU fishing. One major step was the adoption of the IMO Cape Town Agreement in October 2012 that brings fishing vessels within the regulatory safety regimes that apply to merchant shipping. When they come into force, which is expected within the next two years, new Port State Control inspection measures will require comprehensive information on foreign-flagged vessels and their ownership, which lends

IHS Quarterly | Q4-2014 | 29
states can mandate the use of IMO numbers within their systems and certification, which would apply to high-seas vessels.
Additionally, in June US President Barack Obama signed a presidential memorandum, “Comprehensive Framework to Combat Illegal, Unreported, and Unregulated Fishing and Seafood Fraud,” to unify US e©orts against IUU fishing. While the memo doesn’t specifically support a unique vessel identification scheme, it does state that US policy is to strengthen
coordination and implementation of relevant existing statutes to improve the transparency and traceability of the seafood supply chain. This may include the allocation of IMO numbers to vessels in their local domain.
Building a consensusIn addition to curtailing IUU fishing and other illegal activities, adoption of the IMO number scheme for fishing vessels o©ers an array of benefits for consumers and the industry. Currently, when vessel information is received through the supply chain, it is usually vessel name, flag, and fishing gear type. The use of IMO numbers will standardize and channel the information transmitted through the supply chain.
The push for traceability has already started with governments,
NGOs, and retailers. For example, the International Seafood Sustainability Foundation requires members to purchase seafood only from vessels that have IMO numbers. Major retailers can use IMO numbers within their supply chains to track the origin of seafood from the ocean to the grocery shelf. This information could be used on produce eco-labels as part of a vetting process to confirm that a vessel was fishing legally in a certain geographic area on the date presented on catch certificates.
Although barriers remain to the adoption of IMO numbers as the de facto identification scheme for high-seas fishing vessels, there is a growing industry consensus pushing for its adoption. Using an existing, proven system would encourage coordination among various regulatory schemes and reduce the amount of time required to implement the system worldwide. Through concerted action, IUU fishing can be curbed, with the goal of ending one of the main forces behind the decline of the oceans and the life within.
Alex Gray is senior product manager, IHS Maritime & Trade
bit.ly/AlexGray
For more information, visit ihs.com/Q14Fishing
The global depletion of fish stocks is a crisis of governance as much as a management failure and represents a serious threat to the rule of law.
Deep-water rose shrimp
Partial list of marine species deemed to be overexploited
Overfishing: A global problem
Source: United Nations Food and Agriculture Organization
Tusk
Gilthead seabream
Butterfishes, pomfrets
Bobo croaker
Brazilian sardinella
Pacific bluefin tuna
Southern bluefin tuna
Sandeels
Cape rock lobster
Jack and horse mackerels
Penaeus shrimps
South Pacific hake
Argentine hake
Southern bluefin tuna
Atlantic bluefin tuna
Tusk
Argentine hake
Penaeus shrimps
Pacific bluefin tuna
Gilthead seabream
Atlantic bluefin tuna
NORTH PACIFIC OCEAN
SOUTHPACIFIC OCEAN
SOUTHATLANTIC OCEAN
INDIAN OCEAN
NORTH ATLANTICOCEAN
ARCTIC OCEAN
Jack and horse mackerels
itself to the expansion of IMO numbering schemes.
Other soon-to-be enacted FAO provisions require foreign fishing vessels visiting international ports to provide advance notice and request permission for port entry. And ports now have the authority to conduct regular inspections with the intention of preventing illegally caught fish from entering international markets. Also, RFMOs and individual member

30 | IHS Quarterly | Q4-2014
A new manufacturing
blueprint?3D printing, or additive manufacturing, has already made inroads in a number of
industries, from aerospace to automotive, consumer electronics, and medicine, enabling
the creation of highly complex shapes and unprecedented customization. As printer costs
fall and new competitors emerge, “traditional” industrial production models and their
supply chains will be threatened.
Sh
utt
erst
ock
By Alex Chausovsky

IHS Quarterly | Q4-2014 | 31
F or the better part of 500 years after Johannes Gutenberg’s invention of the movable-type printing press—a transformative development
that played a key role in the spread of the Renaissance, Reformation, Age of Enlightenment, and the Scientific Revolution—information was consumed largely via the printed page. To that end, forests were felled and transported to mills where they were cut and ground into pulp to make the paper upon which ink would be stamped en masse via printers—the resulting books and newspapers distributed to readers by hand or vehicle. While a marvel of mass production and scale, it wasn’t necessarily the most labor- or energy-e¡cient method of information delivery.
Then came the digital age. Knowledge transfer was suddenly “democratized” further by the ability of anyone with online connectivity to consume information—digitized, customized, and delivered instantly—for free. No need for paper, news carriers, or a subscription. Moreover, everyone suddenly gained the ability to become his or her own publisher. Traditional business models in the newspaper, print, and related industries were quickly under assault as consumers flocked to the new technology. How could print publishers adapt and monetize their work in a world with new competitors and in which information was essentially given away? Two decades on, many of those that have managed to survive are still trying to figure that out.
Product manufacturers and their vast supply chains may soon be faced with a similar conundrum as yet another disruptive technology gains momentum. The technology—a completely di©erent kind of printing to Gutenberg’s, 3D printing—is on the verge of transforming the way many products are designed, manufactured, and distributed. 3D printing, an additive manufacturing method for creating physical objects from three-dimensional digital models, has the potential to drastically alter the costly processes associated with industrial production, including tooling, machining, welding, and assembly. Unless product manufacturers and the shippers, materials suppliers, distributors, and others who service them adapt their operations to this emerging technology, they may not survive.
Addition vs. subtractionTraditional manufacturing methods typically involve subtractive processes. A block of metal, plastic, wood, or other material is whittled to the desired shape and size via machining, boring, grinding, and cutting. (As Michelangelo once said, “Every block of stone has a statue inside it and it is the task of the sculptor to discover it.”) Constituent parts are then variously joined, welded, and assembled to create a finished product. These processes, whose seamless execution virtually defines the industrial revolution, nonetheless result in considerable waste of materials, time, and energy. Moreover, there are limits to the complexity of the shapes and forms that can be created.

32 | IHS Quarterly | Q4-2014
By contrast, 3D printing is an additive manufacturing process in which a physical object is created from a three-dimensional digital model by laying down many successive thin layers of a material. The earliest form of this process—stereolithography—was developed and patented in the 1980s by Charles Hull, who used a computer-controlled moving laser to trace a cross-section of a part’s pattern onto the surface of a liquid resin, which hardened on contact with the laser to form one layer of the part. After each such “pattern” was traced, the platform upon which the part was being built was lowered and new layers added in the same fashion until the part was completed.
The thickness of each layer depends on the intricacy of the design and may be as fine as one-thousandth of an inch. That hints at both an advantage and a disadvantage of additive manufacturing. While it can be used to produce complex designs—far more so than traditional forming methods such as casting, forging, and machine tooling—the production time is markedly slower than that of standard manufacturing methods.
For this reason, the use of additive manufacturing to date has been predominantly for rapid prototyping (RP). Using 3D printing for RP permits manufacturers to generate a prototype quickly and cheaply to examine an object’s design, test against other parts for fit, uncover any flaws, and determine final specifications before committing to production. Traditional prototyping, involving the use of machine tooling or injection molds to create a model, takes considerably more time and expense.
The Ford Motor Company, for example, currently has five 3D prototyping centers, three in the US and two in Europe. These RP centers produce hundreds of 3D-printed parts per day from materials such as silica, nylon, sand, aluminum, stainless steel, and titanium. An example of a prototype Ford part produced via 3D printing is the intake manifold, one of the most complicated parts of an engine. Using traditional production processes, creating the part can take up to four months and cost up to half a million dollars. However, using 3D printing technology, Ford engineers can produce a prototype within four days at a cost as low as $3,000.
Dawning of the 3D printing revolutionIn recent years, 3D printing has expanded beyond rapid prototyping. In part, this has been due to the expiration of patents covering a method of printing known as fused deposition modeling (FDM), which uses a computer numerical controlled (CNC) nozzle to extrude a thin filament of melted thermoplastic layer by layer to form an object.
After patents covering this technology expired in 2009, the sector grew rapidly as a result of open-source platforms. There are now dozens of manufacturers o©ering hundreds of di©erent FDM machines to consumers. Moreover, the price of these machines has dropped from more than $10,000 per printer to less than $1,000, fueling the development of a consumer market for those who wish to create their own 3D-printed objects at home.
In January 2014, key patents on the 3D printing process
Forecast unit sales of metal and plastics machinery tools, 2014 - 2018
Demand for machine tools and plastics machinery is rising but may be impacted by 3D printing
Source: IHS
0
400,000
800,000
1,200,000
1,600,000
2,000,000
20182017201620152014
Plastic machineryMetal forming machinesMetal cutting machines
Source: IHS
Forecast of additive manufacturing sales in 2014 by sector (%)
Consumer products/electronics is the largest manufacturing segment for 3D printing
Consumer products/electronics 21
Industrial 19
Automotive 16
Aerospace 14
Medical and dental 12
Military and defense 8
Academia 7
Architecture 2
Other 1

IHS Quarterly | Q4-2014 | 33
known as selective laser sintering (SLS) expired (and others are slated to expire later this year). SLS is a technology that uses powerful lasers to melt powders—typically metal, but also plastic, glass, and ceramics—and produce high-quality parts from industrial-grade materials. In recent months, several companies have announced that they are working to develop lower-cost SLS-based 3D printers, mainly for printing in metal. These printers are targeting price points in the tens of thousands of dollars—an order of magnitude lower than current SLS printers, which range in cost from a few hundred thousand dollars to in excess of $1 million.
Industry observers generally believe it is unlikely that SLS printers will experience price declines similar to those of FDM machines, as it is significantly more di¡cult to build an SLS machine that uses lasers and powders than it is to construct an FDM printer that uses heating elements and spools of plastic wire. However, with more people becoming involved with SLS technology, the price to own an SLS printer is likely to drop measurably—a key factor for the 90% of manufacturers worldwide that are small- to medium-sized enterprises (i.e., employ fewer than 500 workers).
Further helping to usher 3D printing technology into the manufacturing mainstream are improvements in printers’ speed and throughput—to date the technology’s Achilles heel. Last year, 3D Systems, a manufacturer of both stereolithography and SLS printers, announced that it had partnered with Google on a research and development project to create modular mobile phones
at mass production-level speeds and volumes.
The company’s methodology substitutes the “reciprocating platform” of many 3D printers—in which the base upon which the object is being formed is static for each print run, slowing printing speeds—with a continuous-motion system designed to achieve print speeds 50 times faster than those of current 3D printers. If this process is realized commercially, 3D printing will have been demonstrated to be able to create parts in production volumes approaching those of traditional manufacturing methods.
Dismantled supply chains?In any case, 3D printing is already impacting manufacturing in a profound way by lowering the
barriers to entry for upstart companies. Optimizing for lower-volume production reduces the cost and risk to manufacture products for lesser-capitalized companies, as they are freed from having to produce tens or hundreds of thousands of units to recover fixed costs. Products can moreover be printed without tooling, retooling, and with little or no assembly, further reducing costs.
3D printing also has the potential to change or eliminate whole steps in the supply chain. If a manufacturer or consumer can print his own part or product, the assembly, warehousing, and distribution/retail functions can be bypassed. From a global standpoint, on-demand printing potentially renders unnecessary many manufacturers’ outsourcing
2010
As 3D printing expands into new materials, its applications will multiply
Source: IHS
Industrial manufacturing
Wide adoption by consumersand businesses
1987 2000 2020 2025 �
Biomaterials
Moldable polymersHuman cells and tissuesSynthetic tissues
Invention of technology and development of first hardware prototype
Integration of 3D printing technology with traditional manufacturing processes,materials, and software
Incorporation of 3D printing technology into everyday life, both personal and business
Metals and other industrial materials
Titanium, stainless steel, nickel and cobalt chrome alloysAluminum, gold, Inconel, epoxy resins, ceramics, Sand, carbon fiber (new)
Plastics
ABS, nylon, PLA, HIPSPolycarbonatesGlass-filled polyamidePhotopolymers and wax
Rapid prototyping
Medical andbiotechnologyapplications

34 | IHS Quarterly | Q4-2014
of operations to regions that o©er low labor and assembly costs.
The potential e©ect on global trade and shipping is obvious. While shipment of finished goods and products from lower-cost manufacturing hubs is likely to be reduced, hauling of raw materials from low-cost production areas is likely to increase—the importance of container ships replaced by bulk cargo carriers. Taken to its logical extension, ships themselves could become mobile “factories”—picking up raw materials and assembling finished parts and products from them via the use of 3D printers during ocean passage. In fact, on-board 3D printing is currently being explored by shipping giant Maersk as well as the US Navy. Although their e©orts are currently focusing on the production of replacement parts for the ships themselves, it is certainly feasible that once the technology is proven, other applications will follow.
The automotive aftermarket represents another supply chain potentially threatened by 3D printing. Rather than order replacement parts from OEMs and other suppliers, auto shops could instead print them on-site. Similarly, 3D printing may now equip them to repair or replace obsolete parts—either by locating the relevant digital design or scanning the broken/obsolete part itself, digitally repairing it, and printing it anew.
A hybrid view of the future As an emerging technology, the entirety of 3D printing’s implications across the manufacturing sector is as yet di¡cult to foresee with any certainty—particularly as new market entrants and business models materialize and companies experiment with incorporating 3D printing into their existing operations.
An example of the latter is the development of a hybrid process that combines an (additive) 3D printer with a traditional (subtractive) CNC machine. Pioneered by Hybrid Manufacturing Technologies, the technology allows the user to integrate the complexity of structure a©orded by 3D printing with the speed and polished finish achievable via CNC machining. The machine has particular suitability for the repair of worn parts—jet turbine blades have been successfully restored in this way—but can also be used in the fabrication of new components or the addition of features and functionality to existing parts.
Japanese machine tool manufacturer DMG MORI is also
Machine builders continue to push the limits of conventional design to address the size limitations of current additive manufacturing technology. An example of this trend comes from Sciaky, a US-based welding solutions specialist serving the aerospace, defense, automotive, and health care industries. Sciaky’s VX-110 Electron Beam Additive Manufacturing (EBAM) system is one of the largest 3D printers in the world.
With a build envelope that can reach up to 19’ x 4’ x 4’, the system allows manufacturers to produce very large parts and structures that, due to size limitations, cannot be made by most industrial-grade metal 3D printing systems available on the market today. Starting with a 3D model from a computer-aided design (CAD) program, Sciaky’s articulated, moving electron beam welding gun deposits materials such as titanium, tantalum, stainless steel, and Inconel via wire feedstock, layer by layer, until the part reaches near net shape. Deposition rates of Sciaky’s EBAM process range from 7 to 20 lbs. per hour, depending on part geometry and material selected, and some post-production machining is required.
This machine will have major implications for the metal forging industry. The two biggest issues with forging, which undoubtedly creates very high-quality metal products, are its long lead times and high costs. Metal additive manufacturing solutions, both laser and electron beam based, address both issues. Lead times are lowered dramatically compared with forging, often from months to days and even hours, while production costs are lessened significantly due to the decrease in material consumption and the elimination of transport from the forging site to the final destination. The combination of these factors and recent developments in the field of metal 3D printing, such as SLS patent expirations, which are expected to drive down the cost of metal 3D printers in the coming years, are aligning in ways that may eliminate the need for forging entirely in the not-so-distant future.
The demise of forging?

IHS Quarterly | Q4-2014 | 35
introducing a similar solution. The company launched its LASERTEC 65 3D machine for the first time in the US in September. The machine is equipped with a powerful diode laser for metal deposition, while the five-axis machining platform enables highly accurate subtractive operations to be carried out. The metal deposition process, which is performed via a powder nozzle, is up to 10 times faster than laser sintering in a powder bed, and all common metal powders can be processed, including steel, nickel and cobalt alloys, brass, and titanium.
Another recent development, which could overcome one of 3D printing’s limitations, is NASA’s invention of a technique to allow the printing of multiple metals or alloys within a single object. The process involves the deposition of layers of metal on a rotating rod, transitioning metals from the inside out rather than adding layers from bottom to top as in traditional 3D printing. The technique allows for the continuous changing of the composition of the alloys so that the finished object incorporates di©erent materials but has no welds, providing superior strength and endurance for harsh environments such as those found in space.
NASA used a multi-alloy printer to manufacture a telescope mirror mount in which the use of di©erent alloys will help minimize the opportunity for thermal expansion and the development of structural cracks in the cold environment of space. The agency said it will consider using the technique in the fabrication of its spacecraft, which cannot be repaired once deployed, for future interplanetary missions. The technique has obvious applications in the automotive and
commercial aerospace markets, where operation in high-stress environments makes the avoidance of welds, bonding, and other joining methods a priority where possible.
Winners and losersAs 3D printing is more than just a manufacturing process—it is a digital technology as well—its proliferation raises intellectual property (IP) and other regulatory concerns. With just a 3D printer and scanner, a consumer can purchase a product, recreate a design and distribute it via the internet, or manufacture and sell it, dealing a potentially crippling blow to the original manufacturer’s sales and its return on initial investment. Likewise, a 3D printer could be used to manufacture and distribute a gun or other regulated weapon.
The IP issue echoes one the recording industry faced after the advent of digital music files generated a huge increase in the trade of copyrighted songs and a decrease in legal music purchases.
Will manufacturers follow the path of the recording industry and sue customers for copyright infringement? Certainly, aggressive enforcement of patent and trademark laws will be carried out. But ultimately the survivors, and winners, in this emerging manufacturing environment are likely to be those companies that embrace the new technology, experiment
with it, and alter their business models to best capitalize on it.
While the specific impact of 3D printing on “traditional” manufacturing is not yet known, some things are certain: additive manufacturing is here to stay, its technology will continue to improve, its role will expand, and new market entrants will devise ways to monetize it.
3D printers will never replace the factory floor. But they are likely to change its look and operation. Tools such as hybrid CNC/3D printers and multi-material 3D printers look certain to take their place beside such standard manufacturing devices as milling, grinding, and plastic injection
molding machines to save energy, time, materials, and labor and increase part/product strength, customization, and design complexity. Companies that view 3D printing only as a threat to their traditional business model, and not an opportunity, may not survive the impact of this most disruptive technology.
Alex Chausovsky is senior principal analyst, industrial automation, IHS Technology
bit.ly/AlexChausovsky
For more information, visit ihs.com/Q14Printing3D
Optimized for low-volume production, 3D printing reduces risk for startup companies, freeing them from producing thousands of units to recover fixed costs.

36 | IHS Quarterly | Q4-2014
Shifting borders, boundaries,
and sovereignty From Western Europe to the Western Pacific, state and non-
state actors alike—via referendum, provocation, and violence—
are challenging existing land and maritime borders. Resource
competition, weapons proliferation, and new media are among
the drivers of these challenges to the concept of nation-state
sovereignty. What are the implications for the defense, security,
and business communities?
By Tate Nurkin
Sh
utt
erst
ock
New dimensions, new maps

IHS Quarterly | Q4-2014 | 37
“It is not down on any map. True places never are.”—Herman Melville, Moby Dick
A cursory review of the daily news reveals a world in which borders are in
flux and control of territory is increasingly contested both within and between sovereign entities.
Crimea has been incorporated into Russia, and Ukraine is fighting to keep whole.
Iraq is devolving into a state in three parts, and the new “Islamic State” stretches—at least for now—across the borders of Syria and northern Iraq, while the Iraqi Kurdish regional government pushes forward with independent energy exports through Turkey and discussion of a referendum on independence.
Scotland’s unsuccessful referendum for separation from the United Kingdom undermined immediate prospects of independence for Edinburgh, but the closeness of the vote—55% no, 45% yes—will further devolve power from Westminster and change the relationship between Scotland and the UK.
The Spanish government has vowed to use the “full force of the law” to block November’s scheduled Catalonia independence referendum, but either the vote or early regional elections could intensify separatist sentiment not just in Catalonia, but also among Spain’s Basque population and plausibly elsewhere in Europe.
In Afghanistan, contested election results, insurgent momentum, and an abundance of not-quite-aligned interests of external actors
have heightened the potential for persistent political unrest. Across the long-lamented Durand Line dividing the Pashtuns of Afghanistan from those in Pakistan, the Pakistani government and military are in the midst of a violent o©ensive to regain control of its North Waziristan province from Tehrik-e-Taliban Pakistan militants.
In East Asia, the possibility for unification or conflict along the tense border on the Korean Peninsula looms over the region, as does intense concern over the near daily incursions of contested air defense zones and maritime borders and boundaries from the South China Sea to the Kuril Islands in northeast Asia.
From Erbil to Edinburgh, Kabul to Khartoum, and from Donetsk to Damascus to the Diaoyus, the dimensions of the international system—the Westphalian concept that nation-states have sovereignty over their territory—are being challenged in stark and destabilizing ways. Challenges within states and contested borders between states ensure that shifting borders and boundaries will play a critical role in driving competition, crisis, and potentially conflict in the 21st century. Emerging de jure and, more importantly, de facto dimensions of the international system have important implications for security, intelligence, and defense communities across the globe as well as for businesses seeking to e©ectively operate and expand in a complex and fluid world.
New states and struggling sovereignsChanging borders and boundaries are not a new phenomenon. Most

38 | IHS Quarterly | Q4-2014
tend to think of maps as inviolate and certain, but the dimensions of the international system have changed dramatically over time and are frequently ill defined. (Question: How many sovereign states are there in the world? Answer: It depends on whom you ask. The United Nations has 193 members. The United States recognizes 194 countries. The International Olympic Committee, an organization with an interest in understanding how communities identify and divide themselves, has 204 members. FIFA, international football’s governing federation, has 209 members.)
The disintegration of pre-World War II empires, gradual redrawing or contestation of colonial boundaries, and formation and collapse of the post-World War II Soviet empire have ensured significant changes to the world’s political geography in the last seven decades. However, current and emerging challenges to modern maps are di©erent. They are not primarily the result of a singular “big bang” in the supra-structure of international geopolitics, such as the end of World War II or the end of the Cold War.
The changing maps of the early 21st century are the result of the interplay of a series of disruptive forces that have gathered momentum in the last two decades.
These include globalization; the prevalence of information technologies and the impact of social media to redefine the meaning of community; weapons and capability proliferation; demographic shifts; environmental degradation and resource competition; crime and corruption; and ethnic, sectarian, religious, and linguistic identity trumping state identity, among others (see sidebar facing page).
These forces are interacting to erode Westphalian concepts of sovereignty and statehood and increasingly separate historical
and cultural “nations” from the political “states” to which they belong. The result is growing disparity—in wealth, values, primary self-identity, culture, opportunity, and access—between countries’ political and economic centers and their peripheries.
As The Guardian commented about the Scottish independence movement on September 5, it is not that the significant risks of independence are not known, but rather that they are not as troubling as enduring “two increasingly intolerable burdens”: a growing disconnect in values between “left-leaning Scots” and the British government and an inability to access and a©ect policy that
reflects their di©ering values. Add in generational shifts in attitudes and the potential for exploitation of North Sea natural resources and it is no surprise the margin was so close.
Connections to external actors seeking to leverage struggling sovereigns for geopolitical gain frequently amplify and complicate these border-shattering dynamics. Russia’s annexation of Crimea and continued destabilization of Ukraine have relied on Russian material support and the creation and furtherance of a narrative that stressed nationalist and historical links among Russia, Crimea, and eastern Ukraine in an e©ort to destabilize Ukraine, challenge the European Union and NATO, and reassert Russian influence in Eastern Europe.
The e©ects of environmental strain and degradation—damaged crops, eroding coastal areas—are increasingly posing uncomfortable questions of sovereign governments seeking to assess and balance the growing possibility and potential burden of climate change-induced mass migrations with humanitarian imperatives. In June 2014, the Immigration and Protection Tribunal of New Zealand granted asylum to a family from the Pacific island of Tuvalu to immigrate to New Zealand due to the threat of rising sea level to their home island. The tribunal’s decision was narrowly interpreted, according to the Washington Post, and is not an endorsement of climate change as a compelling justification on par with political persecution for asylum seekers to come to New Zealand. However, it highlights the di¡cult decisions and sovereign challenges that many governments throughout the world
Enhanced clarity about boundaries can incite rather than dampen tensions, especially when they intersect with new media-fueled nationalisms and resource competition.
IHS Quarterly | Q4-2014 | 39
will face as the combined e©ect of a global population of over seven billion people and the erosion and disappearance of island or coastal land masses drives migration across and within borders.
Today’s challenges to the Westphalian system are also distinguished by their seeming ubiquity. Challenges to government control and political demarcations are no longer restricted to “failed” or “failing” states. They are being felt, and in some places strongly—Ukraine, for example, as well as in Xinjiang, Hong Kong, and Tibet, in China—by Western and modern Asian states thought to be stable and in possession of strong state institutions and identities.
For example, the United States’ struggle to reconcile two competing views—red state versus blue state—of what the republic is, what it represents, and how it should behave has led to a hamstrung and divided polity. American institutions are likely resilient enough to avoid collapse, secession, or internal conflict, but the current political stagnation has a deleterious e©ect on national discourse and federal government e©ectiveness on critical issues, including immigration and the management of a porous border with Mexico. Political divisiveness has also contributed to uncertainty about military force structure and capabilities to project US power and pursue US security interests, all primary functions of an e©ective sovereign.
Ceding influenceAttempts to devolve control or, at the very least, e©ective influence from central sovereigns to more emergent “true places” governed by sub-state—and in some cases, non-state—actors are generating a range of behaviors and shared sovereignty arrangements and calculations on the part of central governments and those that challenge them.
Few more striking or emblematic examples of these increasingly prevalent behaviors exist than Lebanon. In 2006, the Lebanese government remained neutral in a 30-day war fought almost entirely within its territory—a war that killed thousands of Lebanese citizens and displaced hundreds of thousands more. The decision was an acknowledgement of the accommodation the Lebanese government had reached with non-state actor and Iranian- and Syrian-linked Hezbollah.
In order for Lebanon to ensure continuation as a viable place on the map—a viability that is currently
The interaction of globalization and the information revolution is playing an important role in shaping sovereign challenges in the early 21st century in at least three ways.
First, globalization and the information technologies that support and enable it facilitate proliferation of advanced commercial, dual-use, and military technologies, providing more and better capability to a wider range of sub-state and non-state actors. Conflicts across the Middle East and North Africa have been fueled in part by the influx of new weapons through licit and illicit means as well as shadowy connections to external patrons.
Second, the perception that globalization has created winners and losers is amplifying center-periphery tensions within states.
Third, and most important, the information technologies and media that facilitate globalization also allow for enduring cross-border and diaspora connections and the coherence, hardening, and promulgation of ideologies and narratives—be they ethnic nationalist, extremist, nihilist, or something else entirely—that build momentum, credibility, and justification for tests of status quo borders and boundaries.
For example, the Islamic State has engaged in an active, advanced, and e®ective new and social media strategy that was an important element supporting its rapid and unexpected advance across northern Iraq over the summer of 2014. The Islamic State live streamed the execution of Iraqi soldiers in June 2014 as well as its advance through Iraq—which was abetted by the collapse of an Iraqi army fully aware of the fate that awaited those who resisted the Islamic State—demonstrating the futility of resistance to the Iraqi army as well as the glory of victory to potential recruits.
Tate Nurkin
Globalization, the information revolution, and the Islamic State
40 | IHS Quarterly | Q4-2014
threatened by an ongoing political crisis fueled by a highly sectarian political system and spillover of sectarian tensions and violence from the conflict in Syria—its government ceded control of a portion of its territory in southern Lebanon to a non-state actor with its own robust military capability and political and societal traction.
Other more formal acknowledgements of the increasingly delicate balance being struck between central sovereign authority and social and political groups on the periphery of the state are being explored throughout the world. In India, decentralizing pressures have led to the establishment of four new states since 2000, including the formation of India’s 29th state, Telangana—carved out of territory in Andhra Pradesh—in June 2014. The new Telangana state raises several immediate governance questions for both Telangana and Andhra Pradesh, which will share
the state capital of Hyderabad for the next decade. It also raises longer-term questions about the next states that could be created and what additional segmentation of the Indian polity means for the world’s largest democracy.
Autonomy for the Kurdish regional government in Iraq has tested the ability of the Shi’a-led government of Iraq to exercise key instruments of sovereignty, such as exports of strategic resources and control of populations and territory in northern Iraq, especially as Iraqi security forces have retreated in the face of the Islamic State summer o©ensive. Kurdish autonomy has held implications for Iraq since it was first negotiated in 1970, but the growing assertiveness of the Kurdish government in operating increasingly independently of Baghdad could change the nature of the relationship between Iraqi Kurdistan and the Iraqi government once the current political and security crisis abates.
Actions such as the movement of Kurdish forces into Kirkuk and occupation of oil-rich area west of its regional border after the withdrawal of Iraqi security forces are likely to shape a new starting point for post-conflict autonomy negotiations.
Iraqi Kurdistan autonomy also has implications for the Kurds’ neighbors, especially Turkey, which is in the midst of a significant demographic transition that is changing the nature and depth of Turkish government engagement of Kurdish groups both in Turkey and across the region (see sidebar below).
Not all accommodations and shared sovereignty environments are entered into willingly by governments, of course. Indeed, many are resisted quite intensely, though not always e©ectively. The proliferation of military and dual-use items has allowed more actors to a©ect strategic and operational environments and for more robust
Turkey, like much of the rest of the Middle East, is in the midst of significant demographic shifts that are likely to have implications for the country’s societal, economic, and political future and highlight the significance of Kurdish cross-boundary links with Kurdish populations in Iraq, Syria, and Iran (which is itself confronted by historic drops in fertility rates).
According to Turkey’s official statistics organization, TurkStat, the country’s population growth rate reached an all-time low of 1.2% in 2012, while the fertility rate for all of Turkey (2.08) stayed below replacement levels (2.1). However, all 10 provinces with the highest fertility rates in 2012 were in eastern Turkey, where Kurdish populations are
highest, while fertility rates in the rest of the country were significantly below replacement levels.
These trends suggest that by the middle of the 21st century, the Kurdish population in Turkey will grow in both an absolute sense and as a markedly larger proportion of the Turkish society, its workforce, and its pool of military recruits.
Such an important demographic shift is already having—and will continue to have—implications for Turkish policies toward both its Kurdish minority and the large and linked Kurdish populations across Turkey’s borders in Iraq, Syria, and Iran.
Tate Nurkin
Kurdish population growing faster than ethnic Turks
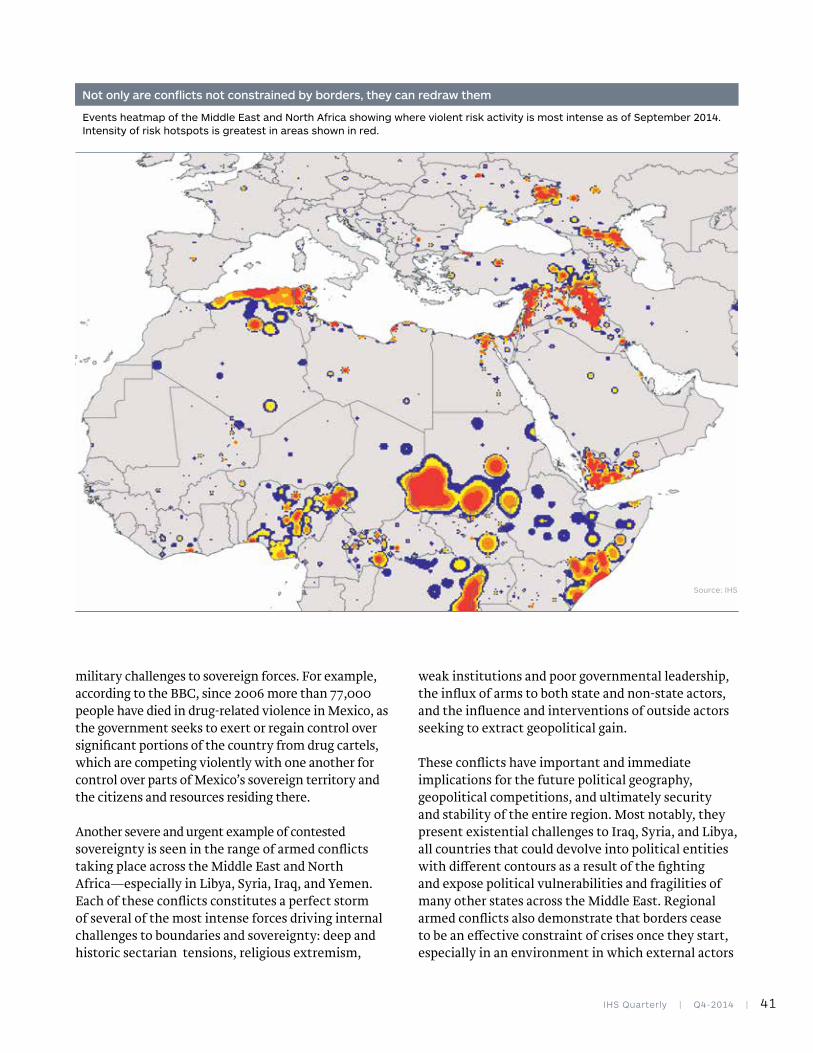
IHS Quarterly | Q4-2014 | 41
military challenges to sovereign forces. For example, according to the BBC, since 2006 more than 77,000 people have died in drug-related violence in Mexico, as the government seeks to exert or regain control over significant portions of the country from drug cartels, which are competing violently with one another for control over parts of Mexico’s sovereign territory and the citizens and resources residing there.
Another severe and urgent example of contested sovereignty is seen in the range of armed conflicts taking place across the Middle East and North Africa—especially in Libya, Syria, Iraq, and Yemen. Each of these conflicts constitutes a perfect storm of several of the most intense forces driving internal challenges to boundaries and sovereignty: deep and historic sectarian tensions, religious extremism,
weak institutions and poor governmental leadership, the influx of arms to both state and non-state actors, and the influence and interventions of outside actors seeking to extract geopolitical gain.
These conflicts have important and immediate implications for the future political geography, geopolitical competitions, and ultimately security and stability of the entire region. Most notably, they present existential challenges to Iraq, Syria, and Libya, all countries that could devolve into political entities with di©erent contours as a result of the fighting and expose political vulnerabilities and fragilities of many other states across the Middle East. Regional armed conflicts also demonstrate that borders cease to be an e©ective constraint of crises once they start, especially in an environment in which external actors
Events heatmap of the Middle East and North Africa showing where violent risk activity is most intense as of September 2014. Intensity of risk hotspots is greatest in areas shown in red.
Not only are conflicts not constrained by borders, they can redraw them
Source: IHS

42 | IHS Quarterly | Q4-2014
are supporting elements challenging state sovereignty and coherence.
These examples are stark but also reflective of the broader challenges that governments throughout the world are facing to their sovereignty, societal stability, and established borders. The new—if uno¡cial—dimensions of the international system will soon demand new maps that acknowledge that the boundaries and borders to which we have grown accustomed may no longer reflect the location of the world’s “true places.”
Contested boundariesErosion of Westphalian concepts of sovereignty resulting from competition within states is not the only way in which borders and boundaries are a©ecting our current geopolitical environment. Competition between states seeking to exercise exclusive control over contested territory is also shaping the future dimensions of the international system and creating anxious environments that lend themselves to miscalculation and sudden, accidental escalation.
This issue is of acute concern in East Asia, where bilateral and multilateral disputes persist over the South China Sea, the Senkaku/Diaoyu Islands, Ieodo/Suyan, Takeshima/Dokdo, Sakhalin Island, and the Kuril Islands. All of these disputes have critical elements in common: they are primarily maritime in nature; they are the result of claims by multiple states holding frequently maximalist territorial positions; and the contested borders sit across key shipping lanes, fishing locations, or areas of presumed abundance of natural resources.
China’s rise as a regional power and its unfolding competition with the United States, in particular, but also Japan and other states in the Western Pacific, are motivating increasingly assertive challenges to the status quo in East Asia. The unilateral placement of the Haiyang Shiyou 981 oil rig well within Vietnam’s exclusive economic zone near the contested Paracel Islands in May 2014 was the most provocative of a series of moves designed to assert control over territory—basically the entire South China Sea—covered by China’s “nine-dash line” claim. Ongoing
Disputed land and maritime boundaries in East Asia
Source: IHS
CHINA
NORTHKOREA
SOUTHKOREA
RUSSIA
TAIWAN
JAPAN
JAPAN
RUSSIA
+Sakhalin Island
JAPAN
RUSSIA
+Kuril Islands
NORTH KOREA
SO
UTH KOREA
+Military Demarcation Line
CHINA
SO
UTH KOREA
+Ieodo / Suyan
CHINA
JAPAN
+Senkaku / Diaoyus
CHINA
TA
IWAN
+China / TaiwanJA
PAN
SO
UTH KOREA
+Takeshima / Dokdo
Competition between states seeking control of contested territory lends
itself to miscalculation and sudden escalation.
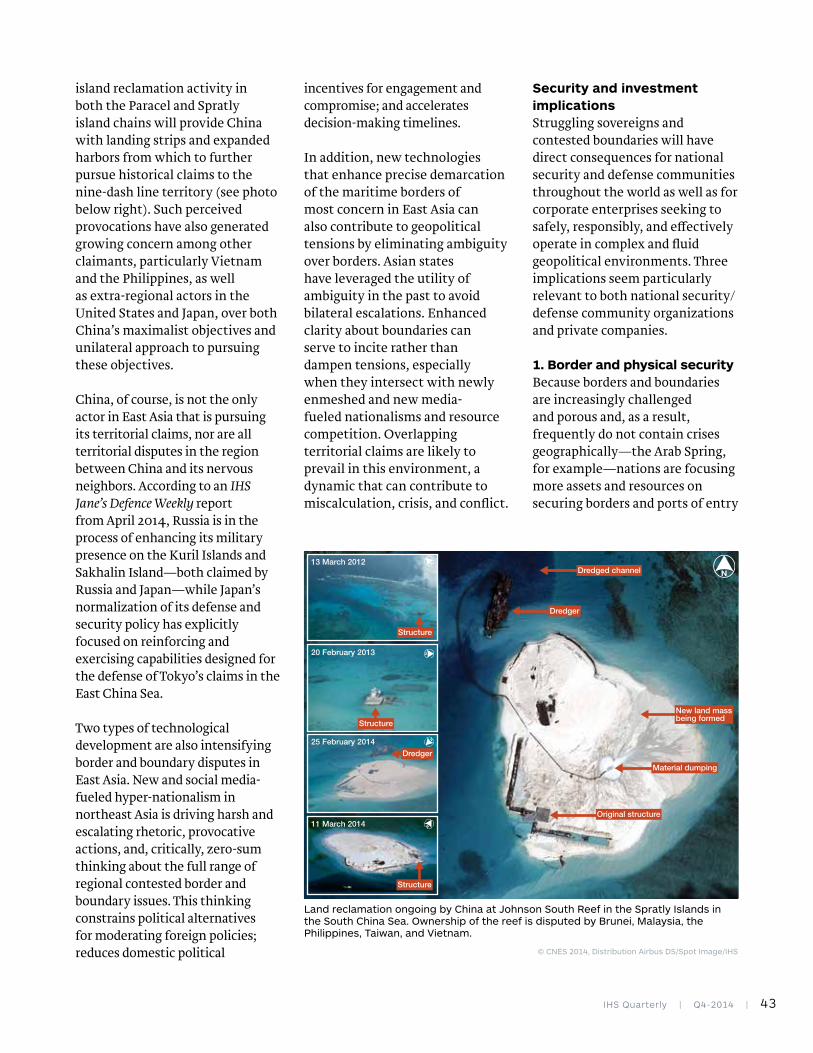
IHS Quarterly | Q4-2014 | 43
island reclamation activity in both the Paracel and Spratly island chains will provide China with landing strips and expanded harbors from which to further pursue historical claims to the nine-dash line territory (see photo below right). Such perceived provocations have also generated growing concern among other claimants, particularly Vietnam and the Philippines, as well as extra-regional actors in the United States and Japan, over both China’s maximalist objectives and unilateral approach to pursuing these objectives.
China, of course, is not the only actor in East Asia that is pursuing its territorial claims, nor are all territorial disputes in the region between China and its nervous neighbors. According to an IHS Jane’s Defence Weekly report from April 2014, Russia is in the process of enhancing its military presence on the Kuril Islands and Sakhalin Island—both claimed by Russia and Japan—while Japan’s normalization of its defense and security policy has explicitly focused on reinforcing and exercising capabilities designed for the defense of Tokyo’s claims in the East China Sea.
Two types of technological development are also intensifying border and boundary disputes in East Asia. New and social media-fueled hyper-nationalism in northeast Asia is driving harsh and escalating rhetoric, provocative actions, and, critically, zero-sum thinking about the full range of regional contested border and boundary issues. This thinking constrains political alternatives for moderating foreign policies; reduces domestic political
incentives for engagement and compromise; and accelerates decision-making timelines.
In addition, new technologies that enhance precise demarcation of the maritime borders of most concern in East Asia can also contribute to geopolitical tensions by eliminating ambiguity over borders. Asian states have leveraged the utility of ambiguity in the past to avoid bilateral escalations. Enhanced clarity about boundaries can serve to incite rather than dampen tensions, especially when they intersect with newly enmeshed and new media-fueled nationalisms and resource competition. Overlapping territorial claims are likely to prevail in this environment, a dynamic that can contribute to miscalculation, crisis, and conflict.
Security and investment implicationsStruggling sovereigns and contested boundaries will have direct consequences for national security and defense communities throughout the world as well as for corporate enterprises seeking to safely, responsibly, and e©ectively operate in complex and fluid geopolitical environments. Three implications seem particularly relevant to both national security/defense community organizations and private companies.
1. Border and physical securityBecause borders and boundaries are increasingly challenged and porous and, as a result, frequently do not contain crises geographically—the Arab Spring, for example—nations are focusing more assets and resources on securing borders and ports of entry
© CNES 2014, Distribution Airbus DS/Spot Image/IHS
Land reclamation ongoing by China at Johnson South Reef in the Spratly Islands in the South China Sea. Ownership of the reef is disputed by Brunei, Malaysia, the Philippines, Taiwan, and Vietnam.
Dredged channel
Dredger
New land massbeing formed
Material dumping
Original structure
Structure
13 March 2012
20 February 2013
Structure
11 March 2014
Structure
25 February 2014Dredger

44 | IHS Quarterly | Q4-2014
to the greatest degree possible. Similarly, companies operating in unstable or insecure areas are vulnerable to fast-moving physical security threats to assets, personnel, and corporate interests, especially those companies supporting critical infrastructure and natural resource development.
The result is growing demand among both public and private sector organizations for a novel suite of command, control, communication, computer, intelligence, surveillance, and reconnaissance (C4ISR) capabilities previously most commonly associated with defense requirements. Unmanned and autonomous systems, remote sensing, cybersecurity, sophisticated command, control, and data integration systems, and e©ective security training,
among other capabilities, are in demand to help monitor borders and fence lines, mitigate risk, track threats, and collect vital operational intelligence.
2. New dimensions, new mapsThe development of new or more robust analysis about, and monitoring of, both possible fault lines within states and communities of interest and the networks that connect these communities to other at-risk states or localities are critical in understanding and responding to environments in which
challenges—violent or otherwise—to current control of territory or resources are increasingly likely.
Network, influencer, and nodal analyses are especially useful for both public and private organizations seeking to identify pathways of crisis contagion. E©ective application of these tools allows enterprises to develop a nuanced understanding of tribal, social, business, and influence networks within and across at-risk geographies. Assessing online influencers—given the important role that globalization and information technologies play in current border challenges—is also key to identifying and potentially influencing networks of interest.
IHS leverages social media monitoring tools to perform analyses of social media activity during and in advance of sovereign
crises. For example, our team retroactively examined over 3.5 million tweets—about 10% of the total potential data set—posted in the month before and during large anti-government protests across Turkey in late May and early June 2013. IHS assessed this data to develop an understanding of general sentiment, geo-locate especially intense pockets of sentiment, and assess the most influential social media centers of gravity during the protests, which communities cohered around them, and how they connected to other online influencers.
Social media intelligence (SOCMINT), especially in conjunction with a more in-depth analysis of network links and fault lines, provides enterprises with valuable indicators and warnings of changes in the intensity, trajectory, pace, and geographic focus areas of unfolding challenges. These types of analyses can also allow national security and corporate entities to better influence or, as in the case of extremist, criminal, or weapons proliferation networks, disrupt operations and decision making in these networks to protect assets, infrastructure, and interests.
3. Anticipating ‘sudden’ shiftsShifting borders and boundaries raise the possibility of fundamental and potentially sudden shifts in political, geopolitical, and security landscapes. Companies and national security and defense agency strategies, interests, and assets may be compromised, threatened by, or vulnerable to shifts in control of territory and resources, which can subsequently constrain strategic and operational alternatives and force these communities into uncomfortable or undesirable alternatives.
For the private sector, contested, uncertain, or newly drawn borders or newly acquired or lost resources (human and physical) can not only a©ect the physical security of personnel and assets, but also have implications on tax and contract regimes, regulatory and administrative environments, payment terms, and other critical elements a©ecting operational e¡ciency and business viability. For example, the growing tendency toward absolute claims of sovereignty and eschewing of
Challenges to government control and political demarcations are no longer restricted to ‘failed’ or ‘failing’ states.

IHS Quarterly | Q4-2014 | 45
multilateral dispute resolution mechanisms in Southeast Asia, in particular, can complicate the ability of a range of commercial companies—transportation, shipping, energy, infrastructure—to finalize deals “without prejudice” in which sovereignty can be put aside.
Predicting the exact timing, dimensions, and trajectories of these shifts is exceedingly di¡cult. Even when risks are identified, crafting e©ective responses is di¡cult. However, both private sector and national security organizations can benefit from incorporation of enhanced strategy and decision-making support tools and capabilities that can help organizations anticipate plausible security, political, geopolitical, and business risks associated with shifting and contested borders. These capabilities can also help organizations develop strategies and operational solutions for mitigating these risks when they arise.
Advanced and alternative analytical techniques—such as scenario planning and tabletop gaming—can help o©set uncertainty by openly incorporating it into planning and decision-making processes. These tools are designed to posit and explore alternative environments and challenge core assumptions, such as the sovereignty and e¡cacy of central governments, buttressing risk mitigation strategies. Full incorporation of e©ective alternative analysis techniques can help decision makers identify and monitor signposts that specific challenges and risks are more or less likely to come to pass and develop hedging strategies designed to respond to crises as they unfold.
Originally developed and implemented most intensively by national security planners—notably Herman Kahn, who frequently employed the methodology to determine pathways to, and outcomes of, nuclear conflicts in the 1950s—scenario planning has been utilized extensively and increasingly by corporations, most famously by Shell to help navigate the challenges of uncertain oil markets in the 1970s. A December 2012 survey of 77 European multinational corporations performed by Rene Rohrbeck of Aarhus University and Jan Oliver Schwarz of Germany’s EBS Business School found that implementation of “strategic foresight” methods was becoming more widespread and that these methods were believed to add value through enhancing corporate capacity to perceive, interpret, and respond to change, precisely the types of capabilities required to anticipate significant shifts in control of territories and resources. Tate Nurkin is managing director, Consulting and Thought Leadership, IHS Aerospace, Defense, and Security James Clad, senior associate, IHS Aerospace, Defense, and Security, and Richard Evans, director, IHS Aerospace, Defense, and Security Consulting, contributed to this article David Hunt, senior manager, and Hugo Foster, analyst, both with IHS Economics and Country Risk, contributed graphics for this article
bit.ly/TateNurkin
For more information, visit ihs.com/Q14JMSA and ihs.com/Q14JTIC
Sh
uttersto
ck

46 | IHS Quarterly | Q4-2014
Sh
utt
erst
ock
The Rivalry Era: A brief history of the energy industry from 2015 to 2040The energy rivalry of the past 25 years has profoundly impacted the energy industry.
Oil no longer holds a monopoly as a transport fuel. Use of renewable energy has grown
rapidly—and demand for gas has soared.
By Jim Burkhard
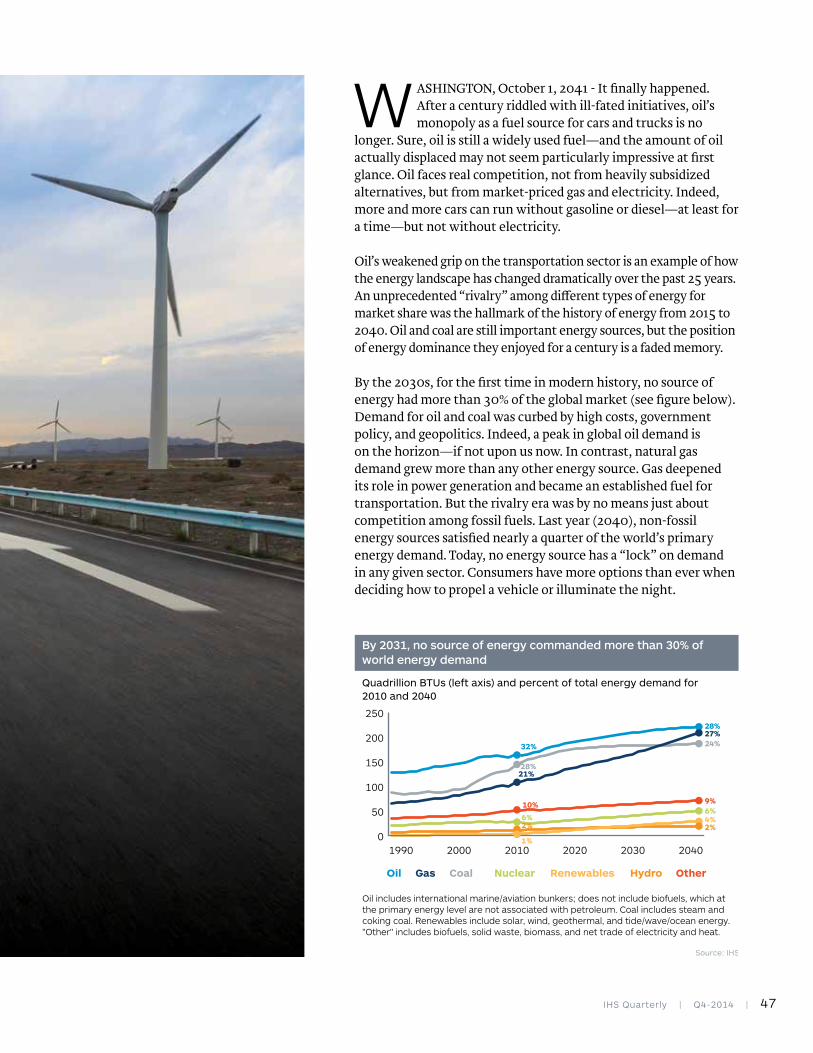
IHS Quarterly | Q4-2014 | 47
W ASHINGTON, October 1, 2041 - It finally happened. After a century riddled with ill-fated initiatives, oil’s monopoly as a fuel source for cars and trucks is no
longer. Sure, oil is still a widely used fuel—and the amount of oil actually displaced may not seem particularly impressive at first glance. Oil faces real competition, not from heavily subsidized alternatives, but from market-priced gas and electricity. Indeed, more and more cars can run without gasoline or diesel—at least for a time—but not without electricity.
Oil’s weakened grip on the transportation sector is an example of how the energy landscape has changed dramatically over the past 25 years. An unprecedented “rivalry” among di©erent types of energy for market share was the hallmark of the history of energy from 2015 to 2040. Oil and coal are still important energy sources, but the position of energy dominance they enjoyed for a century is a faded memory.
By the 2030s, for the first time in modern history, no source of energy had more than 30% of the global market (see figure below). Demand for oil and coal was curbed by high costs, government policy, and geopolitics. Indeed, a peak in global oil demand is on the horizon—if not upon us now. In contrast, natural gas demand grew more than any other energy source. Gas deepened its role in power generation and became an established fuel for transportation. But the rivalry era was by no means just about competition among fossil fuels. Last year (2040), non-fossil energy sources satisfied nearly a quarter of the world’s primary energy demand. Today, no energy source has a “lock” on demand in any given sector. Consumers have more options than ever when deciding how to propel a vehicle or illuminate the night.
Quadrillion BTUs (left axis) and percent of total energy demand for 2010 and 2040
By 2031, no source of energy commanded more than 30% of world energy demand
0
50
100
150
200
250
1990 2000 2010 2020 2030 2040
Oil
32%
28%27%24%
9%6%4%2%
28%21%
10%
6%2%
1%
Gas Coal Nuclear Renewables Hydro Other
Source: IHS
Oil includes international marine/aviation bunkers; does not include biofuels, which at the primary energy level are not associated with petroleum. Coal includes steam and coking coal. Renewables include solar, wind, geothermal, and tide/wave/ocean energy. "Other" includes biofuels, solid waste, biomass, and net trade of electricity and heat.

48 | IHS Quarterly | Q4-2014
Perfect prediction of future events is impossible, regardless of how much planning and preparation are conducted. However, the use of a scenario framework—where two or more di®erent views of the future are considered—can make investments and strategy more robust and resilient under a range of potential outcomes.
In 2014, IHS Energy is releasing a new generation of scenarios. Rivalry is the planning scenario, which provides a comprehensive
global energy outlook to 2040. Our two alternative scenarios, Autonomy and Vertigo, are intended to help our clients consider and prepare for outcomes that are di®erent from the planning scenario.
This article is a summary of the Rivalry scenario—a “history of the future of energy.” A scenario narrative goes beyond the numbers and explains the driving forces that shape the future. The Rivalry narrative is written from
an imagined perspective of 2041. Most of us are accustomed to reading history books written in the past tense with the writer knowing what came before and after the events being discussed. We have adopted a similar approach with the aim of providing a scenario narrative style that is familiar and, we hope, an edifying and insightful read.
Jim Burkhard
The power of scenario planning
RIVALRYMost intense competition in history among energy sources for market share
Defining characteristics of the new generation of IHS Energy Scenarios
Energy rivalry driven by 4 factors: price dierentials, environmental concerns, technology improvements, and energy security
Gas loosens oil’s grip on transport demand; renewables increasingly competitive with gas, coal, and nuclear in power generation
AUTONOMY Market, technology, and social forces decentralize the global energy system
Widespread development of unconventional oil and gas
Generational change and urbanization pressures alter energy demand dynamics
Breakthroughs in electricity storage and solar PV
VERTIGO Volatility in economic growth undermines confidence and exacerbates risk aversion
Investment time lag leads to mismatches between demand and supply
Disruptive innovations heighten sense of imbalance and instability
Source: IHS

IHS Quarterly | Q4-2014 | 49
The energy rivalry was impacted by a larger rivalry among nations. The key dynamic of the geopolitical rivalry was a much-diminished gulf between the economic power of the West and other countries. China has had the largest economy in the world for many years now. And last year the Chinese economy was bigger than the combined output of Japan, Germany, and Brazil (see figure above).
Of course, all countries pursue their own interests. But the world’s relatively new powers—particularly China and India—have had a much bigger impact in the pursuit of their interests than ever before because of their deeper and broader economic capabilities. Their influence and reach expanded in many forms—commercial, military, and political.
At times during the rivalry era, the world edged close to the kind of upheaval that could have irrevocably damaged the global order. Disputes were often fueled by national pride, prestige, and historical grievances. Dense webs of economic relationships did not inoculate the world from friction and conflict. Power—in all its forms—became more and more decentralized and rebalanced commercial, military, and political strength. During this period, the global economy managed to grow at an average annual rate of just above 3%, but not without frequent bouts of anxiety.
Forces for changeCompetition for power and influence among major countries was a key force shaping the rivalry era. New energy relationships formed—or took on new
dimensions. Russia’s 2014 gas supply deal with China was an early example. Saudi Arabia’s push into solar power was another. Solar supplanted a portion of the oil previously used in domestic power generation, which helped maintain a crude oil production bu©er for the oil market. This preserved Saudi Arabia’s important role at the intersection of the oil market and geopolitics.
More broadly, a number of countries adopted policies to encourage the development of unconventional oil and gas. Motivation came from concern about the lack of competitiveness relative to the United States on energy costs as well as ambitions to produce more fuel domestically for the sake of supply security—particularly amid the many years of turbulence that rocked the Middle East and North Africa.
Another key driving force of the rivalry era was price signals. If you believe in the power of price signals to shape behavior, the experience of the rivalry era supports your case. The most prominent example was the reaction to high oil prices and low gas prices. Indeed, it would have been more surprising had there been no reaction. After all, the price of oil remained well above gas prices, including in East Asia (see figure below).
It took time for gas to gain a real foothold in the transportation market. It’s easy to look back at price trends and see the incentive for change. But back in the mid to late 2010s it was far from certain that natural gas prices would remain low enough to justify the cost of switching to gas from diesel.
Real GDP in trillions of constant 2013 USD for 2010 and 2040
0
5
10
15
20
25
30
35
Economic gulf between Western countries and others diminished
Source: IHS
20102040
China India Japan Germany Brazil RussiaUnitedStates
Annual average price in real 2013 USD per million BTU (MMBtu)
2000 2010 2020 2030 2040
The di�erence between oil and gas prices shaped the rivalry era
0
5
10
15
20
25
Europe gas
United States gas
Brent crude oil
Asia gas
Source: IHS
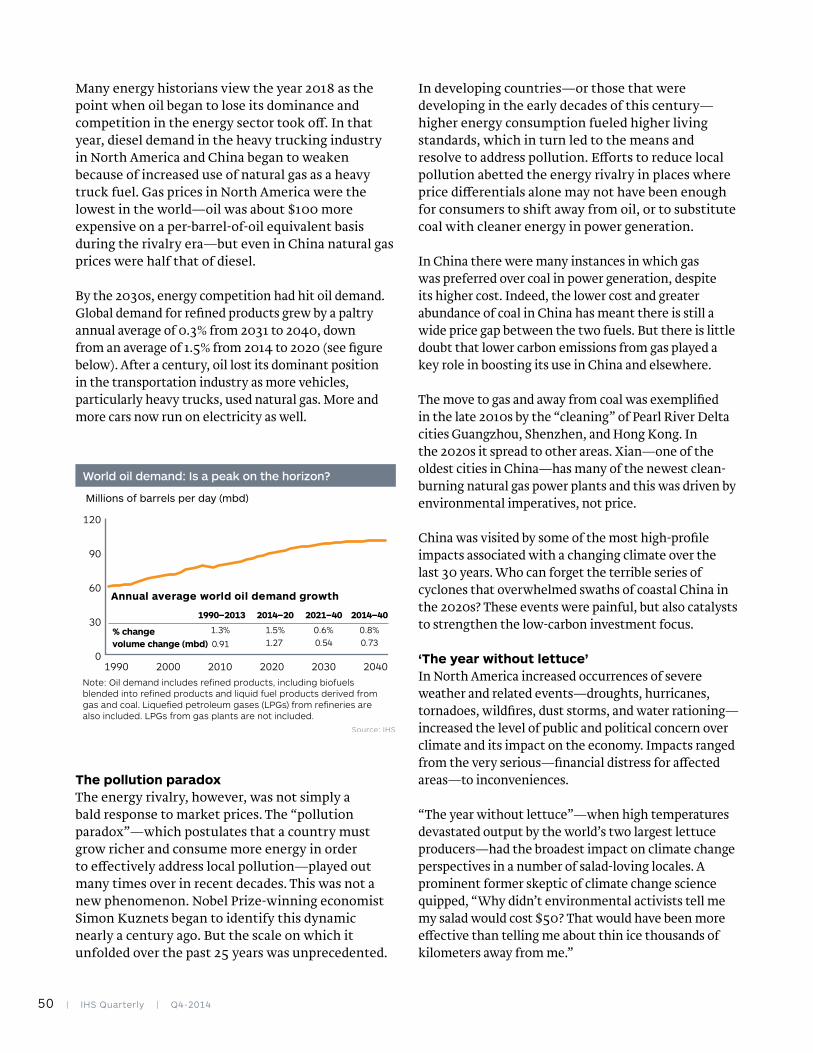
50 | IHS Quarterly | Q4-2014
Many energy historians view the year 2018 as the point when oil began to lose its dominance and competition in the energy sector took o©. In that year, diesel demand in the heavy trucking industry in North America and China began to weaken because of increased use of natural gas as a heavy truck fuel. Gas prices in North America were the lowest in the world—oil was about $100 more expensive on a per-barrel-of-oil equivalent basis during the rivalry era—but even in China natural gas prices were half that of diesel.
By the 2030s, energy competition had hit oil demand. Global demand for refined products grew by a paltry annual average of 0.3% from 2031 to 2040, down from an average of 1.5% from 2014 to 2020 (see figure below). After a century, oil lost its dominant position in the transportation industry as more vehicles, particularly heavy trucks, used natural gas. More and more cars now run on electricity as well.
The pollution paradoxThe energy rivalry, however, was not simply a bald response to market prices. The “pollution paradox”—which postulates that a country must grow richer and consume more energy in order to e©ectively address local pollution—played out many times over in recent decades. This was not a new phenomenon. Nobel Prize-winning economist Simon Kuznets began to identify this dynamic nearly a century ago. But the scale on which it unfolded over the past 25 years was unprecedented.
In developing countries—or those that were developing in the early decades of this century—higher energy consumption fueled higher living standards, which in turn led to the means and resolve to address pollution. E©orts to reduce local pollution abetted the energy rivalry in places where price di©erentials alone may not have been enough for consumers to shift away from oil, or to substitute coal with cleaner energy in power generation.
In China there were many instances in which gas was preferred over coal in power generation, despite its higher cost. Indeed, the lower cost and greater abundance of coal in China has meant there is still a wide price gap between the two fuels. But there is little doubt that lower carbon emissions from gas played a key role in boosting its use in China and elsewhere.
The move to gas and away from coal was exemplified in the late 2010s by the “cleaning” of Pearl River Delta cities Guangzhou, Shenzhen, and Hong Kong. In the 2020s it spread to other areas. Xian—one of the oldest cities in China—has many of the newest clean-burning natural gas power plants and this was driven by environmental imperatives, not price.
China was visited by some of the most high-profile impacts associated with a changing climate over the last 30 years. Who can forget the terrible series of cyclones that overwhelmed swaths of coastal China in the 2020s? These events were painful, but also catalysts to strengthen the low-carbon investment focus.
‘The year without lettuce’In North America increased occurrences of severe weather and related events—droughts, hurricanes, tornadoes, wildfires, dust storms, and water rationing—increased the level of public and political concern over climate and its impact on the economy. Impacts ranged from the very serious—financial distress for a©ected areas—to inconveniences.
“The year without lettuce”—when high temperatures devastated output by the world’s two largest lettuce producers—had the broadest impact on climate change perspectives in a number of salad-loving locales. A prominent former skeptic of climate change science quipped, “Why didn’t environmental activists tell me my salad would cost $50? That would have been more e©ective than telling me about thin ice thousands of kilometers away from me.”
Millions of barrels per day (mbd)
1990
World oil demand: Is a peak on the horizon?
Source: IHS
0
30
60
90
120
Note: Oil demand includes refined products, including biofuels blended into refined products and liquid fuel products derived from gas and coal. Liquefied petroleum gases (LPGs) from refineries are also included. LPGs from gas plants are not included.
2000 2010 2020 2030 2040
% change volume change (mbd)
Annual average world oil demand growth
1990–2013 2014–20 2021–40 2014–40
1.3% 1.5% 0.6% 0.8%
0.91 1.27 0.54 0.73
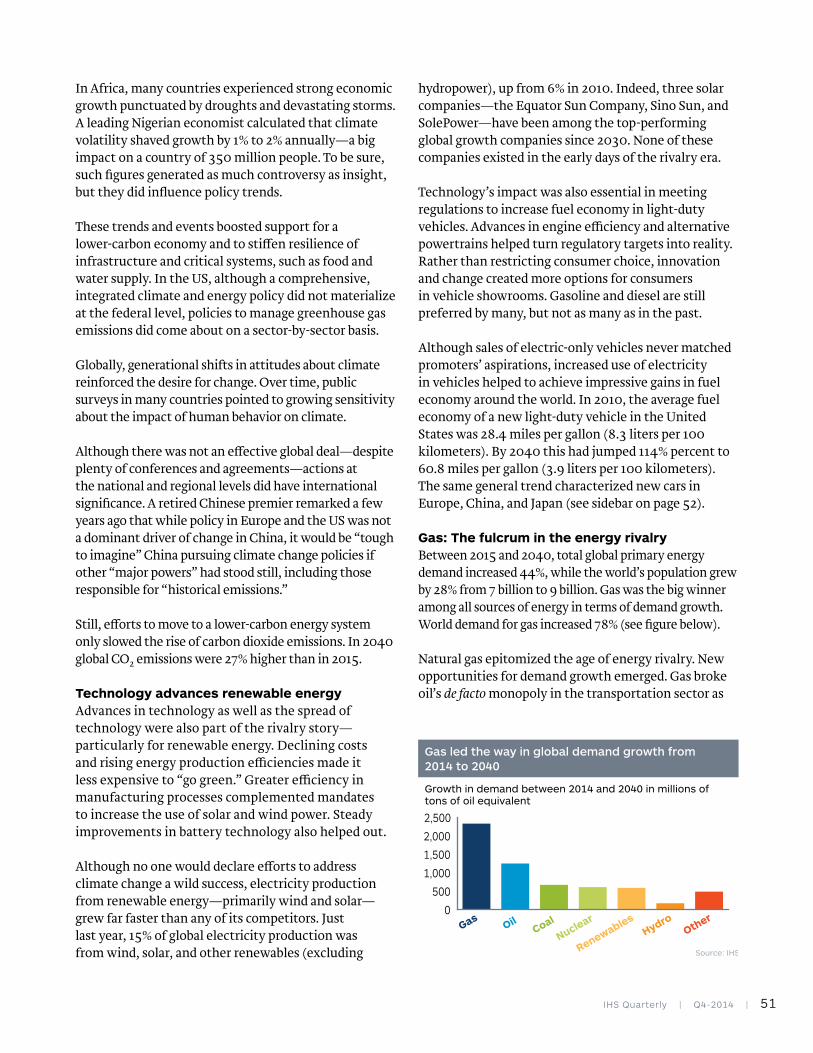
IHS Quarterly | Q4-2014 | 51
In Africa, many countries experienced strong economic growth punctuated by droughts and devastating storms. A leading Nigerian economist calculated that climate volatility shaved growth by 1% to 2% annually—a big impact on a country of 350 million people. To be sure, such figures generated as much controversy as insight, but they did influence policy trends.
These trends and events boosted support for a lower-carbon economy and to sti©en resilience of infrastructure and critical systems, such as food and water supply. In the US, although a comprehensive, integrated climate and energy policy did not materialize at the federal level, policies to manage greenhouse gas emissions did come about on a sector-by-sector basis.
Globally, generational shifts in attitudes about climate reinforced the desire for change. Over time, public surveys in many countries pointed to growing sensitivity about the impact of human behavior on climate.
Although there was not an e©ective global deal—despite plenty of conferences and agreements—actions at the national and regional levels did have international significance. A retired Chinese premier remarked a few years ago that while policy in Europe and the US was not a dominant driver of change in China, it would be “tough to imagine” China pursuing climate change policies if other “major powers” had stood still, including those responsible for “historical emissions.”
Still, e©orts to move to a lower-carbon energy system only slowed the rise of carbon dioxide emissions. In 2040 global CO2 emissions were 27% higher than in 2015.
Technology advances renewable energyAdvances in technology as well as the spread of technology were also part of the rivalry story—particularly for renewable energy. Declining costs and rising energy production e¡ciencies made it less expensive to “go green.” Greater e¡ciency in manufacturing processes complemented mandates to increase the use of solar and wind power. Steady improvements in battery technology also helped out.
Although no one would declare e©orts to address climate change a wild success, electricity production from renewable energy—primarily wind and solar—grew far faster than any of its competitors. Just last year, 15% of global electricity production was from wind, solar, and other renewables (excluding
hydropower), up from 6% in 2010. Indeed, three solar companies—the Equator Sun Company, Sino Sun, and SolePower—have been among the top-performing global growth companies since 2030. None of these companies existed in the early days of the rivalry era.
Technology’s impact was also essential in meeting regulations to increase fuel economy in light-duty vehicles. Advances in engine e¡ciency and alternative powertrains helped turn regulatory targets into reality. Rather than restricting consumer choice, innovation and change created more options for consumers in vehicle showrooms. Gasoline and diesel are still preferred by many, but not as many as in the past.
Although sales of electric-only vehicles never matched promoters’ aspirations, increased use of electricity in vehicles helped to achieve impressive gains in fuel economy around the world. In 2010, the average fuel economy of a new light-duty vehicle in the United States was 28.4 miles per gallon (8.3 liters per 100 kilometers). By 2040 this had jumped 114% percent to 60.8 miles per gallon (3.9 liters per 100 kilometers). The same general trend characterized new cars in Europe, China, and Japan (see sidebar on page 52).
Gas: The fulcrum in the energy rivalryBetween 2015 and 2040, total global primary energy demand increased 44%, while the world’s population grew by 28% from 7 billion to 9 billion. Gas was the big winner among all sources of energy in terms of demand growth. World demand for gas increased 78% (see figure below).
Natural gas epitomized the age of energy rivalry. New opportunities for demand growth emerged. Gas broke oil’s de facto monopoly in the transportation sector as
Source: IHS
0
500
1,000
1,500
2,000
2,500
Growth in demand between 2014 and 2040 in millions of tons of oil equivalent
Gas led the way in global demand growth from 2014 to 2040
GasOil
Coal
Nuclear
RenewablesHydro
Other

52 | IHS Quarterly | Q4-2014
about 2.5 million barrels a day of diesel was displaced by gas. Gas faced competition in the power sector from renewables and coal but ultimately came out a winner. The share of global primary energy demand satisfied by gas increased from 21% in 2015 to 27% in 2040.
Global gas demand expanded, but the geography of growth was uneven. Demand in Russia and the rest of the Commonwealth of Independent States was just slightly higher—3.6%—in 2040 than in 2015. In Europe, gas demand took over 20 years to return to its 2008 peak. It was in Asia where gas demand grew the most, but it also increased in Latin America, the Middle East, and North America. Gas demand more than doubled in Africa, but from a low starting point.
Rising global demand was supplied by the transformation of the global gas reserve base that began with shale gas in North America in the early part of the century. Much attention was focused on the development of shale gas resources in the United States and beyond. But the development of deep
water and associated gas—often in connection with unconventional oil—was also critical. These non-traditional gas resources significantly increased the diversity of gas supply. New contracting structures altered the way that gas is bought, sold, and priced.
Global coal: Success leads to downfallBefore oil and gas, coal was the world’s industrial fuel. In recent decades, despite its vilification as a “dirty fuel,” coal has remained one of the world’s top three sources of energy. In an age of growing concern about climate change, coal was able to retain its top-three position because it was cheap. Demand trends for coal were polarized. Marginalized in North America and Europe, coal demand rose in many other places, especially throughout Asia. Ironically, as coal use increased, so too did concern about the pollution it created—an example of the pollution paradox. These concerns eventually led to its loss of market share.
As recently as the first decade of this century, coal use was still growing faster than any other fuel. But in the
DETROIT, October 1, 2041 - In the past 25 years, the number of vehicles on the road has doubled, hitting 2 billion globally just last year. Sales growth of light-duty vehicles in the emerging markets of the Asia-Pacific region, and especially China, far outpaced that of other regions of the world.
The increase in sales came as emerging market economies led the world in GDP growth, expanding at an annual rate of 4.8% over the past quarter century compared with advanced economies, whose growth lagged at an average annual rate of 2.0%. As emerging economies became richer and consumed more energy, pollution, and in particular poor urban air quality, became a bigger issue and led to more stringent environmental
regulations. The tightening of tailpipe emission standards and stricter fuel economy standards resulted in an increase in powertrain competition and the move toward smaller and/or lighter vehicles and greater electrification.
In a roundabout way, it was the increased pollution that led the way for alternative fuels and powertrains—an example of the “pollution paradox.” Social and political opposition to increasing pollution coincided with generational changes in attitudes about climate change that ultimately led to environmental improvements and moderation in the growth of greenhouse gas emissions.
Asian countries, led by China, pursued goals to cut carbon
intensity and improve air quality through a range of policies, including energy efficiency. Many emerging markets discouraged diesel use in light-duty vehicles, e®ectively reserving the fuel for use in larger and mostly commercial vehicles. By 2025, global diesel vehicle sales had begun to decline. While the CO2 and fuel economy standards globally continued to improve at a modest pace through 2030, the drive to regulate emissions and the push toward new electric vehicle technology became more urgent as 2040 approached.
Since 2025, an increasing percentage of global sales has comprised new-energy vehicles—primarily conventional and plug-in hybrids. Many consumers still prefer gasoline and diesel, but
Auto retrospective, 2015-2040: Emerging markets drove growth

IHS Quarterly | Q4-2014 | 53
2010s, coal ceded first place to gas. Coal producers thus had to adapt to a marketplace in which price competitiveness and security of supply were ultimately the only cards that could be played in coal’s favor. These arguments, particularly a©ordability, sustained coal’s place in the world but did not make for attractive mining margins. For example, investment in steam coal mining was a tough, often unrewarding business.
The world in 2040The diversity in the global energy mix in 2040 is unprecedented. Yes, oil and coal are still important energy sources, but their century-long lock as the world’s dominant fuels is no longer. Price signals, environmental
concerns, geopolitics, technological change, and e©orts to increase energy security and national competitiveness collectively fueled the energy rivalry.
The world is more prosperous than ever, largely due to the spread of energy supply and distribution infrastructure across Asia and Africa. The energy rivalry played a pivotal role in making energy more accessible and cleaner. Living standards—for most—are higher than in the previous generation. At the same time, there is no complacency that this will continue. The US and China succeeded in avoiding open conflict, but the world is far from assured this will continue. China’s influence over the “first
island chain” is far greater today—mainly due to the commercial union between Taiwan and the mainland. This development, by itself, does not make the world safer or more dangerous. But it is a significant change in a still-unsettled global order.
Is the world able to maintain peace without a hegemon in place? We will find out in the years ahead.
Jim Burkhard is vice president and head of Global Oil Market Research and Energy Scenarios, IHS Energy
bit.ly/JimBurkhard
For more information, visit ihs.com/Q14EnergyOutlook
liquefied natural gas has become a mainstream fuel in heavy trucking in both China and the United States. More recently, we have seen a flattening in demand for vehicles using conventional gasoline and diesel, which had powered a large portion of the fleet in the past (see figure).
Around the world, electricity has become a more vital part of the transportation industry. Increased use of electricity in the full range of electric vehicles, including hybrids, has been pivotal in the impressive gains in CO2 reduction and improvement in urban air quality.
Ti¨any Groode, senior principal researcher, IHS Automotive
bit.ly/Ti¨anyGroode
For more information, visit ihs.com/Q14AutoEnergy
Source: IHS
0
20
40
60
80
100
Percent of global light-duty vehicle sales by type of powertrain
Hydrogen fuel cell electric vehicle (FCEV)Liquefied propane gas vehicle (LPG)Full hybrid electric vehicle (FHEV)Mild hybrid electric vehicle (MHEV)Flex fuel vehicle (FFV)Battery electric vehicle (BEV)Plug-in hybrid electric vehicle (PHEV)Natural gasDiesel vehicleGasoline vehicle
Gasoline and diesels lost their dominance as EV and natural gas powertrain sales grew
20402030202020102000

54 | IHS Quarterly | Q4-2014
By Michelle Lynch, Mark Morgan, and Jagdish Rebello
Very small particles with
very big implicationsNanotechnology has been in commercial products for some time, but the pace of development of new nanomaterials and the plethora of new applications are accelerating. The field could prove transformative for many industries, including the one responsible for producing the nanomaterials: chemicals.

IHS Quarterly | Q4-2014 | 55
O nce a theoretical concept confined to the realm of academia, nanotechnology has become part of the consumer lexicon of the 21st century.
Nanomaterials are in our sunscreens, mobile phones, TVs, automobiles, medicines, and hospitals. They o©er superior properties to their non-nano analogs: they are brighter, harder, smaller, stronger, more reactive, more precise, superconductive, and even self-healing.
Nanotechnology is an evolving field of science with both existing and as yet undiscovered commercial promise. Building new molecular structures is one step in the evolution of nanotechnology. But more challenging—and disruptive—will be the mass production of nanotech materials by the chemicals industry at prices that make the materials more cost competitive. This is a prerequisite and the gating factor for explosive growth in downstream industries, most notably aerospace and defense, automotive, electronics, health care, and textiles.
What is nanotechnology?Nanotechnology can be defined in di©erent ways. Most commonly, it is thought of as a product made from materials containing particles with at least one dimension below 100 nanometers. A nanometer is one-billionth of a meter; 10 helium atoms arrayed in a row would measure about one nanometer. A human hair is about 40,000 nanometers thick.
Another definition is a product containing individual, discrete particles that are 1 to 100 nanometers in diameter. These discrete particles are then formulated in di©erent ways to make nanomaterials. The nanoparticles can be dissolved or suspended in a liquid, form part of the composition of a thin surface coating, or be dispersed within a solid shape.
IHS forecasts that the global nanomaterials market will be worth nearly $7.4 billion in 2015, up from $5.6 billion in 2010. The market is projected to reach $12.4 billion by the end of this decade (see sidebar on page 57). Most of the materials in today’s market are inorganic oxides—such as silica, titania, and zirconia—with a smaller proportion comprising precious metals such as platinum, palladium, gold, and silver, as well as carbon-based nanotechnology such as carbon nanotubes and nanofibers. There is also a growing market for organic nanotechnology, which is not included in the IHS forecast. These particles include nano-sized fat molecules (lipids), surfactants, and
Sh
uttersto
ck
A ferrofluid containing nanoscale
particles that become magnetized
when near a magnet.
56 | IHS Quarterly | Q4-2014
polymers. They may be used alone or as part of a hybrid system with inorganic nanomaterials.
Of course, nano-sized particles are abundant in nature—a virus is e©ectively a nanoparticle—and have been part of commercial products since the last century, for instance in colloids, composites, and catalysts. However, the nanodimensions of the particles in these products were not always part of a deliberate design and were not seen as the defining feature of the technology. In many cases they would not even have been possible to measure.
The use of the terms “nanotechnology” and “nanomaterials” began around 1985 with the discovery of buckminsterfullerene, also known as buckyballs or C60, which led to the 1996 Nobel Prize in Chemistry shared by Robert Curl, Harold Kroto, and Richard Smalley. C60’s discovery was followed in 1991 by the development of carbon nanotubes (CNTs), which are finding applications in a variety of industries.
CNTs have been used to make bicycle parts and unmanned maritime vessels. They go into the tips of atomic-force microscopes and provide the sca©olding to promote bone growth. CNTs are used in composite materials, bonded with epoxy, to produce baseball bats, ice-hockey sticks, marine paints, skis, sur·oards, and wind turbines.
Between 2010 and 2015, IHS projects that CNTs and carbon nanofibers will post the highest market growth of all the nanotechnology sectors, with
average annual growth rates of 10% and 30%, respectively. It is expected that they will continue to grow rapidly and are a promising sector of the nanotechnology market.
A wide variety of consumer products, including appliances, computers, cosmetics, food, luggage, and toys, have incorporated nanomaterials in recent years (see sidebar on pages 58-59). The US has been the leading source of nanotech-based consumer products, followed by East Asia and Europe.
Market challengesAs yet, consumers are not entirely sold on the value of nanotechnology. They question the benefits of nanotechnology and have concerns about potential health and environmental e©ects—especially for products worn on the skin, such as cosmetics and sunscreens. This is leading to the introduction of voluntary labeling guidelines, which could become mandatory in the future if the industry becomes more closely regulated.
Indeed, regulation governing the production and sale of nanoparticle-containing products is looming. In Europe, for example, companies are required to register large volumes of nanotechnology products as part of the European Union’s REACH (Registration, Evaluation, Authorization, and Restriction of Chemicals) legislation. In August 2014, the European Commission concluded a period of public consultation on transparency measures for nanomaterials now on the market. Other countries around the world are likely to follow the EU’s lead on the regulation of nanomaterials.
Carbon nanotubes and nanofibers are a promising sector of the nanotech market and are expected to post the highest growth of all the nanotechnology sectors, with average annual growth rates of 10% and 30%, respectively.
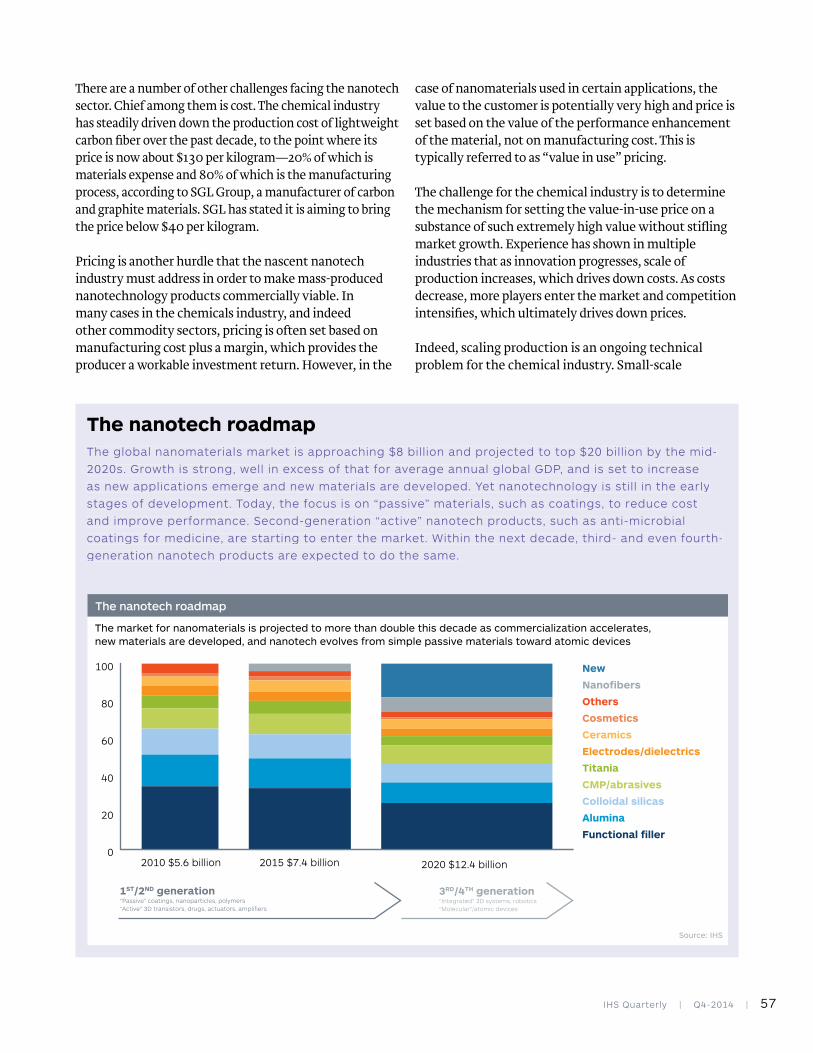
IHS Quarterly | Q4-2014 | 57
There are a number of other challenges facing the nanotech sector. Chief among them is cost. The chemical industry has steadily driven down the production cost of lightweight carbon fiber over the past decade, to the point where its price is now about $130 per kilogram—20% of which is materials expense and 80% of which is the manufacturing process, according to SGL Group, a manufacturer of carbon and graphite materials. SGL has stated it is aiming to bring the price below $40 per kilogram.
Pricing is another hurdle that the nascent nanotech industry must address in order to make mass-produced nanotechnology products commercially viable. In many cases in the chemicals industry, and indeed other commodity sectors, pricing is often set based on manufacturing cost plus a margin, which provides the producer a workable investment return. However, in the
case of nanomaterials used in certain applications, the value to the customer is potentially very high and price is set based on the value of the performance enhancement of the material, not on manufacturing cost. This is typically referred to as “value in use” pricing.
The challenge for the chemical industry is to determine the mechanism for setting the value-in-use price on a substance of such extremely high value without stifling market growth. Experience has shown in multiple industries that as innovation progresses, scale of production increases, which drives down costs. As costs decrease, more players enter the market and competition intensifies, which ultimately drives down prices.
Indeed, scaling production is an ongoing technical problem for the chemical industry. Small-scale
The global nanomaterials market is approaching $8 billion and projected to top $20 billion by the mid-2020s. Growth is strong, well in excess of that for average annual global GDP, and is set to increase as new applications emerge and new materials are developed. Yet nanotechnology is still in the early stages of development. Today, the focus is on “passive” materials, such as coatings, to reduce cost and improve performance. Second-generation “active” nanotech products, such as anti-microbial coatings for medicine, are starting to enter the market. Within the next decade, third- and even fourth-generation nanotech products are expected to do the same.
The nanotech roadmap
The market for nanomaterials is projected to more than double this decade as commercialization accelerates, new materials are developed, and nanotech evolves from simple passive materials toward atomic devices
The nanotech roadmap
0
20
40
60
80
100
2020 $12.4 billion2015 $7.4 billion2010 $5.6 billion
Source: IHS
New
Nanofibers
Others
Cosmetics
Ceramics
Electrodes/dielectrics
Titania
CMP/abrasives
Colloidal silicas
Alumina
Functional filler
1ST/2ND generation“Passive” coatings, nanoparticles, polymers“Active” 3D transistors, drugs, actuators, amplifiers
3RD/4TH generation“Integrated” 3D systems, robotics“Molecular”/atomic devices
58 | IHS Quarterly | Q4-2014
production generally implies high cost. A good example can be found in the carbon fiber business.
Conventional standard-to-intermediate grades of carbon fiber commonly used in aerospace applications are manufactured in multiline facilities with capacities in the region of 4,000 to 5,000 metric tons a year. IHS estimates that for such a facility located in the US, the average combined cost of manufacturing, raw materials, utilities, fixed costs, and depreciation is in the range of $20 to $25 a kilogram. Selling prices are in the range of $40 to $45 a kilogram.
Extremely high performance grades of carbon fiber that are typically used in the production of satellites and space vehicles are made on dedicated equipment in much smaller volumes, on the order of a few hundred tons a year or less. Manufacturing costs in such cases can be as high as $150 to $155 a kilogram. Prices for such grades can reach $200 a kilogram or more.
First-mover advantage or disadvantage?The carbon fiber example captures the volume-price dilemma. In order to reduce prices, manufacturers must scale production. But scaling production will happen only if demand is increasing. Yet demand will rise only when prices start to come down.
Funding mechanisms such as public-private partnerships between academia and industry may point to one way forward to make nanotechnology
commercially viable. One example is a consortium of academics from Rice University, the US Air Force Research Laboratory, Teijin Limited, a Japanese chemical and pharmaceutical company, and Technion - Israel Institute of Technology that together have succeeded in developing a second-generation carbon fiber derived from spinning fiber from carbon nanotubes dissolved in sulfuric acid.
Developing the nanomaterial, however, is just the first step. A similar coalition of experts from many disciplines will take the next step to scale up to industrial production, expanding from kilograms per year to hundreds, possibly thousands, of metric tons per year, while optimizing the process and reducing cost.
Another challenge is the high cost of entry and the high risk for new entrants. Unless the company can generate a sustainable revenue stream and healthy profit margin from the sale of nanomaterials, the business may not be viable. Consider Bayer Material Science (BMS), which opened a pilot plant to make CNTs in 2010 at a cost of about $30 million. In 2013, the company announced it was withdrawing from CNT and graphene production. This year, BMS sold its CNT and graphene patents, along with related intellectual property, to FutureCarbon, a German company focused on developing and manufacturing carbon nanomaterials.
A promising avenue for market entry is for companies to participate in pre-competitive government initiatives.
There are hundreds of examples of nanotechnology in action. Below are cases drawn from five industries on the cutting edge of the nanocurve.
Automotive. Nanotech is used in self-repairing coatings and bulk materials—essentially keeping vehicles from being scratched. This is made possible by the development of nanocontainers, whether self-assembled or assembled layer by layer. A polymer nanocoating can form a tight bond on a vehicle’s substrate, which may include aluminum, chrome, glass, paint, plastic, or stainless steel. These surfaces generally have undulations that help, not hinder, the adhesion of a nanocoating. Sealants made with
nanoparticles can protect vehicle surfaces from acids, alkaline chemicals, detergents, petroleum-based solvents, and water.
Health care. Nanotech is making its mark in health care and medicine in research for drug discovery, improved imaging technologies for physicians, and prescriptions for treating various diseases. It is currently being employed in appetite control, bone replacement, cancer treatment, diagnostic tests, and hormone therapy.
Microelectronics. As the tiniest feature sizes on semiconductors shrink to 22 nanometers and smaller, a
Nanotech applications

IHS Quarterly | Q4-2014 | 59
One option in the US is to join the National Nanotechnology Initiative (NNI), a US government program established in 2001 to coordinate R&D in nanotech, with a commitment to technology transfer and commercialization. In its 2014 strategic plan, the NNI identified five nanotechnology signature initiatives: nanotech for solar energy collection and conversion; sustainable nanomanufacturing; nanoelectronics in 2020 and beyond; developing a nanotech knowledge infrastructure; and using nanoscale materials in sensors to improve and protect health, safety, and the environment.
While far from a sure thing, nanotechnology o©ers significant business opportunities for companies willing and able to take the long view. One avenue is to identify a sizable opportunity in an existing market where a nanotech product can displace an existing inferior solution, e.g., a coating for an automobile that keeps itself
clean, clears mist from side mirrors, or self-repairs scratches in the automotive paint.
Indeed, self-healing coatings have been produced through the use of nanoreservoirs embedded in the coatings. When a scratch is formed—either by mechanical or chemical means—nanocapsules containing the repairing monomer are broken open and mix with nearby catalyst particles, reacting to form fresh coating to fill in the scratch.
This approach has been expanded and improved upon by the development of systems combining active components alongside the passive matrix, which are “signaled” to carry out repair by environmental variations such as a change in pH caused by a corrosive substance. A highly sophisticated system has been developed by Germany’s Max Planck Institute, an R&D leader in this field, in which polyaniline-conductive, polymer-based nanocontainers are incorporated in a coating on a metal surface. The nanocontainers react to
an external corrosive environment by opening to release repairing chemicals and then closing again when the corrosive environment is no longer present, thus increasing the e¡ciency and longevity of the self-repairing technology.
Another path to mass production is to develop an answer for a problem that previously had no known solution. For example, a pill that when swallowed will keep track of your vital signs and report them wirelessly to your doctor. Or clothing that will not stain or wrinkle while shielding you from the weather and ultraviolet rays. Or a nanoscale spy vehicle that could be literally the size of a fly on the wall. These are all products that are being developed today using nanomaterials and nanotechnology. Whether any of them reaches mass-market scale remains to be seen.
Of course, nanotechnology is not just about yet-to-be-invented nanomaterials. Many industries have been using nanomaterials in their products for years, indeed
transition from silicon to nanotech materials becomes increasingly likely. Integrated circuit researchers have already developed field-e�ect transistors with carbon nanotubes and heterostructured semiconductor nanowires. However, the semiconductor industry is approaching the era of advanced molecular electronics with some trepidation, as the fabrication of nanoscale semiconductors could prove to be a formidable manufacturing challenge.
Military and aerospace. Nanotech o�ers lighter and stronger materials for aircraft and spacecraft, as well as new sensor technologies, smaller computer systems, and virtual reality systems with nanostructured electronics for training military personnel. Lighter nanomaterials mean less fuel is
required to lift aircraft o� the ground and spacecraft into orbit or on missions that extend beyond the solar system.
Textiles. Nanotech has given rise to the development of nanofabrics, incorporating nanoparticles and nanofibers. When nano-engineered coatings are applied to fabrics, the nanoparticles bond with the fabric’s fibers. These nanomaterials are able to kill bacteria, reduce or eliminate moisture and odors, and stave o� static electricity. Polymer nanofibers applied to textiles form a bond at one end of the polymer and create a surface of small, hair-like structures that can make nanofabrics resistant to dirt, stains, and water.
Michelle Lynch

60 | IHS Quarterly | Q4-2014
centuries. Consider gold, a highly coveted element that is produced in many forms: bullion bars, coins, and jewelry. The ductile metal can also be reduced to a foil or leaf measuring 100 nanometers in thickness—which qualifies it as a nanomaterial—for use in decorative gilding covering roofs or to coat the visors of helmets for astronauts to protect against solar radiation (see sidebar at left).
Gold nanoparticles, about 10 nanometers or less in width, are chemically reactive and can be used in a variety of chemical transformations, most notably low-temperature abatement of toxic gases, such as carbon monoxide in respiratory protection equipment and automotive air conditioning systems. Gold nanoparticles are also being employed in cancer treatments, including an experimental method of fighting aggressive brain tumors with gold nanospheres, and as biological and chemical sensors.
The nanoroadmapGiven the potential for so many innovative nanotech applications, the question is, how do chemical companies move forward to develop a profitable, sustainable nanomaterials business while balancing the market opportunities and risks? Part of the answer is to look back 10 years or so.
Nanotechnology is now entering its second generation of development. The first generation, which spans two decades, has produced passive ceramics, coatings, and polymers. The second generation is producing active nanotech products such as three-dimensional transistors, actuators, amplifiers, and drugs. The third and fourth generations of nanotech—which IHS projects will emerge in the next few years—will produce integrated three-dimensional systems and robotics, plus atomic-level and molecular-level machines and devices.
Carbon fiber, carbon nanotubes, graphene, and other nascent nanomaterials will play a leading role in the second-, third-, and fourth-generation development of nanotechnology. Single-walled nanotubes can be used in semiconductors and other electronic components, photovoltaic solar cells, and other applications, while multi-walled nanotubes (MWNTs) can be employed in lithium-ion batteries and other forms of energy storage. MWNTs, coated with magnetite, can generate magnetic fields.
Magna Exteriors, a subsidiary of global automotive
In its bulk form, gold is chemically inert and commonly formed into bars of bullion, coins, and jewelry. The element, whose chemical symbol is Au, can also be reduced to a foil or leaf form, in thicknesses ranging from 0.1 millimeter to 100 nanometers. Gold foil or gold leaf can be used to decorate objects, such as gilding ornaments, and has practical applications, such as coating the visors of astronaut helmets. Gold nanoparticles are 10 nanometers or smaller and are chemically reactive. These nanoparticles can be used in the catalytic converters of automotive vehicles to reduce or eliminate carbon monoxide pollution. Other applications of gold nanoparticles include cancer treatments and biological and chemical sensors. Gold nanoparticles are also being used experimentally as “Trojan horse” gold nanospheres in the treatment of aggressive brain tumors, such as glioblastoma multiforme and oligodendroglioma.
Mark Morgan
The many uses of gold
Wel
lan
d a
nd
Wat
ts, U
niv
ersi
ty o
f C
amb
rid
ge,
UK
An image of a “Trojan horse” treatment for an aggressive
form of brain cancer that uses nanoparticles of gold to
kill tumor cells. Once inside the cells, the nanospheres
are exposed to radiotherapy, causing the gold to release
electrons that damage the cancer cell’s DNA.
IHS Quarterly | Q4-2014 | 61
supplier Magna International, took a corporate interest in carbon fiber as a material for automotive body panels earlier this century but put the e©ort aside when it became clear its customers weren’t interested, due in part to high prices and slow processing. After reviving its R&D of carbon fiber in 2009, Magna Exteriors announced this year that it will supply carbon fiber composite body panels for two 2016-model vehicles. In July, Magna Exteriors agreed to sell its composites operations to Continental Structural Plastics.
In addition to body panels for fuel-e¡cient automobiles, carbon fiber is likely to be employed in a variety of other industries and applications, from alternative energy to construction and infrastructure to oil exploration.
Graphene, which is used in making CNTs through chemical vapor deposition, has been hailed as a “wonder material” with unlimited potential uses. It was first isolated a decade ago by two researchers at the University of Manchester, which earned them the 2010 Nobel Prize in Physics.
Graphene is pure carbon that is arrayed in a honeycomb lattice one-atom thick. It is lightweight yet 100 times stronger than steel and highly e¡cient in conducting electricity and heat. When it comes to being used in semiconductor devices, however, graphene is something of a “loose cannon”: it doesn’t have a bandgap like silicon and other semiconducting materials, so the electrical current becomes di¡cult to control.
While research continues to create a workaround for graphene’s zero
bandgap as a semiconductor super material, its advantages in strength and weight are being put to use in other areas. For instance, mixed with dichalcogenides, graphene can be employed as a photovoltaic paint, providing solar power for smartphones and tablet computers.
A graphene filter could work in desalination plants to turn out fresh water. The carbon material could also be applied to windows to restrict the amount of sunlight allowed, reducing the need for air conditioning and saving on energy costs. Graphene can be mixed with thermoset plastic materials, such as epoxy, for use in aircraft, reducing their fuel use and providing greater protection against lightning strikes. Graphene could also be used in bionic limbs, restoring mobility to the disabled.
Riding the nanotech revolutionBy the end of this decade, nanotech is expected to become a general-purpose technology, moving beyond niche applications to encompass passive nanostructures, active nanostructures, nanosystems, and molecular nanosystems. The chemical industry needs to position itself to take advantage of this revolution.
Where the rubber—possibly coated with nanoparticles—really meets the road is in the dramatic growth of applications of carbon fiber, carbon nanotubes, graphene, and other nanomaterials anticipated in the next few years. Today, industry executives should be asking, “how can nanotechnology change and improve our products?”
Consider General Electric (GE). It has been a leader in nanotech research for years, incorporating
nanomaterials in electronic devices, jet engines, gas and steam turbines, and medical diagnosis systems. GE is participating in the New York Power Electronics Manufacturing Consortium, a five-year, $500 million public-private initiative to develop nanomaterials for semiconductors. The program will utilize silicon carbide semiconductor technology, with R&D from the State University of New York’s College of Nanoscale Science and Engineering.
GE is a global corporation with vast resources and scale. It is a catalyst for the industry’s growth. But the growth of nanotechnology also requires nimble, entrepreneurial companies focused on developing out-of-the-box products that will be a disruptive force in the industries they target.
Ultimately, it may be a startup that produces the high-volume, billion-dollar application that launches nanotechnology as a viable industry, much like Apple helped launch the personal computer and decades later the smartphone. It is entirely possible that the Apple of nanotech hasn’t yet been conceived. But make no mistake: it will happen soon.
Michelle Lynch is senior consultant, IHS Chemical; Mark Morgan is managing director of consulting, IHS Chemical; and Jagdish Rebello is senior director, IHS Technology
bit.ly/MichelleLynch bit.ly/MarkMorgan
bit.ly/JagdishRebello
For more information, visit ihs.com/Q14Nanotech

62 | IHS Quarterly | Q4-2014
T esla Motors broke the mold. Then reinvented it. Not only did Tesla Chief Executive and Chief Product Architect Elon Musk demonstrate that
convention could be defied, he did it in an industry with 100-year-old traditions, norms, and processes. Of course, the auto industry has innovated in the past, but Tesla, which was founded in 2003, has pushed the envelope beyond what most automakers thought possible. The company’s Silicon Valley-style “techpreneurship” enabled it to move faster, work more e¡ciently, and create groundbreaking new ideas around sustainable mobility and automotive technology.
After all, this is Musk’s modus operandi. In 1998, he disrupted e-commerce by creating a widely deployable
and secure payment platform called PayPal. And in 2002, he launched SpaceX, a company that designs, manufactures, and launches rockets and spacecraft. The company’s goal is to enable people to live on other planets. Musk, himself, wants to “die on Mars” and wholeheartedly believes it will be possible.
He is also a lightning rod in the debate around mass transit with an idea some critics refer to as vaporware. Dubbed Hyperloop, Musk’s idea is to create a high-speed transportation system that is immune to weather, impossible to crash, uses little energy and recaptures most of what it uses, and travels twice the speed of today’s commercial aircraft. He believes the concept could move people from Los Angeles to San
Tesla Motors: A case study in disruptive innovationTesla is no ordinary car company. To find out just how di®erent it is, the IHS
Technology Teardown Team took apart a 2013 Tesla Model S. What they found
were systems and components unique in the auto industry—some would call
them radical. But Tesla’s disruptive influence is more than semiconductors,
screens, and software. It’s about a new vision for the car, innovative
design, and new models for manufacturing. And it’s shaping the future
of the century-old auto industry.
By Mark Boyadjis

IHS Quarterly | Q4-2014 | 63
Sh
uttersto
ck
Tesla Motors: A case study in disruptive innovationTesla is no ordinary car company. To find out just how di®erent it is, the IHS
Technology Teardown Team took apart a 2013 Tesla Model S. What they found
were systems and components unique in the auto industry—some would call
them radical. But Tesla’s disruptive influence is more than semiconductors,
screens, and software. It’s about a new vision for the car, innovative
design, and new models for manufacturing. And it’s shaping the future
of the century-old auto industry.
By Mark Boyadjis
Francisco in just 35 minutes. Oddly, he has no interest in making the Hyperloop a reality but, rather, is putting his ideas out there for others to take and improve the human experience.
With Tesla, Musk is focused on disrupting mobility. As of mid-June 2014, the company has released all of its patent holdings, claiming that open-source innovation is more powerful than anything one company could do individually. While IP lawyers cringed, Wall Street applauded, sending Tesla’s stock price up 14% to $231 a share. This radical approach to innovation runs deep, as evidenced in the technology and design approach of the company’s flagship Model S, its $69,900 luxury car.
In August 2014, the IHS Technology Teardown Team purchased a used 2013 Model S and took it apart to see what made it tick. The team dismantled 12 systems and cataloged every part within each system. The teardown included both the electronics systems inside the car’s interior and the drivetrain (see sidebar “What’s inside the Model S?” on page 68).
Technical di¦erencesThe teardown confirmed that the Tesla Model S is unlike anything else on the road. A massive plot of real estate in the center stack is dedicated to a 17-inch touch screen infotainment system, which became—since its production launch in 2011—an instant industry benchmark for automotive display integration. There
64 | IHS Quarterly | Q4-2014
is room left for only two physical buttons on the console—one for the hazard lights and one for the glove compartment release (see sidebar below).
The technical specifications are impressive. The 17-inch screen is a Chi Mei Optoelectronics display with 1920 x 1200 WVGA resolution that includes a projected capacitive touch screen—the same technology employed in many smartphones and tablets. The system runs on a Linux-based operating system, o©ers Garmin navigation with Google Earth overlays, and computes at speeds still besting most other systems available today with its NVIDIA Tegra 3 processor combined with 2 GB of DDR3 SDRAM.
The system includes an embedded 3G modem from Sierra Wireless that runs broadband data o© AT&T’s network. It can receive software updates over the air and controls all of the functions of infotainment, audio, navigation, Bluetooth phone, HVAC, and even vehicle settings like windows, door locks, sunroof, trunk release, traction control, headlights, steering, and suspension settings.
In addition, a 12.3-inch fully digital instrument cluster sits directly in front of the driver with its own NVIDIA Tegra 2 processor, which it uses to handle the diverse array of graphics, content, and redundant outputs for the driver. About the only “familiar” driver components
are the steering wheel, pedals, and transmission shifter—the latter actually borrowed from the Mercedes-Benz parts bin.
Manufacturing di¦erencesThe system is clearly in a class of its own. However, with all of these high-end specifications, how can Tesla sell this as a standard feature in every Model S? More disruption.
The company chose to change up the supply chain and borrow from the electronic manufacturing services (EMS) model of production that is standard practice in the consumer electronics industry. In this respect, Tesla is closer to being a technology company than a traditional automobile maker.
We live in an era of smartphone ubiquity. So we are routinely disappointed when we get into our cars and are forced to make do with resistive touch screens (if we are lucky) or LEDs and vacuum fluorescent displays controlled by dials and buttons (if we are not). Tesla understands the importance of smartphone ubiquity to modern life, so it’s no accident the transition is seamless when one climbs into a Model S.
That is not the case with the majority of comparably priced vehicles from other auto manufacturers. Indeed, many of the recent automotive infotainment systems that the IHS Teardown Team has analyzed feature relatively small displays (typically 7-inch diagonal size or less) and low resolution (typically 800 x 480 WVGA or less).
Then there’s the touch technology. Many of the touch screens IHS tears down in automotive head units are using resistive technology. Combine these legacy technologies with often underpowered processing chips and proprietary software and you often end up with a user experience that is unfamiliar, not intuitive, and has a lot of “latency” issues (meaning it’s slow).
At the center of the dashboard in the 2013 Model S is the Tesla Premium Media Control Unit, which blows away all of the head units we have seen in specs, not to mention sheer size. The 17-inch diagonal display with touch screen makes for a very large assembly when removed from the dash. Inside the unit are many subassemblies, which are all modular, giving Tesla numerous design options for future models.
Several of the printed circuit board (PCB) assemblies, including the main assembly, feature Tesla Motors logos and copyrights, meaning that they are all designed and controlled by Tesla. In and of itself, this is unusual, as we find that most automotive OEMs entrust and outsource the bulk of their head unit designs to third parties such as Harman Automotive, Panasonic, Alpine, Denso, Pioneer, and others. Tesla is thus designing and controlling the bill of materials down to the component level. This is closer to Apple’s design-and-build model than it is to other automakers.
Such an approach a�ords Tesla leverage in the supply chain, more direct control over the finished product, and ultimately more control over the
Tesla’s user-experience focus sets it apart

IHS Quarterly | Q4-2014 | 65
Much like how Apple designs the iPhone and then employs Foxconn to build it, Tesla contracted with a leading EMS provider to build its center infotainment system, instrument cluster, and several other systems in the Model S. This model required Tesla to internalize much of the hardware and software development, as well as the systems integration work. Given that Tesla has hired its engineers from all over Silicon Valley and beyond, this was not a problem.
The Silicon Valley culture and the EMS approach to manufacturing were a clear advantage for Tesla at one time but no longer make it unique. The EMS model is expanding in the automotive industry, and
the likes of Compal, Flextronics, Foxconn, and Jabil are working with brands including Chrysler, Daimler, Ford, General Motors (GM), Jaguar, and Volkswagen.
However, the transition to the EMS model can be problematic. Ford outsourced the entire infotainment architecture for the development and deployment of MyFord Touch in 2011 to an EMS provider. The initial system had technical software problems that required Ford to issue several software upgrades. This cost tens of millions of dollars, contributed to a poor customer experience, and caused perception problems for Ford, from which the company has only recently recovered.
user experience. It also gives Tesla a potential performance and technology edge that others might find difficult to quickly emulate, as so much of the design is done in-house at Tesla rather than by the head unit suppliers.
Many other PCB assemblies are modular and come from third parties, such as the processing PCB, which is a turnkey solution from NVIDIA, and the air interface module, which is from Sierra Wireless.
All told, there are 10 PCB assemblies in Tesla’s media control unit. The modularity of this design is not unusual for automotive electronic systems and allows Tesla many options. If Tesla wants to upgrade the processing power or change the air interface module, it may be possible to achieve this more easily and with less redesign than if all of the functions were integrated into fewer PCB assemblies. In this sense, modularity of design, rather than aggressive integration, has always been an automotive electronic standard. Not only does modularity give automotive designers many upgrade options, it improves reparability.
Andrew Rassweiler
The center console of the Tesla Model S is dominated by
a 17-inch touch screen infotainment system, which is an
industry benchmark for automotive display integration. IHS
66 | IHS Quarterly | Q4-2014
Development di¦erencesIn the last decade, virtually every automaker has relocated portions of vehicle and vehicle technology development to new R&D facilities in the San Francisco-to-San Jose tech corridor. In fact, some early innovators predate Tesla: BMW, Daimler, and Volkswagen set up shop in the Valley in the mid-1990s, and Honda opened its first o¡ce in 2003, the same year Tesla was founded.
The reasons for doing so now go beyond manufacturing. Automotive OEMs are co-locating with the likes of Apple, Cisco, Facebook, Google, HP, Intel, NVIDIA, and Oracle to help speed the pace of innovation. This involves accelerating the pace of hardware, software, services, and applications development but also rethinking the process of design.
The development speed of a typical mobile device is often six months or less. Compare that with the design-to-production timing for a new vehicle of approximately four years and it’s no wonder car-buying consumers have been underwhelmed by standard in-vehicle electronics. Even today, consumers can find navigation and infotainment systems designed in 2008 for sale in model-year (MY) 2014 vehicles. To give an idea of how ancient that is in “tech-years,” BlackBerry held more than 50% market share among smartphone users in 2008. Remember BlackBerry?
Tesla has had a competitive advantage over auto industry rivals in design innovation since day one. Located in arguably the center of the world for technological innovation, Tesla was able not only to construct its vision of mobility in Silicon Valley, but also recruit its employees from many of the leading technology companies to design and build the car there as well. All other OEMs grasping for automotive technology leadership had to learn the culture of
Silicon Valley, figure out how to adapt to it, and dissolve the century-old “way of doing things.” Tesla was born into it.
Service di¦erencesWith Tesla’s technology come some very important services. Perhaps at the top of the list is the convenience of over-the-air (OTA) software updates for vehicle recalls, which Tesla has made free and standard for Model S owners. This functionality has, in turn, created plenty of positive press for the company.
It all starts with the connection. The 3G connection in the Tesla infotainment system is already providing this solution via relatively old wireless technology. Since the modular and flexible hardware architecture of its infotainment system allows for mid-cycle technology enhancements, IHS expects Tesla will soon debut true 4G LTE connectivity in its vehicles. The added bandwidth will further enhance the OTA update service, as well as the rest of the services the Model S o©ers.
IHS forecasts a 60% global penetration rate on embedded cellular connections in cars by 2022, with 4G LTE bandwidth comprising roughly 60% of that market. GM and Audi have actually beaten Tesla to market on this specification as both OEMs already have 4G LTE cars on the road now.
One central purpose of this mass-market vehicle broadband adoption is to accommodate FOTA (firmware over the air) and SOTA (software over the air). Tesla has already deployed this function in part because it allows the company to provide vehicle service without needing to charge (or possibly pay) for service bay labor.
Consider Tesla’s recall of the Model S for overheating charger plugs in January 2014. The day the recall notice came out, Tesla had all 29,222 Model S vehicles updated wirelessly and running the new safer version of the software. Ironically, around the same time, GM had a similar fire-related safety recall issued that also required a software update. Despite all of its vehicles having standard OnStar telematics, owners were required to take their cars into a dealership for the software update, costing GM a warranty labor expense on all 370,000 recall service appointments.
Volume aside, Tesla paid much less on a per-vehicle basis than GM, simply by providing a software update procedure that has been on personal computers for
The day Tesla sent out the recall notice for overheating charger plugs, all 29,222 Model S vehicles were updated wirelessly and running the new safer version of the software.

IHS Quarterly | Q4-2014 | 67
more than two decades and mobile phones since before the BlackBerry.
IHS sees the OTA software trend continuing strongly. With vehicles like the new Mercedes-Benz S-Class claimed to have over 65 million lines of code—10 times that of the Boeing 767 Dreamliner—the automotive industry stands at a crossroads. Software recalls are about to become a major problem, one that will be expensive if this type of technology is not broadly deployed.
As of February 2014, over 530 software-related recalls had been reported since 1994 (see figure above). Among these, 75, or 14%, were issued for MY 2007 alone, with over 2.4 million vehicles a©ected. Numerous questions arise from the variation in volume by model year—not the least of which is, why have recalls for MY 2007 been so numerous? There are likely several reasons for this spike:
• MY 2007 had the last large-sales volume before the economic recession plunged US car purchases from approximately 16 million to 10 million in 2010.
• Many new electronics systems were added in MY 2007 for infotainment, advanced driver assistance systems, and core auto control systems, which increased the amount of software in the typical car.
• MY 2007 involved recalls of 75 vehicles, the most of any model year. Many automotive OEMs had multiple model recalls with software updates. Toyota had especially high recall rates that included software updates.
It is in this context that IHS expects FOTA and SOTA to be enabled in over 22 million vehicles sold worldwide in 2020 alone, growing from approximately 200,000 vehicles in 2015. Major deployment will begin in 2017. In the meantime, Tesla will continue to leverage its first-to-market status with FOTA and SOTA to help lower overall costs to the end user and improve unit margins on each additional Model S sold.
Powertrain di¦erencesThe heart of Tesla’s Model S is its electric propulsion system, which includes a battery, motor, drive
inverter, and gearbox. The battery is a microprocessor-controlled lithium-ion unit available in two sizes; spending more buys more range and more power. The induction motor is a three-phase, four-pole AC unit with copper rotor. The drive inverter has variable-frequency drive and regenerative braking system, while the gearbox is a single-speed fixed gear with a 9.73:1 reduction ratio. The battery of each Model S is charged with a high-current power inlet, and each vehicle comes with a single 10kW charger and mobile connector with adapters for 110-volt and 240-volt outlets as well as a public charging station adapter.
This powertrain package allows Tesla to deliver a longer driving range than any other EV maker—about 200 miles versus just under 100—plus acceleration and driving performance similar to or better than a traditional gasoline-powered vehicle. While several automakers o©er EV powertrains—Nissan’s Leaf and Chevrolet’s Volt, for example—none matches Tesla’s commitment to EV development. And as a
Vehicle software recalls are on the rise
Software-related recalls in the US from 1994 through February 2014 by model year measured in volume of a�ected vehicles in millions (left axis) and number of software-related recalls by model year (right axis).
0.0
0.5
1.0
1.5
2.0
2.5
20142013201220112010200920082007200620052004200320022001200094-990
20
40
60
80
100
Source: IHS and the US National Highway Traffic Safety Administration
Number of vehicles in millions a�ected by software recalls
Number of software recalls

clean slate company, Tesla has had the advantage of developing an entirely new powertrain and supply chain without the hindrance of existing dealerships, physical plants, or inventory.
Other EV products use lithium-ion batteries, but in lower kWh and using fewer, but larger, battery cells. For example, the Nissan Leaf uses a 24kWh battery, with 192 cells and EPA-estimated range of 84 miles. The Model S’ 85kWh battery has more than 7,100 cells, allowing it to move greater weight faster and with longer range.
To address range anxiety, Tesla has invested in developing charging stations in North America (124 to date, according to the Tesla website), Europe (82), and Asia (29). In 2013, Tesla announced it was also developing battery-swap stations, separate from charging stations. However, the service was never introduced, due in part to a lack of interest by owners. In November 2014, Tesla revealed the first swap station may go online in California by year’s end.
Tesla is working to drive battery costs down in anticipation of the launch of its mass-market, $35,000 Model 3 EV sedan, which is slated to debut in 2017. To that end, the company recently announced a new $5 billion “gigafactory” battery plant in Nevada in partnership with Panasonic. It will reportedly handle all elements of battery cell production, from raw material to battery pack, rather than only battery pack assembly. And Tesla intends to sell its OEM batteries for non-automotive applications, which will enable it to increase production volume and reduce unit cost.
What does the future hold?Tesla Motors has accomplished much in just over 10 years:
• Created a fun-to-drive electric roadster. Check. • Leveraged the lessons to scale-up to a full-luxury
sedan. Check. • Disrupted the luxury car market and, according to
IHS Automotive data, attracted “conquest” buyers from the likes of BMW, Mercedes, and Lexus, not to mention Toyota and other volume brands. Check.
• Diverged from entrenched supply chains to develop technology in-house and lowered per-unit development costs for an industry-leading infotainment platform. Check.
• Addressed a software-related vehicle safety recall in one day for almost 30,000 cars. Check.
68 | IHS Quarterly | Q4-2014
In August 2014, IHS bought a second-hand 2013 Tesla Model S. The Los Angeles-based IHS Technology Teardown Team set to work pulling it apart to examine all primary systems inside the car. The team has cataloged every component and developed a detailed bill of materials for each system that includes the technical specifications, cost, and manufacturers of the components. In addition, the team estimated the labor and manufacturing cost of each system.
The 12 systems analyzed by the IHS Teardown Team comprised the following:
1. Premium Media Control Unit
2. Instrument Cluster
3. EV Inlet Assembly
4. High-Voltage Junction Box
5. Battery Charger
6. HVAC Controller
7. Thermal Controller
8. Liftgate Left Hand Taillight
9. Power Liftgate Module
10. Body Control Unit
11. Sunroof Control Unit
12. Passive Safety Restraints Control Module
Andrew Rassweiler
What’s inside the Model S?

IHS Quarterly | Q4-2014 | 69
• Created a company destined to influence the industry as a whole and did so while pleasing Wall Street. Check.
Tesla has established benchmarks for infotainment system hardware, software flexibility, and manufacturing supply chain. The company innovated powertrain design, which has proven both robust and viable for everyday use. And it has received plenty of accolades for aesthetic design from the automotive media. The result is that “made in Silicon Valley” is no longer roundly dismissed as an option for an automotive OEM.
So what’s next for Tesla? How does it maintain its leadership in technology development? Has it created a sustainable competitive advantage? Can it deliver on promises of a new luxury crossover with the Model X and a new high-volume EV competitor with the Model 3? Will Tesla be able to steal market share from not only luxury marques, but also from higher-volume brands?
Going forward, Tesla faces five distinct challenges:
Consumer demand. Perhaps the most significant is consumer acceptance of electric vehicles. In the first eight months of 2014, EVs accounted for only 0.7% of the 11.2 million light-vehicle sales in the US. Even Renault-Nissan CEO Carlos Ghosn, a staunch supporter of EVs, last year acknowledged Renault-Nissan would miss its original 2016 target of selling 1.5 million EVs by four to five years.
Dealerships and service. Today, Tesla’s direct-sales model is illegal in most US states. As Tesla
attempts to go mainstream, it will need the legal restrictions lifted or be forced to adjust its model. Further, as vehicles age and the numbers sold increase, there will be maintenance issues that cannot be handled by OTA software updates. Tesla will need to build out an after-sales service network that is robust enough to handle the demand.
Marketing. To date, demand for the Model S exceeds supply. But as the company targets the mass market with the Model 3 and aims for 500,000 units sold in 2020, it will need to beef up its marketing. Tesla’s Apple Genius-bar-inspired dealership model has worked for the a¸uent early adopters, but can it be scaled up to meet its sales targets?
According to IHS registration data, 51.8% of all Tesla buyers have annual household incomes over $150,000. By comparison, the percentage of Chevrolet Malibu buyers with a household income higher than $150,000 is only 6.5%. Tesla will need to create a marketing strategy that targets economy-car consumers, who are notably di©erent than those who buy the $80,000 to $100,000 Model S.
Production. Boosting output will likely mean growing pains for Tesla as it transitions to a high-volume production model. How the company manages the transition will determine Tesla’s near-term future. Of course, many automakers have had di¡culties ramping up new plants or launches and yet overcome the challenges in the longer term. While growing pains are to be expected, there is no reason to believe Tesla does
not have the capacity to become a volume manufacturer.
Innovation. Tesla has already made a name for itself around technology adoption and innovation. But it will be challenged, as all first movers are, to maintain that lead and continue to push the boundaries with future products. Assuming the gigafactory and its supply chain allow Tesla to make a mass-market o©ering and keep its infotainment stack as an industry benchmark, the company’s next move will be automated driving. Musk has already stated that Tesla will “hit the market” by 2017 with a partially self-driving vehicle. With many other OEMs targeting this time frame as well, Tesla might not be as disruptive in automated driving as it has been in infotainment design and sustainable mobility.
But then again, it might surprise the market and break loose another game-changing product or technology before the rest of the automotive industry is ready—because that’s how Silicon Valley works.
Mark Boyadjis is senior analyst, infotainment and human-machine interface, IHS Automotive
Andrew Rassweiler, senior director, Teardown Services, IHS Technology, and Stephanie Brinley, senior analyst, Americas, IHS Automotive, contributed to this article
bit.ly/MarkBoyadjis bit.ly/AndrewRassweiler
bit.ly/StephanieBrinley
For more information, visitihs.com/Q14TeslaTeardownand ihs.com/Q14AutoEV
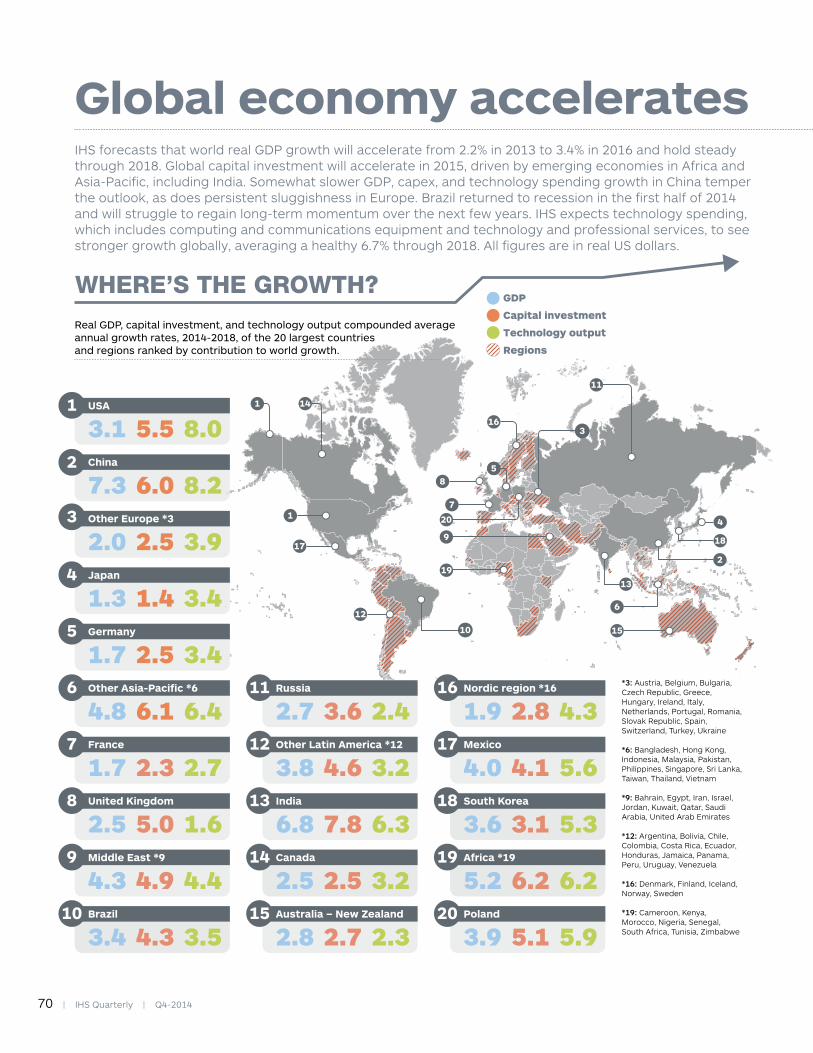
70 | IHS Quarterly | Q4-2014
Global economy accelerates IHS forecasts that world real GDP growth will accelerate from 2.2% in 2013 to 3.4% in 2016 and hold steady through 2018. Global capital investment will accelerate in 2015, driven by emerging economies in Africa and Asia-Pacific, including India. Somewhat slower GDP, capex, and technology spending growth in China temper the outlook, as does persistent sluggishness in Europe. Brazil returned to recession in the first half of 2014 and will struggle to regain long-term momentum over the next few years. IHS expects technology spending, which includes computing and communications equipment and technology and professional services, to see stronger growth globally, averaging a healthy 6.7% through 2018. All figures are in real US dollars.
OUTLOOK
4
2
5
11
5
16
1 14
1
17 18
7
8
9
19
20
10
13
126
15
3
0.0
0.5
1.0
1.5
2.0
2.5
3.0
3.5
201820172016201520142013
Annual growth rate (%) 2013-2018
Global GDP continues to rebound Capital Investment growth peaks in 2016
0
1
2
3
4
5
201820172016201520142013
Annual growth rate (%) 2013-2018
3.1 5.5 8.0USA
7.3 6.0 8.2China
2.0 2.5 3.9Other Europe *3
1.3 1.4 3.4Japan
1.7 2.5 3.4Germany
4.8 6.1 6.4Other Asia-Pacific *6
1.7 2.3 2.7France
2.5 5.0 1.6United Kingdom
4.3 4.9 4.4Middle East *9
3.4 4.3 3.5Brazil
1
2
3
4
5
6
7
8
9
10
2.7 3.6 2.4Russia
3.8 4.6 3.2Other Latin America *12
6.8 7.8 6.3India
11
12
13
2.5 2.5 3.2Canada14
2.8 2.7 2.3Australia – New Zealand15
5.2 6.2 6.2Africa *1919
3.9 5.1 5.9Poland20
1.9 2.8 4.3Nordic region *16
4.0 4.1 5.6Mexico
3.6 3.1 5.3South Korea
16
17
18
*3: Austria, Belgium, Bulgaria, Czech Republic, Greece, Hungary, Ireland, Italy, Netherlands, Portugal, Romania, Slovak Republic, Spain, Switzerland, Turkey, Ukraine
*6: Bangladesh, Hong Kong, Indonesia, Malaysia, Pakistan, Philippines, Singapore, Sri Lanka, Taiwan, Thailand, Vietnam
*9: Bahrain, Egypt, Iran, Israel, Jordan, Kuwait, Qatar, Saudi Arabia, United Arab Emirates
*12: Argentina, Bolivia, Chile, Colombia, Costa Rica, Ecuador, Honduras, Jamaica, Panama, Peru, Uruguay, Venezuela
*16: Denmark, Finland, Iceland, Norway, Sweden
*19: Cameroon, Kenya, Morocco, Nigeria, Senegal, South Africa, Tunisia, Zimbabwe
Annual growth rate (%) 2008-2018
Technology sales growth strengthens in 2014 to 7.1% and holds steady through 2018
Source: IHS
-10
-5
0
5
10
15
20
20182017201620152014201320122011201020092008
2014
$55.57 $63.37 $12.87 $15.36 $3.17 $4.11
2018 2014 2018
GDPUSD trillions
Capital investmentUSD trillions
Technology salesUSD trillions
2014 20182014
$7.80 $0.94$2.49
Real GDP, capital investment, and technology output compounded average annual growth rates, 2014-2018, of the 20 largest countries and regions ranked by contribution to world growth.
WHERE’S THE GROWTH?GDP
Capital investment
Technology output
Regions
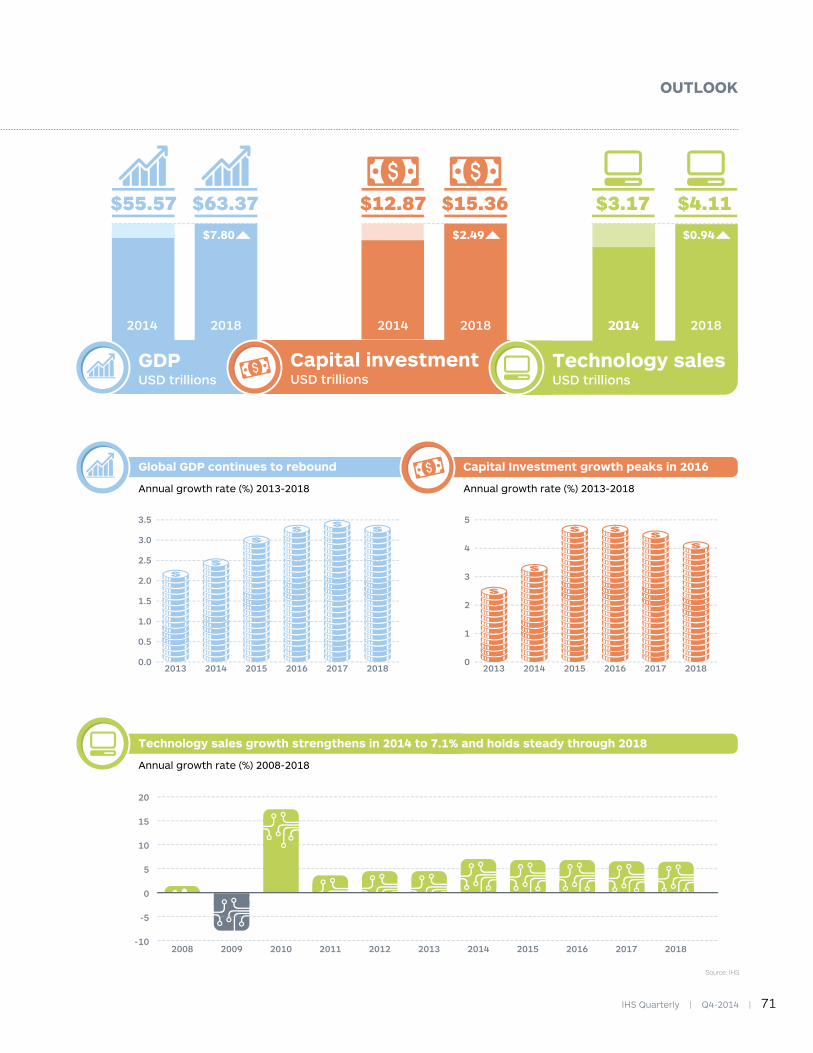
IHS Quarterly | Q4-2014 | 71
Global economy accelerates IHS forecasts that world real GDP growth will accelerate from 2.2% in 2013 to 3.4% in 2016 and hold steady through 2018. Global capital investment will accelerate in 2015, driven by emerging economies in Africa and Asia-Pacific, including India. Somewhat slower GDP, capex, and technology spending growth in China temper the outlook, as does persistent sluggishness in Europe. Brazil returned to recession in the first half of 2014 and will struggle to regain long-term momentum over the next few years. IHS expects technology spending, which includes computing and communications equipment and technology and professional services, to see stronger growth globally, averaging a healthy 6.7% through 2018. All figures are in real US dollars.
OUTLOOK
4
2
5
11
5
16
1 14
1
17 18
7
8
9
19
20
10
13
126
15
3
0.0
0.5
1.0
1.5
2.0
2.5
3.0
3.5
201820172016201520142013
Annual growth rate (%) 2013-2018
Global GDP continues to rebound Capital Investment growth peaks in 2016
0
1
2
3
4
5
201820172016201520142013
Annual growth rate (%) 2013-2018
3.1 5.5 8.0USA
7.3 6.0 8.2China
2.0 2.5 3.9Other Europe *3
1.3 1.4 3.4Japan
1.7 2.5 3.4Germany
4.8 6.1 6.4Other Asia-Pacific *6
1.7 2.3 2.7France
2.5 5.0 1.6United Kingdom
4.3 4.9 4.4Middle East *9
3.4 4.3 3.5Brazil
1
2
3
4
5
6
7
8
9
10
2.7 3.6 2.4Russia
3.8 4.6 3.2Other Latin America *12
6.8 7.8 6.3India
11
12
13
2.5 2.5 3.2Canada14
2.8 2.7 2.3Australia – New Zealand15
5.2 6.2 6.2Africa *1919
3.9 5.1 5.9Poland20
1.9 2.8 4.3Nordic region *16
4.0 4.1 5.6Mexico
3.6 3.1 5.3South Korea
16
17
18
*3: Austria, Belgium, Bulgaria, Czech Republic, Greece, Hungary, Ireland, Italy, Netherlands, Portugal, Romania, Slovak Republic, Spain, Switzerland, Turkey, Ukraine
*6: Bangladesh, Hong Kong, Indonesia, Malaysia, Pakistan, Philippines, Singapore, Sri Lanka, Taiwan, Thailand, Vietnam
*9: Bahrain, Egypt, Iran, Israel, Jordan, Kuwait, Qatar, Saudi Arabia, United Arab Emirates
*12: Argentina, Bolivia, Chile, Colombia, Costa Rica, Ecuador, Honduras, Jamaica, Panama, Peru, Uruguay, Venezuela
*16: Denmark, Finland, Iceland, Norway, Sweden
*19: Cameroon, Kenya, Morocco, Nigeria, Senegal, South Africa, Tunisia, Zimbabwe
Annual growth rate (%) 2008-2018
Technology sales growth strengthens in 2014 to 7.1% and holds steady through 2018
Source: IHS
-10
-5
0
5
10
15
20
20182017201620152014201320122011201020092008
2014
$55.57 $63.37 $12.87 $15.36 $3.17 $4.11
2018 2014 2018
GDPUSD trillions
Capital investmentUSD trillions
Technology salesUSD trillions
2014 20182014
$7.80 $0.94$2.49
Real GDP, capital investment, and technology output compounded average annual growth rates, 2014-2018, of the 20 largest countries and regions ranked by contribution to world growth.
WHERE’S THE GROWTH?GDP
Capital investment
Technology output
Regions

72 | IHS Quarterly | Q4-2014
NUMBERS
100Number of times stronger graphene is than steel
70%
579Projected percent growth in China’s demand for the three basic chemicals between 2000 and 2020
Proportion of the world’s plastic scrap that China imported prior to its “Green Fence Initiative”
29,222Number of Tesla Model S vehicles that were updated wirelessly the same day as its recall for overheating charger plugs
$94 billionDefense o¦set obligations expected to be negotiated between 2012 and 2022
1,500India’s annual GDP per capita in USD, less than one-quarter that of China

IHS Quarterly | Q4-2014 | 73
Sour
ce: I
HS
78 Percentage increase in global demand for natural gas by 2040, according to the IHS Rivalry scenario
Amount by which the global fish catch has increased since 1950, according to the UN Food and Agriculture Organization5x
3.5
millionNumber of tweets IHS analyzed after Turkey’s anti-government protests in May and June of 2013
900%Increase in the value of Vietnam’s merchandise exports since 2000
2/3Proportion of the world’s nations with child-bearing rates below or approaching the replacement level of 2.1 children per woman

74 | IHS Quarterly | Q4-2014
SPOTLIGHT
Life in the very fast lane
“I remember when…” This well-worn phrase used to refer to an event from past decades, but today it as often alludes to something from last year or last month. Such is the ever-increasing speed of technological change. Consider the introduction of smartphones. Scarcely a decade on, they have reshaped modern communications. Similarly today’s nascent technologies—the Cloud, the Internet of Things, nanotechnology, 3D printing—will shape our world in ways we cannot fully imagine.
Technology drives innovation, from the atomic level to issues that shape civilizations—transforming our world at an accelerating rate. Many business, service, educational, environmental, and ecosystem models that drive major industries today didn’t exist five years ago. For example, media and communications platforms are revolutionizing the education of the next generation of students—and not just those in advanced economies. As a©ordable smart devices replace slide rules, the internet supersedes encyclopedias, and e-learning becomes an alternative to university, the economics of technology are transferring knowledge and power into the hands of people across the developing world. It is a great equalizer.
Technology’s profound impact goes far beyond education, of course. Semiconductors, as the building blocks of the digital age, are essential to the functioning of modern industry and business—from computers and electronics, to cars and planes, health care diagnostic equipment, and modern defense systems. In a classic “butterfly e©ect,” this most basic technology, the chip, has created the platform upon which countless other value-added technologies have been built. And to think, Texas Instruments introduced the first integrated circuit just 55 years ago.
Beyond revolutionizing industry, technology is now reshaping how we discover, experience, and maintain both personal and business relationships. Think of Facebook, Twitter, and Linked In. Online databases and tools now permit building a map of one’s family tree dating back centuries. Of course, in the midst of this exciting new world, we face new threats. Headlines remind us daily of the ongoing battle to protect privacy, identity, and financial data. Hence, the growing need for modern versions of Defense Against the Dark Arts (thanks, Harry Potter).
With in-depth research and analysis of technologies and their impact across every major industry segment and around the world, IHS enables companies to be proactive in shaping the future amid these most exciting, complex, and challenging times.
bit.ly/DaleFord
Dale Ford Vice President, IHS Technology

IHS FORUM 2015
IHS.com/2015IHSForums
Three days and endless
opportunities to connect
with your peers and industry
thought leaders from adjacent
industries to learn, share, and
gain a deeper understanding
of the risks and opportunities
that lie ahead.
TOKYO
March 4-6
PARIS
June 10-12
RIO DE JANEIRO
July 21-23
WASHINGTON, DC
November 11-13
ABU DHABI
October 5-7
GET CONNECTED
6932
-101
4PB

Industry information and expertise…
from raw materials to retail shelves
Every decision matters.
That’s why leaders rely on IHS to help them make the best choices.
As the premier provider of global market, industry, and technical expertise, we understand the rigor that goes into making decisions of great importance, guiding those who make them with thinking that matches the scope of their needs.
IHS…because decisions matter
6485
_09
14P
B