data management, curation, statistical analysis & display bob sinkovits afcs bioinformatics lab...
TRANSCRIPT
Data management, curation, statistical analysis & display
Bob SinkovitsAfCS Bioinformatics Lab
San Diego Supercomputer CenterUC San Diego
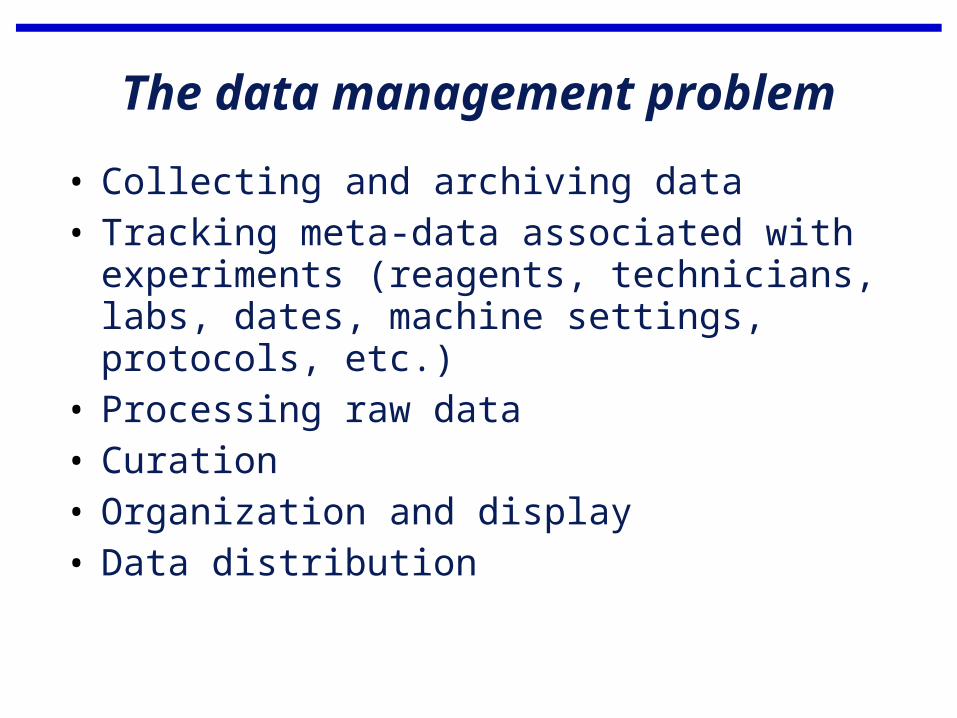
The data management problem
• Collecting and archiving data• Tracking meta-data associated with
experiments (reagents, technicians, labs, dates, machine settings, protocols, etc.)
• Processing raw data• Curation• Organization and display• Data distribution
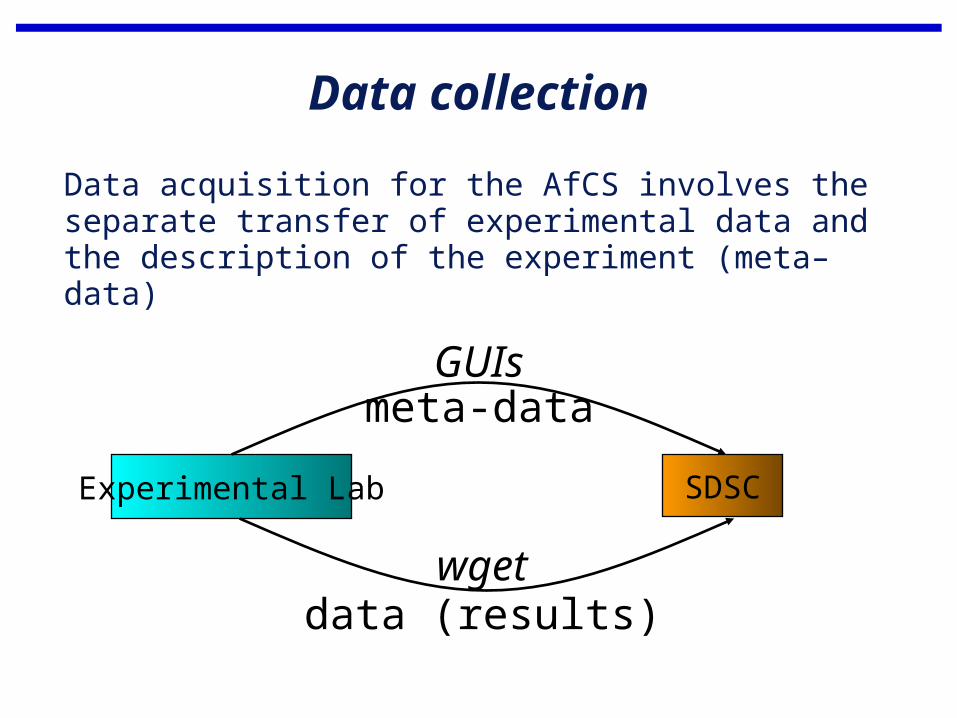
Data collection
Data acquisition for the AfCS involves the separate transfer of experimental data and the description of the experiment (meta–data)
SDSCExperimental Lab
GUIs
wgetdata (results)
meta-data
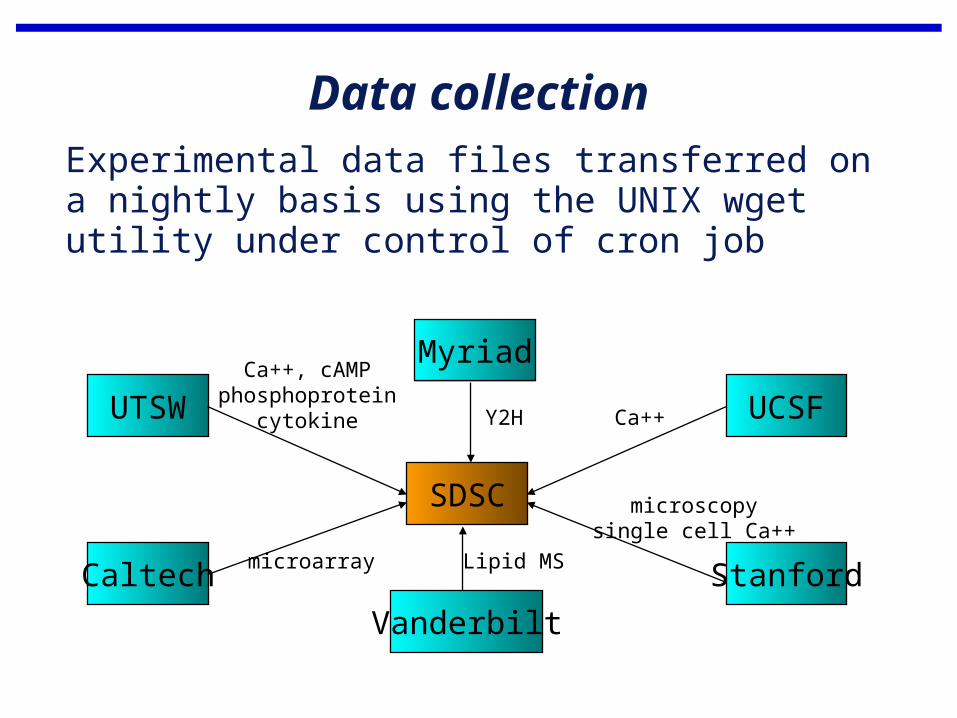
Data collectionExperimental data files transferred on a nightly basis using the UNIX wget utility under control of cron job
StanfordCaltech
SDSC
UTSW UCSFCa++, cAMP
phosphoproteincytokine
microarray
microscopysingle cell Ca++
Ca++
Vanderbilt
Lipid MS
Myriad
Y2H
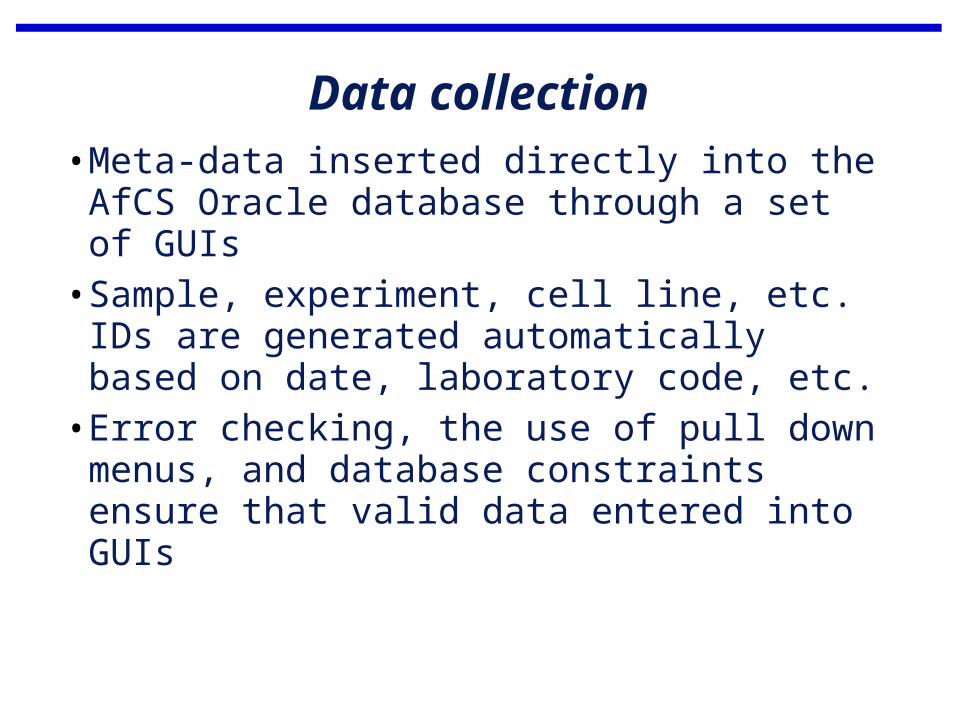
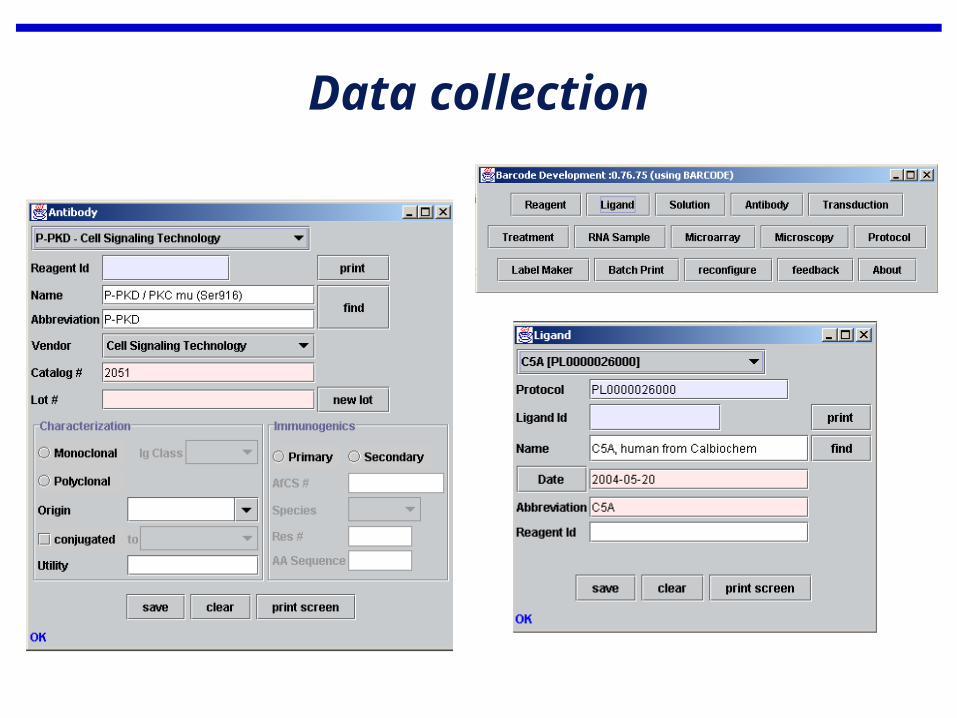
Data collection•Meta-data inserted directly into the AfCS Oracle database through a set of GUIs
•Sample, experiment, cell line, etc. IDs are generated automatically based on date, laboratory code, etc.
•Error checking, the use of pull down menus, and database constraints ensure that valid data entered into GUIs
Data collection
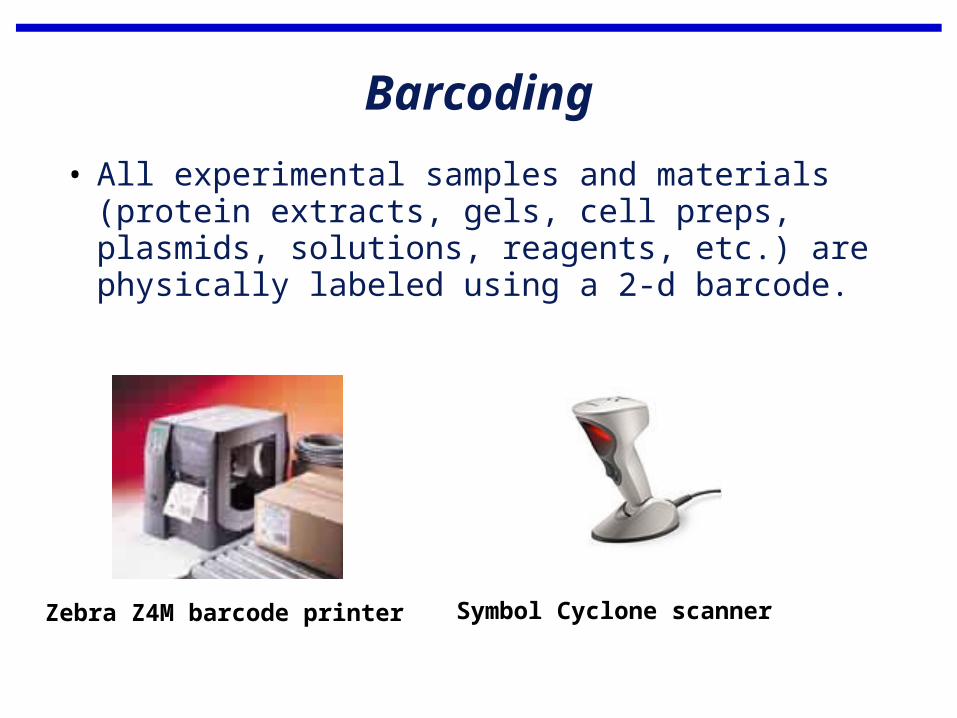
Barcoding
• All experimental samples and materials (protein extracts, gels, cell preps, plasmids, solutions, reagents, etc.) are physically labeled using a 2-d barcode.
Zebra Z4M barcode printer Symbol Cyclone scanner
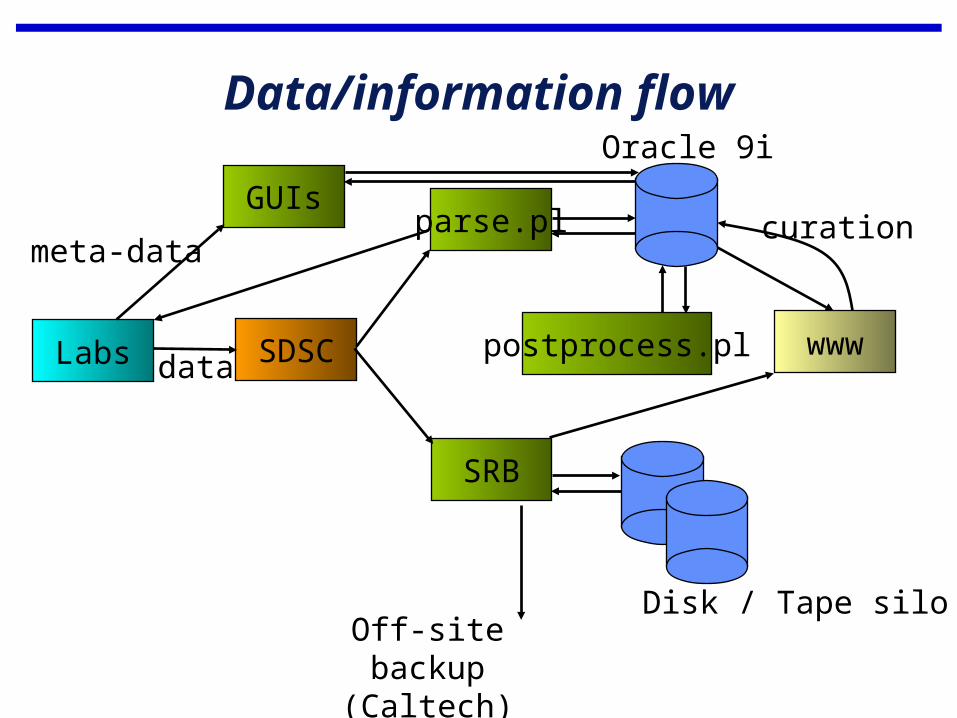
Data/information flow
Labs SDSC
parse.pl
SRB
Oracle 9i
Disk / Tape siloOff-site backup
(Caltech)
wwwpostprocess.pl
curationGUIs
data
meta-data
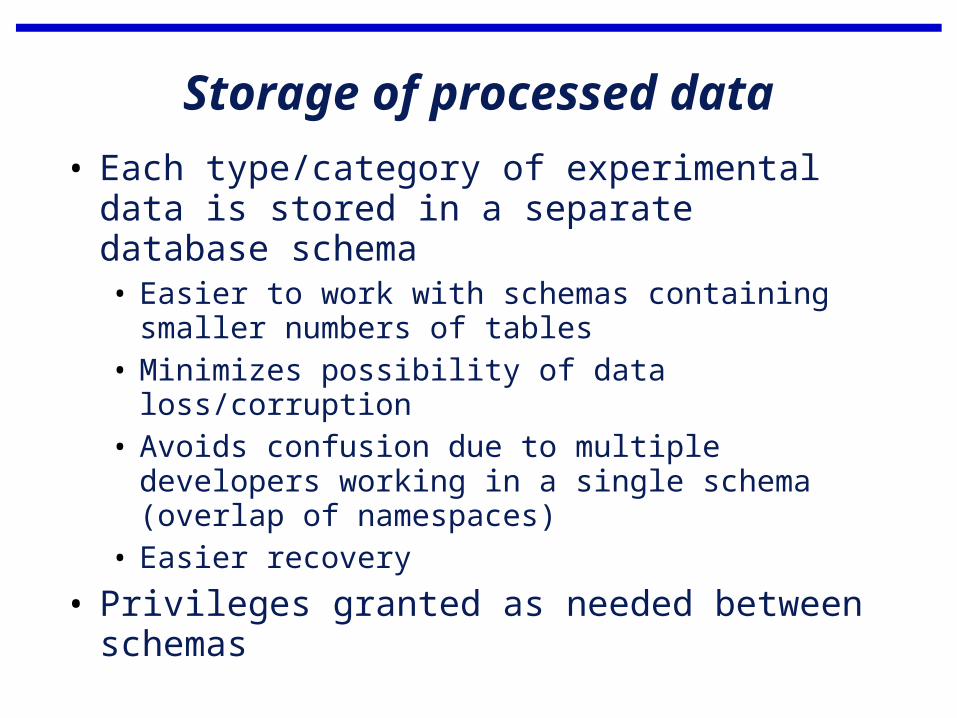
Storage of processed data
• Each type/category of experimental data is stored in a separate database schema• Easier to work with schemas containing
smaller numbers of tables• Minimizes possibility of data loss/corruption• Avoids confusion due to multiple developers
working in a single schema (overlap of namespaces)
• Easier recovery
• Privileges granted as needed between schemas
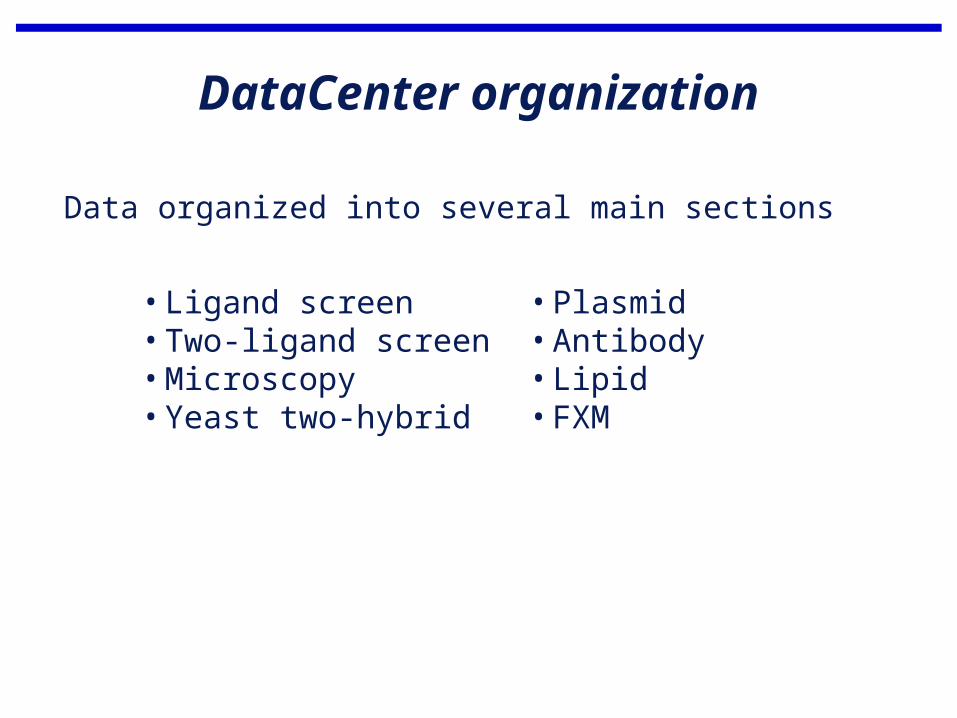
DataCenter organization
Data organized into several main sections
•Ligand screen•Two-ligand screen•Microscopy•Yeast two-hybrid
•Plasmid•Antibody•Lipid•FXM
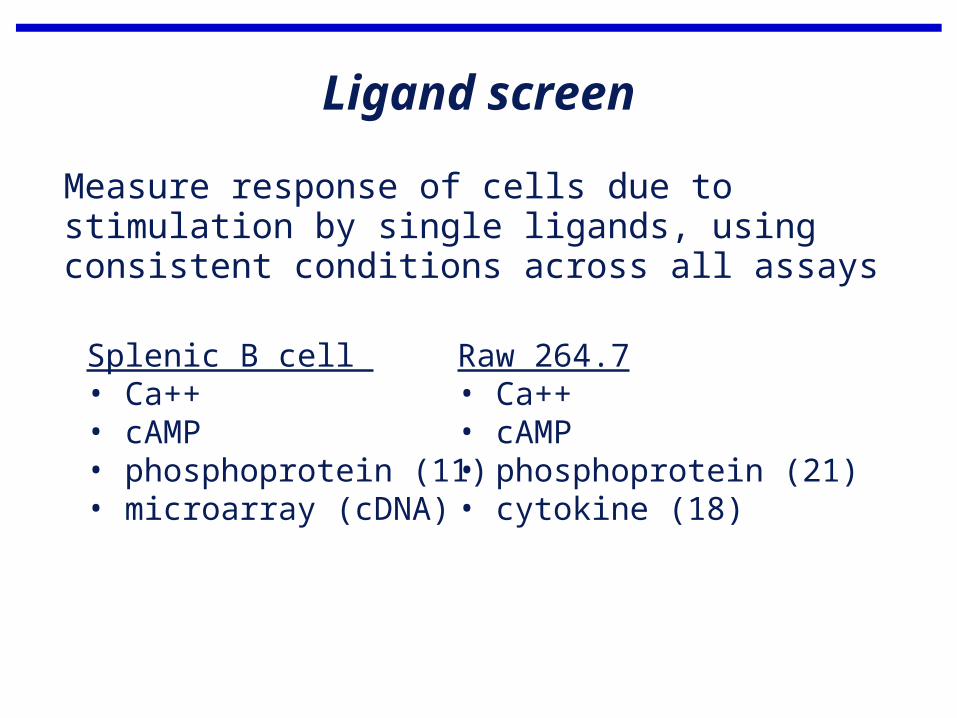
Ligand screen
Measure response of cells due to stimulation by single ligands, using consistent conditions across all assays
Splenic B cell • Ca++• cAMP• phosphoprotein (11)• microarray (cDNA)
Raw 264.7• Ca++• cAMP• phosphoprotein (21)• cytokine (18)
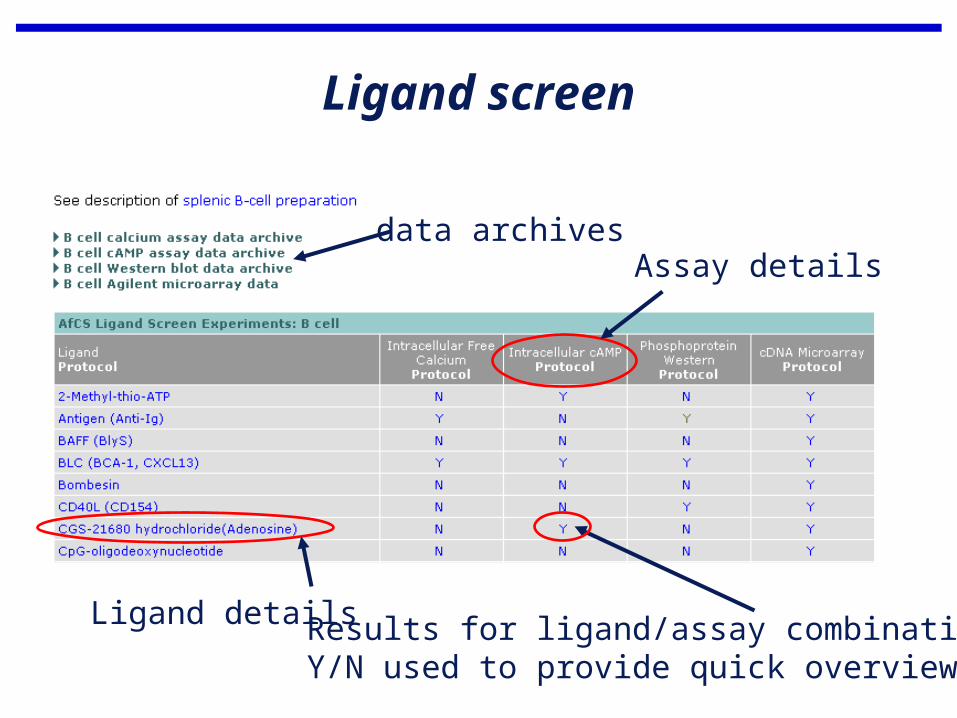
Ligand screen
data archives
Results for ligand/assay combinationY/N used to provide quick overview
Assay details
Ligand details
Ligand screen
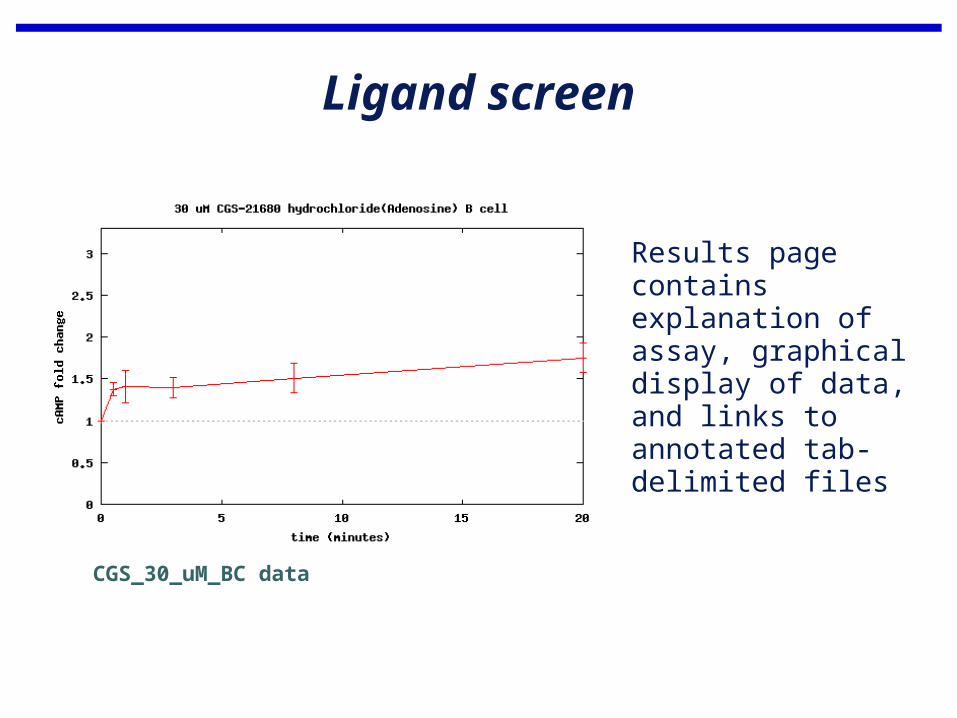
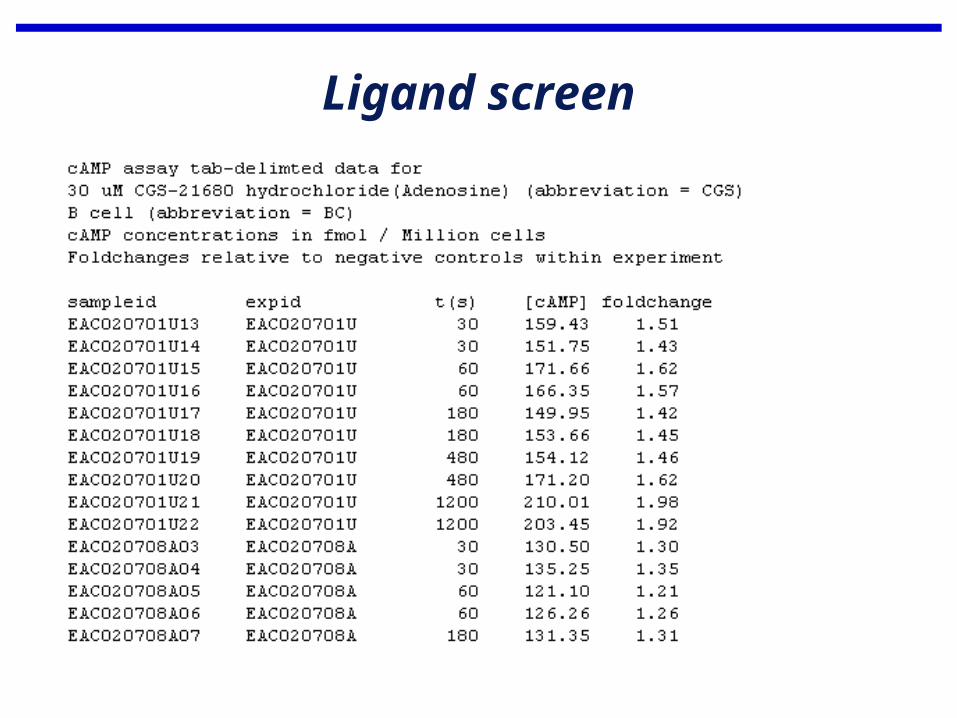
Results page contains explanation of assay, graphical display of data, and links to annotated tab-delimited files
CGS_30_uM_BC data
Ligand screen
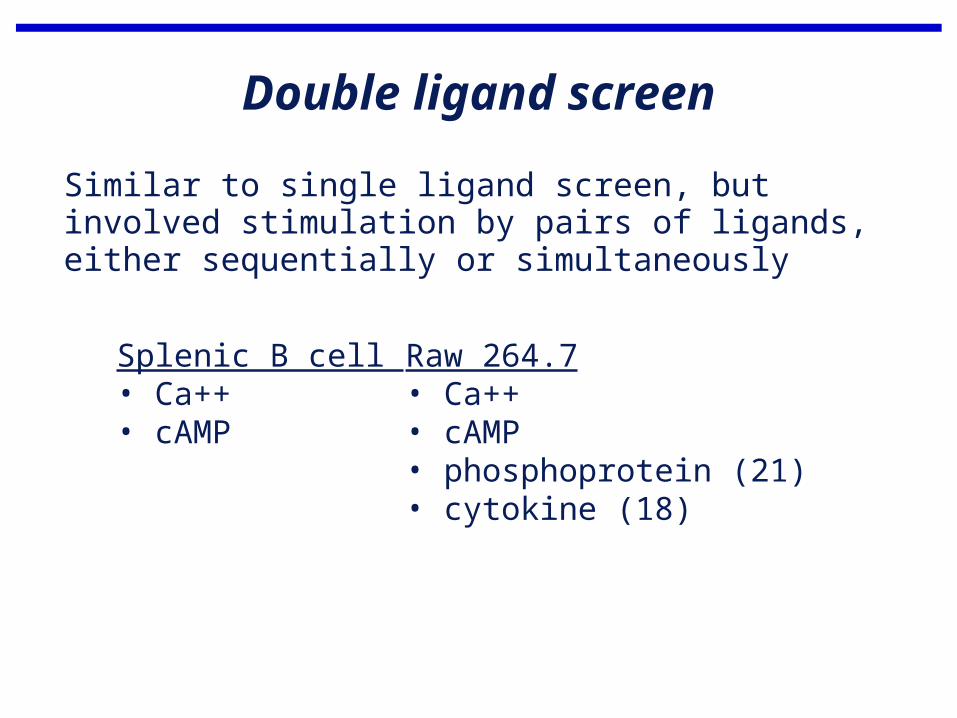
Double ligand screen
Similar to single ligand screen, but involved stimulation by pairs of ligands, either sequentially or simultaneously
Splenic B cell • Ca++• cAMP
Raw 264.7• Ca++• cAMP• phosphoprotein (21)• cytokine (18)
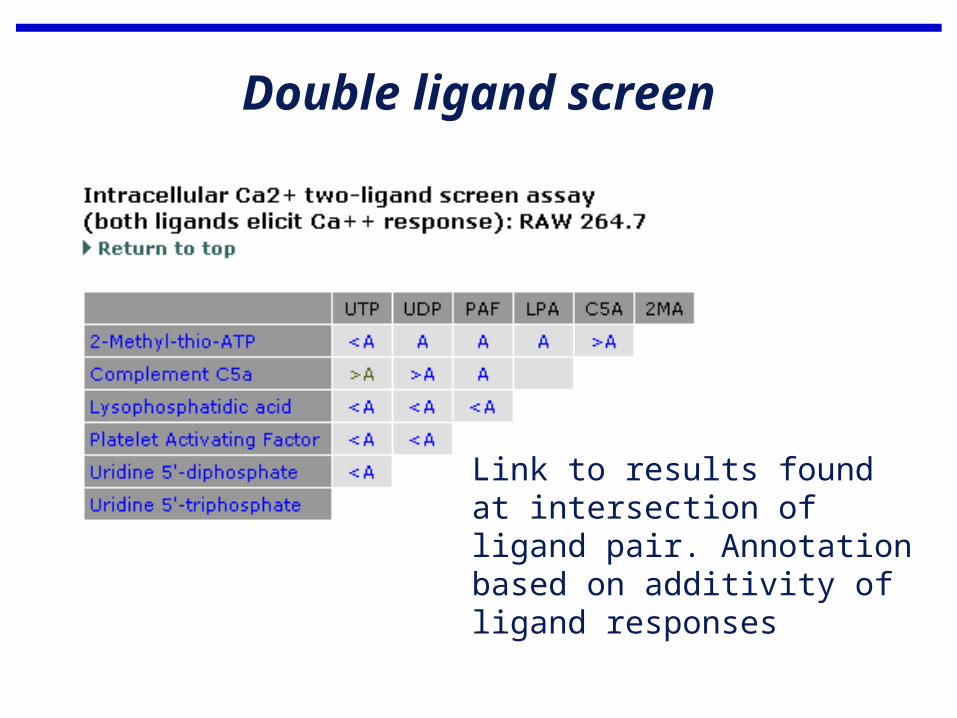
Double ligand screen
Link to results found at intersection of ligand pair. Annotation based on additivity of ligand responses
Double ligand screen
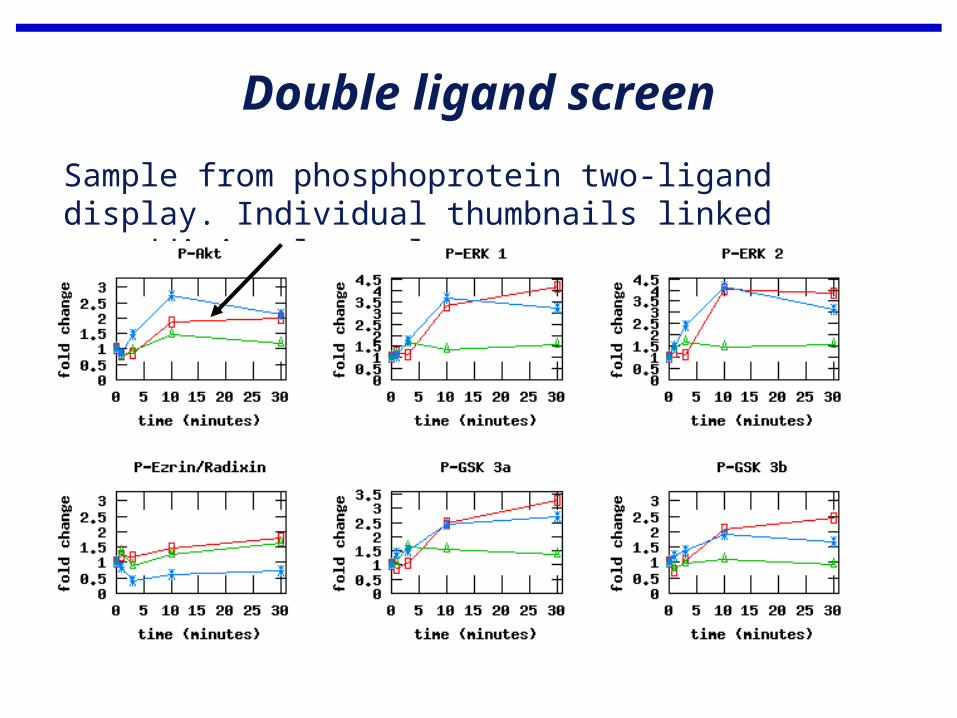
Sample from phosphoprotein two-ligand display. Individual thumbnails linked to additional results
Double ligand screen
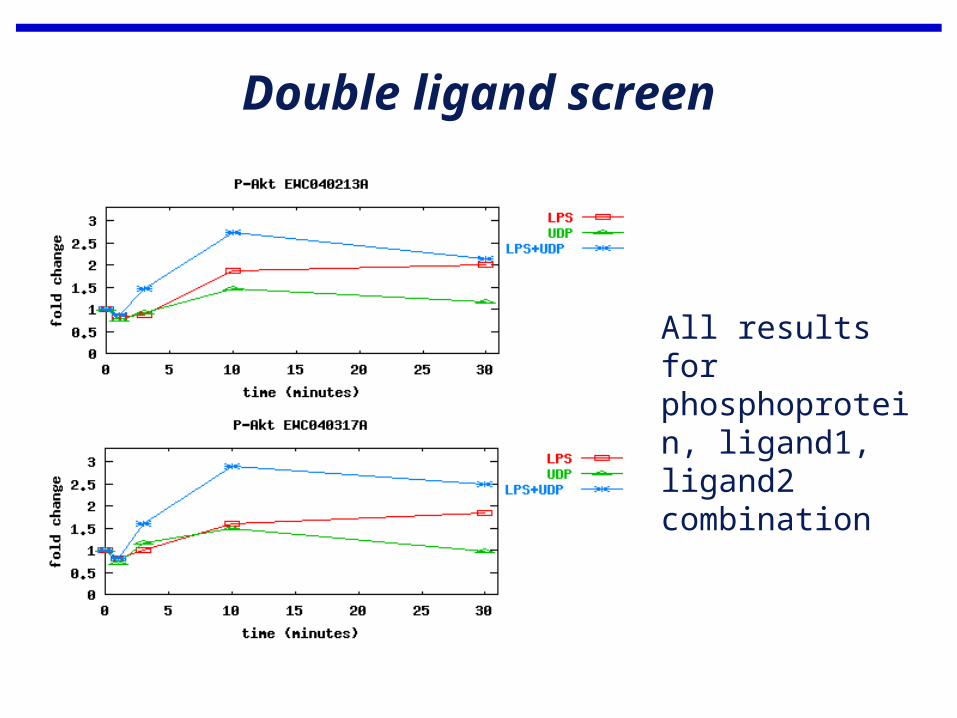
All results for phosphoprotein, ligand1, ligand2 combination
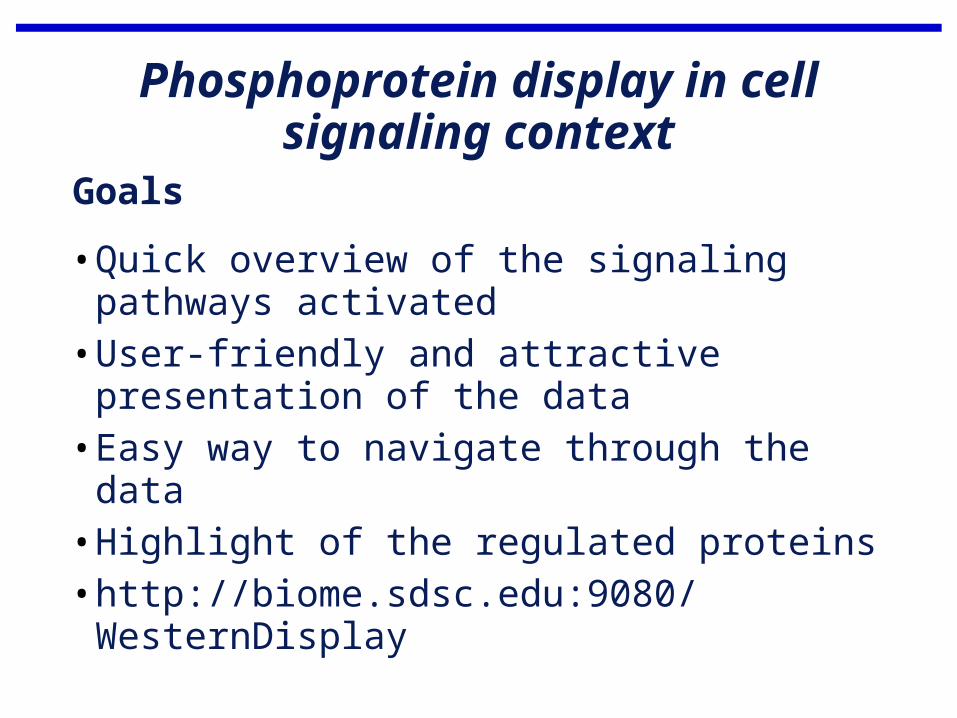
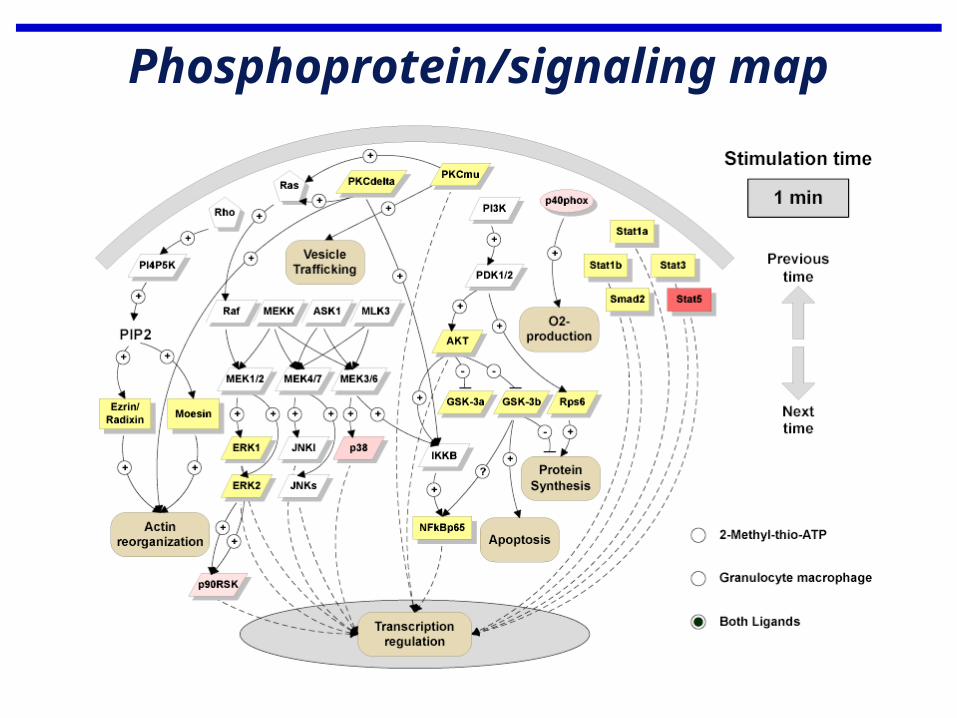
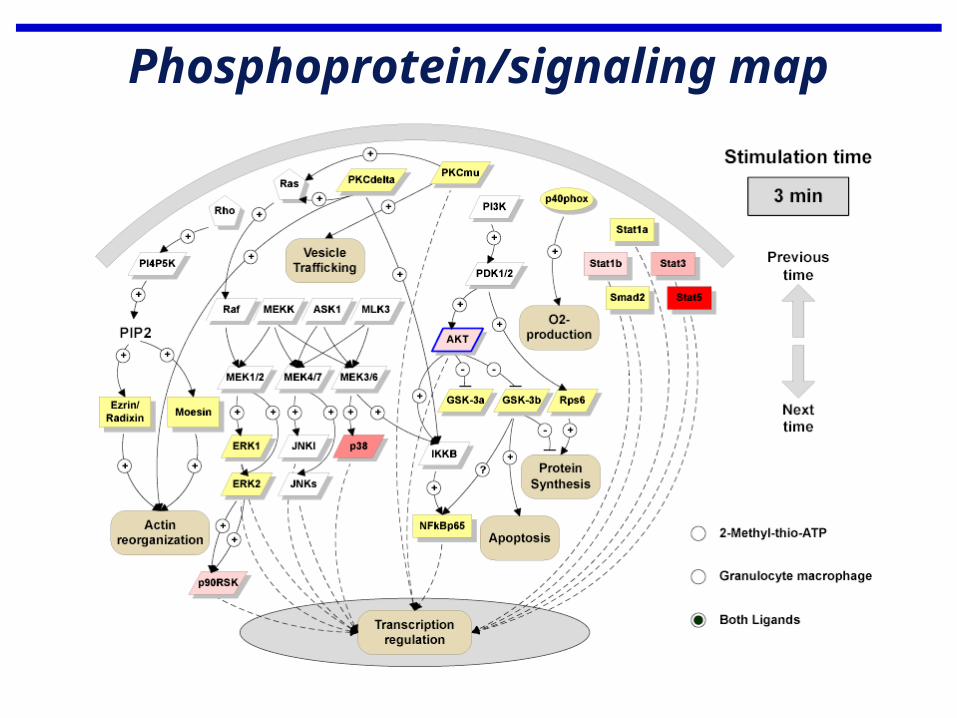
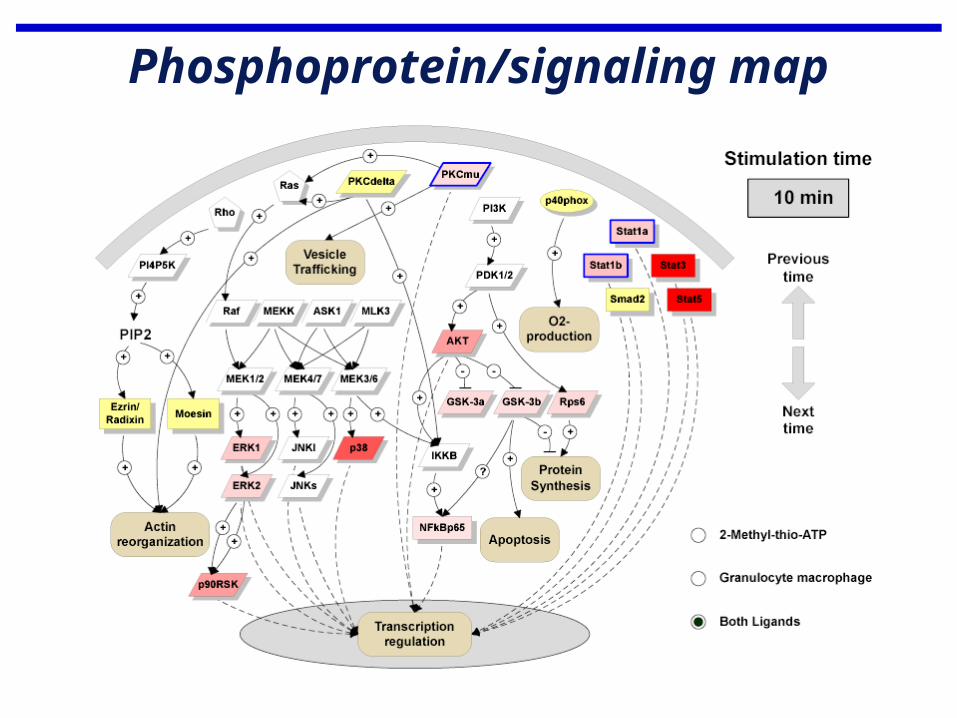
Phosphoprotein display in cell signaling context
•Quick overview of the signaling pathways activated
•User-friendly and attractive presentation of the data
•Easy way to navigate through the data•Highlight of the regulated proteins •http://biome.sdsc.edu:9080/
WesternDisplay
Goals
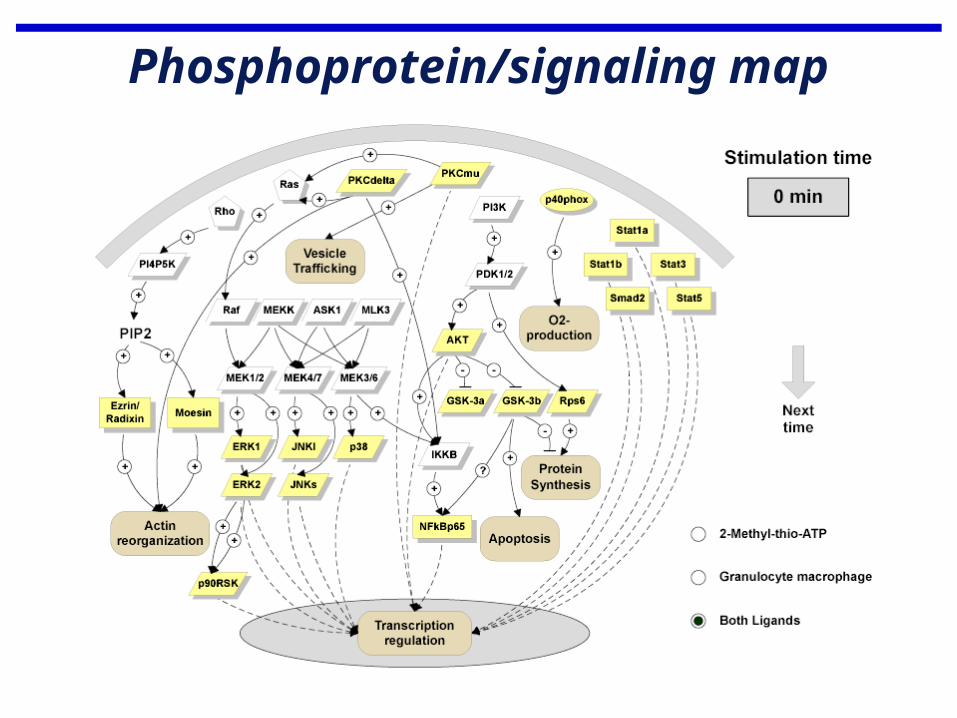
Phosphoprotein/signaling map
Phosphoprotein/signaling map
Phosphoprotein/signaling map
Phosphoprotein/signaling map
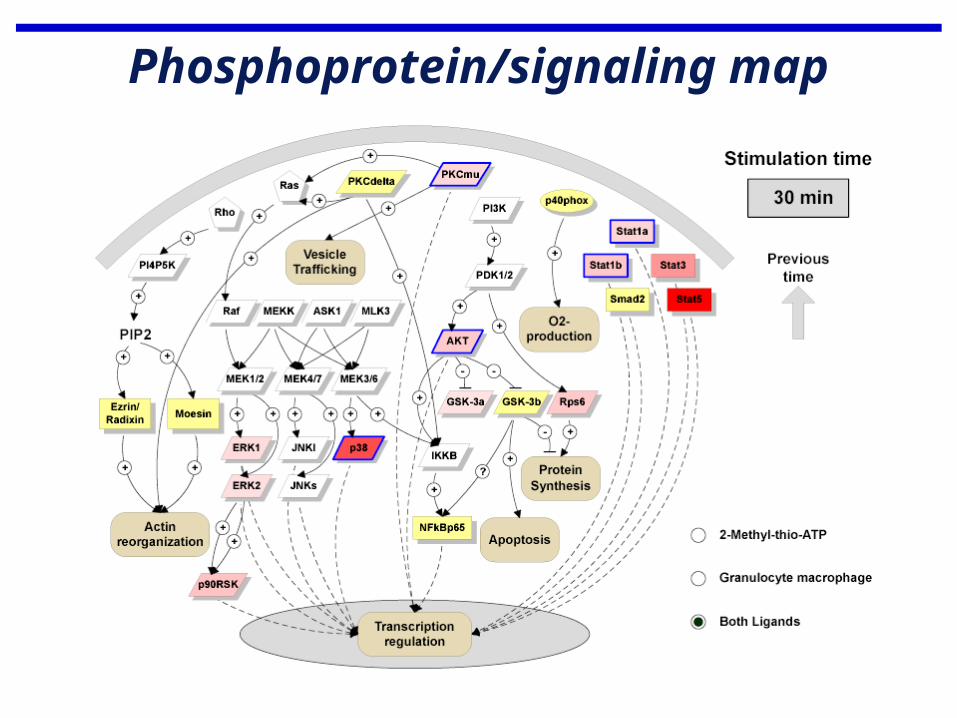
Phosphoprotein/signaling map
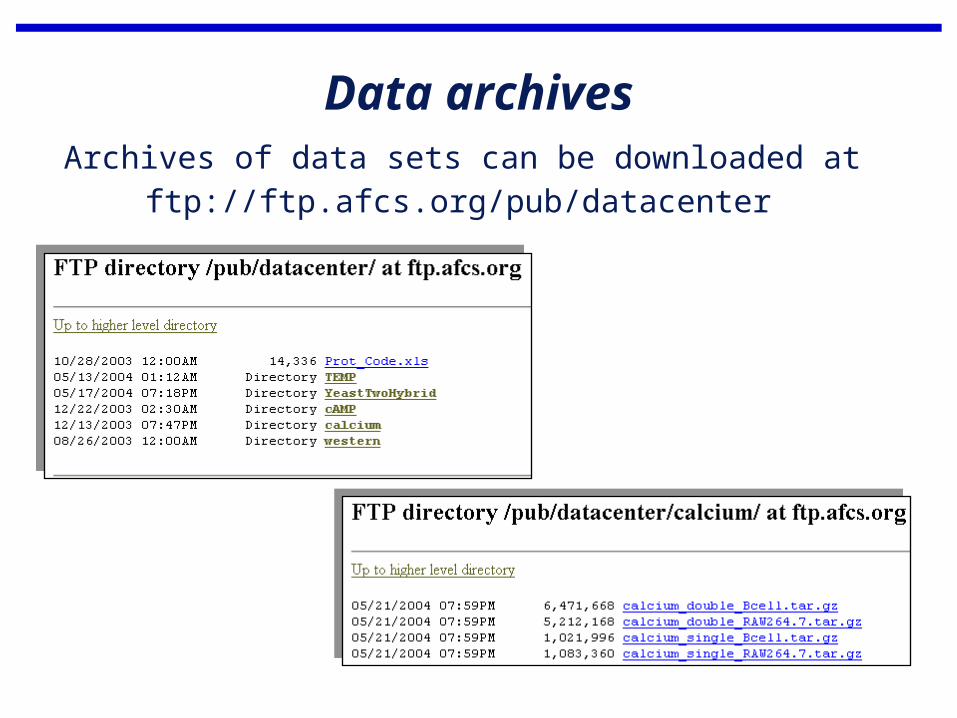
Data archivesArchives of data sets can be downloaded at
ftp://ftp.afcs.org/pub/datacenter
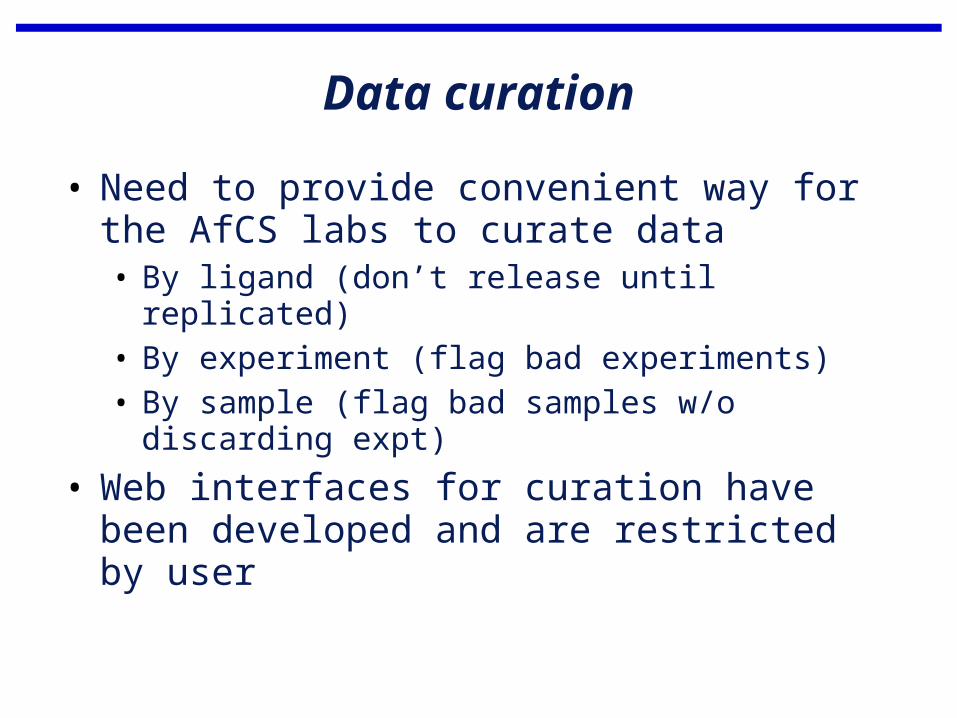
Data curation
• Need to provide convenient way for the AfCS labs to curate data• By ligand (don’t release until replicated)• By experiment (flag bad experiments)• By sample (flag bad samples w/o discarding
expt)
• Web interfaces for curation have been developed and are restricted by user
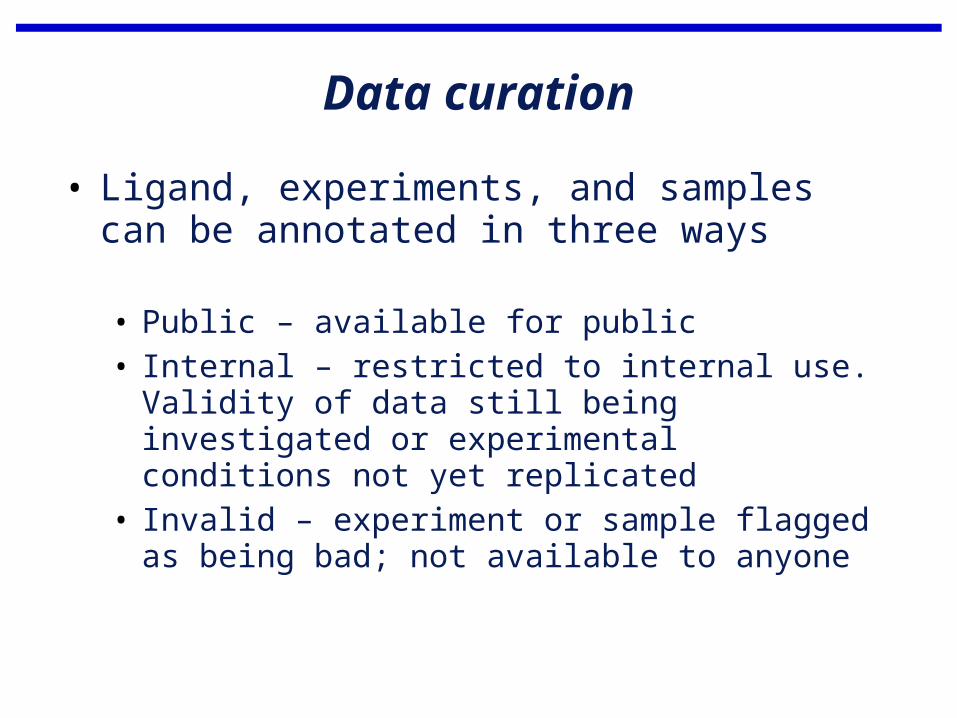
Data curation
• Ligand, experiments, and samples can be annotated in three ways
• Public – available for public• Internal – restricted to internal use. Validity of
data still being investigated or experimental conditions not yet replicated
• Invalid – experiment or sample flagged as being bad; not available to anyone
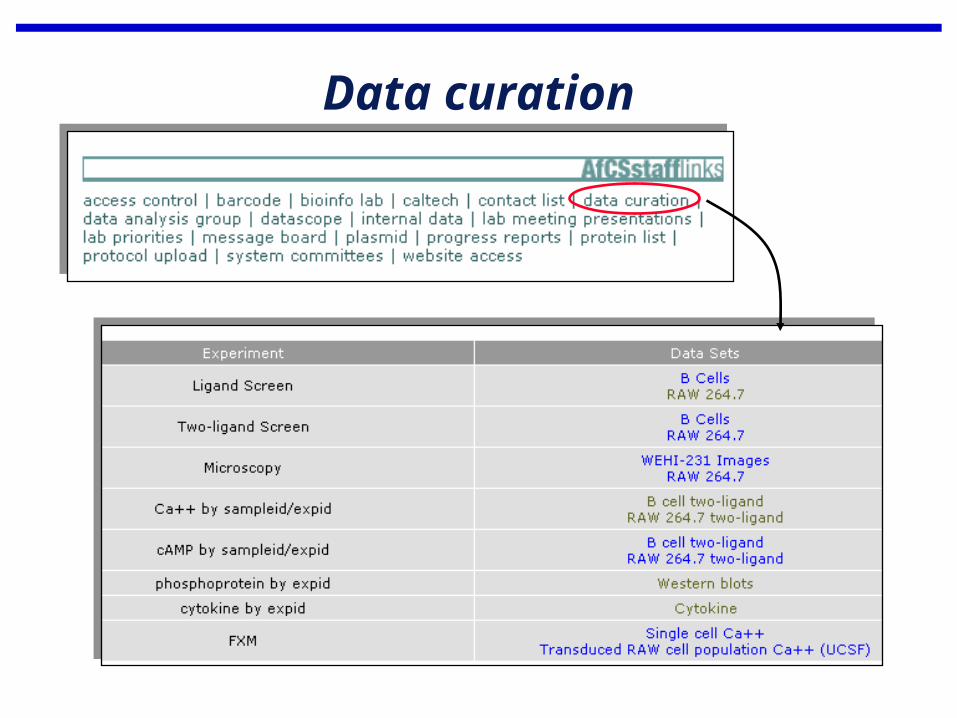
Data curation
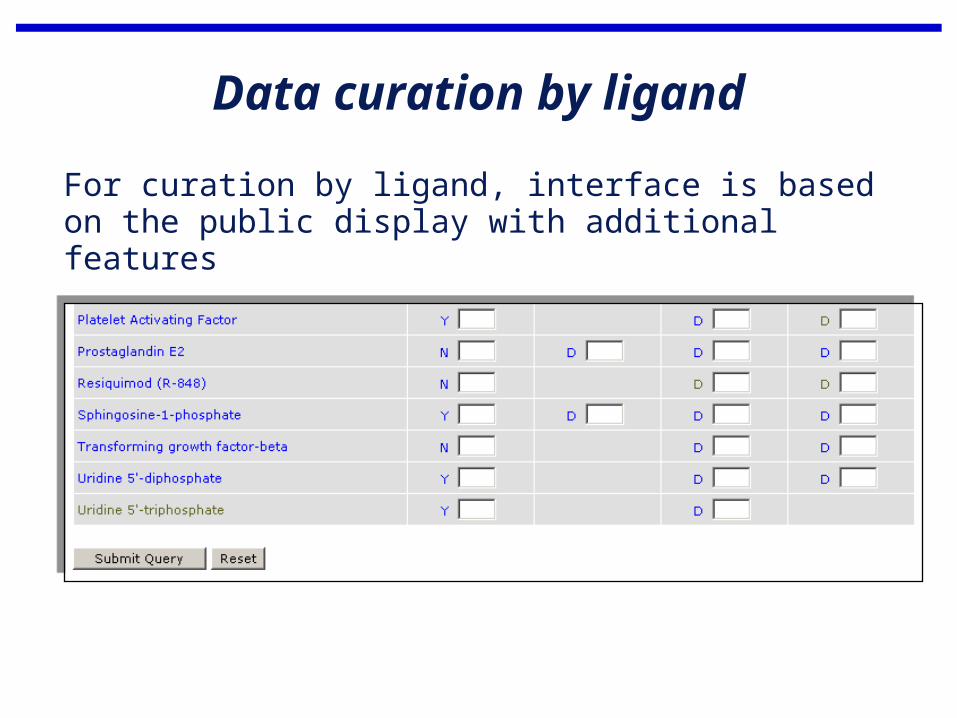
Data curation by ligand
For curation by ligand, interface is based on the public display with additional features
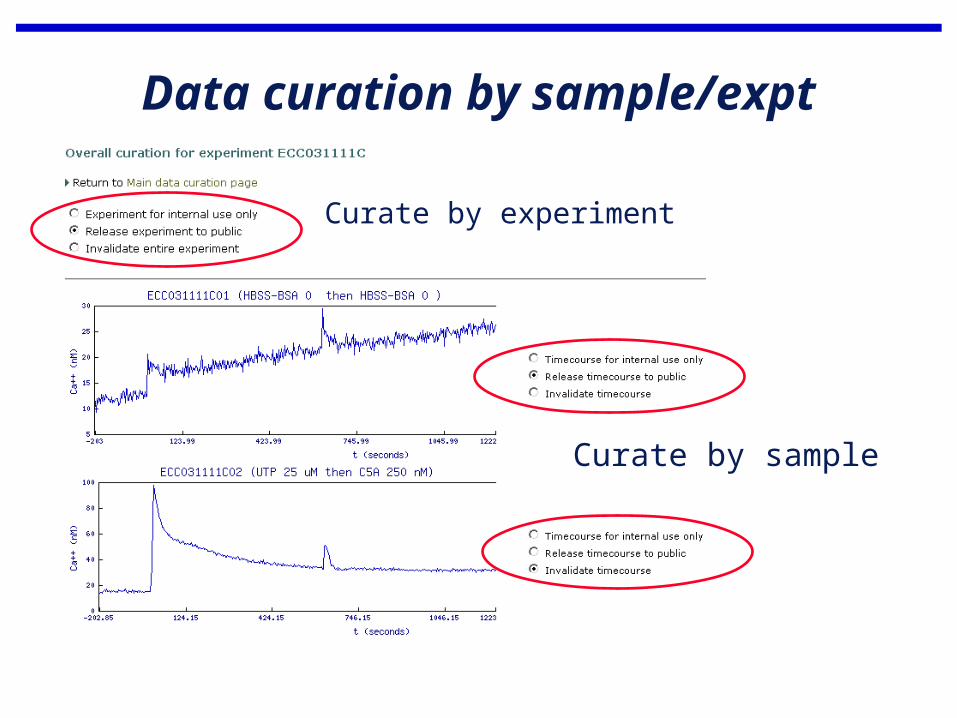
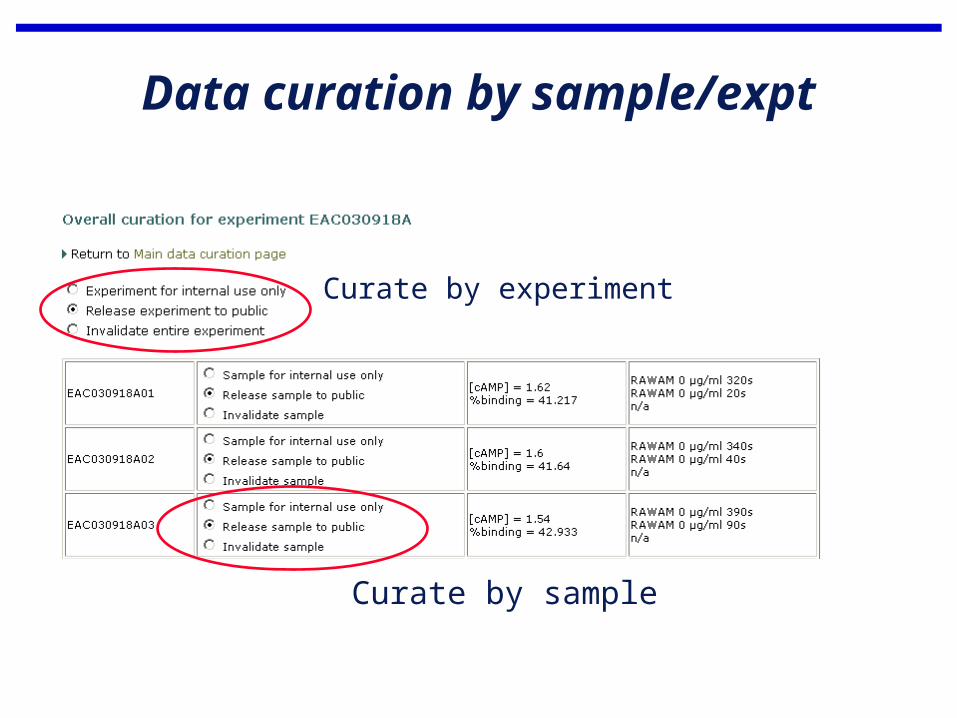
Data curation by sample/expt
Curate by experiment
Curate by sample
Data curation by sample/expt
Curate by experiment
Curate by sample
Data curation by sample/expt
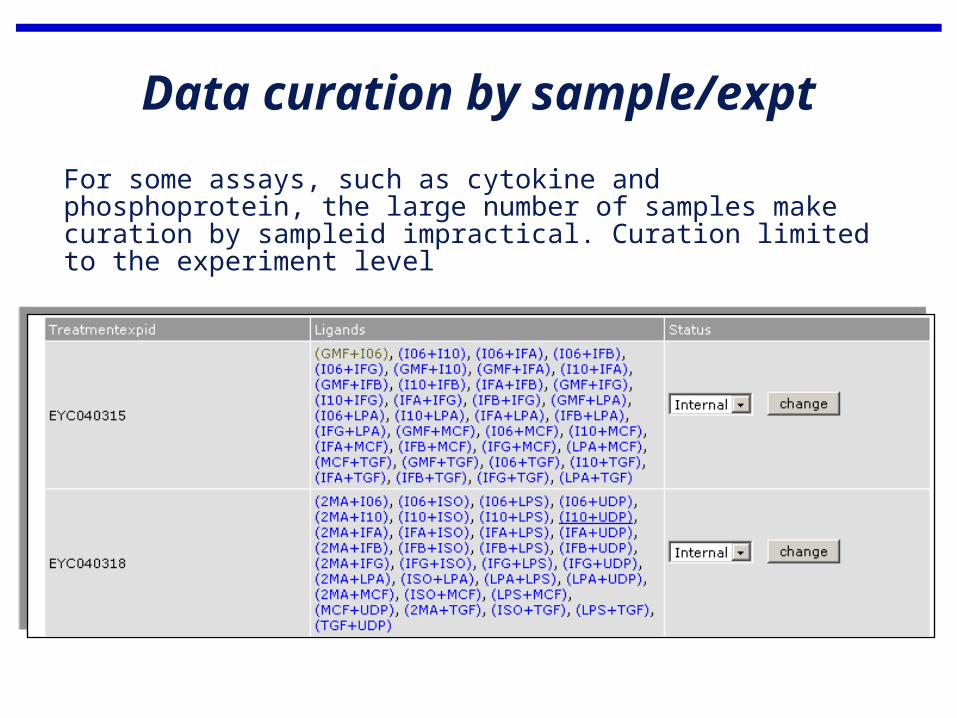
For some assays, such as cytokine and phosphoprotein, the large number of samples make curation by sampleid impractical. Curation limited to the experiment level
Data curation by sample/expt
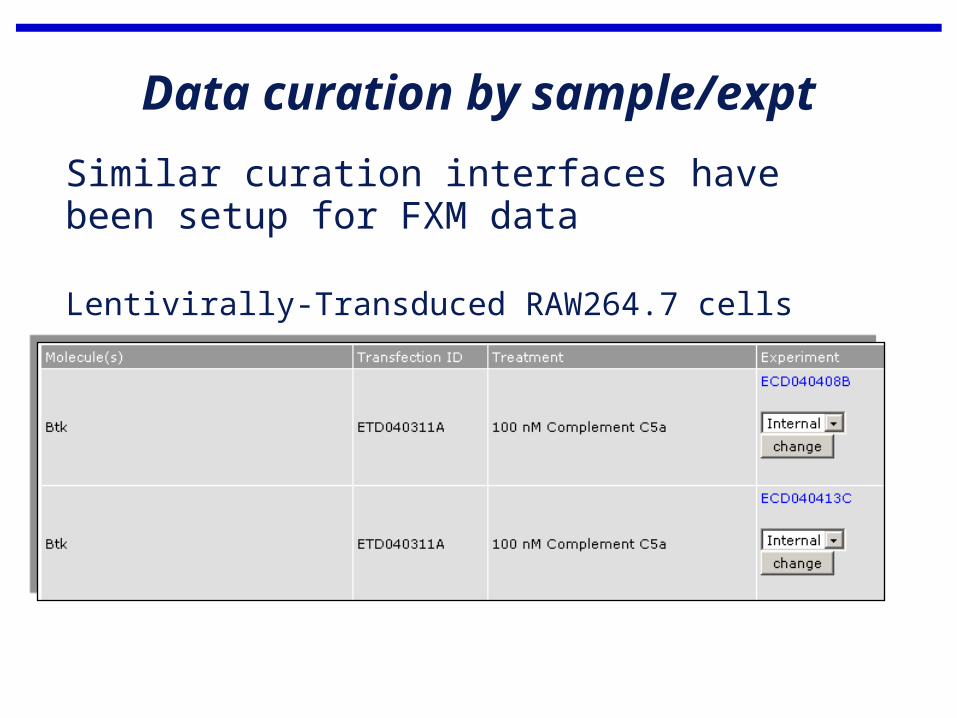
Similar curation interfaces have been setup for FXM data
Lentivirally-Transduced RAW264.7 cells
Acknowledgements•Madhusudan, Ilango Vadivelu – LIMS•Stephen Lyon – web master•Brad Kroeger – systems administration•Chic Barna, Ray Bean – database administration•Sylvain Pradervand – phosphoprotein display•Shankar Subramaniam – “glue”
•Ron Taussig, Gil Sambrano, Richard Scheuermann - data center design
•Paul Sternweis – Ca++, cAMP display•Susie Mumby – phosphoprotein, cytokine display•Lonnie Sorrels, Keng-Mean Lin, Sangdun Choi,
Nick Wong, Robert Hsueh, Heping Han, Ruth Levitz