ligand screens in raw cells – cytokine release ron taussig afcs annual meeting dallas, tx may,...
TRANSCRIPT

Ligand Screens in RAW Cells –
Cytokine Release
Ron TaussigAfCS Annual Meeting
Dallas, TX May, 2004

Cytokine Release Assay
1) Outputs for Macrophages – “End point” assay.
2) What are the responses to individual ligands?
3) How rich is the combinatorial response data set?
4) 23 ligands (look at all 23x23 combinations).
5) Approach: BioRad Luminex technology – assay release of 18 cytokines.
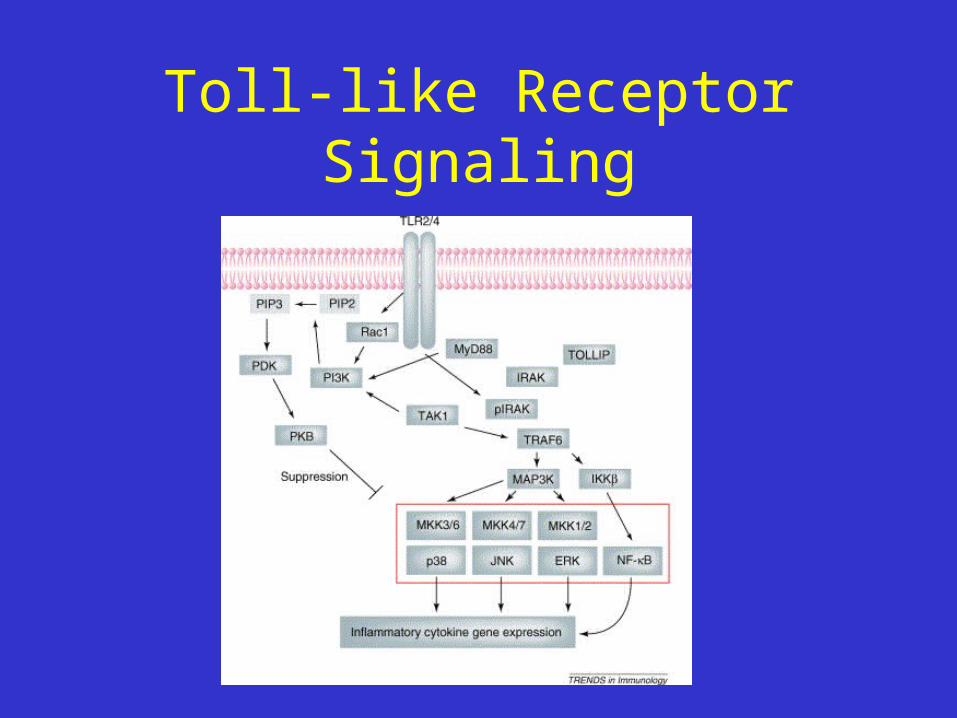
Toll-like Receptor Signaling

Toll-like Receptor Ligands
P3C P2C LPS 848

IFN- Receptor Signaling
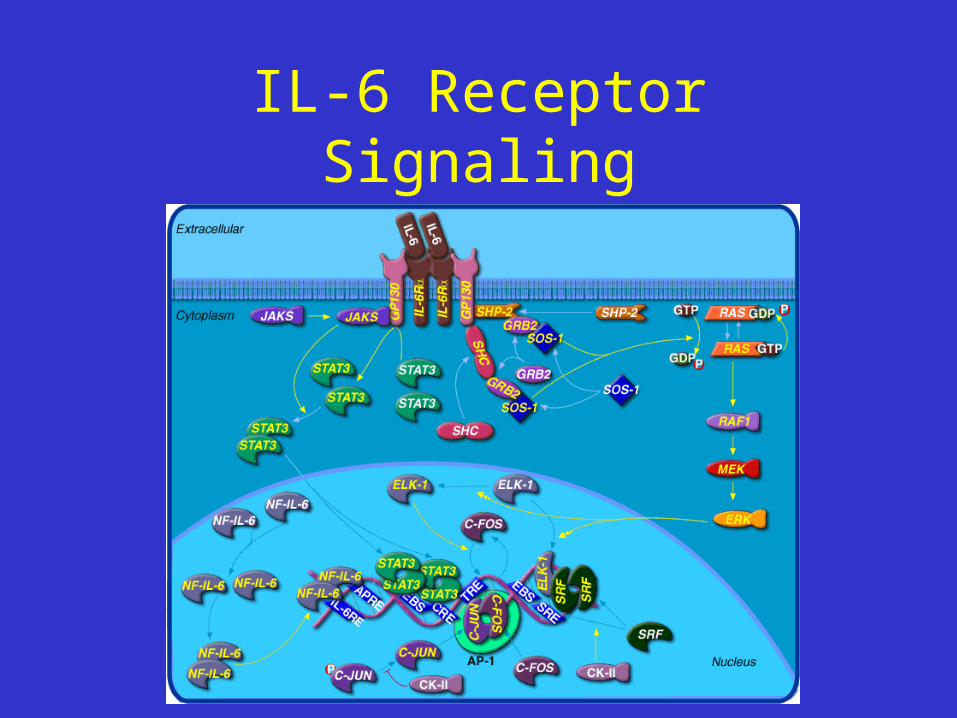
IL-6 Receptor Signaling

Cytokine Release Assay From Assay Development to Double Ligand Screen
Ligand Survey Double Ligand Screen
Single Ligand Screen
January February March April May June
TimeCourse
Excel
On Site Database (Dallas)
Web Display (AfCS)
Data Analysis

Combination Ligand SurveyExperimental plan (cytokine release)
134
134
137
137
• 4 experiments• 23 Ligands tested• All individually tested• All pairwise combinations• 1 Time point: 4 hours• 24 well plate
~ 4 x10⁵ cells/sample
• Completion Time: 3 weeks

Cytokine Release AssayLigand Survey
1) 6 of the 18 cytokines evaluated in the assay gave no ligand-induced responses.
2) Only one of the 23 ligands tested could be eliminated from the analysis (all revealed some interaction with another ligand).
3) >4000 data points:a) ~1.5% (5% with relaxed criteria) of the combinations reveal
inhibitory interactionsb) ~0.5% (1.5% with relaxed criteria) of the combinations reveal
synergistic interactions4) Finalization of the protocol still needed (time course, dilutions,
culture conditions).

Time Course of IL-1a Secretion in Response to Ligand Stimulation
0.0
30.0
60.0
90.0
0 1 2 3 4 5
Time (Hours)
pg
/ml
Untreated
LPS
IFG

Time Course of MIP-1α Secretion in Response to Ligand Stimulation
0.0
40000.0
80000.0
120000.0
160000.0
0 1 2 3 4 5
Time (Hours)
pg
/ml
Untreated
LPS
EST
P2C
IFG
EST + LPS
LPS + P2C
IFG + LPS
EST + P2C
EST + IFG
IFG + P2C

Cytokine Release – Standards
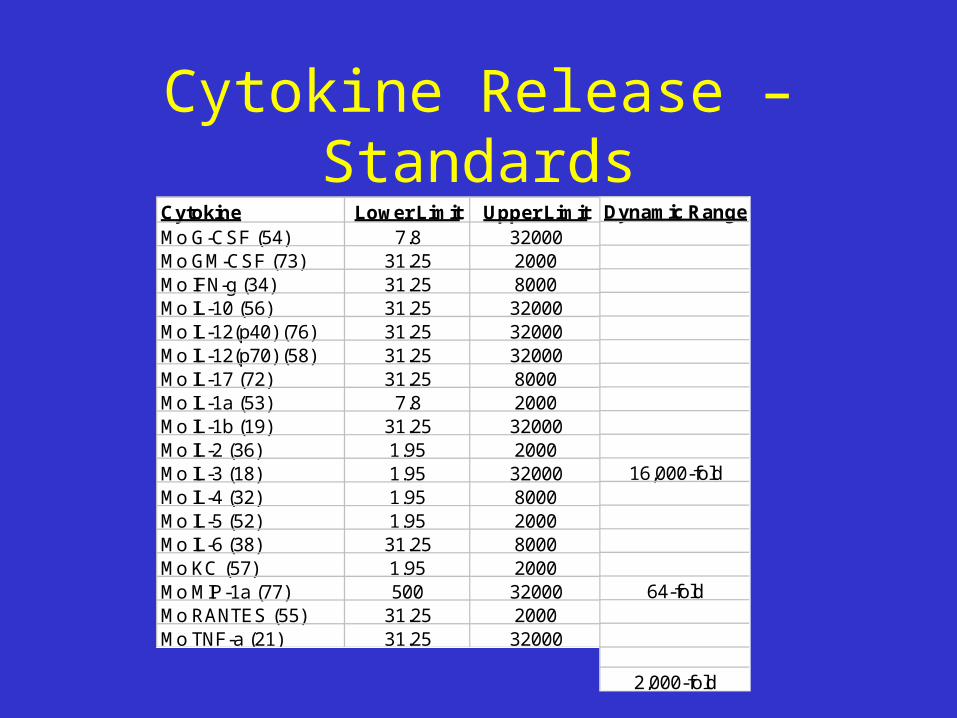
Cytokine Release – StandardsCytokine Lower Limit Upper LimitMo G-CSF (54) 7.8 32000Mo GM-CSF (73) 31.25 2000Mo IFN-g (34) 31.25 8000Mo IL-10 (56) 31.25 32000Mo IL-12(p40) (76) 31.25 32000Mo IL-12(p70) (58) 31.25 32000Mo IL-17 (72) 31.25 8000Mo IL-1a (53) 7.8 2000Mo IL-1b (19) 31.25 32000Mo IL-2 (36) 1.95 2000Mo IL-3 (18) 1.95 32000Mo IL-4 (32) 1.95 8000Mo IL-5 (52) 1.95 2000Mo IL-6 (38) 31.25 8000Mo KC (57) 1.95 2000Mo MIP-1a (77) 500 32000Mo RANTES (55) 31.25 2000Mo TNF-a (21) 31.25 32000
Dynamic Range
16,000-fold
64-fold
2,000-fold

Cytokine Release – Single Responses (TNFa)

Time Course of TNFα Secretion in Response to LPS Stimulation

Time Course of TNFα Secretion in Response to 2MA Stimulation

2MAC5AESTGMFHISIFAIFBIFGI1BI10IL4IL6ISOLPALPSMCFM1AMC1P2CP3CPAFPGE848S1PTGFUDPUTP
GC
SF
GM
CS
F
IFN
g
I10
IL12
p40
IL12
p70
IL17
IL1a
IL1b
IL2
IL3
IL4
IL5
IL6
KC
MIP
1a
RA
NT
ES
TN
Fa

Cytokine Release – Single Ligand Screen Summary

Single Ligand Screen Summary
StimulationStimulation (small)InhibitionLigand = Cytokine
GC
SF
GM
CS
F
IFN
IL1a
IL1b
IL2
IL3
IL4
IL5
IL6
IL1
0
IL1
2(p
40
)
IL1
2(p
70
)
IL1
7
KC
MIP
1a
RA
NT
ES
TN
Fa
ISOPGEC5ALPA2MAPAFUDPUTPS1PMCFTGFGMFI04I06I10IFAIFBIFGI1BLPSP2C848NL T T T
P3C ND ND ND ND ND ND ND ND ND ND ND ND ND ND ND ND ND ND

Cytokine Release – Single Ligand Screen Summary
CompleteIn the week following the meeting:1) Curate the data 2) Display on the public website3) Additional ligands

2MALPS ISOUDPP2C I1B C5A I04 GMF I10 IFA IFB IFG I06 LPATGFMCFP3CPAFPGE2MALPSISOUDPP2CI1BC5AI04
GMFI10IFAIFBIFGI06
LPATGFMCF848PAFPGE
S1P
EYC040512 EYC040518 EYC040519
EYC040414 EYC040423 EYC040518
EYC040406 EYC040421 EYC040430 EYC040513
EYC040326 EYC040416 EYC040503
EYC040318 EYC040331 EYC040422
EYC040325 EYC040415 EYC040429 EYC040507
EYC040315 EYC040330 EYC040506
TrianglesCombinations = 36Single ligand = 9Control = 2
RectanglesCombinations = 32Single ligand = 12Control = 2
Ligand Screens Experimental Plan

Cytokine Release – Interactions Among Ligand Pairs

Cytokine Release – Interactions Among Ligand Pairs

Cytokine Release – Interactions Among Ligand Pairs

Cytokine Release – Interactions Among Ligand Pairs
IL-10
TNFa

Cytokine Release – Interactions Among Ligand Pairs

Cytokine Release – Interactions Among Ligand Pairs
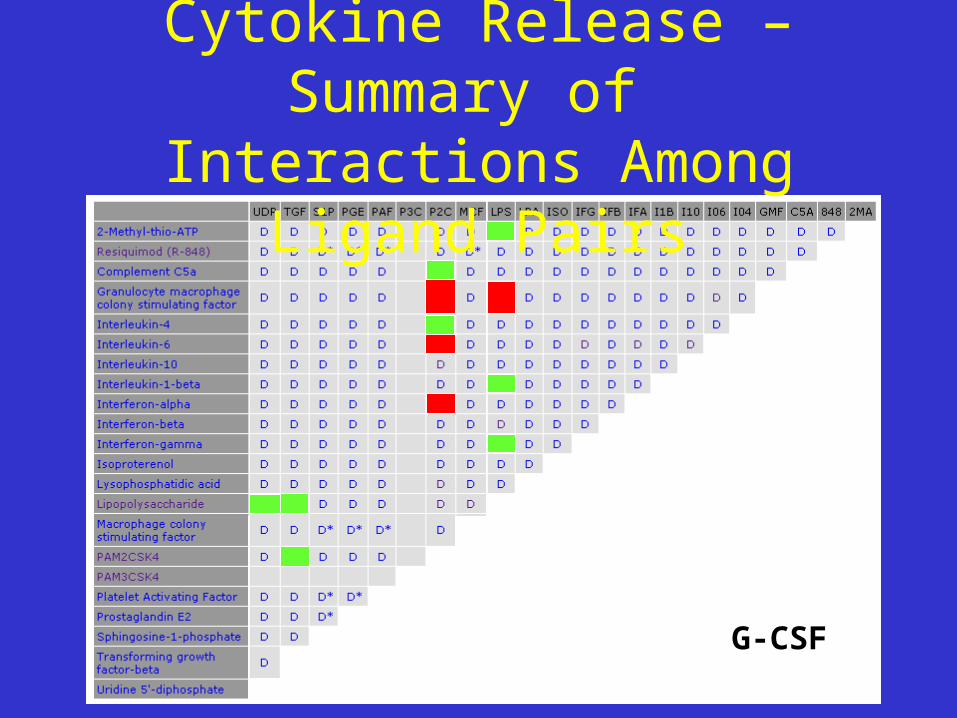
G-CSF
Cytokine Release – Summary of Interactions Among Ligand Pairs

IL-6
Cytokine Release – Summary of Interactions Among Ligand Pairs

IL-10
Cytokine Release – Summary of Interactions Among Ligand Pairs

Mip1a
Cytokine Release – Summary of Interactions Among Ligand Pairs
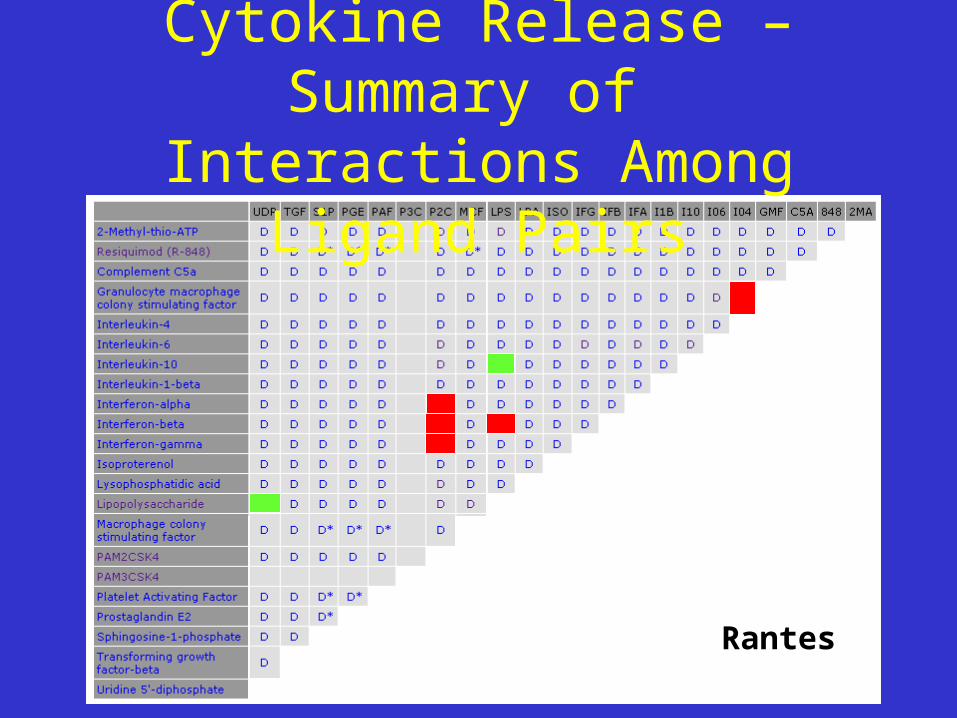
Rantes
Cytokine Release – Summary of Interactions Among Ligand Pairs

TNFa
Cytokine Release – Summary of Interactions Among Ligand Pairs

Cytokine Release – Double Ligand Screen Summary
1) Incubations are complete (Cell Lab)2) Cytokine assays near complete (Antibody Lab)3) First level data analysis
a) Quality of datab) Identify and prioritize repeat assays
4) Curate the data 5) Display on the public website6) Higher data analysis7) Plan next generation of experiments