dart and arrow points on the columbia...
TRANSCRIPT
When and how the bow and arrow wereintroduced, spread, and replaced theatlatl are important research questions
in North American prehistory. In the Pacific North-west the accepted date for this is within the last2,300 years, with the two weapon systems usedtogether for several centuries. The bow is thoughtto have completely replaced the atlatl ca. 1000 B.P.(e.g., Chatters 2004). This same sequence isbelieved to hold for much of western North Amer-ica. The bow’s introduction is sometimes used toexplain a documented increase in warfare after A.D.500 (e.g., Chatters 2004; Lambert 2002; Maschner
1991). However, Webster (1978, 1980) and Chanceand Chance (1982) place the introduction of thebow and arrow in the northern Great Basin andColumbia Plateau as early as ca. 3500 B.P. The evi-dence supporting their suggestions is weak.The bow and arrow may have been introduced
in the central and eastern United States ca.4000–3000 B.P., with spatially and temporallypatchy use until they became the region’s sole pro-jectile system by 1000 B.P. (Nassaney and Pyle1999). In Newfoundland, at North America’s north-eastern corner, the two weapon systems may havebeen used together after the bow and arrow arrived
DART AND ARROW POINTS ON THE COLUMBIA PLATEAU OFWESTERN NORTH AMERICA
Kenneth M. Ames, Kristen A. Fuld, and Sara Davis
The timing of the bow and arrow’s introduction, spread, and replacement of the atlatl is an important research question inNorth American prehistory. Although regional archaeologists have not focused on the issue, it is generally thought that thebow and arrow were introduced on the Columbia Plateau ca. 2,300 years ago and completely replaced the atlatl by 1000B.P. We apply two sets of discriminate functions and four threshold values to three large projectile point samples from theColumbia Plateau and a control sample from the Western Great Basin. Our results indicate that the atlatl was used on thePlateau by ca. 10,800 B.P. While the bow and arrow may have been present by 8500 B.P., they were ubiquitous in the regionby 4400 B.P. Atlatl use appears to have increased for a while after 3000 B.P. At the same time, metric differences betweendart and arrow points strengthened. Darts became rare after 1500 B.P. but seem to have been in use in small numbers atleast until contact.
El momento de introducción y dispersión del arco y flecha así como su reemplazo por el atlatl constituyen importantes temasde investigación de la prehistoria de Norte América. Aunque los arqueólogos regionales no se han concentrado en este tema,en general se piensa que el arco y flecha fueron introducidos en la meseta de Columbia hace unos 2,300 años y que reem-plazaron completamente al atlatl hacia 1000 a.P. En este trabajo aplicamos dos conjuntos de funciones discriminantes, cua-tro valores de umbral y patrones de variación por tamaño a lo largo de tres dimensiones métricas a tres grandes muestras depuntas de proyectil de la meseta de Columbia y a una muestra de control de la Gran Cuenca occidental. Nuestros resultadosindican que el atlatl fue utilizado en la meseta desde ca. 10,800 a.P. Asimismo, el arco y flecha pudieron ya estar presentespara el 8500 a.P. y ya eran ubicuos en la región hacia el 4400 a.P., aunque sin reemplazar completamente al atlatl. El uso delatlatl parece haberse incrementado por un tiempo con posterioridad a 3000 a.P. Al mismo tiempo las diferencias métricasentre puntas de dardo y puntas de flecha se hicieron más notables. Los dardos se tornaron raros después del 1500 a.P., peroparecen haber continuado en uso hasta tiempos del contacto. En suma, no se trata de una historia de reemplazo directo de unarma por otra, sino que ambos sistemas de armas estuvieron en uso al mismo tiempo durante varios milenios en la meseta deColumbia.
Kenneth M. Ames � Department of Anthropology, Portland State University, Portland, OR 97207 ([email protected])Kristen A. Fuld � Department of Anthropology, Portland State University, Portland, OR 97207Sara Davis � Archaeological Investigations Northwest, Inc., 2632 S.E. 162nd Ave., Portland, OR 97236
American Antiquity 75(2), 2010, pp. 287–325Copyright ©2010 by the Society for American Archaeology
287
AQ75(2)Ames_Layout 1 4/12/10 12:22 PM Page 287

288 american antiquity [Vol. 75, no. 2, 2010
there around 1000 B.P. (Erwin et al. 2005). In theWest, the bow and arrow apparently were presentin the Great Basin by 2000 B.P. (Yohe 1998),replacing the atlatl ca. 1350 B.P. (e.g., Bettinger andEerkins 1999). With some exceptions— notably,Corliss’s (1972) pioneering study on neck widths— there has been scant interest in this issue amongarchaeologists working in the Intermontane Plateauof western North America. In contrast to the imme-diately adjacent Great Basin and other areas, anddespite early interest (e.g., Smith 1954), archaeol-ogists on the Plateau have been little concernedwith projectile point variation and classification(Pettigrew et al. 1995; but see Andrefsky 2004;Carlson and Magne 2008; Lohse 1985). Whereregional researchers have addressed the bow andarrow’s introduction, they have used neck widthsto separate darts from arrows (e.g., Ames 2000;Chatters et al. 1995).We present evidence indicating that the history
of these two projectile technologies on the Colum-bia Plateau differs markedly from the generallyaccepted picture. Using the multiple data sets andlines of evidence discussed below, we argue thatthe atlatl was present on the Columbia Plateau at10,800 B.P. and that while the bow and arrow may
have been introduced as early as 8500 B.P, theywere in wide use by 4400 B.P. Both weapon sys-tems were subsequently used together over severalmillennia. After 3000 B.P. dart and arrow pointsbecame increasingly differentiated in size. Theatlatl then became a minor component in the hunt-ing tool kit but remained in use after 1000 B.P.We use measurements from four large projec-
tile point data sets: 859 points from the WesternGreat Basin (WGB), 271 points recovered at theHatwai (10NP143) site in west- central Idaho, 713points from the Lower Snake River (LSR) regionof the eastern Columbia Plateau, and 613 points col-lected during a major pipeline project in central andnortheastern Oregon (Figure 1). The WGB pointsserve as a control sample. Our empirical results arebased on the Hatwai, LSR, and “Pipeline” samples.We first present the four data sets and then explainthe methods we used, describe our results, discussthem, and conclude.
Data Sets
Western Great Basin
The 859 Western Great Basin projectile points
Figure 1 Sites discussed in this paper. A. Hatwai, B. Alpowai, C. Granite Point, D. Wawawai, E. Marmes, F. Tucannon,G. Windust Caves, H. 35JE51B, I. 35DS557, J. Ryegrass Coulee. The dashed line is the approximate route of the PGT –PG&E Pipeline Expansion Project.
AQ75(2)Ames_Layout 1 4/12/10 12:22 PM Page 288

include reported points from Gatecliff Rockshel-ter (Thomas 1983) and currently unreported pointsfrom the Alta Toquima site and the Jefferson Plateauarea (Thomas 2008). Temporally, they span themiddle and late Holocene. Typologically, theyinclude representatives of most of the major pro-jectile point types in the WGB (Table 1). They pro-vide a well- known and understood control sampleagainst which to compare the three Plateau datasets. Use of this control sample is helpful becauseformal variation is much better controlled and typo-logical methods are more fully and explicitly devel-oped in the Great Basin than on the Plateau. Thomas(1981) stresses that his typological methods weredeveloped to create historically sensitive types, notfunctional types. However, they seem to measurefunctional change across time. We applied the equa-tions and thresholds described below to Thomas’sdata in “dry runs” to learn how they worked and toensure that our results are consistent with those ofother researchers.
Hatwai
Hatwai (10NP143) is located on the ClearwaterRiver 11 km upstream of the Clearwater’s conflu-ence with the Snake River at Lewiston, Idaho, andClarkston, Washington. The site was excavated in1977 and 1978 as an extensive test excavation priorto expansion of U.S. Highway 94 to four lanes(Ames et al. 1981). The site is now capped by thehighway’s westbound lanes. The excavationsrecovered 271 projectile points classified into 14types (Table 1). They span the period from ca.10,800 B.P. to 2800 B.P. (Ames et al. 1981; Sanders1982) and are assignable to four temporal compo-nents at the site. Point measurements usedThomas’s (1981) system for measuring Great Basinprojectile points.Hatwai I, the site’s earliest occupation, is a com-
ponent of the Windust phase, the earliest well- documented cultural manifestation on the Plateau(Ames 1988, 2000), although there are scatteredfinds of Clovis or Western Fluted points (e.g., Reidet al. 2008) and Haskett material (Galm and Gough2008) in the region. The Windust phase is gener-ally dated between 10,800 and 8500 B.P. (Leon-hardy and Rice 1970) by a large suite of radiocarbondates (Ames 2000; Huckleberry and Fadem 2007;Sheppard et al. 1987). Hatwai I is dated betweenca. 10,800 and 9800 B.P., a date range commen-
surate with the early portion of the Windust phase.1
Windust projectile points are stemmed lanceolatepoints (Rice 1972; Sanders 1982) and are thePlateau variant of the Western Stemmed Point com-plex (Ames 1988). Windust points are metricallyand formally variable (Rice 1972), partially as aresult of extensive repair and reworking of thepoints during their use life. Excavations at Hatwairecovered 21 Windust points and point fragments(Figure 2). Measurements from 11 complete andnearly complete specimens are used here.The Hatwai I assemblage was recovered from
the surface of and within a late Pleistocene/earlyHolocene gravel bar. Two composite radiocarbonsamples date the base of the exposed deposits(TX3158 and TX3159; Table 2). These dates arestatistically identical, producing a pooled averageof 10,796 ± 138 B.P. The dated stratum yieldedthree stemmed points (Figure 2). A composite char-coal sample from a facies of the gravel bar exposedin an excavation unit located 120 m east produceda date of 10,110 ± 720 B.P. (Table 2). No culturalmaterials were associated with this dated sample.These three dates are statistically identical, with apooled mean of 10,741 ± 171 B.P., suggesting thatthe bar predates 10,000 B.P. The gravel depositsgrade upward into silt/sand alluvium (QAE[Cochran 1988]). This deposit above the gravels hastwo dated samples: 8800 ± 1310 (TX3265) and9160 ± 230 (TX3086). These are statistically thesame, with a pooled mean of 9149 ± 227 B.P. Thisdate is supported by six dates elsewhere in the site(Table 2; Cochran 1988). These six dates are alsostatistically identical, having a pooled mean of 9229± 97 B.P. Given all of this, a terminal date of 9800B.P. for the gravel bar is reasonable. While the cul-tural deposit is a lag deposit, the recovered artifactsshow little or no abrasion, water rolling, or otherevidence of water movement. A refitting study pro-vides additional evidence for the integrity of thisgravel surface assemblage. Sanders (1982) was ableto refit flakes to cores with flakes recovered withina meter of the core. The assemblage is clearly apalimpsest representing multiple light occupationsby mid- latitude foragers (Ames 1988).The small Hatwai II assemblage was recovered
from the upper QAE and middle Holocene allu-vium (QAM) that unconformably overlies theQAE. The unconformity contains a wedge of fangravels with volcanic ash identified as Mazama ash
ames et al.] Dart anD arrOW POintS On tHe cOLumBia PLateau OF WeStern nOrtH america 289
AQ75(2)Ames_Layout 1 4/12/10 12:22 PM Page 289
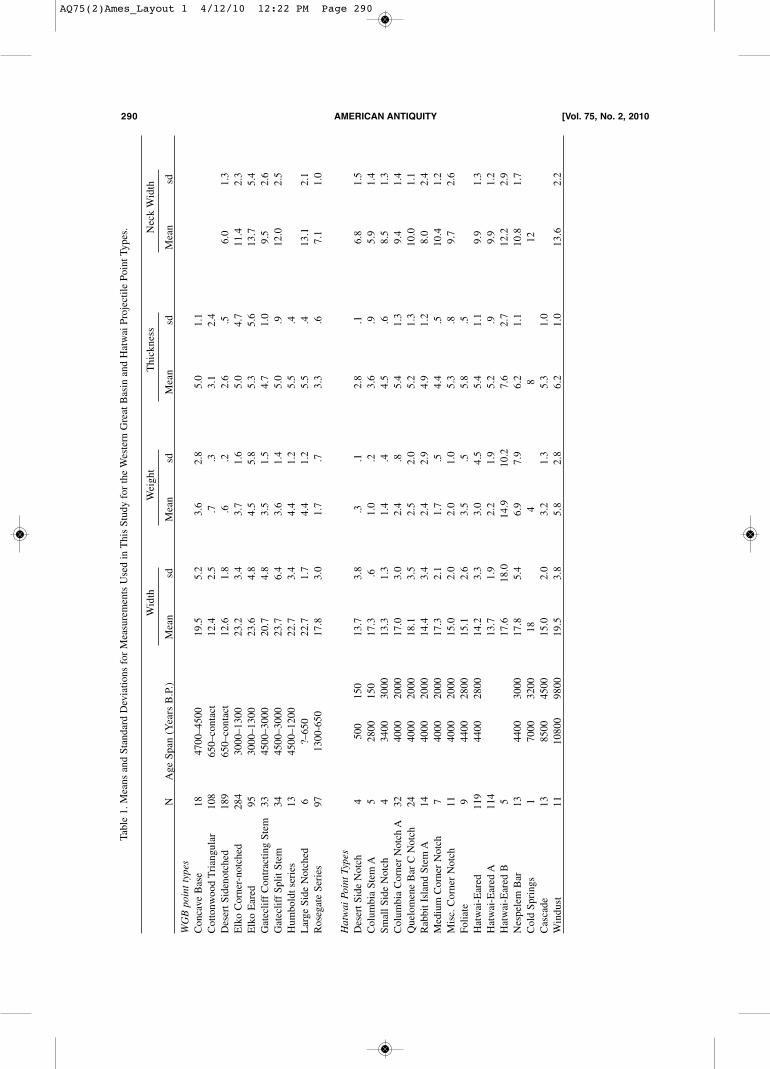
290 american antiquity [Vol. 75, no. 2, 2010Table 1. Means and Standard Deviations for Measurements Used in This Study for the Western Great Basin and Hatwai Projectile Point Types.
Width
Weight
Thickness
Neck Width
NAge Span (Years B.P.)
Mean
sdMean
sdMean
sdMean
sd
WGB point types
Concave Base
184700–4500
19.5
5.2
3.6
2.8
5.0
1.1
Cottonwood Triangular
108
650–contact
12.4
2.5
.7.3
3.1
2.4
Desert Sidenotched
189
650–contact
12.6
1.8
.6.2
2.6
.56.0
1.3
Elko Corner-notched
284
3000–1300
23.2
3.4
3.7
1.6
5.0
4.7
11.4
2.3
Elko Eared
953000–1300
23.6
4.8
4.5
5.8
5.3
5.6
13.7
5.4
Gatecliff Contracting Stem
334500–3000
20.7
4.8
3.5
1.5
4.7
1.0
9.5
2.6
Gatecliff Split Stem
344500–3000
23.7
6.4
3.6
1.4
5.0
.912.0
2.5
Hum
boldt series
134500–1200
22.7
3.4
4.4
1.2
5.5
.4Large Side Notched
6?–650
22.7
1.7
4.4
1.2
5.5
.413.1
2.1
Rosegate Series
971300-650
17.8
3.0
1.7
.73.3
.67.1
1.0
Hatwai Point Types
Desert Side Notch
4500
150
13.7
3.8
.3.1
2.8
.16.8
1.5
Colum
bia Stem A
52800
150
17.3
.61.0
.23.6
.95.9
1.4
Small Side Notch
43400
3000
13.3
1.3
1.4
.44.5
.68.5
1.3
Colum
bia Corner Notch A
324000
2000
17.0
3.0
2.4
.85.4
1.3
9.4
1.4
Quelomene Bar C Notch
244000
2000
18.1
3.5
2.5
2.0
5.2
1.3
10.0
1.1
Rabbit Island Stem A
144000
2000
14.4
3.4
2.4
2.9
4.9
1.2
8.0
2.4
Medium Corner Notch
74000
2000
17.3
2.1
1.7
.54.4
.510.4
1.2
Misc. Corner Notch
114000
2000
15.0
2.0
2.0
1.0
5.3
.89.7
2.6
Foliate
94400
2800
15.1
2.6
3.5
.55.8
.5Hatwai-Eared
119
4400
2800
14.2
3.3
3.0
4.5
5.4
1.1
9.9
1.3
Hatwai-Eared A
114
13.7
1.9
2.2
1.9
5.2
.99.9
1.2
Hatwai-Eared B
517.6
18.0
14.9
10.2
7.6
2.7
12.2
2.9
Nespelem Bar
134400
3000
17.8
5.4
6.9
7.9
6.2
1.1
10.8
1.7
Cold Springs
17000
3200
184
812
Cascade
138500
4500
15.0
2.0
3.2
1.3
5.3
1.0
Windust
1110800
9800
19.5
3.8
5.8
2.8
6.2
1.0
13.6
2.2
AQ75(2)Ames_Layout 1 4/12/10 12:22 PM Page 290

ames et al.] Dart anD arrOW POintS On tHe cOLumBia PLateau OF WeStern nOrtH america 291
Figure 2. Hatwai Windust points. A is a complete point. It is 71 mm long, 16mm wide, with a neck width of 10 mm anda basal of 11 mm. C and D are arrow size. B exemplifies reshaping and size reduction of Windust points. B and C wererecovered in the basal stratum dated c 10,800 BP (see text).
AQ75(2)Ames_Layout 1 4/12/10 12:22 PM Page 291

(Cochran 1988), pyroclastic materials from theeruption that produced Crater Lake in the CascadeMountains of southern Oregon. The multiple erup-tions are dated between 6700 and 7000 B.P. (e.g.,Bacon 1983). The QAM is also dated by five radio-carbon dates (Table 2) that firmly place it between6200 and 5500 B.P. The occupation was very light.Archaeological materials were covered in beddingplanes in the silty QAE and QAM;2 no featureswere recognized. This is typical of Cascade phaseoccupations, which probably represent very mobileforagers (Ames 1988). Artifacts were also recov-
ered in mixed deposits beneath and between Hat-wai III pithouses that were excavated through theQAM and QAE to the underlying gravels. On typo-logical grounds, Hatwai II is a component of theearly Cascade subphase of the regional sequence’sCascade phase (Leonhardy and Rice 1970), whichdates between 8500 and 7000 B.P. (Bense 1972).The Hatwai II radiocarbon dates indicate that theassemblage may contain late Cascade subphasematerials. It does include Cascade points (Figure3), the diagnostic projectile point style of the entireCascade phase. Cascade points are small, bifacial,
292 american antiquity [Vol. 75, no. 2, 2010
Table 2. Dates Discussed in the Text.
Lab. No. Site/Component Context Date 2� Calibration B.P. (p)
Mean All Hatwai IIIB dates 3267±40 3393–3581 (1)WSU1878 Hatwai IIIB House 1 Fill 3130±70 3158–3484 (.99)WSU1829 Hatwai IIIB House 2 Fill 3240±90 3319–3689 (.97)WSU1842 Hatwai IIIB House 1 Fill 3330±70 3396–3720 (.99)TX3092 Hatwai IIIB House 2 Fill 3420±380 2778–4647 (.99)TX3264 Hatwai IIIB House 2 Fill 3440±100 3455– 3929 (.99)TX3088 Hatwai IIIA House 2 Floor 4120 ±110 4380–4871 (.98)Mean TX 3933, 5721, 5720, 3263 4441±75 4869–5290 (1)Mean TX 5721, 5720, 3263 4406±75 4806–5290 (.94)TX3263 Hatwai IIIA House 1 Floor 4340±90 4806 5290 (.94)TX5720 Hatwai IIIA House 1 Floor 4470±190 4783–5587 (.93)TX5721 Hatwai IIIA House 1 Floor 4740±230 4850–5930 (1)TX3933 Hatwai IIIA House 6 Floor 5050±320 5026–6841 (.99)TX3262† Hatwai IIIA House 1 Floor 5550±220 5892–6862 (.99)TX3085 Hatwai IIIA QAM 4310±70 4789–5056 (.86)TX3161 Hatwai II QAM 5450±120 5983–6468 (.98)TX3983 Hatwai II QAM 5780±130 6308–6863 (.99)WSU1828 Hatwai II QAM 6165±150 6719–7336 (.96)TX3084 Hatwai II QAM 6240±100 6895–7333 (.97)TX3982 Hatwai II QAM 6260±160 6779–7463 (.99)Beta53621 35JE51B Pre-Mazama 6670±60 7435–7622 (.99)Beta57179 35JE51B Pre-Mazama 7035±65 7711 –7970 (1)MEAN TX QAE dates 9229±97 10,226–10,503 (.97)WSU1840 Hatwai II QAE 7860±90 8509–8989 (.97)TX3082 Hatwai II QAE 8560±520 8372–10,833 (.98)TX3266 Hatwai II QAE 8660±1660 6171- 13,859 (.99)TX3265 Hatwai II QAE 8800±1310 7166–13,238 (1)TX3086 Hatwai II QAE 9160±230 9664–10,882 (.95)TX3083* Hatwai II QAE 9280±110 10,230–10,737 (1.0)TX3081 Hatwai II QAE 9320±1830 6438 - 15,307 (1.0WSU2440*† Hatwai II QAE 9880±110 11,086 - 11,770 (.99)MEAN TX 3160, 3158, 3159 10741±171 12,230-13,041 (.98)TX3160 HATWAI I GRAVELS 10110±720 9736–13,295 (1)MEAN TX 3158, 3159 10796±138 12,556–13,050 (.92)TX3158 HATWAI I GRAVELS 9850±870 9120-13,361 (.99)TX3159 HATWAI I GRAVELS 10820±140 12,570–13,081 (.95)
All dates are on charcoal. Calibrations were performed with CALIB 5.0.1 (Stuiver et al 1995) for this paper. Sources:Hatwai Ames et al. 1981, TX5720, 5721 not previously reported. 36JE51B (Pettigrew and Hodges 2005).* Dates from the same sample† Dates judged to be too early
AQ75(2)Ames_Layout 1 4/12/10 12:22 PM Page 292

foliate lanceolate points. The 13 Hatwai Cascadepoints fit the formal and technological definitionsof the type (Bense 1972; Butler 1961; Leonhardy1970; Nelson 1969; Ozbun and Fagan 2006).Assemblages of this period contain other foliate andoccasional stemmed points. The Hatwai Cascadeassemblage does not include the large side- and corner- notched points (Northern/Cold Springs SideNotched) that, with Cascade points, are among thediagnostic artifacts for the late Cascade subphase(7000–4500 B.P. [Bense 1972]). Only three of thesepoints were recovered at Hatwai, and they are partof the Hatwai III assemblage.Hatwai III is the largest Hatwai occupation. It
is dated by 11 radiocarbon dates (Table 2). These
indicate two major occupational episodes: HatwaiIIIA between 4400 and 4000 B.P. and Hatwai IIIBbetween 3500 and 3100 B.P. Other evidence sug-gests that the recovered occupation may extend aslate as 2800 B.P. Hatwai IIIA contained at least fivesemisubterranean pithouses, three of which areradiometrically dated. Three of the dates from thefloor of House 1 and the single date from the low-est floor of House 6 (Table 2) are statistically thesame. Their pooled mean of 4441 ± 75 B.P. pro-vides an initial date for Hatwai III. The 5500 B.P.date from the House 1 floor is considered too early.The Hatwai IIIA houses were filled with silty allu-vium after 3500 B.P. or so and were completelyinvisible by 3000 B.P., with houses built over them.
ames et al.] Dart anD arrOW POintS On tHe cOLumBia PLateau OF WeStern nOrtH america 293
Figure 3. Hatwai Cascade points.
AQ75(2)Ames_Layout 1 4/12/10 12:22 PM Page 293
Hatwai IIIB is contained in this alluvium. Itincludes at least three houses and extensive activ-ity areas probably associated with dwellings thatwere destroyed or capped by the original highwayconstruction. Assemblage distinctions betweenthese two contexts are not relevant to this discus-sion, and they are treated here as one.The 237 Hatwai III projectile points are here
assigned to 11projectile point classes, most of whichare variants of Plateau- wide projectile point types(Lohse 1985; Lohse and Shou 2008; Pettigrew et al.
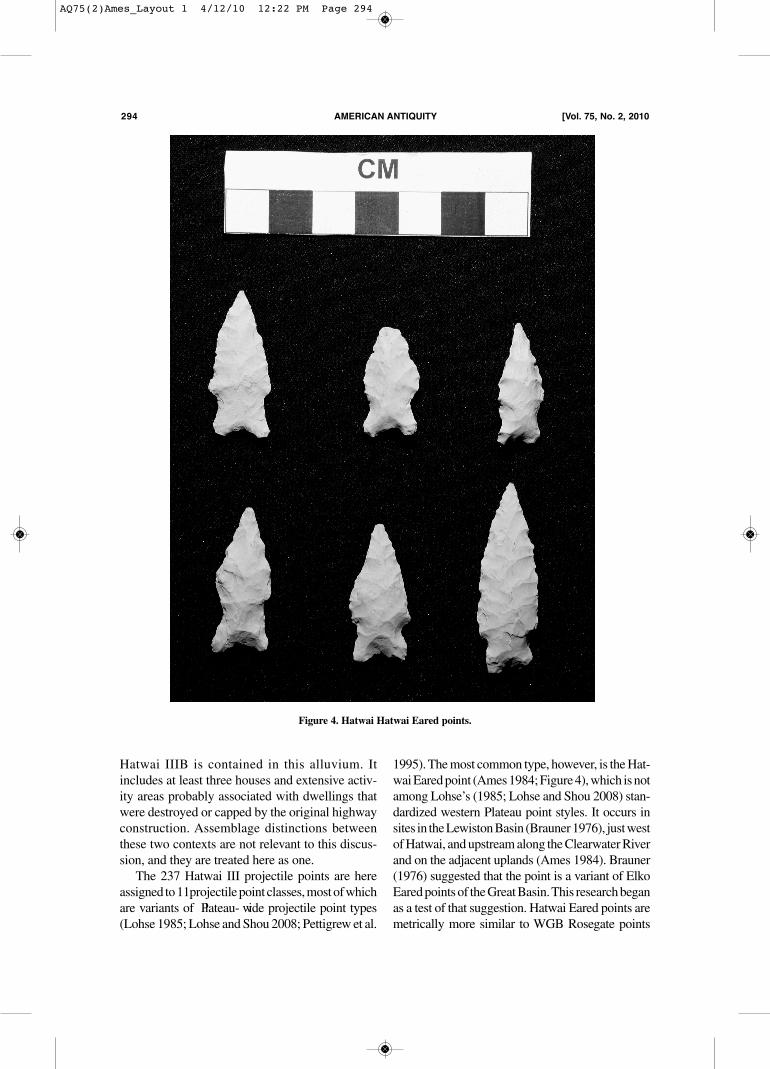
1995). The most common type, however, is the Hat-wai Eared point (Ames 1984; Figure 4), which is notamong Lohse’s (1985; Lohse and Shou 2008) stan-dardized western Plateau point styles. It occurs insites in the Lewiston Basin (Brauner 1976), just westof Hatwai, and upstream along the Clearwater Riverand on the adjacent uplands (Ames 1984). Brauner(1976) suggested that the point is a variant of ElkoEared points of the Great Basin. This research beganas a test of that suggestion. Hatwai Eared points aremetrically more similar to WGB Rosegate points
294 american antiquity [Vol. 75, no. 2, 2010
Figure 4. Hatwai Hatwai Eared points.
AQ75(2)Ames_Layout 1 4/12/10 12:22 PM Page 294

than to Elko Eared points (Thomas 1981; Table 3).3
Although they are smaller, they also have somestrong similarities to WGB Gatecliff Split Stemmedpoints (e.g., Zeanah and Elston 2001:Figure 2a–b,e–h), with which they are contemporary. ThusBrauner was correct in his basic inference that thepoint style has strong affinities with some middle andlate Holocene Great Basin point types. They are alsosimilar to Pettigrew et al.’s (1995) definition of ColdSprings Side Notched points. An analogous styleseems to be associated with the Shuswap Horizonof the central Canadian Plateau’s culture history. TheShuswap Horizon dates to ca. 3500–2400 B.P.(Rousseau 2008). The Hatwai Eared points are foundthroughout the Hatwai III deposits and are directlyassociated with the House 1 and House 6 radiocar-bon dates discussed above.Hatwai IV materials are from scattered contexts
postdating 2800 B.P. that survived the site’s use asa source of fine materials by the Idaho HighwayDepartment. We estimated that perhaps >50 cm ofdeposit were lost when the site was periodicallystripped by belly loaders. Isolated pockets of intactdeposits survived.
Lower Snake River Region
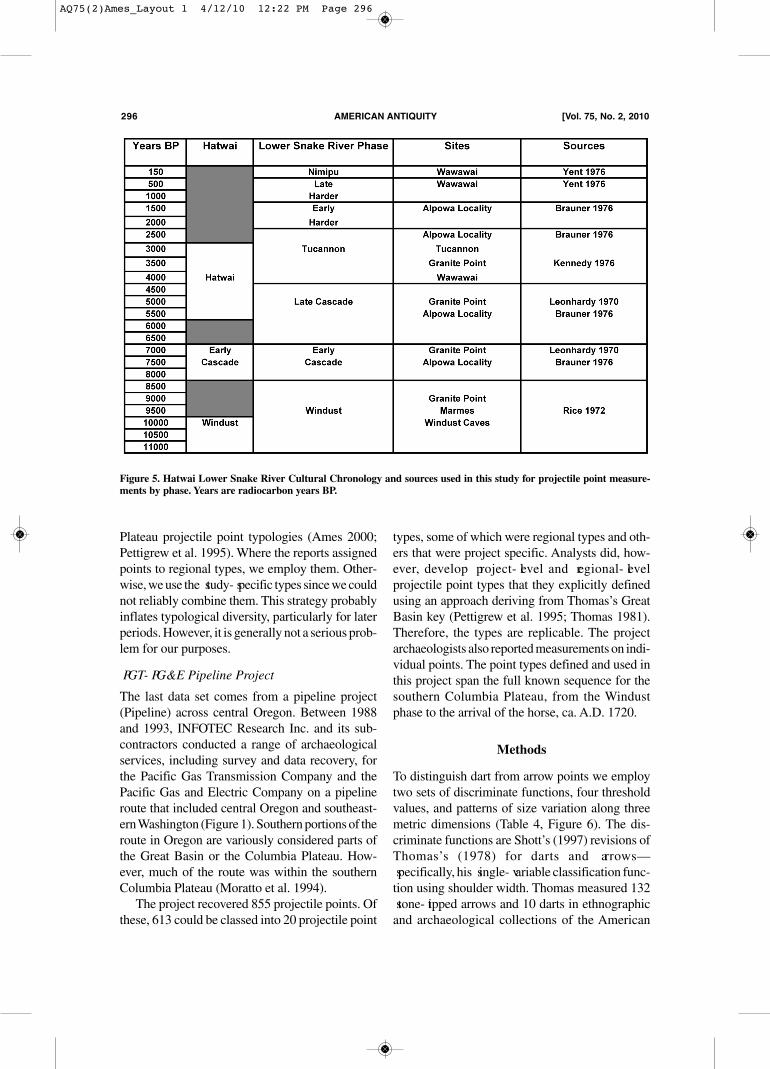
The LSR data include reported means of projectilepoint types spanning the 11,000-year sequence ofthe Lower Snake River region of eastern Wash-ington (Figures 1 and 5). The LSR is the run of theSnake River from its confluence with the Clear-water River to its confluence with the ColumbiaRiver (Figure 1). During the 1960s and 1970s,Washington State University and University ofIdaho archaeologists conducted salvage excava-tions of sites in the proposed reservoirs of dams
under construction along the Snake River. TheMarmes Rockshelter excavations are the bestknown of these (Hicks 2004; Rice 1969). The seriesof excavations were the framework for an 11,000- year- long cultural- historical sequence (Leonhardyand Rice 1970; Figure 5), the longest on the Inter-montane Plateau.The LSR is the logical comparative data set for
Hatwai, since it is clearly part of that region (Sap-pington 1994) and was excavated using techniquesdeveloped in the LSR. We culled projectile pointmeasurements from the final reports and from thesyntheses presented in Ph.D. dissertations and M.A.theses (Figure 5). Virtually all of these studies werecompleted by people supervised and trained byFrank Leonhardy of Washington State Universityand the University of Idaho and so were quite stan-dardized in descriptive format. Ames was alsotrained by Leonhardy and so is very familiar withthe methods employed.This standardization of analytical and descrip-
tive procedures has strengths and weaknesses.Mean measurements are reported for artifact type,not on individual specimens. Means and either stan-dard deviations or minima and maxima arereported, rarely both and sometimes only minimaand maxima. Measurements were not consistentlyrecorded. For example, Rice (1972) did not recordweights for his classes of Windust points. Whenassemblages are described, projectile points andother artifacts are grouped into phase, site, and even component- specific typologies rather than stan-dardized, regional ones. While some regional typesare employed (e.g., Windust, Cascade, ColdSprings Side Notched), usually they are not or theyare referred to only in passing. This is typical of
ames et al.] Dart anD arrOW POintS On tHe cOLumBia PLateau OF WeStern nOrtH america 295
Table 3. Comparison of the Means of Metric Attributes and Ratios of Elko Eared Gatecliff Split Stem, Rosegate andHatwai Eared Points. Attributes and Ratios Based on Thomas 1981.
Attribute Elko Eared Gatecliff SS Rosegate Hatwai Eared
Maximum Length mm 39.9 40.2 30.8 29.0Maximum Width mm 23.6 23.7 17.8 14.2Basal Width mm 18.2 11.8 8.1 11.4Neck Width mm 13.7 12 7.1 9.9Thickness mm 5.3 5 3.3 5.4DSA 165.4 183.8 137 214PSA 132.0 91.9 110.9 111.0Weight gm 4.5 3.6 1.7 3.0Basal Width:Neck Width 1.3 1 1.1 1.1Basal Width:Maximum Width .8 .5 .5 .5
AQ75(2)Ames_Layout 1 4/12/10 12:22 PM Page 295
Plateau projectile point typologies (Ames 2000;Pettigrew et al. 1995). Where the reports assignedpoints to regional types, we employ them. Other-wise, we use the study- specific types since we couldnot reliably combine them. This strategy probablyinflates typological diversity, particularly for laterperiods. However, it is generally not a serious prob-lem for our purposes.
PGT- PG&E Pipeline Project
The last data set comes from a pipeline project(Pipeline) across central Oregon. Between 1988and 1993, INFOTEC Research Inc. and its sub-contractors conducted a range of archaeologicalservices, including survey and data recovery, forthe Pacific Gas Transmission Company and thePacific Gas and Electric Company on a pipelineroute that included central Oregon and southeast-ern Washington (Figure 1). Southern portions of theroute in Oregon are variously considered parts ofthe Great Basin or the Columbia Plateau. How-ever, much of the route was within the southernColumbia Plateau (Moratto et al. 1994).The project recovered 855 projectile points. Of
these, 613 could be classed into 20 projectile point
types, some of which were regional types and oth-ers that were project specific. Analysts did, how-ever, develop project- level and regional- levelprojectile point types that they explicitly definedusing an approach deriving from Thomas’s GreatBasin key (Pettigrew et al. 1995; Thomas 1981).Therefore, the types are replicable. The projectarchaeologists also reported measurements on indi-vidual points. The point types defined and used inthis project span the full known sequence for thesouthern Columbia Plateau, from the Windustphase to the arrival of the horse, ca. A.D. 1720.
Methods
To distinguish dart from arrow points we employtwo sets of discriminate functions, four thresholdvalues, and patterns of size variation along threemetric dimensions (Table 4, Figure 6). The dis-criminate functions are Shott’s (1997) revisions ofThomas’s (1978) for darts and arrows— specifically, his single- variable classification func-tion using shoulder width. Thomas measured 132 stone- tipped arrows and 10 darts in ethnographicand archaeological collections of the American
296 american antiquity [Vol. 75, no. 2, 2010
Figure 5. Hatwai Lower Snake River Cultural Chronology and sources used in this study for projectile point measure-ments by phase. Years are radiocarbon years BP.
AQ75(2)Ames_Layout 1 4/12/10 12:22 PM Page 296
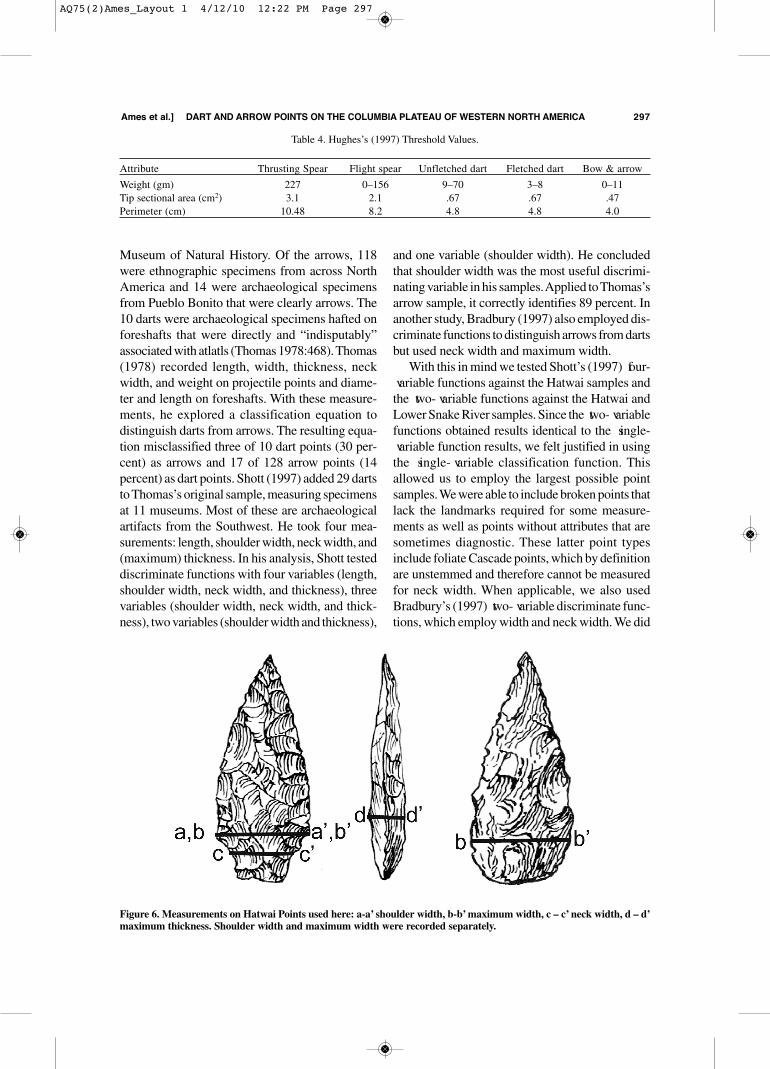
Museum of Natural History. Of the arrows, 118were ethnographic specimens from across NorthAmerica and 14 were archaeological specimensfrom Pueblo Bonito that were clearly arrows. The10 darts were archaeological specimens hafted onforeshafts that were directly and “indisputably”associated with atlatls (Thomas 1978:468). Thomas(1978) recorded length, width, thickness, neckwidth, and weight on projectile points and diame-ter and length on foreshafts. With these measure-ments, he explored a classification equation todistinguish darts from arrows. The resulting equa-tion misclassified three of 10 dart points (30 per-cent) as arrows and 17 of 128 arrow points (14percent) as dart points. Shott (1997) added 29 dartsto Thomas’s original sample, measuring specimensat 11 museums. Most of these are archaeologicalartifacts from the Southwest. He took four mea-surements: length, shoulder width, neck width, and(maximum) thickness. In his analysis, Shott testeddiscriminate functions with four variables (length,shoulder width, neck width, and thickness), threevariables (shoulder width, neck width, and thick-ness), two variables (shoulder width and thickness),
and one variable (shoulder width). He concludedthat shoulder width was the most useful discrimi-nating variable in his samples. Applied to Thomas’sarrow sample, it correctly identifies 89 percent. Inanother study, Bradbury (1997) also employed dis-criminate functions to distinguish arrows from dartsbut used neck width and maximum width.With this in mind we tested Shott’s (1997) four-
variable functions against the Hatwai samples andthe two- variable functions against the Hatwai andLower Snake River samples. Since the two- variablefunctions obtained results identical to the single- variable function results, we felt justified in usingthe single- variable classification function. Thisallowed us to employ the largest possible pointsamples. We were able to include broken points thatlack the landmarks required for some measure-ments as well as points without attributes that aresometimes diagnostic. These latter point typesinclude foliate Cascade points, which by definitionare unstemmed and therefore cannot be measuredfor neck width. When applicable, we also usedBradbury’s (1997) two- variable discriminate func-tions, which employ width and neck width. We did
ames et al.] Dart anD arrOW POintS On tHe cOLumBia PLateau OF WeStern nOrtH america 297
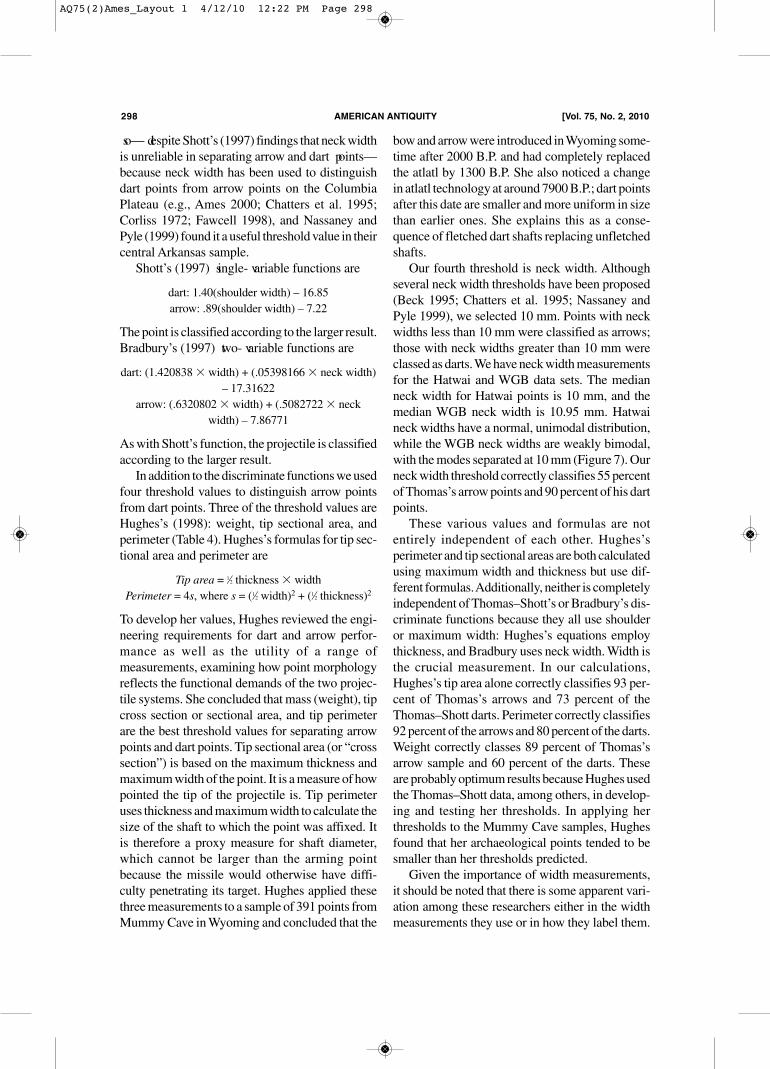
Table 4. Hughes’s (1997) Threshold Values.
Attribute Thrusting Spear Flight spear Unfletched dart Fletched dart Bow & arrow
Weight (gm) 227 0–156 9–70 3–8 0–11Tip sectional area (cm2) 3.1 2.1 .67 .67 .47Perimeter (cm) 10.48 8.2 4.8 4.8 4.0
Figure 6. Measurements on Hatwai Points used here: a-a’ shoulder width, b-b’ maximum width, c – c’ neck width, d – d’maximum thickness. Shoulder width and maximum width were recorded separately.
AQ75(2)Ames_Layout 1 4/12/10 12:22 PM Page 297
so— despite Shott’s (1997) findings that neck widthis unreliable in separating arrow and dart points— because neck width has been used to distinguishdart points from arrow points on the ColumbiaPlateau (e.g., Ames 2000; Chatters et al. 1995;Corliss 1972; Fawcell 1998), and Nassaney andPyle (1999) found it a useful threshold value in theircentral Arkansas sample.Shott’s (1997) single- variable functions are
dart: 1.40(shoulder width) – 16.85arrow: .89(shoulder width) – 7.22
The point is classified according to the larger result.Bradbury’s (1997) two- variable functions are
dart: (1.420838 � width) + (.05398166 � neck width)– 17.31622
arrow: (.6320802 � width) + (.5082722 � neckwidth) – 7.86771
As with Shott’s function, the projectile is classifiedaccording to the larger result.In addition to the discriminate functions we used
four threshold values to distinguish arrow pointsfrom dart points. Three of the threshold values areHughes’s (1998): weight, tip sectional area, andperimeter (Table 4). Hughes’s formulas for tip sec-tional area and perimeter are
Tip area = 1⁄2 thickness � widthPerimeter = 4s, where s = (1⁄2 width)2 + (1⁄2 thickness)2
To develop her values, Hughes reviewed the engi-neering requirements for dart and arrow perfor-mance as well as the utility of a range ofmeasurements, examining how point morphologyreflects the functional demands of the two projec-tile systems. She concluded that mass (weight), tipcross section or sectional area, and tip perimeterare the best threshold values for separating arrowpoints and dart points. Tip sectional area (or “crosssection”) is based on the maximum thickness andmaximum width of the point. It is a measure of howpointed the tip of the projectile is. Tip perimeteruses thickness and maximum width to calculate thesize of the shaft to which the point was affixed. Itis therefore a proxy measure for shaft diameter,which cannot be larger than the arming pointbecause the missile would otherwise have diffi-culty penetrating its target. Hughes applied thesethree measurements to a sample of 391 points fromMummy Cave in Wyoming and concluded that the
bow and arrow were introduced in Wyoming some-time after 2000 B.P. and had completely replacedthe atlatl by 1300 B.P. She also noticed a changein atlatl technology at around 7900 B.P.; dart pointsafter this date are smaller and more uniform in sizethan earlier ones. She explains this as a conse-quence of fletched dart shafts replacing unfletchedshafts.Our fourth threshold is neck width. Although
several neck width thresholds have been proposed(Beck 1995; Chatters et al. 1995; Nassaney andPyle 1999), we selected 10 mm. Points with neckwidths less than 10 mm were classified as arrows;those with neck widths greater than 10 mm wereclassed as darts. We have neck width measurementsfor the Hatwai and WGB data sets. The medianneck width for Hatwai points is 10 mm, and themedian WGB neck width is 10.95 mm. Hatwaineck widths have a normal, unimodal distribution,while the WGB neck widths are weakly bimodal,with the modes separated at 10 mm (Figure 7). Ourneck width threshold correctly classifies 55 percentof Thomas’s arrow points and 90 percent of his dartpoints.These various values and formulas are not
entirely independent of each other. Hughes’sperimeter and tip sectional areas are both calculatedusing maximum width and thickness but use dif-ferent formulas. Additionally, neither is completelyindependent of Thomas–Shott’s or Bradbury’s dis-criminate functions because they all use shoulderor maximum width: Hughes’s equations employthickness, and Bradbury uses neck width. Width isthe crucial measurement. In our calculations,Hughes’s tip area alone correctly classifies 93 per-cent of Thomas’s arrows and 73 percent of theThomas–Shott darts. Perimeter correctly classifies92 percent of the arrows and 80 percent of the darts.Weight correctly classes 89 percent of Thomas’sarrow sample and 60 percent of the darts. Theseare probably optimum results because Hughes usedthe Thomas–Shott data, among others, in develop-ing and testing her thresholds. In applying herthresholds to the Mummy Cave samples, Hughesfound that her archaeological points tended to besmaller than her thresholds predicted.Given the importance of width measurements,
it should be noted that there is some apparent vari-ation among these researchers either in the widthmeasurements they use or in how they label them.
298 american antiquity [Vol. 75, no. 2, 2010
AQ75(2)Ames_Layout 1 4/12/10 12:22 PM Page 298

Hughes (1998:Figure 7) clearly distinguishes max-imum from shoulder width in her measurementsand uses maximum width in her formulas. Theother investigators do not clearly distinguish thetwo. Thomas (1978) uses width but does not spec-ify whether he measured maximum or shoulderwidth. Elsewhere (e.g., 1984) he reports the max-imum width for each point, so we assume that hemeasured maximum width on the museum speci-mens. Shott (1997) assumes that Thomas’s widthis shoulder width. In his text and graphs Shott dis-cusses shoulder width, but in his Table 1 the mea-surement is labeled maximum width. Bradbury(1997) also uses width without specifying maxi-mum or shoulder width. On the Hatwai artifacts,we recorded a range of measurements, includingmaximum width, shoulder width, neck width, andmaximum thickness (Figure 6). In many of the Hat-wai stemmed/notched points, shoulder width is themaximum width, as it no doubt is in the collectionsBradbury, Shott, and Thomas examined. In our cal-culations, we use maximum widths for forms bothwith and without shoulders.Our results for the WGB and Hatwai points are
presented in a series of tables (Tables 5–10). The
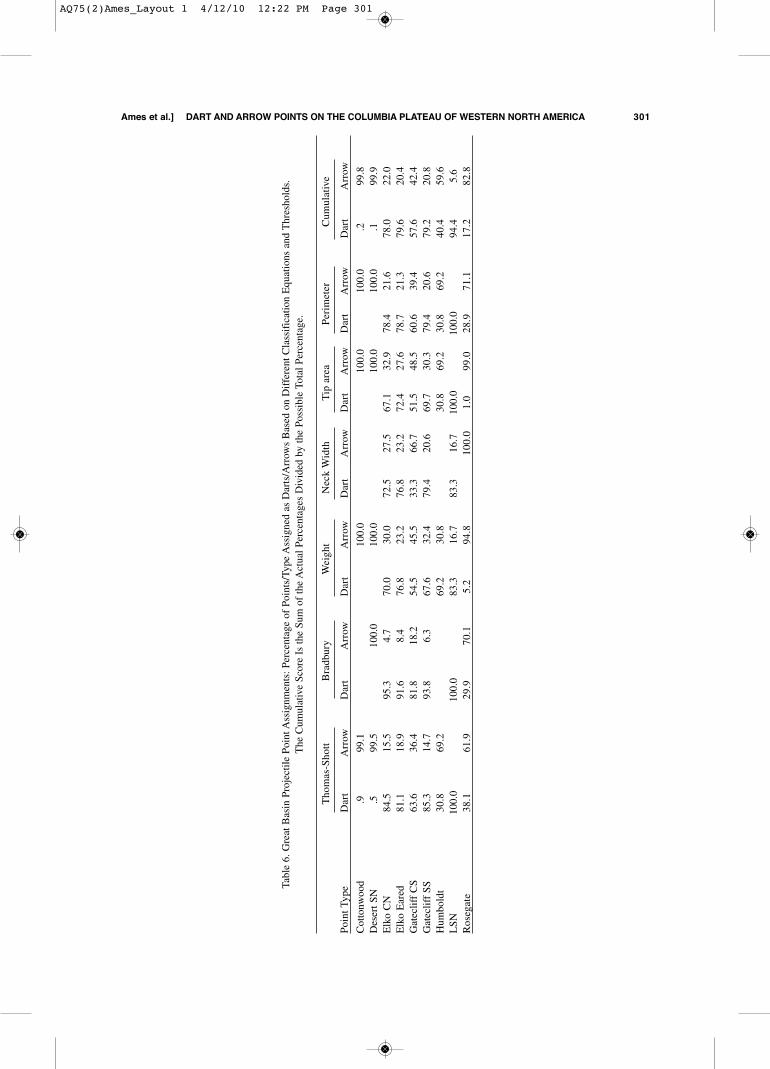
tables include the means and standard deviationsfor the measurements we use for each WGB andHatwai projectile point type (Table 1). Classifica-tion of the WGB and Hatwai point types as eitherarrows or darts is displayed at two levels: by actualartifact count and by the type means for each mea-surement (Tables 5 and 7). Thus Table 5, for exam-ple, shows that of the 284 Elko Eared points in theWGB sample, 240 are classed as darts and 44 asarrows by the Thomas–Shott equation, 246 as dartsand 12 as arrows by Bradbury’s equation, and soon. It also shows that the Elko Eared projectilepoint type is classed as a dart by the Thomas–Shottequation using the type’s mean maximum width.Despite injunctions against employing means (e.g.,Bradbury 1997), we calculated them to assess theirutility for distinguishing darts and arrows becausethe Lower Snake River data are exclusively meanvalues. To more easily evaluate the classificationresults of the various equations and thresholds foreach projectile point type, the counts in Tables 5and 7 were converted to percentages (Tables 6 and8). These percentages are further reduced in thesetables to a single index: the “cumulative percent-age.” The cumulative percentage summarizes the
ames et al.] Dart anD arrOW POintS On tHe cOLumBia PLateau OF WeStern nOrtH america 299
Figure 7. Comparisons of Western Great Basin and Hatwai projectile point sizes by weight (panels a, d) neck width (b,e) and width (c, f).
AQ75(2)Ames_Layout 1 4/12/10 12:22 PM Page 299

300 american antiquity [Vol. 75, no. 2, 2010
Table 5. Great Basin Projectile Points Dart/A
rrow Assignm
ents: Totals of Points/Type Assigned as Darts/Arrows Based on Different Classification Equations and Thresholds.
Points are Assigned as Either Arrows or Darts, Intermediate Sizes (Large Arrow/Small D
art) are Assigned as Darts.
Thomas-Shott
Bradbury
Weight
Neck Width
Tip area
Perimeter
Point Type
NDart
Arrow
Dart
Arrow
Dart
Arrow
Dart
Arrow
Dart
Arrow
Dart
Arrow
Cottonwood
108
1107
108
108
108
Mean
XX
.21.8
Desert SN
189
1188
189
189
189
189
189
Mean
XX
XX
.16
1.7
Elko CN
284
240
44246
12198
85206
78186
91222
61Mean
XX
XX
.65.6
Elko Eared
9577
1876
773
2273
2263
2474
20Mean
XX
XX
.73
5.8
Gatecliff CS
3321
1227
618
1511
2217
1620
13Mean
XX
XX
.54.7
Gatecliff SS
3429
530
223
1127
723
1027
7Mean
XX
XX
.57
6.1
Hum
boldt
134
99
44
94
9Mean
XX
.46
.46
3.3
LSN
3126
55
51
51
66
Mean
XX
XX
.62
5.5
Rosegate
9737
6029
685
9297
196
2869
Mean
XX
XX
.33.3
AQ75(2)Ames_Layout 1 4/12/10 12:22 PM Page 300
ames et al.] Dart anD arrOW POintS On tHe cOLumBia PLateau OF WeStern nOrtH america 301
Table 6. Great Basin Projectile Point Assignm
ents: Percentage of Points/Type Assigned as Darts/Arrows Based on Different Classification Equations and Thresholds.
The Cum
ulative Score Is the Sum of the Actual Percentages Divided by the Possible Total Percentage.
Thomas-Shott
Bradbury
Weight
Neck Width
Tip area
Perimeter
Cum
ulative
Point Type
Dart
Arrow
Dart
Arrow
Dart
Arrow
Dart
Arrow
Dart
Arrow
Dart
Arrow
Dart
Arrow
Cottonwood
.999.1
100.0
100.0
100.0
.299.8
Desert SN
.599.5
100.0
100.0
100.0
100.0
.199.9
Elko CN
84.5
15.5
95.3
4.7
70.0
30.0
72.5
27.5
67.1
32.9
78.4
21.6
78.0
22.0
Elko Eared
81.1
18.9
91.6
8.4
76.8
23.2
76.8
23.2
72.4
27.6
78.7
21.3
79.6
20.4
Gatecliff CS
63.6
36.4
81.8
18.2
54.5
45.5
33.3
66.7
51.5
48.5
60.6
39.4
57.6
42.4
Gatecliff SS
85.3
14.7
93.8
6.3
67.6
32.4
79.4
20.6
69.7
30.3
79.4
20.6
79.2
20.8
Hum
boldt
30.8
69.2
69.2
30.8
30.8
69.2
30.8
69.2
40.4
59.6
LSN
100.0
100.0
83.3
16.7
83.3
16.7
100.0
100.0
94.4
5.6
Rosegate
38.1
61.9
29.9
70.1
5.2
94.8
100.0
1.0
99.0
28.9
71.1
17.2
82.8
AQ75(2)Ames_Layout 1 4/12/10 12:22 PM Page 301

302 american antiquity [Vol. 75, no. 2, 2010
Table 7. Hatwai Projectile Points: Dart/A
rrow assignm
ents: Totals of Points/Type Assigned as Darts/Arrows Based on Different Classification Equations and Thresholds.
Points Are Assigned as Either Arrows or Darts, Intermediate Sizes (Large Arrow/Small D
art) are Assigned as Darts.
Thomas-Shott
Bradbury
Weight
Neck Width
Tip area
Perimeter
Point Type
NDart
Arrow
Dart
Arrow
Dart
Arrow
Dart
Arrow
Dart
Arrow
Dart
Arrow
Windust
115
65
610
110
92
56
Mean
XX
XX
.65
4.3
Cascade
1313
76
310
13Mean
XX
.43
2.8
Colum
bia CN B
327
2512
167
259
2332
329
Mean
XX
X9.4
.19
2.5
Colum
bia S A
55
32
55
55
Mean
XX
X5.9
.09
2.5
Desert SN
44
13
44
55
Mean
XX
X6.8
.07
1.1
Foliate
91
88
19
18
Mean
XX
.22
2.6
Hatwai Eared
119
7112
9101
1065
3775
2109
4111
Mean
XX
X9.9
.17
2.1
Nespelem Bar
133
107
87
67
613
310
Mean
XX
X10.7
2.6
3.1
Quelomene Bar CN
217
147
143
229
131
218
13Mean
XX
X10
.22
3.3
Rabbit Island S
141
133
112
121
1112
111
Mean
XX
X8
.18
2.3
Hatwai Small SN
44
44
44
4Mean
XX
X8.5
1.5
2Hatwai Medium CN
72
51
67
52
71
6Mean
XX
X10.4
.19
3.2
Hatwai Misc. CN
111
101
112
84
710
110
Mean
Xx
X9.7
.18
2.5
AQ75(2)Ames_Layout 1 4/12/10 12:22 PM Page 302

ames et al.] Dart anD arrOW POintS On tHe cOLumBia PLateau OF WeStern nOrtH america 303
Table 8. Hatwai Projectile Points. Percentage of Points/Type Assigned as Darts/Arrows Based on Different Classification Equations and Thresholds.
The Cum
ulative Score Is the Sum of The Actual Percentages Divided by the Possible Total Percentage.
Thomas-Shott
Bradbury
Weight
Neck Width
Tip area
Perimeter
Cum
ulative
Point Type
Dart
Arrow
Dart
Arrow
Dart
Arrow
Dart
Arrow
Dart
Arrow
Dart
Arrow
Dart
Arrow
Windust
45.5
54.5
45.5
54.5
90.9
9.1
100.0
80.0
20.0
54.5
45.5
69.4
30.6
Cascade
100.0
53.8
46.2
23.1
76.9
100.0
19.2
80.8
Colum
bia CN B
21.9
78.1
42.9
57.1
21.9
78.1
28.1
71.9
100.0
9.4
90.6
20.7
79.3
Colum
bia ST A
100.0
60.0
40.0
100.0
100.0
100.0
100.0
10.0
90.0
Desert SN
100.0
25.0
75.0
100.0
100.0
100.0
100.0
4.2
95.8
Foliate
11.1
88.9
88.9
11.1
100.0
11.1
88.9
27.8
72.2
Hatwai Eared
5.9
94.1
8.2
91.8
13.3
86.7
33.0
67.0
1.8
98.2
3.5
96.5
11.0
89.0
Nespelem Bar
23.1
76.9
46.7
53.3
53.8
46.2
53.8
46.2
100.0
23.1
76.9
33.4
66.6
Quelomene Bar
33.3
66.7
33.3
66.7
12.0
88.0
40.9
59.1
4.5
95.5
38.1
61.9
27.0
73.0
Rabbit Island
7.1
92.9
21.4
78.6
14.3
85.7
8.3
91.7
100.0
8.3
91.7
9.9
90.1
Hatwai Small SN
100.0
100.0
100.0
100.0
100.0
100.0
100.0
Hatwai Med CN
28.6
71.4
14.3
85.7
100.0
71.4
28.6
100.0
14.3
85.7
21.4
78.6
Misc. CN
9.1
90.9
8.3
91.7
20.0
80.0
36.4
63.6
100.0
9.1
90.9
13.8
86.2
AQ75(2)Ames_Layout 1 4/12/10 12:22 PM Page 303

information for each projectile point type by sum-ming the percentages for darts or arrows across thetables’ columns and dividing by the theoretical sum(400 for points without neck widths, 600 for thosewith). For example, the cumulative percentages forthe museum arrow and dart samples are as follows:darts, 81 percent (cumulative percentage of dartscorrectly identified by all measures); arrows, 85percent (cumulative percentage of arrows correctlyidentified by all measures). Because of differencesin available data, the LSR and Pipeline results aredisplayed differently: only the Thomas–Shottresults are presented since the relevant reports didnot include point weight or thickness.Finally, we used patterns of variation in weight,
tip area, and perimeter in order to distinguish arrowand dart points (Figure 8). The patterns for arrow(Figure 8a) and dart (Figure 8b) points are dis-played in three- dimensional graphs, in which theweights (x- axis), tip areas (y- axis), and perimeters (z- axis) of Thomas and Shott’s museum samplesare plotted. In Figure 8c, tip area and perimeter onlyare plotted because Shott did not record the weightsof the darts that he added to Thomas’s sample. Indi-vidual artifacts are circles: open circles are pointsclassed as darts by the Thomas–Shott formulas;gray circles are classed as arrows. In these graphs,as in Figure 8a, arrows tend to cluster tightly in thelower right segment of the graph space, while dartsare higher and more dispersed in the space (Figure
304 american antiquity [Vol. 75, no. 2, 2010
Table 9. Lower Snake River Projectile Points by Period. Types Are The Number of Projectile Types/Period, Mean Is TheMean Number of Points/Type. Points Are Assigned as Either Arrows or Darts, Intermediate Sizes (Large Arrow/Small
Dart) Are Assigned as Darts.
Phase N Arrow Dart % Arrow % Dart Types Mean
Nimipu 39 34 5 87.2 12.8 12 3.25Late Harder 146 123 23 84.2 15.8 31 4.71Early Harder 125 73 52 58.4 41.6 26 4.81Tucannon 160 136 24 85.0 15.0 25 6.40Late Cascade 31 19 12 61.3 38.7 10 3.10Early Cascade 85 83 2 97.6 2.4 4 21.25Windust 203 39 181 19.2 89.2 18 11.28
Table 10. Classification of Projectile Points from the Pipeline Project.
Point Type Mean N N Arrow N Dart % Arrow % Dart Time Range
Lanceolate Concave Base Dart 6 3 3 50.0 50.0 10,500–7500 B.P.Cascade Arrow 16 12 4 75.0 25.0 8000–3500 B.P.General Willow Leaf Dart 19 9 10 47.4 52.6 8000–3500 B.P.Mahkin Shouldered Dart 32 11 21 34.4 65.6 8000–3500 B.P.Cold Springs SN A Arrow 8 6 2 75.0 25.0 7000–3500 B.PCold Springs SN B Arrow 22 17 5 77.3 22.7 7000–3500 B.P.?Shaniko Shouldered Arrow 79 46 33 58.2 41.8 5000–1000 B.P.John Day Barbed Arrow 21 10 11 47.6 52.4 4000–1500 B.P.John Day Shouldered Arrow 31 24 7 77.4 22.6 4000–1500 B.P.Rabbit Island Stemmed Arrow 42 35 7 83.3 16.7 4000–1500 B.P.Shaniko Barbed Arrow 75 44 31 58.7 41.3 3000–150 B.P.Madras Barbed Dart 8 8 100.0 post-3000 B.P.Madras Shouldered Dart 19 3 16 15.8 84.2 post-3000 B.P.Quilomene Bar BN Dart 21 21 100.0 post-3000 B.P.Madras SN Dart 4 4 100.0 post-3000 B.P.Willowdale Square Barbed Arrow 14 12 2 85.7 14.3 2200–1600 B.P.Miller Island Diamond Stem Arrow 8 8 100.0 post 2000 B.P.Sherman Pin Stem Arrow 36 34 1 94.4 2.8 1750–115 B.P.Plateau Corner-Notched Arrow 116 112 4 96.6 3.4 1500 B.P.- ProtohistoricPlateau Side-Notched Arrow 5 4 1 80.0 20.0 1500 B.P.- Protohistoric
AQ75(2)Ames_Layout 1 4/12/10 12:22 PM Page 304

8b). This dispersed pattern is usually very robust(Figure 8c), in a pattern we call the “atlatl cloud.”While the cloud pattern differs among dart pointtypes, it is a consistent quality of the dart pointclasses in this study.The difference between the clustered pattern of
arrows in these graphs and the more dispersed atlatlcloud pattern might seem to imply that dart pointsare not only larger than arrows but more variablein size. However, when the size differences betweenarrow and dart points are controlled, dart points canbe more variable than arrow points, but not neces-sarily. We controlled for the size differences by cal-culating coefficients of variation (CV; standarddeviation/mean) for the Western Great Basin andHatwai projectile point types for all the measuresused here. By expressing standard deviations as apercentage, the CV puts them on the same scale.For example, mean weight of the WGB Cotton-wood Triangular points (an arrow point type) is .70g, with a standard deviation of .32 g. The mean
weight for the WGB Gatecliff ContractingStemmed points (a dart point type) is 3.5 g, with astandard deviation of 1.5 g. However, the CVs are.45 and .43, respectively. Gatecliff ContractingStemmed points are bigger than Cottonwood Tri-angular points but not more variable, at least not inweight. The CVs do not, in fact, distinguish dartpoints from arrow points, although darts tend tohave larger CVs. However, the cloud pattern is alsoa product of how dart and arrow points vary alongthe three dimensions plotted here. The CVs maybe similar, but the patterns or shapes of variationaround those dimensions are not. That is what weendeavor to show with the graphs.
Results
Western Great Basin
Cottonwood Triangular and Desert Side Notchedpoints are unambiguously classed as arrows, as
ames et al.] Dart anD arrOW POintS On tHe cOLumBia PLateau OF WeStern nOrtH america 305
Figure 8. Size variation in Thomas’ sample of arrows (a), darts (b) (Thomas 1978) and Shott’s combined sample of darts(c) (Shott 1997).
AQ75(2)Ames_Layout 1 4/12/10 12:22 PM Page 305

they should be, since they are epitomes of lateHolocene arrow points. Indeed, their classificationis more definitive than that of Thomas’s museumarrow sample. They also exemplify the arrow pat-tern in the graphs (Figure 9a–b), clustering tightlyin the graphs’ lower right- hand space. In contrast,Rosegate points are somewhat more dispersed inthe graph space (Figure 9c), although they areclearly arrow points and lack the atlatl cloud.Rosegate points are generally regarded as the firstarrow points in the WGB. Interestingly, the thresh-old values and the means (Table 5) are virtuallyunanimous that Rosegate points are arrow points,while the discriminate functions are somewhat lessso.The dart results (Figure 10) mirror dart results
in other studies (e.g., Nassaney and Pyle 1999), inwhich a substantial minority of points in a dart typeare misclassed as arrows. The graphs illustraterobust atlatl clouds. Interestingly, Large SideNotched points are classed as dart points as defin-
itively as Desert Side Notched and CottonwoodTriangular points are classed as arrow points (Fig-ure 10d).
Hatwai
Relevant measurements and results for each Hat-wai artifact are reported in Ames et al. 2007, whichis available online. The classification results for theHatwai I Windust points are mixed. By some mea-sures they might be arrow points, and by others,dart points. Their mean weight, tip area, and neckwidth, however, unambiguously classify them asdart points (Table 7). The points show considerablevariability (Figure 11a). This variability probablyis due to several factors. Windust points were com-monly extensively reworked and reduced in sizeduring their use lives. Discarded points often havea stem and only the nub of a blade. The two small-est Hatwai Windust points fit that description (Fig-ure 2). The variability may also reflect engineeringissues with darts. According to Hughes (1998), bal-
306 american antiquity [Vol. 75, no. 2, 2010
Figure 9. Size variation in Western Great Basin arrow tips: Cottonwood Triangular (a), Desert Side Notched (b), andRosegate (c).
AQ75(2)Ames_Layout 1 4/12/10 12:22 PM Page 306

ance is a problem for unfletched darts, but one thatcan be corrected by altering the tip weight. The vari-ability we see in Windust points meets Hughes’sexpectations for variability in unfletched dartpoints. Their sizes, however, are small enough forthem to be points for fletched darts. It is generallyassumed that these points armed handheld orthrown spears (e.g., Beck 1995). Our results showthis assumption to be incorrect, at least for the Hat-wai Windust points.Cascade points (Figure 11b; Figure 12a, f) con-
trast markedly with Windust points. They not onlydiffer in form but are much more uniform in shapeand size, although Figure 12 hints at more than onesize grouping within the type’s narrow size limits.This apparent consistency fits Hughes’s predictionsfor fletched dart points, and she sees a similar shiftin patterns of size variability at Mummy Cave atca. 7900 B.P., when highly variable point formswere also replaced by much less variable forms. Inthe Hatwai sample, however, the Cascade points as
a type are classed as arrows by all measures exceptmean weight, and the weights of individual pointsare consistent with medium- sized arrow points(Table 7). Individually they are all classed as arrowpoints (Figure 11b), and their pattern of variabilityis that of arrow points rather than dart points. Unlikeall of the small WGB dart points, for instance,which presumably armed fletched shafts, Cascadepoints have no atlatl cloud (Figure 11c).Hatwai III points are classed as arrow points.
This discussion focuses on the 119 Hatwai Earedpoints (Figure 4). Table 1 presents the mean mea-surements for all 119 and then separately for thefive largest (Hatwai Eared B), which are clearlydart/spear points based on their sizes, and for therest (Hatwai Eared A; Figure 13). All 119 areincluded here. Their cumulative percentage of 87percent arrow assignment (Table 8) is higher thanthe cumulative percentage (85 percent) forThomas’s (1978) arrow sample. TheThomas–Shott equations classify 112 (94 percent)
ames et al.] Dart anD arrOW POintS On tHe cOLumBia PLateau OF WeStern nOrtH america 307
Figure 10. Size variation in Western Great Basin dart points. Elko Corner Notched (a), Elko Eared (b), GatecliffContracting Stem (c), Large Side Notch (d).
AQ75(2)Ames_Layout 1 4/12/10 12:22 PM Page 307
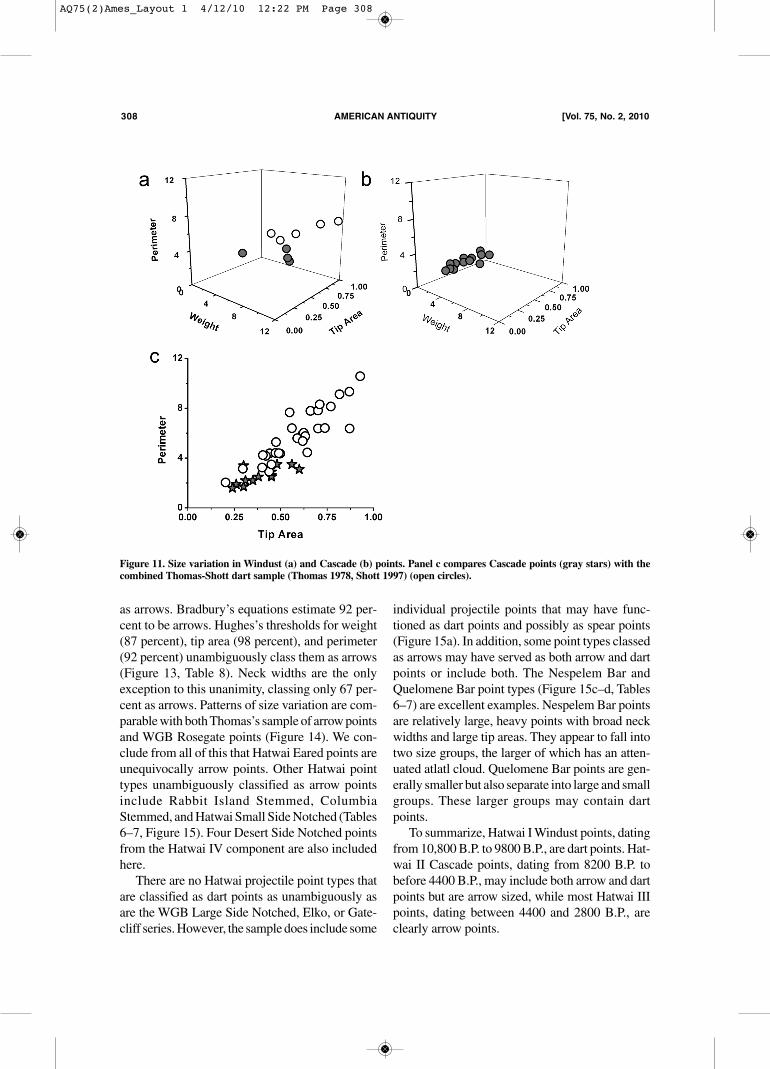
as arrows. Bradbury’s equations estimate 92 per-cent to be arrows. Hughes’s thresholds for weight(87 percent), tip area (98 percent), and perimeter(92 percent) unambiguously class them as arrows(Figure 13, Table 8). Neck widths are the onlyexception to this unanimity, classing only 67 per-cent as arrows. Patterns of size variation are com-parable with both Thomas’s sample of arrow pointsand WGB Rosegate points (Figure 14). We con-clude from all of this that Hatwai Eared points areunequivocally arrow points. Other Hatwai pointtypes unambiguously classified as arrow pointsinclude Rabbit Island Stemmed, ColumbiaStemmed, and Hatwai Small Side Notched (Tables6–7, Figure 15). Four Desert Side Notched pointsfrom the Hatwai IV component are also includedhere.There are no Hatwai projectile point types that
are classified as dart points as unambiguously asare the WGB Large Side Notched, Elko, or Gate-cliff series. However, the sample does include some
individual projectile points that may have func-tioned as dart points and possibly as spear points(Figure 15a). In addition, some point types classedas arrows may have served as both arrow and dartpoints or include both. The Nespelem Bar andQuelomene Bar point types (Figure 15c–d, Tables6–7) are excellent examples. Nespelem Bar pointsare relatively large, heavy points with broad neckwidths and large tip areas. They appear to fall intotwo size groups, the larger of which has an atten-uated atlatl cloud. Quelomene Bar points are gen-erally smaller but also separate into large and smallgroups. These larger groups may contain dartpoints.To summarize, Hatwai I Windust points, dating
from 10,800 B.P. to 9800 B.P., are dart points. Hat-wai II Cascade points, dating from 8200 B.P. tobefore 4400 B.P., may include both arrow and dartpoints but are arrow sized, while most Hatwai IIIpoints, dating between 4400 and 2800 B.P., areclearly arrow points.
308 american antiquity [Vol. 75, no. 2, 2010
Figure 11. Size variation in Windust (a) and Cascade (b) points. Panel c compares Cascade points (gray stars) with thecombined Thomas-Shott dart sample (Thomas 1978, Shott 1997) (open circles).
AQ75(2)Ames_Layout 1 4/12/10 12:22 PM Page 308

Lower Snake River Region
Our LSR data are presented in two graphs and a table.In the first graph, the mean weights (Figure 16a),perimeters (Figure 16b), and tip areas (Figure 16c)for each type are plotted by phase. In the secondgraph (Figure 17), the means are binned and plottedby phase. In both sets of graphs, dashed lines indi-cate Hughes’s threshold values. Because we seldomhad measurements for individual artifacts, numbersof arrows and darts were estimated by counting allthe members of a class as either arrows or darts ifthe class itself was classified as arrow or dart.Because the LSR data are based on mean val-
ues, sample size and number of projectile pointtypes per phase and number of artifacts per typeare important (Table 9). The late Cascade andNimipu phases have the smallest sample sizes, andWindust, the largest. The graphs mix taxonomiclevels. For example, Rice (1972) recognized onebasic regional Windust type with multiple subtypes.The subtypes are used in the graphs rather than oneWindust type. Cascade points are a single, regionaltype represented at four sites in these data; hencethey appear four times on the graphs. We did thatto avoid calculating a mean of the means of the four
sites. The mean number of points/class figure forthe early Cascade phase is deceptive, because 79of the 85 points are in a single class from the Gran-ite Point site (Figure 1). The data for the late Cas-cade subphase combine regional types with site- specific groups. After the late Cascade sub-phase, all the types are site specific or even specificto a single site component. However, in the absenceof measurements of individual artifacts, they do areasonably good job tracking artifact sizes becausethe number of types is high while the number ofartifacts/type is low.We applied the Thomas–Shott equations and
calculated perimeter and tip area for projectile typeminimum, mean, and maximum for the 125 LSRprojectile point types. In the interests of space onlymeans are reported here. The complete data arereported elsewhere (Ames et al. 2007) and are avail-able online. The classification of specimens asarrow or dart in Table 9 is based on evaluation ofall results.The threshold values for Windust points rein-
force the conclusion that they are dart points, asdoes the broad spread of threshold values amongWindust point subtypes (Figure 16). This spread
ames et al.] Dart anD arrOW POintS On tHe cOLumBia PLateau OF WeStern nOrtH america 309
Figure 12. Cascade point widths of the Hatwai (a), Granite Point (b), Pipeline (c), Ryegrass Coulee (d) and Combined (e)samples and thicknesses of the Hatwai (f), Granite Point (g), Ryegrass Coulee (h) and Combined (i) samples.
AQ75(2)Ames_Layout 1 4/12/10 12:22 PM Page 309

mirrors that of the Hatwai Windust sample (Table9). The type means for Cascade points indicate thatCascade points are overwhelmingly arrow points.As it happens, it is possible in this one LSR caseto check that inference. Nisbit (1981:111) tookwidth, length, and thickness measurements on 17of the 79 Cascade points recovered at the GranitePoint site (Figure 1), the only such set of LSR mea-surements we have. The Granite Point Cascadepoints are somewhat larger than the Hatwai points(Figure 12b, g), but most are arrow sized. Width isunimodally distributed among the Granite Pointartifacts. The Thomas–Shott single- variable equa-
tion classes three (14 percent) as dart points;Hughes’s perimeter threshold classes the samethree as dart points; and her tip area classes nine(42 percent) as large arrow/small dart points. Thesenumbers and the graphs again suggest that Cascadepoints as a type are arrow points or include botharrow and dart points.The graphs and table show important temporal
trends. Although the late Cascade sample is small,both arrow and dart points are indicated. The sam-ple is too small to draw any other conclusions. TheTucannon phase is very similar to the contempo-rary Hatwai III component in that dart points were
310 american antiquity [Vol. 75, no. 2, 2010
Figure 13. Hatwai Eared sub-type widths (a), weights (b), thicknesses (c), neck widths (d), tip areas (e) and perimeters(f). Dashed lines indicate Hughes’ (1998) thresholds (Table 4).
AQ75(2)Ames_Layout 1 4/12/10 12:22 PM Page 310

present, but the majority of the assemblage seemsto be arrow points. The overall proportion of arrowpoints to dart points in Hatwai III (that is, 85 per-cent arrows) is the same as the proportion of arrowsin the LSR region’s Tucannon phase (Table 9).In the early Harder phase, the relative number
of dart points increased, from 15 percent of thetotal number of projectile points in the precedingTucannon phase to almost 42 percent (Table 9), thehighest percentage of dart points in the LSR assem-blages after the Windust phase. Arrow and dartpoints also diverged in size. This divergence prob-ably began during the Tucannon phase but is quiteevident in the early Harder phase. Mean weightsshift toward both the small and large tails of thedistribution, and the slightly bimodal distributionof tip areas during the Tucannon phase becomes
strongly bimodal in the early Harder phase. Closeexamination of mean perimeters (Figure 17b)shows that both tails of the distribution fatten in theearly Harder phase. These patterns are commen-surate with a gradual divergence of dart and arrowpoints. The patterns shift markedly in the lateHarder phase with the visible appearance of smallarrow points and the strongest distinction betweenarrow and dart points of the entire sequence. Thisshift may indicate that local arrow point styles werereplaced with a new, smaller arrow point. At thesame time, darts both declined in numbers andbecame metrically very distinct. Later in time, inthe contact- period Nimipu phase (which dates toafter the introduction of the horse), the size of arrowpoints is even smaller, even though people contin-ued to use darts.
ames et al.] Dart anD arrOW POintS On tHe cOLumBia PLateau OF WeStern nOrtH america 311
Figure 14. Metric variability in Hatwai Eared Points (a) Hatwai Eared points compared to the full size range variationin Thomas’ Arrow sample (Thomas 1978) (b), Hatwai Eared points compared to the Thomas arrow sample using thestandard x, y and z axis sizes in this paper (c) and Hatwai Eared compared to Rosegate points.(d). In panel a, open cir-cles are points classed as darts, gray circles are arrows. In the other panels, gray stars are Hatwai Eared points, open cir-cles the other points.
AQ75(2)Ames_Layout 1 4/12/10 12:22 PM Page 311

In sum, the LSR data indicate that bows andarrows were present during the early Cascade sub-phase (8500–7000 B.P.). Use of atlatl darts was rel-atively common during the late Cascade(7000–4500 B.P.) but declined during the Tucan-non phase. Dart use revived during early Harder(2500–1500 B.P.). The atlatl was replaced by thebow and arrow during the late Harder phase (1500B.P.–contact), although a very small number ofdarts were still in use in the Nimipu phase (post-contact). The size and morphology of arrow pointsand dart points diverged metrically during thislengthy period, with maximum divergence duringthe late Harder phase.
PGT- PG&E Pipeline Project
The Pipeline analytical team took a range of widthand length measurements, including maximumblade width, base width, and neck width, but notthickness or weight measurements. Therefore wecould use only the Thomas–Shott single- attribute
(shoulder width) equation. Here we assume thatmaximum width and shoulder width are generallythe same. The results are quite similar, and in somecases identical, to those already described (Table10). The six Windust points separate metricallyinto three arrows and three dart points, almostexactly the same breakdown as the sample of 11Windust points from Hatwai. The assignment of theCascade points is quite similar to the Granite Pointproportions; they are similar in size to both the Hat-wai and Granite Point Cascade points (Figure 12c),with a trimodal width distribution similar to the pat-tern seen at Hatwai.The shifting proportions of darts and arrows
through time in this area are similar to thoseobserved in the LSR region (Table 10). Arrowswere introduced in the early Holocene; the pro-portion of darts declines in the middle Holoceneand then rises sharply among point types that wereintroduced after 3000 B.P. All of the unambiguousdart points in the sequence postdate 3000 B.P., and
312 american antiquity [Vol. 75, no. 2, 2010
Figure 15. Metric variation in other Hatwai III point styles, including all styles (a), Rabbit Island Stemmed points (b),Nespelem Bar Points (c) and Quelomene Bar Points (d).
AQ75(2)Ames_Layout 1 4/12/10 12:22 PM Page 312

darts are virtually absent among the point types thatwere introduced after 2000 B.P.Looking at point types only, three arrow point
types and three dart point types were introduced inthe early Holocene (Table 10). Only arrow pointtypes were introduced in the middle Holocene(although early Holocene forms persisted). After3000 B.P., three types of dart points and one newarrow point type were introduced. The newly intro-duced dart point styles again are the most distinc-tive types of dart points in the entire sequence. After2200 B.P., new point styles include five arrow pointtypes but no darts.
Discussion
Several conclusions can be drawn from the multi-ple lines of evidence and multiple data sets pre-sented above. First, the atlatl was present on theColumbia Plateau by 10,800 B.P., either fletched orunfletched. Patterns of metric variation suggestunfletched darts; point sizes suggest both were pre-sent. Second, Cascade points are plausibly arrowpoints. Third, the bow and arrow were present onthe Columbia Plateau in large numbers no later than4400 B.P. Fourth, both projectile systems were usedtogether over several millennia. Fifth, after 3000 B.P.darts and arrows became increasingly differenti-ated; and sixth, the atlatl was in use on the Plateauin small numbers after 1000 B.P. Before briefly dis-cussing some of the ramifications of these conclu-sions we explore two alternative explanations.It has been suggested to us that the early and
middle Holocene presence of arrow- sized points atHatwai is a consequence of our “monitoring posi-tion” (Thomas 1982) vis- à- vis projectile point uselives. The suggestion was made for Hatwai III thatthe assemblage is composed of dart points reworkeddown to arrow size at the end of their use lives. Thisargument is different from the rejuvenation modelof Flenniken and Raymond (1986) and others. Thatmodel posits that Great Basin dart point types actu-ally represent different stages in the use lives ofindividual points as they were reworked and reju-venated after breakage. This argument, rather, isthat reworking and rejuvenating dart points even-tually make them arrow sized and that this workoccurs in residential sites. Consequently, dart- sizedHatwai Eared points are elsewhere on the land-scape. Many Hatwai Eared points are clearly
reworked (Figure 4), but the sample of 119 is suf-ficiently large that if Hatwai Eared points were dartpoints, the full size range should be represented(Zeanah and Elston 2001), that is, there should bean atlatl cloud, even if an attenuated one. Thisexpectation is strengthened by the levels of repairand discard at Hatwai. Of the 119 Hatwai Earedpoints, only a third (43) are complete; most of therest lack tips or were snapped above the shoulders.If Hatwai Eared points are actually dart points, weshould find dart- sized points among the completepoints, which presumably would be ready at handto replace the discarded points. Just two completepoints are dart sized, and one is small dart/arrowsized; the rest are arrow sized. What we appear tobe seeing are arrow points being reworked intosmaller arrow points, probably while they were stillhafted (Zeanah and Elston 2001). The argument isfurther undercut by the remarkably parallel resultsin three large but differing data sets of points froma variety of contexts. Arrow- sized points, for exam-ple, are common in all three Plateau middleHolocene samples.It has also been suggested to us that Plateau pro-
jectile points are small relative to those found else-where (e.g., Ames 2000) and therefore the variousmeasures we employ here will not work on thePlateau: in essence dart points on the Plateau werearrow point size. We tested the first part of thisassertion by plotting the weights, neck widths,perimeters, and tip areas of the WGB, Hatwai, andLSR points (Figure 18). We again were unable toinclude the Pipeline points because the relevantmeasures were not reported. The Plateau points areindeed generally smaller than the WGB points.However, because the LSR data are means, poten-tial size variability there may be compressed. Totest that possibility, we calculated sample meansfrom the means of the WGB and Hatwai pointtypes. Those means are smaller (Table 11) but donot completely eliminate the size differentialsbetween the WGB points and the LSR and Hatwaipoints. We believe that the difference at least par-tially results from the Columbia Plateau samplescontaining more arrow points than does the WGBsample. Arrow points make up 53 percent of theWGB sample we used. Among the Plateau sam-ples, and assuming our assignments are correct,arrows are 69 percent of the Pipeline points and 85percent of the Hatwai points. Of the LSR point
ames et al.] Dart anD arrOW POintS On tHe cOLumBia PLateau OF WeStern nOrtH america 313
AQ75(2)Ames_Layout 1 4/12/10 12:22 PM Page 313

types, 69 percent are classed as arrows, and weestimate that 63 percent of the artifacts are arrowpoints (Table 9). If our assignments are wrong, oneis left with the interesting problem of how and whypeople on the Plateau successfully armed their dartswith arrow- sized points until the late Holocenewhen they started using larger dart points. The sec-ond part of the assertion— that Plateau dart pointswill be so small that they will all be classed as arrows— is belied by all the measures employedhere working very consistently across all four datasets; the graphing is particularly persuasive in thisregard. Thus, we find this argument unconvincing.The evidence presented here argues that Win-
dust points armed either unfletched or fletcheddarts. Archaeologists have generally assumed thatthe large stemmed points of the latePleistocene/early Holocene West armed thrown orhandheld spears (e.g., Beck 1995). This appears tobe incorrect. If these Windust points were used on
unfletched darts, this interpretation would helpaccount for their formal and metric variability. Asnoted above, balance is a problem for unfletcheddarts, and manipulating point sizes is one way ofbalancing the darts (Hughes 1998). We speculatethat some of this manipulation might have occurredwhen points were originally made, but some mighthave been done on the fly during hunts, with haftedpoints being worked down as they broke. Hughesnotes that the tips of unfletched darts may be“designed to store extra weight, i.e. long and thick”(1998:368). Given the energy expenses of rework-ing and rehafting dart points (Zeanah and Elston2001), it is plausible that Windust points weredesigned to “store extra weight” and to be workeddown during their use lives while still providing bal-ance for the shafts they armed.The next issue is whether Cascade points are
arrow or dart points. The separate lines of evidencepresented thus far indicate that most are arrow
314 american antiquity [Vol. 75, no. 2, 2010
Figure 16. Mean weights (a), perimeters (b), and tip areas (c), class by phase of Lower Snake River projectile point types.Stars are Hatwai point classes, including Windust, Cascade and Hatwai Eared. Dashed lines indicate Hughes’ (1998)thresholds (Table 4).
AQ75(2)Ames_Layout 1 4/12/10 12:22 PM Page 314

points. This suggestion is likely to be very contro-versial and certainly will not be resolved to every-one’s satisfaction without physical reanalysis ofone or more of the type collections, such as the onefrom Granite Point. Part of the problem, as notedabove, is that different projects reported differentmeasurements in different ways, so we do not havea single large, consistent data set. In any case, theintroduction of Cascade points marked a signifi-cant formal shift from Windust points, a shift that,if nothing else, our data indicate is insufficientlyappreciated and problematized. It is likely that theshift was, at least in part, a change in hafting tech-nology. Musil (1988) reviews two forms of haft-ing, split stem (three variants) and socketed, forearly Holocene points in western North America.He does not include Cascade points but does dis-cuss contracting- sided points (e.g., Haskett), whichwould include Cascade points. He argues thatstemmed points, such as Windust points, werehafted in split hafts while contracting- sided pointswere in socketed hafts. Fedje et al. (2008) suggestanother method of hafting foliate points in whichshafts have beveled ends and points are attached tothe shaft against the bevel. We know of no evi-dence indicating that arrows cannot have socketedor beveled hafting or that would explain the formaluniformity of Cascade points in terms of hafting.A related issue is Amick’s (1994) concern as to
whether the Thomas–Shott equations are applica-ble to unstemmed lanceolate points simply because
there were none in Thomas’s original ethnographicsample. He raised the issue because the equationsclassified a high percentage of a large sample ofFolsom points as arrows. Our use of multiple mea-sures addresses this issue. Additionally, Hughes’sobservation that the shaft cannot have a diametergreater than its arming point’s width is valid regard-less of the point’s shape. In this study, we assumedthat Cascade points’ maximum width is the equiv-alent of shoulder width for the purposes of usingShott’s single- variable equations.We compared the size variation among Hatwai’s
Cascade points with the only lanceolate pointsavailable in the WGB data set: the Humboldt seriespoints (Figure 19). Humboldt points have ambigu-ous classification results (Tables 4–5), which mir-rors uncertainty about their function, whether theyare dart points or knives, for example (Yohe 1998).Cascade points are generally smaller, and their vari-ability is more circumscribed. We can make addi-tional statements about the sizes and uniformity ofCascade points using the three samples discussedhere, plus one additional sample. Munsell(1968:29–36) reports measurements on 16 Cas-cade points recovered at the Ryegrass Coulee site(45KT88) in the western Columbia Plateau (Fig-ure 1). They date to the middle Holocene. Theassemblage is unusual because it contains microb-lade cores and microblades but is otherwise a typ-ical Cascade assemblage. Munsell’s descriptionsand the illustrations make it clear that these are in
ames et al.] Dart anD arrOW POintS On tHe cOLumBia PLateau OF WeStern nOrtH america 315
Figure 17. Mean weights (a), perimeters (b) and tip areas (c) for Lower Snake River Projectile points. Dashed lines indi-cate Hughes’ (1998) thresholds (Table 4).
AQ75(2)Ames_Layout 1 4/12/10 12:22 PM Page 315

fact Cascade points (Figure 12d, h). Combiningthe four collections produces a sample of 62 points,with maximum width measurements available forthe entire sample (Figure 12e) and thickness mea-surements on 46 of the 62 points (Figure 12i, Fig-ure 20a–b). We have weights only for the Hatwaipoints.The majority of the Cascade points in the com-
bined sample (Hatwai, Granite Point, Pipeline,Ryegrass Coulee) are classed as arrows. TheThomas–Shott single- variable equations class 53(85 percent) as arrows and nine (15 percent) asdarts. Of the 46 for which we can calculate tip areaand perimeter (Figure 20a–b), 25 (54 percent) havetip areas below Hughes’s arrow/dart threshold of.47. Sixteen (35 percent) of the points measurebetween .47 and .62 (large arrow/small dart); andfive (11 percent) are above .74 (dart). Tip area mea-surements below .62 are strongly trimodal (Figure20a), again suggesting that the smaller Cascadepoints include three size variants. Perimeters are
tightly circumscribed; 41 points have perimetervalues between 1.6 and 4.0 (arrow), and five arebetween 4.0 and 5.4 (large arrow/small dart). Actu-ally, variation is even more constrained: 36 (78 per-cent) have perimeters below 3.5. This uniformitysuggests consistent adherence to very narrow lim-its on shaft diameter despite the size variants notedabove. The pattern of metric variation in the com-bined sample (Figure 20c) is very similar to the Hat-wai Cascade sample; it lacks the atlatl cloud (Figure11b–c). This result cannot be attributed to samplesize. The scatter of points representing this cloudis clearly visible in equivalently sized samples ofdarts (e.g., the combined Thomas–Shott dart sam-ple [Figure 8c], WGB Gatecliff Contracting andSplit Stemmed [Figure 10c], and WGB Large SideNotched [Figure 10d]) as well as the larger WGBdart samples. In sum, most Cascade points are con-sistently arrow sized along a number of dimen-sions, and they generally vary metrically likearrows, rather than like darts. We therefore argue
316 american antiquity [Vol. 75, no. 2, 2010
Figure 18. Box plots comparing sizes of Western Great Basin, Hatwai and Lower Snake River projectile points on fourdimensions: weight (a) neck widths (b), perimeter (c) and tip area (d). The Lower Snake River figures are class means;the Western Great Basin and Hatwai figures are individual points.
AQ75(2)Ames_Layout 1 4/12/10 12:22 PM Page 316

that many Cascade points were arrow points. Some,perhaps the largest size variant, could have beendart points.The final issue is the chronology of Cascade
points. The dating of the sample from Hatwai is notvery precise, between 8200 and 4400 B.P. That canbe narrowed using points from the Pipeline projectand Granite Point. Six of the 15 Pipeline Cascadepoints were recovered at two sites (35DS557[Atwell and Hodges 1995], 35JE51B [Pettigrewand Hodges 1995]; Figure 1). At both sites, thepoints were below Mazama ash, which, as notedabove, dates between 6700 and 7000 B.P. At site35JE51B, the associated sediments produced tworadiocarbon dates: 6770 ± 60 and 7035 ± 65 (Table2; Pettigrew et al. 1995). Five of these six pointsare classed here as arrow points, and one is classedas a dart point. At Granite Point, Cascade pointswere recovered both above and below the Mazamaash (Leonhardy 1970). The post- Mazama late Cas-cade component at this site has a terminal date ofca. 5000 B.P. (Leonhardy 1970). Although Nisbit(1981) does not indicate from which Granite PointCascade assemblage he drew his sample (early orlate Cascade), only three complete Cascade pointsare associated with Granite Point’s late Cascadecomponent (Leonhardy 1970). Thus, at a mini-mum, we know that 14 of the 17 individual pointsthat Nisbit measured are from the pre- Mazamaearly Cascade component. In short, arrow- sizedCascade points predate the Mazama ashfall.Turning to Hatwai III, 85 percent of all the points
are also classed as arrow points, virtually the samepercentage as in the earlier Cascade phase, as alsoseen during the contemporary Tucannon phase onthe LSR and during the later late Harder and
Nimipu phases, when the arrow is generally thoughtto have replaced darts (Table 9). Hatwai Earedpoints, which date between 4400 and 2800 B.P.,are clearly arrow points. While they presently seemlimited regionally to the southeastern Plateau, otherarrow point styles, such as Rabbit Island Stemmedpoints, are common mid- Holocene Plateau typesthat occur across the whole region (Lohse and Shou2008; Pettigrew et al. 1995).We find the ubiquity of arrows in large numbers
on the Plateau by 4400 B.P. to be a surprise. How-ever, this pattern is remarkably consistent acrossthe three Plateau data sets and appears to be dif-ferent from patterns reported elsewhere (e.g., Nas-saney and Pyle 1999). In other regions, arrows maybe present but apparently are not numerous. Hat-wai III points are technologically distinct from Cas-cade points (Ames 1984) and seem, with othernotched point types in the region, to be part of thewidespread side- and corner- notching techniquethat may have developed in the eastern Great Basinca. 8000 B.P. (Beck 1995), arriving on the Plateauafter 7000 B.P. A plausible hypothesis is that corner- notched arrows represent an adaptation of that haft-ing technique to arrows.Our data also show that the two weapon systems
have a long and complex mutual history on thePlateau, perhaps similar in some ways to that doc-umented by Shott (1993) for the late Woodland inthe Midwestern United States. On the Plateau, thebow and arrow do not initially replace the dart.Atlatls and bow and arrow technology are usedtogether for millennia, countering the generalexpectation that the dart would disappear after thebow and arrow became common. According to thisview, the bow and arrow’s apparent clear superi-
ames et al.] Dart anD arrOW POintS On tHe cOLumBia PLateau OF WeStern nOrtH america 317
Table 11. Size Measurements for the Western Great Basin, Hatwai and Lower Snake River Samples.
Attribute Mean Std Dev Std. Error Median
WGB Weight (gm) 3.50 3.32 0.17 3.10Hatwai Weight (gm) 3.15 3.73 0.25 2.10LSR Weight (gm) 2.45 2.31 0.24 1.70WGB Neck Width (mm) 10.96 3.73 0.19 10.95Hatwai Neck Width (mm) 9.95 2.15 0.14 10.00WGB Perimeter 5.12 4.39 0.22 4.82Hatwai Perimeter 3.10 6.30 0.38 2.45LSR Perimeter 3.31 1.37 0.13 3.19GB Tip Area 0.53 0.88 0.04 0.47Hatwai Tip Area 0.23 0.29 0.02 0.19LSR Tip Area 0.47 0.23 0.02 0.41
AQ75(2)Ames_Layout 1 4/12/10 12:22 PM Page 317

ority over the atlatl would result in rapid replace-ment of the older technology, once the bow andarrow were readily available (e.g., Hughes 1998;Raymond 1986; Seeman 1992 and citationstherein). This model has been debated (see Shott1993 for counterarguments; also Cattelain 1997; Yu2006), and we are not the first to document the per-sistence of darts after the appearance of the bowand arrow (e.g., Erwin et al. 2005; Shott 1993; Van-Pool 2006, Yohe 1998), although we may be thefirst to propose such a lengthy period of co- use inNorth America. The late Holocene revival of darts,in both numbers and form, however, is particularlyinteresting and important. Dart points first becameboth more numerous and more differentiated fromarrow points and then became less common.Viewed from an evolutionary standpoint this pat-tern, analogous to diversifying selection and nichespecialization, records increasing functional spe-cialization, with arrows and darts becoming evenmore differentiated and task specific as darts tendedtoward extinction.Lyman et al. (2008) present a useful general
model based on evolutionary concepts of the tran-sition from atlatl dart to bow and arrow againstwhich to compare our results. Our data were not
developed as an explicit test of their model, and theyuse only one Plateau site in their test. They arguethat, following the introduction of the bow andarrow in a region, dart and arrow points will dis-play increased formal variation as artisans experi-ment with differing forms to arm their weapons,selecting the more effective and abandoning the lesseffective. With time, formal variation shoulddecline as the less effective forms are winnowedout. Their review of data supported these predic-tions. However, if the bow and arrow were presentduring the early Cascade phase, our results do notsupport their expectations. Early Holocene pointassemblages on the Columbia Plateau are oftenexclusively Cascade points, although stemmedpoints are also present. Late Cascade point assem-blages generally have two styles, Cascade and largenotched points. It is not until after 5000 B.P. thatprojectile point formal variation increases signifi-cantly. On the other hand, if we are wrong aboutCascade points and the bow and arrow were intro-duced ca. 5000 B.P., the pattern conforms better toLyman et al.’s model, though still not fully. Com-mon mid- Holocene point styles on the Plateauinclude foliate, stemmed, basal, and corner- notchedforms, the diversity of forms they predict. Rather
318 american antiquity [Vol. 75, no. 2, 2010
Figure 19. Size variation among Hatwai Cascade (stars) and Humboldt Series points (circles). Humboldt points are theonly lanceolate points in the WGB sample. Open symbols represent points classed as darts, gray symbols points classedas arrows by the Thomas-Shott equations (Shott 1997).
AQ75(2)Ames_Layout 1 4/12/10 12:22 PM Page 318
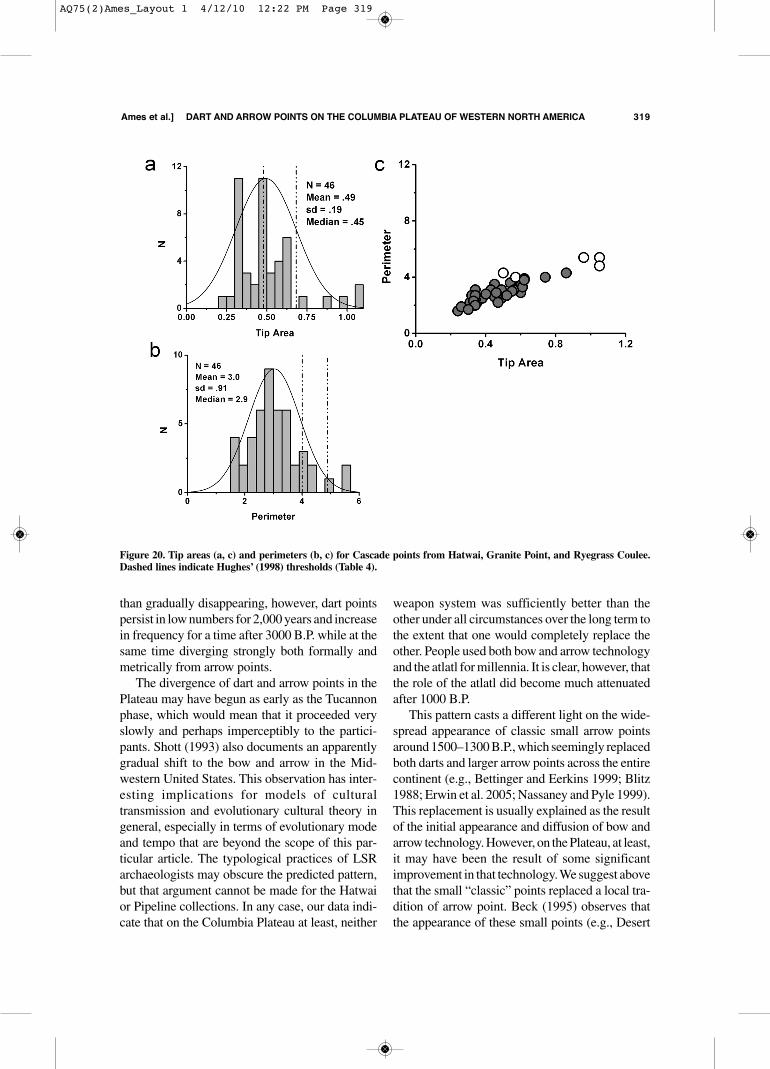
than gradually disappearing, however, dart pointspersist in low numbers for 2,000 years and increasein frequency for a time after 3000 B.P. while at thesame time diverging strongly both formally andmetrically from arrow points.The divergence of dart and arrow points in the
Plateau may have begun as early as the Tucannonphase, which would mean that it proceeded veryslowly and perhaps imperceptibly to the partici-pants. Shott (1993) also documents an apparentlygradual shift to the bow and arrow in the Mid-western United States. This observation has inter-esting implications for models of culturaltransmission and evolutionary cultural theory ingeneral, especially in terms of evolutionary modeand tempo that are beyond the scope of this par-ticular article. The typological practices of LSRarchaeologists may obscure the predicted pattern,but that argument cannot be made for the Hatwaior Pipeline collections. In any case, our data indi-cate that on the Columbia Plateau at least, neither
weapon system was sufficiently better than theother under all circumstances over the long term tothe extent that one would completely replace theother. People used both bow and arrow technologyand the atlatl for millennia. It is clear, however, thatthe role of the atlatl did become much attenuatedafter 1000 B.P.This pattern casts a different light on the wide-
spread appearance of classic small arrow pointsaround 1500–1300 B.P., which seemingly replacedboth darts and larger arrow points across the entirecontinent (e.g., Bettinger and Eerkins 1999; Blitz1988; Erwin et al. 2005; Nassaney and Pyle 1999).This replacement is usually explained as the resultof the initial appearance and diffusion of bow andarrow technology. However, on the Plateau, at least,it may have been the result of some significantimprovement in that technology. We suggest abovethat the small “classic” points replaced a local tra-dition of arrow point. Beck (1995) observes thatthe appearance of these small points (e.g., Desert
ames et al.] Dart anD arrOW POintS On tHe cOLumBia PLateau OF WeStern nOrtH america 319
Figure 20. Tip areas (a, c) and perimeters (b, c) for Cascade points from Hatwai, Granite Point, and Ryegrass Coulee.Dashed lines indicate Hughes’ (1998) thresholds (Table 4).
AQ75(2)Ames_Layout 1 4/12/10 12:22 PM Page 319
Side Notched) marks a revival of side notching thathad already disappeared among dart points in theGreat Basin several millennia earlier. In additionto side notching, some varieties of these small latepoints have very narrow stems, sometimes referredto as “pin stems.” In both cases, the hafting elementson the points seem fragile (Beck 1995). We do notmean to suggest that improvements in hafting aloneaccount for the rapid spread of these small pointsbut, rather, any changes in hafting may have beenpart of a complex set of design/performanceimprovements for the bow and arrow that finallyrendered the atlatl obsolete, except perhaps undervery specialized conditions. These data also indi-cate that the appearance of the bow and arrow byitself does not explain the well- documented andwidespread increase in warfare in western NorthAmerica (Chatters 2004; Lambert 2002; Maschner1991) in the late Holocene.The final empirical implications we wish to
explore have to do with the origin of the bow andarrow in the western hemisphere. If Cascade pointsare actually arrow points, then the bow and arrowwere present in western North America no later than7000 B.P. and, given the chronology of Cascadepoints, by 8500 B.P., if not earlier. Cascade pointsare a local manifestation of a widespread bifacialtechnology in northwestern North America withapparent roots in western Beringia that archaeolo-gists have recognized for a long time (e.g., Butler1961; Smith 1954; chapters in Carlson and Magne2008). Bifacial foliates of varying sizes are amongthe diagnostic artifacts of this manifestation andhave considerable time depth. They are contem-porary with Windust, for example, on the northernBritish Columbia and southeast Alaska coasts (e.g.,Dixon 2008; Fedje et al. 2008) and have strong sim-ilarities to technologies in northeastern Asia, whichinclude both microblades and foliate bifaces.The date of 8500 B.P. is not impossibly early
for the bow and arrow in North America. For exam-ple, Amick (1994) could not exclude the possibil-ity of Folsom arrows. Ackerman (2009) reportsfinding antler spear and arrow heads slotted formicroblades, as well as the microblades themselves,at two southwestern Alaskan sites. At one site, theywere recovered from deposits dating between ca.10,400 and 8100 B.P. One slotted arrow point wasdirectly radiocarbon dated at 8740 ± 40 B.P. Ack-erman (2009) links his microblades to the late Pale-
olithic Diukti culture of western Beringia, whichincludes both microblades and foliate bifaces. Ashe suggests, the bow and arrow could have beenpart of this late Paleolithic Beringian technology.If we are not correct about Cascade points, then per-haps Hatwai Eared points indicate a local inven-tion of the bow. They could represent a localapplication to arrows of the side and corner notch-ing spreading from the Great Basin.We do not address how the technological
changes that we document fit with other develop-ments in the Columbia Plateau over the past 11,000years. That is well beyond the scope of this article.We have not, for example, explored the full impli-cations of the introduction of Cascade points,which, regardless of the weapon systems they rep-resent, are a major change from Windust points.Commenting on the shift from atlatls to bows andarrows in the American Middle West, Shott sug-gests that “the economic consequences of the tran-sition are at once subtler and less profound thanoften supposed” (1993:425). Our data suggest thathe may be correct about subtle consequences, atleast on the Columbia Plateau. Those consequencesappear to have rippled across millennia, perhapsinvisibly to the people involved. They also haveimportant theoretical and substantive implicationsbeyond those considered here. In any case, theappearance of Cascade points is contemporary witha regional shift in mobility patterns further towardthe forager end of the collector–forager continuum(Ames 1988). The increase in the use of darts inthe late Cascade phase corresponds with the spreadof large side- notched and corner- notched pointsfrom the Great Basin to the Plateau. The wide-spread presence of arrows in the middle Holoceneis contemporary with the appearance of houses,stable residential sites, and what appear to be teth-ered mobility patterns (Ames 1991; Chatters 1989),while the spike in the relative frequency of darts inthe early Harder phase is contemporary with evi-dence of bison hunting on the Plateau (e.g., Chat-ters et al. 1995; Lyman 1985, 2004; Schroedl 1973).The late revival of darts could therefore be linkedto bison hunting, although Amick (1994) suggeststhat the bow and arrow were more effective forhunting bison. Evidence of subsequent declininguse of darts corresponds with the increasing dif-ferentiation between darts and arrows, suggestingthat darts were part of a tool kit of very specialized
320 american antiquity [Vol. 75, no. 2, 2010
AQ75(2)Ames_Layout 1 4/12/10 12:22 PM Page 320

gear, but it is also contemporary with greater logis-tical and community mobility (e.g., Ames 1991;Chatters 1995; Goodale et al. 2004), food storage(Ames 2000), and wealth (Schulting 1995). Simi-larly, the appearance of “classic” arrows is alsocontemporary with these latter changes, increasedwarfare, and the appearance of large residentialaggregations (Chatters 2004). Linking shiftingweaponry to these broad trends will be an inter-esting challenge.Finally, we address potential questions about
the methodology employed here. Our analysis isbased on metric data; we pay limited attention topotential sources of patterning and variation result-ing from differences in raw materials, lithic tech-niques, repair, discard, and so forth. These areimportant lines of evidence and would be espe-cially trenchant if our conclusions relied on a sin-gle site sample, on only Hatwai, for example, or asmall regional sample. In those instances, we wouldnot have gone forward without developing that evi-dence. However, as we moved through our metriccompilations, and our large samples producedremarkably parallel results despite their differences,we felt we had a strong cable of evidence (Wylie1989). An alternative conclusion is that the arrayof equations and thresholds used here are flawed,either because of problems in the original museumsamples upon which they are based (e.g., Seeman1992) or because there are special conditions onthe Columbia Plateau (e.g., unusually small dartpoints) that make them inapplicable regionally, atleast before 3000 B.P. Shott (1993, 1997) addressesissues with the museum samples, and we addressthe question of special conditions above. We beganthis research agnostic about the efficacy of thesemethods, but given our strikingly parallel resultsacross multiple samples, we conclude that theywork rather well.
Summary and Conclusions
We argue that the bow and arrow were present onthe Columbia Plateau in the early Holocene. Wethink the argument is strong for Cascade points. Wedemonstrate that the bow and arrow were presenton the Columbia Plateau in large numbers no laterthat 4400 B.P. (5000 cal B.P.). Atlatls and bows andarrows were used in varying frequencies throughthe Holocene until the bow almost completely
replaced the atlatl by 1000 B.P., although darts invery small numbers appear to have persisted intothe early modern period.These results indicate that the bow and arrow
and atlatls had very patchy and fluctuating tempo-ral and spatial distributions prior to the final latespread of small arrow points. This pattern is alsoapparent in the data reviewed by Nassaney andPyle (1999) for the eastern United States. Ourresults also show that the history of atlatls and bowsin one region cannot necessarily be extrapolated toother regions. Their history on the Plateau differsfrom their history in the Great Basin. Decisionsabout when to use which weapon system and towhat extent were no doubt very local decisions.Ignorance of the alternative system was certainlynot a reason. Much like hunter- gatherers with longfluctuating relationships with farmers yet not them-selves adopting agriculture, the mid- Holocene, bow- using people on the Plateau interacted with dart- using groups in the Great Basin (Ames 2000;Ames et al. 1998). The dart revival during the lateHarder period on the Plateau also suggests thatdespite the general greater effectiveness of bowsand arrows, they were not always better tools, andtheir utility varied locally in both time and space.Implicit in our evidence is the strong possibility thatin some areas, one or the other weapon systemmight have gone extinct and subsequently beenreintroduced. All of this considered, the mostimportant outcome of this study is the demonstra-tion that the bow and arrow were probably presenton the Columbia Plateau before 7000 B.P., theywere ubiquitous on the Plateau no later than 4400B.P., and darts and arrows subsequently had anunexpectedly long and complicated mutual history.
Acknowledgments. Versions of this article were presented atthe 60th Annual Northwest Anthropology Conference and atthe 73rd Annual Meetings of the Society for AmericanArchaeology at a symposium honoring R. G. Matson. Wethank the organizers of that symposium for the opportunityto present our work and honor R.G. We thank David HurstThomas and Lorann S. A. Pendleton for generously allowingus use of their unpublished data and Thomas for his generalencouragement. R. Lee Lyman and Robert Ackerman gra-ciously gave us access to unpublished papers. Lyman,Ackerman, and four anonymous reviewers gave us verythoughtful, productive comments that markedly improvedthe article. Judy Bense tried hard to help us, and we appreci-ate it. Virginia Butler and her Archaeology LaboratoryMethods class gave us excellent critiques on data presenta-tion. Luis Borrero provided the Spanish abstract. Greg Baker
ames et al.] Dart anD arrOW POintS On tHe cOLumBia PLateau OF WeStern nOrtH america 321
AQ75(2)Ames_Layout 1 4/12/10 12:22 PM Page 321
and Amy Sherwood prepared Figures 3 and 4. We also grate-fully acknowledge the important contributions of Frank C.Leonhardy and James P. Green to the research reported here.We, of course, are responsible for any and all errors.
References Cited
Ackerman, Robert E.2009 Microblade Assemblages in Southwestern Alaska: AnEarly Holocene Adaptation. In Explaining Lithic Assem-blage Variability Across Beringia, edited by TheodoreGoebel and Ian Buvit. Center for the Study of the FirstAmericans, Texas A&M University, College Station, inpress.
Ames, Kenneth M.1984 Comments on the Tucannon Phase. Idaho Archaeol-ogist 5(2):1–8.
1988 Early Holocene Forager Mobility Strategies on theSouthern Columbia Plateau. In Early Human Occupationin Western North America, edited by Judith A. Willig, C.Melvin Aikens, and John Fagan, pp. 325–360. NevadaState Museum Papers, Vol. 21. Carson City.
1991 Sedentism, a Temporal Shift or a Transitional Changein Hunter- Gatherer Mobility Strategies. In Between Bandsand States: Sedentism, Subsistence, and Interaction inSmall Scale Societies, edited by Susan Gregg, pp. 108–133.Southern Illinois University Press, Carbondale.
2000 Kennewick Man: Cultural Affiliation Report, Chap.2: Review of the Archaeological Data. Electronic docu-ment,http://www.cr.nps.gov/aad/kennewick/AMES.HTM,accessed December 12, 2008.
Ames, Kenneth M., Sara Davis, and Kristen A. Fuld2007 Dart and Arrow Points on the Columbia Plateau.Poster presented at the 60th Northwest AnthropologicalConference, Pullman, Washington. Electronic document,http://web.pdx.edu/~amesk/pdfs/NWAC_POSTER_2007.pdf, accessed December 12, 2008.
Ames, Kenneth M., Don D. Dumond, Gerry Galm, and RickMinor
1998 The Prehistory of the Southern Plateau. In Handbookof North American Indians, Vol. 9: The Plateau, edited byDeward Walker, pp. 103–109. Smithsonian InstitutionPress, Washington, D.C.
Ames, Kenneth M., James P. Green, and Margeret Pfoertner1981 Hatwai (10NP143): Interim Report. ArchaeologicalReports No. 9. Boise State University, Boise.
Amick, Daniel S.1994 Technological Organization and the Structure of Infer-ence in Lithic Analysis: An Examination of Folsom Hunt-ing Behavior and the American Southwest. In TheOrganization of North American Prehistoric ChippedStone Tool Technologies, edited by Philip J. Carr, pp. 9–34.International Monographs in Prehistory, Ann Arbor.
Andrefsky, William, Jr.2004 Materials and Contexts for a Cultural History of theColumbia Plateau. In Complex Hunter- Gatherers, Evolu-tion and Organization of Prehistoric Communities on thePlateau of Northwestern North America, edited by WilliamC. Prentiss and Ian Kuijt, pp. 23–35. University of UtahPress, Salt Lake City.
Atwell, Ricky J., and Charles M. Hodges1995 Site 35-DS-557. In Archaeological Investigations PGT- PG&E Pipeline Expansion Project: Idaho, Wash-ington, Oregon and California, Vol. 2B Summary Reports:Prehistoric Sites in Oregon, edited by Randall F. Schalk,
Richard M. Pettigrew, Clayton G. Lebow, Michael J.Moratto, and Ricky J. Atwell, pp. 19–50. INFOTECResearch, Fresno.
Bacon, Charles R.1983 Eruptive History of Mount Mazama and Crater LakeCaldera, Cascade Range, U.S.A. Journal of Volcanologyand Geothermal Research 18:57–115.
Beck, Charlotte1995 Functional Attributes and the Differential Persistenceof Great Basin Darts. Journal of California and GreatBasin Anthropology 17:222–243.
Bense, Judith A.1972 The Cascade Phase: A Study in the Effects of theAltithermal on a Cultural System. Unpublished Ph.D. dis-sertation, Department of Anthropology, Washington StateUniversity.
Bettinger, Robert L., and Jelmer Eerkins1999 Point Typologies, Cultural Transmission, and theSpread of Bow- and- Arrow Technology in the PrehistoricGreat Basin. American Antiquity 64:231–242.
Blitz, John H.1988 Adoption of the Bow in Prehistoric North America.North American Archaeologist 9:123–145.
Bradbury, Andrew P.1997 The Bow and Arrow in the Eastern Woodlands: Evi-dence for an Archaic Origin. North American Archaeolo-gist 18:207–233.
Brauner, David Ray1976 Alpowai: The Culture History of the Alpowa Local-ity. Unpublished Ph.D. dissertation, Department of Anthro-pology, Washington State University, Pullman.
Butler, B. Robert1961 The Old Cordilleran Culture in the Pacific Northwest.Occasional Papers of the Idaho State College Museum 51.Pocatello.
Carlson, Roy L., and Martin P. R. Magne (editors)2008 Projectile Point Sequences in Northwestern NorthAmerica. Archaeology Press, Simon Fraser University,Burnaby.
Cattelain, Pierre1997 Hunting During the Upper Paleolithic: Bow,Spearthrower, or Both? In Projectile Technology, editedby Heidi Knecht, pp. 213–240. Plenum Press, New York.
Chance, David H., and Jennifer V. Chance1982 Kettle Falls: 1971/1974. University of Idaho Anthro-pological Research Manuscript Series 69. Moscow.
Chatters, James C.1989 Resource Intensification and Sedentism on the South-ern Plateau. Archaeology in Washington 1:1–20.
1995 Population Growth, Climatic Cooling, and the Devel-opment of Collector Strategies on the Southern Plateau,Western North America. Journal of World Prehistory9:341–400.
2004 Safety in Numbers: The Influence of the Bow andArrow on Village Formation on the Columbia Plateau. InComplex Hunter- Gatherers: Evolution and Organizationof Prehistoric Communities on the Plateau of Northwest-ern North America, edited by William C. Prentiss and IanKuijt, pp. 67–83. University of Utah Press, Salt Lake City.
Chatters, James C., Sarah K. Campbell, Grant D. Smith, andPhillip E. Minthorn Jr.
1995 Bison Procurement in the Far West: A 2,100- Year- OldKill Site on the Columbia Plateau. American Antiquity60:751–763.
Cochran, Bruce D.1988 Significance of Holocene Alluvial Cycles in thePacific Northwest Interior. Unpublished Ph.D. dissertation,
322 american antiquity [Vol. 75, no. 2, 2010
AQ75(2)Ames_Layout 1 4/12/10 12:22 PM Page 322

Department of Anthropology, University of Idaho.Corliss, David1972 Neck Width of Projectile Points: An Index of CulturalContinuity and Change. Occasional Papers No. 29. IdahoState University Museum, Pocatello.
Dixon, E. James2008 Bifaces from On Your Knees Cave, SoutheasternAlaska. In Projectile Point Sequences in NorthwesternNorth America, edited by Roy L. Carlson and Martin P. R.Magne, pp. 11–19. Archaeology Press, Simon Fraser Uni-versity, Burnaby.
Erwin, John C., Donald H. Holly Jr., Stephen H. Hull, and Tim-othy L. Rast
2005 Form and Function of Projectile Points and the Tra-jectory of Newfoundland Prehistory. Canadian Journal ofArchaeology 29:46–67.
Fawcett, William B.1998 Chronology and Projectile Point Neck Width: AnIdaho Example. North American Archaeologist19(1):59–85.
Fedje, Daryle, Quentin Mackie, Duncan McLaren, and TinaChristensen
2008 A Projectile Point Sequence for Haida Gwaii. In Pro-jectile Point Sequences in Northwestern North America,edited by Roy L. Carlson and Martin P. R. Magne, pp.19–40. Archaeology Press, Simon Fraser University, Burn-aby.
Flenniken, J. Jeffrey, and Anan Raymond1986 Morphological Projectile Point Typology: Replica-tion, Experimentation, and Technological Analysis. Amer-ican Antiquity 5:603–614.
Galm, Jerry R., and Stan Gough2008 The Projectile Point/Knife Sequence from the Sen-tinel Gap Site. In Projectile Point Sequences in North-western North America, edited by Roy L. Carlson andMartin P. R. Magne, pp. 209–221. Archaeology Press,Simon Fraser University, Burnaby.
Goodale, N. B., W. C. Prentiss, and I. Kuijt2004 Cultural Complexity: A New Chronology of the UpperColumbia Drainage Area. In Complex Hunter- Gatherers:Evolution and Organization of Prehistoric Communitieson the Plateau of Northwestern North America, edited byWilliam C. Prentiss and Ian Kuijt, pp. 36–48. Universityof Utah Press, Salt Lake City.
Hicks, Brent A. (editor)2004 Marmes Rockshelter: A Final Report on 11,000 Yearsof Cultural Use. Washington State University Press, Pull-man.
Huckleberry, Gary, and Cynthia Fadem2007 Environmental Change Recorded in Sediments fromthe Marmes Rockshelter Archaeological Site, Southeast-ern Washington State, USA. Quaternary Research67:21–34.
Hughes, Susan S.1998 Getting to the Point: Evolutionary Change in Prehis-toric Weaponry. Journal of Archaeological Method andTheory 5:345–408.
Kennedy, Hal Kirk1976 Examination of the Tucannon Phase as a Valid Con-cept: Step One. Unpublished Master’s thesis, Departmentof Anthropology, University of Idaho.
Lambert, Patricia M.2002 The Archaeology of War: A North American Per-spective. Journal of Archaeological Research10:207–241.
Leonhardy, Frank Clinton1970 Artifact Assemblages and Archaeological Units atGranite Point Locality 1 (45WT41), Southeastern Wash-
ington. Unpublished Ph.D. dissertation, Department ofAnthropology, Washington State University.
Leonhardy, Frank C., and David G. Rice1970 A Proposed Culture Typology for the Lower SnakeRiver Region, Southeastern Washington. NorthwestAnthropological Research Notes 4:1–29.
Lohse, Ernest S.1985 Rufus Woods Lake Projectile Point Chronology. InSummary of Results, Chief Joseph Dam Cultural ResourcesProject, Washington, edited by Sarah K. Campbell, pp.317–364. University of Washington, Office of PublicArchaeology, Seattle.
Lohse, Ernest S., and C. Shou2008 The Southern Plateau Projectile Point Sequence: An Informatics- Based Approach. In Projectile PointSequences in Northwestern North America, edited by RoyL. Carlson and Martin P. R. Magne, pp. 187–208. Archae-ology Press, Simon Fraser University, Burnaby.
Lyman, R. Lee1985 The Paleozoology of the Avey’s Orchard Site. InAvey’s Orchard: Archaeological Investigations of a LatePrehistoric Columbia River Community, edited by JerryR. Galm and Ruth A. Masten, pp. 243–321. Eastern Wash-ington University Reports in Archaeology, No. 100-42.Archaeological and Historical Services, Cheney, Wash-ington.
2004 Late Quaternary Diminution and Abundance of Pre-historic Bison (Bison sp.) in Eastern Washington State,U.S.A. Quaternary Research 62:76–85.
Lyman, R. Lee, Todd L. VanPool, and Michael J. O’Brien2008 Variation in North American Dart Points and ArrowPoints When One or Both Are Present. Journal of Archae-ological Science 35:2805–2812.
Maschner, Hebert D. G.1991 The Emergence of Cultural Complexity on the North-ern Northwest Coast. Antiquity 65:924–934.
Moratto, Michael J., Richard M. Pettigrew, Barry A. Price,Lester A. Ross, and Randall F. Schalk (editors)
1994 Archaeological Investigations PGT- PG&E Expan-sion Project Idaho, Washington, Oregon and California,Vol. 1: Project Overview, Research Design and Archaeo-logical Inventory. INFOTEC Research, Fresno.
Munsell, David A.1968 The Ryegrass Coulee Site. Unpublished Master’s the-sis, Department of Anthropology, University of Washing-ton, Seattle.
Musil, Robert R.1988 Functional Efficiency and Technological Change: AHafting Tradition Model for Prehistoric North America.In Early Human Occupation in Far Western North Amer-ica: The Clovis–Archaic Interface, edited by Judith A.Willig, C. Melvin Aikens, and John L. Fagan, pp. 373–388.Anthropological Papers No. 21. Nevada State Museum,Carson City.
Nassaney, Michael S., and Kendra Pyle1999 The Adoption of the Bow and Arrow in Eastern NorthAmerica: A View from Central Arkansas. American Antiq-uity 64:243–263.
Nelson, Charles M.1969 The Sunset Creek Site (45-KT-28) and Its Place inPlateau Prehistory. Report of Investigations 47. Wash-ington State University, Laboratory of Anthropology, Pull-man.
Nisbit, Robert A., Jr.1981 The Lanceolate Projectile Point in Southwestern Ore-gon: A Perspective from the Applegate River. UnpublishedMaster’s thesis, Department of Anthropology, Oregon State
ames et al.] Dart anD arrOW POintS On tHe cOLumBia PLateau OF WeStern nOrtH america 323
AQ75(2)Ames_Layout 1 4/12/10 12:22 PM Page 323
University, Corvallis.Ozbun, Terry L., and John L. Fagan2006 A New Look at Old Cordilleran Traditions in LithicTechnology. Paper presented at the 59th Annual NorthwestAnthropological Conference, Seattle.
Pettigrew, Richard M., William Hildebrandt, and PatriciaMikkelson
1995 Projectile Point Typology. In Archaeological Investi-gations PGT- PG&E Pipeline Expansion Project Idaho,California, and California, Vol. 5: Technical Studies, editedby Robert U. Bryson, Craig E. Skinner, and Richard M.Pettigrew, pp. 1–39. INFOTEC Research, Fresno.
Pettigrew, Richard M., and Charles M. Hodges1995 Site 35-JE-51B (the Johnson Site). In ArchaeologicalInvestigations PGT- PG&E Pipeline Expansion ProjectIdaho, Washington, Oregon, and California, Vol. 2B Sum-mary Reports: Prehistoric Sites Oregon, edited by Ran-dall F. Schalk, Richard M. Pettigrew, Clayton G. Lebow,Michael J. Moratto, and Ricky J. Atwell, pp. 1–87.INFOTEC Research, Fresno.
Raymond, Anan1986 Experiments in the Function and Performance of theWeighted Atlatl. World Archaeology 18:153–177.
Reid, Kenneth C., Matthew K. Root, and Richard E. Hughes2008 The Copper Creek Clovis Point from Hells Canyon,Northeastern Oregon. Journal of California and GreatBasin Anthropology 28:75–84.
Rice, David G.1969 Preliminary Report, Marmes Rockshelter Archaeo-logical Site. Washington State University, Pullman.
1972 The Windust Phase in Lower Snake River Region Pre-history. Report of Investigations 50. Washington State Uni-versity, Pullman.
Rousseau, Mike K.2008 Chipped Stone Bifaces as Cultural, Behavioral, andTemporal Indices on the Central Canadian Plateau. In Pro-jectile Point Sequences in Northwestern North America,edited by Roy L. Carlson and Martin P. R. Magne, pp.221–251. Archaeology Press, Simon Fraser University,Burnaby.
Sanders, Paul H.1982 Lithic Analysis of the Windust Phase Component,Hatwai Site (10NP143), Nez Perce County, Idaho. Unpub-lished Master’s thesis, Department of Anthropology, Uni-versity of Wyoming.
Sappington, Robert Lee1994 The Prehistory of the Clearwater River Region, NorthCentral Idaho. University of Idaho AnthropologicalReports 95. Moscow.
Schroedl, Gerald F.1973 The Archaeological Occurrence of Bison in the South-ern Plateau. Reports of Investigations 51. WashingtonState University, Pullman.
Schulting, Rick J.1995 Mortuary Variability and Status Differentiation on theColumbia–Fraser Plateau. Archaeology Press, SimonFraser University, Burnaby.
Seeman, Mark F.1992 The Bow and Arrow: The Intrusive Mound Complex,and a Late Woodland Jack’s Reef Horizon in the Mid- OhioValley. In Cultural Variability in Context: Woodland Set-tlements in the Mid- Ohio Valley, edited by Mark F. See-man, pp. 41–51. Midcontinental Journal of ArchaeologySpecial Paper No. 7. Kent, Ohio.
Sheppard, John C., Peter E. Wigand, Carl E. Gustafson, andRubin Meyer
1987 A Reevaluation of the Marmes Rockshelter Radio-
carbon Chronology. American Antiquity 52:118–125.Shott, Michael J.1993 Spears, Darts, and Arrows: Late Woodland HuntingTechniques in the Upper Ohio Valley. American Antiquity58:425–443.
1997 Stones and Shafts Redux: The Metric Discriminationof Chipped- Stone Dart and Arrow Points. American Antiq-uity 62:86–101.
Smith, Marian W.1954 Attributes and the Discovery of Projectile Point Types:With Data from the Columbia–Fraser Region. AmericanAntiquity 20:15–26.
Stuiver, Minze, Paula J. Reimer, and Ron W. Reimer2005 CALIB Manual. Quaternary Isotope Lab, Universityof Washington, Seattle. Electronic document,http://calib.qub.ac.uk/calib/manual/index.html.
Thomas, David Hurst1978 Arrowheads and Atlatl Darts: How the Stones Got theShaft. American Antiquity 43:461–472.
1981 How to Classify the Projectile Points from MonitorValley, Nevada. Journal of California and Great BasinAnthropology 3(1):7–43.
1982 The Archaeology of Monitor Valley 1: Epistemology.Anthropological Papers of the American Museum of Nat-ural History 58 (Pt. 1). New York.
1983 The Archaeology of Monitor Valley 2: Gatecliff Shel-ter. Anthropological Papers of the American Museum ofNatural History 59 (Pt. 1). New York.
2008 The Archaeology of Monitor Valley 4: Alta Toquimaand the Mt. Jefferson Tablelands Complex. Anthropolog-ical Papers of the American Museum of Natural History,in press.
VanPool, Todd L.2006 The Survival of Archaic Technology in an Agricul-tural World: How the Atlatl and Dart Endured in the NorthAmerican Southwest. Kiva 71:429–452.
Webster, Gary S.1978 Dry Creek Rockshelter: Cultural Chronology in theWestern Snake River Region of Idaho, ca. 4150–1300 B.P.Tebiwa 15.
1980 Recent Data Bearing on the Question of the Originsof the Bow and Arrow in the Great Basin. American Antiq-uity 45:63–66.
Wylie, Alison1989 Archaeological Cables and Tacking: The Implicationsof Practice for Bernstein’s “Options Beyond Objectivismand Relativism.” Philosophy of Science 19(1):1–18.
Yent, Martha E.1976 The Cultural Sequence at Wawawai (45WT39), LowerSnake River Region, Southeastern Washington. Unpub-lished Master’s thesis, Department of Anthropology, Wash-ington State University.
Yohe, Robert M., II1998 The Introduction of the Bow and Arrow and LithicResource Use at Rose Spring (CA- INY-372). Journal ofCalifornia and Great Basin Anthropology 20(1):26–52.
Yu, Pei- Lin2006 From Atlatl to Bow and Arrow: Implicating Projec-tile Technology to Changing Systems of Hunter- GathererMobility. In Archaeology and Ethnoarchaeology of Mobil-ity, edited by Frederic Seller, Russell Greaves, and Pei- LinYu, pp. 201–220. University Press of Florida, Gainesville.
Zeanah, David W., and Robert G. Elston2001 Testing a Simple Hypothesis Concerning theResilience of Dart Point Styles to Haft Element Repair.Journal of California and Great Basin Anthropology23(1):93–124.
324 american antiquity [Vol. 75, no. 2, 2010
AQ75(2)Ames_Layout 1 4/12/10 12:22 PM Page 324

Notes
1. All dates in the text are uncorrected radiocarbon dates.All radiocarbon date calculations, including pooled meansand calibrations, were done with CALIB 5.0.1 (Stuiver et al.2004) for this article.
2. In Ames 2000 it was stated that Cascade points may beas early as 9000 B.P. at Hatwai. This was an error. As part ofthis research, the proveniences and contexts of all Hatwai
Cascade points were reviewed, and none could be firmlyplaced in a context dating earlier than 8200 B.P.
3. Unfortunately, we did not take axial length measure-ments and so cannot calculate Thomas’s basal indentationratio, which is a key attribute for Rosegate points.
Submitted December 12, 2008; Revised May 21, 2009;Accepted August 11, 2009.
ames et al.] Dart anD arrOW POintS On tHe cOLumBia PLateau OF WeStern nOrtH america 325
AQ75(2)Ames_Layout 1 4/12/10 12:22 PM Page 325
Premiering in St. Louis from The SAA Press
Celebrating SAA’s 75th Anniversary Meeting, Voices in American Archaeology features a diverse selection of authors addressing topics that contribute to larger dialogues among archaeologists and the wider public.
Contributions By: Mitchell Allen Jeffery H. Altschul Wendy Ashmore Jane E. Buikstra Margaret W. Conkey Robert Drennan T. J. Ferguson Maria Franklin Rosemary A. Joyce José Luis Lanata Dorothy T. Lippert Barbara J. Little Lynn Meskell Barbara J. Mills Thomas C. Patterson Timothy Pauketat Robert Paynter Jeremy A. Sabloff Lynne Sebastian Stephen W. Silliman James E. Snead Sander van der Leeuw Joe E. Watkins
Michael Wilcox Melinda A. Zeder Larry J. Zimmerman ISBN 978-0-932839-39-8 342 pp. 2010
Regular price: $34.75; SAA Member Discount Price: $24.75
www.saa.org/thesaapress
AQ75(2)Ames_Layout 1 4/12/10 12:22 PM Page 326