cs investment funds 13 (formerly credit suisse fund (lux))
TRANSCRIPT
CS Investment Funds 13 (formerly Credit Suisse Fund (Lux)) Investment fund under Luxembourg law
Audited Annual Report at 31.03.2015

CS Investment Funds 13 (formerly Credit Suisse Fund (Lux)) • Audited Annual Report as at 31.03.2015
Page 2Table of Contents
Audit Report 3
Management and Administration 4
Consolidated Report 6
Notes 8
Manager's Report 12
Report by SubfundCredit Suisse (Lux) Asia Corporate Bond Fund 14Credit Suisse (Lux) Asia Local Currency Bond Fund 23Credit Suisse (Lux) Broad EUR Bond Fund 32Credit Suisse (Lux) Broad Short Term EUR Bond Fund 37Credit Suisse (Lux) Broad Short Term USD Bond Fund 43Credit Suisse (Lux) Broad USD Bond Fund 49Credit Suisse (Lux) Commodity Index Plus CHF Fund 55Credit Suisse (Lux) Commodity Index Plus USD Fund 59Credit Suisse (Lux) Global Responsible Equity Fund 64Credit Suisse (Lux) Money Market Fund - EUR 69Credit Suisse (Lux) Money Market Fund - CHF 73Credit Suisse (Lux) Money Market Fund - USD 78Credit Suisse (Lux) Relative Return Engineered EUR Bond Fund 82Credit Suisse (Lux) Target Volatility Fund EUR 87
Unaudited Information 92

CS Investrnent Funds 13 (formedy Credit Suisse Fund (Lux))o {udibd Annual Report as at 31.03.2015
Audit Report Page 3
_rupwe
To the Unitholders ofCS Invstilent Funds 13 (formsrly Ctdft Suiece Fund (LuxD
We have audited the accompanying financial statements of CS Invesbnent Funds'13 (formerly Credit Suisse Fund (Lux)) and of each of ib Subfunds, witich
comprise the statement of net assets and the statement of investrnents in
searrfies and other net assets as at 31.03.20i5 and the statement ofoperations and changes in net asseb for the year then ended, and a summary oIsignificant accounting policies and other explanatory notes to the financial
statements.
Responslblllty of the Board of Dlrectorc of ths Management Company forthe Flnancial SbtemEnts
The Board of Directors of the Man4gement Company is responsible for thepreparation and fair preseniaiion of these financial statemenb in accordance with
Luxembourg legal and regulatory requirements relating to the preparation of thefinancial statements and for such intema! control as the Eloard of Directors of theManagement Company determines is necessary to enable the preparation offinancial statements that are free from materiai misstatement, whether due tofraud or enor.
Regponslbillty of the 'R6vieeur d'enbeprie€s agr66"
Our responsibility is to express an opinion on these financial statemenb based on
our audit. We conducted our zudit in accordance with lniemational Standards on
Auditing as adopted for Luxembourg by the "Commission de Surveillance du
Secteur Financier". Those standards require that we comply with ethical
requirements and plan and perform the audit to obtain reasonable arisurance
about whether ttre financial statements are free from material missbiemeni.
An audit involves performing procedures to obtain audil evidence about $eamounts and disclosures in the financial statements. The procedures selected
depend on the judgment of the 'R6vlseur d'entreprises agr66', including the
assessment of the risks ol material misstatement of the financial statements,
whether due to fraud or enor. In making those risk assessments, the 'R6viseurd'entreprises agr66" considers intemai conirol relevant to the entity's preparation
and fair presentation of the financial statements in order to design auditprocedures that are appropriate in the circumstances, but not for the purpose ofexpressing an opinion on the effectivoness of the entity's intemal control. An
audit also includes eraluating the appropriateness of accounting policies used and
the reasonableness of accounting estimates made by the Board of Directors ofthe Management Company, as well as evaluafing the overall presentation of thefinancial statemenb.
We believe that the audit evidence we have obtained is sufficient and aPpropriate
to provide a basis for our audit opinion.
Oplnlon
In our opinion, he financial statemenb give a true and fujr view of the financial
position of CS Investment Funds '13 ({ormerly Crdit Suisse Fund (Lux)) and ofeach of its Subfunds as of 31 ,03.201 5, and of the results of their operalions and
changes in thoir net assets for the year then ended in accordance with
Luxembourg legal and regulatory requirements relating to the preparation of thefinancial statements.
Other matters
Supplementary information included in the annual report has been reviewed in thecontext ol our mandate but has not been subject to specific audit procedures
canied out in accordance with the standards described above. Consequently, weexpress no opinion on such informaflon, However, we have no observation tomake conceming such informalion in the context of the financiai statementstaken as a whole.
Luxembourg, June 30, 2015
PricewaterhouseCoopers, Soci€t6 coop6rativeRepresenied by
The English version oJ the Annual Report has been reviewed by the auditors.
Consequently, the zudilor's report only refers to the English version of the report;
other vorsions result from a translation made under the responsibility of $e Board
of Directors of the management company.
PricewaierhouseCoopers, Soci6t6 cooperabte,2 rue Gerhard Mercator, B.P. 1443, L-1014 Luxembourg
f : +€,52 494848 1 , F:+352 494848 29@, www.pwc.lu
Cabinet de r6vision agr66. Expert-comptable (autorisation gowemementale n" 1 0028256)
R.C.S. Luxembourg B 65 477 - TVA LU25482518

CS Investment Funds 13 (formerly Credit Suisse Fund (Lux)) • Audited Annual Report as at 31.03.2015
Management and Administration Page 4
Management Company
Credit Suisse Fund Management S.A. 5, rue Jean Monnet, L-2180 Luxembourg R.C.S. Luxembourg B 72 925
Board of Directors
Luca Diener, Member of the Board Managing Director, Credit Suisse AG, Zurich Rudolf Kömen, Member of the Board Director, Credit Suisse Fund Management S.A., Luxembourg Guy Reiter, Member of the Board Director, Credit Suisse Fund Management S.A., Luxembourg Ferenc Schnitzer, Member of the Board (until 21.10.2014) Director, Credit Suisse AG, Zurich
Custodian Bank
Credit Suisse (Luxembourg) S.A. 5, rue Jean Monnet, L-2180 Luxembourg (change of address effective from 12.05.2014)
Auditor
PricewaterhouseCoopers, Société coopérative 2, rue Gerhard Mercator, L-2182 Luxembourg
Representative in Switzerland
Credit Suisse Funds AG Uetlibergstrasse 231, CH-8070 Zurich
Paying Agent in Switzerland
Credit Suisse AG Paradeplatz, 8, CH-8001 Zurich
Paying and Information Agent in Germany
Deutsche Bank AG Institutional Cash & Securities Services Issuer Services / Post IPO Services Taunusanlage 12, D-60325 Frankfurt/Main
Additional Information Agent in Germany
Credit Suisse (Deutschland) AG Junghofstrasse 16, D-60311 Frankfurt/Main
Principal correspondent bank in France
BNP PARIBAS Securities Services 3, rue d’ Antin, F-75002 Paris
Paying Agent and Representative in Liechtenstein
LGT Bank in Liechtenstein Aktiengesellschaft Herrengasse 12, FL-9490 Vaduz
Paying Agent in Austria
UniCredit Bank Austria AG Schottengasse 6-8, A-1010 Vienna
Distribution Agents
Credit Suisse AG Paradeplatz 8, CH-8001 Zurich Credit Suisse Fund Services (Luxembourg) S.A., Luxembourg 5, rue Jean Monnet, L-2180 Luxembourg
Investment Manager
Credit Suisse AG Paradeplatz 8, CH-8001 Zurich
- Credit Suisse (Lux) Broad Short Term EUR Bond Fund (formerly Credit Suisse Fund (Lux) Bond Short Maturity EUR)
- Credit Suisse (Lux) Broad Short Term USD Bond Fund (formerly Credit Suisse Fund (Lux) Bond Short Maturity USD)
- Credit Suisse (Lux) Broad EUR Bond Fund (formerly Credit Suisse Fund (Lux) Bond EUR)
- Credit Suisse (Lux) Broad USD Bond Fund (formerly Credit Suisse Fund (Lux) Bond USD)
- Credit Suisse (Lux) Global Responsible Equity Fund (formerly Credit Suisse Fund (Lux) Global Responsible Equities)
- Credit Suisse (Lux) Money Market Fund – EUR (formerly Credit Suisse Fund (Lux) Money Market EUR)
- Credit Suisse (Lux) Money Market Fund – CHF (formerly Credit Suisse Fund (Lux) Money Market Sfr)
- Credit Suisse (Lux) Money Market Fund – USD (formerly Credit Suisse Fund (Lux) Money Market USD)
- Credit Suisse (Lux) Relative Return Engineered EUR Bond Fund (formerly Credit Suisse Fund (Lux) Relative Return Engineered (Euro))
- Credit Suisse (Lux) Target Volatility Fund EUR (formerly Credit Suisse Fund (Lux) Target Volatility (Euro) (until 10.02.2014)) (since 17.02.2015)
Credit Suisse Asset Management, LLC 11 Madison Avenue, New York, NY 10017, USA
- Credit Suisse (Lux) Commodity Index Plus CHF Fund (formerly Credit Suisse Fund (Lux) Commodity Index Plus (Sfr))
- Credit Suisse (Lux) Commodity Index Plus USD Fund (formerly Credit Suisse Fund (Lux) Commodity Index Plus (US$))
Credit Suisse (Singapore) Limited 1 Raffles Link, Singapore 039393
- Credit Suisse (Lux) Asia Corporate Bond Fund (formerly Credit Suisse Fund (Lux) Bond Asia Corporate (USD))
- Credit Suisse (Lux) Asia Local Currency Bond Fund (formerly Credit Suisse Fund (Lux) Bond Asia Local Currency (USD))
Central Administration
Credit Suisse Fund Services (Luxembourg) S.A., Luxembourg 5, rue Jean Monnet, L-2180 Luxembourg

CS Investment Funds 13 (formerly Credit Suisse Fund (Lux)) • Audited Annual Report as at 31.03.2015
Management and Administration Page 5
Distribution of Units in Germany
Deutsche Bank AG, Institutional Cash & Securities Services, Issuer Services / Post IPO, Services, Taunusanlage 12, D-60325 Frankfurt am Main, is the Paying Agent for the Fund in Germany. Applications for the redemption and conversion of Units which may be distributed in Germany, may be lodged with the Paying Agent. All payments which are intended for Unitholders (including proceeds of the redemption of Units and any distributions) may be channeled, at their request, via the Paying Agent and/or paid out by the Paying Agent in cash in euros. The Paying Agent is also the Information Agent for the Fund in Germany. Any correspondence with the Paying and Information Agent in Germany should be directed to Deutsche Bank AG, Institutional Cash & Securities Services, Issuer Services / Post IPO, Services. Credit Suisse (Deutschland) AG, Junghofstrasse 16, D-60311 Frankfurt am Main, is an additional Information Agent (individually and collectively referred to as “Information Agent”) for the Fund in Germany. Investors may obtain copies of the Prospectus, Key Investor Information Document, Management Regulations, audited annual report and unaudited semi-annual report, together with the issue, redemption and conversion prices, free of charge from the Information Agent. Furthermore, the Management Company’s articles of incorporation are available for inspection at the Information Agent. Any required notices to Unitholders and the issue and redemption prices shall be published in the “Börsen-Zeitung” Frankfurt am Main as a minimum. The Management Company may also place announcements in other newspapers and periodicals of its choice. Moreover, registered investors will be notified by way of permanent data media in the following instances: suspension of the redemption of Units; liquidation of the Fund or a Subfund; changes to the Management Regulations that are inconsistent with the existing investment principles, affect significant investor rights, or relate to remuneration or compensation of expenses (stating the background and the investors' rights), the merger of a Subfund or the possible conversion of a Subfund into a feeder fund. The Management Company is required, if requested, to supply the German tax authorities with evidence demonstrating, for example, the correctness of the declared basis for taxation. The calculation of this basis may be interpreted in different ways, and it is not possible to guarantee that the German tax authorities will accept the Management Company’s calculation method in every significant respect. Moreover, investors must be aware that, in the event that past errors come to light, corrections may not be generally made with retroactive effect but in principle are only applied to the current financial year. Consequently, such corrections may adversely affect or benefit those investors who receive a distribution or to whom capital growth accrues in the current financial year.
Distribution of Units in Austria
UniCredit Bank Austria AG, Schottengasse 6–8, A-1010 Vienna, is the Paying Agent (the “Austrian Paying Agent”) for Austria. All payments intended for Unitholders may be channeled at his or her request via the Austrian Paying Agent and/or upon request may be paid in cash by the Austrian Paying Agent. Applications for the redemption of Units may be lodged with the Austrian Paying Agent. Hard copies of the Prospectus, the Key Investor Information Document, the Management Regulations, the audited annual report as well as the unaudited semi-annual report and the issue and redemption prices are available free of charge from the Austrian Paying Agent. All notices to Unitholders and price publications shall be published in the “Wiener Zeitung” as a minimum. The Management Company may also place announcements in other newspapers and periodicals of its choice.
Distribution of Units in Liechtenstein
The Paying Agent and Representative in Liechtenstein is LGT Bank in Liechtenstein Aktiengesellschaft, Herrengasse 12, FL-9490 Vaduz. Announcements to investors concerning amendments to the Management Regulations, change of the Management Company or the Custodian Bank as well as the liquidation of the Fund shall be published in the “Liechtensteiner Vaterland”. Prices are published on the electronic platform www.swissfunddata.ch each day on which Units are issued and redeemed. At least twice a month, prices are published in the “Liechtensteiner Vaterland”.
No subscription may be accepted on the basis of the financial reports. Subscriptions are accepted only on the basis of the current sales prospectus accompanied by the key investor information documents, the latest audited annual report and the latest unaudited semi-annual report if more recent. The issue and redemption prices are published in Luxembourg at the registered office of the Management Company. The net asset value is also published daily on the Internet www.credit-suisse.com and in different newspapers. Unitholders may obtain the sales prospectus, the key investor information documents, the latest audited annual and unaudited semi-annual reports, the changes in the composition of the securities portfolio during the reporting period and copies of the Management Regulations free of charge from the registered office of the Management Company, or the local representatives in the countries where the Fund is registered or the Paying and Information Agent and the Additional Information Agent in Germany.

CS Investment Funds 13 (formerly Credit Suisse Fund (Lux)) • Audited Annual Report as at 31.03.2015
Page 6Consolidated Report
Statement of Net Assets in CHF
31.03.2015
Assets
Investments in securities at market value 3,123,433,449.73Cash at banks and at brokers 83,732,814.53Subscriptions receivable 5,732,268.30Income receivable 19,264,590.44Prepaid expenses 69,466.17Formation expenses 299.24Net unrealised gain on financial futures contracts 51,859.44Net unrealised gain on swaps contracts 4,132,490.61Net unrealised gain on forward foreign exchange contracts 1,409,641.18Other assets 20,302.29
3,237,847,181.93
Liabilities
Due to banks and to brokers 5,703,665.64Redemptions payable 3,049,610.99Provisions for accrued expenses 1,222,603.32Net unrealised loss on financial futures contracts 1,243,950.94Net unrealised loss on swaps contracts 14,049,253.20Net unrealised loss on forward foreign exchange contracts 3,234,879.22Other liabilities 2,166.90
28,506,130.21
Net assets 3,209,341,051.72
The notes are an integral part of the financial statements.

CS Investment Funds 13 (formerly Credit Suisse Fund (Lux)) • Audited Annual Report as at 31.03.2015
Page 7
Income
Interest on investments in securities (net) 27,986,118.53Dividends (net) 558,280.38Bank interest 25,896.73Securities lending income 125,477.43
28,695,773.07
Expenses
Management fee 4,647,405.45Custodian and safe custody fees 557,070.62Administration expenses 623,114.08Printing and publication expenses 107,513.83Interest and bank charges 37,566.46Audit, control, legal, representative bank and other expenses 728,596.56"Taxe d'abonnement" 305,002.98Amortisation of formation expenses 1,228.20
7,007,498.18
Net income (loss) 21,688,274.89
Realised gain (loss)
Net realised gain (loss) on sales of investments 9,508,183.73Net realised gain (loss) on financial futures contracts -4,361,344.96Net realised gain (loss) on swap contracts -77,844,437.92Net realised gain (loss) on forward foreign exchange contracts -25,806,351.67Net realised gain (loss) on foreign exchange -2,377,930.31
-100,881,881.13
Net realised gain (loss) -79,193,606.24
Change in net unrealised appreciation (depreciation)
Change in net unrealised appreciation (depreciation) on investments 19,202,427.71Change in net unrealised appreciation (depreciation) on financial futures contracts -1,857,192.80Change in net unrealised appreciation (depreciation) on swap contracts -10,682,700.66Change in net unrealised appreciation (depreciation) on forward foreign exchange contracts 4,782,323.71
11,444,857.96
Net increase (decrease) in net assets as a result of operations -67,748,748.28
Subscriptions / Redemptions
Subscriptions 966,874,738.18Redemptions -1,097,923,291.12
-131,048,552.94
Distribution -2,661,997.77
The notes are an integral part of the financial statements.
Consolidated Report
Statement of Operations in CHF
For the period from01.10.2014 to
31.03.2015

CS Investment Funds 13 (formerly Credit Suisse Fund (Lux)) • Audited Annual Report as at 31.03.2015
Consolidated Report Page 8
Notes
General
CS Investment Funds 13 (formerly Credit Suisse Fund (Lux)) ("the Fund") is a Luxembourg mutual investment Fund with subfunds ("umbrella Fund") which has been launched as at 24.10.2003. The Fund is registered under Part I of the Luxembourg law dated 17.12.2010, as amended, relating to undertakings for collective investments. As of 31.03.2015 the Fund had 14 subfunds. Changes: The Management Company has decided to amend the end of the accounting year of the Fund from 30.09 to 31.03 of each year. As a consequence, the current accounting year started on 01.10.2014 and ended on 31.03.2015. - Credit Suisse Fund (Lux) Bond Short Maturity USD -EA- has been launched
on 19.12.2014 and the first NAV has been calculated on 22.12.2014. - Credit Suisse Fund (Lux) Bond USD -EA- has been launched on 19.12.2014
and the first NAV has been calculated on 22.12.2014. - Credit Suisse Fund (Lux) Bond Asia Corporate (USD) -EA- has been
launched on 13.01.2015 and the first NAV has been calculated on 14.01.2015.
- Credit Suisse Fund (Lux) Bond EUR -EA- has been launched on 21.01.2015 and the first NAV has been calculated on 22.01.2015.
- -UB- unit of Credit Suisse (Lux) Money Market Fund – CHF, Credit Suisse (Lux) Money Market Fund – USD and Credit Suisse (Lux) Money Market Fund – EUR has been launched on 30.01.2015 and the first NAV has been calculated on 02.02.2015.
- Credit Suisse Fund (Lux) Bond Asia Corporate (USD) -UA-, -UB-, -UBH- CHF, -UBH- EUR, -UAH- SGD, -UAH- EUR has been launched on 30.01.2015 and the first NAV has been calculated on 02.02.2015.
- Credit Suisse Fund (Lux) Bond Asia Local Currency (USD) -I- has been launched on 16.02.2015 and the first NAV has been calculated on 17.02.2015.
It has been decided to rename the Fund Credit Suisse Fund (Lux) into CS Investment Funds 13 with effective date 17.02.2015. The name of the subfunds changed as follow:
Old name New name Credit Suisse Fund (Lux) Bond Asia Corporate (USD)
Credit Suisse (Lux) Asia Corporate Bond Fund
Credit Suisse Fund (Lux) Bond Asia Local Currency (USD)
Credit Suisse (Lux) Asia Local Currency Bond Fund
Credit Suisse Fund (Lux) Bond EUR Credit Suisse (Lux) Broad EUR Bond Fund
Credit Suisse Fund (Lux) Bond USD
Credit Suisse (Lux) Broad USD Bond Fund
Credit Suisse Fund (Lux) Bond Short Maturity EUR
Credit Suisse (Lux) Broad Short Term EUR Bond Fund
Credit Suisse Fund (Lux) Bond Short Maturity USD
Credit Suisse (Lux) Broad Short Term USD Bond Fund
Credit Suisse Fund (Lux) Commodity Index Plus (Sfr)
Credit Suisse (Lux) Commodity Index Plus CHF Fund
Credit Suisse Fund (Lux) Commodity Index Plus (US$) Credit Suisse Fund (Lux) Global Responsible Equities Credit Suisse Fund (Lux) Money Market Sfr Credit Suisse Fund (Lux) Money Market EUR Credit Suisse Fund (Lux) Money Market USD Credit Suisse Fund (Lux) Relative Return Engineered (Euro) Credit Suisse Fund (Lux) Target Volatility (Euro)
Credit Suisse (Lux) Commodity Index Plus USD Fund Credit Suisse (Lux) Global Responsible Equity Fund Credit Suisse (Lux) Money Market Fund – CHF Credit Suisse (Lux) Money Market Fund – EUR Credit Suisse (Lux) Money Market Fund – USD Credit Suisse (Lux) Relative Return Engineered EUR Bond Fund Credit Suisse (Lux) Target Volatility Fund EUR
Moreover, the name of the unit classes changed as follow: Old Name New Name DG
DB IA
I IB R BH SW X Y
IBH MBH AH IAH
- Credit Suisse (Lux) Asia Local Currency Bond Fund -UAH- SGD has been
launched on 27.02.2015 and the first NAV has been calculated on 02.03.2015.
- -UA- unit of Credit Suisse (Lux) Broad Short Term EUR Bond, Credit Suisse (Lux) Broad Short Term USD Bond, Credit Suisse (Lux) Broad USD Bond Fund, Credit Suisse (Lux) Broad EUR Bond Fund and Credit Suisse (Lux) Asia Local Currency Bond Fund has been launched on 27.02.2015 and the first NAV has been calculated on 02.03.2015.
- -UB- unit of Credit Suisse (Lux) Broad Short Term EUR Bond, Credit Suisse (Lux) Broad Short Term USD Bond, Credit Suisse (Lux) Broad USD Bond Fund, Credit Suisse (Lux) Broad EUR Bond Fund, Credit Suisse (Lux) Asia Local Currency Bond Fund, Credit Suisse (Lux) Global Responsible Equity Fund, Credit Suisse (Lux) Relative Return Engineered EUR Bond Fund, Credit Suisse (Lux) Commodity Index Plus USD Fund and Credit Suisse (Lux) Target Volatility Fund EUR has been launched on 27.02.2015 and the first NAV has been calculated on 02.03.2015.
- -UBH- CHF unit of Credit Suisse (Lux) Asia Local Currency Bond Fund, Credit Suisse (Lux) Commodity Index Plus USD Fund and Credit Suisse (Lux) Target Volatility Fund EUR has been launched on 27.02.2015 and the first NAV has been calculated on 02.03.2015.
- -UBH- EUR unit of Credit Suisse (Lux) Asia Local Currency Bond Fund and Credit Suisse (Lux) Commodity Index Plus USD Fund has been launched on 27.02.2015 and the first NAV has been calculated on 02.03.2015.
- -UBH- USD unit of Credit Suisse (Lux) Target Volatility Fund EUR has been launched on 27.02.2015 and the first NAV has been calculated on 02.03.2015.
- -UBH- CZK, -UBH- HUF and -UBH- PLN unit of Credit Suisse (Lux) Broad Short Term EUR Bond has been launched on 27.02.2015 and the first NAV has been calculated on 02.03.2015.
- -DB- unit of Credit Suisse (Lux) Asia Local Currency Bond Fund and Credit Suisse (Lux) Asia Corporate Bond Fund has been launched on 12.03.2015 and the first NAV has been calculated on 13.03.2015.
Summary of significant accounting policies
a) Computation of the net asset value of each subfund The Net Asset Value of the Units in each subfund shall be calculated in the Reference Currency of the respective subfund and shall be determined by the Management Company in Luxembourg on each Banking Day on which banks are normally open all day for business in Luxembourg (each such day being referred to as a “Valuation Day”). The net asset value of each subfund is determined each day on the basis of income/expenses accrued up to the same day, transactions in the investment portfolio until the preceding day and the valuation of net assets on the basis of the last available market prices. The financial statements reflect the net asset values as calculated on 31.03.2015 based on the market prices of the investments as of 31.03.2015. The investment manager needs to undertake transactions in order to maintain the desired asset allocation as a result of subscriptions or redemptions, which may generate additional costs for the fund and its shareholders. As a consequence, in order to protect the existing investors’ interest, from these capital movements, when net capital movements exceed a threshold pre-defined by the Board of Directors, an adjustment of the NAV per share used is applied. This adjustment reflects the estimated tax and dealing costs that may be incurred by the fund as a result of these transactions, and the estimated bud-off spread of the assets in which the fund invests. A periodical review is undertaken in order to verify the appropriateness of the swing factor being applied. The NAV per share as disclosed in the statistical information is the published NAV per share whereas the total net assets disclosed in the statement of net assets is the total net asset value excluding year end swing adjustment. As at year end, swing pricing was applied on the subfund Credit Suisse (Lux) Target Volatility Fund EUR.

CS Investment Funds 13 (formerly Credit Suisse Fund (Lux)) • Audited Annual Report as at 31.03.2015
Consolidated Report Page 9
Notes
b) Valuation of investment securities of each subfund Securities which are listed on a stock exchange or which are regularly traded on such are valued at the last available price paid. If such a price is not available for a particular exchange session, but a closing mid-price (the mean of the listed closing bid and ask prices) or a closing bid price is available, then the closing mid-price, or alternatively the closing bid price, may be taken as a basis for the valuation. If the security is traded on more than one stock exchange, valuation is made by reference to the exchange on which it is chiefly traded. In the case of securities for which trading on a stock exchange is not significant, but which are bought and sold on a secondary market with regulated trading among securities dealers (with the effect that the price is set on a market basis), the Board of Directors of the Management Company may decide to base the valuation on this secondary market. Securities traded on a regulated market are valued in the same way as securities listed on a stock exchange. Securities that are not listed on a stock exchange and are not traded on a regulated market are valued at their last available market price; if no such price is available, the Board of Directors of the Management Company shall value these securities in accordance with other criteria to be established by the Board of Directors of the Management Company and on the basis of the selling prices that can probably be achieved, which shall be estimated with due care and in good faith. If a valuation in accordance with the above rules is rendered impossible or incorrect owing to special or changed circumstances, the Board of Directors of the Management Company is entitled to use other generally recognized valuation principles in order to evaluate the subfund's assets. The valuation price of a money market investment shall – based on the net acquisition price – be progressively adjusted to the redemption price while keeping the resulting investment return constant. In the event of a significant change in market conditions, the basis for the valuation of different investments shall be brought into line with the new market yields. c) Net realised gain/loss on sales of investments of each subfund The realised gains or losses on the sales of securities are calculated on the basis of the average acquisition cost. d) Cash at banks and at brokers Cash at banks and at brokers includes cash in hand, margin calls and deposits held at call with banks and other short-term investments in an active market with original maturities of three months or less and bank overdrafts. e) Foreign exchange conversion The financial statements are kept in the reference currency of each subfund and the consolidated financial statements are kept in CHF. Cash at banks, other net assets and the value of portfolio securities in currencies other than reference currency of each subfund are converted into the reference currency at the foreign exchange rate prevailing on the date of valuation. Income and expenses in currencies other than reference currency of each subfund are converted into the reference currency at the foreign exchange rate applicable at the date they accrue to the subfund. Realised gains or losses on foreign currencies are accounted for in the statement of operations. The acquisition cost of securities in currencies other than the reference currency of each subfund is converted into the reference currency at the foreign exchange rate valid at the date of acquisition. f) Transactions on investments in securities of each subfund The transactions on investments in securities are booked on a trade date basis. g) Formation expenses of each subfund Formation expenses are amortised over a period of five years. h) Valuation of financial futures contracts of each subfund Unmatured financial futures contracts are valued at valuation date at market rates prevailing at this date and resulting unrealised gains or losses are posted to the statement of operations and are shown under the statement of net assets. i) Valuation of forward foreign exchange contracts of each subfund Unmatured forward foreign exchange contracts are valued at valuation date at forward exchange rates prevailing at this date and resulting unrealised gains or losses are posted to the statement of operations and are shown under the statement of net assets.
j) Valuation of swaps On each valuation day, swap agreements are valued at the net present value of the future cash flows, using the relevant interest rate yield curve on valuation day. Asset swaps and the securities linked to the asset swaps are not revaluated as the security and the asset swaps are considered for the purpose of the valuation as a single instrument. The resulting unrealised gains or losses are shown under the statement of net assets. k) Allocation of accrued expenses Accrued expenses which can be allocated directly to a subfund are charged to this subfund. Accrued expenses which cannot be allocated directly are divided among the subfunds in proportion to the net assets of each subfund. l) Securities Lending The Fund can practise lending of securities included in its portfolios of its sub-funds. The Fund may only lend securities within a standardized system of securities lending organised by a recognised institution of securities compensation or by first class financial institutions specialised in this type of operations. m) Income recognition Dividends are recorded on ex-dividend date, net of withholding tax. Interests are accrued on a daily basis. n) Other income The trailer commissions received during the period/year are accounted under “Other income”.
Management fee (see detail at subfund level)
As remuneration for its services and reimbursement of its expenses, the Management Company is entitled to a management fee, payable at the end of each month and calculated on the basis of the average of the daily net asset value of each subfund during the relevant month. There is no management fee for the D units.
"Taxe d'abonnement"
Under the prevailing laws and regulations, the Company is subject in Luxembourg, on the basis of its investments, to a "taxe d'abonnement" at the annual rate of 0.05%, payable quarterly and calculated on the basis of the net assets of each Subfund at the end of each quarter. In the case of Unit Classes that may only be acquired by institutional investors, this annual tax rate is 0.01%. The portion of net assets, which is invested in other undertakings for collective investment in securities under Luxembourg law, is exempt from this tax.
Total Expense Ratio (TER) (see detail at subfund level)
The TER expresses the sum of all costs and commissions charged on an ongoing basis to the fund’s assets, taken retrospectively as a percentage of these assets. If a subfund invests at least 10% of its net assets as a fund of fund in target funds, a composite TER of the fund of funds is to be calculated as follows: The prorated TER of the individual target funds including a performance related remuneration, weighted according to the share they represent in the overall assets of the fund of funds as of the closing date and the TER of the fund of funds minus the retroceded commissions received from the target funds during the reporting year. The TER is calculated following the SFAMA guideline. No TER is disclosed for units launched less than 6 months ago.
Portfolio Turnover Rate (PTR) (see detail at subfund level)
The PTR is used as the indicator for the fund’s trading activities (excluding purchases and sales resulting from subscriptions and buybacks) and is expressed as a percentage of the average net assets of the fund during the preceding twelve-month period. The PTR is calculated following the SFAMA guideline.
Changes in the composition of the securities portfolio
Changes in the composition of the securities portfolio during the reporting period are available to unit holders free of charge at the registered office of the
CS Investment Funds 13 (formerly Credit Suisse Fund (Lux)) • Audited Annual Report as at 31.03.2015
Consolidated Report Page 10
Notes
Management Company or the local representatives in the countries where the Fund is registered.
Exchange Rates
The consolidated financial statements are kept in CHF. For this purpose, the financial statements of the subfunds are converted into CHF at the following foreign exchange rates:
1 EUR = 1.043150 CHF 1 USD = 0.971275 CHF
Fund performance (see detail at subfund level)
The performance of the year Y is based on the net asset values as calculated on the last business day of the year Y respectively Y-1. Those net asset values reflect the market prices of the investments as of the last business day of the year Y-1 respectively Y. Historical performance is no indicator of current or future performance. The performance data given does not take into account commissions and costs incurred in the purchase or redemption of the Fund’s units. The YTD (Year-To-Date) Performance includes the period from 01.01.2015 until 31.03.2015. For units launched more than 3 years ago no performance since inception is disclosed. Performance of distributing units includes reinvestments of dividends.
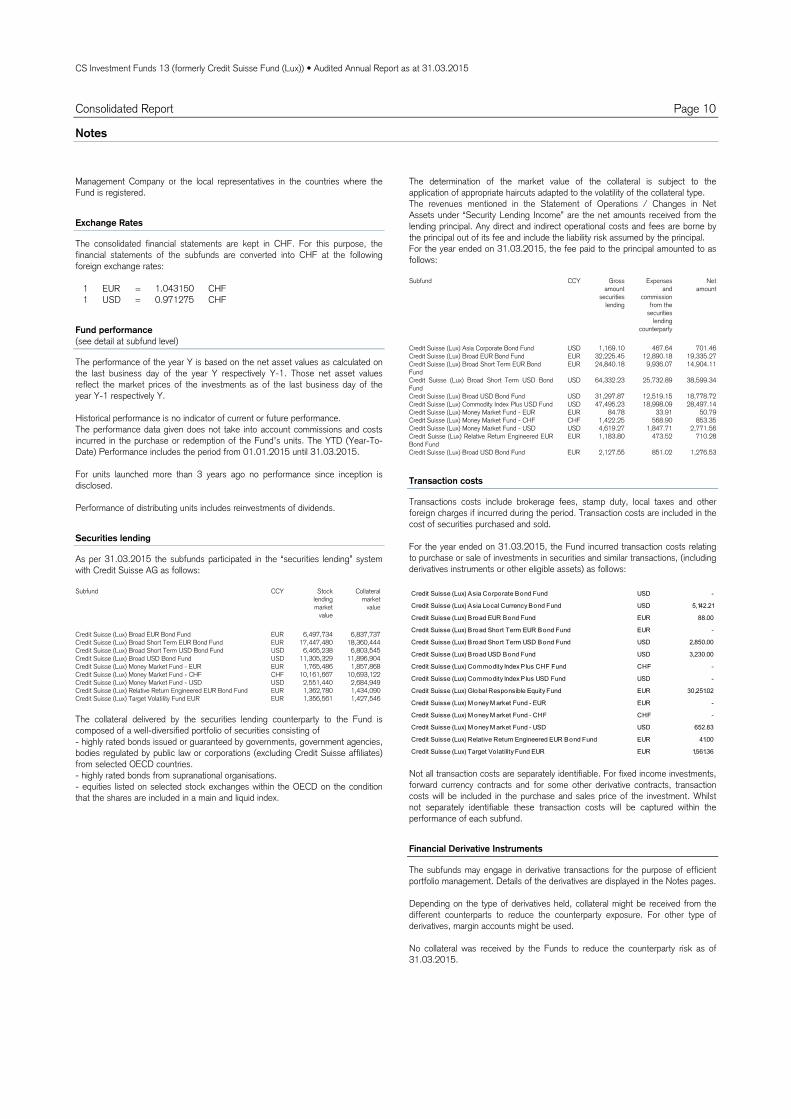
Securities lending
As per 31.03.2015 the subfunds participated in the “securities lending” system with Credit Suisse AG as follows: Subfund CCY Stock
lending market
value
Collateral market
value
Credit Suisse (Lux) Broad EUR Bond Fund EUR 6,497,734 6,837,737Credit Suisse (Lux) Broad Short Term EUR Bond Fund EUR 17,447,480 18,360,444Credit Suisse (Lux) Broad Short Term USD Bond Fund USD 6,465,238 6,803,545Credit Suisse (Lux) Broad USD Bond Fund USD 11,305,329 11,896,904Credit Suisse (Lux) Money Market Fund - EUR EUR 1,765,486 1,857,868Credit Suisse (Lux) Money Market Fund - CHF CHF 10,161,667 10,693,122Credit Suisse (Lux) Money Market Fund - USD USD 2,551,440 2,684,949Credit Suisse (Lux) Relative Return Engineered EUR Bond Fund EUR 1,362,780 1,434,090Credit Suisse (Lux) Target Volatility Fund EUR EUR 1,356,561 1,427,546
The collateral delivered by the securities lending counterparty to the Fund is composed of a well-diversified portfolio of securities consisting of - highly rated bonds issued or guaranteed by governments, government agencies, bodies regulated by public law or corporations (excluding Credit Suisse affiliates) from selected OECD countries. - highly rated bonds from supranational organisations. - equities listed on selected stock exchanges within the OECD on the condition that the shares are included in a main and liquid index.
The determination of the market value of the collateral is subject to the application of appropriate haircuts adapted to the volatility of the collateral type. The revenues mentioned in the Statement of Operations / Changes in Net Assets under “Security Lending Income” are the net amounts received from the lending principal. Any direct and indirect operational costs and fees are borne by the principal out of its fee and include the liability risk assumed by the principal. For the year ended on 31.03.2015, the fee paid to the principal amounted to as follows: Subfund CCY Gross
amount securities
lending
Expenses and
commission from the
securities lending
counterparty
Net amount
Credit Suisse (Lux) Asia Corporate Bond Fund USD 1,169.10 467.64 701.46Credit Suisse (Lux) Broad EUR Bond Fund EUR 32,225.45 12,890.18 19,335.27Credit Suisse (Lux) Broad Short Term EUR Bond Fund
EUR 24,840.18 9,936.07 14,904.11
Credit Suisse (Lux) Broad Short Term USD Bond Fund
USD 64,332.23 25,732.89 38,599.34
Credit Suisse (Lux) Broad USD Bond Fund USD 31,297.87 12,519.15 18,778.72Credit Suisse (Lux) Commodity Index Plus USD Fund USD 47,495.23 18,998.09 28,497.14Credit Suisse (Lux) Money Market Fund - EUR EUR 84.78 33.91 50.79Credit Suisse (Lux) Money Market Fund - CHF CHF 1,422.25 568.90 853.35Credit Suisse (Lux) Money Market Fund - USD USD 4,619.27 1,847.71 2,771.56Credit Suisse (Lux) Relative Return Engineered EUR Bond Fund
EUR 1,183.80 473.52 710.28
Credit Suisse (Lux) Broad USD Bond Fund EUR 2,127.55 851.02 1,276.53
Transaction costs
Transactions costs include brokerage fees, stamp duty, local taxes and other foreign charges if incurred during the period. Transaction costs are included in the cost of securities purchased and sold. For the year ended on 31.03.2015, the Fund incurred transaction costs relating to purchase or sale of investments in securities and similar transactions, (including derivatives instruments or other eligible assets) as follows: Credit Suisse (Lux) Asia Corporate Bond Fund USD -
Credit Suisse (Lux) Asia Local Currency Bond Fund USD 5,142.21
Credit Suisse (Lux) Broad EUR Bond Fund EUR 88.00
Credit Suisse (Lux) Broad Short Term EUR Bond Fund EUR -
Credit Suisse (Lux) Broad Short Term USD Bond Fund USD 2,850.00
Credit Suisse (Lux) Broad USD Bond Fund USD 3,230.00
Credit Suisse (Lux) Commodity Index Plus CHF Fund CHF -
Credit Suisse (Lux) Commodity Index Plus USD Fund USD -
Credit Suisse (Lux) Global Responsible Equity Fund EUR 30,251.02
Credit Suisse (Lux) M oney M arket Fund - EUR EUR -
Credit Suisse (Lux) M oney M arket Fund - CHF CHF -
Credit Suisse (Lux) M oney M arket Fund - USD USD 652.83
Credit Suisse (Lux) Relative Return Engineered EUR Bond Fund EUR 41.00
Credit Suisse (Lux) Target Vo latility Fund EUR EUR 1,561.36 Not all transaction costs are separately identifiable. For fixed income investments, forward currency contracts and for some other derivative contracts, transaction costs will be included in the purchase and sales price of the investment. Whilst not separately identifiable these transaction costs will be captured within the performance of each subfund.
Financial Derivative Instruments
The subfunds may engage in derivative transactions for the purpose of efficient portfolio management. Details of the derivatives are displayed in the Notes pages. Depending on the type of derivatives held, collateral might be received from the different counterparts to reduce the counterparty exposure. For other type of derivatives, margin accounts might be used. No collateral was received by the Funds to reduce the counterparty risk as of 31.03.2015.

CS Investment Funds 13 (formerly Credit Suisse Fund (Lux)) • Audited Annual Report as at 31.03.2015
Consolidated Report Page 11
Notes
Risk Management
The global exposure of the subfunds is calculated on the basis of the commitment approach except for Credit Suisse Fund (Lux) Relative Return Engineered (Euro) which is calculated under absolute VaR approach.
Index tracking error
Credit Suisse (Lux) Commodity Index Plus USD Fund Class I The performance of the subfund for the year ended 31.03.2015 was -26.24%, net of fees, while the Bloomberg Commodity Index Total Return, the subfund’s benchmark, decreased by 27.04%. This resulted in a net excess return of 0.80%. The subfund also outperformed the benchmark before fees and subfund expenses. Commodity strategies and underlying cash management both positively contributed to relative performance. Within the portfolio’s commodity exposure, forward curve positioning in the Energy, Livestock and Agriculture sectors had a positive impact relative to the benchmark. At year end, the tracking error was 0.48%, compared to an estimated tracking error of 1.50%. This difference was principally due to lower monthly curve volatility. Credit Suisse (Lux) Commodity Index Plus CHF Fund Class I The performance of the subfund for the year ended 31.03.2015 was -26.94%, net of fees, while the Bloomberg Commodity Index Swiss Franc Hedged Daily Modified Total Return, the subfund’s benchmark, decreased by 27.71%. This resulted in a net excess return of 0.78%. The subfund also outperformed the benchmark before fees and subfund expenses. Commodity strategies and underlying cash management both positively contributed to relative performance. Within the portfolio’s commodity exposure, forward curve positioning in the Energy, Livestock and Agriculture sectors had a positive impact relative to the benchmark. At year end, the tracking error was 0.55%, compared to an estimated tracking error of 1.50%. This difference was principally due to lower monthly curve volatility.”
CS Investment Funds 13 (formerly Credit Suisse Fund (Lux)) • Audited Annual Report as at 31.03.2015
Manager's Report Page 12
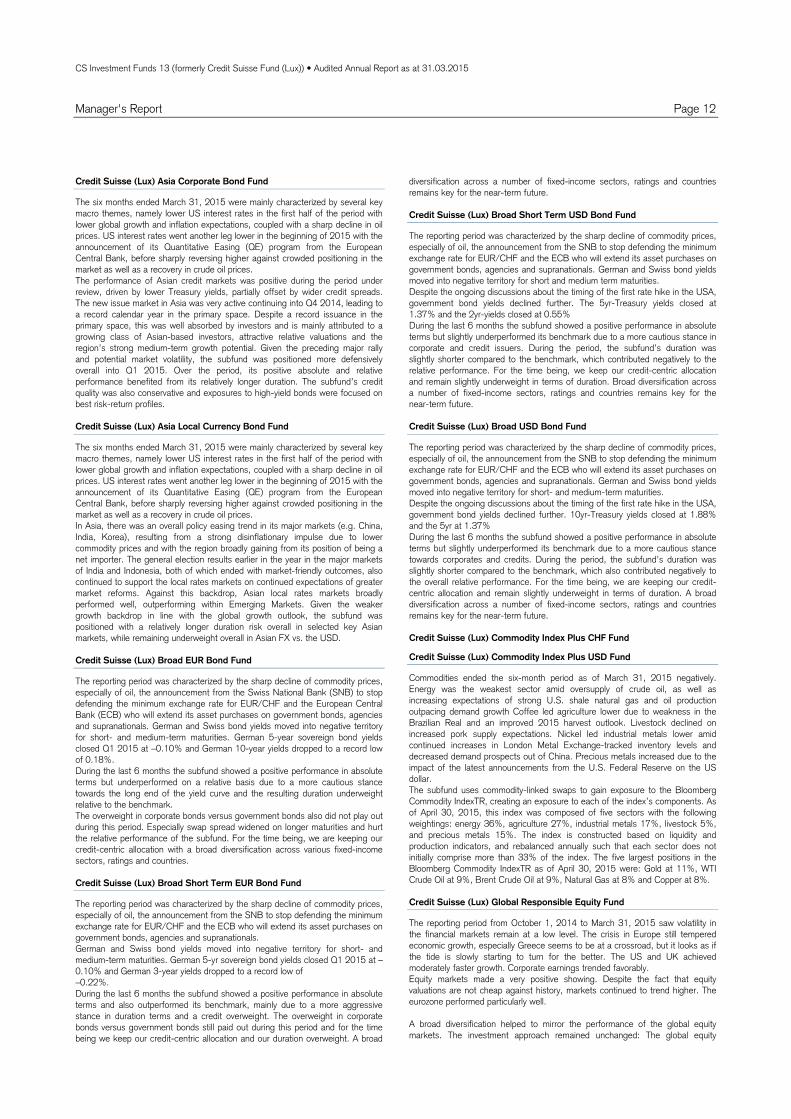
Credit Suisse (Lux) Asia Corporate Bond Fund
The six months ended March 31, 2015 were mainly characterized by several key macro themes, namely lower US interest rates in the first half of the period with lower global growth and inflation expectations, coupled with a sharp decline in oil prices. US interest rates went another leg lower in the beginning of 2015 with the announcement of its Quantitative Easing (QE) program from the European Central Bank, before sharply reversing higher against crowded positioning in the market as well as a recovery in crude oil prices. The performance of Asian credit markets was positive during the period under review, driven by lower Treasury yields, partially offset by wider credit spreads. The new issue market in Asia was very active continuing into Q4 2014, leading to a record calendar year in the primary space. Despite a record issuance in the primary space, this was well absorbed by investors and is mainly attributed to a growing class of Asian-based investors, attractive relative valuations and the region’s strong medium-term growth potential. Given the preceding major rally and potential market volatility, the subfund was positioned more defensively overall into Q1 2015. Over the period, its positive absolute and relative performance benefited from its relatively longer duration. The subfund’s credit quality was also conservative and exposures to high-yield bonds were focused on best risk-return profiles. Credit Suisse (Lux) Asia Local Currency Bond Fund
The six months ended March 31, 2015 were mainly characterized by several key macro themes, namely lower US interest rates in the first half of the period with lower global growth and inflation expectations, coupled with a sharp decline in oil prices. US interest rates went another leg lower in the beginning of 2015 with the announcement of its Quantitative Easing (QE) program from the European Central Bank, before sharply reversing higher against crowded positioning in the market as well as a recovery in crude oil prices. In Asia, there was an overall policy easing trend in its major markets (e.g. China, India, Korea), resulting from a strong disinflationary impulse due to lower commodity prices and with the region broadly gaining from its position of being a net importer. The general election results earlier in the year in the major markets of India and Indonesia, both of which ended with market-friendly outcomes, also continued to support the local rates markets on continued expectations of greater market reforms. Against this backdrop, Asian local rates markets broadly performed well, outperforming within Emerging Markets. Given the weaker growth backdrop in line with the global growth outlook, the subfund was positioned with a relatively longer duration risk overall in selected key Asian markets, while remaining underweight overall in Asian FX vs. the USD. Credit Suisse (Lux) Broad EUR Bond Fund
The reporting period was characterized by the sharp decline of commodity prices, especially of oil, the announcement from the Swiss National Bank (SNB) to stop defending the minimum exchange rate for EUR/CHF and the European Central Bank (ECB) who will extend its asset purchases on government bonds, agencies and supranationals. German and Swiss bond yields moved into negative territory for short- and medium-term maturities. German 5-year sovereign bond yields closed Q1 2015 at –0.10% and German 10-year yields dropped to a record low of 0.18%. During the last 6 months the subfund showed a positive performance in absolute terms but underperformed on a relative basis due to a more cautious stance towards the long end of the yield curve and the resulting duration underweight relative to the benchmark. The overweight in corporate bonds versus government bonds also did not play out during this period. Especially swap spread widened on longer maturities and hurt the relative performance of the subfund. For the time being, we are keeping our credit-centric allocation with a broad diversification across various fixed-income sectors, ratings and countries. Credit Suisse (Lux) Broad Short Term EUR Bond Fund
The reporting period was characterized by the sharp decline of commodity prices, especially of oil, the announcement from the SNB to stop defending the minimum exchange rate for EUR/CHF and the ECB who will extend its asset purchases on government bonds, agencies and supranationals. German and Swiss bond yields moved into negative territory for short- and medium-term maturities. German 5-yr sovereign bond yields closed Q1 2015 at –0.10% and German 3-year yields dropped to a record low of –0.22%. During the last 6 months the subfund showed a positive performance in absolute terms and also outperformed its benchmark, mainly due to a more aggressive stance in duration terms and a credit overweight. The overweight in corporate bonds versus government bonds still paid out during this period and for the time being we keep our credit-centric allocation and our duration overweight. A broad
diversification across a number of fixed-income sectors, ratings and countries remains key for the near-term future. Credit Suisse (Lux) Broad Short Term USD Bond Fund
The reporting period was characterized by the sharp decline of commodity prices, especially of oil, the announcement from the SNB to stop defending the minimum exchange rate for EUR/CHF and the ECB who will extend its asset purchases on government bonds, agencies and supranationals. German and Swiss bond yields moved into negative territory for short and medium term maturities. Despite the ongoing discussions about the timing of the first rate hike in the USA, government bond yields declined further. The 5yr-Treasury yields closed at 1.37% and the 2yr-yields closed at 0.55% During the last 6 months the subfund showed a positive performance in absolute terms but slightly underperformed its benchmark due to a more cautious stance in corporate and credit issuers. During the period, the subfund’s duration was slightly shorter compared to the benchmark, which contributed negatively to the relative performance. For the time being, we keep our credit-centric allocation and remain slightly underweight in terms of duration. Broad diversification across a number of fixed-income sectors, ratings and countries remains key for the near-term future. Credit Suisse (Lux) Broad USD Bond Fund
The reporting period was characterized by the sharp decline of commodity prices, especially of oil, the announcement from the SNB to stop defending the minimum exchange rate for EUR/CHF and the ECB who will extend its asset purchases on government bonds, agencies and supranationals. German and Swiss bond yields moved into negative territory for short- and medium-term maturities. Despite the ongoing discussions about the timing of the first rate hike in the USA, government bond yields declined further. 10yr-Treasury yields closed at 1.88% and the 5yr at 1.37% During the last 6 months the subfund showed a positive performance in absolute terms but slightly underperformed its benchmark due to a more cautious stance towards corporates and credits. During the period, the subfund’s duration was slightly shorter compared to the benchmark, which also contributed negatively to the overall relative performance. For the time being, we are keeping our credit-centric allocation and remain slightly underweight in terms of duration. A broad diversification across a number of fixed-income sectors, ratings and countries remains key for the near-term future. Credit Suisse (Lux) Commodity Index Plus CHF Fund
Credit Suisse (Lux) Commodity Index Plus USD Fund
Commodities ended the six-month period as of March 31, 2015 negatively. Energy was the weakest sector amid oversupply of crude oil, as well as increasing expectations of strong U.S. shale natural gas and oil production outpacing demand growth Coffee led agriculture lower due to weakness in the Brazilian Real and an improved 2015 harvest outlook. Livestock declined on increased pork supply expectations. Nickel led industrial metals lower amid continued increases in London Metal Exchange-tracked inventory levels and decreased demand prospects out of China. Precious metals increased due to the impact of the latest announcements from the U.S. Federal Reserve on the US dollar. The subfund uses commodity-linked swaps to gain exposure to the Bloomberg Commodity IndexTR, creating an exposure to each of the index’s components. As of April 30, 2015, this index was composed of five sectors with the following weightings: energy 36%, agriculture 27%, industrial metals 17%, livestock 5%, and precious metals 15%. The index is constructed based on liquidity and production indicators, and rebalanced annually such that each sector does not initially comprise more than 33% of the index. The five largest positions in the Bloomberg Commodity IndexTR as of April 30, 2015 were: Gold at 11%, WTI Crude Oil at 9%, Brent Crude Oil at 9%, Natural Gas at 8% and Copper at 8%. Credit Suisse (Lux) Global Responsible Equity Fund
The reporting period from October 1, 2014 to March 31, 2015 saw volatility in the financial markets remain at a low level. The crisis in Europe still tempered economic growth, especially Greece seems to be at a crossroad, but it looks as if the tide is slowly starting to turn for the better. The US and UK achieved moderately faster growth. Corporate earnings trended favorably. Equity markets made a very positive showing. Despite the fact that equity valuations are not cheap against history, markets continued to trend higher. The eurozone performed particularly well. A broad diversification helped to mirror the performance of the global equity markets. The investment approach remained unchanged: The global equity
CS Investment Funds 13 (formerly Credit Suisse Fund (Lux)) • Audited Annual Report as at 31.03.2015
Manager's Report Page 13
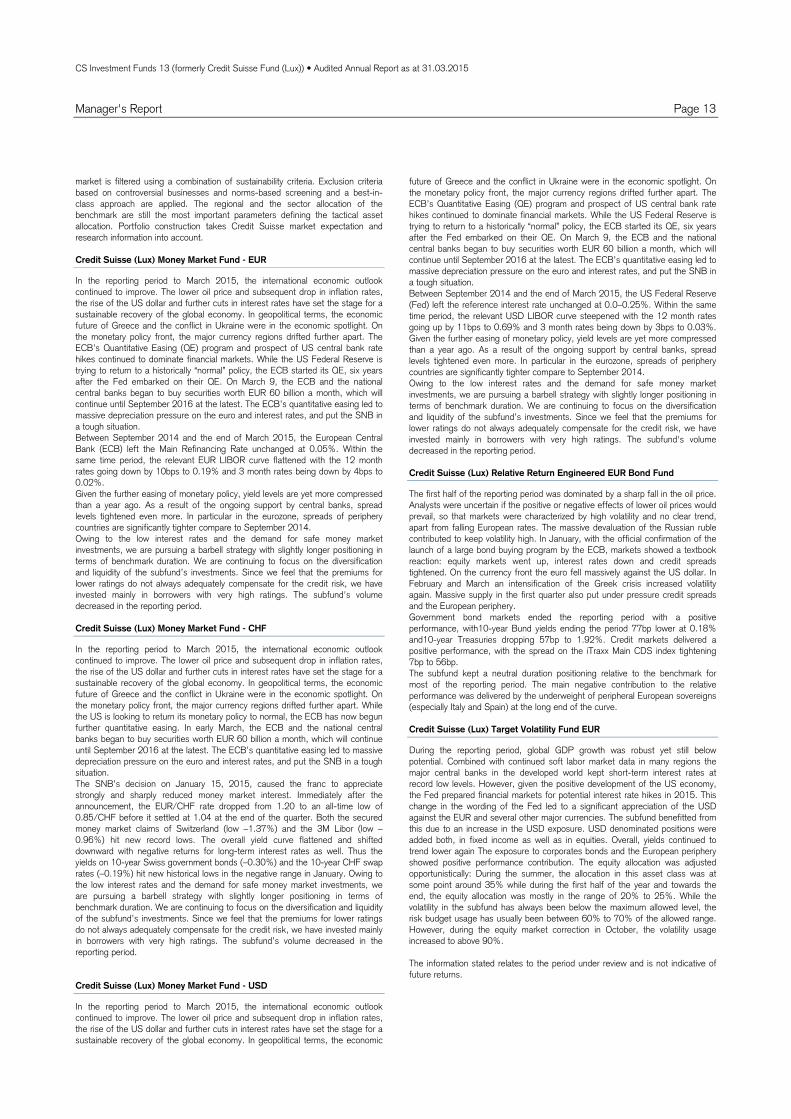
market is filtered using a combination of sustainability criteria. Exclusion criteria based on controversial businesses and norms-based screening and a best-in-class approach are applied. The regional and the sector allocation of the benchmark are still the most important parameters defining the tactical asset allocation. Portfolio construction takes Credit Suisse market expectation and research information into account. Credit Suisse (Lux) Money Market Fund - EUR
In the reporting period to March 2015, the international economic outlook continued to improve. The lower oil price and subsequent drop in inflation rates, the rise of the US dollar and further cuts in interest rates have set the stage for a sustainable recovery of the global economy. In geopolitical terms, the economic future of Greece and the conflict in Ukraine were in the economic spotlight. On the monetary policy front, the major currency regions drifted further apart. The ECB’s Quantitative Easing (QE) program and prospect of US central bank rate hikes continued to dominate financial markets. While the US Federal Reserve is trying to return to a historically “normal” policy, the ECB started its QE, six years after the Fed embarked on their QE. On March 9, the ECB and the national central banks began to buy securities worth EUR 60 billion a month, which will continue until September 2016 at the latest. The ECB’s quantitative easing led to massive depreciation pressure on the euro and interest rates, and put the SNB in a tough situation. Between September 2014 and the end of March 2015, the European Central Bank (ECB) left the Main Refinancing Rate unchanged at 0.05%. Within the same time period, the relevant EUR LIBOR curve flattened with the 12 month rates going down by 10bps to 0.19% and 3 month rates being down by 4bps to 0.02%. Given the further easing of monetary policy, yield levels are yet more compressed than a year ago. As a result of the ongoing support by central banks, spread levels tightened even more. In particular in the eurozone, spreads of periphery countries are significantly tighter compare to September 2014. Owing to the low interest rates and the demand for safe money market investments, we are pursuing a barbell strategy with slightly longer positioning in terms of benchmark duration. We are continuing to focus on the diversification and liquidity of the subfund’s investments. Since we feel that the premiums for lower ratings do not always adequately compensate for the credit risk, we have invested mainly in borrowers with very high ratings. The subfund's volume decreased in the reporting period. Credit Suisse (Lux) Money Market Fund - CHF
In the reporting period to March 2015, the international economic outlook continued to improve. The lower oil price and subsequent drop in inflation rates, the rise of the US dollar and further cuts in interest rates have set the stage for a sustainable recovery of the global economy. In geopolitical terms, the economic future of Greece and the conflict in Ukraine were in the economic spotlight. On the monetary policy front, the major currency regions drifted further apart. While the US is looking to return its monetary policy to normal, the ECB has now begun further quantitative easing. In early March, the ECB and the national central banks began to buy securities worth EUR 60 billion a month, which will continue until September 2016 at the latest. The ECB’s quantitative easing led to massive depreciation pressure on the euro and interest rates, and put the SNB in a tough situation. The SNB’s decision on January 15, 2015, caused the franc to appreciate strongly and sharply reduced money market interest. Immediately after the announcement, the EUR/CHF rate dropped from 1.20 to an all-time low of 0.85/CHF before it settled at 1.04 at the end of the quarter. Both the secured money market claims of Switzerland (low –1.37%) and the 3M Libor (low –0.96%) hit new record lows. The overall yield curve flattened and shifted downward with negative returns for long-term interest rates as well. Thus the yields on 10-year Swiss government bonds (–0.30%) and the 10-year CHF swap rates (–0.19%) hit new historical lows in the negative range in January. Owing to the low interest rates and the demand for safe money market investments, we are pursuing a barbell strategy with slightly longer positioning in terms of benchmark duration. We are continuing to focus on the diversification and liquidity of the subfund’s investments. Since we feel that the premiums for lower ratings do not always adequately compensate for the credit risk, we have invested mainly in borrowers with very high ratings. The subfund’s volume decreased in the reporting period. Credit Suisse (Lux) Money Market Fund - USD
In the reporting period to March 2015, the international economic outlook continued to improve. The lower oil price and subsequent drop in inflation rates, the rise of the US dollar and further cuts in interest rates have set the stage for a sustainable recovery of the global economy. In geopolitical terms, the economic
future of Greece and the conflict in Ukraine were in the economic spotlight. On the monetary policy front, the major currency regions drifted further apart. The ECB’s Quantitative Easing (QE) program and prospect of US central bank rate hikes continued to dominate financial markets. While the US Federal Reserve is trying to return to a historically “normal” policy, the ECB started its QE, six years after the Fed embarked on their QE. On March 9, the ECB and the national central banks began to buy securities worth EUR 60 billion a month, which will continue until September 2016 at the latest. The ECB’s quantitative easing led to massive depreciation pressure on the euro and interest rates, and put the SNB in a tough situation. Between September 2014 and the end of March 2015, the US Federal Reserve (Fed) left the reference interest rate unchanged at 0.0–0.25%. Within the same time period, the relevant USD LIBOR curve steepened with the 12 month rates going up by 11bps to 0.69% and 3 month rates being down by 3bps to 0.03%. Given the further easing of monetary policy, yield levels are yet more compressed than a year ago. As a result of the ongoing support by central banks, spread levels tightened even more. In particular in the eurozone, spreads of periphery countries are significantly tighter compare to September 2014. Owing to the low interest rates and the demand for safe money market investments, we are pursuing a barbell strategy with slightly longer positioning in terms of benchmark duration. We are continuing to focus on the diversification and liquidity of the subfund’s investments. Since we feel that the premiums for lower ratings do not always adequately compensate for the credit risk, we have invested mainly in borrowers with very high ratings. The subfund's volume decreased in the reporting period. Credit Suisse (Lux) Relative Return Engineered EUR Bond Fund
The first half of the reporting period was dominated by a sharp fall in the oil price. Analysts were uncertain if the positive or negative effects of lower oil prices would prevail, so that markets were characterized by high volatility and no clear trend, apart from falling European rates. The massive devaluation of the Russian ruble contributed to keep volatility high. In January, with the official confirmation of the launch of a large bond buying program by the ECB, markets showed a textbook reaction: equity markets went up, interest rates down and credit spreads tightened. On the currency front the euro fell massively against the US dollar. In February and March an intensification of the Greek crisis increased volatility again. Massive supply in the first quarter also put under pressure credit spreads and the European periphery. Government bond markets ended the reporting period with a positive performance, with10-year Bund yields ending the period 77bp lower at 0.18% and10-year Treasuries dropping 57bp to 1.92%. Credit markets delivered a positive performance, with the spread on the iTraxx Main CDS index tightening 7bp to 56bp. The subfund kept a neutral duration positioning relative to the benchmark for most of the reporting period. The main negative contribution to the relative performance was delivered by the underweight of peripheral European sovereigns (especially Italy and Spain) at the long end of the curve. Credit Suisse (Lux) Target Volatility Fund EUR
During the reporting period, global GDP growth was robust yet still below potential. Combined with continued soft labor market data in many regions the major central banks in the developed world kept short-term interest rates at record low levels. However, given the positive development of the US economy, the Fed prepared financial markets for potential interest rate hikes in 2015. This change in the wording of the Fed led to a significant appreciation of the USD against the EUR and several other major currencies. The subfund benefitted from this due to an increase in the USD exposure. USD denominated positions were added both, in fixed income as well as in equities. Overall, yields continued to trend lower again The exposure to corporates bonds and the European periphery showed positive performance contribution. The equity allocation was adjusted opportunistically: During the summer, the allocation in this asset class was at some point around 35% while during the first half of the year and towards the end, the equity allocation was mostly in the range of 20% to 25%. While the volatility in the subfund has always been below the maximum allowed level, the risk budget usage has usually been between 60% to 70% of the allowed range. However, during the equity market correction in October, the volatility usage increased to above 90%. The information stated relates to the period under review and is not indicative of future returns.
CS Investment Funds 13 (formerly Credit Suisse Fund (Lux)) • Audited Annual Report as at 31.03.2015
Page 14Credit Suisse (Lux) Asia Corporate Bond Fund
Technical Data and Notes
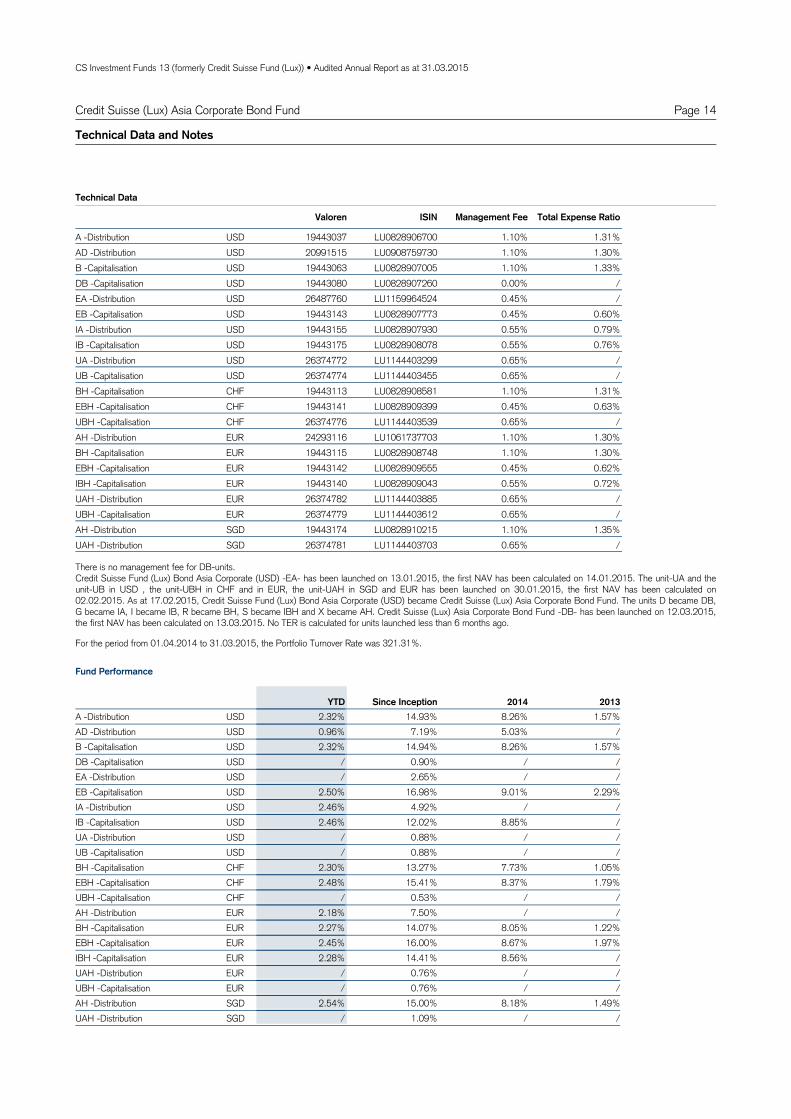
USDA 19443037 LU0828906700 1.10% 1.31%Distribution -
Valoren ISIN Management Fee Total Expense Ratio
USDAD 20991515 LU0908759730 1.10% 1.30%Distribution - USDB 19443063 LU0828907005 1.10% 1.33%Capitalisation - USDDB 19443080 LU0828907260 0.00% /Capitalisation - USDEA 26487760 LU1159964524 0.45% /Distribution - USDEB 19443143 LU0828907773 0.45% 0.60%Capitalisation - USDIA 19443155 LU0828907930 0.55% 0.79%Distribution - USDIB 19443175 LU0828908078 0.55% 0.76%Capitalisation - USDUA 26374772 LU1144403299 0.65% /Distribution - USDUB 26374774 LU1144403455 0.65% /Capitalisation - CHFBH 19443113 LU0828908581 1.10% 1.31%Capitalisation - CHFEBH 19443141 LU0828909399 0.45% 0.63%Capitalisation - CHFUBH 26374776 LU1144403539 0.65% /Capitalisation - EURAH 24293116 LU1061737703 1.10% 1.30%Distribution - EURBH 19443115 LU0828908748 1.10% 1.30%Capitalisation - EUREBH 19443142 LU0828909555 0.45% 0.62%Capitalisation - EURIBH 19443140 LU0828909043 0.55% 0.72%Capitalisation - EURUAH 26374782 LU1144403885 0.65% /Distribution - EURUBH 26374779 LU1144403612 0.65% /Capitalisation - SGDAH 19443174 LU0828910215 1.10% 1.35%Distribution - SGDUAH 26374781 LU1144403703 0.65% /Distribution -
Technical Data
USDA 1.57%8.26%14.93%2.32%Distribution - 2013YTD 2014Since Inception
USDAD /5.03%7.19%0.96%Distribution - USDB 1.57%8.26%14.94%2.32%Capitalisation - USDDB //0.90%/Capitalisation - USDEA //2.65%/Distribution - USDEB 2.29%9.01%16.98%2.50%Capitalisation - USDIA //4.92%2.46%Distribution - USDIB /8.85%12.02%2.46%Capitalisation - USDUA //0.88%/Distribution - USDUB //0.88%/Capitalisation - CHFBH 1.05%7.73%13.27%2.30%Capitalisation - CHFEBH 1.79%8.37%15.41%2.48%Capitalisation - CHFUBH //0.53%/Capitalisation - EURAH //7.50%2.18%Distribution - EURBH 1.22%8.05%14.07%2.27%Capitalisation - EUREBH 1.97%8.67%16.00%2.45%Capitalisation - EURIBH /8.56%14.41%2.28%Capitalisation - EURUAH //0.76%/Distribution - EURUBH //0.76%/Capitalisation - SGDAH 1.49%8.18%15.00%2.54%Distribution - SGDUAH //1.09%/Distribution -
Fund Performance
For the period from 01.04.2014 to 31.03.2015, the Portfolio Turnover Rate was 321.31%.
There is no management fee for DB-units.Credit Suisse Fund (Lux) Bond Asia Corporate (USD) -EA- has been launched on 13.01.2015, the first NAV has been calculated on 14.01.2015. The unit-UA and theunit-UB in USD , the unit-UBH in CHF and in EUR, the unit-UAH in SGD and EUR has been launched on 30.01.2015, the first NAV has been calculated on02.02.2015. As at 17.02.2015, Credit Suisse Fund (Lux) Bond Asia Corporate (USD) became Credit Suisse (Lux) Asia Corporate Bond Fund. The units D became DB,G became IA, I became IB, R became BH, S became IBH and X became AH. Credit Suisse (Lux) Asia Corporate Bond Fund -DB- has been launched on 12.03.2015,the first NAV has been calculated on 13.03.2015. No TER is calculated for units launched less than 6 months ago.
CS Investment Funds 13 (formerly Credit Suisse Fund (Lux)) • Audited Annual Report as at 31.03.2015
Page 15Credit Suisse (Lux) Asia Corporate Bond Fund
Technical Data and Notes
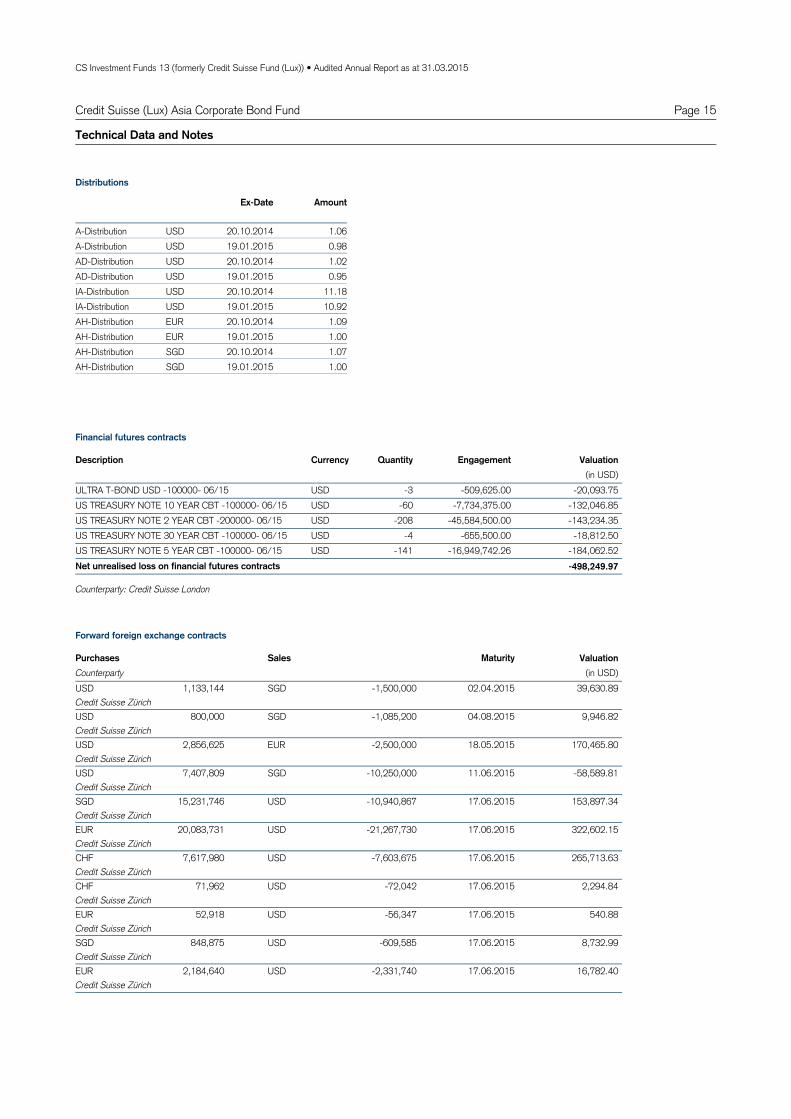
A Distribution- USD 20.10.2014 1.06A Distribution- USD 19.01.2015 0.98
Ex-Date Amount
AD Distribution- USD 20.10.2014 1.02AD Distribution- USD 19.01.2015 0.95IA Distribution- USD 20.10.2014 11.18IA Distribution- USD 19.01.2015 10.92AH Distribution- EUR 20.10.2014 1.09AH Distribution- EUR 19.01.2015 1.00AH Distribution- SGD 20.10.2014 1.07AH Distribution- SGD 19.01.2015 1.00
Distributions
USDULTRA T-BOND USD -100000- 06/15 -3 -509,625.00 -20,093.75USDUS TREASURY NOTE 10 YEAR CBT -100000- 06/15 -60 -7,734,375.00 -132,046.85USDUS TREASURY NOTE 2 YEAR CBT -200000- 06/15 -208 -45,584,500.00 -143,234.35USDUS TREASURY NOTE 30 YEAR CBT -100000- 06/15 -4 -655,500.00 -18,812.50USDUS TREASURY NOTE 5 YEAR CBT -100000- 06/15 -141 -16,949,742.26 -184,062.52
-498,249.97Net unrealised loss on financial futures contracts
Quantity EngagementDescription Currency Valuation(in USD)
Counterparty: Credit Suisse London
Financial futures contracts
1,133,144USD SGD -1,500,000 39,630.8902.04.2015Credit Suisse Zürich
800,000USD SGD -1,085,200 9,946.8204.08.2015Credit Suisse Zürich
2,856,625USD EUR -2,500,000 170,465.8018.05.2015Credit Suisse Zürich
7,407,809USD SGD -10,250,000 -58,589.8111.06.2015Credit Suisse Zürich
15,231,746SGD USD -10,940,867 153,897.3417.06.2015Credit Suisse Zürich
20,083,731EUR USD -21,267,730 322,602.1517.06.2015Credit Suisse Zürich
7,617,980CHF USD -7,603,675 265,713.6317.06.2015Credit Suisse Zürich
71,962CHF USD -72,042 2,294.8417.06.2015Credit Suisse Zürich
52,918EUR USD -56,347 540.8817.06.2015Credit Suisse Zürich
848,875SGD USD -609,585 8,732.9917.06.2015Credit Suisse Zürich
2,184,640EUR USD -2,331,740 16,782.4017.06.2015Credit Suisse Zürich
SalesPurchases Valuation(in USD)
MaturityCounterparty
Forward foreign exchange contracts

CS Investment Funds 13 (formerly Credit Suisse Fund (Lux)) • Audited Annual Report as at 31.03.2015
Page 16Credit Suisse (Lux) Asia Corporate Bond Fund
Technical Data and Notes
80,116CHF USD -83,158 -397.5917.06.2015Credit Suisse Zürich
495,000SGD USD -360,882 -325.4317.06.2015Credit Suisse Zürich
148,400EUR USD -162,335 -2,802.9817.06.2015Credit Suisse Zürich
1,000,000CHF USD -1,049,534 -16,531.7817.06.2015Credit Suisse Zürich
200,000SGD USD -145,964 -284.6217.06.2015Credit Suisse Zürich
555,714CHF USD -579,794 -5,740.3317.06.2015Credit Suisse Zürich
176,901EUR USD -194,453 -4,281.7017.06.2015Credit Suisse Zürich
250,000SGD USD -182,440 -340.3217.06.2015Credit Suisse Zürich
700,000SGD USD -509,337 541.2917.06.2015Credit Suisse Zürich
1,100,000SGD USD -798,363 2,904.8311.06.2015Credit Suisse Zürich
904,759.30Net unrealised gain on forward foreign exchange contracts
SalesPurchases Valuation(in USD)
MaturityCounterparty
Forward foreign exchange contracts

CS Investment Funds 13 (formerly Credit Suisse Fund (Lux)) • Audited Annual Report as at 31.03.2015
Page 17
Assets
Investments in securities at market value 462,229,465.67Cash at banks and at brokers 1,996,774.40Subscriptions receivable 4,913,412.31Income receivable 5,265,572.33Prepaid expenses 12,167.14Net unrealised gain on forward foreign exchange contracts 904,759.30
475,322,151.15
Liabilities
Due to banks and to brokers 4,208,007.47Redemptions payable 337,826.00Provisions for accrued expenses 331,990.40Net unrealised loss on financial futures contracts 498,249.97Other liabilities 913.14
5,376,986.98
469,945,164.17Net assets
Statement of Net Assets in USD and Fund Evolution
31.03.2015
Credit Suisse (Lux) Asia Corporate Bond Fund
The notes are an integral part of the financial statements.
CS Investment Funds 13 (formerly Credit Suisse Fund (Lux)) • Audited Annual Report as at 31.03.2015
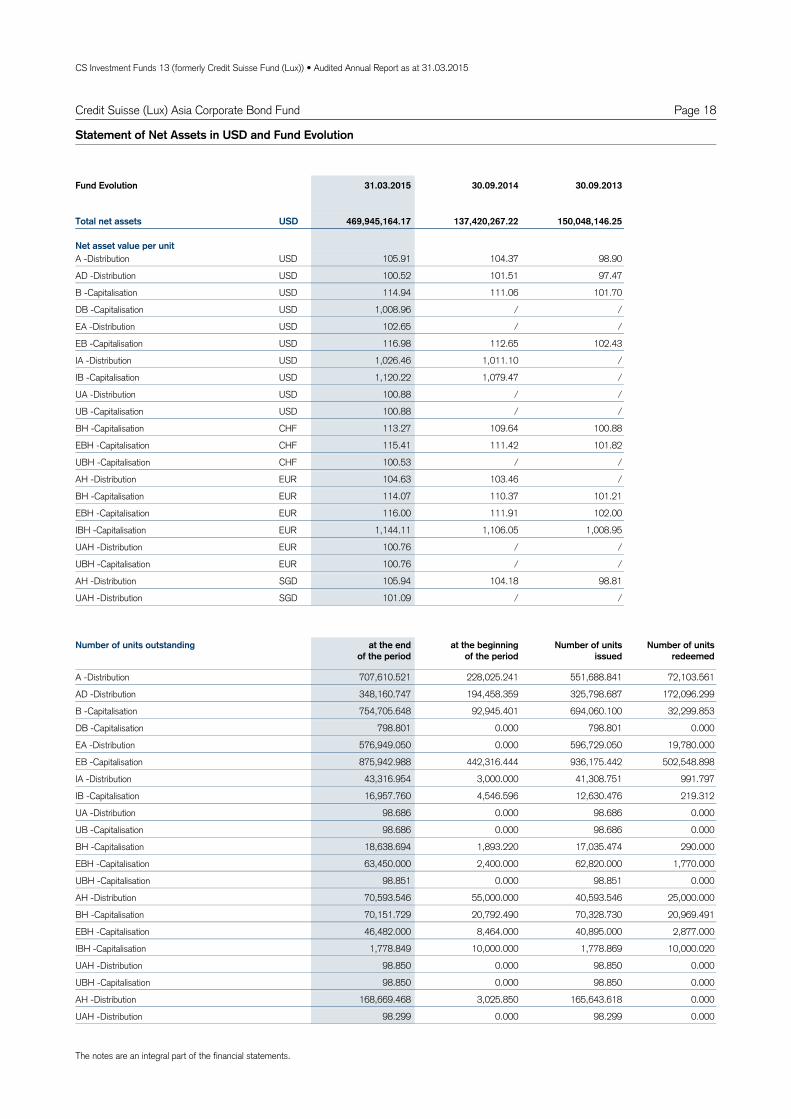
Page 18
Statement of Net Assets in USD and Fund Evolution
105.91 98.90USDA 104.37Distribution -
100.52 97.47USDAD 101.51Distribution -
114.94 101.70USDB 111.06Capitalisation -
1,008.96 /USDDB /Capitalisation -
102.65 /USDEA /Distribution -
116.98 102.43USDEB 112.65Capitalisation -
1,026.46 /USDIA 1,011.10Distribution -
1,120.22 /USDIB 1,079.47Capitalisation -
100.88 /USDUA /Distribution -
100.88 /USDUB /Capitalisation -
113.27 100.88CHFBH 109.64Capitalisation -
115.41 101.82CHFEBH 111.42Capitalisation -
100.53 /CHFUBH /Capitalisation -
104.63 /EURAH 103.46Distribution -
114.07 101.21EURBH 110.37Capitalisation -
116.00 102.00EUREBH 111.91Capitalisation -
1,144.11 1,008.95EURIBH 1,106.05Capitalisation -
100.76 /EURUAH /Distribution -
100.76 /EURUBH /Capitalisation -
105.94 98.81SGDAH 104.18Distribution -
101.09 /SGDUAH /Distribution -
Total net assets
Net asset value per unit
469,945,164.17 137,420,267.22 150,048,146.25USD
Fund Evolution 31.03.2015 30.09.2014 30.09.2013
707,610.521 551,688.841A 228,025.241 72,103.561Distribution -
348,160.747 325,798.687AD 194,458.359 172,096.299Distribution -
754,705.648 694,060.100B 92,945.401 32,299.853Capitalisation -
798.801 798.801DB 0.000 0.000Capitalisation -
576,949.050 596,729.050EA 0.000 19,780.000Distribution -
875,942.988 936,175.442EB 442,316.444 502,548.898Capitalisation -
43,316.954 41,308.751IA 3,000.000 991.797Distribution -
16,957.760 12,630.476IB 4,546.596 219.312Capitalisation -
98.686 98.686UA 0.000 0.000Distribution -
98.686 98.686UB 0.000 0.000Capitalisation -
18,638.694 17,035.474BH 1,893.220 290.000Capitalisation -
63,450.000 62,820.000EBH 2,400.000 1,770.000Capitalisation -
98.851 98.851UBH 0.000 0.000Capitalisation -
70,593.546 40,593.546AH 55,000.000 25,000.000Distribution -
70,151.729 70,328.730BH 20,792.490 20,969.491Capitalisation -
46,482.000 40,895.000EBH 8,464.000 2,877.000Capitalisation -
1,778.849 1,778.869IBH 10,000.000 10,000.020Capitalisation -
98.850 98.850UAH 0.000 0.000Distribution -
98.850 98.850UBH 0.000 0.000Capitalisation -
168,669.468 165,643.618AH 3,025.850 0.000Distribution -
98.299 98.299UAH 0.000 0.000Distribution -
Number of units outstanding at the endof the period
at the beginningof the period
Number of units issued
Number of units redeemed
Credit Suisse (Lux) Asia Corporate Bond Fund
The notes are an integral part of the financial statements.
CS Investment Funds 13 (formerly Credit Suisse Fund (Lux)) • Audited Annual Report as at 31.03.2015
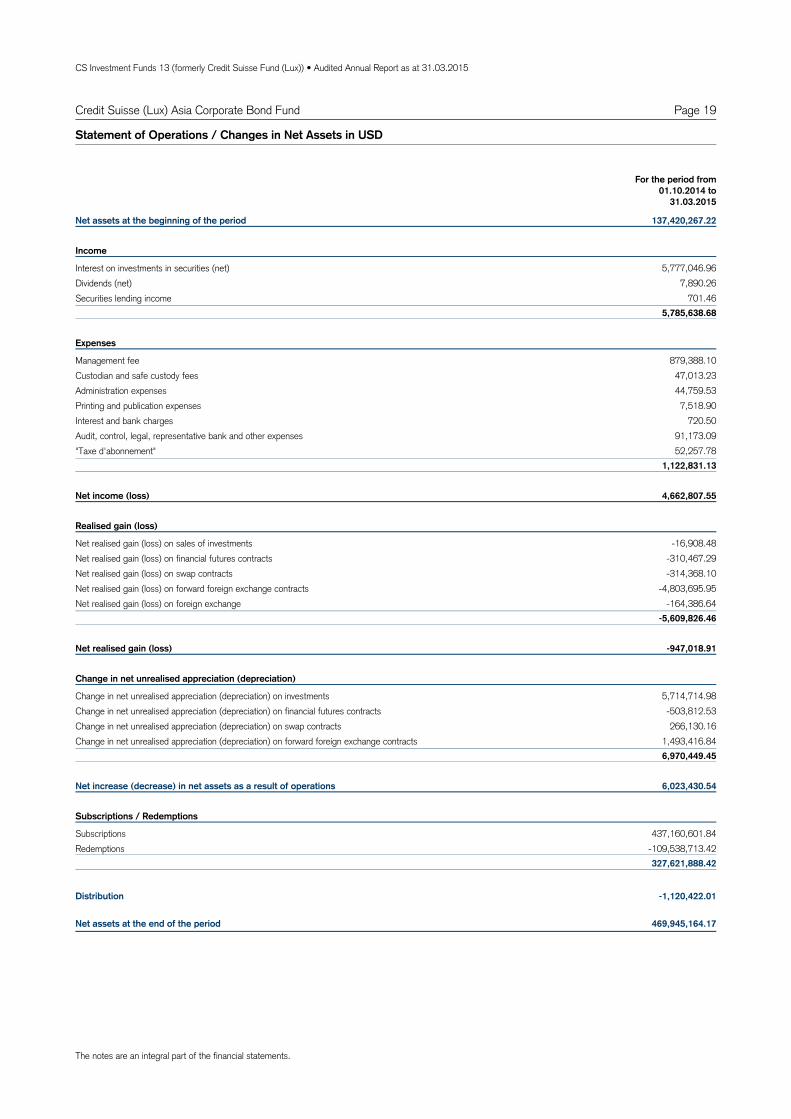
Page 19Credit Suisse (Lux) Asia Corporate Bond Fund
Net assets at the beginning of the period 137,420,267.22
Income
Interest on investments in securities (net) 5,777,046.96Dividends (net) 7,890.26Securities lending income 701.46
5,785,638.68
Expenses
Management fee 879,388.10Custodian and safe custody fees 47,013.23Administration expenses 44,759.53Printing and publication expenses 7,518.90Interest and bank charges 720.50Audit, control, legal, representative bank and other expenses 91,173.09"Taxe d'abonnement" 52,257.78
1,122,831.13
Net income (loss) 4,662,807.55
Realised gain (loss)
Net realised gain (loss) on sales of investments -16,908.48Net realised gain (loss) on financial futures contracts -310,467.29Net realised gain (loss) on swap contracts -314,368.10Net realised gain (loss) on forward foreign exchange contracts -4,803,695.95Net realised gain (loss) on foreign exchange -164,386.64
-5,609,826.46
Net realised gain (loss) -947,018.91
Change in net unrealised appreciation (depreciation)
Change in net unrealised appreciation (depreciation) on investments 5,714,714.98Change in net unrealised appreciation (depreciation) on financial futures contracts -503,812.53Change in net unrealised appreciation (depreciation) on swap contracts 266,130.16Change in net unrealised appreciation (depreciation) on forward foreign exchange contracts 1,493,416.84
6,970,449.45
Net increase (decrease) in net assets as a result of operations 6,023,430.54
Subscriptions / Redemptions
Subscriptions 437,160,601.84Redemptions -109,538,713.42
327,621,888.42
Distribution -1,120,422.01
Net assets at the end of the period 469,945,164.17
Statement of Operations / Changes in Net Assets in USD
For the period from01.10.2014 to
31.03.2015
The notes are an integral part of the financial statements.

The notes are an integral part of the financial statements.Any differences in the percentage of Net Assets are the result of roundings.
CS Investment Funds 13 (formerly Credit Suisse Fund (Lux)) • Audited Annual Report as at 31.03.2015
Page 20Credit Suisse (Lux) Asia Corporate Bond Fund
Breakdown by Country and Economic Sector of the Investments in SecuritiesStatement of Investments in Securities and Other Net Assets
23.71Cayman IslandsBreakdown by Country
22.18Virgin Islands (UK)11.90Hong Kong6.84Japan4.72Singapore4.42South Korea4.24India3.63USA2.74People's Republic of China2.25Australia2.01Indonesia1.53Turkey1.46Netherlands0.87Philippines0.84United Arab Emirates0.81Thailand0.78Germany0.66Bermuda0.64Guernsey0.62Luxembourg0.30Chile0.23Spain0.21Egypt0.19Malaysia0.19Ireland0.15United Kingdom0.14Bahrain0.06Macau0.04Peru
98.36Total
30.61Financial, investment and other div. companiesBreakdown by Economic Sector
21.05Banks and other credit institutions13.15Real estate4.88Building materials and building industry3.99Insurance companies3.77Non-classifiable/non-classified institutions3.11Traffic and transportation2.59Mortgage and funding institutions (MBA, ABS)2.33Mining, coal and steel industry2.01Telecommunication1.77Petroleum1.69Internet, software and IT services1.50Electronics and semiconductors1.12Chemicals1.10Countries and central governments1.00Energy and water supply0.98Investment trusts/funds0.59Electrical appliances and components0.49Miscellaneous services0.31Vehicles0.21Supranational organisations0.11Watch and clock industry, jewellery
98.36Total
Statement of Investments in Securities and Other Net Assets
DescriptionQuantity /
NominalValuation % of net
assets(in USD)
Securities listed on a stock exchange or other organised markets: Bonds
Bonds
USD ABU DHABI NATIONAL ENERGY COMPANY3.875%/14-06.05.2024
2,500,000 2,564,200.00 0.55
USD AFRICAN EXPORT-IMPORT BANK 4.75%/14-29.07.2019
1,000,000 1,003,700.00 0.21
USD AGILE PROPERTY HOLDINGS (reg. -S-)8.875%/10-28.04.2017
4,600,000 4,547,698.00 0.97
USD AIA GROUP (reg. -S-) T. -2- 3.2%/15-11.03.2025
500,000 504,950.00 0.11
USD ALAM SYNERGY (reg. -S-) 9%/14-29.01.2019 2,500,000 2,602,650.00 0.55USD ALIBABA GROUP HOLDING (reg. -S-) 3.6%/14-
28.11.20241,000,000 1,003,370.00 0.21
USD ALIBABA GROUP HOLDING (reg. -S-) 4.5%/14-28.11.2034
1,300,000 1,328,652.00 0.28
USD AMIPEACE 3.125%/14-26.11.2019 1,200,000 1,223,520.00 0.26USD BAHRAIN (reg. -S-) 6%/14-19.09.2044 700,000 679,056.00 0.14USD BANK OF AMERICA (subordinated) S. -L-
4.25%/14-22.10.20261,600,000 1,647,120.00 0.35
CNY BANK OF CHINA (reg. -S-) FIX-TO-FLOATERS6.75%/14-PERPETUAL
30,800,000 5,308,847.94 1.13
USD BANK OF CHINA (subordinated) (reg. -S-) T. -1-5%/14-13.11.2024
4,200,000 4,424,700.00 0.94
USD BANK OF EAST ASIA (reg. -S-) FIX-TO-FRN4.25%/14-20.11.2024
2,600,000 2,634,502.00 0.56
USD BANK OF INDIA (reg. -S-) S. 5 6.25%/11-16.02.2021
600,000 689,544.00 0.15
USD BAOSTEEL FINANCING 2015 3.875%/15-28.01.2020
5,550,000 5,712,892.50 1.22
USD BCP SINGAPORE (reg .-S-) 8%/14-150421 1,000,000 980,000.00 0.21USD BEIJING CAPITAL POLARIS 2.875%/15-
01.04.20182,200,000 2,206,160.00 0.47
USD BHARAT PETROLEUM (reg. -S-) 4.625%/12-25.10.2022
1,000,000 1,056,710.00 0.22
USD BHARTI AIRTEL INTERNATIONAL (reg. -S-)5.35%/14-20.05.2024
1,500,000 1,654,770.00 0.35
USD BOC AVIATION T. -1- (reg. -S-) 3.%/15-30.03.2020
4,000,000 3,997,960.00 0.85
CNY BOHAI GENERAL 6.4%/14-16.10.2017 9,000,000 1,416,670.58 0.30USD CAGAMAS GLOBAL 2.745%/14-10.12.2019 900,000 907,110.00 0.19USD CAR (reg. -S-) 6.125%/15-04.02.2020 2,500,000 2,552,550.00 0.54USD CDBL FUNDING 1 (reg -S-) 4.25%/14-
02.12.20242,200,000 2,235,860.00 0.48
USD CENTRAL CHINA REAL ESTATE (reg. -S-)6.5%/13-04.06.2018
1,000,000 956,370.00 0.20
USD CENTRAL PLAZA DEVELOPMENT (reg -S-) FIX-TO-FRN 14-PERPETUAL
2,750,000 2,792,900.00 0.59
CNY CENTRAL PLAZA DEVELOPMENT 5.75%/14-17.02.2017
5,000,000 795,410.68 0.17
USD CENTRAL PLAZA DEVELPOMENT (reg. -S-)8.375%/13-PERPETUAL
2,200,000 2,338,622.00 0.50
USD CENTURY MASTER INVESTMENT 4.75%/13-19.09.2018
500,000 526,250.00 0.11
USD CHARMING LIGHT -S- 3.75%/14-03.09.2019 2,000,000 2,034,660.00 0.43USD CHARMING LIGHT -S- 5%/14-03.09.2024 4,750,000 4,925,750.00 1.05USD CHINA CINDA FINANCE (reg. -S-) 4%/14-
14.05.2019500,000 517,664.00 0.11
USD CHINA CINDA FINANCE (reg. -S-) 5.625%/14-14.05.2024
1,800,000 1,972,062.00 0.42
USD CHINA CITIC BANK INTERNATIONAL(subordinated) FIX-TO-FRN 14-PERPETUAL
1,500,000 1,606,365.00 0.34
USD CHINA MERCHANTS LAND 4.021%/13-11.12.2018
500,000 522,775.00 0.11
USD CHINA OVERSEAS FINANCE (CAYMAN) III5.375%/13-29.10.2023
1,000,000 1,085,680.00 0.23
USD CHINA OVERSEAS FINANCE (CAYMAN)5.95%/14-08.05.2024
1,000,000 1,133,600.00 0.24
USD CHINA OVERSEAS FINANCE 5.5%/10-10.11.2020
2,250,000 2,462,985.00 0.52
USD CHINA OVERSEAS GRAND OCEANS FINANCE5.125%/14-23.01.2018
5,250,000 5,424,405.00 1.15
USD CHINA RESOURCES LAND 6%/14-27.02.2024 1,000,000 1,133,790.00 0.24USD CHINA SHANSHUI CEM 7.5%/15-10.03.2020 4,750,000 4,726,250.00 1.01USD CHINA TAIPEI NEW HORIZON 18.10.2023 3,250,000 3,648,450.00 0.78USD CHINA TAIPING INSURANCE HOLDINGS FRN
14-PERPETUAL3,300,000 3,447,180.00 0.73
USD CHINALCO FINANCE HOLDINGS 3.625%/14-11.12.2019
220,000 225,984.00 0.05
USD CHONG HING BANK (reg -S-) (subordinated)6.5%/14 PERPETUAL
2,000,000 2,086,360.00 0.44
USD CIFI HOLDINGS (reg -S-) 8.875%14-27.01.2019 3,900,000 3,850,977.00 0.82USD CIFI HOLDINGS 12.25%/13-15.04.2018 1,300,000 1,404,221.00 0.30USD CITIC INTERNATIONALN HOLDING (subordinated)
FIX-TO-FRN 13-07.11.20241,000,000 1,067,280.00 0.23
USD CITIC PACIFIC S. 3 6.875%/12-21.01.2018 500,000 555,250.00 0.12USD CITIC PACIFIC 6.375%/13-10.04.2020 1,000,000 1,136,020.00 0.24USD CITIC (reg. -S-) S. 1 6.625%/11-15.04.2021 1,500,000 1,743,825.00 0.37USD CITIC (reg. -S-) S. 4 6.8%/12-17.01.2023 500,000 594,000.00 0.13USD CORPBANCA (reg. -S-) 3.875%/14-22.09.2019 1,400,000 1,402,870.00 0.30USD COSCO FINANCE 4%/12-03.12.2022 2,000,000 2,059,840.00 0.44USD COUNTRY GARDEN HOLDINGS (reg. -S-)
7.875%/14-27.05.20191,800,000 1,877,652.00 0.40
USD COUNTRY GARDEN HOLDINGS 7.5%/15-09.03.2020
4,250,000 4,292,500.00 0.91
USD CRCC YUPENG FIX-TO-FRN 14-PERPETUAL 1,000,000 1,023,100.00 0.22USD CREDIT SUISSE GROUP FINANCE (reg. -S-)
2.75%/15-26.03.20201,000,000 1,005,705.00 0.21
USD CREDIT SUISSE GROUP FUNDING (GUERNSEY)(reg. -S-) 3.75%/15-26.03.2025
2,000,000 2,012,600.00 0.43
EUR CSSC CAPITAL 15 (reg -S-) 1.7%/15-19.02.2018
2,500,000 2,717,220.00 0.58
USD DAH SING BANK (subordinated) FIX-TO-FRN 14-29.01.2024
2,525,000 2,628,828.00 0.56

The notes are an integral part of the financial statements.Any differences in the percentage of Net Assets are the result of roundings.
CS Investment Funds 13 (formerly Credit Suisse Fund (Lux)) • Audited Annual Report as at 31.03.2015
Page 21Credit Suisse (Lux) Asia Corporate Bond Fund
Statement of Investments in Securities and Other Net Assets (Continued)
DescriptionQuantity /
NominalValuation % of net
assets(in USD)
USD DAH SING BANK (subordinated) (reg. -S-) S.2010-001 6.625%/10-11.02.2020
1,800,000 2,043,378.00 0.43
USD DAI-ICHI LIFE INSURANCE FIX-TO-FLOATER5.1%/14-PERPETUAL
2,100,000 2,279,655.00 0.49
USD DAIMLER FINANCE NORTH AMERICA (reg. -S-)2.25%/15-02.03.2020
500,000 503,315.00 0.11
CNY DATANG TELECOM (HONGKONG) 5.5%/14-29.09.2017
7,500,000 1,190,321.50 0.25
USD DEUTSCHE BANK FIX-TO-FRN 7.5%/14-PERPETUAL
3,600,000 3,668,400.00 0.78
USD DIANJIAN HAIXING FIX-TO-FLOATERS4.05%/14-PERPETUAL
1,700,000 1,735,700.00 0.37
USD DOUBLE ROSY (reg. -S-) 3.625%/14-18.11.2019
3,600,000 3,616,452.00 0.77
USD EMIRATES NBD PJSC 3.25%/14-19.11.2019 500,000 505,950.00 0.11USD FAR EAST HORIZO FIX-TO-FLOATERS
5.55%/14-PERPETUAL1,500,000 1,537,995.00 0.33
SGD FCL TREASURY PTE (subordinated) FIX-TO-FLOATER 5%/15-PERPETUAL
8,750,000 6,419,094.67 1.37
USD FIRST GULF BANK 2.625%/15-24.02.2020 850,000 845,750.00 0.18USD FRANSHION BRILLIANT 5.75%/14-19.03.2019 5,000,000 5,310,000.00 1.13USD FRANSHION DEVELOPMENT (reg. -S-)
6.75%/11-15.04.20215,000,000 5,560,500.00 1.18
USD FRANSHION INVESTMENT (reg. -S-) 4.7%/12-26.10.2017
500,000 516,595.00 0.11
USD FUTURE LAND DEVELOPMENT (reg. -S-)10.25%/13-31.01.2018
1,600,000 1,595,136.00 0.34
USD GCX (REG. -S-) 7%/14-01.08.2019 3,100,000 3,103,534.00 0.66USD GEELY AUTOMOBILE (reg -S-) 5.25%/14-
06.10.20191,200,000 1,244,184.00 0.26
USD GEMDALE INTERNATIONAL 7.125%/12-16.11.2017
4,700,000 4,816,419.00 1.02
USD GOODMAN HK 4.375%/14-19.06.2024 2,000,000 2,099,120.00 0.45USD GREENLAND GLOBAL INVESTMENT
4.375%/14-03.07.20191,000,000 1,008,500.00 0.21
USD GREENLAND GLOBAL (reg. -S-) 5.875%/14-03.07.2024
2,000,000 2,054,240.00 0.44
USD GREENLAND HONG KONG HOLDINGS (reg. -S-)4.375%/14-07.08.2017
3,600,000 3,627,000.00 0.77
USD HAINAN AIRLINE HK (reg. -S-) 3.625%/13-07.02.2020
1,885,000 1,936,837.50 0.41
USD HAITONG INTERNATIONAL FINANCE (reg . -S-)3.99%/14-11.09.2019
4,500,000 4,587,750.00 0.98
USD HAITONG INTERNATIONAL FINANCE (reg . -S-)4.2%/15-29.07.2020
2,900,000 2,954,520.00 0.63
USD HANA BANK (reg. -S-) (subordinated)4.375%/14-30.09.2024
1,600,000 1,701,936.00 0.36
USD HAZINE MUSTESARLIGI SUKUK (reg. -S-)4.489%/14-25.11.2024
1,300,000 1,312,480.00 0.28
USD HLP FINANCE 4.45%/14-16.04.2021 5,516,000 5,793,454.80 1.23USD HONGKONG INTERNATIONAL (QINGDAO)
COMPANY 4.75%/15-12.02.20201,500,000 1,522,200.00 0.32
USD HPHT FINANCE 2.25%/15-17.03.2018 3,500,000 3,514,210.00 0.75USD HPHT FINANCE 2.875%/15-17.03.2020 2,450,000 2,477,195.00 0.53USD HUARONG FINANCE II (reg. -S-) 4.5%/15-
16.01.20206,200,000 6,477,140.00 1.38
USD HUARONG FINANCE II 5.5%/15-16.01.2025 5,950,000 6,317,710.00 1.34USD HUATAI INTERNATIONAL FINANCE 3.625%/14-
08.10.20191,200,000 1,241,124.00 0.26
USD HYUNDAI CAPITAL SERVICES (reg. -S-)2.625%/15-29.09.2020
4,500,000 4,515,030.00 0.96
USD ICBC (ASIA) FIX-TO-FRN 4.5%/13-10.10.2023 2,000,000 2,067,960.00 0.44USD ICBC ASIA (reg. -S-) (subordinated) 5.125%/10-
30.11.20202,500,000 2,733,925.00 0.58
USD ICBCIL FINANCE 2.625%/15-19.03.2018 3,100,000 3,106,820.00 0.66USD ICBCIL FINANCE 3.25%/15-17.03.2020 3,150,000 3,177,405.00 0.68USD INDONESIA (reg. -S-) 4.125%/15-15.01.2025 1,000,000 1,029,540.00 0.22USD INDONESIA (reg. -S-) 5.125%/15-15.01.2045 1,000,000 1,051,980.00 0.22USD INDUSTRIAL AND COMMERCIAL BANK OF
CHINA FRN 15-12.02.2018500,000 504,300.00 0.11
USD INDUSTRIAL AND COMMERCIAL BANK OFCHINA (MACAO) (subordinated) FIX-TO-FRN3.875%/14-10.09.2024
300,000 303,630.00 0.06
USD INDUSTRIAL AND COMMERCIAL BANK OFCHINA (MACAO) (subordinated) FIX-TO-FRN6%/14-PERPETUAL
3,000,000 3,140,460.00 0.67
USD INRETAIL SHOPPING MALLS (reg. -S-) 6.5%/14-09.07.2021
200,000 208,750.00 0.04
CNY ITNL OFFSHORE PTE 7.5%/15-01.04.2018 13,000,000 2,065,320.84 0.44USD JABABEKA INTERNATIONAL (reg. -S-) 7.5%/14-
24.09.20192,600,000 2,639,000.00 0.56
USD JOYOUS GLORY GROUP 5.7%/13-07.03.2020 500,000 530,884.00 0.11USD JSW STEEL 4.75%/14-12.11.2019 1,500,000 1,445,700.00 0.31USD KING POWER CAPITAL 5.625%/14-03.11.2024 1,400,000 1,507,240.00 0.32USD KOREA EXCHANGE BANK 4.25%/14-
14.10.20242,300,000 2,427,006.00 0.52
USD LAI SUN INTERNATIONBAL FINANCE (REG.-S-)5.7%/13-18.01.2018
500,000 513,750.00 0.11
USD LOGAN PROPERTY 9.75%/14-08.12.2017 1,700,000 1,617,652.00 0.34CNY LONGFOR PROPERTIES 6.75%/114-28.05.2018 10,000,000 1,553,577.20 0.33USD MITRA PINASTHIKA MUSTIKA 6.75%/14-
19.09.20193,800,000 3,747,940.00 0.80
USD MITSUBISHI UFJ LEASE& FINANCE 2.5%/15-09.03.2020
5,150,000 5,143,768.50 1.09
USD MIZUHO BANK (reg -S-) 2.4%/15-26.03.2020 12,200,000 12,259,292.00 2.62USD MIZUHO BANK (reg -S-) 3.2%/15-26.03.2025 2,900,000 2,901,682.00 0.62USD NEW WORLD CHINA LAND 5.375%/14-
06.11.20196,250,000 6,534,250.00 1.39
USD NEW WORLD DEVELOPPMENT 5.25%/14-26.02.2021
5,300,000 5,650,171.00 1.20
USD NIPPON LIFE INSURANCE (subordinated) (reg -S-) FIX-TO-FLOATER 5.1%/14-16.10.2044
2,400,000 2,606,256.00 0.55
USD NTPC 4.375%/14-26.11.2024 2,000,000 2,094,600.00 0.45USD NTPC 5.625%/11-14.07.2021 600,000 678,096.00 0.14
DescriptionQuantity /
NominalValuation % of net
assets(in USD)
USD ONGC VIDESH (reg. -S-) 4.625%/14-15.07.2024 3,300,000 3,476,583.00 0.74USD PCCW CAPITAL NO 2 (reg. -S-) 3.625%/15-
02.04.20253,950,000 3,934,200.00 0.84
USD PCCW HKT (reg. -S-) 3.75%/13-08.03.2023 5,000,000 5,097,000.00 1.08USD PERUSAHAAN PENERBIT SBSN III T. 3 SUKUK
4.35%/14-10.09.2024600,000 617,670.00 0.13
USD POLY PROPERTY GROUP (reg. -S-) 4.75%/13-16.05.2018
500,000 503,650.00 0.11
USD POLY REAL ESTATE FINANCE 4.5%/13-06.08.2018
1,000,000 1,032,030.00 0.22
USD POLY REAL ESTATE FINANCE 5.25%/14-25.04.2019
5,253,000 5,546,117.40 1.18
USD PT ASTRA SEDAYA FINANCE 2.875%/15-01.04.2018
3,000,000 3,000,600.00 0.64
USD PTT EXPLORATION AND PRODUCTION PUBLIC(subordinated) (reg. -S-) FIX-TO-FRN 4.875%/14-PERPETUAL
3,800,000 3,826,296.00 0.81
USD QBE INSURANCE GROUP FIX-TO-FRN6.75%/14-01.12.2044
4,500,000 4,854,150.00 1.03
USD RAK CAPITAL SUKUK 3.094%/15-31.03.2025 5,900,000 5,854,570.00 1.25USD RELIANCE INDUSTRIES (reg. -S-) 4.125%/15-
28.01.20252,250,000 2,259,675.00 0.48
USD RELIANCE INDUSTRIES (reg. -S-) 4.875%/15-10.02.2045
3,200,000 3,014,400.00 0.64
USD REPUBLIC OFKOREA 4.125%/14-10.06.2044 2,000,000 2,437,320.00 0.52USD RH INTERNATIONAL FINANCE (reg. -S-) S.001
4.25%/12-19.10.2017500,000 504,720.00 0.11
USD RIZAL COMMERCIAL BANKING 4.25%/15-22.01.2020
800,000 834,120.00 0.18
USD ROAD KING INFRASTRUCTURE FINANCE (2012)(reg. -S-) 9.875%/12-18.09.2017
1,000,000 1,065,560.00 0.23
USD ROYAL CAPITAL FIX-TO-FRN 6.25%/15-PERPETUAL
2,500,000 2,600,000.00 0.55
USD SAUDI ELECTRICITY GLOBAL SUKUK (reg. -S-)4%/14-08.04.2024
1,000,000 1,065,400.00 0.23
USD SDSC INTERNATIONAL FINANCE 3.625%/14-12.11.2019
1,700,000 1,751,510.00 0.37
USD SECURITY BANK (reg. -S-) 3.95%/15-03.02.2020
1,100,000 1,124,750.00 0.24
USD SHENHUA OVERSEAS CAPITAL (reg .-S-)3.125%/15-20.01.2020
1,600,000 1,628,160.00 0.35
USD SHIMAO PROPERTY HOLDINGS (reg. -S-)8.375%/15-10.02.2022
7,800,000 7,984,782.00 1.70
USD SHUI ON DEVELOPMENT 8.7%/14-24.11.2017 4,500,000 4,516,020.00 0.96USD SIB SUKUK COMPANY III (reg -S-) 2.843%/15-
17.03.20205,250,000 5,249,475.00 1.12
USD SINO-OCEAN LAND TREASURE FINANCE II (reg.-S-) 4.45%/15-04.02.2020
4,300,000 4,349,450.00 0.93
USD SINO-OCEAN LAND TREASURE FINANCE II (reg.-S-) 5.95%/15-04.02.2027
2,300,000 2,325,990.00 0.49
USD SMC GLOBAL POWER (subordinated) FIX-TO-FRN 7.5%/14-PERPET
2,000,000 2,103,700.00 0.45
USD SOHO CHINA (reg. -S-) 5.75%/12-07.11.2017 500,000 520,305.00 0.11USD SOMPO JAPAN (subordinated) (reg. -S-) FIX-TO-
FRN 13-28.03.20732,500,000 2,714,800.00 0.58
USD STANDARD CHARTERED (subordinated)5.875%/10-24.06.2020
200,000 230,378.00 0.05
USD SUMITOMO LIFE INSURANCE (subordinated)(reg. -S-) FIX-TO-FRN 13-20.09.2073
2,000,000 2,340,800.00 0.50
USD SUMITOMO MITSUI BANKING 2.45%/15-16.01.2020
1,800,000 1,818,360.00 0.39
USD SUNAC CHINA 9.375%/13-05.04.2018 300,000 298,221.00 0.06USD TATA MOTORS 4.625%/14-30.04.2020 1,400,000 1,437,240.00 0.31USD TBG GLOBAL 5.25%/15-10.02.2022 2,850,000 2,849,031.00 0.61USD TENCENT HOLDINGS (reg. -S-) T. -3-
2.875%/15-11.02.20205,100,000 5,149,470.00 1.10
USD TENCENT HOLDINGS (reg. -S-) T. -4- 3.8%/15-11.02.2025
2,700,000 2,755,350.00 0.59
USD THE EXPORT IMPORT BANK OF INDIA (reg. S-)2.75%/15-01.04.2020
4,500,000 4,473,900.00 0.95
USD THE EXPORT-IMPORT BANK OF KOREA2.25%/15-21.01.2020
5,300,000 5,349,184.00 1.14
USD THE EXPORT-IMPORT BANK OF KOREA2.875%/15-21.01.2025
4,300,000 4,318,722.20 0.92
CNY TIMES PROPERTY 10.375%/14-16.07.2017 4,000,000 598,113.35 0.13USD TIMES PROPERTY 11.45%/15-05.03.2020 6,650,000 6,317,500.00 1.34USD TML HOLDINGS PTE 5.75%/14-07.05.2021 3,300,000 3,499,683.00 0.74USD TRILLION CHANCE 8.5%/14-10.01.2019 3,550,000 3,294,932.50 0.70USD TURKIYE VAKIFLAR BANK (subordinated) FIX-TO-
FLOATERS (reg. -S-) 6.875%/15-03.02.20256,000,000 5,878,020.00 1.25
USD UOB CAYMAN (reg. -S-) (subordinated) FIX-TO-FRN 5.796%/05-PERPETUAL
500,000 514,685.00 0.11
USD VEB FINANCE (reg. -S-) 4.224%/13-21.11.2018 1,000,000 885,300.00 0.19USD VERIZON COMMUNICATIONS 5.012%/15-
21.08.2054560,000 575,568.00 0.12
USD VERIZON COMMUNICATIONS 6.55%/13-15.09.2043
559,000 725,067.72 0.15
USD WING HANG BANK (subordinated) FIX-TO-FRN6%/07-PERPETUAL
2,000,000 2,116,000.00 0.45
USD XEROX 2.75%/15-01.09.2020 3,600,000 3,602,160.00 0.77USD XEROX 4.8%/15-01.03.2035 3,470,000 3,408,719.80 0.73USD YANCOAL INTERNATIONAL RESOURCES (reg. -
S-) 4.461%/12-16.05.2017865,000 863,399.75 0.18
USD YANCOAL INTERNATIONAL RESOURCES (reg. -S-) 5.73%/12-16.05.2022
700,000 653,226.00 0.14
USD YANCOAL INTERNATIONAL TRADING FIX-TO-FRN 7.2%/14-PERPET
2,800,000 2,871,764.00 0.61
SGD YANLORD LAND GROUP 6.2%/14-08.05.2017 1,000,000 730,191.69 0.16USD YUEXIU REIT ASSET MANAGER (reg. -S-)
3.1%/13-14.05.20182,200,000 2,189,990.00 0.47
USD YUZHOU PROPERTIES (reg. -S-) 11.75%/12-25.10.2017
1,300,000 1,358,071.00 0.29

The notes are an integral part of the financial statements.Any differences in the percentage of Net Assets are the result of roundings.
CS Investment Funds 13 (formerly Credit Suisse Fund (Lux)) • Audited Annual Report as at 31.03.2015
Page 22Credit Suisse (Lux) Asia Corporate Bond Fund
Statement of Investments in Securities and Other Net Assets (Continued)
DescriptionQuantity /
NominalValuation % of net
assets(in USD)
USD YUZHOU PROPERTIES 8.75%/13-04.10.2018 3,600,000 3,458,232.00 0.74
Securities listed on a stock exchange or other organised markets:Bonds 459,846,659.12 97.85
Bonds 459,846,659.12 97.85
Securities listed on a stock exchange or other organised markets: Investment funds
Fund units (Open-End)
USD CS INVESTMENT FUNDS 1 SICAV - FOCUSEDBOND FUND -IB- USD
1,000 1,011,850.00 0.21
USD CS INVESTMENT FUNDS 1 SICAV - FOCUSEDBOND FUND -QA- USD
1,000 1,011,620.00 0.22
Securities listed on a stock exchange or other organised markets:Investment funds 2,023,470.00 0.43
Fund units (Open-End) 2,023,470.00 0.43
Securities not listed on a stock exchange: Investment funds
Fund units (Open-End)
SGD CS (LUX) GLOBAL VALUE BOND FUND -AH-SGD
5,000 359,336.55 0.08
Securities not listed on a stock exchange: Investment funds 359,336.55 0.08
Fund units (Open-End) 359,336.55 0.08
Total of Portfolio 462,229,465.67 98.36
Cash at banks and at brokers 1,996,774.40 0.42
Due to banks and to brokers -4,208,007.47 -0.90
Other net assets 9,926,931.57 2.12
Total net assets 469,945,164.17 100.00
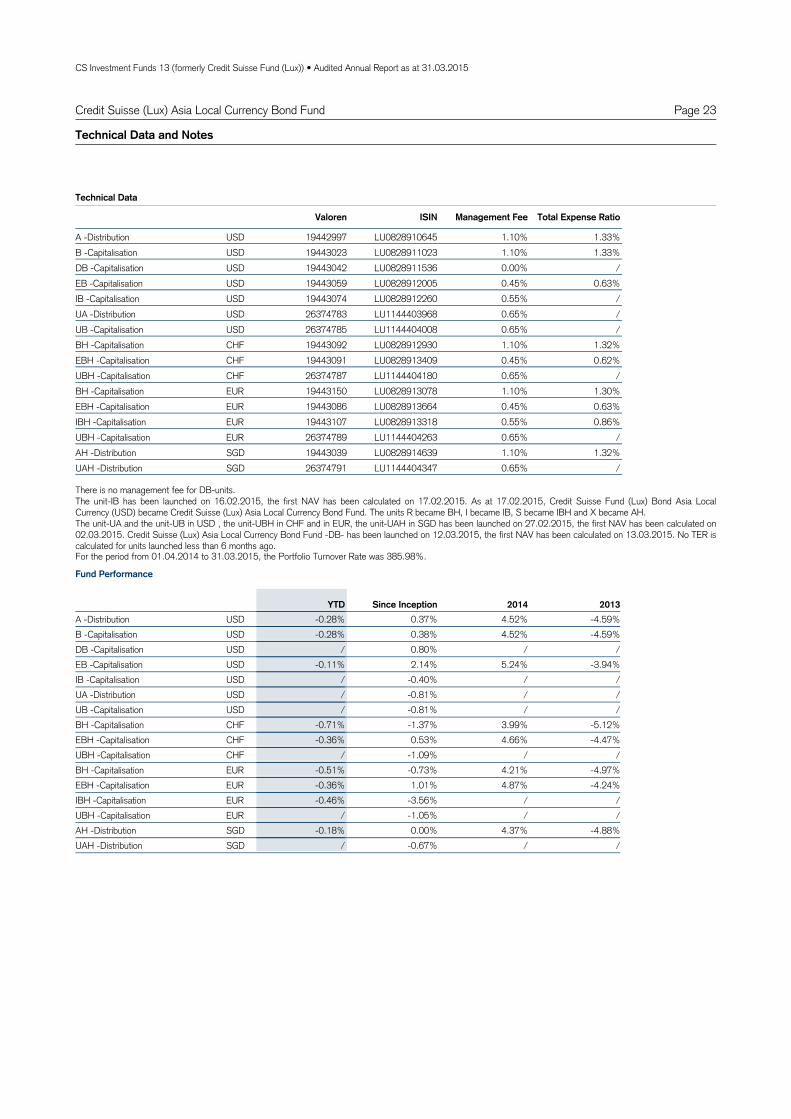
CS Investment Funds 13 (formerly Credit Suisse Fund (Lux)) • Audited Annual Report as at 31.03.2015
Page 23Credit Suisse (Lux) Asia Local Currency Bond Fund
Technical Data and Notes
USDA 19442997 LU0828910645 1.10% 1.33%Distribution -
Valoren ISIN Management Fee Total Expense Ratio
USDB 19443023 LU0828911023 1.10% 1.33%Capitalisation - USDDB 19443042 LU0828911536 0.00% /Capitalisation - USDEB 19443059 LU0828912005 0.45% 0.63%Capitalisation - USDIB 19443074 LU0828912260 0.55% /Capitalisation - USDUA 26374783 LU1144403968 0.65% /Distribution - USDUB 26374785 LU1144404008 0.65% /Capitalisation - CHFBH 19443092 LU0828912930 1.10% 1.32%Capitalisation - CHFEBH 19443091 LU0828913409 0.45% 0.62%Capitalisation - CHFUBH 26374787 LU1144404180 0.65% /Capitalisation - EURBH 19443150 LU0828913078 1.10% 1.30%Capitalisation - EUREBH 19443086 LU0828913664 0.45% 0.63%Capitalisation - EURIBH 19443107 LU0828913318 0.55% 0.86%Capitalisation - EURUBH 26374789 LU1144404263 0.65% /Capitalisation - SGDAH 19443039 LU0828914639 1.10% 1.32%Distribution - SGDUAH 26374791 LU1144404347 0.65% /Distribution -
Technical Data
USDA -4.59%4.52%0.37%-0.28%Distribution - 2013YTD 2014Since Inception
USDB -4.59%4.52%0.38%-0.28%Capitalisation - USDDB //0.80%/Capitalisation - USDEB -3.94%5.24%2.14%-0.11%Capitalisation - USDIB //-0.40%/Capitalisation - USDUA //-0.81%/Distribution - USDUB //-0.81%/Capitalisation - CHFBH -5.12%3.99%-1.37%-0.71%Capitalisation - CHFEBH -4.47%4.66%0.53%-0.36%Capitalisation - CHFUBH //-1.09%/Capitalisation - EURBH -4.97%4.21%-0.73%-0.51%Capitalisation - EUREBH -4.24%4.87%1.01%-0.36%Capitalisation - EURIBH //-3.56%-0.46%Capitalisation - EURUBH //-1.05%/Capitalisation - SGDAH -4.88%4.37%0.00%-0.18%Distribution - SGDUAH //-0.67%/Distribution -
Fund Performance
There is no management fee for DB-units.The unit-IB has been launched on 16.02.2015, the first NAV has been calculated on 17.02.2015. As at 17.02.2015, Credit Suisse Fund (Lux) Bond Asia LocalCurrency (USD) became Credit Suisse (Lux) Asia Local Currency Bond Fund. The units R became BH, I became IB, S became IBH and X became AH.The unit-UA and the unit-UB in USD , the unit-UBH in CHF and in EUR, the unit-UAH in SGD has been launched on 27.02.2015, the first NAV has been calculated on02.03.2015. Credit Suisse (Lux) Asia Local Currency Bond Fund -DB- has been launched on 12.03.2015, the first NAV has been calculated on 13.03.2015. No TER iscalculated for units launched less than 6 months ago.For the period from 01.04.2014 to 31.03.2015, the Portfolio Turnover Rate was 385.98%.

CS Investment Funds 13 (formerly Credit Suisse Fund (Lux)) • Audited Annual Report as at 31.03.2015
Page 24Credit Suisse (Lux) Asia Local Currency Bond Fund
Technical Data and Notes
A Distribution- USD 20.10.2014 0.87A Distribution- USD 19.01.2015 0.80
Ex-Date Amount
AH Distribution- SGD 20.10.2014 0.88AH Distribution- SGD 19.01.2015 0.81
Distributions
AUDCOMMONWEALTH GOV TRE BOND 10Y -800000-06/15
8 6,251,520.00 2,200.18
AUDCOMMONWEALTH GOV TRE BOND 3Y -280000- 06/15 30 8,260,560.00 10,267.50KRWKOREA GOVT BONDS 3 YEAR -100000000- 06/15 -40 -4,379,600,000.00 -21,992.88USDUS TREASURY NOTE 10 YEAR CBT -100000- 06/15 -237 -30,550,781.25 -50,695.28USDUS TREASURY NOTE 5 YEAR CBT -100000- 06/15 -35 -4,207,382.83 -56,562.50
-116,782.98Net unrealised loss on financial futures contracts
Quantity EngagementDescription Currency Valuation(in USD)
Counterparty: Credit Suisse London
Financial futures contracts
13,170,000AUD USD -11,215,835 -1,181,603.2013.05.2015Credit Suisse Zürich
116,200,000THB USD -3,491,587 77,982.5309.04.2015Credit Suisse Zürich
4,300,000AUD USD -3,477,195 -195,536.3416.04.2015Credit Suisse Zürich
842,380USD NZD -1,100,000 18,856.8016.04.2015Credit Suisse Zürich
16,000,000PHP USD -362,081 -4,403.9529.04.2015Credit Suisse Zürich
2,370,390USD NZD -3,300,000 -100,432.9816.04.2015Credit Suisse Zürich
1,735,810USD NZD -2,300,000 13,856.5816.04.2015Credit Suisse Zürich
2,312,000,000KRW USD -2,099,337 -17,435.3205.06.2015Credit Suisse Zürich
680,000AUD USD -529,312 -11,219.5313.05.2015Credit Suisse Zürich
562,650USD NZD -750,000 1,138.0016.04.2015Credit Suisse Zürich
300,000,000INR USD -4,776,310 -30,995.9405.06.2015Credit Suisse Zürich
1,115,625USD NZD -1,500,000 -7,414.6516.04.2015Credit Suisse Zürich
14,700,000MYR USD -3,963,119 -20,785.1511.06.2015Credit Suisse Zürich
10,630,000,000KRW USD -9,558,063 14,002.7205.06.2015Credit Suisse Zürich
SalesPurchases Valuation(in USD)
MaturityCounterparty
Forward foreign exchange contracts
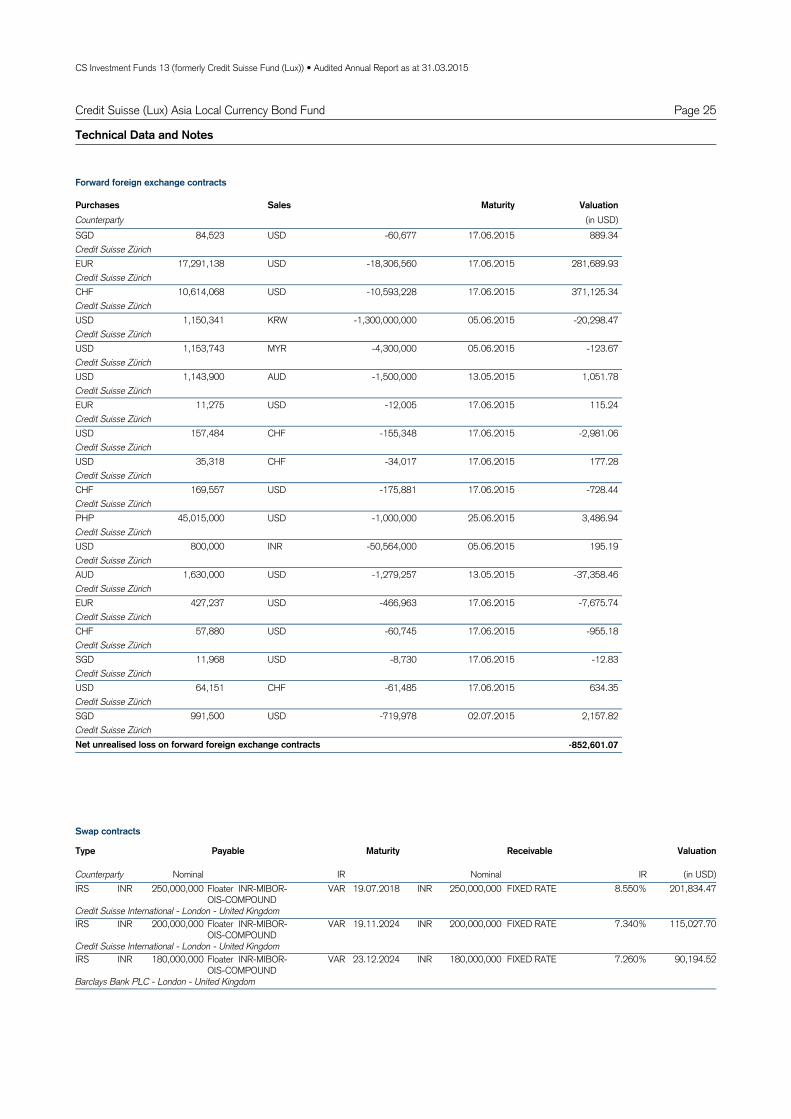
CS Investment Funds 13 (formerly Credit Suisse Fund (Lux)) • Audited Annual Report as at 31.03.2015
Page 25Credit Suisse (Lux) Asia Local Currency Bond Fund
Technical Data and Notes
84,523SGD USD -60,677 889.3417.06.2015Credit Suisse Zürich
17,291,138EUR USD -18,306,560 281,689.9317.06.2015Credit Suisse Zürich
10,614,068CHF USD -10,593,228 371,125.3417.06.2015Credit Suisse Zürich
1,150,341USD KRW -1,300,000,000 -20,298.4705.06.2015Credit Suisse Zürich
1,153,743USD MYR -4,300,000 -123.6705.06.2015Credit Suisse Zürich
1,143,900USD AUD -1,500,000 1,051.7813.05.2015Credit Suisse Zürich
11,275EUR USD -12,005 115.2417.06.2015Credit Suisse Zürich
157,484USD CHF -155,348 -2,981.0617.06.2015Credit Suisse Zürich
35,318USD CHF -34,017 177.2817.06.2015Credit Suisse Zürich
169,557CHF USD -175,881 -728.4417.06.2015Credit Suisse Zürich
45,015,000PHP USD -1,000,000 3,486.9425.06.2015Credit Suisse Zürich
800,000USD INR -50,564,000 195.1905.06.2015Credit Suisse Zürich
1,630,000AUD USD -1,279,257 -37,358.4613.05.2015Credit Suisse Zürich
427,237EUR USD -466,963 -7,675.7417.06.2015Credit Suisse Zürich
57,880CHF USD -60,745 -955.1817.06.2015Credit Suisse Zürich
11,968SGD USD -8,730 -12.8317.06.2015Credit Suisse Zürich
64,151USD CHF -61,485 634.3517.06.2015Credit Suisse Zürich
991,500SGD USD -719,978 2,157.8202.07.2015Credit Suisse Zürich
-852,601.07Net unrealised loss on forward foreign exchange contracts
SalesPurchases Valuation(in USD)
MaturityCounterparty
Forward foreign exchange contracts
IRS Floater INR-MIBOR-OIS-COMPOUND
19.07.2018 201,834.47INR 250,000,000 VAR INR 250,000,000 FIXED RATE 8.550%
Credit Suisse International - London - United KingdomIRS Floater INR-MIBOR-
OIS-COMPOUND19.11.2024 115,027.70INR 200,000,000 VAR INR 200,000,000 FIXED RATE 7.340%
Credit Suisse International - London - United KingdomIRS Floater INR-MIBOR-
OIS-COMPOUND23.12.2024 90,194.52INR 180,000,000 VAR INR 180,000,000 FIXED RATE 7.260%
Barclays Bank PLC - London - United Kingdom
Type Maturity ReceivablePayable Valuation
(in USD)Nominal IR Nominal IRCounterparty
Swap contracts
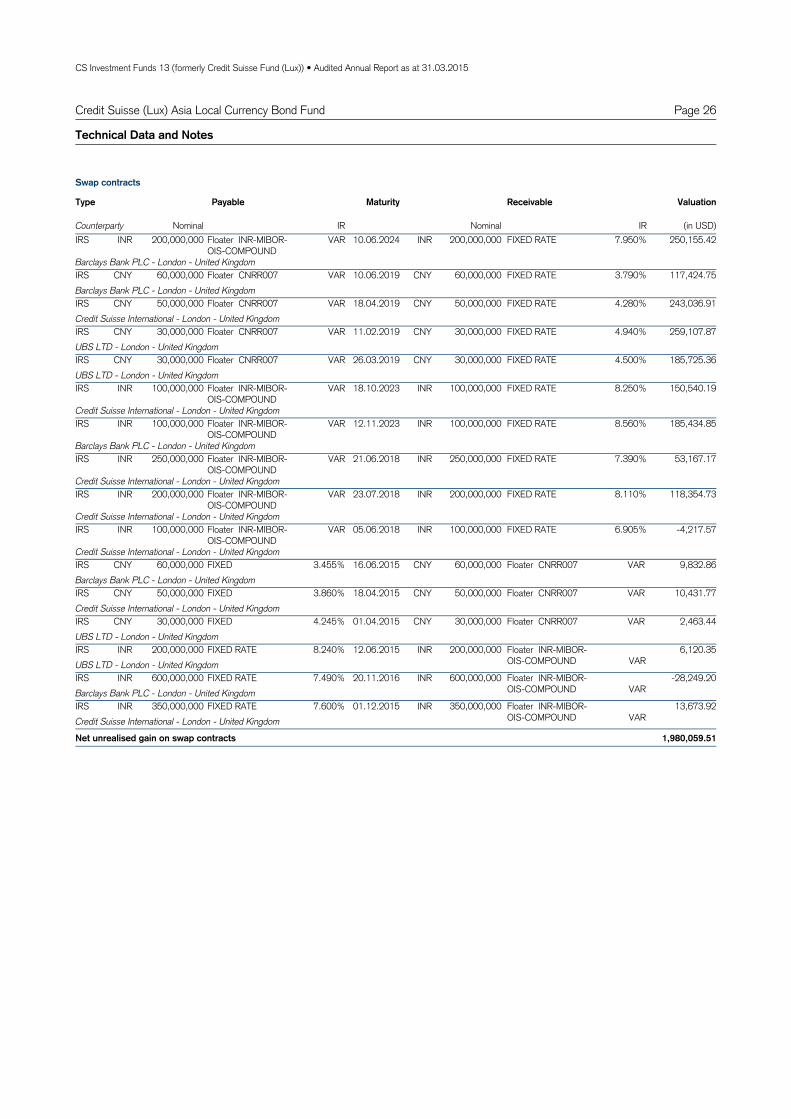
CS Investment Funds 13 (formerly Credit Suisse Fund (Lux)) • Audited Annual Report as at 31.03.2015
Page 26Credit Suisse (Lux) Asia Local Currency Bond Fund
Technical Data and Notes
IRS Floater INR-MIBOR-OIS-COMPOUND
10.06.2024 250,155.42INR 200,000,000 VAR INR 200,000,000 FIXED RATE 7.950%
Barclays Bank PLC - London - United KingdomIRS Floater CNRR007 10.06.2019 117,424.75CNY 60,000,000 VAR CNY 60,000,000 FIXED RATE 3.790%Barclays Bank PLC - London - United KingdomIRS Floater CNRR007 18.04.2019 243,036.91CNY 50,000,000 VAR CNY 50,000,000 FIXED RATE 4.280%Credit Suisse International - London - United KingdomIRS Floater CNRR007 11.02.2019 259,107.87CNY 30,000,000 VAR CNY 30,000,000 FIXED RATE 4.940%UBS LTD - London - United KingdomIRS Floater CNRR007 26.03.2019 185,725.36CNY 30,000,000 VAR CNY 30,000,000 FIXED RATE 4.500%UBS LTD - London - United KingdomIRS Floater INR-MIBOR-
OIS-COMPOUND18.10.2023 150,540.19INR 100,000,000 VAR INR 100,000,000 FIXED RATE 8.250%
Credit Suisse International - London - United KingdomIRS Floater INR-MIBOR-
OIS-COMPOUND12.11.2023 185,434.85INR 100,000,000 VAR INR 100,000,000 FIXED RATE 8.560%
Barclays Bank PLC - London - United KingdomIRS Floater INR-MIBOR-
OIS-COMPOUND21.06.2018 53,167.17INR 250,000,000 VAR INR 250,000,000 FIXED RATE 7.390%
Credit Suisse International - London - United KingdomIRS Floater INR-MIBOR-
OIS-COMPOUND23.07.2018 118,354.73INR 200,000,000 VAR INR 200,000,000 FIXED RATE 8.110%
Credit Suisse International - London - United KingdomIRS Floater INR-MIBOR-
OIS-COMPOUND05.06.2018 -4,217.57INR 100,000,000 VAR INR 100,000,000 FIXED RATE 6.905%
Credit Suisse International - London - United KingdomIRS FIXED 16.06.2015 9,832.86CNY 60,000,000 3.455% CNY 60,000,000 Floater CNRR007 VAR
Barclays Bank PLC - London - United KingdomIRS FIXED 18.04.2015 10,431.77CNY 50,000,000 3.860% CNY 50,000,000 Floater CNRR007 VAR
Credit Suisse International - London - United KingdomIRS FIXED 01.04.2015 2,463.44CNY 30,000,000 4.245% CNY 30,000,000 Floater CNRR007 VAR
UBS LTD - London - United KingdomIRS FIXED RATE 12.06.2015 6,120.35INR 200,000,000 8.240% INR 200,000,000 Floater INR-MIBOR-
OIS-COMPOUND VAR%
UBS LTD - London - United KingdomIRS FIXED RATE 20.11.2016 -28,249.20INR 600,000,000 7.490% INR 600,000,000 Floater INR-MIBOR-
OIS-COMPOUND VAR%
Barclays Bank PLC - London - United KingdomIRS FIXED RATE 01.12.2015 13,673.92INR 350,000,000 7.600% INR 350,000,000 Floater INR-MIBOR-
OIS-COMPOUND VAR%
Credit Suisse International - London - United Kingdom
1,980,059.51Net unrealised gain on swap contracts
Type Maturity ReceivablePayable Valuation
(in USD)Nominal IR Nominal IRCounterparty
Swap contracts

CS Investment Funds 13 (formerly Credit Suisse Fund (Lux)) • Audited Annual Report as at 31.03.2015
Page 27
Assets
Investments in securities at market value 110,556,122.38Cash at banks and at brokers 1,444,581.94Subscriptions receivable 107,915.84Income receivable 1,616,519.61Prepaid expenses 2,983.81Net unrealised gain on swaps contracts 1,980,059.51
115,708,183.09
Liabilities
Due to banks and to brokers 722,209.01Redemptions payable 151,982.56Provisions for accrued expenses 123,315.79Net unrealised loss on financial futures contracts 116,782.98Net unrealised loss on forward foreign exchange contracts 852,601.07Other liabilities 1,317.84
1,968,209.25
113,739,973.84Net assets
Statement of Net Assets in USD and Fund Evolution
31.03.2015
Credit Suisse (Lux) Asia Local Currency Bond Fund
The notes are an integral part of the financial statements.
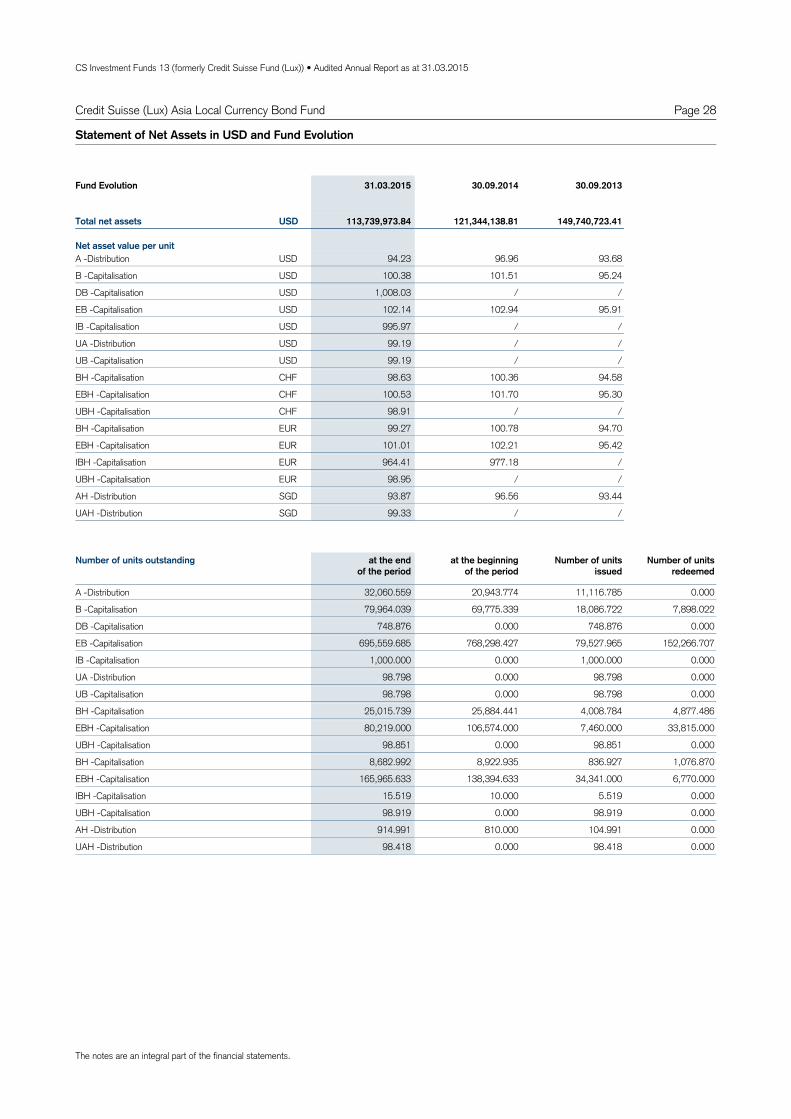
CS Investment Funds 13 (formerly Credit Suisse Fund (Lux)) • Audited Annual Report as at 31.03.2015
Page 28
Statement of Net Assets in USD and Fund Evolution
94.23 93.68USDA 96.96Distribution -
100.38 95.24USDB 101.51Capitalisation -
1,008.03 /USDDB /Capitalisation -
102.14 95.91USDEB 102.94Capitalisation -
995.97 /USDIB /Capitalisation -
99.19 /USDUA /Distribution -
99.19 /USDUB /Capitalisation -
98.63 94.58CHFBH 100.36Capitalisation -
100.53 95.30CHFEBH 101.70Capitalisation -
98.91 /CHFUBH /Capitalisation -
99.27 94.70EURBH 100.78Capitalisation -
101.01 95.42EUREBH 102.21Capitalisation -
964.41 /EURIBH 977.18Capitalisation -
98.95 /EURUBH /Capitalisation -
93.87 93.44SGDAH 96.56Distribution -
99.33 /SGDUAH /Distribution -
Total net assets
Net asset value per unit
113,739,973.84 121,344,138.81 149,740,723.41USD
Fund Evolution 31.03.2015 30.09.2014 30.09.2013
32,060.559 11,116.785A 20,943.774 0.000Distribution -
79,964.039 18,086.722B 69,775.339 7,898.022Capitalisation -
748.876 748.876DB 0.000 0.000Capitalisation -
695,559.685 79,527.965EB 768,298.427 152,266.707Capitalisation -
1,000.000 1,000.000IB 0.000 0.000Capitalisation -
98.798 98.798UA 0.000 0.000Distribution -
98.798 98.798UB 0.000 0.000Capitalisation -
25,015.739 4,008.784BH 25,884.441 4,877.486Capitalisation -
80,219.000 7,460.000EBH 106,574.000 33,815.000Capitalisation -
98.851 98.851UBH 0.000 0.000Capitalisation -
8,682.992 836.927BH 8,922.935 1,076.870Capitalisation -
165,965.633 34,341.000EBH 138,394.633 6,770.000Capitalisation -
15.519 5.519IBH 10.000 0.000Capitalisation -
98.919 98.919UBH 0.000 0.000Capitalisation -
914.991 104.991AH 810.000 0.000Distribution -
98.418 98.418UAH 0.000 0.000Distribution -
Number of units outstanding at the endof the period
at the beginningof the period
Number of units issued
Number of units redeemed
Credit Suisse (Lux) Asia Local Currency Bond Fund
The notes are an integral part of the financial statements.

CS Investment Funds 13 (formerly Credit Suisse Fund (Lux)) • Audited Annual Report as at 31.03.2015
Page 29Credit Suisse (Lux) Asia Local Currency Bond Fund
Net assets at the beginning of the period 121,344,138.81
Income
Interest on investments in securities (net) 2,730,511.78Dividends (net) 5,062.76Bank interest 7,457.76
2,743,032.30
Expenses
Management fee 311,493.85Custodian and safe custody fees 31,834.25Administration expenses 25,165.00Printing and publication expenses 4,273.30Audit, control, legal, representative bank and other expenses 62,544.46"Taxe d'abonnement" 8,607.04
443,917.90
Net income (loss) 2,299,114.40
Realised gain (loss)
Net realised gain (loss) on sales of investments -1,493,305.53Net realised gain (loss) on financial futures contracts -1,312,835.90Net realised gain (loss) on swap contracts 44,995.31Net realised gain (loss) on forward foreign exchange contracts -6,629,072.50Net realised gain (loss) on foreign exchange -120,665.69
-9,510,884.31
Net realised gain (loss) -7,211,769.91
Change in net unrealised appreciation (depreciation)
Change in net unrealised appreciation (depreciation) on investments 1,309,210.69Change in net unrealised appreciation (depreciation) on financial futures contracts -240,792.00Change in net unrealised appreciation (depreciation) on swap contracts 800,708.19Change in net unrealised appreciation (depreciation) on forward foreign exchange contracts 1,191,523.77
3,060,650.65
Net increase (decrease) in net assets as a result of operations -4,151,119.26
Subscriptions / Redemptions
Subscriptions 18,158,023.51Redemptions -21,574,886.22
-3,416,862.71
Distribution -36,183.00
Net assets at the end of the period 113,739,973.84
Statement of Operations / Changes in Net Assets in USD
For the period from01.10.2014 to
31.03.2015
The notes are an integral part of the financial statements.
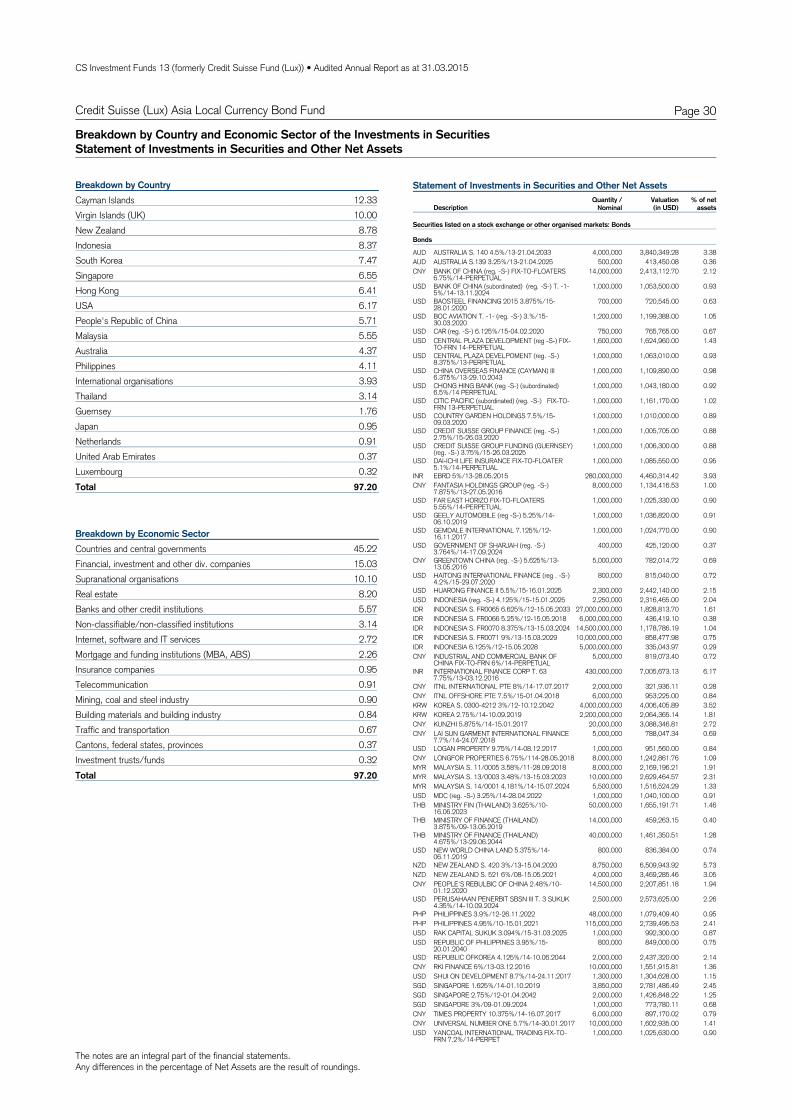
The notes are an integral part of the financial statements.Any differences in the percentage of Net Assets are the result of roundings.
CS Investment Funds 13 (formerly Credit Suisse Fund (Lux)) • Audited Annual Report as at 31.03.2015
Page 30Credit Suisse (Lux) Asia Local Currency Bond Fund
Breakdown by Country and Economic Sector of the Investments in SecuritiesStatement of Investments in Securities and Other Net Assets
12.33Cayman IslandsBreakdown by Country
10.00Virgin Islands (UK)8.78New Zealand8.37Indonesia7.47South Korea6.55Singapore6.41Hong Kong6.17USA5.71People's Republic of China5.55Malaysia4.37Australia4.11Philippines3.93International organisations3.14Thailand1.76Guernsey0.95Japan0.91Netherlands0.37United Arab Emirates0.32Luxembourg
97.20Total
45.22Countries and central governmentsBreakdown by Economic Sector
15.03Financial, investment and other div. companies10.10Supranational organisations8.20Real estate5.57Banks and other credit institutions3.14Non-classifiable/non-classified institutions2.72Internet, software and IT services2.26Mortgage and funding institutions (MBA, ABS)0.95Insurance companies0.91Telecommunication0.90Mining, coal and steel industry0.84Building materials and building industry0.67Traffic and transportation0.37Cantons, federal states, provinces0.32Investment trusts/funds
97.20Total
Statement of Investments in Securities and Other Net Assets
DescriptionQuantity /
NominalValuation % of net
assets(in USD)
Securities listed on a stock exchange or other organised markets: Bonds
Bonds
AUD AUSTRALIA S. 140 4.5%/13-21.04.2033 4,000,000 3,840,349.28 3.38AUD AUSTRALIA S.139 3.25%/13-21.04.2025 500,000 413,450.08 0.36CNY BANK OF CHINA (reg. -S-) FIX-TO-FLOATERS
6.75%/14-PERPETUAL14,000,000 2,413,112.70 2.12
USD BANK OF CHINA (subordinated) (reg. -S-) T. -1-5%/14-13.11.2024
1,000,000 1,053,500.00 0.93
USD BAOSTEEL FINANCING 2015 3.875%/15-28.01.2020
700,000 720,545.00 0.63
USD BOC AVIATION T. -1- (reg. -S-) 3.%/15-30.03.2020
1,200,000 1,199,388.00 1.05
USD CAR (reg. -S-) 6.125%/15-04.02.2020 750,000 765,765.00 0.67USD CENTRAL PLAZA DEVELOPMENT (reg -S-) FIX-
TO-FRN 14-PERPETUAL1,600,000 1,624,960.00 1.43
USD CENTRAL PLAZA DEVELPOMENT (reg. -S-)8.375%/13-PERPETUAL
1,000,000 1,063,010.00 0.93
USD CHINA OVERSEAS FINANCE (CAYMAN) III6.375%/13-29.10.2043
1,000,000 1,109,890.00 0.98
USD CHONG HING BANK (reg -S-) (subordinated)6.5%/14 PERPETUAL
1,000,000 1,043,180.00 0.92
USD CITIC PACIFIC (subordinated) (reg. -S-) FIX-TO-FRN 13-PERPETUAL
1,000,000 1,161,170.00 1.02
USD COUNTRY GARDEN HOLDINGS 7.5%/15-09.03.2020
1,000,000 1,010,000.00 0.89
USD CREDIT SUISSE GROUP FINANCE (reg. -S-)2.75%/15-26.03.2020
1,000,000 1,005,705.00 0.88
USD CREDIT SUISSE GROUP FUNDING (GUERNSEY)(reg. -S-) 3.75%/15-26.03.2025
1,000,000 1,006,300.00 0.88
USD DAI-ICHI LIFE INSURANCE FIX-TO-FLOATER5.1%/14-PERPETUAL
1,000,000 1,085,550.00 0.95
INR EBRD 5%/13-28.05.2015 280,000,000 4,460,314.42 3.93CNY FANTASIA HOLDINGS GROUP (reg. -S-)
7.875%/13-27.05.20168,000,000 1,134,416.53 1.00
USD FAR EAST HORIZO FIX-TO-FLOATERS5.55%/14-PERPETUAL
1,000,000 1,025,330.00 0.90
USD GEELY AUTOMOBILE (reg -S-) 5.25%/14-06.10.2019
1,000,000 1,036,820.00 0.91
USD GEMDALE INTERNATIONAL 7.125%/12-16.11.2017
1,000,000 1,024,770.00 0.90
USD GOVERNMENT OF SHARJAH (reg. -S-)3.764%/14-17.09.2024
400,000 425,120.00 0.37
CNY GREENTOWN CHINA (reg. -S-) 5.625%/13-13.05.2016
5,000,000 782,014.72 0.69
USD HAITONG INTERNATIONAL FINANCE (reg . -S-)4.2%/15-29.07.2020
800,000 815,040.00 0.72
USD HUARONG FINANCE II 5.5%/15-16.01.2025 2,300,000 2,442,140.00 2.15USD INDONESIA (reg. -S-) 4.125%/15-15.01.2025 2,250,000 2,316,465.00 2.04IDR INDONESIA S. FR0065 6.625%/12-15.05.2033 27,000,000,000 1,828,813.70 1.61IDR INDONESIA S. FR0066 5.25%/12-15.05.2018 6,000,000,000 436,419.10 0.38IDR INDONESIA S. FR0070 8.375%/13-15.03.2024 14,500,000,000 1,178,786.19 1.04IDR INDONESIA S. FR0071 9%/13-15.03.2029 10,000,000,000 858,477.98 0.75IDR INDONESIA 6.125%/12-15.05.2028 5,000,000,000 335,043.97 0.29CNY INDUSTRIAL AND COMMERCIAL BANK OF
CHINA FIX-TO-FRN 6%/14-PERPETUAL5,000,000 819,073.40 0.72
INR INTERNATIONAL FINANCE CORP T. 637.75%/13-03.12.2016
430,000,000 7,005,673.13 6.17
CNY ITNL INTERNATIONAL PTE 8%/14-17.07.2017 2,000,000 321,936.11 0.28CNY ITNL OFFSHORE PTE 7.5%/15-01.04.2018 6,000,000 953,225.00 0.84KRW KOREA S. 0300-4212 3%/12-10.12.2042 4,000,000,000 4,006,405.89 3.52KRW KOREA 2.75%/14-10.09.2019 2,200,000,000 2,064,365.14 1.81CNY KUNZHI 5.875%/14-15.01.2017 20,000,000 3,088,346.81 2.72CNY LAI SUN GARMENT INTERNATIONAL FINANCE
7.7%/14-24.07.20185,000,000 788,047.34 0.69
USD LOGAN PROPERTY 9.75%/14-08.12.2017 1,000,000 951,560.00 0.84CNY LONGFOR PROPERTIES 6.75%/114-28.05.2018 8,000,000 1,242,861.76 1.09MYR MALAYSIA S. 11/0005 3.58%/11-28.09.2018 8,000,000 2,169,196.21 1.91MYR MALAYSIA S. 13/0003 3.48%/13-15.03.2023 10,000,000 2,629,464.57 2.31MYR MALAYSIA S. 14/0001 4.181%/14-15.07.2024 5,500,000 1,516,524.29 1.33USD MDC (reg. -S-) 3.25%/14-28.04.2022 1,000,000 1,040,100.00 0.91THB MINISTRY FIN (THAILAND) 3.625%/10-
16.06.202350,000,000 1,655,191.71 1.46
THB MINISTRY OF FINANCE (THAILAND)3.875%/09-13.06.2019
14,000,000 459,263.15 0.40
THB MINISTRY OF FINANCE (THAILAND)4.675%/13-29.06.2044
40,000,000 1,461,350.51 1.28
USD NEW WORLD CHINA LAND 5.375%/14-06.11.2019
800,000 836,384.00 0.74
NZD NEW ZEALAND S. 420 3%/13-15.04.2020 8,750,000 6,509,943.92 5.73NZD NEW ZEALAND S. 521 6%/08-15.05.2021 4,000,000 3,469,285.46 3.05CNY PEOPLE'S REBULBIC OF CHINA 2.48%/10-
01.12.202014,500,000 2,207,851.18 1.94
USD PERUSAHAAN PENERBIT SBSN III T. 3 SUKUK4.35%/14-10.09.2024
2,500,000 2,573,625.00 2.26
PHP PHILIPPINES 3.9%/12-26.11.2022 48,000,000 1,079,409.40 0.95PHP PHILIPPINES 4.95%/10-15.01.2021 115,000,000 2,739,495.53 2.41USD RAK CAPITAL SUKUK 3.094%/15-31.03.2025 1,000,000 992,300.00 0.87USD REPUBLIC OF PHILIPPINES 3.95%/15-
20.01.2040800,000 849,000.00 0.75
USD REPUBLIC OFKOREA 4.125%/14-10.06.2044 2,000,000 2,437,320.00 2.14CNY RKI FINANCE 6%/13-03.12.2016 10,000,000 1,551,915.81 1.36USD SHUI ON DEVELOPMENT 8.7%/14-24.11.2017 1,300,000 1,304,628.00 1.15SGD SINGAPORE 1.625%/14-01.10.2019 3,850,000 2,781,486.49 2.45SGD SINGAPORE 2.75%/12-01.04.2042 2,000,000 1,426,848.22 1.25SGD SINGAPORE 3%/09-01.09.2024 1,000,000 773,780.11 0.68CNY TIMES PROPERTY 10.375%/14-16.07.2017 6,000,000 897,170.02 0.79CNY UNIVERSAL NUMBER ONE 5.7%/14-30.01.2017 10,000,000 1,602,935.00 1.41USD YANCOAL INTERNATIONAL TRADING FIX-TO-
FRN 7.2%/14-PERPET1,000,000 1,025,630.00 0.90
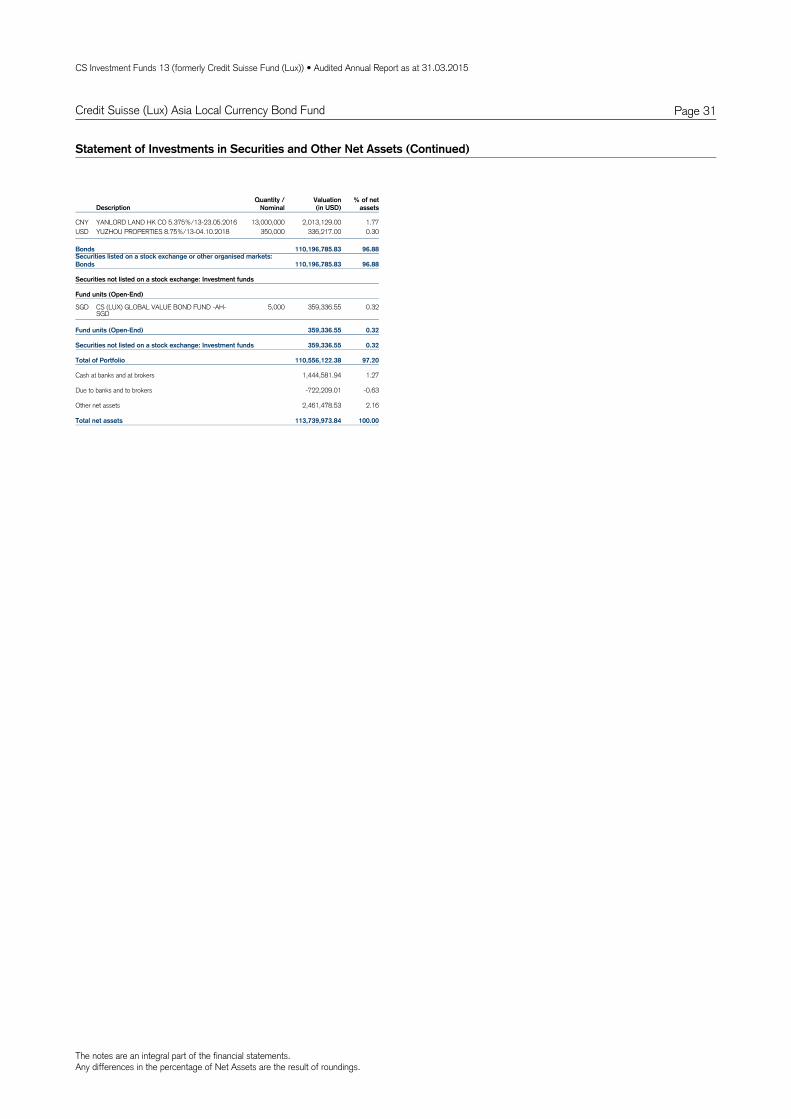
The notes are an integral part of the financial statements.Any differences in the percentage of Net Assets are the result of roundings.
CS Investment Funds 13 (formerly Credit Suisse Fund (Lux)) • Audited Annual Report as at 31.03.2015
Page 31Credit Suisse (Lux) Asia Local Currency Bond Fund
Statement of Investments in Securities and Other Net Assets (Continued)
DescriptionQuantity /
NominalValuation % of net
assets(in USD)
CNY YANLORD LAND HK CO 5.375%/13-23.05.2016 13,000,000 2,013,129.00 1.77USD YUZHOU PROPERTIES 8.75%/13-04.10.2018 350,000 336,217.00 0.30
Securities listed on a stock exchange or other organised markets:Bonds 110,196,785.83 96.88
Bonds 110,196,785.83 96.88
Securities not listed on a stock exchange: Investment funds
Fund units (Open-End)
SGD CS (LUX) GLOBAL VALUE BOND FUND -AH-SGD
5,000 359,336.55 0.32
Securities not listed on a stock exchange: Investment funds 359,336.55 0.32
Fund units (Open-End) 359,336.55 0.32
Total of Portfolio 110,556,122.38 97.20
Cash at banks and at brokers 1,444,581.94 1.27
Due to banks and to brokers -722,209.01 -0.63
Other net assets 2,461,478.53 2.16
Total net assets 113,739,973.84 100.00

CS Investment Funds 13 (formerly Credit Suisse Fund (Lux)) • Audited Annual Report as at 31.03.2015
Page 32Credit Suisse (Lux) Broad EUR Bond Fund
Technical Data and Notes
EURA 13404999 LU0650586935 0.50% 0.67%Distribution -
Valoren ISIN Management Fee Total Expense Ratio
EURB 13405038 LU0650587073 0.50% 0.67%Capitalisation - EUREA 25913202 LU1132333110 0.25% /Distribution - EUREB 13405042 LU0650587404 0.25% 0.38%Capitalisation - EURUA 26374792 LU1144404420 0.30% /Distribution - EURUB 26374795 LU1144404693 0.30% /Capitalisation -
Technical Data
EURA 1.51%10.23%19.94%2.27%Distribution - 2013YTD 2014Since Inception
EURB 1.51%10.23%19.93%2.27%Capitalisation - EUREA //1.85%/Distribution - EUREB 1.81%10.55%20.95%2.34%Capitalisation - EURUA //0.29%/Distribution - EURUB //0.29%/Capitalisation -
Fund Performance
For the period from 01.04.2014 to 31.03.2015, the Portfolio Turnover Rate was 84.92%.
Credit Suisse Fund (Lux) Bond EUR -EA- has been launched on 21.01.2015, the first NAV was calculated on 22.01.2015.As at 17.02.2015, Credit Suisse Fund (Lux) Bond EUR became Credit Suisse (Lux) Broad EUR Bond Fund. The unit-UA and the unit-UB has been launched on 27.02.2015, the first NAV has been calculated on 02.03.2015.No TER is calculated for units launched less than 6 months ago.
A Distribution- EUR 18.11.2014 2.20
Ex-Date Amount
Distributions
EUREURO BUND FUTURE -100000- 06/15 -80 -12,700,800.00 -186,400.00-186,400.00Net unrealised loss on financial futures contracts
Quantity EngagementDescription Currency Valuation(in EUR)
Counterparty: Credit Suisse Zürich
Financial futures contracts
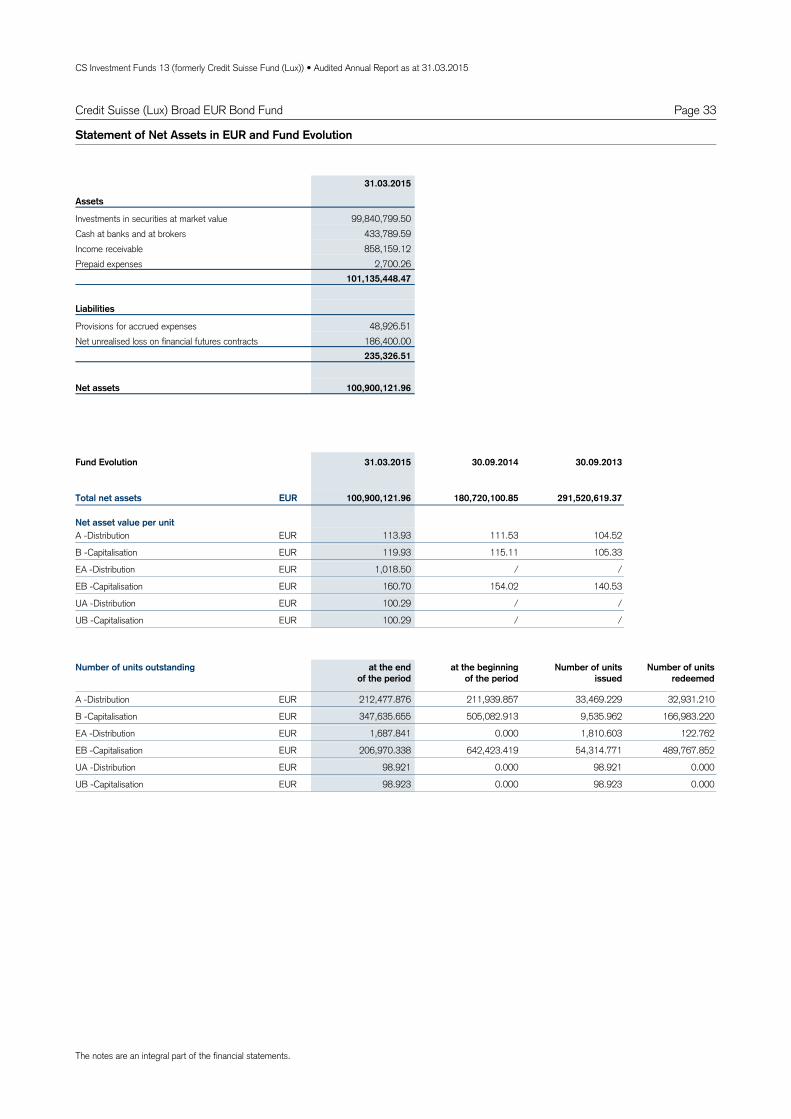
CS Investment Funds 13 (formerly Credit Suisse Fund (Lux)) • Audited Annual Report as at 31.03.2015
Page 33
Assets
Investments in securities at market value 99,840,799.50Cash at banks and at brokers 433,789.59Income receivable 858,159.12Prepaid expenses 2,700.26
101,135,448.47
Liabilities
Provisions for accrued expenses 48,926.51Net unrealised loss on financial futures contracts 186,400.00
235,326.51
100,900,121.96Net assets
Statement of Net Assets in EUR and Fund Evolution
31.03.2015
113.93 104.52EURA 111.53Distribution -
119.93 105.33EURB 115.11Capitalisation -
1,018.50 /EUREA /Distribution -
160.70 140.53EUREB 154.02Capitalisation -
100.29 /EURUA /Distribution -
100.29 /EURUB /Capitalisation -
Total net assets
Net asset value per unit
100,900,121.96 180,720,100.85 291,520,619.37EUR
Fund Evolution 31.03.2015 30.09.2014 30.09.2013
212,477.876 33,469.229A 211,939.857 32,931.210Distribution - EUR
347,635.655 9,535.962B 505,082.913 166,983.220Capitalisation - EUR
1,687.841 1,810.603EA 0.000 122.762Distribution - EUR
206,970.338 54,314.771EB 642,423.419 489,767.852Capitalisation - EUR
98.921 98.921UA 0.000 0.000Distribution - EUR
98.923 98.923UB 0.000 0.000Capitalisation - EUR
Number of units outstanding at the endof the period
at the beginningof the period
Number of units issued
Number of units redeemed
Credit Suisse (Lux) Broad EUR Bond Fund
The notes are an integral part of the financial statements.

CS Investment Funds 13 (formerly Credit Suisse Fund (Lux)) • Audited Annual Report as at 31.03.2015
Page 34Credit Suisse (Lux) Broad EUR Bond Fund
Net assets at the beginning of the period 180,720,100.85
Income
Interest on investments in securities (net) 1,786,146.03Bank interest 27.23Securities lending income 19,335.27
1,805,508.53
Expenses
Management fee 286,448.35Custodian and safe custody fees 30,642.83Administration expenses 33,702.07Printing and publication expenses 6,306.13Audit, control, legal, representative bank and other expenses 32,912.99"Taxe d'abonnement" 21,142.13
411,154.50
Net income (loss) 1,394,354.03
Realised gain (loss)
Net realised gain (loss) on sales of investments 10,170,465.44Net realised gain (loss) on financial futures contracts -987,506.16Net realised gain (loss) on foreign exchange 3,326.51
9,186,285.79
Net realised gain (loss) 10,580,639.82
Change in net unrealised appreciation (depreciation)
Change in net unrealised appreciation (depreciation) on investments -3,823,602.15Change in net unrealised appreciation (depreciation) on financial futures contracts -186,399.98
-4,010,002.13
Net increase (decrease) in net assets as a result of operations 6,570,637.69
Subscriptions / Redemptions
Subscriptions 15,272,004.39Redemptions -101,205,669.68
-85,933,665.29
Distribution -456,951.29
Net assets at the end of the period 100,900,121.96
Statement of Operations / Changes in Net Assets in EUR
For the period from01.10.2014 to
31.03.2015
The notes are an integral part of the financial statements.
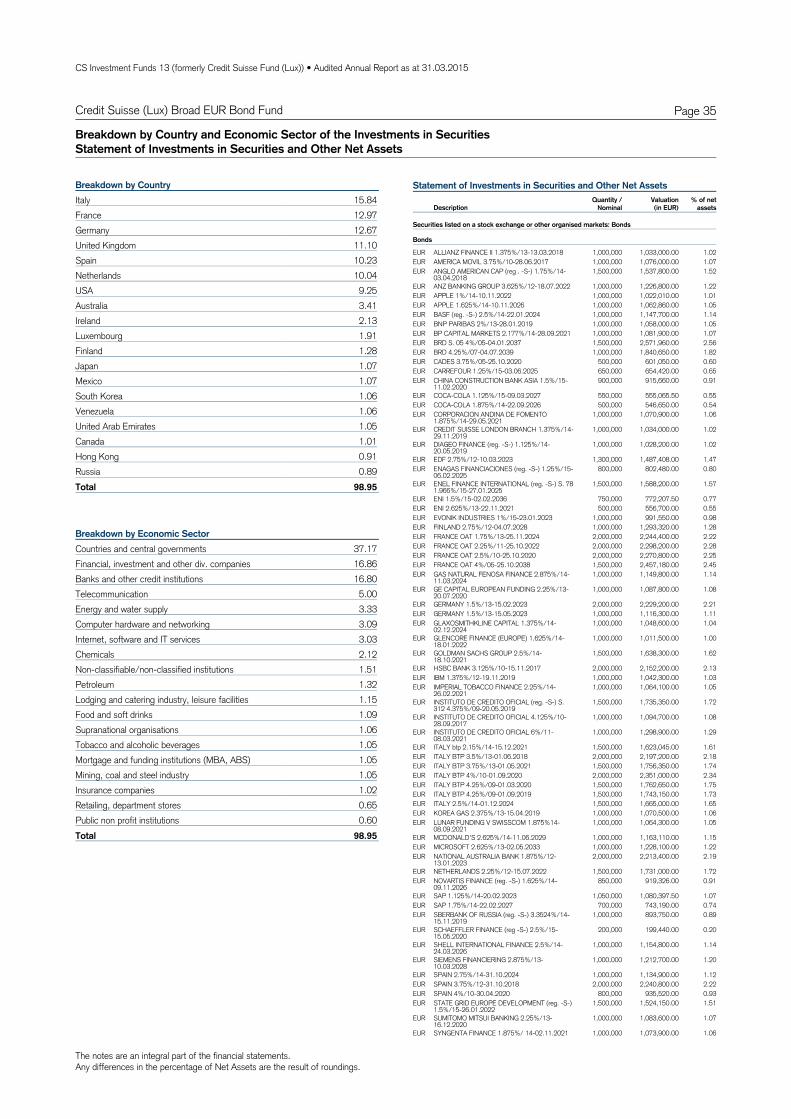
The notes are an integral part of the financial statements.Any differences in the percentage of Net Assets are the result of roundings.
CS Investment Funds 13 (formerly Credit Suisse Fund (Lux)) • Audited Annual Report as at 31.03.2015
Page 35Credit Suisse (Lux) Broad EUR Bond Fund
Breakdown by Country and Economic Sector of the Investments in SecuritiesStatement of Investments in Securities and Other Net Assets
15.84ItalyBreakdown by Country
12.97France12.67Germany11.10United Kingdom10.23Spain10.04Netherlands9.25USA3.41Australia2.13Ireland1.91Luxembourg1.28Finland1.07Japan1.07Mexico1.06South Korea1.06Venezuela1.05United Arab Emirates1.01Canada0.91Hong Kong0.89Russia
98.95Total
37.17Countries and central governmentsBreakdown by Economic Sector
16.86Financial, investment and other div. companies16.80Banks and other credit institutions5.00Telecommunication3.33Energy and water supply3.09Computer hardware and networking3.03Internet, software and IT services2.12Chemicals1.51Non-classifiable/non-classified institutions1.32Petroleum1.15Lodging and catering industry, leisure facilities1.09Food and soft drinks1.06Supranational organisations1.05Tobacco and alcoholic beverages1.05Mortgage and funding institutions (MBA, ABS)1.05Mining, coal and steel industry1.02Insurance companies0.65Retailing, department stores0.60Public non profit institutions
98.95Total
Statement of Investments in Securities and Other Net Assets
DescriptionQuantity /
NominalValuation % of net
assets(in EUR)
Securities listed on a stock exchange or other organised markets: Bonds
Bonds
EUR ALLIANZ FINANCE II 1.375%/13-13.03.2018 1,000,000 1,033,000.00 1.02EUR AMERICA MOVIL 3.75%/10-28.06.2017 1,000,000 1,076,000.00 1.07EUR ANGLO AMERICAN CAP (reg . -S-) 1.75%/14-
03.04.20181,500,000 1,537,800.00 1.52
EUR ANZ BANKING GROUP 3.625%/12-18.07.2022 1,000,000 1,226,800.00 1.22EUR APPLE 1%/14-10.11.2022 1,000,000 1,022,010.00 1.01EUR APPLE 1.625%/14-10.11.2026 1,000,000 1,062,860.00 1.05EUR BASF (reg. -S-) 2.5%/14-22.01.2024 1,000,000 1,147,700.00 1.14EUR BNP PARIBAS 2%/13-28.01.2019 1,000,000 1,058,000.00 1.05EUR BP CAPITAL MARKETS 2.177%/14-28.09.2021 1,000,000 1,081,900.00 1.07EUR BRD S. 05 4%/05-04.01.2037 1,500,000 2,571,960.00 2.56EUR BRD 4.25%/07-04.07.2039 1,000,000 1,840,650.00 1.82EUR CADES 3.75%/05-25.10.2020 500,000 601,050.00 0.60EUR CARREFOUR 1.25%/15-03.06.2025 650,000 654,420.00 0.65EUR CHINA CONSTRUCTION BANK ASIA 1.5%/15-
11.02.2020900,000 915,660.00 0.91
EUR COCA-COLA 1.125%/15-09.03.2027 550,000 555,065.50 0.55EUR COCA-COLA 1.875%/14-22.09.2026 500,000 546,650.00 0.54EUR CORPORACION ANDINA DE FOMENTO
1.875%/14-29.05.20211,000,000 1,070,900.00 1.06
EUR CREDIT SUISSE LONDON BRANCH 1.375%/14-29.11.2019
1,000,000 1,034,000.00 1.02
EUR DIAGEO FINANCE (reg. -S-) 1.125%/14-20.05.2019
1,000,000 1,028,200.00 1.02
EUR EDF 2.75%/12-10.03.2023 1,300,000 1,487,408.00 1.47EUR ENAGAS FINANCIACIONES (reg. -S-) 1.25%/15-
06.02.2025800,000 802,480.00 0.80
EUR ENEL FINANCE INTERNATIONAL (reg. -S-) S. 781.966%/15-27.01.2025
1,500,000 1,588,200.00 1.57
EUR ENI 1.5%/15-02.02.2036 750,000 772,207.50 0.77EUR ENI 2.625%/13-22.11.2021 500,000 556,700.00 0.55EUR EVONIK INDUSTRIES 1%/15-23.01.2023 1,000,000 991,550.00 0.98EUR FINLAND 2.75%/12-04.07.2028 1,000,000 1,293,320.00 1.28EUR FRANCE OAT 1.75%/13-25.11.2024 2,000,000 2,244,400.00 2.22EUR FRANCE OAT 2.25%/11-25.10.2022 2,000,000 2,298,200.00 2.28EUR FRANCE OAT 2.5%/10-25.10.2020 2,000,000 2,270,800.00 2.25EUR FRANCE OAT 4%/05-25.10.2038 1,500,000 2,457,180.00 2.45EUR GAS NATURAL FENOSA FINANCE 2.875%/14-
11.03.20241,000,000 1,149,800.00 1.14
EUR GE CAPITAL EUROPEAN FUNDING 2.25%/13-20.07.2020
1,000,000 1,087,800.00 1.08
EUR GERMANY 1.5%/13-15.02.2023 2,000,000 2,229,200.00 2.21EUR GERMANY 1.5%/13-15.05.2023 1,000,000 1,116,300.00 1.11EUR GLAXOSMITHKLINE CAPITAL 1.375%/14-
02.12.20241,000,000 1,048,600.00 1.04
EUR GLENCORE FINANCE (EUROPE) 1.625%/14-18.01.2022
1,000,000 1,011,500.00 1.00
EUR GOLDMAN SACHS GROUP 2.5%/14-18.10.2021
1,500,000 1,638,300.00 1.62
EUR HSBC BANK 3.125%/10-15.11.2017 2,000,000 2,152,200.00 2.13EUR IBM 1.375%/12-19.11.2019 1,000,000 1,042,300.00 1.03EUR IMPERIAL TOBACCO FINANCE 2.25%/14-
26.02.20211,000,000 1,064,100.00 1.05
EUR INSTITUTO DE CREDITO OFICIAL (reg. -S-) S.312 4.375%/09-20.05.2019
1,500,000 1,735,350.00 1.72
EUR INSTITUTO DE CREDITO OFICIAL 4.125%/10-28.09.2017
1,000,000 1,094,700.00 1.08
EUR INSTITUTO DE CREDITO OFICIAL 6%/11-08.03.2021
1,000,000 1,298,900.00 1.29
EUR ITALY btp 2.15%/14-15.12.2021 1,500,000 1,623,045.00 1.61EUR ITALY BTP 3.5%/13-01.06.2018 2,000,000 2,197,200.00 2.18EUR ITALY BTP 3.75%/13-01.05.2021 1,500,000 1,756,350.00 1.74EUR ITALY BTP 4%/10-01.09.2020 2,000,000 2,351,000.00 2.34EUR ITALY BTP 4.25%/09-01.03.2020 1,500,000 1,762,650.00 1.75EUR ITALY BTP 4.25%/09-01.09.2019 1,500,000 1,743,150.00 1.73EUR ITALY 2.5%/14-01.12.2024 1,500,000 1,665,000.00 1.65EUR KOREA GAS 2.375%/13-15.04.2019 1,000,000 1,070,500.00 1.06EUR LUNAR FUNDING V SWISSCOM 1.875%14-
08.09.20211,000,000 1,064,300.00 1.05
EUR MCDONALD'S 2.625%/14-11.06.2029 1,000,000 1,163,110.00 1.15EUR MICROSOFT 2.625%/13-02.05.2033 1,000,000 1,228,100.00 1.22EUR NATIONAL AUSTRALIA BANK 1.875%/12-
13.01.20232,000,000 2,213,400.00 2.19
EUR NETHERLANDS 2.25%/12-15.07.2022 1,500,000 1,731,000.00 1.72EUR NOVARTIS FINANCE (reg. -S-) 1.625%/14-
09.11.2026850,000 919,326.00 0.91
EUR SAP 1.125%/14-20.02.2023 1,050,000 1,080,397.50 1.07EUR SAP 1.75%/14-22.02.2027 700,000 743,190.00 0.74EUR SBERBANK OF RUSSIA (reg. -S-) 3.3524%/14-
15.11.20191,000,000 893,750.00 0.89
EUR SCHAEFFLER FINANCE (reg -S-) 2.5%/15-15.05.2020
200,000 199,440.00 0.20
EUR SHELL INTERNATIONAL FINANCE 2.5%/14-24.03.2026
1,000,000 1,154,800.00 1.14
EUR SIEMENS FINANCIERING 2.875%/13-10.03.2028
1,000,000 1,212,700.00 1.20
EUR SPAIN 2.75%/14-31.10.2024 1,000,000 1,134,900.00 1.12EUR SPAIN 3.75%/12-31.10.2018 2,000,000 2,240,800.00 2.22EUR SPAIN 4%/10-30.04.2020 800,000 935,520.00 0.93EUR STATE GRID EUROPE DEVELOPMENT (reg. -S-)
1.5%/15-26.01.20221,500,000 1,524,150.00 1.51
EUR SUMITOMO MITSUI BANKING 2.25%/13-16.12.2020
1,000,000 1,083,600.00 1.07
EUR SYNGENTA FINANCE 1.875%/ 14-02.11.2021 1,000,000 1,073,900.00 1.06
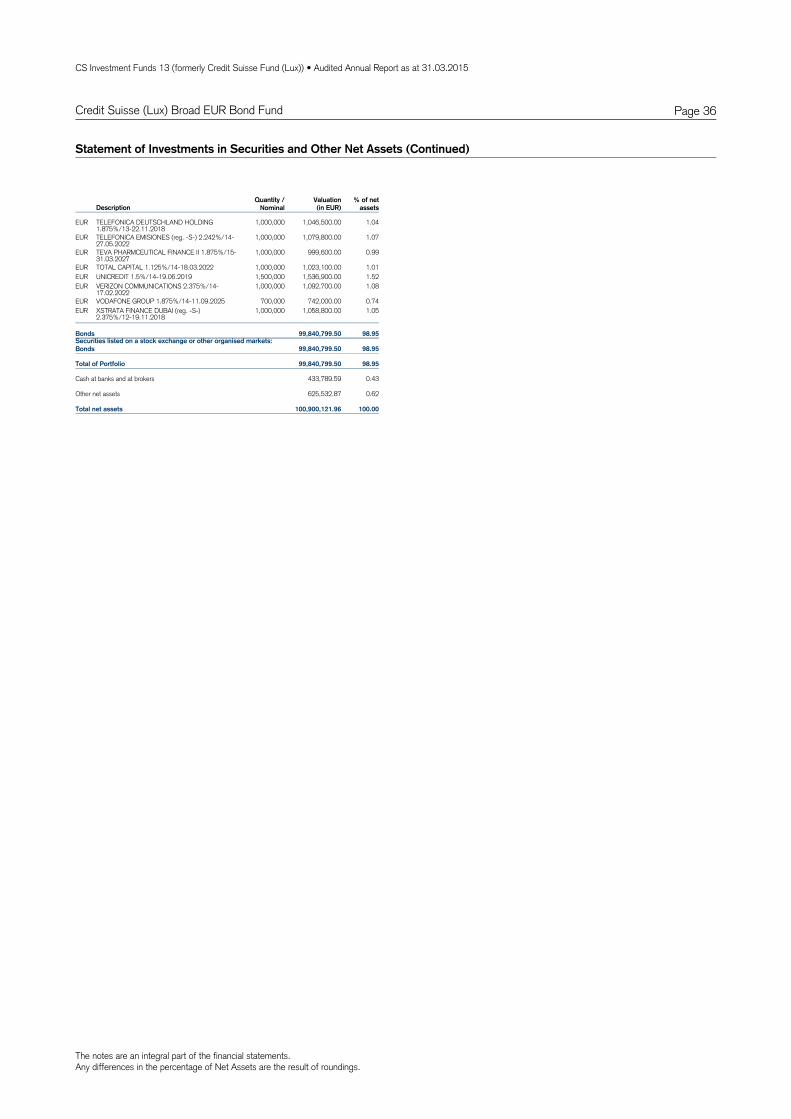
The notes are an integral part of the financial statements.Any differences in the percentage of Net Assets are the result of roundings.
CS Investment Funds 13 (formerly Credit Suisse Fund (Lux)) • Audited Annual Report as at 31.03.2015
Page 36Credit Suisse (Lux) Broad EUR Bond Fund
Statement of Investments in Securities and Other Net Assets (Continued)
DescriptionQuantity /
NominalValuation % of net
assets(in EUR)
EUR TELEFONICA DEUTSCHLAND HOLDING1.875%/13-22.11.2018
1,000,000 1,046,500.00 1.04
EUR TELEFONICA EMISIONES (reg. -S-) 2.242%/14-27.05.2022
1,000,000 1,079,800.00 1.07
EUR TEVA PHARMCEUTICAL FINANCE II 1.875%/15-31.03.2027
1,000,000 999,600.00 0.99
EUR TOTAL CAPITAL 1.125%/14-18.03.2022 1,000,000 1,023,100.00 1.01EUR UNICREDIT 1.5%/14-19.06.2019 1,500,000 1,536,900.00 1.52EUR VERIZON COMMUNICATIONS 2.375%/14-
17.02.20221,000,000 1,092,700.00 1.08
EUR VODAFONE GROUP 1.875%/14-11.09.2025 700,000 742,000.00 0.74EUR XSTRATA FINANCE DUBAI (reg. -S-)
2.375%/12-19.11.20181,000,000 1,058,800.00 1.05
Securities listed on a stock exchange or other organised markets:Bonds 99,840,799.50 98.95
Bonds 99,840,799.50 98.95
Total of Portfolio 99,840,799.50 98.95
Cash at banks and at brokers 433,789.59 0.43
Other net assets 625,532.87 0.62
Total net assets 100,900,121.96 100.00

CS Investment Funds 13 (formerly Credit Suisse Fund (Lux)) • Audited Annual Report as at 31.03.2015
Page 37Credit Suisse (Lux) Broad Short Term EUR Bond Fund
Technical Data and Notes
EURA 10948649 LU0480842656 0.40% 0.58%Distribution -
Valoren ISIN Management Fee Total Expense Ratio
EURB 10948813 LU0480842730 0.40% 0.58%Capitalisation - EUREB 11618388 LU0533764527 0.25% 0.39%Capitalisation - EURIB 13402083 LU0650599839 0.25% 0.42%Capitalisation - EURUA 26374796 LU1144404776 0.25% /Distribution - EURUB 26374797 LU1144404859 0.25% /Capitalisation - CZKBH 11546587 LU0527857667 0.40% 0.58%Capitalisation - CZKUBH 26374798 LU1144404933 0.25% /Capitalisation - HUFBH 11546591 LU0527858806 0.40% 0.57%Capitalisation - HUFUBH 26374800 LU1144405070 0.25% /Capitalisation - PLNBH 11546600 LU0527859101 0.40% 0.57%Capitalisation - PLNUBH 26374803 LU1144405153 0.25% /Capitalisation -
Technical Data
EURA 1.13% 3.56%1.61%/0.32%Distribution - 2013 2012YTD 2014Since Inception
EURB 1.12% 3.65%1.61%/0.32%Capitalisation - EUREB 1.31% 3.77%1.80%/0.37%Capitalisation - EURIB / //0.81%0.37%Capitalisation - EURUA / //-0.01%/Distribution - EURUB / //-0.01%/Capitalisation - CZKBH 0.94% 3.59%1.19%/0.23%Capitalisation - CZKUBH / //-0.10%/Capitalisation - HUFBH 4.62% 7.93%2.97%/0.59%Capitalisation - HUFUBH / //0.02%/Capitalisation - PLNBH 3.83% 7.38%3.74%/0.69%Capitalisation - PLNUBH / //0.05%/Capitalisation -
Fund Performance
For the period from 01.04.2014 to 31.03.2015, the Portfolio Turnover Rate was 18.05%.
As at 17.02.2015, Credit Suisse Fund (Lux) Bond Short Maturity EUR became Credit Suisse (Lux) Broad Short Term EUR Bond Fund. The unit-UA, the unit-UB, the unit-UBH in CZK, in HUF and PLN has been launched on 27.02.2015, the first NAV has been calculated on 02.03.2015. The units Rbecame BH and I became IB.No TER is calculated for units launched less than 6 months ago.
A Distribution- EUR 18.11.2014 1.75
Ex-Date Amount
Distributions
129,583,042HUF EUR -425,725 5,246.1117.06.2015Credit Suisse Zürich
185,158,472CZK EUR -6,797,011 -78,601.3717.06.2015Credit Suisse Zürich
SalesPurchases Valuation(in EUR)
MaturityCounterparty
Forward foreign exchange contracts

CS Investment Funds 13 (formerly Credit Suisse Fund (Lux)) • Audited Annual Report as at 31.03.2015
Page 38Credit Suisse (Lux) Broad Short Term EUR Bond Fund
Technical Data and Notes
19,712,986PLN EUR -4,759,153 64,384.5417.06.2015Credit Suisse Zürich
96,684EUR PLN -402,414 -1,788.3117.06.2015Credit Suisse Zürich
81,874EUR CZK -2,250,010 233.1017.06.2015Credit Suisse Zürich
-10,525.93Net unrealised loss on forward foreign exchange contracts
SalesPurchases Valuation(in EUR)
MaturityCounterparty
Forward foreign exchange contracts
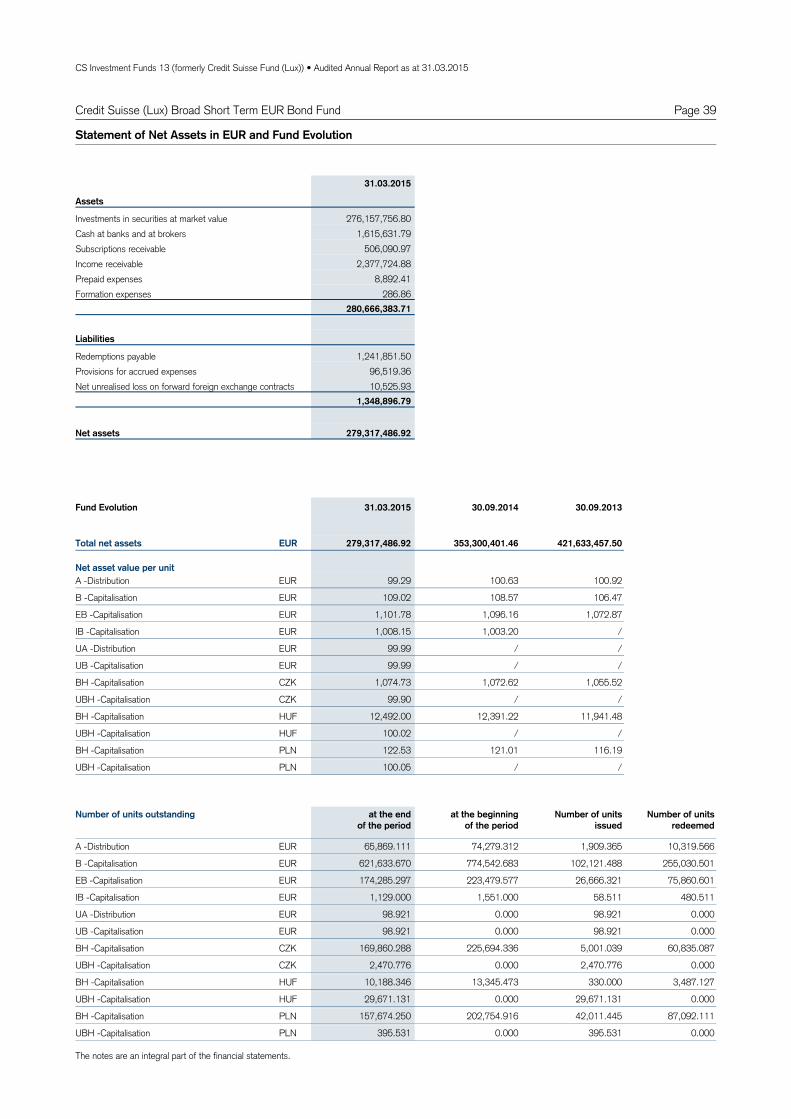
CS Investment Funds 13 (formerly Credit Suisse Fund (Lux)) • Audited Annual Report as at 31.03.2015
Page 39
Assets
Investments in securities at market value 276,157,756.80Cash at banks and at brokers 1,615,631.79Subscriptions receivable 506,090.97Income receivable 2,377,724.88Prepaid expenses 8,892.41Formation expenses 286.86
280,666,383.71
Liabilities
Redemptions payable 1,241,851.50Provisions for accrued expenses 96,519.36Net unrealised loss on forward foreign exchange contracts 10,525.93
1,348,896.79
279,317,486.92Net assets
Statement of Net Assets in EUR and Fund Evolution
31.03.2015
99.29 100.92EURA 100.63Distribution -
109.02 106.47EURB 108.57Capitalisation -
1,101.78 1,072.87EUREB 1,096.16Capitalisation -
1,008.15 /EURIB 1,003.20Capitalisation -
99.99 /EURUA /Distribution -
99.99 /EURUB /Capitalisation -
1,074.73 1,055.52CZKBH 1,072.62Capitalisation -
99.90 /CZKUBH /Capitalisation -
12,492.00 11,941.48HUFBH 12,391.22Capitalisation -
100.02 /HUFUBH /Capitalisation -
122.53 116.19PLNBH 121.01Capitalisation -
100.05 /PLNUBH /Capitalisation -
Total net assets
Net asset value per unit
279,317,486.92 353,300,401.46 421,633,457.50EUR
Fund Evolution 31.03.2015 30.09.2014 30.09.2013
65,869.111 1,909.365A 74,279.312 10,319.566Distribution - EUR
621,633.670 102,121.488B 774,542.683 255,030.501Capitalisation - EUR
174,285.297 26,666.321EB 223,479.577 75,860.601Capitalisation - EUR
1,129.000 58.511IB 1,551.000 480.511Capitalisation - EUR
98.921 98.921UA 0.000 0.000Distribution - EUR
98.921 98.921UB 0.000 0.000Capitalisation - EUR
169,860.288 5,001.039BH 225,694.336 60,835.087Capitalisation - CZK
2,470.776 2,470.776UBH 0.000 0.000Capitalisation - CZK
10,188.346 330.000BH 13,345.473 3,487.127Capitalisation - HUF
29,671.131 29,671.131UBH 0.000 0.000Capitalisation - HUF
157,674.250 42,011.445BH 202,754.916 87,092.111Capitalisation - PLN
395.531 395.531UBH 0.000 0.000Capitalisation - PLN
Number of units outstanding at the endof the period
at the beginningof the period
Number of units issued
Number of units redeemed
Credit Suisse (Lux) Broad Short Term EUR Bond Fund
The notes are an integral part of the financial statements.

CS Investment Funds 13 (formerly Credit Suisse Fund (Lux)) • Audited Annual Report as at 31.03.2015
Page 40Credit Suisse (Lux) Broad Short Term EUR Bond Fund
Net assets at the beginning of the period 353,300,401.46
Income
Interest on investments in securities (net) 3,192,404.60Bank interest 60.17Securities lending income 14,904.11
3,207,368.88
Expenses
Management fee 473,110.84Custodian and safe custody fees 64,309.52Administration expenses 67,578.91Printing and publication expenses 13,414.40Audit, control, legal, representative bank and other expenses 67,642.78"Taxe d'abonnement" 33,829.86Amortisation of formation expenses 1,177.40
721,063.71
Net income (loss) 2,486,305.17
Realised gain (loss)
Net realised gain (loss) on sales of investments -373,964.83Net realised gain (loss) on forward foreign exchange contracts 175,968.79Net realised gain (loss) on foreign exchange 16,095.38
-181,900.66
Net realised gain (loss) 2,304,404.51
Change in net unrealised appreciation (depreciation)
Change in net unrealised appreciation (depreciation) on investments -607,649.05Change in net unrealised appreciation (depreciation) on forward foreign exchange contracts -67,108.22
-674,757.27
Net increase (decrease) in net assets as a result of operations 1,629,647.24
Subscriptions / Redemptions
Subscriptions 42,097,033.10Redemptions -117,585,264.57
-75,488,231.47
Distribution -124,330.31
Net assets at the end of the period 279,317,486.92
Statement of Operations / Changes in Net Assets in EUR
For the period from01.10.2014 to
31.03.2015
The notes are an integral part of the financial statements.
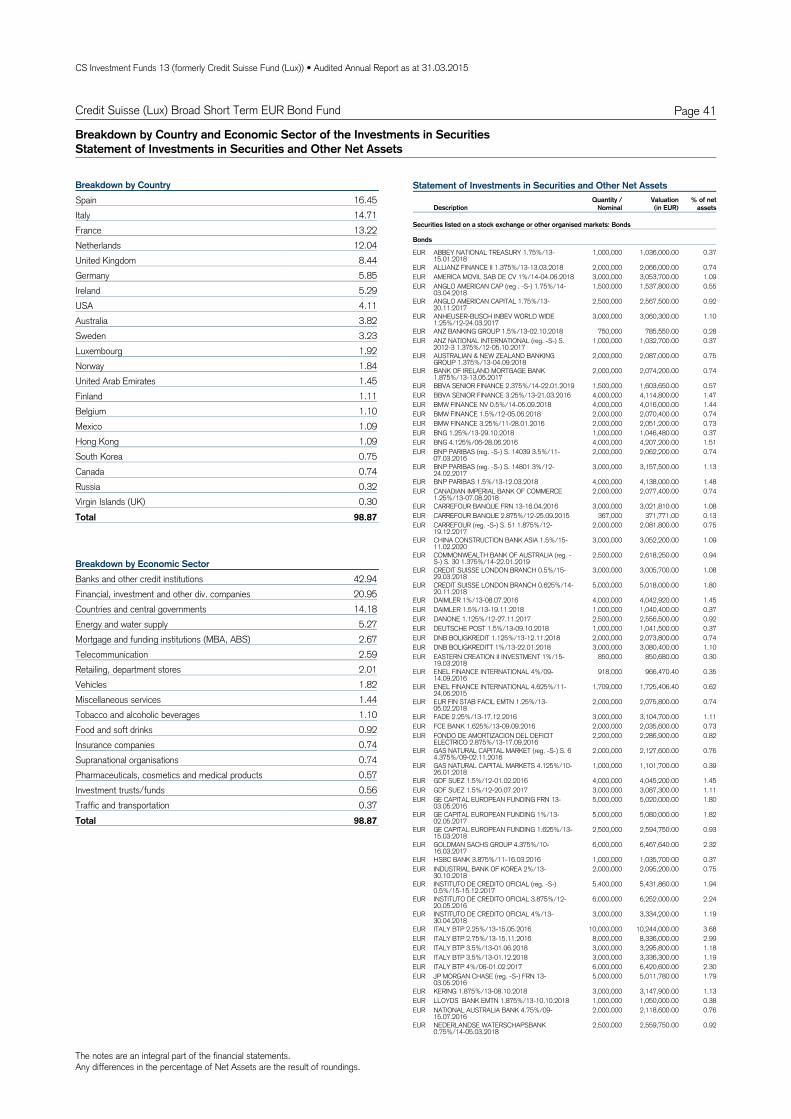
The notes are an integral part of the financial statements.Any differences in the percentage of Net Assets are the result of roundings.
CS Investment Funds 13 (formerly Credit Suisse Fund (Lux)) • Audited Annual Report as at 31.03.2015
Page 41Credit Suisse (Lux) Broad Short Term EUR Bond Fund
Breakdown by Country and Economic Sector of the Investments in SecuritiesStatement of Investments in Securities and Other Net Assets
16.45SpainBreakdown by Country
14.71Italy13.22France12.04Netherlands8.44United Kingdom5.85Germany5.29Ireland4.11USA3.82Australia3.23Sweden1.92Luxembourg1.84Norway1.45United Arab Emirates1.11Finland1.10Belgium1.09Mexico1.09Hong Kong0.75South Korea0.74Canada0.32Russia0.30Virgin Islands (UK)
98.87Total
42.94Banks and other credit institutionsBreakdown by Economic Sector
20.95Financial, investment and other div. companies14.18Countries and central governments5.27Energy and water supply2.67Mortgage and funding institutions (MBA, ABS)2.59Telecommunication2.01Retailing, department stores1.82Vehicles1.44Miscellaneous services1.10Tobacco and alcoholic beverages0.92Food and soft drinks0.74Insurance companies0.74Supranational organisations0.57Pharmaceuticals, cosmetics and medical products0.56Investment trusts/funds0.37Traffic and transportation
98.87Total
Statement of Investments in Securities and Other Net Assets
DescriptionQuantity /
NominalValuation % of net
assets(in EUR)
Securities listed on a stock exchange or other organised markets: Bonds
Bonds
EUR ABBEY NATIONAL TREASURY 1.75%/13-15.01.2018
1,000,000 1,036,000.00 0.37
EUR ALLIANZ FINANCE II 1.375%/13-13.03.2018 2,000,000 2,066,000.00 0.74EUR AMERICA MOVIL SAB DE CV 1%/14-04.06.2018 3,000,000 3,053,700.00 1.09EUR ANGLO AMERICAN CAP (reg . -S-) 1.75%/14-
03.04.20181,500,000 1,537,800.00 0.55
EUR ANGLO AMERICAN CAPITAL 1.75%/13-20.11.2017
2,500,000 2,567,500.00 0.92
EUR ANHEUSER-BUSCH INBEV WORLD WIDE1.25%/12-24.03.2017
3,000,000 3,060,300.00 1.10
EUR ANZ BANKING GROUP 1.5%/13-02.10.2018 750,000 785,550.00 0.28EUR ANZ NATIONAL INTERNATIONAL (reg. -S-) S.
2012-3 1.375%/12-05.10.20171,000,000 1,032,700.00 0.37
EUR AUSTRALIAN & NEW ZEALAND BANKINGGROUP 1.375%/13-04.09.2018
2,000,000 2,087,000.00 0.75
EUR BANK OF IRELAND MORTGAGE BANK1.875%/13-13.05.2017
2,000,000 2,074,200.00 0.74
EUR BBVA SENIOR FINANCE 2.375%/14-22.01.2019 1,500,000 1,603,650.00 0.57EUR BBVA SENIOR FINANCE 3.25%/13-21.03.2016 4,000,000 4,114,800.00 1.47EUR BMW FINANCE NV 0.5%/14-05.09.2018 4,000,000 4,016,000.00 1.44EUR BMW FINANCE 1.5%/12-05.06.2018 2,000,000 2,070,400.00 0.74EUR BMW FINANCE 3.25%/11-28.01.2016 2,000,000 2,051,200.00 0.73EUR BNG 1.25%/13-29.10.2018 1,000,000 1,046,480.00 0.37EUR BNG 4.125%/06-28.06.2016 4,000,000 4,207,200.00 1.51EUR BNP PARIBAS (reg. -S-) S. 14039 3.5%/11-
07.03.20162,000,000 2,062,200.00 0.74
EUR BNP PARIBAS (reg. -S-) S. 14801 3%/12-24.02.2017
3,000,000 3,157,500.00 1.13
EUR BNP PARIBAS 1.5%/13-12.03.2018 4,000,000 4,138,000.00 1.48EUR CANADIAN IMPERIAL BANK OF COMMERCE
1.25%/13-07.08.20182,000,000 2,077,400.00 0.74
EUR CARREFOUR BANQUE FRN 13-16.04.2016 3,000,000 3,021,810.00 1.08EUR CARREFOUR BANQUE 2.875%/12-25.09.2015 367,000 371,771.00 0.13EUR CARREFOUR (reg. -S-) S. 51 1.875%/12-
19.12.20172,000,000 2,081,800.00 0.75
EUR CHINA CONSTRUCTION BANK ASIA 1.5%/15-11.02.2020
3,000,000 3,052,200.00 1.09
EUR COMMONWEALTH BANK OF AUSTRALIA (reg. -S-) S. 30 1.375%/14-22.01.2019
2,500,000 2,618,250.00 0.94
EUR CREDIT SUISSE LONDON BRANCH 0.5%/15-29.03.2018
3,000,000 3,005,700.00 1.08
EUR CREDIT SUISSE LONDON BRANCH 0.625%/14-20.11.2018
5,000,000 5,018,000.00 1.80
EUR DAIMLER 1%/13-08.07.2016 4,000,000 4,042,920.00 1.45EUR DAIMLER 1.5%/13-19.11.2018 1,000,000 1,040,400.00 0.37EUR DANONE 1.125%/12-27.11.2017 2,500,000 2,556,500.00 0.92EUR DEUTSCHE POST 1.5%/13-09.10.2018 1,000,000 1,041,500.00 0.37EUR DNB BOLIGKREDIT 1.125%/13-12.11.2018 2,000,000 2,073,800.00 0.74EUR DNB BOLIGKREDITT 1%/13-22.01.2018 3,000,000 3,080,400.00 1.10EUR EASTERN CREATION II INVESTMENT 1%/15-
19.03.2018850,000 850,680.00 0.30
EUR ENEL FINANCE INTERNATIONAL 4%/09-14.09.2016
918,000 966,470.40 0.35
EUR ENEL FINANCE INTERNATIONAL 4.625%/11-24.06.2015
1,709,000 1,725,406.40 0.62
EUR EUR FIN STAB FACIL EMTN 1.25%/13-05.02.2018
2,000,000 2,075,800.00 0.74
EUR FADE 2.25%/13-17.12.2016 3,000,000 3,104,700.00 1.11EUR FCE BANK 1.625%/13-09.09.2016 2,000,000 2,035,600.00 0.73EUR FONDO DE AMORTIZACION DEL DEFICIT
ELECTRICO 2.875%/13-17.09.20162,200,000 2,286,900.00 0.82
EUR GAS NATURAL CAPITAL MARKET (reg. -S-) S. 64.375%/09-02.11.2016
2,000,000 2,127,600.00 0.76
EUR GAS NATURAL CAPITAL MARKETS 4.125%/10-26.01.2018
1,000,000 1,101,700.00 0.39
EUR GDF SUEZ 1.5%/12-01.02.2016 4,000,000 4,045,200.00 1.45EUR GDF SUEZ 1.5%/12-20.07.2017 3,000,000 3,087,300.00 1.11EUR GE CAPITAL EUROPEAN FUNDING FRN 13-
03.05.20165,000,000 5,020,000.00 1.80
EUR GE CAPITAL EUROPEAN FUNDING 1%/13-02.05.2017
5,000,000 5,080,000.00 1.82
EUR GE CAPITAL EUROPEAN FUNDING 1.625%/13-15.03.2018
2,500,000 2,594,750.00 0.93
EUR GOLDMAN SACHS GROUP 4.375%/10-16.03.2017
6,000,000 6,467,640.00 2.32
EUR HSBC BANK 3.875%/11-16.03.2016 1,000,000 1,035,700.00 0.37EUR INDUSTRIAL BANK OF KOREA 2%/13-
30.10.20182,000,000 2,095,200.00 0.75
EUR INSTITUTO DE CREDITO OFICIAL (reg. -S-)0.5%/15-15.12.2017
5,400,000 5,431,860.00 1.94
EUR INSTITUTO DE CREDITO OFICIAL 3.875%/12-20.05.2016
6,000,000 6,252,000.00 2.24
EUR INSTITUTO DE CREDITO OFICIAL 4%/13-30.04.2018
3,000,000 3,334,200.00 1.19
EUR ITALY BTP 2.25%/13-15.05.2016 10,000,000 10,244,000.00 3.68EUR ITALY BTP 2.75%/13-15.11.2016 8,000,000 8,336,000.00 2.99EUR ITALY BTP 3.5%/13-01.06.2018 3,000,000 3,295,800.00 1.18EUR ITALY BTP 3.5%/13-01.12.2018 3,000,000 3,336,300.00 1.19EUR ITALY BTP 4%/06-01.02.2017 6,000,000 6,420,600.00 2.30EUR JP MORGAN CHASE (reg. -S-) FRN 13-
03.05.20165,000,000 5,011,780.00 1.79
EUR KERING 1.875%/13-08.10.2018 3,000,000 3,147,900.00 1.13EUR LLOYDS BANK EMTN 1.875%/13-10.10.2018 1,000,000 1,050,000.00 0.38EUR NATIONAL AUSTRALIA BANK 4.75%/09-
15.07.20162,000,000 2,118,600.00 0.76
EUR NEDERLANDSE WATERSCHAPSBANK0.75%/14-05.03.2018
2,500,000 2,559,750.00 0.92

The notes are an integral part of the financial statements.Any differences in the percentage of Net Assets are the result of roundings.
CS Investment Funds 13 (formerly Credit Suisse Fund (Lux)) • Audited Annual Report as at 31.03.2015
Page 42Credit Suisse (Lux) Broad Short Term EUR Bond Fund
Statement of Investments in Securities and Other Net Assets (Continued)
DescriptionQuantity /
NominalValuation % of net
assets(in EUR)
EUR NORDEA BANK FINLAND 2.375%/11-02.09.2016
2,000,000 2,067,940.00 0.74
EUR NORDEA BANK (reg. -S-) S. 222 2.25%/12-05.10.2017
2,000,000 2,101,200.00 0.75
EUR NORDEA BANK 1.375%/13-12.04.2018 1,200,000 1,239,720.00 0.44EUR ORANGE 1.875%/13-03.09.2018 2,000,000 2,099,000.00 0.75EUR POHJOLA BANK 1.75%/13-29.08.2018 1,000,000 1,046,900.00 0.37EUR RABOBANK NEDERLAND 1.75%/14-22.01.2019 3,000,000 3,153,300.00 1.13EUR RABOBANK (reg. -S-) S. 2207A 3.375%/10-
21.04.20174,500,000 4,790,250.00 1.71
EUR RABOBANK S. 2407A 3.875%/11-20.04.2016 2,000,000 2,078,000.00 0.74EUR ROCHE FINANCE HOLDINGS 2%/12-
25.06.20181,500,000 1,584,750.00 0.57
EUR ROYAL BANK OF SCOTLAND GROUP 1.5%/13-28.11.2016
2,045,000 2,078,129.00 0.74
EUR SANTANDER CONSUMER FINANCE 1.45%/14-29.01.2016
1,500,000 1,514,400.00 0.54
EUR SANTANDER INTERNATIONAL DEBT1.375%/14-25.03.2017
5,000,000 5,098,000.00 1.83
EUR SANTANDER INTERNATIONAL DEBT4.625%/12-21.03.2016
2,000,000 2,083,000.00 0.75
EUR SBERBANK OF RUSSIA (reg. -S-) 3.3524%/14-15.11.2019
1,000,000 893,750.00 0.32
EUR SNAM 2.375%/13-30.06.2017 4,650,000 4,852,740.00 1.74EUR SOCIETE GENERALE SFH 1%/12-19.12.2017 1,000,000 1,026,700.00 0.37EUR SOCIETE GENERALE 3.25%/11-06.06.2016 2,000,000 2,076,200.00 0.74EUR SPAIN 2.1%/13-30.04.2017 3,000,000 3,122,340.00 1.12EUR SPAIN 3.3%/13-30.07.2016 3,000,000 3,131,100.00 1.12EUR SPAIN 3.75%/12-31.10.2018 1,500,000 1,680,600.00 0.60EUR STADSHYPOTEK (reg. -S-) S. 41 1.875%/12-
21.03.20171,500,000 1,555,050.00 0.56
EUR STADSHYPOTEK (reg. -S-) 1%/13-19.06.2018 3,000,000 3,090,900.00 1.11EUR STANDARD CHARTERED (reg. -S-) S. 69
3.875%/11-20.10.20162,000,000 2,111,800.00 0.76
EUR STANDARD CHARTERED 1.75%/12-29.10.2017 1,000,000 1,036,100.00 0.37EUR SWEDISH EXPORT CREDIT S. 5502 1.125%/13-
20.11.20181,000,000 1,039,200.00 0.37
EUR TELEFONICA DEUTSCHLAND HOLDING1.875%/13-22.11.2018
2,000,000 2,093,000.00 0.75
EUR UNEDIC 0.375%/13-29.04.2016 4,000,000 4,019,200.00 1.44EUR UNICREDIT 2.25%/13-16.12.2016 1,500,000 1,542,765.00 0.55EUR UNICREDITO ITALIANO FRN 13-22.01.2016 3,000,000 3,026,790.00 1.08EUR VOLKSWAGEN INTERNATIONAL FINANCE
1%/13-26.10.20163,000,000 3,036,000.00 1.09
EUR VOLKSWAGEN LEASING 1%/14-04.10.2017 8,000,000 8,133,600.00 2.91EUR WESTPAC BANKING S. 2012-C5 2.125%/12-
16.02.20163,000,000 3,053,700.00 1.09
EUR XSTRATA FINANCE DUBAI (reg. -S-) STEP UP12-19.05.2016
4,000,000 4,055,600.00 1.45
Securities listed on a stock exchange or other organised markets:Bonds 274,601,791.80 98.31
Bonds 274,601,791.80 98.31
Securities listed on a stock exchange or other organised markets: Investment funds
Fund units (Open-End)
EUR CS INVESTMENT FUNDS 1 SICAV - CREDITSUISSE (LUX) ABSOLUTE RETURN BOND FUND-IBH- EUR
1,500 1,555,965.00 0.56
Securities listed on a stock exchange or other organised markets:Investment funds 1,555,965.00 0.56
Fund units (Open-End) 1,555,965.00 0.56
Total of Portfolio 276,157,756.80 98.87
Cash at banks and at brokers 1,615,631.79 0.58
Other net assets 1,544,098.33 0.55
Total net assets 279,317,486.92 100.00
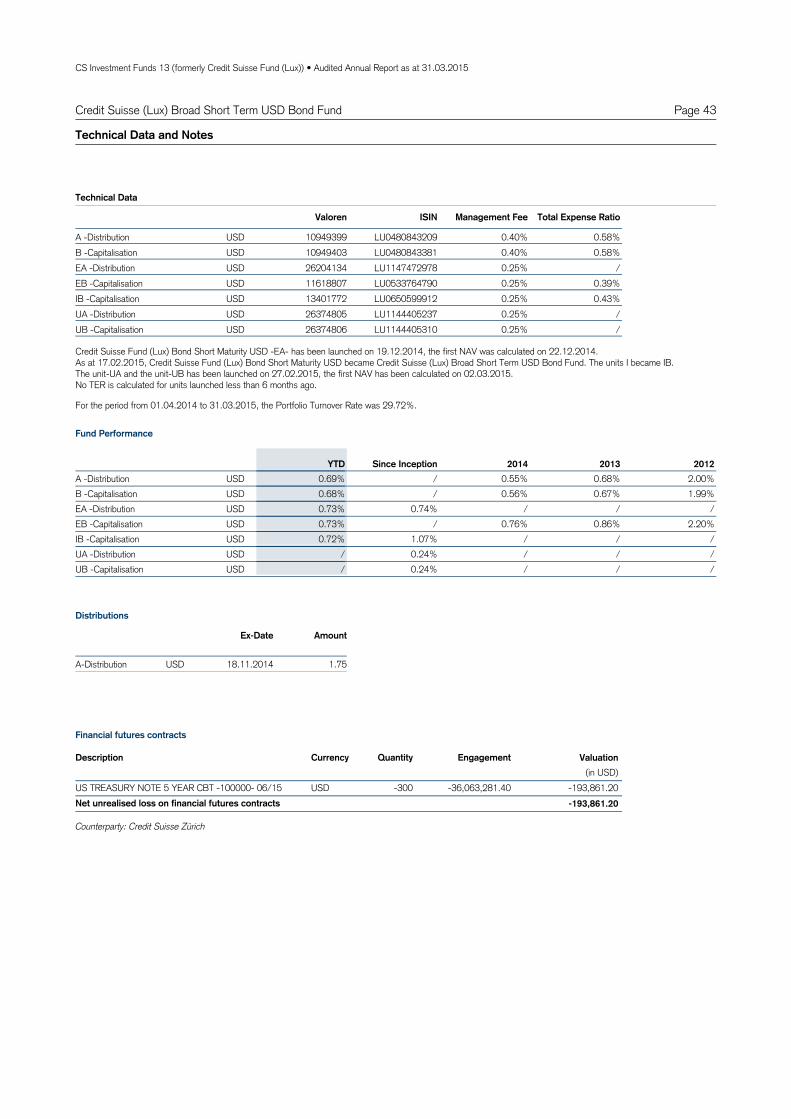
CS Investment Funds 13 (formerly Credit Suisse Fund (Lux)) • Audited Annual Report as at 31.03.2015
Page 43Credit Suisse (Lux) Broad Short Term USD Bond Fund
Technical Data and Notes
USDA 10949399 LU0480843209 0.40% 0.58%Distribution -
Valoren ISIN Management Fee Total Expense Ratio
USDB 10949403 LU0480843381 0.40% 0.58%Capitalisation - USDEA 26204134 LU1147472978 0.25% /Distribution - USDEB 11618807 LU0533764790 0.25% 0.39%Capitalisation - USDIB 13401772 LU0650599912 0.25% 0.43%Capitalisation - USDUA 26374805 LU1144405237 0.25% /Distribution - USDUB 26374806 LU1144405310 0.25% /Capitalisation -
Technical Data
USDA 0.68% 2.00%0.55%/0.69%Distribution - 2013 2012YTD 2014Since Inception
USDB 0.67% 1.99%0.56%/0.68%Capitalisation - USDEA / //0.74%0.73%Distribution - USDEB 0.86% 2.20%0.76%/0.73%Capitalisation - USDIB / //1.07%0.72%Capitalisation - USDUA / //0.24%/Distribution - USDUB / //0.24%/Capitalisation -
Fund Performance
For the period from 01.04.2014 to 31.03.2015, the Portfolio Turnover Rate was 29.72%.
Credit Suisse Fund (Lux) Bond Short Maturity USD -EA- has been launched on 19.12.2014, the first NAV was calculated on 22.12.2014.As at 17.02.2015, Credit Suisse Fund (Lux) Bond Short Maturity USD became Credit Suisse (Lux) Broad Short Term USD Bond Fund. The units I became IB.The unit-UA and the unit-UB has been launched on 27.02.2015, the first NAV has been calculated on 02.03.2015.No TER is calculated for units launched less than 6 months ago.
A Distribution- USD 18.11.2014 1.75
Ex-Date Amount
Distributions
USDUS TREASURY NOTE 5 YEAR CBT -100000- 06/15 -300 -36,063,281.40 -193,861.20-193,861.20Net unrealised loss on financial futures contracts
Quantity EngagementDescription Currency Valuation(in USD)
Counterparty: Credit Suisse Zürich
Financial futures contracts
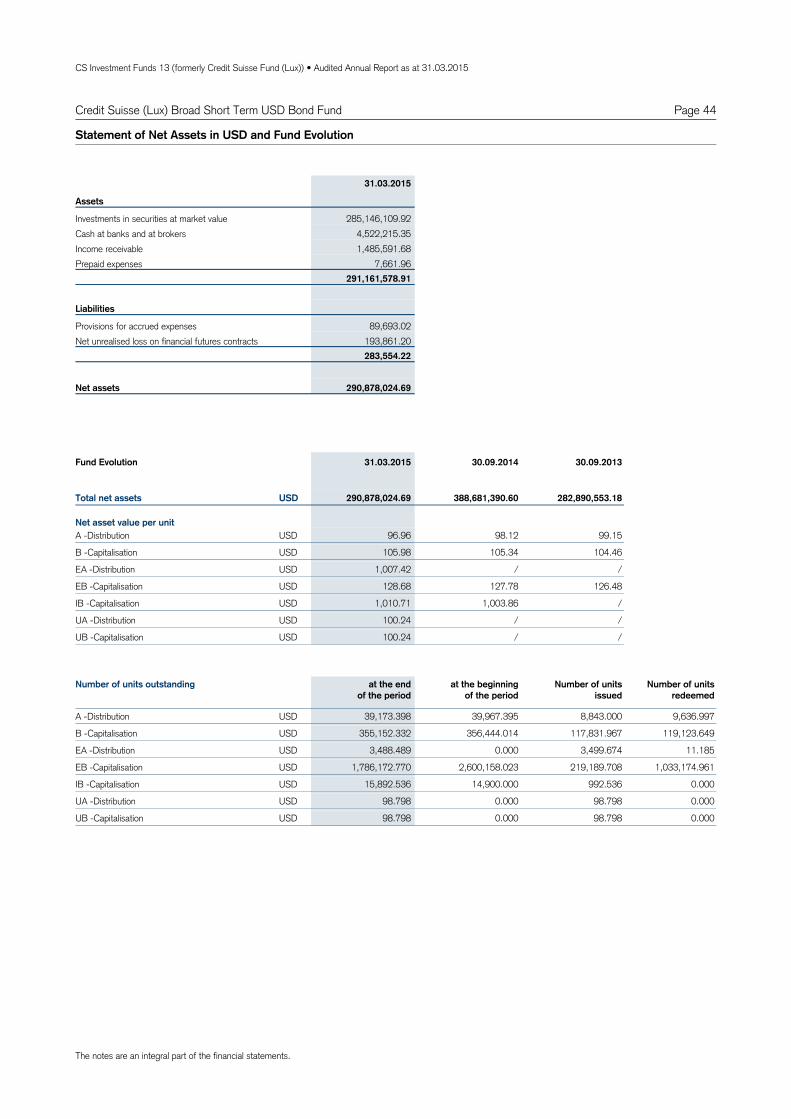
CS Investment Funds 13 (formerly Credit Suisse Fund (Lux)) • Audited Annual Report as at 31.03.2015
Page 44
Assets
Investments in securities at market value 285,146,109.92Cash at banks and at brokers 4,522,215.35Income receivable 1,485,591.68Prepaid expenses 7,661.96
291,161,578.91
Liabilities
Provisions for accrued expenses 89,693.02Net unrealised loss on financial futures contracts 193,861.20
283,554.22
290,878,024.69Net assets
Statement of Net Assets in USD and Fund Evolution
31.03.2015
96.96 99.15USDA 98.12Distribution -
105.98 104.46USDB 105.34Capitalisation -
1,007.42 /USDEA /Distribution -
128.68 126.48USDEB 127.78Capitalisation -
1,010.71 /USDIB 1,003.86Capitalisation -
100.24 /USDUA /Distribution -
100.24 /USDUB /Capitalisation -
Total net assets
Net asset value per unit
290,878,024.69 388,681,390.60 282,890,553.18USD
Fund Evolution 31.03.2015 30.09.2014 30.09.2013
39,173.398 8,843.000A 39,967.395 9,636.997Distribution - USD
355,152.332 117,831.967B 356,444.014 119,123.649Capitalisation - USD
3,488.489 3,499.674EA 0.000 11.185Distribution - USD
1,786,172.770 219,189.708EB 2,600,158.023 1,033,174.961Capitalisation - USD
15,892.536 992.536IB 14,900.000 0.000Capitalisation - USD
98.798 98.798UA 0.000 0.000Distribution - USD
98.798 98.798UB 0.000 0.000Capitalisation - USD
Number of units outstanding at the endof the period
at the beginningof the period
Number of units issued
Number of units redeemed
Credit Suisse (Lux) Broad Short Term USD Bond Fund
The notes are an integral part of the financial statements.

CS Investment Funds 13 (formerly Credit Suisse Fund (Lux)) • Audited Annual Report as at 31.03.2015
Page 45Credit Suisse (Lux) Broad Short Term USD Bond Fund
Net assets at the beginning of the period 388,681,390.60
Income
Interest on investments in securities (net) 3,784,774.56Bank interest 2,160.20Securities lending income 38,599.34
3,825,534.10
Expenses
Management fee 462,060.70Custodian and safe custody fees 69,518.58Administration expenses 74,965.01Printing and publication expenses 14,556.26Audit, control, legal, representative bank and other expenses 73,301.47"Taxe d'abonnement" 26,896.59
721,298.61
Net income (loss) 3,104,235.49
Realised gain (loss)
Net realised gain (loss) on sales of investments -1,181,129.41Net realised gain (loss) on financial futures contracts -942,754.00
-2,123,883.41
Net realised gain (loss) 980,352.08
Change in net unrealised appreciation (depreciation)
Change in net unrealised appreciation (depreciation) on investments 1,717,138.95Change in net unrealised appreciation (depreciation) on financial futures contracts -362,611.16
1,354,527.79
Net increase (decrease) in net assets as a result of operations 2,334,879.87
Subscriptions / Redemptions
Subscriptions 45,946,652.11Redemptions -146,005,998.92
-100,059,346.81
Distribution -78,898.97
Net assets at the end of the period 290,878,024.69
Statement of Operations / Changes in Net Assets in USD
For the period from01.10.2014 to
31.03.2015
The notes are an integral part of the financial statements.

The notes are an integral part of the financial statements.Any differences in the percentage of Net Assets are the result of roundings.
CS Investment Funds 13 (formerly Credit Suisse Fund (Lux)) • Audited Annual Report as at 31.03.2015
Page 46Credit Suisse (Lux) Broad Short Term USD Bond Fund
Breakdown by Country and Economic Sector of the Investments in SecuritiesStatement of Investments in Securities and Other Net Assets
45.87USABreakdown by Country
7.08France6.60Canada5.99Netherlands4.96United Kingdom3.95Japan3.90Cayman Islands2.77Australia2.63Sweden2.42Philippines1.73Denmark1.39Virgin Islands (UK)1.35Mexico1.05New Zealand1.03International organisations0.97Germany0.73Kazakhstan0.72South Korea0.69Luxembourg0.69Turkey0.43South Africa0.34Norway0.30United Arab Emirates0.26People's Republic of China0.18Singapore
98.03Total
29.50Banks and other credit institutionsBreakdown by Economic Sector
20.78Financial, investment and other div. companies7.67Telecommunication5.18Supranational organisations5.03Pharmaceuticals, cosmetics and medical products4.02Petroleum2.75Mortgage and funding institutions (MBA, ABS)2.41Graphics publishing and printing media2.25Public non profit institutions2.16Retailing, department stores1.77Vehicles1.72Food and soft drinks1.61Miscellaneous services1.55Countries and central governments1.07Rubber and tires1.04Miscellaneous trading companies1.04Computer hardware and networking1.03Cantons, federal states, provinces0.97Chemicals0.87Precious metals and precious stones0.75Energy and water supply0.69Tobacco and alcoholic beverages0.68Mining, coal and steel industry0.36Insurance companies0.35Electrical appliances and components0.35Internet, software and IT services0.26Textiles, garments and leather goods
0.17Miscellaneous consumer goods98.03Total

The notes are an integral part of the financial statements.Any differences in the percentage of Net Assets are the result of roundings.
CS Investment Funds 13 (formerly Credit Suisse Fund (Lux)) • Audited Annual Report as at 31.03.2015
Page 47Credit Suisse (Lux) Broad Short Term USD Bond Fund
Breakdown by Country and Economic Sector of the Investments in SecuritiesStatement of Investments in Securities and Other Net Assets
Statement of Investments in Securities and Other Net Assets
DescriptionQuantity /
NominalValuation % of net
assets(in USD)
Securities listed on a stock exchange or other organised markets: Bonds
Bonds
USD ABN AMRO BANK (reg. -S-) 2.5%/13-30.10.2018
1,000,000 1,020,300.00 0.35
USD ABN AMRO (reg. -S-) 4.25%/12-02.02.2017 3,000,000 3,155,880.00 1.08USD ADCB ISLAMIC FINANCE (CAYMAN) FRN 13-
09.01.20174,000,000 4,033,960.00 1.39
USD AIR LEASE 2.125%/14-15.01.2018 3,000,000 2,975,400.00 1.02USD ALIBABA GROUP HOLDING (reg. -S-)
1.625%/14-28.11.2017450,000 450,895.50 0.16
USD ALIBABA GROUP HOLDING (reg. -S-) 2.5%/14-28.11.2019
1,250,000 1,248,412.50 0.43
USD AMAZON.COM 1.2%/12-29.11.2017 1,500,000 1,494,600.00 0.51USD AMERICA MOVIL FRN 13-12.09.2016 1,875,000 1,886,362.50 0.65USD AMERICA MOVIL 2.375%/11-08.09.2016 2,000,000 2,035,645.20 0.70USD AMERICAN EXPRESS S. -D- T. 76 2.375%/12-
24.03.20171,000,000 1,028,401.30 0.35
USD AMERICAN HONDA FINANCE (reg. -S-)1.5%/12-11.09.2017
200,000 201,260.00 0.07
USD AMERICAN HONDA FINANCE (reg. -S-)1.6%/13-16.02.2018
800,000 805,360.00 0.28
USD ANGLO AMERICAN (reg. -S-) 2.625%/12-03.04.2017
500,000 510,287.38 0.18
USD ANZ BANKING GROUP 1.875%/12-06.10.2017 250,000 253,387.50 0.09USD ANZ NEW ZEALAND (reg. -S-) T. 17 1.4%/14-
27.04.20173,050,000 3,055,490.00 1.05
USD APPLE 1%/13-03.05.2018 1,000,000 991,600.00 0.34USD ASIAN DEVELOPMENT BANK 1.1255%/12-
15.03.20177,000,000 7,058,800.00 2.42
USD AT&T 1.4%/12-01.12.2017 1,500,000 1,488,000.00 0.51USD AT&T 2.4%/11-15.08.2016 1,000,000 1,017,620.00 0.35USD AT&T 2.95%/11-15.05.2016 2,500,000 2,551,500.00 0.88USD BANK NEDERLANDSE GEMEENTEN (reg. -S-)
0.625%/14-18.07.20162,000,000 2,001,800.00 0.69
USD BANK OF AMERICA S. L 3.875%/12-22.03.2017 1,000,000 1,046,080.00 0.36USD BANK OF AMERICA 2%/13-11.01.2018 3,000,000 3,025,290.00 1.04USD BANK OF MONTREAL S. B T. 169 1.4%/12-
11.09.2017800,000 802,560.00 0.28
USD BANK OF TOKYO-MITSUBISHI UF (reg. -S-)1.45%/14-08.09.2017
2,000,000 1,990,800.00 0.68
USD BARRICK GOLD 2.9%/11-30.05.2016 2,500,000 2,533,853.88 0.87USD BAT INTERNATIONAL FINANCE (reg. -S-)
2.125%/12-07.06.2017350,000 355,345.10 0.12
USD BAYER US (reg. -S-) 1.5%/14-06.10.2017 3,000,000 3,017,700.00 1.04USD BAYER US (reg -S-) 2.375%/14-08.10.2019 3,000,000 3,046,800.00 1.05USD BFCM (reg.-S-) 1.7%/14-20.01.2017 2,000,000 2,016,161.90 0.69USD BNG 5.125%/06-05.10.2016 6,000,000 6,401,580.00 2.19USD BNP PARIBAS T. 893 2.375%/12-14.09.2017 2,000,000 2,039,420.00 0.70USD BP CAPITAL MARKETS 1.375%/13-10.05.2018 500,000 496,750.00 0.17USD BRITISH SKY BROADCASTING GROUP (reg. -S-)
2.625%/14-16.09.20193,000,000 3,038,340.00 1.04
USD BRITISH TELECOM 1.25%/14-14.02.2017 900,000 900,036.00 0.31USD BRITISH TELECOM 1.625%/13-28.06.2016 600,000 604,626.00 0.21USD CADES (reg. -S-) 1.375%/13-29.01.2018 500,000 504,050.00 0.17USD CAISSE DES DEPOTS ET CONSIGNATIONS
0.875%/13-07.11.20163,000,000 3,010,800.00 1.04
USD CATERPILLAR FINANCIAL SERVICES S. G T. 8582.45%/13-06.09.2018
300,000 309,108.00 0.11
USD CATERPILLAR FINANCIAL SERVICES 1.25%/12-06.11.2017
260,000 260,416.00 0.09
USD CHINA OVERSEAS FINANCE (CAYMAN) V4.25%/14-08.05.2019
3,000,000 3,120,300.00 1.07
USD CITIGROUP 1.75%/13-01.05.2018 2,000,000 1,994,700.00 0.69USD CNOOC FINANCE 2013 1.125%/13-09.05.2016 450,000 448,830.00 0.15USD CNOOC FINANCE 2013 1.75%/13-09.05.2018 1,000,000 992,600.00 0.34USD COMMERCIAL BANK OF DUBAI (reg. -S-)
3.375%/13-21.05.2018850,000 866,337.00 0.30
USD COMMONWEALTH BANK OF AUSTRALIA (reg. -S-) T.4 1.875%/13-11.12.2018
2,000,000 2,022,000.00 0.70
USD CONAGRA FOODS 1.9%/13-25.01.2018 3,000,000 3,001,200.00 1.03USD CONL RUBBER 4.5%/12-15.09.2019 3,000,000 3,101,490.00 1.07USD COUNCIL OF EUROPE DEVELOPMENT BANK
1.5%/12-22.02.20175,000,000 5,073,000.00 1.73
USD CREDIT AGRICOLE (reg. -S-) T. 8 2.125%/13-17.04.2018
500,000 506,620.00 0.17
USD CREDIT SUISSE NEW YORK BRANCH1.375%/14-26.05.2017
2,000,000 2,003,000.00 0.69
USD CVS HEALTH 2.25%/14-12.08.2019 3,000,000 3,046,770.00 1.05USD DAIMLER FINANCE NORTH AMERCIA (reg. -S-)
2.375%/13-01.08.20183,000,000 3,067,200.00 1.05
USD DEVELOPMENT BANK OF KAZAKHSTAN (reg. -S-) S. 5 5.5%/10-20.12.2015
2,078,000 2,117,606.68 0.73
USD DIAGEO CAPITAL 1.125%/13-29.04.2018 500,000 497,055.00 0.17USD EDF (reg. -S-) 1.15%/14-20.01.2017 850,000 851,785.00 0.29USD EIB 1%/13-15.06.2018 3,000,000 2,991,000.00 1.03USD EMC 1.875%/13-01.06.2018 1,500,000 1,516,260.00 0.52USD FANNIE MAE 0.875%/13-21.05.2018 1,500,000 1,493,850.00 0.51USD FANNIE MAE 1%/14-27.09.2017 2,000,000 2,009,660.00 0.69USD FANNIE MAE 1.25%/12-30.01.2017 1,000,000 1,012,200.00 0.35USD FIRSTRAND BANK (reg. -S-) 4.375%/11-
09.06.20161,200,000 1,239,276.00 0.43
USD FMS WERTMANAGEMENT 1.625%/13-20.11.2018
1,000,000 1,013,400.00 0.35
USD FORD MOTOR CREDIT 2.375%/13-16.01.2018 3,000,000 3,048,300.00 1.05USD FORD MOTOR CREDIT 3%/12-12.06.2017 2,000,000 2,060,780.00 0.71USD FREDDIE MAC 0.875%/13-07.03.2018 3,500,000 3,494,015.00 1.20USD GAZ CAPITAL (reg. -S-) 5.092%/10-29.11.2015 1,500,000 1,502,400.00 0.52USD GECC 1.625%/13-02.04.2018 800,000 804,920.00 0.28
DescriptionQuantity /
NominalValuation % of net
assets(in USD)
USD GOLDMAN SACHS GROUP 2.375%/13-22.01.2018
1,000,000 1,017,900.00 0.35
USD GOLDMAN SACHS GROUP 2.55%/14-23.10.2019
550,000 557,678.00 0.19
USD GOLDMAN SACHS GROUP 2.9%/13-19.07.2018
1,000,000 1,032,990.00 0.36
USD HALLIBURTON 2%/13-01.08.2018 3,000,000 3,020,970.00 1.04USD HARLEY-DAVIDSON FINANCIAL SERVICES (reg.
-S-) 2.4%/14-15.09.20193,000,000 3,048,870.00 1.05
USD HEWLETT-PACKARD 2.6%/12-15.09.2017 500,000 511,850.00 0.18USD HOME DEPOT 2.25%/13-10.09.2018 700,000 722,428.00 0.25USD HSBC BANK (reg. -S-) 1.5%/13-15.05.2018 850,000 848,810.00 0.29USD HUARONG FINANCE II (reg. -S-) 4.5%/15-
16.01.20202,500,000 2,611,750.00 0.90
USD HUTCHISON WHAMPOA INTERNATIONAL 14(reg. -S-) 1.625%/14-31.10.2017
1,450,000 1,445,215.00 0.50
USD HYUNDAI CAPITAL AMERICA (reg. -S-)1.45%/14-06.02.2017
1,100,000 1,100,550.00 0.38
USD HYUNDAI CAPITAL AMERICA (reg. -S-) 2%/15-19.03.2018
3,000,000 3,012,900.00 1.04
USD HYUNDAI CAPITAL SERVICES (reg. -S-)4.375%/11-27.07.2016
2,000,000 2,080,400.00 0.72
USD ICBC 2.5%/14-21.11.2017 750,000 760,125.00 0.26USD IMPERIAL TOBACCO FINANCE (reg. -S-)
2.05%/13-11.02.20181,000,000 1,005,000.00 0.35
USD ING BANK (reg. -S-) 3.75%/12-07.03.2017 2,000,000 2,092,420.00 0.72USD JAPAN FINANCE 1.375%/13-05.02.2018 2,000,000 2,003,200.00 0.69USD JOHN DEERE CAPITAL S. F 1.35%/15-
16.01.20181,000,000 1,003,310.00 0.34
USD JOHN DEERE CAPITAL S. -F- 2.3%/14-16.09.2019
3,000,000 3,051,510.00 1.05
USD JOHNSON CONTROLS 1.4%/14-02.11.2017 1,000,000 996,970.00 0.34USD JP MORGAN CHASE 1.8%/13-25.01.2018 2,000,000 2,013,800.00 0.69USD JPMORGAN CHASE 2%/12-15.08.2017 375,000 380,732.24 0.13USD KELLOGG 1.875%/11-17.11.2016 1,500,000 1,521,132.08 0.52USD KINDER MORGAN ENERGY PARTNERS 6%/07-
01.02.20171,500,000 1,610,175.00 0.55
USD KOMMUNEKREDIT 0.875%/13-29.07.2016 5,000,000 5,023,600.00 1.73USD KWF 0.5%/14-15.07.2016 1,000,000 1,000,300.00 0.34USD LINDE 1.5%/13-18.04.2018 800,000 804,936.00 0.28USD LLOYDS TSB BANK 4.2%/12-28.03.2017 3,000,000 3,173,916.45 1.09USD LORILLARD TOBACCO 3.5%/11-04.08.2016 1,000,000 1,027,500.00 0.35USD LVMH MOET HENNESSY LOUIS VUITTON (reg. -
S-) 1.625%/12-29.06.2017750,000 757,507.50 0.26
USD MACQUARIE BANK (reg. -S-) T. 3 2%/13-15.08.2016
1,000,000 1,010,900.00 0.35
USD MACQUARIE BANK (reg. -S-) 4.875%/10-10.08.2017
750,000 801,825.00 0.28
USD MATTEL 1.7%/13-15.03.2018 500,000 498,026.15 0.17USD MERCK & CO 1.1%/12-31.01.2018 2,000,000 1,993,400.00 0.69USD MERCK & CO 1.85%/15-10.02.2020 1,500,000 1,509,360.00 0.52USD MICROSOFT 1.625%/13-06.12.2018 1,000,000 1,014,870.00 0.35USD MIZUHO BANK (reg -S-) 1.7%/14-25.09.2017 4,000,000 4,007,400.00 1.38USD MONSANTO 1.15%/14-30.06.2017 2,000,000 2,005,000.00 0.69USD MORGAN STANLEY S. F 5.75%/06-18.10.2016 1,500,000 1,599,000.00 0.55USD MORGAN STANLEY 4.75%/12-22.03.2017 1,500,000 1,596,705.00 0.55USD NISSAN MOTOR ACCEPTANCE (reg. -S-)
1.8%/13-15.03.2018800,000 806,160.00 0.28
USD NOMURA HOLDINGS S. -A- 2%/13-13.09.2016 700,000 707,210.00 0.24USD NORDEA BANK (reg. -S-) T. 2 3.125%/12-
20.03.20174,000,000 4,145,760.00 1.43
USD NORDEA BANK T. 5 (reg. -S-) 0.875%/13-13.05.2016
1,000,000 1,002,200.00 0.34
USD NV BANK NEDERLANDSE GEMEENTEN BNG(reg. -S-) 1.375%/13-19.03.2018
500,000 503,650.00 0.17
USD ONEOK PARTNERS 6.15%/06-01.10.2016 1,250,000 1,335,750.00 0.46USD ONTARIO 1%/13-22.07.2016 2,000,000 2,010,800.00 0.69USD ONTARIO 1.2%/13-14.02.2018 1,000,000 1,001,400.00 0.34USD PEMEX PROJECT FUNDING MASTER
5.75%/07-01.03.20182,000,000 2,197,400.00 0.76
USD PETROBRAS GLOBAL FIN 2%/13-20.05.2016 1,500,000 1,428,600.00 0.49USD PHILIP MORRIS INTERNATIONAL 1.125%/12-
21.08.20171,000,000 1,001,230.00 0.34
USD QNB FINANCE FRN (reg. -S-) 13-31.10.2016 1,000,000 1,007,860.00 0.35USD RCI BANQUE (reg. -S-) 3.5%/13-03.04.2018 750,000 782,775.00 0.27USD RIO TINTO FINANCE USA 2.25%/13-
14.12.20182,500,000 2,541,392.50 0.87
USD RIO TINTO FINANCE USA FRN 13-17.06.2016 475,000 476,170.40 0.16USD ROCHE HOLDINGS (reg. -S-) 1.35%/14-
29.09.20174,500,000 4,518,450.00 1.55
USD ROCHE HOLDINGS (reg. -S-) 2.25%/14-30.09.2019
3,500,000 3,547,250.00 1.22
USD SAMSUNG ELECTRONICS AMERICA (reg. -S-)1.75%/12-10.04.2017
1,000,000 1,007,600.00 0.35
USD SBERBANK (reg. -S-) 5.4%/10-24.03.2017 500,000 487,750.00 0.17USD SIEMENS FINANCIERING 1.5%/13-12.03.2018 850,000 859,690.00 0.30USD SOCIETE GENERALE -144A- 2.75%/12-
12.10.20172,000,000 2,057,940.00 0.71
USD STATOIL ASA 1.15%/13-15.05.2018 500,000 497,100.00 0.17USD SUMITOMO MITSUI BANKING 2.5%/13-
19.07.2018900,000 919,998.00 0.32
USD SUMITOMO MITSUI BANKING 1.35%/14-11.07.2017
1,850,000 1,848,407.15 0.64
USD SUNCORP METWAY (reg .-S-) 1.7%/14-28.03.2017
3,000,000 3,016,050.00 1.04
USD SWEDBANK (reg. -S-) 1.75%/13-12.03.2018 500,000 501,950.00 0.17USD SWEDBANK (reg. -S-) 2.125%/12-29.09.2017 500,000 507,600.00 0.17USD SWEDEN (reg. -S-) 1%/13-27.02.2018 500,000 500,275.00 0.17USD SWEDISH EXPORT CREDIT S. T. 238
2.125%/11-13.07.20161,000,000 1,020,410.00 0.35
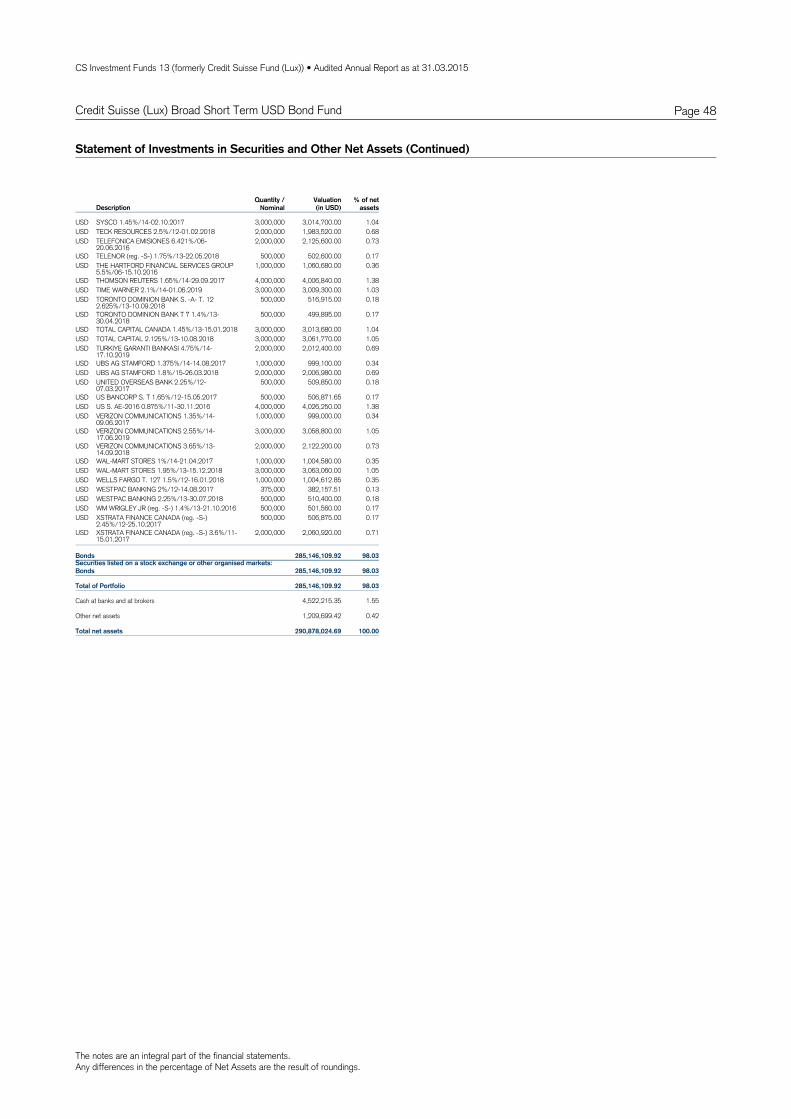
The notes are an integral part of the financial statements.Any differences in the percentage of Net Assets are the result of roundings.
CS Investment Funds 13 (formerly Credit Suisse Fund (Lux)) • Audited Annual Report as at 31.03.2015
Page 48Credit Suisse (Lux) Broad Short Term USD Bond Fund
Statement of Investments in Securities and Other Net Assets (Continued)
DescriptionQuantity /
NominalValuation % of net
assets(in USD)
USD SYSCO 1.45%/14-02.10.2017 3,000,000 3,014,700.00 1.04USD TECK RESOURCES 2.5%/12-01.02.2018 2,000,000 1,983,520.00 0.68USD TELEFONICA EMISIONES 6.421%/06-
20.06.20162,000,000 2,125,600.00 0.73
USD TELENOR (reg. -S-) 1.75%/13-22.05.2018 500,000 502,600.00 0.17USD THE HARTFORD FINANCIAL SERVICES GROUP
5.5%/06-15.10.20161,000,000 1,060,680.00 0.36
USD THOMSON REUTERS 1.65%/14-29.09.2017 4,000,000 4,006,840.00 1.38USD TIME WARNER 2.1%/14-01.06.2019 3,000,000 3,009,300.00 1.03USD TORONTO DOMINION BANK S. -A- T. 12
2.625%/13-10.09.2018500,000 516,915.00 0.18
USD TORONTO DOMINION BANK T 7 1.4%/13-30.04.2018
500,000 499,895.00 0.17
USD TOTAL CAPITAL CANADA 1.45%/13-15.01.2018 3,000,000 3,013,680.00 1.04USD TOTAL CAPITAL 2.125%/13-10.08.2018 3,000,000 3,061,770.00 1.05USD TURKIYE GARANTI BANKASI 4.75%/14-
17.10.20192,000,000 2,012,400.00 0.69
USD UBS AG STAMFORD 1.375%/14-14.08.2017 1,000,000 999,100.00 0.34USD UBS AG STAMFORD 1.8%/15-26.03.2018 2,000,000 2,006,980.00 0.69USD UNITED OVERSEAS BANK 2.25%/12-
07.03.2017500,000 509,850.00 0.18
USD US BANCORP S. T 1.65%/12-15.05.2017 500,000 506,871.65 0.17USD US S. AE-2016 0.875%/11-30.11.2016 4,000,000 4,026,250.00 1.38USD VERIZON COMMUNICATIONS 1.35%/14-
09.06.20171,000,000 999,000.00 0.34
USD VERIZON COMMUNICATIONS 2.55%/14-17.06.2019
3,000,000 3,058,800.00 1.05
USD VERIZON COMMUNICATIONS 3.65%/13-14.09.2018
2,000,000 2,122,200.00 0.73
USD WAL-MART STORES 1%/14-21.04.2017 1,000,000 1,004,580.00 0.35USD WAL-MART STORES 1.95%/13-15.12.2018 3,000,000 3,063,060.00 1.05USD WELLS FARGO T. 127 1.5%/12-16.01.2018 1,000,000 1,004,612.85 0.35USD WESTPAC BANKING 2%/12-14.08.2017 375,000 382,157.51 0.13USD WESTPAC BANKING 2.25%/13-30.07.2018 500,000 510,400.00 0.18USD WM WRIGLEY JR (reg. -S-) 1.4%/13-21.10.2016 500,000 501,560.00 0.17USD XSTRATA FINANCE CANADA (reg. -S-)
2.45%/12-25.10.2017500,000 506,875.00 0.17
USD XSTRATA FINANCE CANADA (reg. -S-) 3.6%/11-15.01.2017
2,000,000 2,060,920.00 0.71
Securities listed on a stock exchange or other organised markets:Bonds 285,146,109.92 98.03
Bonds 285,146,109.92 98.03
Total of Portfolio 285,146,109.92 98.03
Cash at banks and at brokers 4,522,215.35 1.55
Other net assets 1,209,699.42 0.42
Total net assets 290,878,024.69 100.00
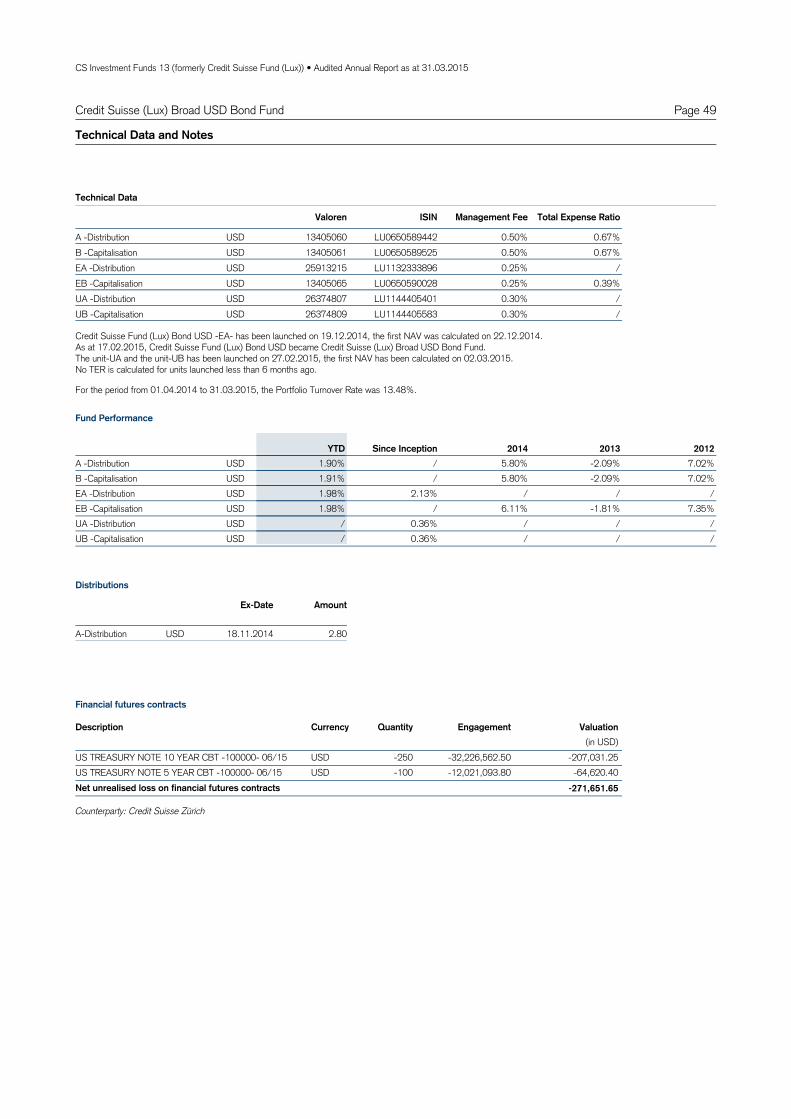
CS Investment Funds 13 (formerly Credit Suisse Fund (Lux)) • Audited Annual Report as at 31.03.2015
Page 49Credit Suisse (Lux) Broad USD Bond Fund
Technical Data and Notes
USDA 13405060 LU0650589442 0.50% 0.67%Distribution -
Valoren ISIN Management Fee Total Expense Ratio
USDB 13405061 LU0650589525 0.50% 0.67%Capitalisation - USDEA 25913215 LU1132333896 0.25% /Distribution - USDEB 13405065 LU0650590028 0.25% 0.39%Capitalisation - USDUA 26374807 LU1144405401 0.30% /Distribution - USDUB 26374809 LU1144405583 0.30% /Capitalisation -
Technical Data
USDA -2.09% 7.02%5.80%/1.90%Distribution - 2013 2012YTD 2014Since Inception
USDB -2.09% 7.02%5.80%/1.91%Capitalisation - USDEA / //2.13%1.98%Distribution - USDEB -1.81% 7.35%6.11%/1.98%Capitalisation - USDUA / //0.36%/Distribution - USDUB / //0.36%/Capitalisation -
Fund Performance
For the period from 01.04.2014 to 31.03.2015, the Portfolio Turnover Rate was 13.48%.
Credit Suisse Fund (Lux) Bond USD -EA- has been launched on 19.12.2014, the first NAV was calculated on 22.12.2014.As at 17.02.2015, Credit Suisse Fund (Lux) Bond USD became Credit Suisse (Lux) Broad USD Bond Fund. The unit-UA and the unit-UB has been launched on 27.02.2015, the first NAV has been calculated on 02.03.2015.No TER is calculated for units launched less than 6 months ago.
A Distribution- USD 18.11.2014 2.80
Ex-Date Amount
Distributions
USDUS TREASURY NOTE 10 YEAR CBT -100000- 06/15 -250 -32,226,562.50 -207,031.25USDUS TREASURY NOTE 5 YEAR CBT -100000- 06/15 -100 -12,021,093.80 -64,620.40
-271,651.65Net unrealised loss on financial futures contracts
Quantity EngagementDescription Currency Valuation(in USD)
Counterparty: Credit Suisse Zürich
Financial futures contracts
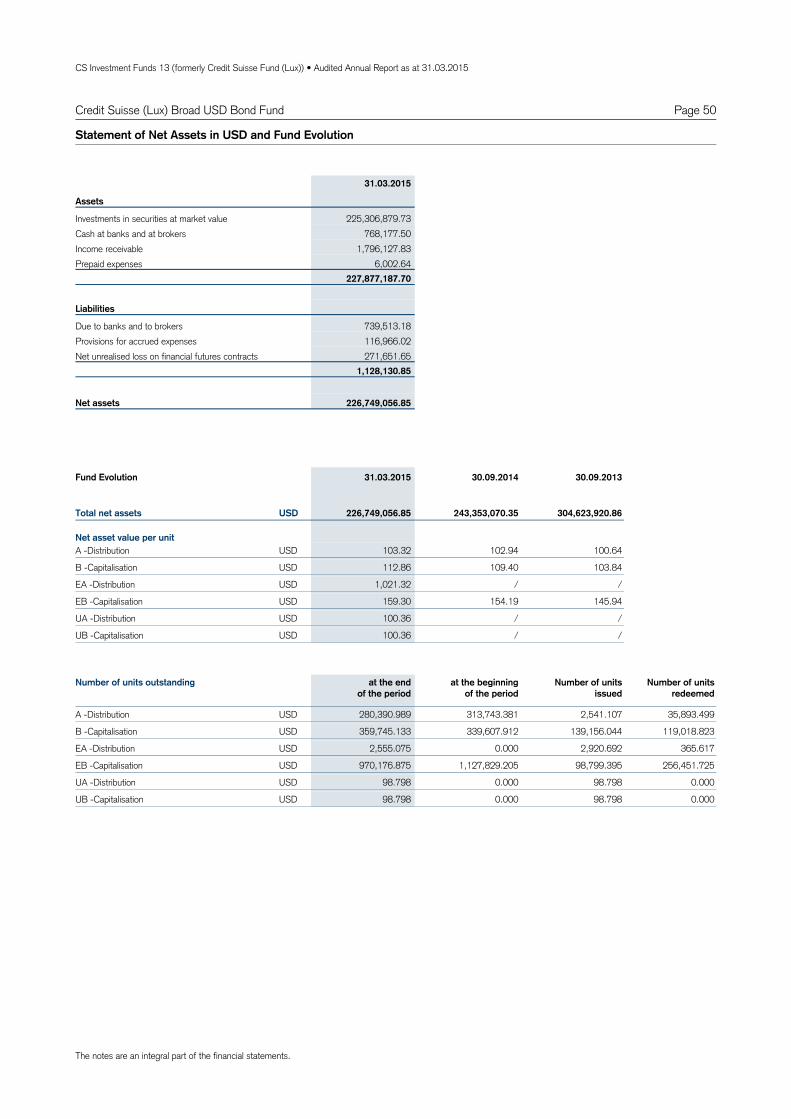
CS Investment Funds 13 (formerly Credit Suisse Fund (Lux)) • Audited Annual Report as at 31.03.2015
Page 50
Assets
Investments in securities at market value 225,306,879.73Cash at banks and at brokers 768,177.50Income receivable 1,796,127.83Prepaid expenses 6,002.64
227,877,187.70
Liabilities
Due to banks and to brokers 739,513.18Provisions for accrued expenses 116,966.02Net unrealised loss on financial futures contracts 271,651.65
1,128,130.85
226,749,056.85Net assets
Statement of Net Assets in USD and Fund Evolution
31.03.2015
103.32 100.64USDA 102.94Distribution -
112.86 103.84USDB 109.40Capitalisation -
1,021.32 /USDEA /Distribution -
159.30 145.94USDEB 154.19Capitalisation -
100.36 /USDUA /Distribution -
100.36 /USDUB /Capitalisation -
Total net assets
Net asset value per unit
226,749,056.85 243,353,070.35 304,623,920.86USD
Fund Evolution 31.03.2015 30.09.2014 30.09.2013
280,390.989 2,541.107A 313,743.381 35,893.499Distribution - USD
359,745.133 139,156.044B 339,607.912 119,018.823Capitalisation - USD
2,555.075 2,920.692EA 0.000 365.617Distribution - USD
970,176.875 98,799.395EB 1,127,829.205 256,451.725Capitalisation - USD
98.798 98.798UA 0.000 0.000Distribution - USD
98.798 98.798UB 0.000 0.000Capitalisation - USD
Number of units outstanding at the endof the period
at the beginningof the period
Number of units issued
Number of units redeemed
Credit Suisse (Lux) Broad USD Bond Fund
The notes are an integral part of the financial statements.
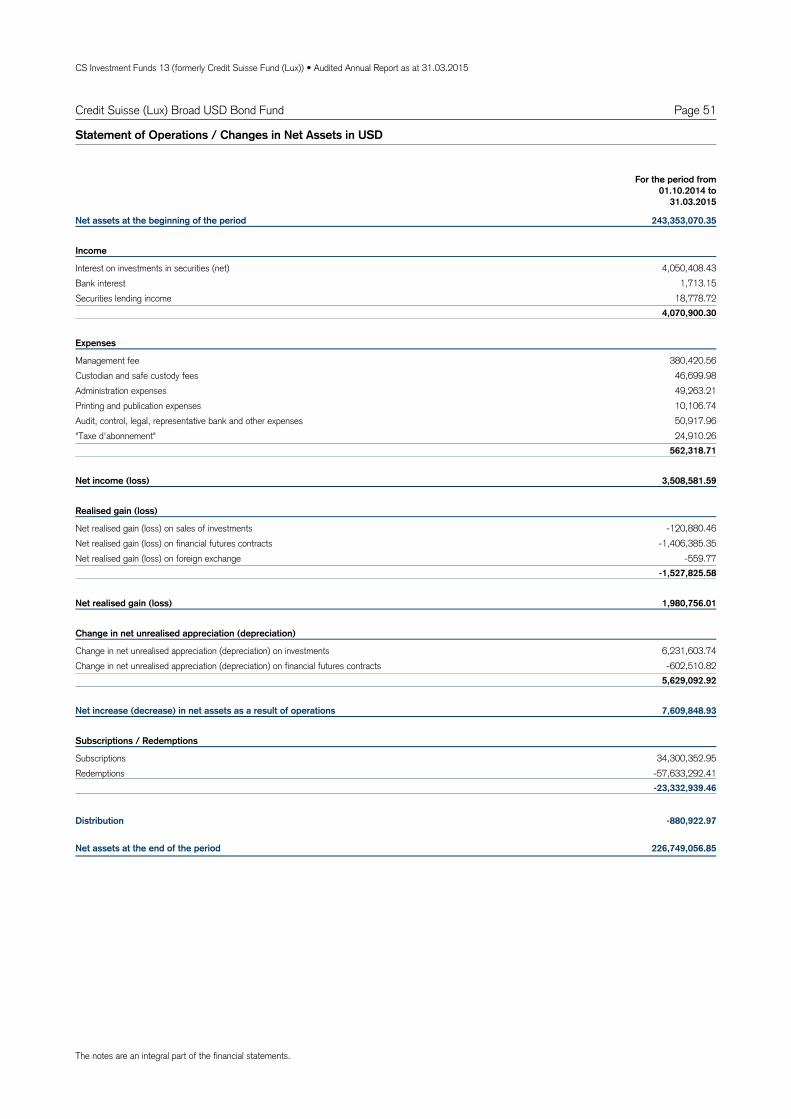
CS Investment Funds 13 (formerly Credit Suisse Fund (Lux)) • Audited Annual Report as at 31.03.2015
Page 51Credit Suisse (Lux) Broad USD Bond Fund
Net assets at the beginning of the period 243,353,070.35
Income
Interest on investments in securities (net) 4,050,408.43Bank interest 1,713.15Securities lending income 18,778.72
4,070,900.30
Expenses
Management fee 380,420.56Custodian and safe custody fees 46,699.98Administration expenses 49,263.21Printing and publication expenses 10,106.74Audit, control, legal, representative bank and other expenses 50,917.96"Taxe d'abonnement" 24,910.26
562,318.71
Net income (loss) 3,508,581.59
Realised gain (loss)
Net realised gain (loss) on sales of investments -120,880.46Net realised gain (loss) on financial futures contracts -1,406,385.35Net realised gain (loss) on foreign exchange -559.77
-1,527,825.58
Net realised gain (loss) 1,980,756.01
Change in net unrealised appreciation (depreciation)
Change in net unrealised appreciation (depreciation) on investments 6,231,603.74Change in net unrealised appreciation (depreciation) on financial futures contracts -602,510.82
5,629,092.92
Net increase (decrease) in net assets as a result of operations 7,609,848.93
Subscriptions / Redemptions
Subscriptions 34,300,352.95Redemptions -57,633,292.41
-23,332,939.46
Distribution -880,922.97
Net assets at the end of the period 226,749,056.85
Statement of Operations / Changes in Net Assets in USD
For the period from01.10.2014 to
31.03.2015
The notes are an integral part of the financial statements.
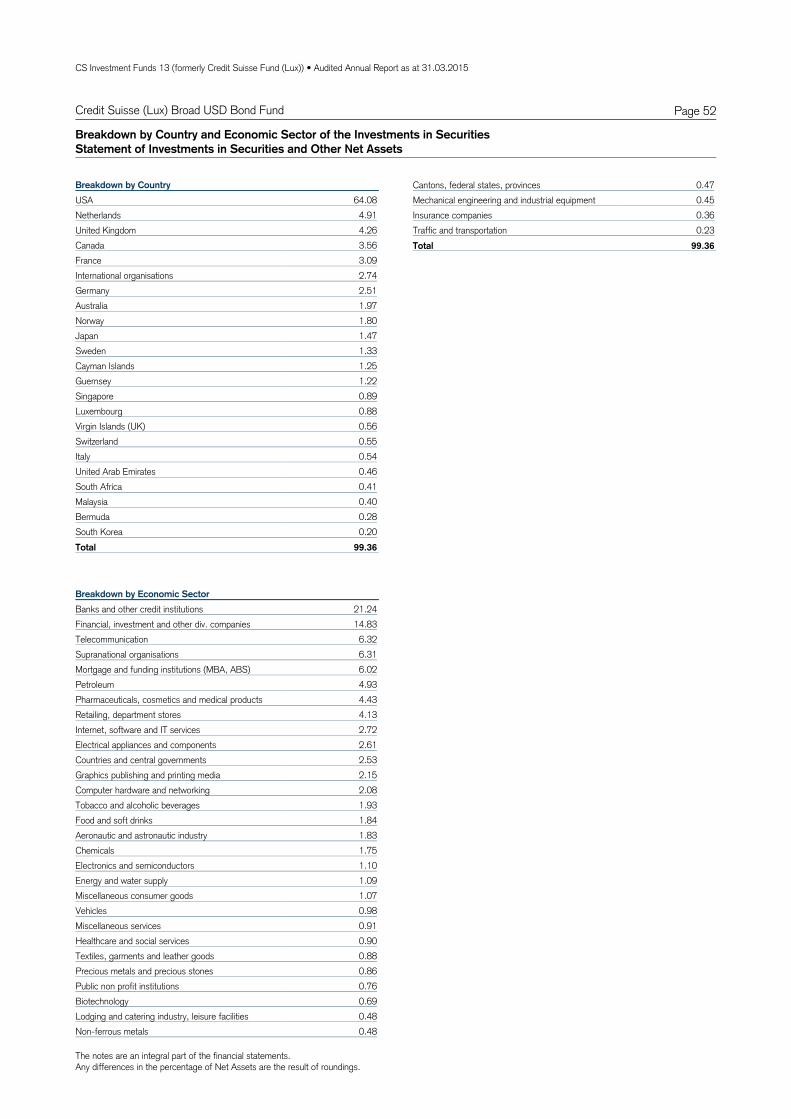
The notes are an integral part of the financial statements.Any differences in the percentage of Net Assets are the result of roundings.
CS Investment Funds 13 (formerly Credit Suisse Fund (Lux)) • Audited Annual Report as at 31.03.2015
Page 52Credit Suisse (Lux) Broad USD Bond Fund
Breakdown by Country and Economic Sector of the Investments in SecuritiesStatement of Investments in Securities and Other Net Assets
64.08USABreakdown by Country
4.91Netherlands4.26United Kingdom3.56Canada3.09France2.74International organisations2.51Germany1.97Australia1.80Norway1.47Japan1.33Sweden1.25Cayman Islands1.22Guernsey0.89Singapore0.88Luxembourg0.56Virgin Islands (UK)0.55Switzerland0.54Italy0.46United Arab Emirates0.41South Africa0.40Malaysia0.28Bermuda0.20South Korea
99.36Total
21.24Banks and other credit institutionsBreakdown by Economic Sector
14.83Financial, investment and other div. companies6.32Telecommunication6.31Supranational organisations6.02Mortgage and funding institutions (MBA, ABS)4.93Petroleum4.43Pharmaceuticals, cosmetics and medical products4.13Retailing, department stores2.72Internet, software and IT services2.61Electrical appliances and components2.53Countries and central governments2.15Graphics publishing and printing media2.08Computer hardware and networking1.93Tobacco and alcoholic beverages1.84Food and soft drinks1.83Aeronautic and astronautic industry1.75Chemicals1.10Electronics and semiconductors1.09Energy and water supply1.07Miscellaneous consumer goods0.98Vehicles0.91Miscellaneous services0.90Healthcare and social services0.88Textiles, garments and leather goods0.86Precious metals and precious stones0.76Public non profit institutions0.69Biotechnology0.48Lodging and catering industry, leisure facilities0.48Non-ferrous metals
0.47Cantons, federal states, provinces0.45Mechanical engineering and industrial equipment0.36Insurance companies0.23Traffic and transportation
99.36Total

The notes are an integral part of the financial statements.Any differences in the percentage of Net Assets are the result of roundings.
CS Investment Funds 13 (formerly Credit Suisse Fund (Lux)) • Audited Annual Report as at 31.03.2015
Page 53Credit Suisse (Lux) Broad USD Bond Fund
Breakdown by Country and Economic Sector of the Investments in SecuritiesStatement of Investments in Securities and Other Net Assets
Statement of Investments in Securities and Other Net Assets
DescriptionQuantity /
NominalValuation % of net
assets(in USD)
Securities listed on a stock exchange or other organised markets: Bonds
Bonds
USD ABB TREASURY CENTER USA 4%/11-15.06.2021
1,500,000 1,640,427.00 0.72
USD ABBOTT LABORATORIES 4.125%/10-27.05.2020
500,000 554,032.25 0.24
USD ABU DHABI NATIONAL ENERGY (reg. -S-) S. 47.25%/08-01.08.2018
250,000 290,300.00 0.13
USD ADOBE SYSTEMS 4.75%/10-01.02.2020 1,000,000 1,120,177.85 0.49USD AGILENT TECHNOLOGIES 5%/10-15.07.2020 1,500,000 1,635,275.55 0.72USD ALIBABA GROUP HOLDING (reg. -S-)
3.125%/14-28.11.20211,000,000 1,005,510.00 0.44
USD AMAZON.COM 2.5%/12-29.11.2022 1,000,000 985,219.70 0.43USD AMERICAN EXPRESS CREDIT S. E 2.125%/13-
27.07.2018750,000 762,300.00 0.34
USD AMGEN 3.625%/12-15.05.2022 1,500,000 1,574,400.00 0.69USD ANGLO AMERICAN CAPITAL (reg. -S-)
4.125%/12-27.09.20221,000,000 1,005,518.35 0.44
USD ANHEUSER BUSCH INBEV WORLDWIDE (reg. -S-) 5.375%/10-15.01.2020
500,000 575,934.00 0.25
USD ANHEUSER BUSCH INVEV WORLDWIDE4.375%/11-15.02.2021
1,000,000 1,113,708.80 0.49
USD AON 5%/10-30.09.2020 250,000 281,554.34 0.12USD APPLE 3.85%/13-04.05.2043 500,000 505,900.00 0.22USD ASIAN DEVELOPMENT BANK 5.593%/98-
16.07.20182,000,000 2,261,944.00 1.00
USD AT&T 3%/12-15.02.2022 1,500,000 1,497,450.00 0.66USD AT&T 4.45%/11-15.05.2021 1,000,000 1,085,500.00 0.48USD AUSTRALIA & NEW ZEALAND BANKING GROUP
(reg. -S-) T. 34 4.875%/11-12.01.2021400,000 454,360.00 0.20
USD BANK NEDERLANDSE GEMEENTEN BNG2.625%/14-28.04.2021
1,000,000 1,044,900.00 0.46
USD BANK NEDERLANDSE GEMEENTEN (reg. -S-)1.875%/14-11.06.2019
1,000,000 1,017,700.00 0.45
USD BANK OF AMERICA S. Ll 5.875%/12-07.02.2042
2,000,000 2,539,080.00 1.12
USD BANK OF AMERICA 3.3%/13-11.01.2023 1,000,000 1,010,000.00 0.45USD BARCLAYS BANK 5.125%/10-08.01.2020 1,200,000 1,365,912.06 0.60USD BARRICK GOLD (reg. -S-) 3.85%/12-01.04.2022 2,000,000 1,955,710.00 0.86USD BARRICK NORTH AMERICA FINANCE (reg. -S-)
4.4%/11-30.05.2021100,000 102,696.60 0.05
USD BERKSHIRE HATHAWAY FINANCE 2.9%/13-15.10.2020
1,000,000 1,056,156.00 0.47
USD BOEING 2.35%/14-30.10.2021 1,500,000 1,516,500.00 0.67USD BP CAPITAL MARKETS 2.518%/14-16.01.2020 1,000,000 1,015,750.00 0.45USD BP CAPITAL MARKETS 2.75%/13-10.05.2023 1,000,000 977,870.00 0.43USD BRISTOL-MYERS SQUIBB 2%/12-01.08.2022 1,000,000 963,100.00 0.42USD BRITISH GAS INTERNATIONAL FINANCE
0%/91-04.11.20212,000,000 1,673,160.00 0.74
USD CADES (reg. -S-) 2%/13-17.04.2020 1,700,000 1,731,637.00 0.76USD CATERPILLAR -H- 2.75%/14-20.08.2021 1,000,000 1,025,600.00 0.45USD CAYMAN ISLANDS (reg. -S-) 5.95%/09-
24.11.2019500,000 571,250.00 0.25
USD CITIGROUP 1.75%/13-01.05.2018 1,500,000 1,496,025.00 0.66USD CITIGROUP 5.375%/10-09.08.2020 244,000 278,572.36 0.12USD CNOOC FINANCE 2013 4.25%/13-09.05.2043 1,000,000 1,001,380.00 0.44USD COCA-COLA 3.15%/10-15.11.2020 870,000 921,678.00 0.41USD COLGATE-PALMOLIVE S. T. 95 2.45%/11-
15.11.2021600,000 612,588.36 0.27
USD COMCAST 3.125%/12-15.07.2022 1,000,000 1,034,500.00 0.46USD COMCAST 4.5%/13-15.01.2043 2,500,000 2,738,075.00 1.21USD CORPORACION ANDINA DE FOMENTO
4.375%/12-15.06.20221,135,000 1,236,809.50 0.55
USD CREDIT SUISSE GROUP FINANCE (reg. -S-)2.75%/15-26.03.2020
1,750,000 1,759,983.75 0.78
USD CREDIT SUISSE GROUP FUNDING (GUERNSEY)(reg. -S-) 3.75%/15-26.03.2025
1,000,000 1,006,300.00 0.44
USD CREDIT SUISSE NEW YORK BRANCH3.625%/14-09.09.2024
2,000,000 2,056,400.00 0.91
USD CREDIT SUISSE NEW YORK 2.3%/14-28.05.2019
1,000,000 1,009,110.00 0.45
USD DAIMLER FINANCE NORTH AMERCIA (reg. -S-)2.375%/13-01.08.2018
1,000,000 1,022,400.00 0.45
USD DIAGEO CAPITAL 1.125%/13-29.04.2018 500,000 497,055.00 0.22USD DIAGEO CAPITAL 2.625%/13-29.04.2023 800,000 792,579.96 0.35USD DIAGEO INVESTMENT 2.875%/12-11.05.2022 250,000 253,650.00 0.11USD DOLPHIN ENERGY (reg. -S-) 5.888%/09-
15.06.2019600,000 374,552.70 0.17
USD DU PONT (E.I.) DE NEMOURS 4.25%/11-01.04.2021
500,000 550,361.33 0.24
USD EBAY 4%/12-15.07.2042 1,000,000 866,893.00 0.38USD EI DU PONT DE NEMOURS 4.15%/13-
15.02.20432,000,000 2,062,260.00 0.91
USD EIB 4.875%/06-15.02.2036 2,000,000 2,688,800.00 1.19USD EMC 1.875%/13-01.06.2018 1,000,000 1,010,840.00 0.45USD EMIRATES TELECOMMUNICATIONS
2.375%/14-18.06.2019350,000 354,375.00 0.16
USD EUROPEAN INVESTMENT BANK 1.875%/14-15.03.2019
1,000,000 1,022,100.00 0.45
USD EXPORT DEVELOPMENT CANADA 1.75%/14-19.08.2019
2,000,000 2,027,800.00 0.89
USD EXXON MOBIL 1.912%/15-06.03.2020 1,000,000 1,005,500.00 0.44USD FANNIE MAE 0.875%/13-21.05.2018 2,500,000 2,489,750.00 1.10USD FANNIE MAE 5.625%/07-15.07.2037 1,500,000 2,157,990.00 0.95USD FANNIE MAE 6.25%/99-15.05.2029 2,000,000 2,870,260.00 1.27USD FRANCE TELECOM 5.375%/09-08.07.2019 500,000 569,050.00 0.25USD FREDDIE MAC 3.75%/09-27.03.2019 2,000,000 2,193,608.80 0.97USD FREDDIE MAC 6.25%/02-15.07.2032 2,000,000 2,970,940.00 1.31USD FREDDIE MAC 6.75%/00-15.03.2031 2,500,000 3,820,050.00 1.69
DescriptionQuantity /
NominalValuation % of net
assets(in USD)
USD GECC 4.375%/10-16.09.2020 2,000,000 2,226,404.70 0.98USD GECC 6.75%/02-15.03.2032 1,000,000 1,383,800.00 0.61USD GOLDMAN SACHS GROUP T. 580 5.375%/10-
15.03.20201,000,000 1,131,500.00 0.50
USD GOLDMAN SACHS GROUP 6.125%/03-15.02.2033
3,000,000 3,820,500.00 1.69
USD GOOGLE 3.625%/11-19.05.2021 1,000,000 1,089,980.00 0.48USD HALLIBURTON 2%/13-01.08.2018 1,000,000 1,006,990.00 0.44USD HEINEKEN (reg. -S-) 3.4%/12-01.04.2022 1,000,000 1,035,600.00 0.46USD HEWLETT-PACKARD 3.75%/10-01.12.2020 1,000,000 1,051,800.00 0.46USD HOLCIM CAPITAL (reg. -S-) 6.5%/13-
12.09.2043500,000 632,164.50 0.28
USD HOME DEPOT 2.7%/13-01.04.2023 2,000,000 2,020,800.00 0.89USD HONG KONG ELECTRIC FINANCE 4.25%/10-
14.12.2020250,000 271,500.00 0.12
USD HSBC BANK (reg. -S-) 4.125%/10-12.08.2020 750,000 817,815.00 0.36USD HUTCHISON WHAMPOA INTERNATIONAL (reg. -
S-) 7.625%/09-09.04.2019600,000 723,834.00 0.32
USD HUTCHISON WHAMPOA INTL 11 (reg. -S-)4.625%/12-13.01.2022
500,000 548,775.00 0.24
USD IADB 3%/13-04.10.2023 1,000,000 1,082,100.00 0.48USD IBM 1.875%/12-01.08.2022 1,500,000 1,430,250.00 0.63USD IBM 2.9%/11-01.11.2021 700,000 728,350.00 0.32USD IBRD S. 1312 4.75%/05-15.02.2035 1,000,000 1,318,100.00 0.58USD IMPERIAL TOBACCO FINANCE (reg. -S-)
3.5%/13-11.02.20231,000,000 1,012,960.00 0.45
USD INTEL 3.3%/11-01.10.2021 500,000 533,324.75 0.24USD INTERNATIONAL CCE 3.5%/10-15.09.2020 1,000,000 1,061,808.00 0.47USD ITALY 5.375%/03-15.06.2033 1,000,000 1,224,530.00 0.54USD JAPAN BANK FOR INTERNATIONAL
COOPERATION 1.75%/13-31.07.20181,250,000 1,266,062.50 0.56
USD JOHN DEERE CAP S. -E- T. 368 3.15%/11-15.10.2021
1,210,000 1,262,450.84 0.56
USD JOHN DEERE CAPITAL S. E 1.7%/12-15.01.2020
700,000 695,351.51 0.31
USD JP MORGAN CHASE 4.25%/10-15.10.2020 2,000,000 2,179,868.20 0.96USD JP MORGAN CHASE 4.5%/12-24.01.2022 2,000,000 2,211,640.00 0.98USD JP MORGAN CHASE 5.6%/11-15.07.2041 2,000,000 2,447,110.00 1.08USD KELLOGG 4%/10-15.12.2020 1,105,000 1,189,974.50 0.52USD KFW 0%/06-18.04.2036 2,500,000 1,422,750.00 0.63USD KFW 2.75%13-01.10.2020 1,500,000 1,590,300.00 0.70USD KFW 4.5%/08-16.07.2018 500,000 553,900.00 0.24USD KFW 4.875%/09-17.06.2019 1,000,000 1,143,800.00 0.50USD KOREA 5.625%/05-03.11.2025 350,000 448,119.00 0.20USD LINDE 1.5%/13-18.04.2018 1,000,000 1,006,170.00 0.44USD MACQUARIE GROUP (reg. -S-) T. 1 7.625%/09-
13.08.20191,000,000 1,207,149.80 0.53
USD MACY'S RETAIL 3.625%/14-01.06.2024 2,000,000 2,073,720.00 0.91USD MATTEL 4.35%/10-01.10.2020 500,000 539,747.13 0.24USD MCDONALD'S 3.625%/11-20.05.2021 1,000,000 1,079,971.00 0.48USD MERCK & CO 2.4%/12-15.09.2022 2,000,000 1,991,600.00 0.88USD MERCK & CO 2.75%/15-10.02.2025 1,700,000 1,697,093.00 0.75USD MICROSOFT 3.75%/13-01.05.2043 500,000 504,558.43 0.22USD MICROSOFT 4%/11-08.02.2021 500,000 554,800.00 0.24USD MICROSOFT 4.2%/09-01.06.2019 830,000 915,407.00 0.40USD MIZUHO CORPORATE BANK (reg. -S-) 3.5%/13-
21.03.20231,000,000 1,037,596.30 0.46
USD MONSANTO 4.2%/14-15.07.2034 350,000 373,870.00 0.16USD MORGAN STANLEY S. F. 6.375%/12-
24.07.20421,000,000 1,333,717.00 0.59
USD MORGAN STANLEY 2.125%/13-25.04.2018 1,000,000 1,011,533.15 0.45USD MORGAN STANLEY 5.5%/10-24.07.2020 3,700,000 4,245,824.00 1.88USD MOTOROLA SOLUTIONS 3.5%/13-01.03.2023 2,000,000 2,006,460.00 0.88USD NATIONAL GRID NORTH AMERICA 2.375%/15-
30.09.20201,500,000 1,491,750.00 0.66
USD NBCUNIVERSAL MEDIA 4.375%/11-01.04.2021 500,000 554,650.00 0.24USD NESTLE HOLDINGS 2.125%/14-14.01.2020 1,000,000 1,016,000.00 0.45USD NIKE 2.25%/13-01.05.2023 1,000,000 986,818.05 0.44USD NIKE 3.625%/13-01.05.2043 1,000,000 1,001,970.00 0.44USD NORDEA BANK T. 7 (reg. -S-) 1.625%/13-
15.05.20181,000,000 1,005,016.10 0.44
USD NOVARTIS CAPITAL 3.4%/14-06.05.2024 700,000 744,373.00 0.33USD ONTARIO 3%/11-16.07.2018 1,000,000 1,055,200.00 0.47USD ORACLE 2.375%/13-15.01.2019 800,000 822,440.00 0.36USD ORACLE 3.875%/11-15.07.2020 1,100,000 1,201,733.23 0.53USD PEPSICO 3%/11-25.08.2021 1,000,000 1,049,378.80 0.46USD PETROBRAS GLOBAL FINANCE 3%/13-
15.01.20192,000,000 1,730,000.00 0.76
USD PETRONAS CAPITAL (reg. -S-) 5.25%/09-12.08.2019
800,000 896,920.00 0.40
USD PFIZER 4.3%/13-15.06.2043 1,500,000 1,597,950.00 0.70USD PFIZER 6.2%/09-15.03.2019 1,000,000 1,168,400.00 0.52USD PHILIP MORRIS INTERNATIONAL 4.125%/11-
17.05.20211,500,000 1,655,829.15 0.73
USD PRUDENTIAL FINANCIAL T. 42 4.5%/11-16.11.2021
750,000 833,855.78 0.37
USD RABOBANK T. 42 4.5%/11-11.01.2021 1,500,000 1,670,400.00 0.74USD RIO TINTO FINANCE USA 4.125%/11-
20.05.20211,000,000 1,077,317.75 0.48
USD ROCHE HOLDINGS (reg. -S-) 2.875%/14-29.09.2021
1,500,000 1,540,200.00 0.68
USD ROYAL BANK OF SCOTLAND 5.625%/10-24.08.2020
1,000,000 1,158,019.70 0.51
USD ROYAL PHILIPS 3.75%/12-15.03.2022 300,000 318,592.67 0.14USD SABMILLER HOLDINGS (reg -S-) 3.75%/12-
15.01.20221,100,000 1,157,981.00 0.51
USD SANOFI-AVENTIS 4%/11-29.03.2021 500,000 549,880.00 0.24
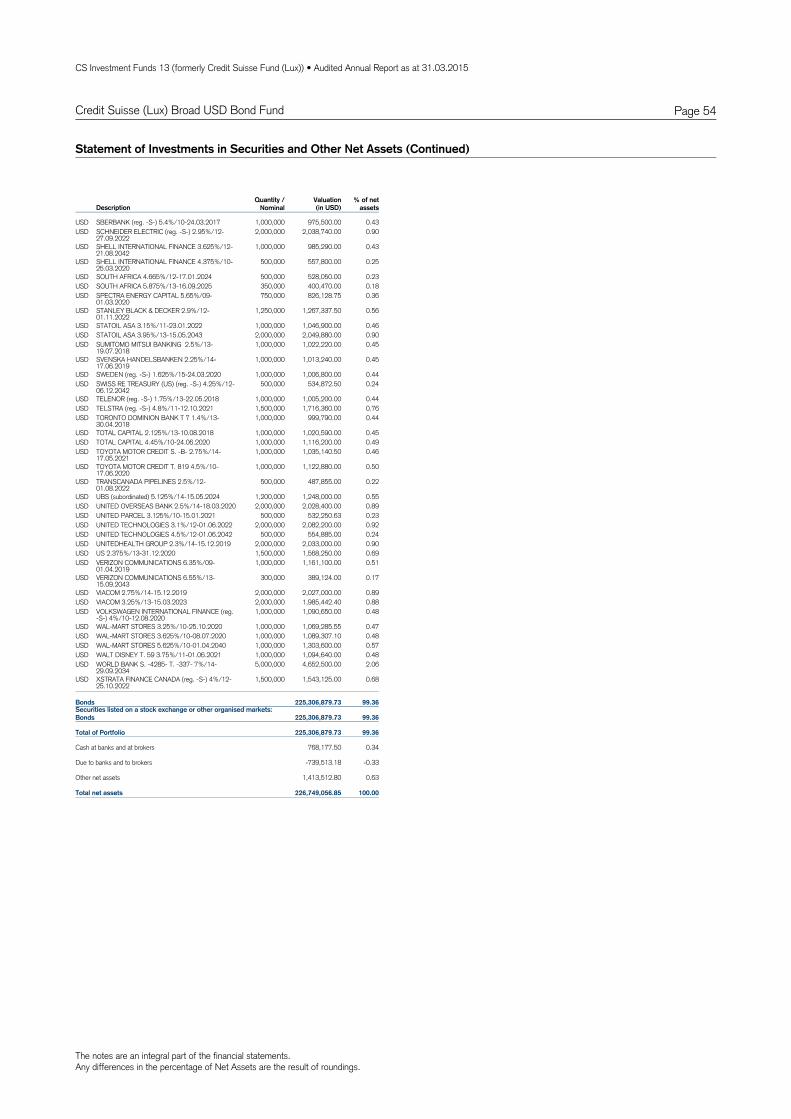
The notes are an integral part of the financial statements.Any differences in the percentage of Net Assets are the result of roundings.
CS Investment Funds 13 (formerly Credit Suisse Fund (Lux)) • Audited Annual Report as at 31.03.2015
Page 54Credit Suisse (Lux) Broad USD Bond Fund
Statement of Investments in Securities and Other Net Assets (Continued)
DescriptionQuantity /
NominalValuation % of net
assets(in USD)
USD SBERBANK (reg. -S-) 5.4%/10-24.03.2017 1,000,000 975,500.00 0.43USD SCHNEIDER ELECTRIC (reg. -S-) 2.95%/12-
27.09.20222,000,000 2,038,740.00 0.90
USD SHELL INTERNATIONAL FINANCE 3.625%/12-21.08.2042
1,000,000 985,290.00 0.43
USD SHELL INTERNATIONAL FINANCE 4.375%/10-25.03.2020
500,000 557,800.00 0.25
USD SOUTH AFRICA 4.665%/12-17.01.2024 500,000 528,050.00 0.23USD SOUTH AFRICA 5.875%/13-16.09.2025 350,000 400,470.00 0.18USD SPECTRA ENERGY CAPITAL 5.65%/09-
01.03.2020750,000 826,128.75 0.36
USD STANLEY BLACK & DECKER 2.9%/12-01.11.2022
1,250,000 1,267,337.50 0.56
USD STATOIL ASA 3.15%/11-23.01.2022 1,000,000 1,046,900.00 0.46USD STATOIL ASA 3.95%/13-15.05.2043 2,000,000 2,049,880.00 0.90USD SUMITOMO MITSUI BANKING 2.5%/13-
19.07.20181,000,000 1,022,220.00 0.45
USD SVENSKA HANDELSBANKEN 2.25%/14-17.06.2019
1,000,000 1,013,240.00 0.45
USD SWEDEN (reg. -S-) 1.625%/15-24.03.2020 1,000,000 1,006,800.00 0.44USD SWISS RE TREASURY (US) (reg. -S-) 4.25%/12-
06.12.2042500,000 534,872.50 0.24
USD TELENOR (reg. -S-) 1.75%/13-22.05.2018 1,000,000 1,005,200.00 0.44USD TELSTRA (reg. -S-) 4.8%/11-12.10.2021 1,500,000 1,716,360.00 0.76USD TORONTO DOMINION BANK T 7 1.4%/13-
30.04.20181,000,000 999,790.00 0.44
USD TOTAL CAPITAL 2.125%/13-10.08.2018 1,000,000 1,020,590.00 0.45USD TOTAL CAPITAL 4.45%/10-24.06.2020 1,000,000 1,116,200.00 0.49USD TOYOTA MOTOR CREDIT S. -B- 2.75%/14-
17.05.20211,000,000 1,035,140.50 0.46
USD TOYOTA MOTOR CREDIT T. 819 4.5%/10-17.06.2020
1,000,000 1,122,880.00 0.50
USD TRANSCANADA PIPELINES 2.5%/12-01.08.2022
500,000 487,855.00 0.22
USD UBS (subordinated) 5.125%/14-15.05.2024 1,200,000 1,248,000.00 0.55USD UNITED OVERSEAS BANK 2.5%/14-18.03.2020 2,000,000 2,028,400.00 0.89USD UNITED PARCEL 3.125%/10-15.01.2021 500,000 532,250.63 0.23USD UNITED TECHNOLOGIES 3.1%/12-01.06.2022 2,000,000 2,082,200.00 0.92USD UNITED TECHNOLOGIES 4.5%/12-01.06.2042 500,000 554,885.00 0.24USD UNITEDHEALTH GROUP 2.3%/14-15.12.2019 2,000,000 2,033,000.00 0.90USD US 2.375%/13-31.12.2020 1,500,000 1,568,250.00 0.69USD VERIZON COMMUNICATIONS 6.35%/09-
01.04.20191,000,000 1,161,100.00 0.51
USD VERIZON COMMUNICATIONS 6.55%/13-15.09.2043
300,000 389,124.00 0.17
USD VIACOM 2.75%/14-15.12.2019 2,000,000 2,027,000.00 0.89USD VIACOM 3.25%/13-15.03.2023 2,000,000 1,985,442.40 0.88USD VOLKSWAGEN INTERNATIONAL FINANCE (reg.
-S-) 4%/10-12.08.20201,000,000 1,090,650.00 0.48
USD WAL-MART STORES 3.25%/10-25.10.2020 1,000,000 1,069,285.55 0.47USD WAL-MART STORES 3.625%/10-08.07.2020 1,000,000 1,089,307.10 0.48USD WAL-MART STORES 5.625%/10-01.04.2040 1,000,000 1,303,600.00 0.57USD WALT DISNEY T. 59 3.75%/11-01.06.2021 1,000,000 1,094,640.00 0.48USD WORLD BANK S. -4285- T. -337- 7%/14-
29.09.20345,000,000 4,652,500.00 2.06
USD XSTRATA FINANCE CANADA (reg. -S-) 4%/12-25.10.2022
1,500,000 1,543,125.00 0.68
Securities listed on a stock exchange or other organised markets:Bonds 225,306,879.73 99.36
Bonds 225,306,879.73 99.36
Total of Portfolio 225,306,879.73 99.36
Cash at banks and at brokers 768,177.50 0.34
Due to banks and to brokers -739,513.18 -0.33
Other net assets 1,413,512.80 0.63
Total net assets 226,749,056.85 100.00

CS Investment Funds 13 (formerly Credit Suisse Fund (Lux)) • Audited Annual Report as at 31.03.2015
Page 55Credit Suisse (Lux) Commodity Index Plus CHF Fund
Technical Data and Notes
CHFB 2288450 LU0230917477 1.40% 1.53%Capitalisation -
Valoren ISIN Management Fee Total Expense Ratio
CHFDB 2288452 LU0230917550 0.00% 0.07%Capitalisation - CHFIB 2288455 LU0230917808 0.40% 0.58%Capitalisation -
Technical Data
CHFB -11.29% -4.21%-17.83%/-6.83%Capitalisation - 2013 2012YTD 2014Since Inception
CHFDB -9.98% -2.75%-16.61%/-6.49%Capitalisation - CHFIB -10.42% -3.24%-17.04%/-6.61%Capitalisation -
Fund Performance
For the period from 01.04.2014 to 31.03.2015, the Portfolio Turnover Rate was 224.31%.
There is no management fee for DB-units.As at 17.02.2015, Credit Suisse Fund (Lux) Commodity Index Plus (Sfr) became Credit Suisse (Lux) Commodity Index Plus CHF Fund. The units D became DB and Ibecame IB.
52,100,000CHF USD -53,983,484 -274,388.1330.04.2015Goldman Sachs International (London)
52,100,000CHF USD -53,989,358 -280,093.2230.04.2015Commonwealth Bank Of Australia (Sydney)
52,100,000CHF USD -53,966,429 -257,823.2230.04.2015Barclays Bank PLC Wholesale (London)
1,273,000CHF USD -1,325,807 -13,295.6730.04.2015Goldman Sachs International (London)
833,973USD CHF -810,000 -890.3330.04.2015Barclays Bank PLC Wholesale (London)
-826,490.57Net unrealised loss on forward foreign exchange contracts
SalesPurchases Valuation(in CHF)
MaturityCounterparty
Forward foreign exchange contracts
ERS Neg. var. BCOM Index 27.04.2015 -2,331,960.12USD 82,924,813 0.180% Pos. var. BCOM IndexCredit Suisse International - London - United KingdomERS Neg. var. BCOMF2
Index27.04.2015 -2,223,218.89USD 82,850,630 0.280% Pos. var. BCOMF2
IndexCredit Suisse International - London - United KingdomERS Neg. var. BCOMF2
Index27.04.2015 -13,817.06USD 1,200,000 0.280% Pos. var. BCOMF2
IndexCredit Suisse International - London - United Kingdom
-4,568,996.07Net unrealised loss on swap contracts
Type Maturity ReceivablePayable Valuation
(in CHF)Nominal IR Nominal IRCounterparty
Swap contracts

CS Investment Funds 13 (formerly Credit Suisse Fund (Lux)) • Audited Annual Report as at 31.03.2015
Page 56
Assets
Investments in securities at market value 154,244,709.26Cash at banks and at brokers 7,350,791.71Income receivable 118,009.74Prepaid expenses 319.42Other assets 19,874.57
161,733,704.70
Liabilities
Provisions for accrued expenses 38,756.54Net unrealised loss on swaps contracts 4,568,996.07Net unrealised loss on forward foreign exchange contracts 826,490.57
5,434,243.18
156,299,461.52Net assets
Statement of Net Assets in CHF and Fund Evolution
31.03.2015
51.97 68.86CHFB 63.38Capitalisation -
531.71 689.24CHFDB 643.63Capitalisation -
554.20 723.92CHFIB 672.64Capitalisation -
Total net assets
Net asset value per unit
156,299,461.52 185,816,494.47 211,118,474.50CHF
Fund Evolution 31.03.2015 30.09.2014 30.09.2013
196,751.741 8,388.005B 254,488.096 66,124.360Capitalisation - CHF
213,108.606 64,989.844DB 178,673.629 30,554.867Capitalisation - CHF
59,118.388 7,588.098IB 81,304.772 29,774.482Capitalisation - CHF
Number of units outstanding at the endof the period
at the beginningof the period
Number of units issued
Number of units redeemed
Credit Suisse (Lux) Commodity Index Plus CHF Fund
The notes are an integral part of the financial statements.

CS Investment Funds 13 (formerly Credit Suisse Fund (Lux)) • Audited Annual Report as at 31.03.2015
Page 57Credit Suisse (Lux) Commodity Index Plus CHF Fund
Net assets at the beginning of the period 185,816,494.47
Income
Interest on investments in securities (net) 220,356.43Bank interest 3,161.08
223,517.51
Expenses
Management fee 179,404.09Custodian and safe custody fees 27,682.86Administration expenses 39,644.83Printing and publication expenses 2,266.36Audit, control, legal, representative bank and other expenses 20,447.84"Taxe d'abonnement" 10,750.83
280,196.81
Net income (loss) -56,679.30
Realised gain (loss)
Net realised gain (loss) on sales of investments 5,923,819.66Net realised gain (loss) on swap contracts -25,747,686.77Net realised gain (loss) on forward foreign exchange contracts -5,944,789.21Net realised gain (loss) on foreign exchange -1,184,029.34
-26,952,685.66
Net realised gain (loss) -27,009,364.96
Change in net unrealised appreciation (depreciation)
Change in net unrealised appreciation (depreciation) on investments -2,844,437.16Change in net unrealised appreciation (depreciation) on swap contracts -3,860,063.34Change in net unrealised appreciation (depreciation) on forward foreign exchange contracts 2,095,998.25
-4,608,502.25
Net increase (decrease) in net assets as a result of operations -31,617,867.21
Subscriptions / Redemptions
Subscriptions 42,113,114.28Redemptions -40,012,280.02
2,100,834.26
Net assets at the end of the period 156,299,461.52
Statement of Operations / Changes in Net Assets in CHF
For the period from01.10.2014 to
31.03.2015
The notes are an integral part of the financial statements.
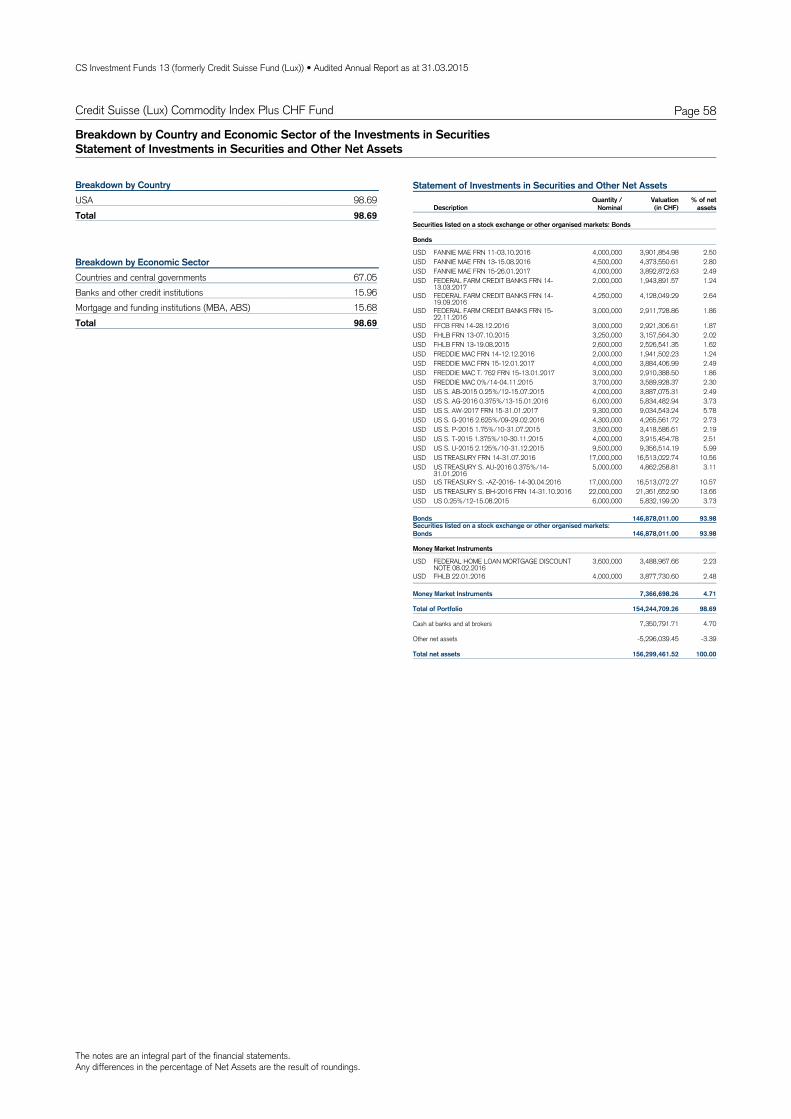
The notes are an integral part of the financial statements.Any differences in the percentage of Net Assets are the result of roundings.
CS Investment Funds 13 (formerly Credit Suisse Fund (Lux)) • Audited Annual Report as at 31.03.2015
Page 58Credit Suisse (Lux) Commodity Index Plus CHF Fund
Breakdown by Country and Economic Sector of the Investments in SecuritiesStatement of Investments in Securities and Other Net Assets
98.69USA98.69Total
Breakdown by Country
67.05Countries and central governmentsBreakdown by Economic Sector
15.96Banks and other credit institutions15.68Mortgage and funding institutions (MBA, ABS)98.69Total
Statement of Investments in Securities and Other Net Assets
DescriptionQuantity /
NominalValuation % of net
assets(in CHF)
Securities listed on a stock exchange or other organised markets: Bonds
Bonds
USD FANNIE MAE FRN 11-03.10.2016 4,000,000 3,901,854.98 2.50USD FANNIE MAE FRN 13-15.08.2016 4,500,000 4,373,550.61 2.80USD FANNIE MAE FRN 15-26.01.2017 4,000,000 3,892,872.63 2.49USD FEDERAL FARM CREDIT BANKS FRN 14-
13.03.20172,000,000 1,943,891.57 1.24
USD FEDERAL FARM CREDIT BANKS FRN 14-19.09.2016
4,250,000 4,128,049.29 2.64
USD FEDERAL FARM CREDIT BANKS FRN 15-22.11.2016
3,000,000 2,911,728.86 1.86
USD FFCB FRN 14-28.12.2016 3,000,000 2,921,306.61 1.87USD FHLB FRN 13-07.10.2015 3,250,000 3,157,564.30 2.02USD FHLB FRN 13-19.08.2015 2,600,000 2,526,541.35 1.62USD FREDDIE MAC FRN 14-12.12.2016 2,000,000 1,941,502.23 1.24USD FREDDIE MAC FRN 15-12.01.2017 4,000,000 3,884,406.99 2.49USD FREDDIE MAC T. 762 FRN 15-13.01.2017 3,000,000 2,910,388.50 1.86USD FREDDIE MAC 0%/14-04.11.2015 3,700,000 3,589,928.37 2.30USD US S. AB-2015 0.25%/12-15.07.2015 4,000,000 3,887,075.31 2.49USD US S. AG-2016 0.375%/13-15.01.2016 6,000,000 5,834,482.94 3.73USD US S. AW-2017 FRN 15-31.01.2017 9,300,000 9,034,543.24 5.78USD US S. G-2016 2.625%/09-29.02.2016 4,300,000 4,265,561.72 2.73USD US S. P-2015 1.75%/10-31.07.2015 3,500,000 3,418,586.61 2.19USD US S. T-2015 1.375%/10-30.11.2015 4,000,000 3,915,454.78 2.51USD US S. U-2015 2.125%/10-31.12.2015 9,500,000 9,356,514.19 5.99USD US TREASURY FRN 14-31.07.2016 17,000,000 16,513,022.74 10.56USD US TREASURY S. AU-2016 0.375%/14-
31.01.20165,000,000 4,862,258.81 3.11
USD US TREASURY S. -AZ-2016- 14-30.04.2016 17,000,000 16,513,072.27 10.57USD US TREASURY S. BH-2016 FRN 14-31.10.2016 22,000,000 21,361,652.90 13.66USD US 0.25%/12-15.08.2015 6,000,000 5,832,199.20 3.73
Securities listed on a stock exchange or other organised markets:Bonds 146,878,011.00 93.98
Bonds 146,878,011.00 93.98
Money Market Instruments
USD FEDERAL HOME LOAN MORTGAGE DISCOUNTNOTE 08.02.2016
3,600,000 3,488,967.66 2.23
USD FHLB 22.01.2016 4,000,000 3,877,730.60 2.48
Money Market Instruments 7,366,698.26 4.71
Total of Portfolio 154,244,709.26 98.69
Cash at banks and at brokers 7,350,791.71 4.70
Other net assets -5,296,039.45 -3.39
Total net assets 156,299,461.52 100.00

CS Investment Funds 13 (formerly Credit Suisse Fund (Lux)) • Audited Annual Report as at 31.03.2015
Page 59Credit Suisse (Lux) Commodity Index Plus USD Fund
Technical Data and Notes
USDB 2288457 LU0230918368 1.40% 1.52%Capitalisation -
Valoren ISIN Management Fee Total Expense Ratio
USDDB 2288458 LU0230918798 0.00% 0.07%Capitalisation - USDIB 2288461 LU0230918954 0.40% 0.57%Capitalisation - USDUB 26377139 LU1144406391 1.05% /Capitalisation - CHFUBH 26377140 LU1144406474 1.05% /Capitalisation - EURBH 18118457 LU0755570602 1.40% 1.57%Capitalisation - EURIBH 18118539 LU0755571592 0.40% 0.58%Capitalisation - EURUBH 26377141 LU1144406557 1.05% /Capitalisation -
Technical Data
USDB -10.73% -3.07%-17.46%/-6.23%Capitalisation - 2013 2012YTD 2014Since Inception
USDDB -9.41% -1.60%-16.24%/-5.89%Capitalisation - USDIB -9.87% -2.10%-16.67%/-6.00%Capitalisation - USDUB / //-5.18%/Capitalisation - CHFUBH / //-5.43%/Capitalisation - EURBH -11.24% /-17.72%-33.05%-6.52%Capitalisation - EURIBH -10.34% /-16.89%-31.03%-6.29%Capitalisation - EURUBH / //-5.38%/Capitalisation -
Fund Performance
For the period from 01.04.2014 to 31.03.2015, the Portfolio Turnover Rate was 230.36%.
There is no management fee for DB-units.As at 17.02.2015, Credit Suisse Fund (Lux) Commodity Index Plus (US$) became Credit Suisse (Lux) Commodity Index Plus USD Fund. The units D became DB, Ibecame IB, R became BH and S became IBH.The unit-UB, UBH CHF and EUR has been launched on 27.02.2015, the first NAV has been calculated on 02.03.2015.No TER is calculated for units launched less than 6 months ago.
26,120,000EUR USD -28,596,698 -538,568.2830.04.2015Barclays Bank PLC Wholesale (London)
9,448CHF USD -9,790 -51.2330.04.2015Goldman Sachs International (London)
26,120,000EUR USD -28,594,478 -536,348.0830.04.2015Goldman Sachs International (London)
26,120,000EUR USD -28,599,572 -541,441.4830.04.2015Commonwealth Bank Of Australia (Sydney)
1,547,551USD EUR -1,440,000 701.1530.04.2015Goldman Sachs International (London)
196USD CHF -190 -0.2230.04.2015Barclays Bank PLC Wholesale (London)
-1,615,708.14Net unrealised loss on forward foreign exchange contracts
SalesPurchases Valuation(in USD)
MaturityCounterparty
Forward foreign exchange contracts
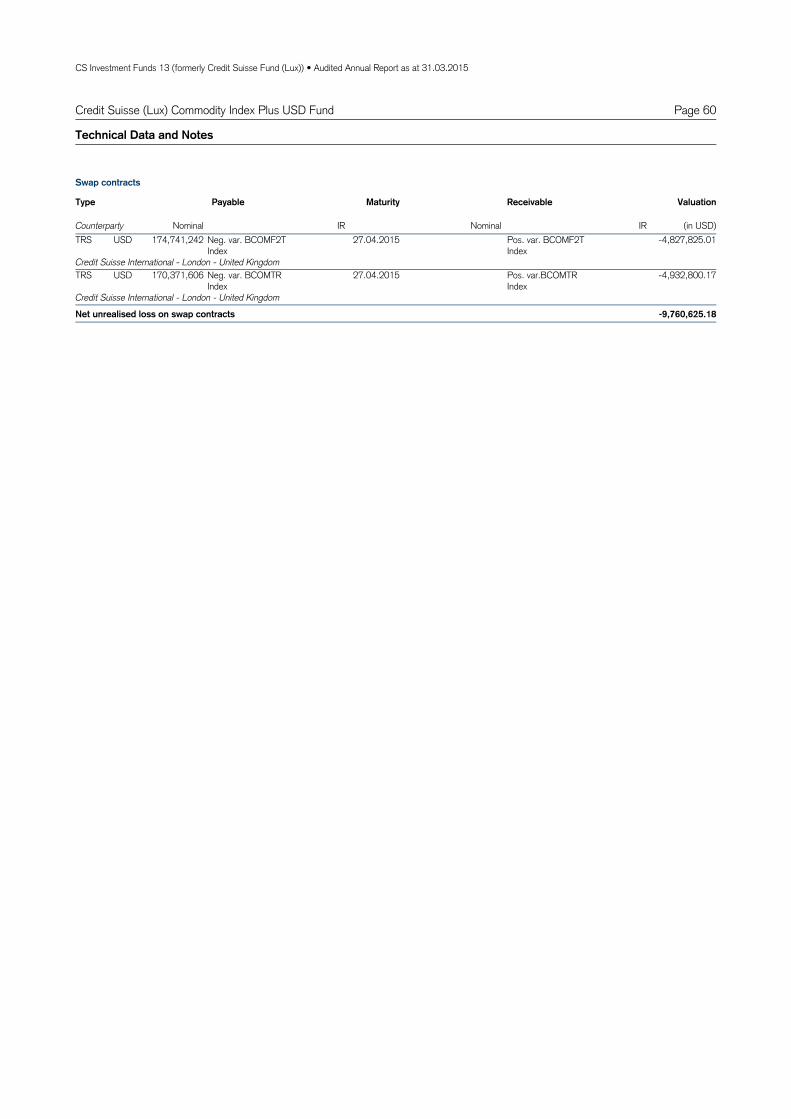
CS Investment Funds 13 (formerly Credit Suisse Fund (Lux)) • Audited Annual Report as at 31.03.2015
Page 60Credit Suisse (Lux) Commodity Index Plus USD Fund
Technical Data and Notes
TRS Neg. var. BCOMF2TIndex
27.04.2015 -4,827,825.01USD 174,741,242 Pos. var. BCOMF2TIndex
Credit Suisse International - London - United KingdomTRS Neg. var. BCOMTR
Index27.04.2015 -4,932,800.17USD 170,371,606 Pos. var.BCOMTR
IndexCredit Suisse International - London - United Kingdom
-9,760,625.18Net unrealised loss on swap contracts
Type Maturity ReceivablePayable Valuation
(in USD)Nominal IR Nominal IRCounterparty
Swap contracts

CS Investment Funds 13 (formerly Credit Suisse Fund (Lux)) • Audited Annual Report as at 31.03.2015
Page 61
Assets
Investments in securities at market value 335,310,564.22Cash at banks and at brokers 9,903,525.61Subscriptions receivable 336,923.90Income receivable 312,009.86Prepaid expenses 5,839.44
345,868,863.03
Liabilities
Redemptions payable 1,264,250.51Provisions for accrued expenses 131,246.97Net unrealised loss on swaps contracts 9,760,625.18Net unrealised loss on forward foreign exchange contracts 1,615,708.14
12,771,830.80
333,097,032.23Net assets
Statement of Net Assets in USD and Fund Evolution
31.03.2015
62.19 81.37USDB 75.26Capitalisation -
691.79 885.56USDDB 831.09Capitalisation -
622.89 803.41USDIB 750.22Capitalisation -
94.82 /USDUB /Capitalisation -
94.57 /CHFUBH /Capitalisation -
52.74 69.53EURBH 64.13Capitalisation -
549.06 713.04EURIBH 664.30Capitalisation -
94.62 /EURUBH /Capitalisation -
Total net assets
Net asset value per unit
333,097,032.23 378,589,997.07 523,956,851.97USD
Fund Evolution 31.03.2015 30.09.2014 30.09.2013
185,835.941 53,633.174B 197,587.281 65,384.514Capitalisation - USD
178,492.226 52,232.211DB 129,887.528 3,627.513Capitalisation - USD
184,392.498 83,076.590IB 221,267.291 119,951.383Capitalisation - USD
98.800 98.800UB 0.000 0.000Capitalisation - USD
98.851 98.851UBH 0.000 0.000Capitalisation - CHF
157,602.128 44,540.859BH 142,507.854 29,446.585Capitalisation - EUR
125,907.385 35,432.143IBH 93,218.149 2,742.907Capitalisation - EUR
98.923 98.923UBH 0.000 0.000Capitalisation - EUR
Number of units outstanding at the endof the period
at the beginningof the period
Number of units issued
Number of units redeemed
Credit Suisse (Lux) Commodity Index Plus USD Fund
The notes are an integral part of the financial statements.

CS Investment Funds 13 (formerly Credit Suisse Fund (Lux)) • Audited Annual Report as at 31.03.2015
Page 62Credit Suisse (Lux) Commodity Index Plus USD Fund
Net assets at the beginning of the period 378,589,997.07
Income
Interest on investments in securities (net) 481,073.94Bank interest 10,494.23Securities lending income 28,497.14
520,065.31
Expenses
Management fee 575,062.29Custodian and safe custody fees 63,294.30Administration expenses 83,395.31Printing and publication expenses 6,931.24Audit, control, legal, representative bank and other expenses 56,844.03"Taxe d'abonnement" 50,396.39
835,923.56
Net income (loss) -315,858.25
Realised gain (loss)
Net realised gain (loss) on sales of investments -401,530.36Net realised gain (loss) on swap contracts -53,639,664.75Net realised gain (loss) on forward foreign exchange contracts -11,347,147.41Net realised gain (loss) on foreign exchange -1,190,043.92
-66,578,386.44
Net realised gain (loss) -66,894,244.69
Change in net unrealised appreciation (depreciation)
Change in net unrealised appreciation (depreciation) on investments 68,431.47Change in net unrealised appreciation (depreciation) on swap contracts -8,313,306.50Change in net unrealised appreciation (depreciation) on forward foreign exchange contracts -281,508.65
-8,526,383.68
Net increase (decrease) in net assets as a result of operations -75,420,628.37
Subscriptions / Redemptions
Subscriptions 128,944,012.57Redemptions -99,016,349.04
29,927,663.53
Net assets at the end of the period 333,097,032.23
Statement of Operations / Changes in Net Assets in USD
For the period from01.10.2014 to
31.03.2015
The notes are an integral part of the financial statements.
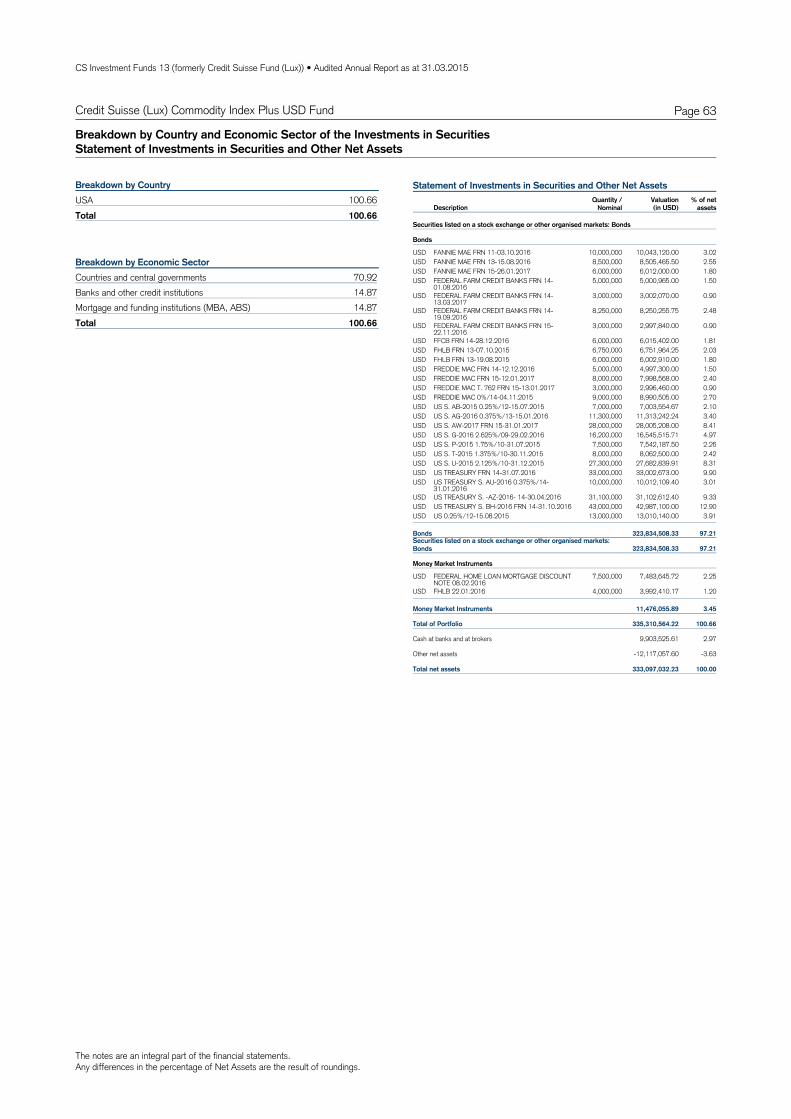
The notes are an integral part of the financial statements.Any differences in the percentage of Net Assets are the result of roundings.
CS Investment Funds 13 (formerly Credit Suisse Fund (Lux)) • Audited Annual Report as at 31.03.2015
Page 63Credit Suisse (Lux) Commodity Index Plus USD Fund
Breakdown by Country and Economic Sector of the Investments in SecuritiesStatement of Investments in Securities and Other Net Assets
100.66USA100.66Total
Breakdown by Country
70.92Countries and central governmentsBreakdown by Economic Sector
14.87Banks and other credit institutions14.87Mortgage and funding institutions (MBA, ABS)
100.66Total
Statement of Investments in Securities and Other Net Assets
DescriptionQuantity /
NominalValuation % of net
assets(in USD)
Securities listed on a stock exchange or other organised markets: Bonds
Bonds
USD FANNIE MAE FRN 11-03.10.2016 10,000,000 10,043,120.00 3.02USD FANNIE MAE FRN 13-15.08.2016 8,500,000 8,505,465.50 2.55USD FANNIE MAE FRN 15-26.01.2017 6,000,000 6,012,000.00 1.80USD FEDERAL FARM CREDIT BANKS FRN 14-
01.08.20165,000,000 5,000,965.00 1.50
USD FEDERAL FARM CREDIT BANKS FRN 14-13.03.2017
3,000,000 3,002,070.00 0.90
USD FEDERAL FARM CREDIT BANKS FRN 14-19.09.2016
8,250,000 8,250,255.75 2.48
USD FEDERAL FARM CREDIT BANKS FRN 15-22.11.2016
3,000,000 2,997,840.00 0.90
USD FFCB FRN 14-28.12.2016 6,000,000 6,015,402.00 1.81USD FHLB FRN 13-07.10.2015 6,750,000 6,751,964.25 2.03USD FHLB FRN 13-19.08.2015 6,000,000 6,002,910.00 1.80USD FREDDIE MAC FRN 14-12.12.2016 5,000,000 4,997,300.00 1.50USD FREDDIE MAC FRN 15-12.01.2017 8,000,000 7,998,568.00 2.40USD FREDDIE MAC T. 762 FRN 15-13.01.2017 3,000,000 2,996,460.00 0.90USD FREDDIE MAC 0%/14-04.11.2015 9,000,000 8,990,505.00 2.70USD US S. AB-2015 0.25%/12-15.07.2015 7,000,000 7,003,554.67 2.10USD US S. AG-2016 0.375%/13-15.01.2016 11,300,000 11,313,242.24 3.40USD US S. AW-2017 FRN 15-31.01.2017 28,000,000 28,005,208.00 8.41USD US S. G-2016 2.625%/09-29.02.2016 16,200,000 16,545,515.71 4.97USD US S. P-2015 1.75%/10-31.07.2015 7,500,000 7,542,187.50 2.26USD US S. T-2015 1.375%/10-30.11.2015 8,000,000 8,062,500.00 2.42USD US S. U-2015 2.125%/10-31.12.2015 27,300,000 27,682,839.91 8.31USD US TREASURY FRN 14-31.07.2016 33,000,000 33,002,673.00 9.90USD US TREASURY S. AU-2016 0.375%/14-
31.01.201610,000,000 10,012,109.40 3.01
USD US TREASURY S. -AZ-2016- 14-30.04.2016 31,100,000 31,102,612.40 9.33USD US TREASURY S. BH-2016 FRN 14-31.10.2016 43,000,000 42,987,100.00 12.90USD US 0.25%/12-15.08.2015 13,000,000 13,010,140.00 3.91
Securities listed on a stock exchange or other organised markets:Bonds 323,834,508.33 97.21
Bonds 323,834,508.33 97.21
Money Market Instruments
USD FEDERAL HOME LOAN MORTGAGE DISCOUNTNOTE 08.02.2016
7,500,000 7,483,645.72 2.25
USD FHLB 22.01.2016 4,000,000 3,992,410.17 1.20
Money Market Instruments 11,476,055.89 3.45
Total of Portfolio 335,310,564.22 100.66
Cash at banks and at brokers 9,903,525.61 2.97
Other net assets -12,117,057.60 -3.63
Total net assets 333,097,032.23 100.00

CS Investment Funds 13 (formerly Credit Suisse Fund (Lux)) • Audited Annual Report as at 31.03.2015
Page 64Credit Suisse (Lux) Global Responsible Equity Fund
Technical Data and Notes
EURB 4751729 LU0395641813 1.92% 2.16%Capitalisation -
Valoren ISIN Management Fee Total Expense Ratio
EURD 4751731 LU0395642464 0.00% /Capitalisation - EUREB 4751732 LU0395642381 0.70% 0.92%Capitalisation - EURIB 4751734 LU0395641904 0.75% 0.99%Capitalisation - EURUB 26377147 LU1144406714 1.15% /Capitalisation -
Technical Data
EURB 15.52% 9.55%16.46%/13.82%Capitalisation - 2013 2012YTD 2014Since Inception
EURD / 11.86%///Capitalisation - EUREB 17.22% 11.16%17.94%/14.17%Capitalisation - EURIB 16.88% 10.84%17.83%/14.15%Capitalisation - EURUB / //2.98%/Capitalisation -
Fund Performance
For the period from 01.04.2014 to 31.03.2015, the Portfolio Turnover Rate was 67.39%.
The last NAV of Credit Suisse (Lux) Global Responsible Equity Fund -D- has been calculated on 26.11.2013.As at 17.02.2015, Credit Suisse Fund (Lux) Global Responsible Equities became Credit Suisse (Lux) Global Responsible Equity Fund. The units I became IB.The unit-UB has been launched on 27.02.2015, the first NAV has been calculated on 02.03.2015.No TER is calculated for units launched less than 6 months ago.

CS Investment Funds 13 (formerly Credit Suisse Fund (Lux)) • Audited Annual Report as at 31.03.2015
Page 65
Assets
Investments in securities at market value 70,000,181.67Cash at banks and at brokers 1,737,005.87Income receivable 114,762.41Prepaid expenses 4,947.99
71,856,897.94
Liabilities
Provisions for accrued expenses 52,665.1252,665.12
71,804,232.82Net assets
Statement of Net Assets in EUR and Fund Evolution
31.03.2015
226.38 163.34EURB 191.20Capitalisation -
/ 1,804.08EURD /Capitalisation -
2,472.68 1,749.86EUREB 2,075.33Capitalisation -
1,945.53 1,379.41EURIB 1,633.63Capitalisation -
102.98 /EURUB /Capitalisation -
Total net assets
Net asset value per unit
71,804,232.82 66,153,106.80 70,701,322.27EUR
Fund Evolution 31.03.2015 30.09.2014 30.09.2013
16,288.953 3,584.208B 13,781.879 1,077.134Capitalisation - EUR
0.000 0.000D 0.000 0.000Capitalisation - EUR
23,387.000 192.000EB 26,463.000 3,268.000Capitalisation - EUR
5,263.529 0.000IB 5,263.529 0.000Capitalisation - EUR
464.150 464.150UB 0.000 0.000Capitalisation - EUR
Number of units outstanding at the endof the period
at the beginningof the period
Number of units issued
Number of units redeemed
Credit Suisse (Lux) Global Responsible Equity Fund
The notes are an integral part of the financial statements.

CS Investment Funds 13 (formerly Credit Suisse Fund (Lux)) • Audited Annual Report as at 31.03.2015
Page 66Credit Suisse (Lux) Global Responsible Equity Fund
Net assets at the beginning of the period 66,153,106.80
Income
Dividends (net) 498,046.75Bank interest 577.64
498,624.39
Expenses
Management fee 255,933.29Custodian and safe custody fees 15,081.71Administration expenses 28,881.00Printing and publication expenses 2,529.70Audit, control, legal, representative bank and other expenses 19,957.70"Taxe d'abonnement" 6,012.33
328,395.73
Net income (loss) 170,228.66
Realised gain (loss)
Net realised gain (loss) on sales of investments 2,152,460.50Net realised gain (loss) on foreign exchange 124,229.10
2,276,689.60
Net realised gain (loss) 2,446,918.26
Change in net unrealised appreciation (depreciation)
Change in net unrealised appreciation (depreciation) on investments 9,313,601.479,313,601.47
Net increase (decrease) in net assets as a result of operations 11,760,519.73
Subscriptions / Redemptions
Subscriptions 1,174,232.56Redemptions -7,283,626.27
-6,109,393.71
Net assets at the end of the period 71,804,232.82
Statement of Operations / Changes in Net Assets in EUR
For the period from01.10.2014 to
31.03.2015
The notes are an integral part of the financial statements.

The notes are an integral part of the financial statements.Any differences in the percentage of Net Assets are the result of roundings.
CS Investment Funds 13 (formerly Credit Suisse Fund (Lux)) • Audited Annual Report as at 31.03.2015
Page 67Credit Suisse (Lux) Global Responsible Equity Fund
Breakdown by Country and Economic Sector of the Investments in SecuritiesStatement of Investments in Securities and Other Net Assets
52.67USABreakdown by Country
8.77Japan4.96United Kingdom4.74France4.24Germany4.14Switzerland3.97Canada2.61Australia2.18Ireland2.02Netherlands1.57Sweden1.49Denmark0.94Bermuda0.72Singapore0.70Netherlands Antilles0.65Hong Kong0.58Portugal0.54Italy
97.49Total
11.03Banks and other credit institutionsBreakdown by Economic Sector
10.48Pharmaceuticals, cosmetics and medical products7.09Food and soft drinks6.81Petroleum6.49Internet, software and IT services5.97Insurance companies5.50Mechanical engineering and industrial equipment4.80Electrical appliances and components4.21Chemicals3.96Financial, investment and other div. companies3.39Energy and water supply3.09Textiles, garments and leather goods2.99Computer hardware and networking2.80Biotechnology2.49Vehicles2.41Electronics and semiconductors2.30Miscellaneous consumer goods2.17Graphics publishing and printing media2.17Building materials and building industry1.31Real estate1.29Lodging and catering industry, leisure facilities1.29Telecommunication1.01Healthcare and social services0.98Traffic and transportation0.73Retailing, department stores0.73Miscellaneous services
97.49Total
Statement of Investments in Securities and Other Net Assets
DescriptionQuantity /
NominalValuation % of net
assets(in EUR)
Securities listed on a stock exchange or other organised markets: Shares (and equity-type securities)
Shares (and equity-type securities)
USD ACCENTURE -A- 10,000 872,346.37 1.21CHF ACTELION (reg. shares) 5,000 539,711.45 0.75EUR ALLIANZ SE (reg. shares) (restricted) 4,500 728,325.00 1.01USD AMERICAN TOWER 5,200 455,847.30 0.63USD AMERICAN WATER WORKS 17,000 858,072.63 1.20USD AMERISOURCEBERGEN 7,800 825,536.31 1.15USD APPLE 8,500 984,781.19 1.37JPY ASAHI KASEI 70,000 624,459.19 0.87JPY ASTELLAS PHARMA 60,000 916,541.18 1.28AUD AUSTRALIA & NEW ZEALAND BANKING GROUP 35,000 912,188.36 1.27USD AUTOMATIC DATA PROCESSING 6,000 478,435.75 0.67USD AVALONBAY COMMUNITIES 3,000 486,731.84 0.68GBP AVIVA 80,000 597,138.71 0.83EUR AXA 40,000 938,200.00 1.31USD BAKER HUGHES 12,000 710,391.06 0.99CAD BANK OF MONTREAL 12,500 697,482.08 0.97EUR BAYER (reg. shares) 4,500 629,775.00 0.88USD BIOGEN 1,300 511,091.25 0.71USD BLACKROCK 2,000 681,266.29 0.95EUR BNP PARIBAS -A- 10,000 565,700.00 0.79HKD BOC HONG KONG 140,000 464,887.26 0.65USD CARDINAL HEALTH 10,000 840,502.79 1.17USD CATERPILLAR 8,000 596,126.63 0.83USD CELGENE 4,600 493,750.47 0.69USD CIGNA 6,000 723,128.49 1.01USD CITIGROUP 11,000 527,672.25 0.73USD COCA-COLA 12,500 471,950.65 0.66USD COLGATE-PALMOLIVE 11,000 710,186.22 0.99DKK COLOPLAST -B- 6,000 422,447.55 0.59USD CONOCOPHILLIPS 12,000 695,642.46 0.97USD CUMMINS 5,000 645,437.62 0.90USD DEERE & CO 11,000 898,128.49 1.25USD DEVON ENERGY 8,000 449,236.50 0.63USD DOW CHEMICAL 10,000 446,741.15 0.62USD EATON 11,000 695,744.88 0.97USD ECOLAB 6,500 692,243.95 0.96EUR EDP-ENERGIAS DE PORTUGAL (reg. shares) 120,000 418,200.00 0.58USD ELI LILLY & CO 13,000 879,376.16 1.22USD EMC 34,000 809,162.01 1.13CAD ENBRIDGE 17,000 762,984.75 1.06USD ESTEE LAUDER COMPANIES -A- 7,000 542,011.17 0.75JPY FUJI HEAVY INDUSTRIES 15,000 464,792.36 0.65USD GENERAL MILLS 9,000 474,301.68 0.66USD GILEAD SCIENCES 11,000 1,005,055.87 1.40USD GOOGLE -C- 1,100 561,266.29 0.78USD HARTFORD FINANCIAL SERVICES GROUP 23,000 895,586.59 1.25USD HOME DEPOT 6,000 634,692.74 0.88JPY HONDA MOTOR 22,000 666,664.34 0.93EUR ING GROEP (cert. shares) 55,000 750,475.00 1.05JPY INPEX 50,000 514,559.65 0.72USD INTEL 25,000 727,886.41 1.01USD INVESCO 18,200 672,586.59 0.94GBP JOHN WOOD GROUP 67,000 588,084.87 0.82SGD KEPPEL 85,000 519,277.76 0.72GBP KINGFISHER 100,000 526,090.26 0.73JPY KOMATSU 38,500 706,185.08 0.98USD KRAFT FOODS 7,900 640,790.04 0.89USD LAM RESEARCH 7,200 470,849.16 0.66USD MANPOWER 6,000 481,284.92 0.67CAD MANULIFE FINANCIAL 25,000 395,331.74 0.55USD MARATHON OIL 22,000 534,841.71 0.74USD MEAD JOHNSON NUTRITION -A- 6,000 561,620.11 0.78USD MICROSOFT 23,000 870,637.80 1.21USD MONDELEZ INTERNATIONAL 19,000 638,463.69 0.89AUD NATIONAL AUSTRALIA BANK 35,000 959,739.66 1.34EUR NATIXIS 80,000 556,880.00 0.78CHF NESTLE (reg. shares) 10,000 703,638.02 0.98USD NIKE -B- 10,000 934,171.32 1.30JPY NOMURA RESEARCH INSTITUTE 15,000 526,399.76 0.73CHF NOVARTIS (reg. shares) 5,800 534,601.93 0.74DKK NOVO-NORDISK -B- 13,000 647,324.57 0.90USD ORACLE 22,000 883,891.99 1.23USD PARKER-HANNIFIN 5,300 586,158.29 0.82USD PEPSICO 9,000 801,284.92 1.12USD PPG INDUSTRIES 3,000 630,000.00 0.88USD PROCTER & GAMBLE 6,000 457,765.36 0.64GBP PRUDENTIAL 27,000 624,009.95 0.87USD PVH 4,500 446,480.45 0.62USD QUANTA SERVICES 20,000 531,284.92 0.74EUR REED ELSEVIER 30,000 695,700.00 0.97CHF ROCHE HOLDINGS (cert. shares) 2,700 693,927.05 0.97CAD ROYAL BANK OF CANADA 9,500 532,460.94 0.74USD SANDISK 6,000 355,418.99 0.49EUR SANOFI 7,500 689,475.00 0.96

The notes are an integral part of the financial statements.Any differences in the percentage of Net Assets are the result of roundings.
CS Investment Funds 13 (formerly Credit Suisse Fund (Lux)) • Audited Annual Report as at 31.03.2015
Page 68Credit Suisse (Lux) Global Responsible Equity Fund
Statement of Investments in Securities and Other Net Assets (Continued)
DescriptionQuantity /
NominalValuation % of net
assets(in EUR)
EUR SAP SE 16,000 1,080,480.00 1.51USD SCHLUMBERGER 6,500 504,990.69 0.70USD SHERWIN-WILLIAMS 3,500 927,141.53 1.29EUR SIEMENS (reg. shares) 6,000 604,200.00 0.84SEK SKANDINAVISKA ENSKILDA BANKEN -A- 50,000 544,684.07 0.76EUR SNAM 85,000 384,200.00 0.54JPY SOFTBANK 9,300 503,992.84 0.70GBP SSE 37,000 766,134.49 1.07USD STARBUCKS 9,000 793,575.42 1.11USD STATE STREET 10,000 684,636.87 0.95JPY SUMITOMO MITSUI FINANCIAL GROUP 20,000 714,521.68 1.00USD SYMANTEC 20,000 435,102.42 0.61USD T ROWE PRICE GROUP 7,600 573,042.83 0.80SEK TELEFON LM ERICSSON -B- 50,000 585,170.99 0.81CAD TELUS NON-CANADIAN 15,000 463,922.07 0.65USD THE PRICELINE GROUP 500 541,969.27 0.75USD TIME WARNER 11,000 864,841.71 1.20EUR TOTAL 14,000 647,850.00 0.90JPY TOYOTA MOTOR 10,000 650,856.82 0.91USD UNION PACIFIC 7,000 705,931.10 0.98USD VF 12,000 841,452.51 1.17GBP VODAFONE GROUP 150,000 457,080.66 0.64USD WALT DISNEY 9,500 927,797.95 1.29CHF ZURICH INSURANCE GROUP (reg. shares) 1,600 505,085.56 0.70
Securities listed on a stock exchange or other organised markets:Shares (and equity-type securities) 70,000,181.67 97.49
Shares (and equity-type securities) 70,000,181.67 97.49
Total of Portfolio 70,000,181.67 97.49
Cash at banks and at brokers 1,737,005.87 2.42
Other net assets 67,045.28 0.09
Total net assets 71,804,232.82 100.00
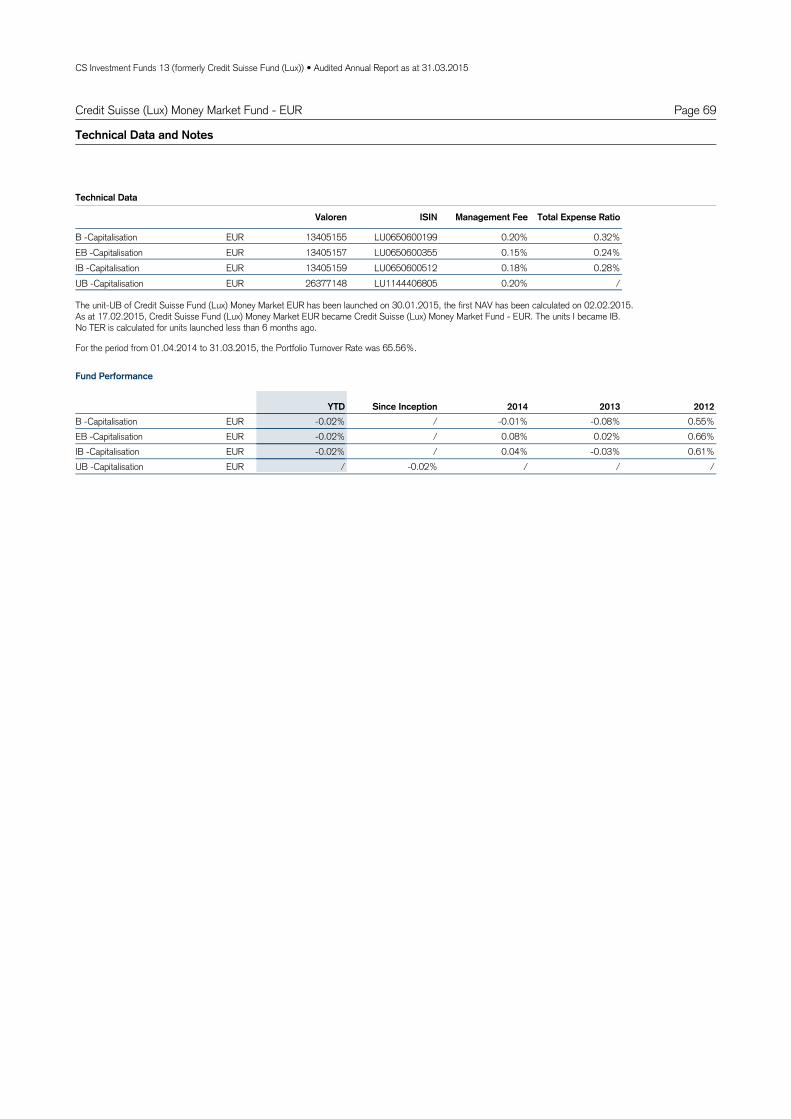
CS Investment Funds 13 (formerly Credit Suisse Fund (Lux)) • Audited Annual Report as at 31.03.2015
Page 69Credit Suisse (Lux) Money Market Fund - EUR
Technical Data and Notes
EURB 13405155 LU0650600199 0.20% 0.32%Capitalisation -
Valoren ISIN Management Fee Total Expense Ratio
EUREB 13405157 LU0650600355 0.15% 0.24%Capitalisation - EURIB 13405159 LU0650600512 0.18% 0.28%Capitalisation - EURUB 26377148 LU1144406805 0.20% /Capitalisation -
Technical Data
EURB -0.08% 0.55%-0.01%/-0.02%Capitalisation - 2013 2012YTD 2014Since Inception
EUREB 0.02% 0.66%0.08%/-0.02%Capitalisation - EURIB -0.03% 0.61%0.04%/-0.02%Capitalisation - EURUB / //-0.02%/Capitalisation -
Fund Performance
For the period from 01.04.2014 to 31.03.2015, the Portfolio Turnover Rate was 65.56%.
The unit-UB of Credit Suisse Fund (Lux) Money Market EUR has been launched on 30.01.2015, the first NAV has been calculated on 02.02.2015.As at 17.02.2015, Credit Suisse Fund (Lux) Money Market EUR became Credit Suisse (Lux) Money Market Fund - EUR. The units I became IB.No TER is calculated for units launched less than 6 months ago.

CS Investment Funds 13 (formerly Credit Suisse Fund (Lux)) • Audited Annual Report as at 31.03.2015
Page 70
Assets
Investments in securities at market value 214,398,944.74Cash at banks and at brokers 8,586,810.61Income receivable 1,123,350.00Prepaid expenses 3,362.16
224,112,467.51
Liabilities
Provisions for accrued expenses 43,722.5543,722.55
224,068,744.96Net assets
Statement of Net Assets in EUR and Fund Evolution
31.03.2015
100.61 100.68EURB 100.67Capitalisation -
116.14 116.08EUREB 116.18Capitalisation -
1,007.67 1,007.74EURIB 1,008.12Capitalisation -
99.98 /EURUB /Capitalisation -
Total net assets
Net asset value per unit
224,068,744.96 246,050,125.50 504,730,357.94EUR
Fund Evolution 31.03.2015 30.09.2014 30.09.2013
1,065,024.083 230,046.065B 1,257,835.902 422,857.884Capitalisation - EUR
558,845.001 194,612.352EB 642,362.776 278,130.127Capitalisation - EUR
51,602.589 27,003.224IB 44,435.028 19,835.663Capitalisation - EUR
98.850 98.850UB 0.000 0.000Capitalisation - EUR
Number of units outstanding at the endof the period
at the beginningof the period
Number of units issued
Number of units redeemed
Credit Suisse (Lux) Money Market Fund - EUR
The notes are an integral part of the financial statements.
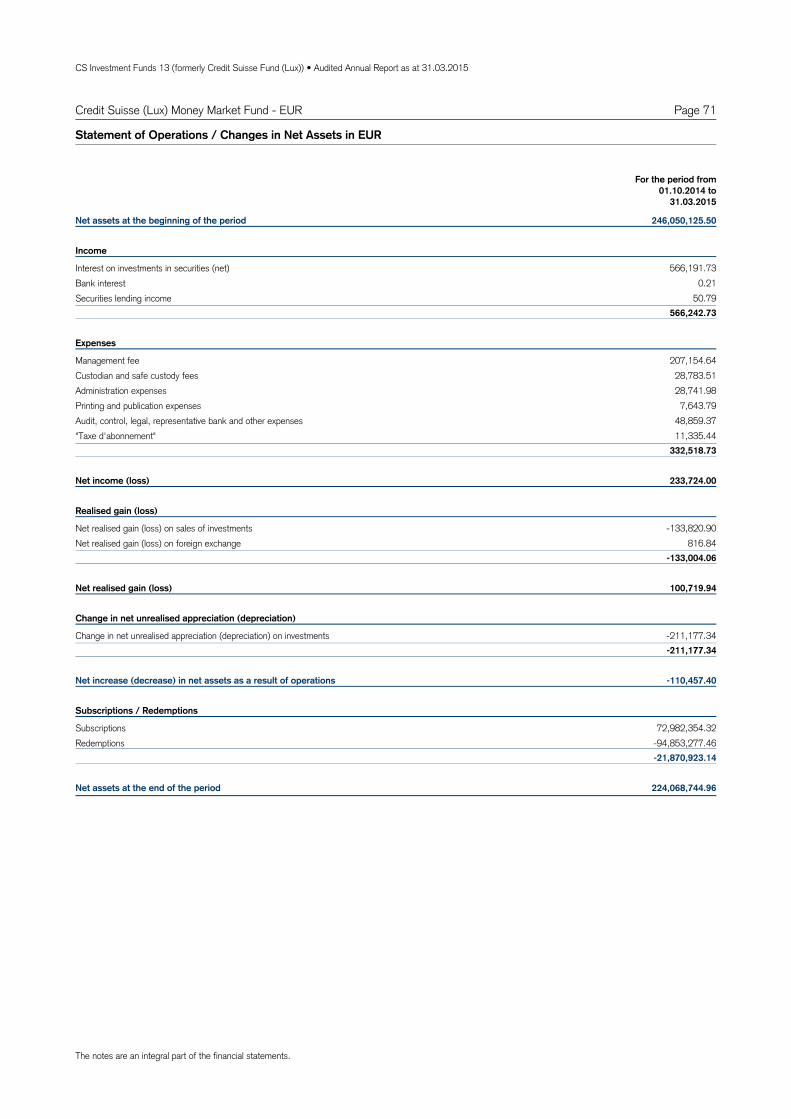
CS Investment Funds 13 (formerly Credit Suisse Fund (Lux)) • Audited Annual Report as at 31.03.2015
Page 71Credit Suisse (Lux) Money Market Fund - EUR
Net assets at the beginning of the period 246,050,125.50
Income
Interest on investments in securities (net) 566,191.73Bank interest 0.21Securities lending income 50.79
566,242.73
Expenses
Management fee 207,154.64Custodian and safe custody fees 28,783.51Administration expenses 28,741.98Printing and publication expenses 7,643.79Audit, control, legal, representative bank and other expenses 48,859.37"Taxe d'abonnement" 11,335.44
332,518.73
Net income (loss) 233,724.00
Realised gain (loss)
Net realised gain (loss) on sales of investments -133,820.90Net realised gain (loss) on foreign exchange 816.84
-133,004.06
Net realised gain (loss) 100,719.94
Change in net unrealised appreciation (depreciation)
Change in net unrealised appreciation (depreciation) on investments -211,177.34-211,177.34
Net increase (decrease) in net assets as a result of operations -110,457.40
Subscriptions / Redemptions
Subscriptions 72,982,354.32Redemptions -94,853,277.46
-21,870,923.14
Net assets at the end of the period 224,068,744.96
Statement of Operations / Changes in Net Assets in EUR
For the period from01.10.2014 to
31.03.2015
The notes are an integral part of the financial statements.
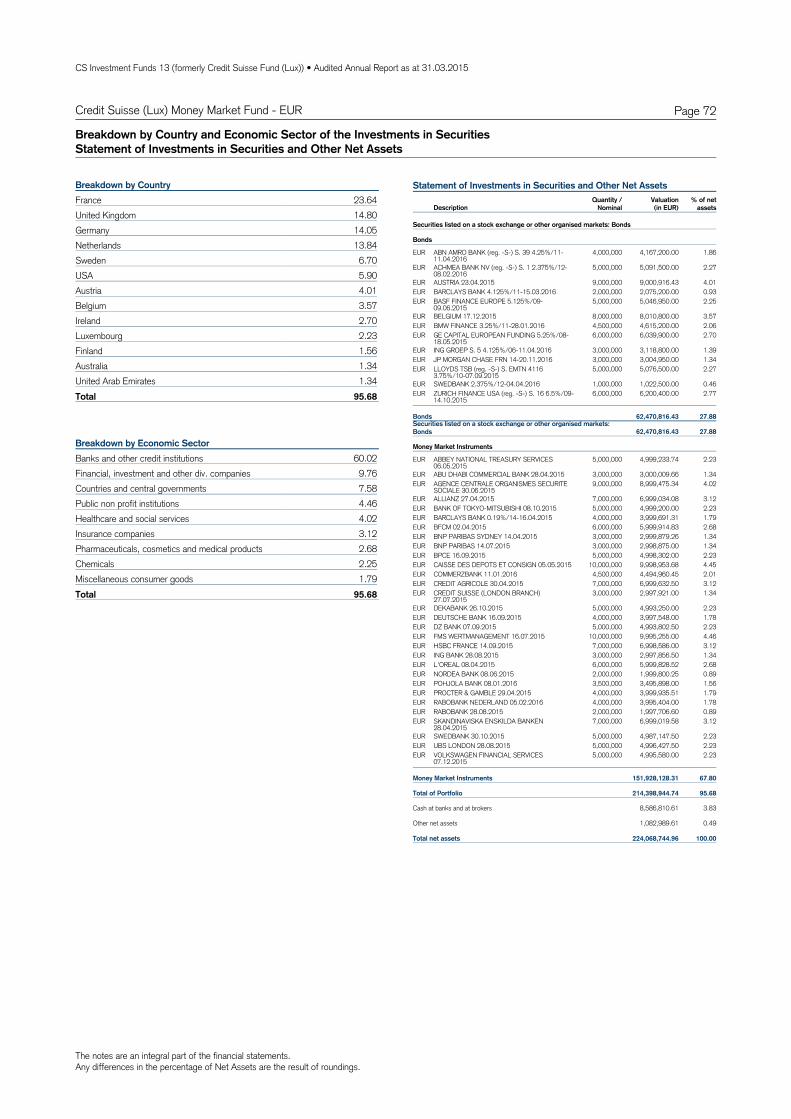
The notes are an integral part of the financial statements.Any differences in the percentage of Net Assets are the result of roundings.
CS Investment Funds 13 (formerly Credit Suisse Fund (Lux)) • Audited Annual Report as at 31.03.2015
Page 72Credit Suisse (Lux) Money Market Fund - EUR
Breakdown by Country and Economic Sector of the Investments in SecuritiesStatement of Investments in Securities and Other Net Assets
23.64FranceBreakdown by Country
14.80United Kingdom14.05Germany13.84Netherlands6.70Sweden5.90USA4.01Austria3.57Belgium2.70Ireland2.23Luxembourg1.56Finland1.34Australia1.34United Arab Emirates
95.68Total
60.02Banks and other credit institutionsBreakdown by Economic Sector
9.76Financial, investment and other div. companies7.58Countries and central governments4.46Public non profit institutions4.02Healthcare and social services3.12Insurance companies2.68Pharmaceuticals, cosmetics and medical products2.25Chemicals1.79Miscellaneous consumer goods
95.68Total
Statement of Investments in Securities and Other Net Assets
DescriptionQuantity /
NominalValuation % of net
assets(in EUR)
Securities listed on a stock exchange or other organised markets: Bonds
Bonds
EUR ABN AMRO BANK (reg. -S-) S. 39 4.25%/11-11.04.2016
4,000,000 4,167,200.00 1.86
EUR ACHMEA BANK NV (reg. -S-) S. 1 2.375%/12-08.02.2016
5,000,000 5,091,500.00 2.27
EUR AUSTRIA 23.04.2015 9,000,000 9,000,916.43 4.01EUR BARCLAYS BANK 4.125%/11-15.03.2016 2,000,000 2,075,200.00 0.93EUR BASF FINANCE EUROPE 5.125%/09-
09.06.20155,000,000 5,046,950.00 2.25
EUR BELGIUM 17.12.2015 8,000,000 8,010,800.00 3.57EUR BMW FINANCE 3.25%/11-28.01.2016 4,500,000 4,615,200.00 2.06EUR GE CAPITAL EUROPEAN FUNDING 5.25%/08-
18.05.20156,000,000 6,039,900.00 2.70
EUR ING GROEP S. 5 4.125%/06-11.04.2016 3,000,000 3,118,800.00 1.39EUR JP MORGAN CHASE FRN 14-20.11.2016 3,000,000 3,004,950.00 1.34EUR LLOYDS TSB (reg. -S-) S. EMTN 4116
3.75%/10-07.09.20155,000,000 5,076,500.00 2.27
EUR SWEDBANK 2.375%/12-04.04.2016 1,000,000 1,022,500.00 0.46EUR ZURICH FINANCE USA (reg. -S-) S. 16 6.5%/09-
14.10.20156,000,000 6,200,400.00 2.77
Securities listed on a stock exchange or other organised markets:Bonds 62,470,816.43 27.88
Bonds 62,470,816.43 27.88
Money Market Instruments
EUR ABBEY NATIONAL TREASURY SERVICES06.05.2015
5,000,000 4,999,233.74 2.23
EUR ABU DHABI COMMERCIAL BANK 28.04.2015 3,000,000 3,000,009.66 1.34EUR AGENCE CENTRALE ORGANISMES SECURITE
SOCIALE 30.06.20159,000,000 8,999,475.34 4.02
EUR ALLIANZ 27.04.2015 7,000,000 6,999,034.08 3.12EUR BANK OF TOKYO-MITSUBISHI 08.10.2015 5,000,000 4,999,200.00 2.23EUR BARCLAYS BANK 0.19%/14-16.04.2015 4,000,000 3,999,691.31 1.79EUR BFCM 02.04.2015 6,000,000 5,999,914.83 2.68EUR BNP PARIBAS SYDNEY 14.04.2015 3,000,000 2,999,879.26 1.34EUR BNP PARIBAS 14.07.2015 3,000,000 2,998,875.00 1.34EUR BPCE 16.09.2015 5,000,000 4,998,302.00 2.23EUR CAISSE DES DEPOTS ET CONSIGN 05.05.2015 10,000,000 9,998,953.68 4.45EUR COMMERZBANK 11.01.2016 4,500,000 4,494,960.45 2.01EUR CREDIT AGRICOLE 30.04.2015 7,000,000 6,999,632.50 3.12EUR CREDIT SUISSE (LONDON BRANCH)
27.07.20153,000,000 2,997,921.00 1.34
EUR DEKABANK 26.10.2015 5,000,000 4,993,250.00 2.23EUR DEUTSCHE BANK 16.09.2015 4,000,000 3,997,548.00 1.78EUR DZ BANK 07.09.2015 5,000,000 4,993,802.50 2.23EUR FMS WERTMANAGEMENT 16.07.2015 10,000,000 9,995,255.00 4.46EUR HSBC FRANCE 14.09.2015 7,000,000 6,998,586.00 3.12EUR ING BANK 28.08.2015 3,000,000 2,997,856.50 1.34EUR L'OREAL 08.04.2015 6,000,000 5,999,828.52 2.68EUR NORDEA BANK 08.06.2015 2,000,000 1,999,800.25 0.89EUR POHJOLA BANK 08.01.2016 3,500,000 3,495,898.00 1.56EUR PROCTER & GAMBLE 29.04.2015 4,000,000 3,999,935.51 1.79EUR RABOBANK NEDERLAND 05.02.2016 4,000,000 3,995,404.00 1.78EUR RABOBANK 28.08.2015 2,000,000 1,997,706.60 0.89EUR SKANDINAVISKA ENSKILDA BANKEN
28.04.20157,000,000 6,999,019.58 3.12
EUR SWEDBANK 30.10.2015 5,000,000 4,987,147.50 2.23EUR UBS LONDON 28.08.2015 5,000,000 4,996,427.50 2.23EUR VOLKSWAGEN FINANCIAL SERVICES
07.12.20155,000,000 4,995,580.00 2.23
Money Market Instruments 151,928,128.31 67.80
Total of Portfolio 214,398,944.74 95.68
Cash at banks and at brokers 8,586,810.61 3.83
Other net assets 1,082,989.61 0.49
Total net assets 224,068,744.96 100.00

CS Investment Funds 13 (formerly Credit Suisse Fund (Lux)) • Audited Annual Report as at 31.03.2015
Page 73Credit Suisse (Lux) Money Market Fund - CHF
Technical Data and Notes
CHFB 11273207 LU0507202330 0.05% 0.14%Capitalisation -
Valoren ISIN Management Fee Total Expense Ratio
CHFEB 11618822 LU0533765177 0.05% 0.14%Capitalisation - CHFP 11273229 LU0507202686 0.05% 0.14%Capitalisation - CHFUB 26377150 LU1144406987 0.05% /Capitalisation -
Technical Data
CHFB -0.02% 0.17%-0.07%/-0.02%Capitalisation - 2013 2012YTD 2014Since Inception
CHFEB -0.02% /-0.06%-0.09%-0.03%Capitalisation - CHFP -0.02% 0.17%-0.07%/-0.02%Capitalisation - CHFUB / //-0.09%/Capitalisation -
Fund Performance
For the period from 01.04.2014 to 31.03.2015, the Portfolio Turnover Rate was 46.77%.
The unit-UB of Credit Suisse Fund (Lux) Money Market Sfr has been launched on 30.01.2015, the first NAV has been calculated on 02.02.2015.As at 17.02.2015, Credit Suisse Fund (Lux) Money Market Sfr became Credit Suisse (Lux) Money Market Fund - CHF.No TER is calculated for units launched less than 6 months ago.

CS Investment Funds 13 (formerly Credit Suisse Fund (Lux)) • Audited Annual Report as at 31.03.2015
Page 74
Assets
Investments in securities at market value 580,615,579.26Cash at banks and at brokers 34,988,602.55Income receivable 3,473,342.08Prepaid expenses 9,295.70
619,086,819.59
Liabilities
Provisions for accrued expenses 54,924.8854,924.88
619,031,894.71Net assets
Statement of Net Assets in CHF and Fund Evolution
31.03.2015
713.81 714.30CHFB 714.02Capitalisation -
107.79 107.86CHFEB 107.83Capitalisation -
1,043.01 1,043.73CHFP 1,043.31Capitalisation -
99.91 /CHFUB /Capitalisation -
Total net assets
Net asset value per unit
619,031,894.71 749,922,638.15 1,033,140,371.46CHF
Fund Evolution 31.03.2015 30.09.2014 30.09.2013
809,239.071 58,516.131B 979,072.894 228,349.954Capitalisation - CHF
331,705.214 88,946.672EB 393,285.071 150,526.529Capitalisation - CHF
5,394.772 955.000P 8,092.274 3,652.502Capitalisation - CHF
98.851 98.851UB 0.000 0.000Capitalisation - CHF
Number of units outstanding at the endof the period
at the beginningof the period
Number of units issued
Number of units redeemed
Credit Suisse (Lux) Money Market Fund - CHF
The notes are an integral part of the financial statements.
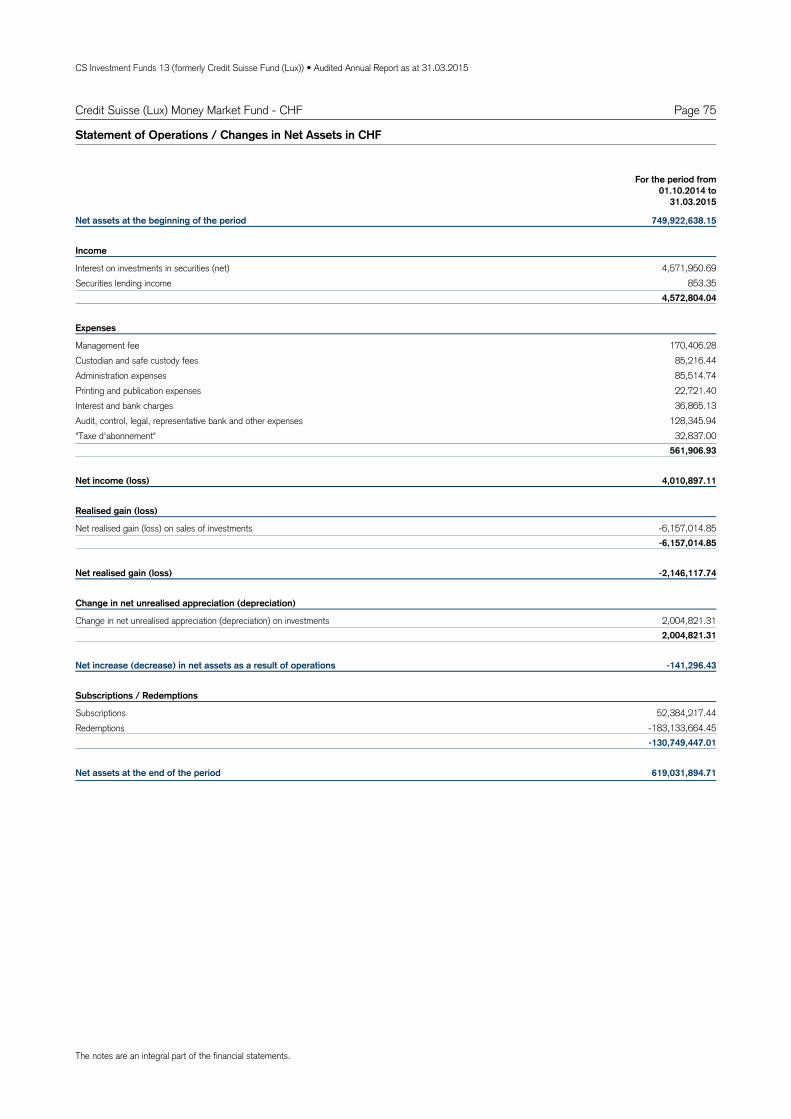
CS Investment Funds 13 (formerly Credit Suisse Fund (Lux)) • Audited Annual Report as at 31.03.2015
Page 75Credit Suisse (Lux) Money Market Fund - CHF
Net assets at the beginning of the period 749,922,638.15
Income
Interest on investments in securities (net) 4,571,950.69Securities lending income 853.35
4,572,804.04
Expenses
Management fee 170,406.28Custodian and safe custody fees 85,216.44Administration expenses 85,514.74Printing and publication expenses 22,721.40Interest and bank charges 36,865.13Audit, control, legal, representative bank and other expenses 128,345.94"Taxe d'abonnement" 32,837.00
561,906.93
Net income (loss) 4,010,897.11
Realised gain (loss)
Net realised gain (loss) on sales of investments -6,157,014.85-6,157,014.85
Net realised gain (loss) -2,146,117.74
Change in net unrealised appreciation (depreciation)
Change in net unrealised appreciation (depreciation) on investments 2,004,821.312,004,821.31
Net increase (decrease) in net assets as a result of operations -141,296.43
Subscriptions / Redemptions
Subscriptions 52,384,217.44Redemptions -183,133,664.45
-130,749,447.01
Net assets at the end of the period 619,031,894.71
Statement of Operations / Changes in Net Assets in CHF
For the period from01.10.2014 to
31.03.2015
The notes are an integral part of the financial statements.

The notes are an integral part of the financial statements.Any differences in the percentage of Net Assets are the result of roundings.
CS Investment Funds 13 (formerly Credit Suisse Fund (Lux)) • Audited Annual Report as at 31.03.2015
Page 76Credit Suisse (Lux) Money Market Fund - CHF
Breakdown by Country and Economic Sector of the Investments in SecuritiesStatement of Investments in Securities and Other Net Assets
25.02SwitzerlandBreakdown by Country
18.59France10.44Germany9.76United Kingdom8.00Netherlands4.39USA3.36Norway2.43Finland2.17Austria2.04Denmark1.98Canada1.61Australia1.12South Korea1.09International organisations0.97Mexico0.82Sweden
93.79Total
43.82Banks and other credit institutionsBreakdown by Economic Sector
25.02Countries and central governments6.17Traffic and transportation3.18Financial, investment and other div. companies2.47Petroleum2.44Mortgage and funding institutions (MBA, ABS)2.39Electrical appliances and components2.35Cantons, federal states, provinces1.60Supranational organisations1.12Public non profit institutions0.97Telecommunication0.84Insurance companies0.77Vehicles0.65Computer hardware and networking
93.79Total
Statement of Investments in Securities and Other Net Assets
DescriptionQuantity /
NominalValuation % of net
assets(in CHF)
Securities listed on a stock exchange or other organised markets: Bonds
Bonds
CHF ABBEY NATIONAL TREASURY SERVICES2.5%/11-08.06.2015
13,000,000 13,076,700.00 2.11
CHF ABN AMRO BANK 2.5%/06-30.12.2015 5,000,000 5,107,500.00 0.83CHF AEROPORTS DE PARIS 3.125%/09-15.07.2015 2,500,000 2,524,750.00 0.41CHF AMERICA MOVIL 2.25%/10-07.04.2015 6,000,000 6,001,800.00 0.97CHF ASB FINANCE EMTN FRN 12-05.11.2015 500,000 500,500.00 0.08CHF ASIAN DEVELOPMENT BANK 0%/86-
07.02.20166,730,000 6,762,304.00 1.09
CHF BARCLAYS BANK FRN 12-16.04.2015 13,000,000 13,002,470.00 2.10CHF BAWAG P.S.K. 1.25%/10-30.09.2015 1,430,000 1,431,859.00 0.23CHF BMW UK CAPITAL 2.125%/10-29.06.2015 4,760,000 4,789,988.00 0.77CHF BNG 2.75%/03-03.07.2015 16,015,000 16,154,330.50 2.61CHF BPCE 2%/10-13.04.2015 3,000,000 3,002,100.00 0.48CHF BRADFORD & BINGLEY 3.25%/07-16.07.2015 5,000,000 5,048,500.00 0.82CHF CREDIT AGRICOLE LONDON BRANCH 2%/10-
08.04.20153,000,000 3,000,900.00 0.48
CHF CRH 1.5%/10-21.09.2015 3,420,000 3,450,096.00 0.56CHF DANSKE BANK 3.5%/08-02.07.2015 12,500,000 12,620,000.00 2.04CHF DEKABANK DEUTSCHE GIROZENTRALE
3.125%/04-16.12.20151,000,000 1,021,700.00 0.17
CHF DEPFA 3%/03-15.09.2015 11,000,000 11,152,900.00 1.80CHF DNB BOLIGKREDITT 1.625%/10-24.04.2015 17,275,000 17,292,275.00 2.79CHF ERSTE GROUP BANK 2.75%/07-10.12.2015 6,875,000 6,912,125.00 1.12CHF GECC 2.625%/10-20.01.2016 8,070,000 8,267,715.00 1.34CHF GECC 3%/04-16.10.2015 3,865,000 3,934,570.00 0.64CHF GECC 3%/07-15.06.2015 2,500,000 2,518,750.00 0.41CHF HSBC SFH FRANCE 1.75%/10-07.09.2015 2,200,000 2,219,140.00 0.36CHF IBM 3.625%/08-27.05.2015 4,000,000 4,024,000.00 0.65CHF IBRD 5.5%/86-05.02.2016 3,000,000 3,153,000.00 0.51CHF KOREA LAND & HOUSING FRN 14-09.11.2016 7,000,000 6,957,510.00 1.12CHF NATIONAL AUSTRALIA BANK FRN 12-
07.08.201510,000,000 9,984,100.00 1.61
CHF NEDERLANDEN FINANCIERINGS MAAT2.625%/08-22.09.2015
8,000,000 8,124,000.00 1.31
CHF NEDERLANDSE WATERSCHAPSBANK2.5%/05-20.04.2015
3,470,000 3,475,552.00 0.56
CHF NORDEA BANK 3.375%/08-22.05.2015 1,000,000 1,005,200.00 0.16CHF NORDRHEIN-WESTFALEN 3.25%/07-
28.08.20152,250,000 2,285,550.00 0.37
CHF NORWEGIAN RAILWAYS 3.375%/08-03.08.2015
3,500,000 3,545,850.00 0.57
CHF OESTERREICHISCHE KONTROLLBANK1.5%/11-23.02.2016
5,000,000 5,084,000.00 0.82
CHF PROVINCE OF ONTARIO 2.125%/05-29.06.2015 2,050,000 2,063,530.00 0.33CHF PROVINCE OF ONTARIO 3.375%/08-01.12.2015 5,000,000 5,130,500.00 0.83CHF RABOBANK FRN 14-09.07.2014 16,700,000 16,664,596.00 2.69CHF REGIE AUTONOME DES TRANSPORTS PARIS
3.375%/08-21.03.20165,000,000 5,174,500.00 0.84
CHF REGIE AUTONOME DES TRANSPORTSPARISIENS 2.125%/05-21.07.2015
11,260,000 11,346,702.00 1.83
CHF SASKATCHEWAN 2.125%/05-15.01.2016 5,000,000 5,106,500.00 0.82CHF SNCF 5%/95-20.10.2015 3,500,000 3,608,850.00 0.58CHF SOCIETE GENERALE 1.875%/10-19.10.2015 9,370,000 9,488,999.00 1.53CHF SWEDISH EXPORT CREDIT 2.625%/09-
28.12.20154,000,000 4,094,800.00 0.66
CHF SWISS CONFEDERATION S. A-8050 0%/15-07.01.2016
15,000,000 15,091,200.00 2.44
CHF SWISS CONFEDERATION S. -3.8112- /15-04.06.2015
29,500,000 29,553,310.72 4.77
CHF SWISS CONFEDERATION S. -3.8113- /15-11.06.2015
25,000,000 25,047,670.32 4.05
CHF SWISS CONFEDERATION S. -3.8114- 14-18.06.2015
25,000,000 25,052,956.04 4.05
CHF SWISS CONFEDERATION S. -3.8115- 14-25.06.2015
25,000,000 25,053,868.14 4.05
CHF SWISS CONFEDERATION S.3.8107 0%/15-30.04.2015
35,000,000 35,022,050.00 5.66
CHF SWISS RE AMERICA HOLDING 4%/01-29.06.2015
5,140,000 5,196,026.00 0.84
CHF TOTAL CAPITAL 2.375%/06-13.01.2016 10,000,000 10,217,000.00 1.65CHF TOTAL CAPITAL 3.125%/07-29.09.2015 5,000,000 5,089,000.00 0.82CHF WESTPAC SECURITIES NZ FRN 12-02.04.2015 7,125,000 7,125,000.00 1.15CHF WESTPAC SECURITIES NZ LTD LONDON
BRANCH 1.875%/10-25.08.20153,900,000 3,936,270.00 0.64
Securities listed on a stock exchange or other organised markets:Bonds 446,495,062.72 72.12
Bonds 446,495,062.72 72.12
Money Market Instruments
CHF BARCLAYS BANK 21.08.2015 3,000,000 3,000,710.40 0.48CHF BFCM 08.05.2015 20,000,000 19,991,489.60 3.23CHF BNP PARIBAS cd 23.04.2015 7,000,000 7,003,186.48 1.13CHF BP CAPITAL MARKETS 05.05.2015 7,000,000 7,011,043.37 1.13CHF BPCE 05.05.2015 12,000,000 12,017,273.39 1.94CHF COMMERZBANK 11.09.2015 15,000,000 15,024,390.00 2.43CHF CREDIT AGRICOLE 11.09.2015 8,000,000 8,016,328.00 1.29CHF DZ BANK 07.05.2015 20,000,000 19,996,349.40 3.24CHF LANDESBANK HESSEN THUERINGEN
06.07.201510,000,000 10,010,240.00 1.62
CHF LANDESBANK HESSEN-THUERINGEN28.08.2015
5,000,000 5,007,560.00 0.81
CHF NORDEA BANK 26.05.2015 15,000,000 15,023,508.43 2.43
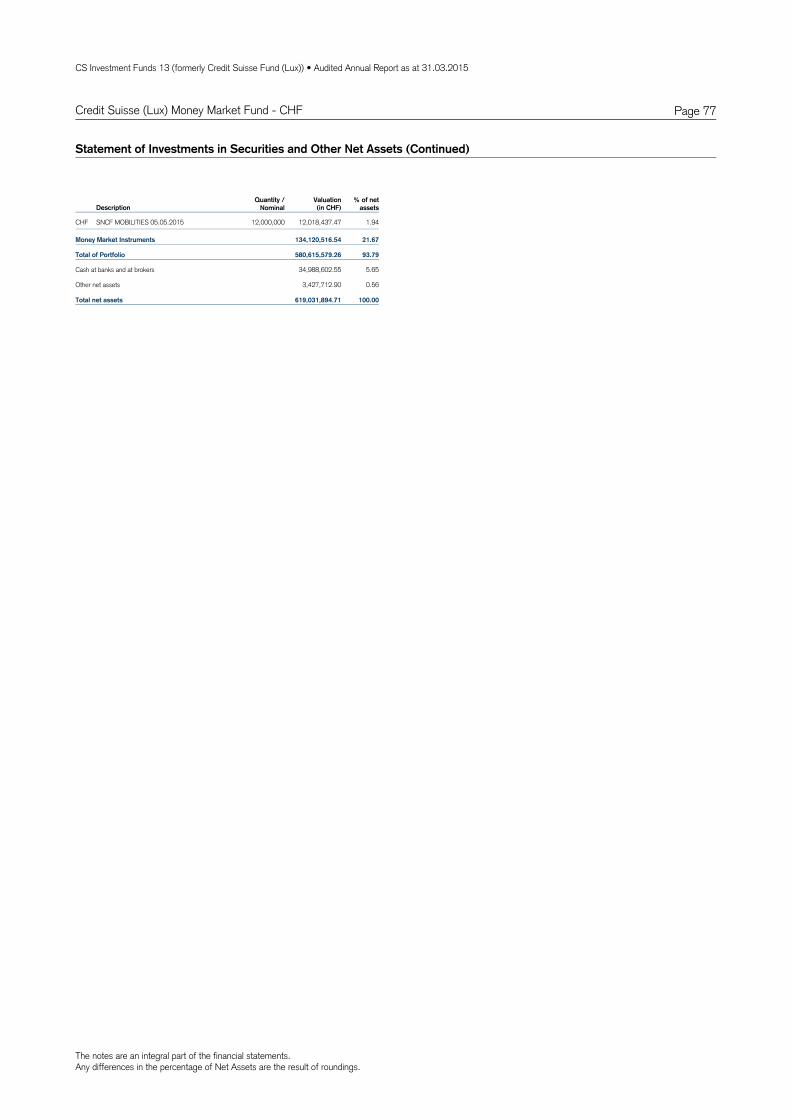
The notes are an integral part of the financial statements.Any differences in the percentage of Net Assets are the result of roundings.
CS Investment Funds 13 (formerly Credit Suisse Fund (Lux)) • Audited Annual Report as at 31.03.2015
Page 77Credit Suisse (Lux) Money Market Fund - CHF
Statement of Investments in Securities and Other Net Assets (Continued)
DescriptionQuantity /
NominalValuation % of net
assets(in CHF)
CHF SNCF MOBILITIES 05.05.2015 12,000,000 12,018,437.47 1.94
Money Market Instruments 134,120,516.54 21.67
Total of Portfolio 580,615,579.26 93.79
Cash at banks and at brokers 34,988,602.55 5.65
Other net assets 3,427,712.90 0.56
Total net assets 619,031,894.71 100.00

CS Investment Funds 13 (formerly Credit Suisse Fund (Lux)) • Audited Annual Report as at 31.03.2015
Page 78Credit Suisse (Lux) Money Market Fund - USD
Technical Data and Notes
USDB 13405161 LU0650600785 0.30% 0.40%Capitalisation -
Valoren ISIN Management Fee Total Expense Ratio
USDDB 13405162 LU0650600868 0.00% 0.06%Capitalisation - USDEB 13405163 LU0650600942 0.15% 0.24%Capitalisation - USDIB 13405166 LU0650601163 0.25% 0.36%Capitalisation - USDUB 26377154 LU1144407019 0.20% /Capitalisation -
Technical Data
USDB 0.10% 0.37%0.02%/0.01%Capitalisation - 2013 2012YTD 2014Since Inception
USDDB / /0.35%0.45%0.09%Capitalisation - USDEB 0.18% 0.36%0.16%/0.05%Capitalisation - USDIB / //0.02%0.02%Capitalisation - USDUB / //0.01%/Capitalisation -
Fund Performance
For the period from 01.04.2014 to 31.03.2015, the Portfolio Turnover Rate was 50.78%.
There is no management fee for DB-units.The unit-UB of Credit Suisse Fund (Lux) Money Market USD has been launched on 30.01.2015, the first NAV has been calculated on 02.02.2015.As at 17.02.2015, Credit Suisse Fund (Lux) Money Market USD became Credit Suisse (Lux) Money Market Fund - USD. The units D became DB and I became IB.No TER is calculated for units launched less than 6 months ago.
5,467,821USD CHF -5,000,000 312,012.6608.05.2015Credit Suisse Zürich
6,430,868USD CHF -6,000,000 214,516.4220.08.2015Credit Suisse Zürich
526,529.08Net unrealised gain on forward foreign exchange contracts
SalesPurchases Valuation(in USD)
MaturityCounterparty
Forward foreign exchange contracts

CS Investment Funds 13 (formerly Credit Suisse Fund (Lux)) • Audited Annual Report as at 31.03.2015
Page 79
Assets
Investments in securities at market value 274,280,701.94Cash at banks and at brokers 7,420,793.17Income receivable 261,221.49Prepaid expenses 1,126.19Net unrealised gain on forward foreign exchange contracts 526,529.08
282,490,371.87
Liabilities
Provisions for accrued expenses 50,333.7350,333.73
282,440,038.14Net assets
Statement of Net Assets in USD and Fund Evolution
31.03.2015
100.39 100.35USDB 100.40Capitalisation -
1,004.50 /USDDB 1,002.91Capitalisation -
116.78 116.48USDEB 116.70Capitalisation -
1,000.24 /USDIB 1,000.12Capitalisation -
100.01 /USDUB /Capitalisation -
Total net assets
Net asset value per unit
282,440,038.14 313,451,881.62 473,329,787.42USD
Fund Evolution 31.03.2015 30.09.2014 30.09.2013
848,136.657 255,538.229B 1,019,221.643 426,623.215Capitalisation - USD
122,079.999 16,335.496DB 105,744.503 0.000Capitalisation - USD
380,361.339 95,415.885EB 699,499.555 414,554.101Capitalisation - USD
30,234.750 21,244.750IB 23,433.000 14,443.000Capitalisation - USD
98.730 98.730UB 0.000 0.000Capitalisation - USD
Number of units outstanding at the endof the period
at the beginningof the period
Number of units issued
Number of units redeemed
Credit Suisse (Lux) Money Market Fund - USD
The notes are an integral part of the financial statements.

CS Investment Funds 13 (formerly Credit Suisse Fund (Lux)) • Audited Annual Report as at 31.03.2015
Page 80Credit Suisse (Lux) Money Market Fund - USD
Net assets at the beginning of the period 313,451,881.62
Income
Interest on investments in securities (net) 424,305.35Securities lending income 2,771.56
427,076.91
Expenses
Management fee 220,906.72Custodian and safe custody fees 35,939.49Administration expenses 45,454.86Printing and publication expenses 6,546.94Interest and bank charges 1.57Audit, control, legal, representative bank and other expenses 43,207.35"Taxe d'abonnement" 14,320.50
366,377.43
Net income (loss) 60,699.48
Realised gain (loss)
Net realised gain (loss) on sales of investments -294,881.46Net realised gain (loss) on forward foreign exchange contracts 599,349.48Net realised gain (loss) on foreign exchange 18,420.87
322,888.89
Net realised gain (loss) 383,588.37
Change in net unrealised appreciation (depreciation)
Change in net unrealised appreciation (depreciation) on investments -700,868.14Change in net unrealised appreciation (depreciation) on forward foreign exchange contracts 526,529.08
-174,339.06
Net increase (decrease) in net assets as a result of operations 209,249.31
Subscriptions / Redemptions
Subscriptions 74,450,510.02Redemptions -105,671,602.81
-31,221,092.79
Net assets at the end of the period 282,440,038.14
Statement of Operations / Changes in Net Assets in USD
For the period from01.10.2014 to
31.03.2015
The notes are an integral part of the financial statements.
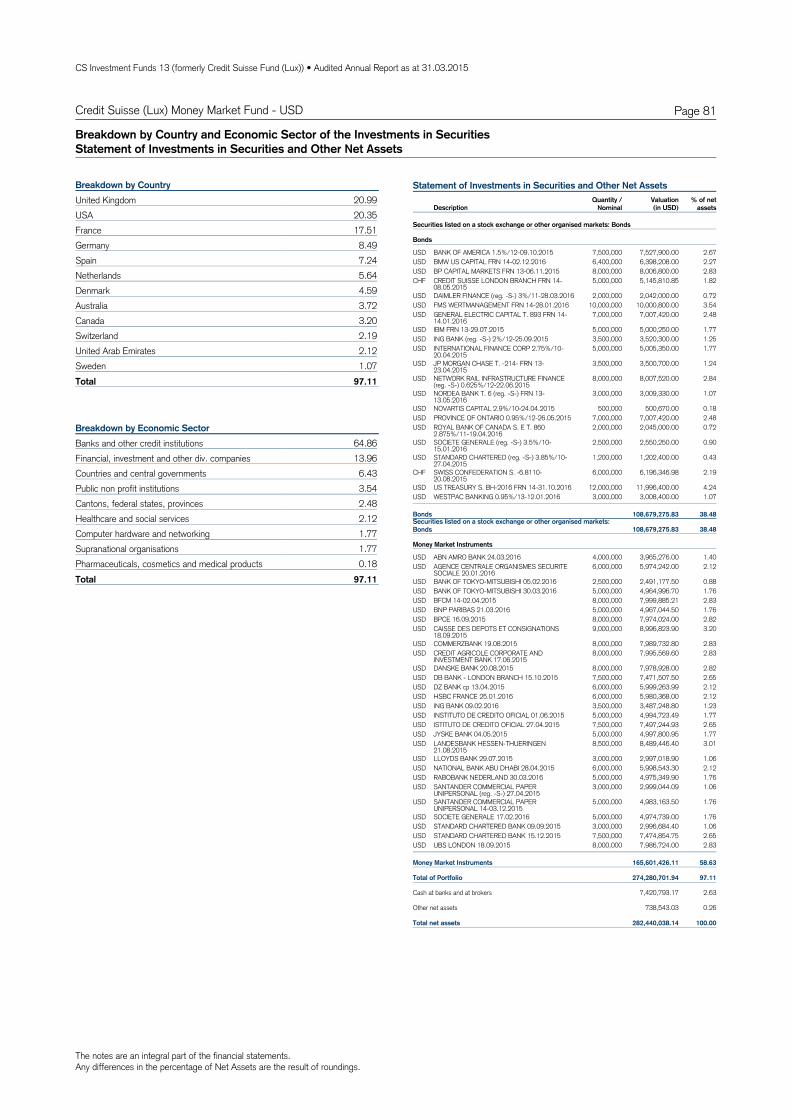
The notes are an integral part of the financial statements.Any differences in the percentage of Net Assets are the result of roundings.
CS Investment Funds 13 (formerly Credit Suisse Fund (Lux)) • Audited Annual Report as at 31.03.2015
Page 81Credit Suisse (Lux) Money Market Fund - USD
Breakdown by Country and Economic Sector of the Investments in SecuritiesStatement of Investments in Securities and Other Net Assets
20.99United KingdomBreakdown by Country
20.35USA17.51France8.49Germany7.24Spain5.64Netherlands4.59Denmark3.72Australia3.20Canada2.19Switzerland2.12United Arab Emirates1.07Sweden
97.11Total
64.86Banks and other credit institutionsBreakdown by Economic Sector
13.96Financial, investment and other div. companies6.43Countries and central governments3.54Public non profit institutions2.48Cantons, federal states, provinces2.12Healthcare and social services1.77Computer hardware and networking1.77Supranational organisations0.18Pharmaceuticals, cosmetics and medical products
97.11Total
Statement of Investments in Securities and Other Net Assets
DescriptionQuantity /
NominalValuation % of net
assets(in USD)
Securities listed on a stock exchange or other organised markets: Bonds
Bonds
USD BANK OF AMERICA 1.5%/12-09.10.2015 7,500,000 7,527,900.00 2.67USD BMW US CAPITAL FRN 14-02.12.2016 6,400,000 6,398,208.00 2.27USD BP CAPITAL MARKETS FRN 13-06.11.2015 8,000,000 8,006,800.00 2.83CHF CREDIT SUISSE LONDON BRANCH FRN 14-
08.05.20155,000,000 5,145,810.85 1.82
USD DAIMLER FINANCE (reg. -S-) 3%/11-28.03.2016 2,000,000 2,042,000.00 0.72USD FMS WERTMANAGEMENT FRN 14-28.01.2016 10,000,000 10,000,800.00 3.54USD GENERAL ELECTRIC CAPITAL T. 893 FRN 14-
14.01.20167,000,000 7,007,420.00 2.48
USD IBM FRN 13-29.07.2015 5,000,000 5,000,250.00 1.77USD ING BANK (reg. -S-) 2%/12-25.09.2015 3,500,000 3,520,300.00 1.25USD INTERNATIONAL FINANCE CORP 2.75%/10-
20.04.20155,000,000 5,005,350.00 1.77
USD JP MORGAN CHASE T. -214- FRN 13-23.04.2015
3,500,000 3,500,700.00 1.24
USD NETWORK RAIL INFRASTRUCTURE FINANCE(reg. -S-) 0.625%/12-22.06.2015
8,000,000 8,007,520.00 2.84
USD NORDEA BANK T. 6 (reg. -S-) FRN 13-13.05.2016
3,000,000 3,009,330.00 1.07
USD NOVARTIS CAPITAL 2.9%/10-24.04.2015 500,000 500,670.00 0.18USD PROVINCE OF ONTARIO 0.95%/12-26.05.2015 7,000,000 7,007,420.00 2.48USD ROYAL BANK OF CANADA S. E T. 860
2.875%/11-19.04.20162,000,000 2,045,000.00 0.72
USD SOCIETE GENERALE (reg. -S-) 3.5%/10-15.01.2016
2,500,000 2,550,250.00 0.90
USD STANDARD CHARTERED (reg. -S-) 3.85%/10-27.04.2015
1,200,000 1,202,400.00 0.43
CHF SWISS CONFEDERATION S. -6.8110-20.08.2015
6,000,000 6,196,346.98 2.19
USD US TREASURY S. BH-2016 FRN 14-31.10.2016 12,000,000 11,996,400.00 4.24USD WESTPAC BANKING 0.95%/13-12.01.2016 3,000,000 3,008,400.00 1.07
Securities listed on a stock exchange or other organised markets:Bonds 108,679,275.83 38.48
Bonds 108,679,275.83 38.48
Money Market Instruments
USD ABN AMRO BANK 24.03.2016 4,000,000 3,965,276.00 1.40USD AGENCE CENTRALE ORGANISMES SECURITE
SOCIALE 20.01.20166,000,000 5,974,242.00 2.12
USD BANK OF TOKYO-MITSUBISHI 05.02.2016 2,500,000 2,491,177.50 0.88USD BANK OF TOKYO-MITSUBISHI 30.03.2016 5,000,000 4,964,996.70 1.76USD BFCM 14-02.04.2015 8,000,000 7,999,885.21 2.83USD BNP PARIBAS 21.03.2016 5,000,000 4,967,044.50 1.76USD BPCE 16.09.2015 8,000,000 7,974,024.00 2.82USD CAISSE DES DEPOTS ET CONSIGNATIONS
18.09.20159,000,000 8,996,823.90 3.20
USD COMMERZBANK 19.08.2015 8,000,000 7,989,732.80 2.83USD CREDIT AGRICOLE CORPORATE AND
INVESTMENT BANK 17.06.20158,000,000 7,995,569.60 2.83
USD DANSKE BANK 20.08.2015 8,000,000 7,978,928.00 2.82USD DB BANK - LONDON BRANCH 15.10.2015 7,500,000 7,471,507.50 2.65USD DZ BANK cp 13.04.2015 6,000,000 5,999,263.99 2.12USD HSBC FRANCE 25.01.2016 6,000,000 5,980,368.00 2.12USD ING BANK 09.02.2016 3,500,000 3,487,248.80 1.23USD INSTITUTO DE CREDITO OFICIAL 01.06.2015 5,000,000 4,994,723.49 1.77USD ISTITUTO DE CREDITO OFICIAL 27.04.2015 7,500,000 7,497,244.93 2.65USD JYSKE BANK 04.05.2015 5,000,000 4,997,800.95 1.77USD LANDESBANK HESSEN-THUERINGEN
21.08.20158,500,000 8,489,446.40 3.01
USD LLOYDS BANK 29.07.2015 3,000,000 2,997,018.90 1.06USD NATIONAL BANK ABU DHABI 28.04.2015 6,000,000 5,998,543.30 2.12USD RABOBANK NEDERLAND 30.03.2016 5,000,000 4,975,349.90 1.76USD SANTANDER COMMERCIAL PAPER
UNIPERSONAL (reg. -S-) 27.04.20153,000,000 2,999,044.09 1.06
USD SANTANDER COMMERCIAL PAPERUNIPERSONAL 14-03.12.2015
5,000,000 4,983,163.50 1.76
USD SOCIETE GENERALE 17.02.2016 5,000,000 4,974,739.00 1.76USD STANDARD CHARTERED BANK 09.09.2015 3,000,000 2,996,684.40 1.06USD STANDARD CHARTERED BANK 15.12.2015 7,500,000 7,474,854.75 2.65USD UBS LONDON 18.09.2015 8,000,000 7,986,724.00 2.83
Money Market Instruments 165,601,426.11 58.63
Total of Portfolio 274,280,701.94 97.11
Cash at banks and at brokers 7,420,793.17 2.63
Other net assets 738,543.03 0.26
Total net assets 282,440,038.14 100.00
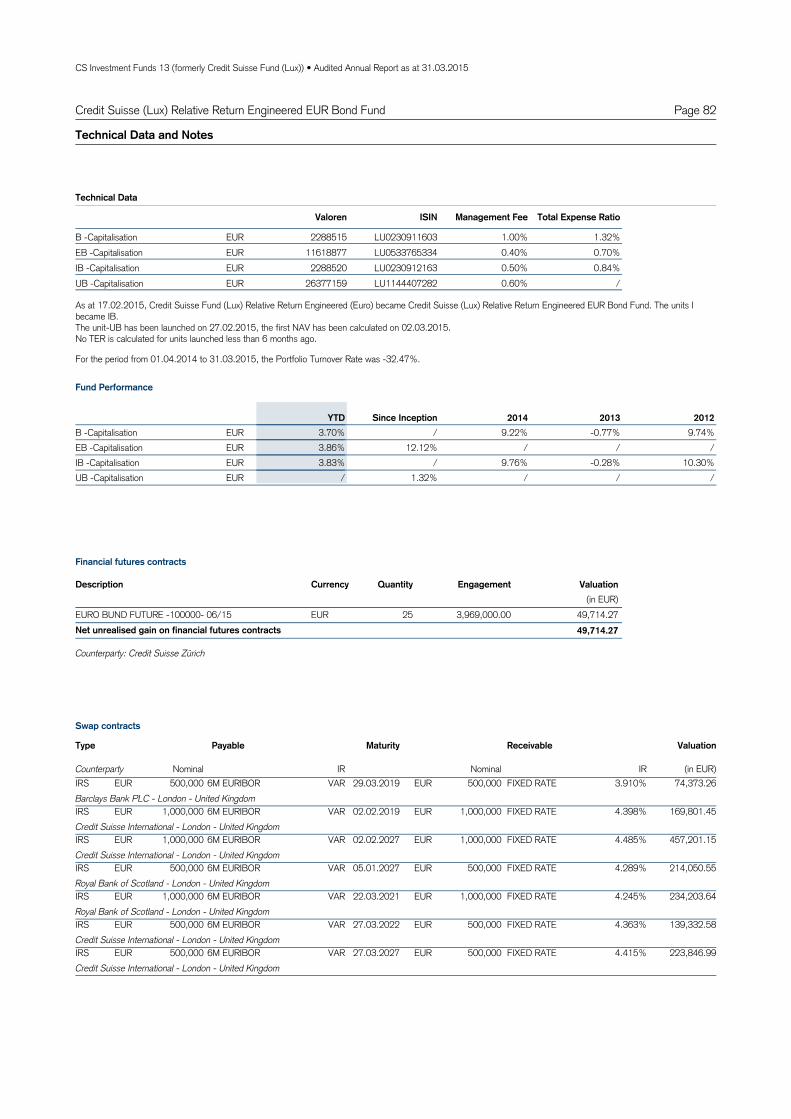
CS Investment Funds 13 (formerly Credit Suisse Fund (Lux)) • Audited Annual Report as at 31.03.2015
Page 82Credit Suisse (Lux) Relative Return Engineered EUR Bond Fund
Technical Data and Notes
EURB 2288515 LU0230911603 1.00% 1.32%Capitalisation -
Valoren ISIN Management Fee Total Expense Ratio
EUREB 11618877 LU0533765334 0.40% 0.70%Capitalisation - EURIB 2288520 LU0230912163 0.50% 0.84%Capitalisation - EURUB 26377159 LU1144407282 0.60% /Capitalisation -
Technical Data
EURB -0.77% 9.74%9.22%/3.70%Capitalisation - 2013 2012YTD 2014Since Inception
EUREB / //12.12%3.86%Capitalisation - EURIB -0.28% 10.30%9.76%/3.83%Capitalisation - EURUB / //1.32%/Capitalisation -
Fund Performance
For the period from 01.04.2014 to 31.03.2015, the Portfolio Turnover Rate was -32.47%.
As at 17.02.2015, Credit Suisse Fund (Lux) Relative Return Engineered (Euro) became Credit Suisse (Lux) Relative Return Engineered EUR Bond Fund. The units Ibecame IB.The unit-UB has been launched on 27.02.2015, the first NAV has been calculated on 02.03.2015.No TER is calculated for units launched less than 6 months ago.
EUREURO BUND FUTURE -100000- 06/15 25 3,969,000.00 49,714.2749,714.27Net unrealised gain on financial futures contracts
Quantity EngagementDescription Currency Valuation(in EUR)
Counterparty: Credit Suisse Zürich
Financial futures contracts
IRS 6M EURIBOR 29.03.2019 74,373.26EUR 500,000 VAR EUR 500,000 FIXED RATE 3.910%Barclays Bank PLC - London - United KingdomIRS 6M EURIBOR 02.02.2019 169,801.45EUR 1,000,000 VAR EUR 1,000,000 FIXED RATE 4.398%Credit Suisse International - London - United KingdomIRS 6M EURIBOR 02.02.2027 457,201.15EUR 1,000,000 VAR EUR 1,000,000 FIXED RATE 4.485%Credit Suisse International - London - United KingdomIRS 6M EURIBOR 05.01.2027 214,050.55EUR 500,000 VAR EUR 500,000 FIXED RATE 4.289%Royal Bank of Scotland - London - United KingdomIRS 6M EURIBOR 22.03.2021 234,203.64EUR 1,000,000 VAR EUR 1,000,000 FIXED RATE 4.245%Royal Bank of Scotland - London - United KingdomIRS 6M EURIBOR 27.03.2022 139,332.58EUR 500,000 VAR EUR 500,000 FIXED RATE 4.363%Credit Suisse International - London - United KingdomIRS 6M EURIBOR 27.03.2027 223,846.99EUR 500,000 VAR EUR 500,000 FIXED RATE 4.415%Credit Suisse International - London - United Kingdom
Type Maturity ReceivablePayable Valuation
(in EUR)Nominal IR Nominal IRCounterparty
Swap contracts
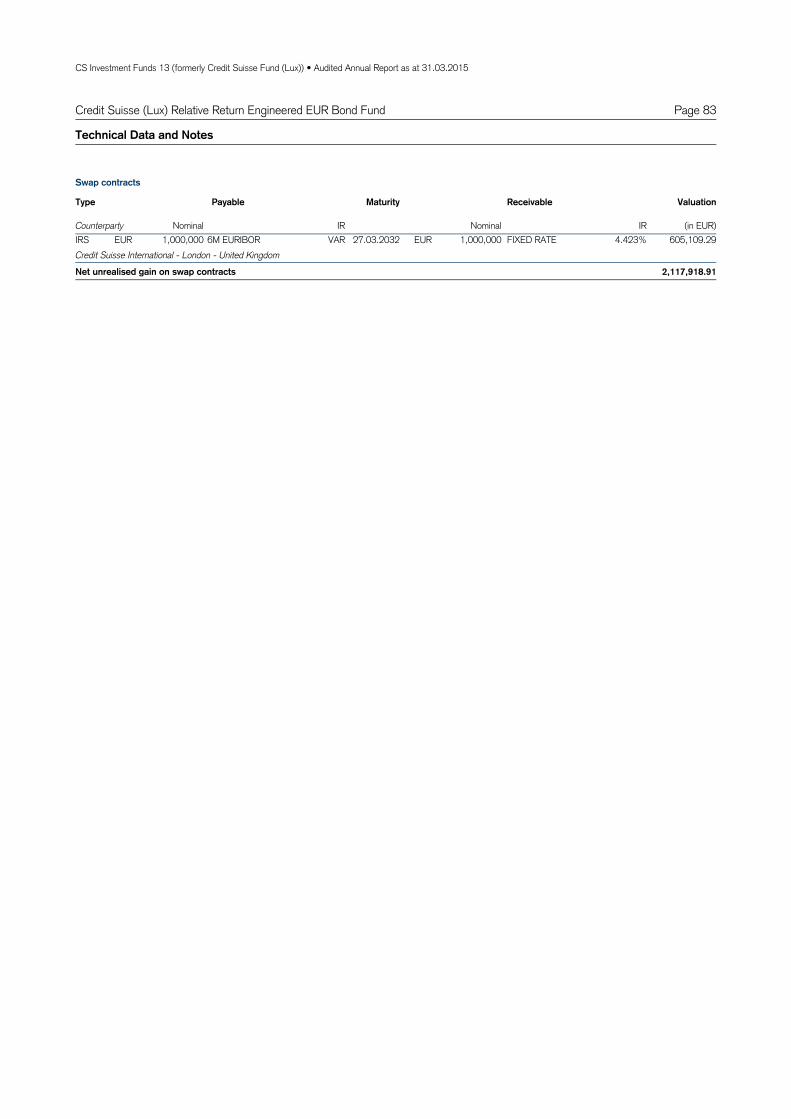
CS Investment Funds 13 (formerly Credit Suisse Fund (Lux)) • Audited Annual Report as at 31.03.2015
Page 83Credit Suisse (Lux) Relative Return Engineered EUR Bond Fund
Technical Data and Notes
IRS 6M EURIBOR 27.03.2032 605,109.29EUR 1,000,000 VAR EUR 1,000,000 FIXED RATE 4.423%Credit Suisse International - London - United Kingdom
2,117,918.91Net unrealised gain on swap contracts
Type Maturity ReceivablePayable Valuation
(in EUR)Nominal IR Nominal IRCounterparty
Swap contracts

CS Investment Funds 13 (formerly Credit Suisse Fund (Lux)) • Audited Annual Report as at 31.03.2015
Page 84
Assets
Investments in securities at market value 34,848,634.89Cash at banks and at brokers 1,776,124.79Income receivable 476,005.80Prepaid expenses 3,118.28Net unrealised gain on financial futures contracts 49,714.27Net unrealised gain on swaps contracts 2,117,918.91
39,271,516.94
Liabilities
Provisions for accrued expenses 30,663.2630,663.26
39,240,853.68Net assets
Statement of Net Assets in EUR and Fund Evolution
31.03.2015
151.76 133.52EURB 143.20Capitalisation -
1,121.18 /EUREB 1,054.54Capitalisation -
1,576.98 1,377.14EURIB 1,484.35Capitalisation -
101.32 /EURUB /Capitalisation -
Total net assets
Net asset value per unit
39,240,853.68 34,587,725.87 56,768,466.39EUR
Fund Evolution 31.03.2015 30.09.2014 30.09.2013
120,436.714 22,407.202B 133,928.330 35,898.818Capitalisation - EUR
3,833.135 962.541EB 7,193.238 4,322.644Capitalisation - EUR
10,561.857 6,380.693IB 5,270.591 1,089.427Capitalisation - EUR
98.923 98.923UB 0.000 0.000Capitalisation - EUR
Number of units outstanding at the endof the period
at the beginningof the period
Number of units issued
Number of units redeemed
Credit Suisse (Lux) Relative Return Engineered EUR Bond Fund
The notes are an integral part of the financial statements.

CS Investment Funds 13 (formerly Credit Suisse Fund (Lux)) • Audited Annual Report as at 31.03.2015
Page 85Credit Suisse (Lux) Relative Return Engineered EUR Bond Fund
Net assets at the beginning of the period 34,587,725.87
Income
Interest on investments in securities (net) 539,443.00Bank interest 641.86Securities lending income 710.28
540,795.14
Expenses
Management fee 138,635.30Custodian and safe custody fees 8,658.41Administration expenses 11,883.68Printing and publication expenses 1,734.14Audit, control, legal, representative bank and other expenses 24,914.20"Taxe d'abonnement" 8,942.27
194,768.00
Net income (loss) 346,027.14
Realised gain (loss)
Net realised gain (loss) on sales of investments 183,058.08Net realised gain (loss) on financial futures contracts 505,304.72Net realised gain (loss) on swap contracts 252,870.55Net realised gain (loss) on foreign exchange 5,556.03
946,789.38
Net realised gain (loss) 1,292,816.52
Change in net unrealised appreciation (depreciation)
Change in net unrealised appreciation (depreciation) on investments 883,297.38Change in net unrealised appreciation (depreciation) on financial futures contracts -2,045.74Change in net unrealised appreciation (depreciation) on swap contracts 206,758.78
1,088,010.42
Net increase (decrease) in net assets as a result of operations 2,380,826.94
Subscriptions / Redemptions
Subscriptions 13,975,834.49Redemptions -11,703,533.62
2,272,300.87
Net assets at the end of the period 39,240,853.68
Statement of Operations / Changes in Net Assets in EUR
For the period from01.10.2014 to
31.03.2015
The notes are an integral part of the financial statements.

The notes are an integral part of the financial statements.Any differences in the percentage of Net Assets are the result of roundings.
CS Investment Funds 13 (formerly Credit Suisse Fund (Lux)) • Audited Annual Report as at 31.03.2015
Page 86Credit Suisse (Lux) Relative Return Engineered EUR Bond Fund
Breakdown by Country and Economic Sector of the Investments in SecuritiesStatement of Investments in Securities and Other Net Assets
23.64ItalyBreakdown by Country
20.09Spain18.39Germany13.34France6.55Netherlands2.76Belgium1.36Cayman Islands1.36United Kingdom1.32Luxembourg
88.81Total
80.04Countries and central governmentsBreakdown by Economic Sector
2.68Financial, investment and other div. companies2.05Banks and other credit institutions1.40Chemicals1.36Vehicles1.28Traffic and transportation
88.81Total
Statement of Investments in Securities and Other Net Assets
DescriptionQuantity /
NominalValuation % of net
assets(in EUR)
Securities listed on a stock exchange or other organised markets: Bonds
Bonds
EUR BASF (reg. -S-) S. 9 4.625%/09-07.07.2017 500,000 550,100.00 1.40EUR BELGIUM OLO S. 49 4%/07-28.03.2017 1,000,000 1,083,200.00 2.76EUR BRD S. 0301 4.75%/03-04.07.2034 1,000,000 1,786,200.00 4.55EUR BRD 2%/11-04.01.2022 2,000,000 2,272,800.00 5.79EUR BRD 4.25%/07-04.07.2039 500,000 920,325.00 2.35EUR CREDIT SUISSE LONDON 3.875%/10-
25.01.2017500,000 532,200.00 1.36
EUR DAIMLER 4.125%/10-19.01.2017 500,000 534,910.00 1.36EUR FRANCE OAT 1%/11-25.07.2017 1,000,000 1,026,900.00 2.62EUR FRANCE OAT 2.5%/14-25.05.2030 1,000,000 1,244,900.00 3.17EUR FRANCE OAT 3.75%/05-25.04.2021 500,000 610,640.00 1.56EUR FRANCE OAT 4.25%/03-25.04.2019 2,000,000 2,349,600.00 5.99EUR GERMANY 2.5%/14-15.08.2046 750,000 1,155,390.00 2.94EUR INTESA SANPAOLO (reg. -S-) S. 684 4%/12-
09.11.2017250,000 271,675.00 0.69
EUR ITALY BTP 3.5%/13-01.06.2018 1,000,000 1,098,600.00 2.80EUR ITALY BTP 4.5%/12-15.07.2015 1,000,000 1,012,800.00 2.58EUR ITALY BTP 4.75%/11-15.09.2016 3,000,000 3,201,600.00 8.17EUR ITALY BTP 4.75%/12-01.06.2017 1,000,000 1,097,200.00 2.80EUR ITALY BTP 5%/09-01.09.2040 500,000 782,800.00 1.99EUR ITALY i/l 2.35%/14-15.09.2024 1,500,000 1,807,974.89 4.61EUR JOHN DEERE BANK 1.5%/13-16.07.2018 500,000 519,450.00 1.32EUR NETHERLANDS 0.5%/14-15.04.2017 1,000,000 1,014,100.00 2.58EUR NETHERLANDS 4%/06-15.07.2016 1,000,000 1,054,230.00 2.69EUR PRINCIPAL FINANCE GLOBAL FUNDING II (reg. -
S-) S.4 4.5%/07-26.01.2017500,000 535,600.00 1.36
EUR SPAIN 3.25%/10-30.04.2016 2,500,000 2,588,250.00 6.60EUR SPAIN 3.75%/12-31.10.2015 3,000,000 3,065,100.00 7.81EUR SPAIN 3.8%/06-31.01.2017 1,000,000 1,067,800.00 2.72EUR SPAIN 4.7%/09-30.07.2041 750,000 1,161,900.00 2.96EUR VOLKSWAGEN FINANCIAL SERVICES (-S-)
0.875%/12-04.12.2015500,000 502,390.00 1.28
Securities listed on a stock exchange or other organised markets:Bonds 34,848,634.89 88.81
Bonds 34,848,634.89 88.81
Total of Portfolio 34,848,634.89 88.81
Cash at banks and at brokers 1,776,124.79 4.53
Other net assets 2,616,094.00 6.66
Total net assets 39,240,853.68 100.00

CS Investment Funds 13 (formerly Credit Suisse Fund (Lux)) • Audited Annual Report as at 31.03.2015
Page 87Credit Suisse (Lux) Target Volatility Fund EUR
Technical Data and Notes
EURB 2187281 LU0222452368 1.30% 1.68%Capitalisation -
Valoren ISIN Management Fee Total Expense Ratio
EURIB 2187286 LU0222452954 0.60% 0.95%Capitalisation - EURUB 26377161 LU1144407365 1.05% /Capitalisation - CHFBH 18074946 LU0752725373 1.30% 1.68%Capitalisation - CHFUBH 26377163 LU1144407449 1.05% /Capitalisation - USDBH 18074957 LU0752725456 1.30% 1.68%Capitalisation - USDUBH 26377169 LU1144407522 1.05% /Capitalisation -
Technical Data
EURB -1.42% 4.31%6.26%/3.38%Capitalisation - 2013 2012YTD 2014Since Inception
EURIB -0.75% 5.07%7.01%/3.56%Capitalisation - EURUB / //0.35%/Capitalisation - CHFBH -1.62% /5.91%-0.19%3.08%Capitalisation - CHFUBH / //0.24%/Capitalisation - USDBH -1.26% /6.00%7.22%3.23%Capitalisation - USDUBH / //0.32%/Capitalisation -
Fund Performance
For the period from 01.04.2014 to 31.03.2015, the Portfolio Turnover Rate was 52.24%.
As at 17.02.2015, Credit Suisse Fund (Lux) Target Volatility (Euro) became Credit Suisse (Lux) Target Volatility Fund EUR. The units I became IB and R became BH.The unit-UB in EUR, the unit-UBH in CHF and in USD has been launched on 27.02.2015, the first NAV has been calculated on 02.03.2015.No TER is calculated for units launched less than 6 months ago.
5,295,132CHF EUR -4,994,597 93,588.2517.06.2015Credit Suisse Zürich
4,812,063USD EUR -4,548,169 -71,898.0817.06.2015Credit Suisse Zürich
45,681EUR USD -48,605 468.3317.06.2015Credit Suisse Zürich
74,650EUR USD -80,481 -215.1917.06.2015Credit Suisse Zürich
97,975EUR USD -107,060 -1,615.7617.06.2015Credit Suisse Zürich
96,039EUR USD -104,741 -1,394.9717.06.2015Credit Suisse Zürich
41,813CHF EUR -40,026 152.8917.06.2015Credit Suisse Zürich
47,940EUR USD -51,992 -424.9817.06.2015Credit Suisse Zürich
18,660.49Net unrealised gain on forward foreign exchange contracts
SalesPurchases Valuation(in EUR)
MaturityCounterparty
Forward foreign exchange contracts
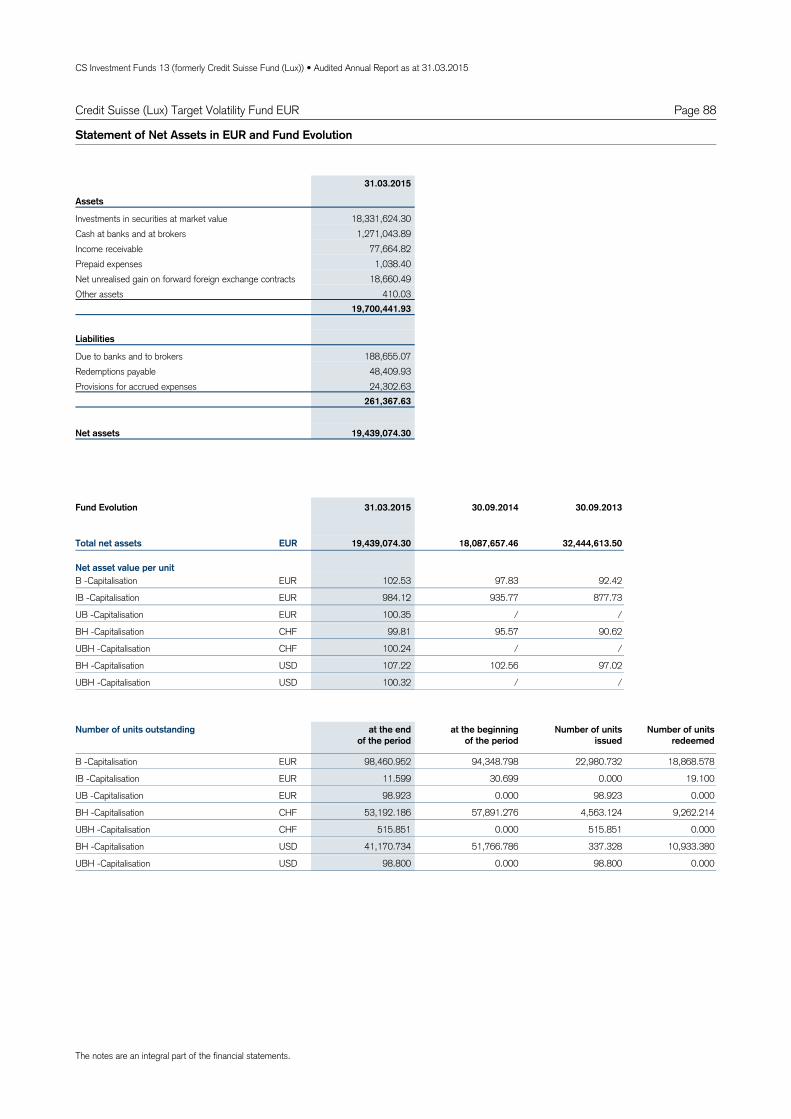
CS Investment Funds 13 (formerly Credit Suisse Fund (Lux)) • Audited Annual Report as at 31.03.2015
Page 88
Assets
Investments in securities at market value 18,331,624.30Cash at banks and at brokers 1,271,043.89Income receivable 77,664.82Prepaid expenses 1,038.40Net unrealised gain on forward foreign exchange contracts 18,660.49Other assets 410.03
19,700,441.93
Liabilities
Due to banks and to brokers 188,655.07Redemptions payable 48,409.93Provisions for accrued expenses 24,302.63
261,367.63
19,439,074.30Net assets
Statement of Net Assets in EUR and Fund Evolution
31.03.2015
102.53 92.42EURB 97.83Capitalisation -
984.12 877.73EURIB 935.77Capitalisation -
100.35 /EURUB /Capitalisation -
99.81 90.62CHFBH 95.57Capitalisation -
100.24 /CHFUBH /Capitalisation -
107.22 97.02USDBH 102.56Capitalisation -
100.32 /USDUBH /Capitalisation -
Total net assets
Net asset value per unit
19,439,074.30 18,087,657.46 32,444,613.50EUR
Fund Evolution 31.03.2015 30.09.2014 30.09.2013
98,460.952 22,980.732B 94,348.798 18,868.578Capitalisation - EUR
11.599 0.000IB 30.699 19.100Capitalisation - EUR
98.923 98.923UB 0.000 0.000Capitalisation - EUR
53,192.186 4,563.124BH 57,891.276 9,262.214Capitalisation - CHF
515.851 515.851UBH 0.000 0.000Capitalisation - CHF
41,170.734 337.328BH 51,766.786 10,933.380Capitalisation - USD
98.800 98.800UBH 0.000 0.000Capitalisation - USD
Number of units outstanding at the endof the period
at the beginningof the period
Number of units issued
Number of units redeemed
Credit Suisse (Lux) Target Volatility Fund EUR
The notes are an integral part of the financial statements.

CS Investment Funds 13 (formerly Credit Suisse Fund (Lux)) • Audited Annual Report as at 31.03.2015
Page 89Credit Suisse (Lux) Target Volatility Fund EUR
Net assets at the beginning of the period 18,087,657.46
Income
Interest on investments in securities (net) 90,508.81Dividends (net) 25,079.77Bank interest 166.53Securities lending income 1,276.53
117,031.64
Expenses
Management fee 124,154.68Custodian and safe custody fees 4,299.96Administration expenses 5,821.34Printing and publication expenses 991.31Audit, control, legal, representative bank and other expenses 9,587.67"Taxe d'abonnement" 4,173.40
149,028.36
Net income (loss) -31,996.72
Realised gain (loss)
Net realised gain (loss) on sales of investments 607,113.68Net realised gain (loss) on forward foreign exchange contracts 1,436,340.63Net realised gain (loss) on foreign exchange 62,290.75
2,105,745.06
Net realised gain (loss) 2,073,748.34
Change in net unrealised appreciation (depreciation)
Change in net unrealised appreciation (depreciation) on investments 306,361.16Change in net unrealised appreciation (depreciation) on forward foreign exchange contracts -85,769.34
220,591.82
Net increase (decrease) in net assets as a result of operations 2,294,340.16
Subscriptions / Redemptions
Subscriptions 2,745,137.15Redemptions -3,688,060.47
-942,923.32
Net assets at the end of the period 19,439,074.30
Statement of Operations / Changes in Net Assets in EUR
For the period from01.10.2014 to
31.03.2015
The notes are an integral part of the financial statements.
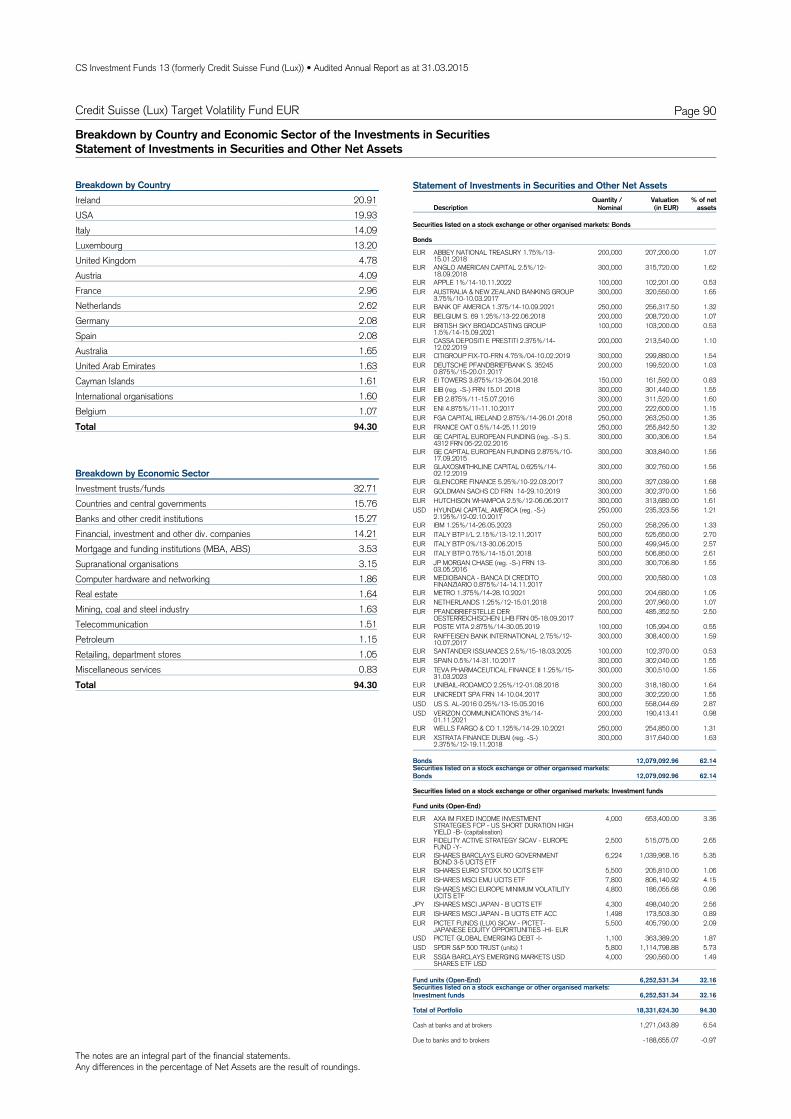
The notes are an integral part of the financial statements.Any differences in the percentage of Net Assets are the result of roundings.
CS Investment Funds 13 (formerly Credit Suisse Fund (Lux)) • Audited Annual Report as at 31.03.2015
Page 90Credit Suisse (Lux) Target Volatility Fund EUR
Breakdown by Country and Economic Sector of the Investments in SecuritiesStatement of Investments in Securities and Other Net Assets
20.91IrelandBreakdown by Country
19.93USA14.09Italy13.20Luxembourg4.78United Kingdom4.09Austria2.96France2.62Netherlands2.08Germany2.08Spain1.65Australia1.63United Arab Emirates1.61Cayman Islands1.60International organisations1.07Belgium
94.30Total
32.71Investment trusts/fundsBreakdown by Economic Sector
15.76Countries and central governments15.27Banks and other credit institutions14.21Financial, investment and other div. companies3.53Mortgage and funding institutions (MBA, ABS)3.15Supranational organisations1.86Computer hardware and networking1.64Real estate1.63Mining, coal and steel industry1.51Telecommunication1.15Petroleum1.05Retailing, department stores0.83Miscellaneous services
94.30Total
Statement of Investments in Securities and Other Net Assets
DescriptionQuantity /
NominalValuation % of net
assets(in EUR)
Securities listed on a stock exchange or other organised markets: Bonds
Bonds
EUR ABBEY NATIONAL TREASURY 1.75%/13-15.01.2018
200,000 207,200.00 1.07
EUR ANGLO AMERICAN CAPITAL 2.5%/12-18.09.2018
300,000 315,720.00 1.62
EUR APPLE 1%/14-10.11.2022 100,000 102,201.00 0.53EUR AUSTRALIA & NEW ZEALAND BANKING GROUP
3.75%/10-10.03.2017300,000 320,550.00 1.65
EUR BANK OF AMERICA 1.375/14-10.09.2021 250,000 256,317.50 1.32EUR BELGIUM S. 69 1.25%/13-22.06.2018 200,000 208,720.00 1.07EUR BRITISH SKY BROADCASTING GROUP
1.5%/14-15.09.2021100,000 103,200.00 0.53
EUR CASSA DEPOSITI E PRESTITI 2.375%/14-12.02.2019
200,000 213,540.00 1.10
EUR CITIGROUP FIX-TO-FRN 4.75%/04-10.02.2019 300,000 299,880.00 1.54EUR DEUTSCHE PFANDBRIEFBANK S. 35245
0.875%/15-20.01.2017200,000 199,520.00 1.03
EUR EI TOWERS 3.875%/13-26.04.2018 150,000 161,592.00 0.83EUR EIB (reg. -S-) FRN 15.01.2018 300,000 301,440.00 1.55EUR EIB 2.875%/11-15.07.2016 300,000 311,520.00 1.60EUR ENI 4.875%/11-11.10.2017 200,000 222,600.00 1.15EUR FGA CAPITAL IRELAND 2.875%/14-26.01.2018 250,000 263,250.00 1.35EUR FRANCE OAT 0.5%/14-25.11.2019 250,000 255,842.50 1.32EUR GE CAPITAL EUROPEAN FUNDING (reg. -S-) S.
4312 FRN 06-22.02.2016300,000 300,306.00 1.54
EUR GE CAPITAL EUROPEAN FUNDING 2.875%/10-17.09.2015
300,000 303,840.00 1.56
EUR GLAXOSMITHKLINE CAPITAL 0.625%/14-02.12.2019
300,000 302,760.00 1.56
EUR GLENCORE FINANCE 5.25%/10-22.03.2017 300,000 327,039.00 1.68EUR GOLDMAN SACHS CD FRN 14-29.10.2019 300,000 302,370.00 1.56EUR HUTCHISON WHAMPOA 2.5%/12-06.06.2017 300,000 313,680.00 1.61USD HYUNDAI CAPITAL AMERICA (reg. -S-)
2.125%/12-02.10.2017250,000 235,323.56 1.21
EUR IBM 1.25%/14-26.05.2023 250,000 258,295.00 1.33EUR ITALY BTP I/L 2.15%/13-12.11.2017 500,000 525,650.00 2.70EUR ITALY BTP 0%/13-30.06.2015 500,000 499,945.00 2.57EUR ITALY BTP 0.75%/14-15.01.2018 500,000 506,850.00 2.61EUR JP MORGAN CHASE (reg. -S-) FRN 13-
03.05.2016300,000 300,706.80 1.55
EUR MEDIOBANCA - BANCA DI CREDITOFINANZIARIO 0.875%/14-14.11.2017
200,000 200,580.00 1.03
EUR METRO 1.375%/14-28.10.2021 200,000 204,680.00 1.05EUR NETHERLANDS 1.25%/12-15.01.2018 200,000 207,960.00 1.07EUR PFANDBRIEFSTELLE DER
OESTERREICHISCHEN LHB FRN 05-18.09.2017500,000 485,352.50 2.50
EUR POSTE VITA 2.875%/14-30.05.2019 100,000 105,994.00 0.55EUR RAIFFEISEN BANK INTERNATIONAL 2.75%/12-
10.07.2017300,000 308,400.00 1.59
EUR SANTANDER ISSUANCES 2.5%/15-18.03.2025 100,000 102,370.00 0.53EUR SPAIN 0.5%/14-31.10.2017 300,000 302,040.00 1.55EUR TEVA PHARMACEUTICAL FINANCE II 1.25%/15-
31.03.2023300,000 300,510.00 1.55
EUR UNIBAIL-RODAMCO 2.25%/12-01.08.2018 300,000 318,180.00 1.64EUR UNICREDIT SPA FRN 14-10.04.2017 300,000 302,220.00 1.55USD US S. AL-2016 0.25%/13-15.05.2016 600,000 558,044.69 2.87USD VERIZON COMMUNICATIONS 3%/14-
01.11.2021200,000 190,413.41 0.98
EUR WELLS FARGO & CO 1.125%/14-29.10.2021 250,000 254,850.00 1.31EUR XSTRATA FINANCE DUBAI (reg. -S-)
2.375%/12-19.11.2018300,000 317,640.00 1.63
Securities listed on a stock exchange or other organised markets:Bonds 12,079,092.96 62.14
Bonds 12,079,092.96 62.14
Securities listed on a stock exchange or other organised markets: Investment funds
Fund units (Open-End)
EUR AXA IM FIXED INCOME INVESTMENTSTRATEGIES FCP - US SHORT DURATION HIGHYIELD -B- (capitalisation)
4,000 653,400.00 3.36
EUR FIDELITY ACTIVE STRATEGY SICAV - EUROPEFUND -Y-
2,500 515,075.00 2.65
EUR ISHARES BARCLAYS EURO GOVERNMENTBOND 3-5 UCITS ETF
6,224 1,039,968.16 5.35
EUR ISHARES EURO STOXX 50 UCITS ETF 5,500 205,810.00 1.06EUR ISHARES MSCI EMU UCITS ETF 7,800 806,140.92 4.15EUR ISHARES MSCI EUROPE MINIMUM VOLATILITY
UCITS ETF4,800 186,055.68 0.96
JPY ISHARES MSCI JAPAN - B UCITS ETF 4,300 498,040.20 2.56EUR ISHARES MSCI JAPAN - B UCITS ETF ACC 1,498 173,503.30 0.89EUR PICTET FUNDS (LUX) SICAV - PICTET-
JAPANESE EQUITY OPPORTUNITIES -HI- EUR5,500 405,790.00 2.09
USD PICTET GLOBAL EMERGING DEBT -I- 1,100 363,389.20 1.87USD SPDR S&P 500 TRUST (units) 1 5,800 1,114,798.88 5.73EUR SSGA BARCLAYS EMERGING MARKETS USD
SHARES ETF USD4,000 290,560.00 1.49
Securities listed on a stock exchange or other organised markets:Investment funds 6,252,531.34 32.16
Fund units (Open-End) 6,252,531.34 32.16
Total of Portfolio 18,331,624.30 94.30
Cash at banks and at brokers 1,271,043.89 6.54
Due to banks and to brokers -188,655.07 -0.97
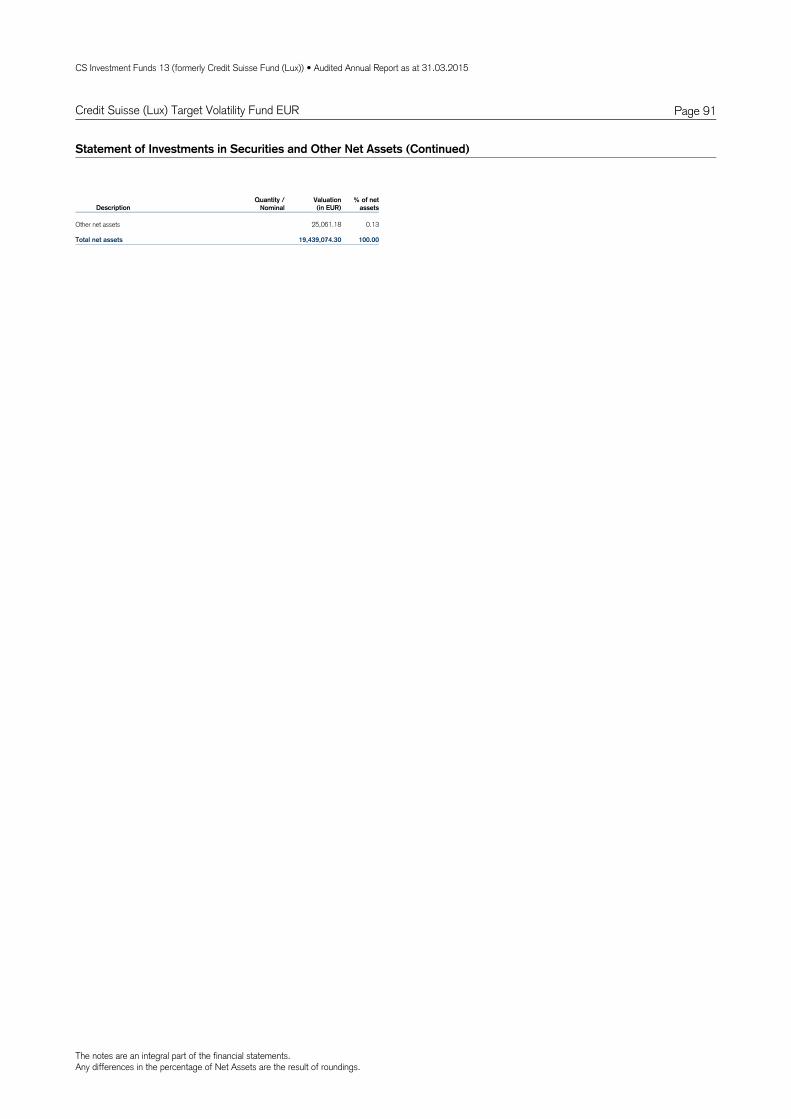
The notes are an integral part of the financial statements.Any differences in the percentage of Net Assets are the result of roundings.
CS Investment Funds 13 (formerly Credit Suisse Fund (Lux)) • Audited Annual Report as at 31.03.2015
Page 91Credit Suisse (Lux) Target Volatility Fund EUR
Statement of Investments in Securities and Other Net Assets (Continued)
DescriptionQuantity /
NominalValuation % of net
assets(in EUR)
Other net assets 25,061.18 0.13
Total net assets 19,439,074.30 100.00

CS Investment Funds 13 (formerly Credit Suisse Fund (Lux)) • Audited Annual Report as at 31.03.2015
Unaudited information Page 92
Risk Management
1. VaR information
The subfund listed in the table below is following the Relative VaR approach for calculation of global exposure. The VaR levels reached during the financial year and VaR limits are shown for each fund in the below table.
(*)Period from 01.04.2014 to 31.03.2015 Applied calculation standards The following calculation standards are used in daily calculation of the VaR: ■ Confidence interval: 99% ■ Holding period: 1 month (20 business days) ■ Effective observation period: 250 days ■ Data set updates: Daily ■ Calculation frequency: Daily ■ Model: Monte Carlo simulation
2. Leverage information The levels of leverage reached during the financial year are shown for each fund in the below table.
(*)Period from 01.04.2014 to 31.03.2015 In accordance with the regulatory requirements the leverage is calculated by way of the sum of the notionals of the derivatives. The sum of the notionals takes into account the absolute values of notionals of all the financial derivative instruments used by the Subfund. Henceforth the level of leverage is an indicator of the intensity of the use of financial derivative instruments within the Subfund and is not an indicator of the investment risks in relation to those derivatives because it does not take into account any netting or hedging effects.
Launch Lowest
VaR (*)
Highest VaR (*)
Average VaR (*)
Reference Portfolio
Regulatorlimit
Credit Suisse (Lux)Relative Return Engineered EUR Bond 03/01/2008 1.09% 2.78% 1.63%
JP Morgan EMU T raded TM
2 times benchmark
Fund
Launch
Leverage calculation method
Minimum leverage (*)
Maximum leverage
(*)
Average leverage
(*)
Excepted
Leverage Prospectus
Credit Suisse (Lux) Relative Return Engineered EUR Bond Fund
03/01/2008
Sum of Notionals
0.03
1.00
0.25
0.25

CREDIT SUISSE FUND MANAGEMENT S.A.5, rue Jean MonnetL-2180 Luxembourg
www.credit-suisse.com