credit suisse (lux) multi-advisor equity alpha fund · 2017-01-27 · credit suisse (lux)...
TRANSCRIPT
Asset Management – Alternative Investments
Dirk Wieringa
January 2017
Alternative Funds Solutions
Credit Suisse (Lux) Multi-Advisor Equity Alpha
Fund

January 2017 Asset Management 2 The disclaimer at the end is also applicable to this page.
“Best Ideas Long/Short Equity”
January 2017 Asset Management 3 The disclaimer at the end is also applicable to this page.
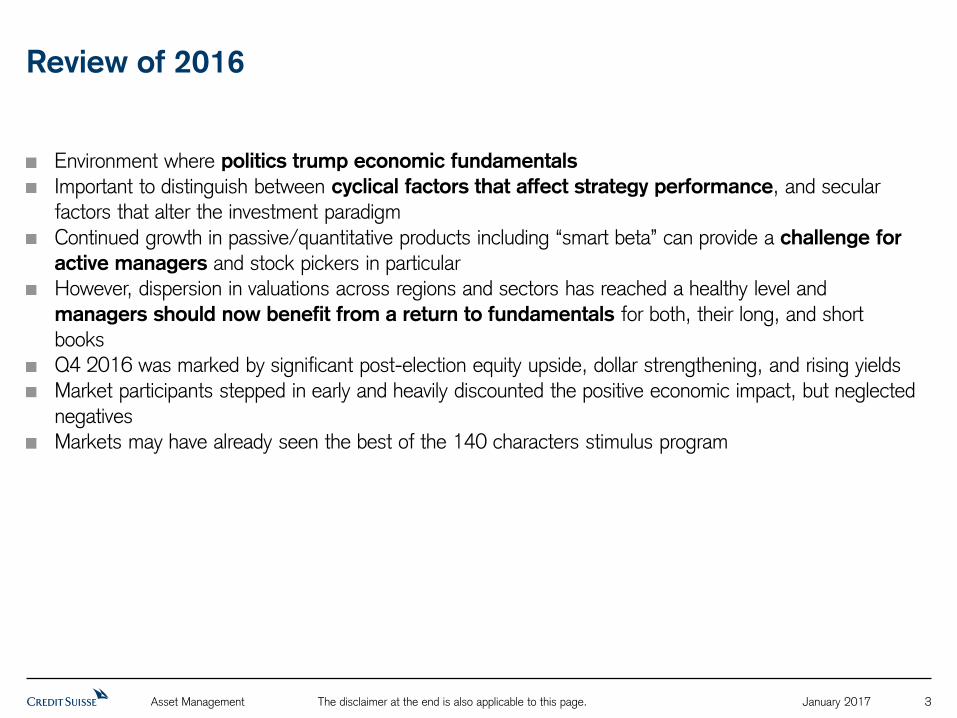
Review of 2016
Environment where politics trump economic fundamentals
Important to distinguish between cyclical factors that affect strategy performance, and secular factors that alter the investment paradigm
Continued growth in passive/quantitative products including “smart beta” can provide a challenge for
active managers and stock pickers in particular However, dispersion in valuations across regions and sectors has reached a healthy level and
managers should now benefit from a return to fundamentals for both, their long, and short books
Q4 2016 was marked by significant post-election equity upside, dollar strengthening, and rising yields
Market participants stepped in early and heavily discounted the positive economic impact, but neglected
negatives
Markets may have already seen the best of the 140 characters stimulus program

January 2017 Asset Management 4 The disclaimer at the end is also applicable to this page.
2016: A Year of Rotations, Surprises and Sentiment Shifts
Significant Events Disrupted Fundamental Stock Picking
Source: Bloomberg, Credit Suisse; Index: MSCI World Total Return
Rotation
Brexit
Trump

January 2017 Asset Management 5 The disclaimer at the end is also applicable to this page.
Equity Factor Performance
Value Strikes Back in Q4
Source: Bloomberg, Morgan Stanley
Factor 2016
Momentum -16%
Quality -5%
Size 0%
Value +10%
Volatility -1%
January 2017 Asset Management 6 The disclaimer at the end is also applicable to this page.
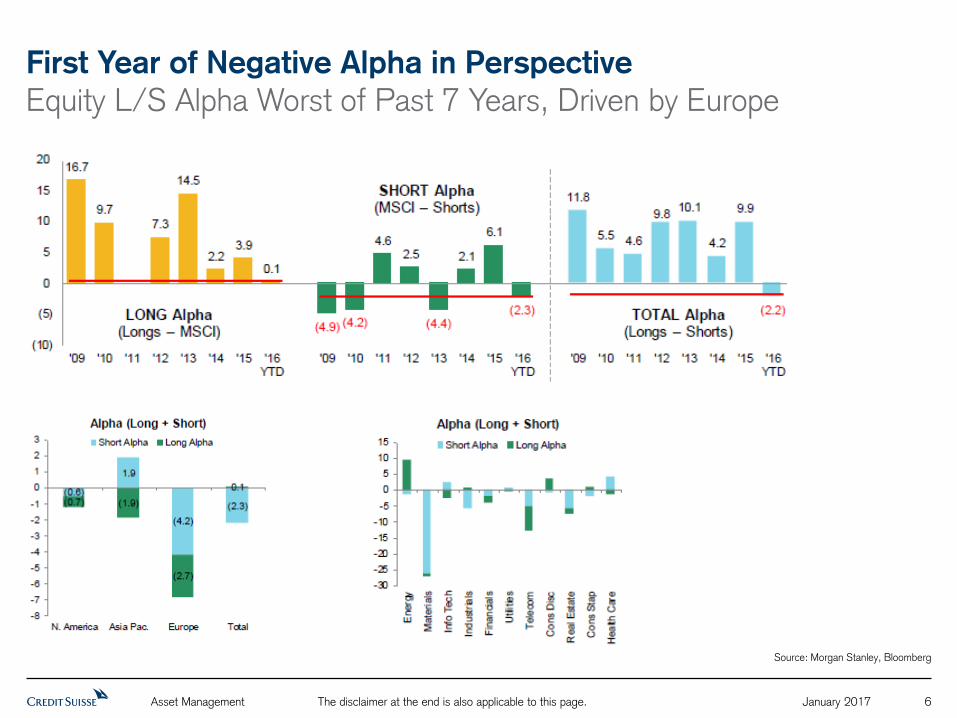
First Year of Negative Alpha in Perspective
Equity L/S Alpha Worst of Past 7 Years, Driven by Europe
Source: Morgan Stanley, Bloomberg

January 2017 Asset Management 7 The disclaimer at the end is also applicable to this page.
U.S. Equities Dispersion in Valuations by Sector Can Provide a Fertile Ground for Stock-picking
Source: JP Morgan
Many sectors still look undervalued relative to historical averages (HC, Tech, Consumer, Telecom)

January 2017 Asset Management 8 The disclaimer at the end is also applicable to this page.
Outlook into 2017
We anticipate additional volatility related to the European elections and US rates normalization
The triple punch of US yield increases, steepening of the yield curve, and dollar appreciation gives
a strong back drop for Discretionary Macro Traders
The ability to navigate through a choppy political agenda is crucial
Focus on managers with the ability to react to changing environments, either through broad
discretionary mandates, or quantitative approaches that allows for inbuilt “bottom-picking”
Key themes and positioning include:
– In equities, we maintain a preference for lower-net and opportunistic managers
– We turn positive on event driven due to continued high M&A volumes and cash rich company balance sheets
– We are optimistic towards fixed income arbitrage
– We continue to favor flexible Discretionary Macro managers
– We favor Multi-Strategy CTAs that should benefit from uncorrelated sources of alpha

January 2017 Asset Management 9 The disclaimer at the end is also applicable to this page.
Innovative Concept to Systematically Combine “Best Ideas”
into a Single Portfolio of High Conviction Long/Short Equities

January 2017 Asset Management 10 The disclaimer at the end is also applicable to this page.
Investment Rationale
Why Equity Long/Short? Why “Best Ideas”?
Long-only equity
mutual funds
Equity long/
short funds
“Best Ideas”
α
β
Excess return
Derived from stock
picks
No correlation to
market
Market return
Derived from expo-
sure to asset class
Perfect correlation
to market
β
α
β
α
β
Little alpha
Small excess return
High market
dependence
Alpha, but mostly from
high conviction trades
Generation of excess
returns
Some market dependence
Larger liquid alpha
generation
Opportunity for larger
excess returns
Low market dependence
Collect high
conviction
trades from
top equity
long/short
managers
Variable Variable
Investors’ returns derive
from either alpha (α) or
beta (β)
α

January 2017 Asset Management 11 The disclaimer at the end is also applicable to this page.
Investment Approach
Selecting Highest Conviction Trades from Top Managers
Long/short equity
manager universe
(>4,000) Credit Suisse AFS
approved
long/short
equity managers
(~30)
Selected
specialist
long/short
equity advisors
(~5–7)
“Best Ideas”
portfolio
Managers are subject to a rigorous due
diligence process covering:
Investment Operational Risk
Legal
Skill level assessment of each manager’s
stock selection ability
Advisors provide daily position level data of
top ten long and short holdings
Advisors’ top trades are combined in
a single portfolio
Portfolio construction process
IDEAS
IDEAS IDEAS IDEAS
Liquid, high-conviction ideas
Other ideas
January 2017 Asset Management 12 The disclaimer at the end is also applicable to this page.
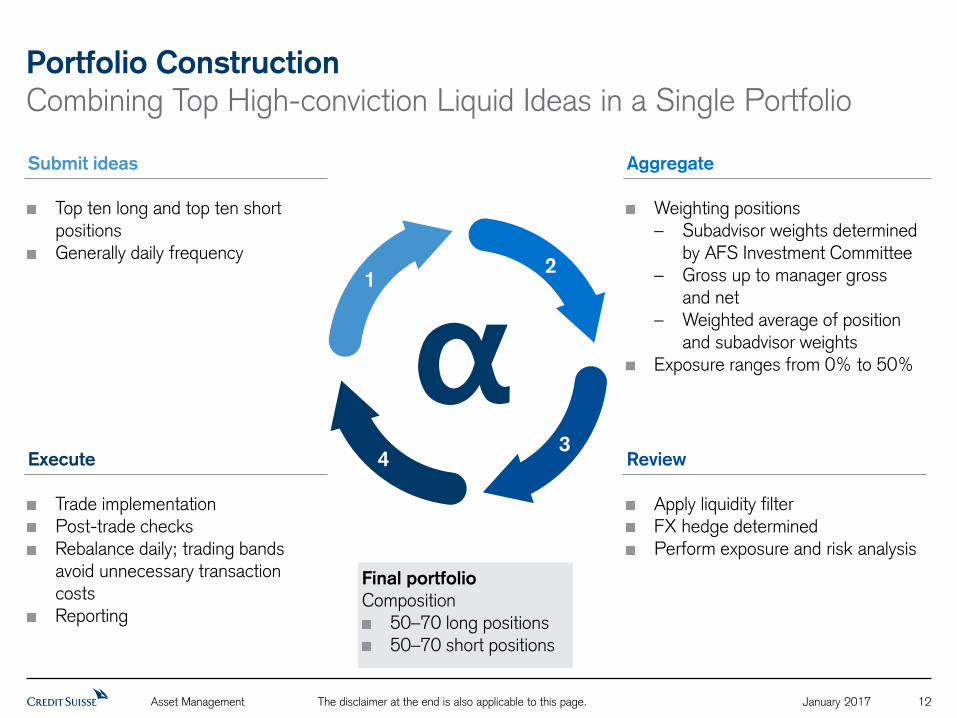
Portfolio Construction
Combining Top High-conviction Liquid Ideas in a Single Portfolio
Review
Apply liquidity filter FX hedge determined Perform exposure and risk analysis
α 1
2
3 4
Aggregate
Weighting positions – Subadvisor weights determined
by AFS Investment Committee – Gross up to manager gross
and net – Weighted average of position
and subadvisor weights Exposure ranges from 0% to 50%
Execute
Trade implementation Post-trade checks Rebalance daily; trading bands avoid unnecessary transaction costs Reporting
Submit ideas
Top ten long and top ten short positions Generally daily frequency
Final portfolio
Composition 50–70 long positions 50–70 short positions

January 2017 Asset Management 13 The disclaimer at the end is also applicable to this page.
Portfolio Exposures (as of December 31, 2016)
Sources: Credit Suisse, Bloomberg As of 31.12.2016
Portfolio positioning
Long exposure 80.9%
Short exposure -63.5%
Number of long positions 77
Number of short positions 67
Geographic exposure (% of NAV)
Region Long Short Gross Net
Asia ex Japan 8.4 -3.2 11.6 5.2
Europe 27.6 -17.6 45.1 10.0
Japan 2.9 -1.1 4.0 1.8
North America 0.0 0.0 0.0 0.0
South America 42.1 -41.6 83.7 0.6
Other 0.0 0.0 0.0 0.0
Total 80.9 -63.5 144.4 17.5
Sector exposure (% of NAV)
Industry Long Short Gross Net
Consumer discretionary 8.0 -11.9 19.9 -3.9
Consumer staples 1.7 -2.3 4.0 -0.6
Energy 1.1 0.0 1.1 1.1
Financials 4.5 -1.4 5.9 3.1
Health care 22.2 -18.7 40.9 3.5
Industrials 8.8 -8.2 17.0 0.7
Communications 8.7 -5.2 13.9 3.4
Materials 3.4 -1.1 4.5 2.3
Technology 18.2 -12.5 30.7 5.7
Utilities 2.3 -0.7 3.1 1.6
Market 2.0 -1.4 3.4 0.6
Total 80.9 -63.5 144.4 17.5
Market cap
Market Long Short Gross Net
Mega-cap 43.4 -33.3 76.7 10.2
Large-cap 12.1 -13.0 25.1 -0.9
Mid-cap 17.5 -14.3 31.8 3.1
Small-cap 5.9 -0.9 6.8 5.1
Index 2.0 -2.0 4.0 0.0
Total 80.9 -63.5 144.4 17.5
Top five long holdings
Sanofi 2.7
Eli Lilly & Company 2.3
GlaxoSmithKline PLC 2.2
Allergan plc 2.2
Alphabet Inc 2.2
Total 11.6

January 2017 Asset Management 14 The disclaimer at the end is also applicable to this page.
Return Potential of the “Best Ideas”
(Hypothetical Performance)
Hypothetical net performance backtest of subadvisors’ top high conviction, liquid stock ideas from January 2011 to December 2015. For January 2016 the figure represents paper trading of the approach. Net performance assumes a management fee of 1.00%, a 5% incentive fee and subadvisor fees of 1.0%. Based on monthly position data from subadvisors and constant weights to subadvisors. Simulated past performance indications and financial market scenarios are not reliable indicators of current or future performance.
Sources: Credit Suisse, Bloomberg As of 31.01.2016
Cumulative Returns of the “Best Ideas” compared to full portfolio returns of the basket of sub-advisors
(net of fees)
90
100
110
120
130
140
150
160
Dez 10 Jun 11 Dez 11 Jun 12 Dez 12 Jun 13 Dez 13 Jun 14 Dez 14 Jun 15 Dez 15
“Best Ideas” of the Sub-advisors Full Portfolio of the Sub-advisors
January 2017 Asset Management 15 The disclaimer at the end is also applicable to this page.
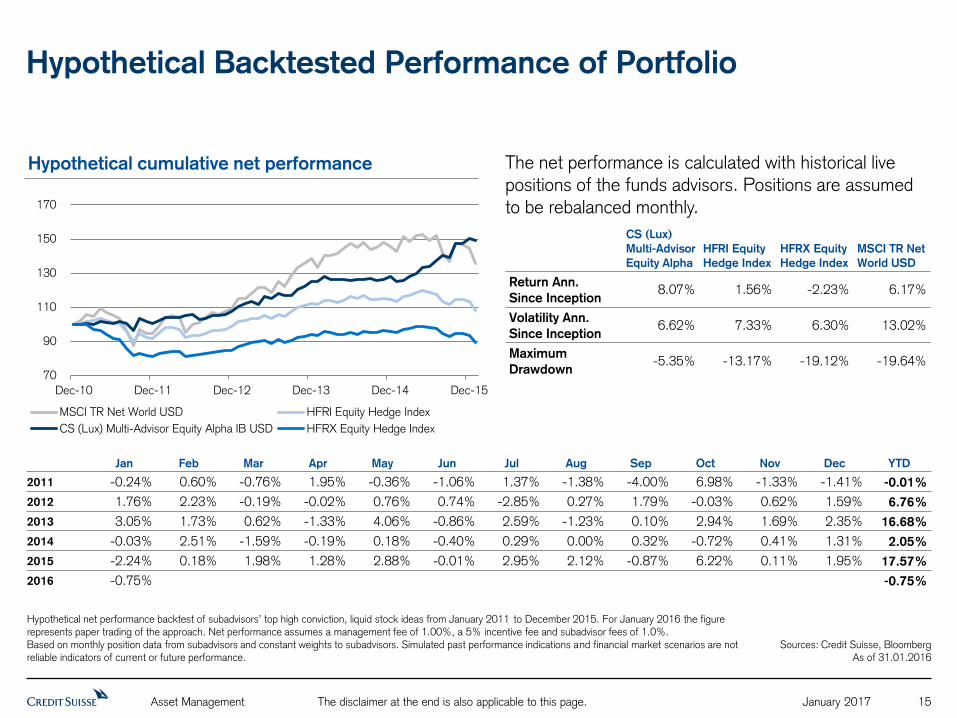
Hypothetical Backtested Performance of Portfolio
Hypothetical net performance backtest of subadvisors’ top high conviction, liquid stock ideas from January 2011 to December 2015. For January 2016 the figure represents paper trading of the approach. Net performance assumes a management fee of 1.00%, a 5% incentive fee and subadvisor fees of 1.0%. Based on monthly position data from subadvisors and constant weights to subadvisors. Simulated past performance indications and financial market scenarios are not reliable indicators of current or future performance.
Sources: Credit Suisse, Bloomberg As of 31.01.2016
Hypothetical cumulative net performance The net performance is calculated with historical live positions of the funds advisors. Positions are assumed to be rebalanced monthly.
CS (Lux)
Multi-Advisor
Equity Alpha
HFRI Equity
Hedge Index
HFRX Equity
Hedge Index
MSCI TR Net
World USD
Return Ann.
Since Inception 8.07% 1.56% -2.23% 6.17%
Volatility Ann.
Since Inception 6.62% 7.33% 6.30% 13.02%
Maximum
Drawdown -5.35% -13.17% -19.12% -19.64%
70
90
110
130
150
170
Dec-10 Dec-11 Dec-12 Dec-13 Dec-14 Dec-15
MSCI TR Net World USD HFRI Equity Hedge Index
CS (Lux) Multi-Advisor Equity Alpha IB USD HFRX Equity Hedge Index
Jan Feb Mar Apr May Jun Jul Aug Sep Oct Nov Dec YTD
2011 -0.24% 0.60% -0.76% 1.95% -0.36% -1.06% 1.37% -1.38% -4.00% 6.98% -1.33% -1.41% -0.01%
2012 1.76% 2.23% -0.19% -0.02% 0.76% 0.74% -2.85% 0.27% 1.79% -0.03% 0.62% 1.59% 6.76%
2013 3.05% 1.73% 0.62% -1.33% 4.06% -0.86% 2.59% -1.23% 0.10% 2.94% 1.69% 2.35% 16.68%
2014 -0.03% 2.51% -1.59% -0.19% 0.18% -0.40% 0.29% 0.00% 0.32% -0.72% 0.41% 1.31% 2.05%
2015 -2.24% 0.18% 1.98% 1.28% 2.88% -0.01% 2.95% 2.12% -0.87% 6.22% 0.11% 1.95% 17.57%
2016 -0.75% -0.75%

January 2017 Asset Management 16 The disclaimer at the end is also applicable to this page.
Performance since Inception
Historical performance indications and financial market scenarios are no reliable indicators of future performance. The performance data do not take into account the commissions and costs incurred on the issue and redemption of fund units. February 2016 performance is calculated from February 2, 2016 through February 29, 2016. Paper trading results for February 1, 2016 were +0.68%.
Sources: Credit Suisse, Bloomberg As of 31.12.2016
Historical cumulative net performance (since inception February 2, 2016)
93
94
95
96
97
98
99
100
101
102
103
Feb 16 Mar 16 Apr 16 May 16 Jun 16 Jul 16 Aug 16 Sep 16 Oct 16 Nov 16 Dec 16
CS (Lux) Multi-Advisor Equity Alpha Fund IB USD
Jan Feb Mar Apr May Jun Jul Aug Sep Oct Nov Dec YTD
2016 – -2.7% 1.4% -0.8% -0.1% 0.2% 2.6% -0.1% 1.1% -0.1% -3,3% -1,1 -3,2%

January 2017 Asset Management 17 The disclaimer at the end is also applicable to this page.
Performance
Return Independence
“Best Ideas” vs. MSCI World
(since inception February 2, 2016)
“Best Ideas” vs. MSCI World
(since inception February 2, 2016)
The Beta of daily returns vs. MSCI World is at around 0.11 for Best Ideas and far lower than that of the HFRX Equity Hedge Index to the MSCI World. Sources: Credit Suisse, Bloomberg
As of 31.12.2016
-2.50%
-1.50%
-0.50%
0.50%
1.50%
2.50%
-2.50% -1.50% -0.50% 0.50% 1.50% 2.50%
y = 0.4349x + 1E-05
R² = 0.7625
-2.50%
-1.50%
-0.50%
0.50%
1.50%
2.50%
-2.50% -1.50% -0.50% 0.50% 1.50% 2.50%
CS (Lux) Multi-Advisor Equity Alpha vs. MSCI World
Beta 0.11
R2 7.1%
HFRX Equity Hedge Index vs. MSCI World
Beta 0.43
R2 76.3%

January 2017 Asset Management 18 The disclaimer at the end is also applicable to this page.
Value Proposition
An innovative “best ideas” approach to long/short equity: the fund allocates directly to the highest
conviction, liquid long and short positions of a carefully selected group of long/short equity hedge fund managers.
1
2
3
Capturing the best long and short equity ideas in a single fund structure
Benchmark independent and alpha focused returns
Available in a regulated structure with daily liquidity
January 2017 Asset Management 19 The disclaimer at the end is also applicable to this page.
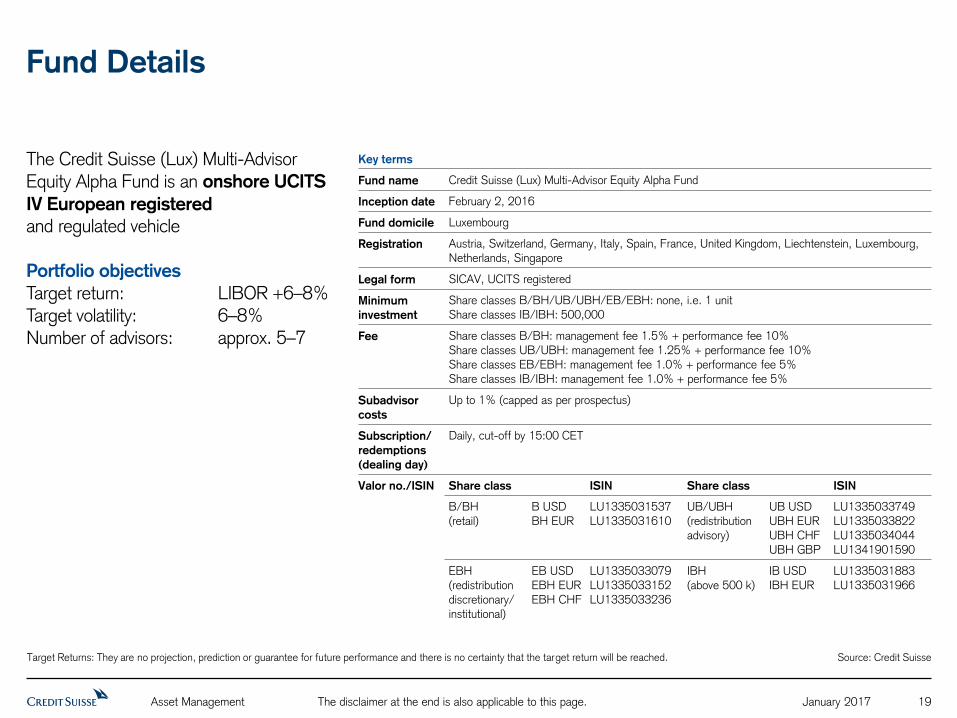
Fund Details
Target Returns: They are no projection, prediction or guarantee for future performance and there is no certainty that the target return will be reached. Source: Credit Suisse
The Credit Suisse (Lux) Multi-Advisor Equity Alpha Fund is an onshore UCITS
IV European registered
and regulated vehicle Portfolio objectives Target return: LIBOR +6–8% Target volatility: 6–8% Number of advisors: approx. 5–7
Key terms
Fund name Credit Suisse (Lux) Multi-Advisor Equity Alpha Fund
Inception date February 2, 2016
Fund domicile Luxembourg
Registration Austria, Switzerland, Germany, Italy, Spain, France, United Kingdom, Liechtenstein, Luxembourg,
Netherlands, Singapore
Legal form SICAV, UCITS registered
Minimum
investment
Share classes B/BH/UB/UBH/EB/EBH: none, i.e. 1 unit
Share classes IB/IBH: 500,000
Fee Share classes B/BH: management fee 1.5% + performance fee 10% Share classes UB/UBH: management fee 1.25% + performance fee 10% Share classes EB/EBH: management fee 1.0% + performance fee 5% Share classes IB/IBH: management fee 1.0% + performance fee 5%
Subadvisor
costs
Up to 1% (capped as per prospectus)
Subscription/
redemptions
(dealing day)
Daily, cut-off by 15:00 CET
Valor no./ISIN
Share class ISIN Share class ISIN
B/BH (retail)
B USD BH EUR
LU1335031537 LU1335031610
UB/UBH (redistribution
advisory)
UB USD UBH EUR
UBH CHF UBH GBP
LU1335033749 LU1335033822
LU1335034044 LU1341901590
EBH
(redistribution discretionary/
institutional)
EB USD
EBH EUR EBH CHF
LU1335033079
LU1335033152 LU1335033236
IBH
(above 500 k)
IB USD
IBH EUR
LU1335031883
LU1335031966

Appendix

January 2017 Asset Management 21 The disclaimer at the end is also applicable to this page.
Equity Long/Short Manager Alpha Generation
AFS-approved Managers do Create Alpha
1 Credit Suisse Alternative Funds Solutions. Historical performance indications and financial market scenarios are not reliable indicators of current or future performance.
Source: Credit Suisse As of 31.10.2016
Alpha of AFS-approved managers vs. MSCI World
Alpha for the AFS1 lineup of Equity Long/Short managers has averaged 3.33% per year since January 2011.
-25%
-20%
-15%
-10%
-5%
0%
5%
10%
15%
20%
25%
-4%
-3%
-2%
-1%
0%
1%
2%
3%
4%

January 2017 Asset Management 22 The disclaimer at the end is also applicable to this page.
Globally Diversified Portfolio of “Best Ideas”
There is no indication or guarantee that any actual client portfolio will make the same or similar investments as the sample portfolios described above.
Subadvisor F Subadvisor E
Global tech/media/telco
>5-year track record USD 100 mn+ in strategy AUM
Subadvisor A
Europe generalist
>10-year track record USD 1 bn+ in strategy AUM
“Best Ideas” Credit Suisse (Lux)
Multi-Advisor Equity Alpha Fund
Subadvisor B Subadvisor C
Subadvisor D
US generalist
>5-year track record USD 400 mn+ in strategy AUM
Global healthcare
>10-year track record USD 500 mn+ in strategy AUM
Asia generalist
>10-year track record USD 400 mn+ in strategy AUM
Highest conviction, liquid ideas Target net exposure range of 0% to 50% Global investment universe
Global generalist
>4-year track record USD 100 mn+ in strategy AUM

January 2017 Asset Management 23 The disclaimer at the end is also applicable to this page.
Investable Universe
Global and Unconstrained of Any Benchmark
The strategy is global and unconstrained of any benchmark to allow for maximum alpha potential
Geographies
Americas EMEA APAC (incl. Chinese A-shares) Emerging markets
Market cap
Mega cap Large cap Mid cap Small cap
Sectors
Consumer discretionary Consumer staples Energy Financials Health care Industrials IT Materials Telecommunication Services Utilities

January 2017 Asset Management 24 The disclaimer at the end is also applicable to this page.
Historical Exposure Levels
Figures represent backtested data until December 13, 2015, paper trading from December 15, 2015 to February 1, 2016 and live figures from February 2, 2016. Source: Credit Suisse
As of 31.10.2016
Historical market exposures
Gross exposures ranged from 140% to 190%; net exposures from 15% to 30% Gross exposure is largely a function of market volatility: when volatility increases, subadvisors will generally reduce their balance sheets as exhibited in the latter half of 2012 and the fall of 2015 Net exposure will fluctuate based on the expected risk/return from longs and shorts. For example, net has declined over the past few months as subadvisors are seeing more opportunities to generate alpha on the short side.
-100%
-50%
0%
50%
100%
150%
200%
250%
Long Exposure Short Exposure Net Exposure Long Exposure
Gross Exposure
Long Exposure Net Exposure
Short Exposure
Start of live
performance
January 2017 Asset Management 25 The disclaimer at the end is also applicable to this page.
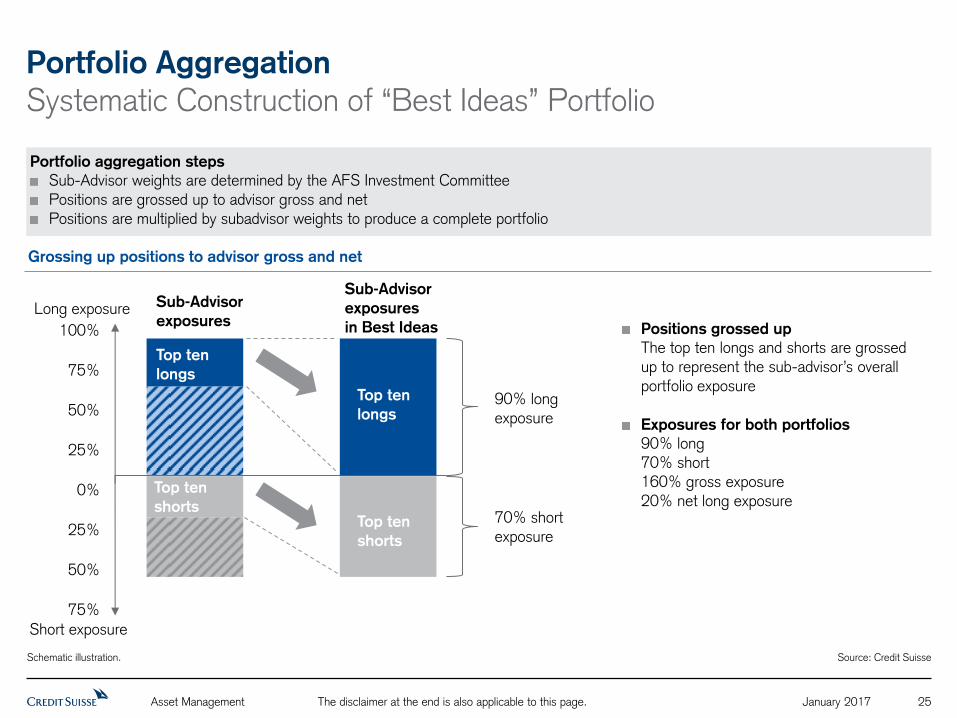
Portfolio Aggregation
Systematic Construction of “Best Ideas” Portfolio
Schematic illustration. Source: Credit Suisse
Portfolio aggregation steps
Sub-Advisor weights are determined by the AFS Investment Committee Positions are grossed up to advisor gross and net
Positions are multiplied by subadvisor weights to produce a complete portfolio
Positions grossed up
The top ten longs and shorts are grossed up to represent the sub-advisor’s overall portfolio exposure
Exposures for both portfolios
90% long 70% short
160% gross exposure 20% net long exposure
Short exposure
90% long
exposure
70% short exposure
Long exposure
Top ten
longs
Top ten
shorts Top ten
shorts
Top ten
longs
100%
75%
50%
25%
0%
25%
50%
75%
Sub-Advisor
exposures
Sub-Advisor
exposures
in Best Ideas
Grossing up positions to advisor gross and net
January 2017 Asset Management 26 The disclaimer at the end is also applicable to this page.
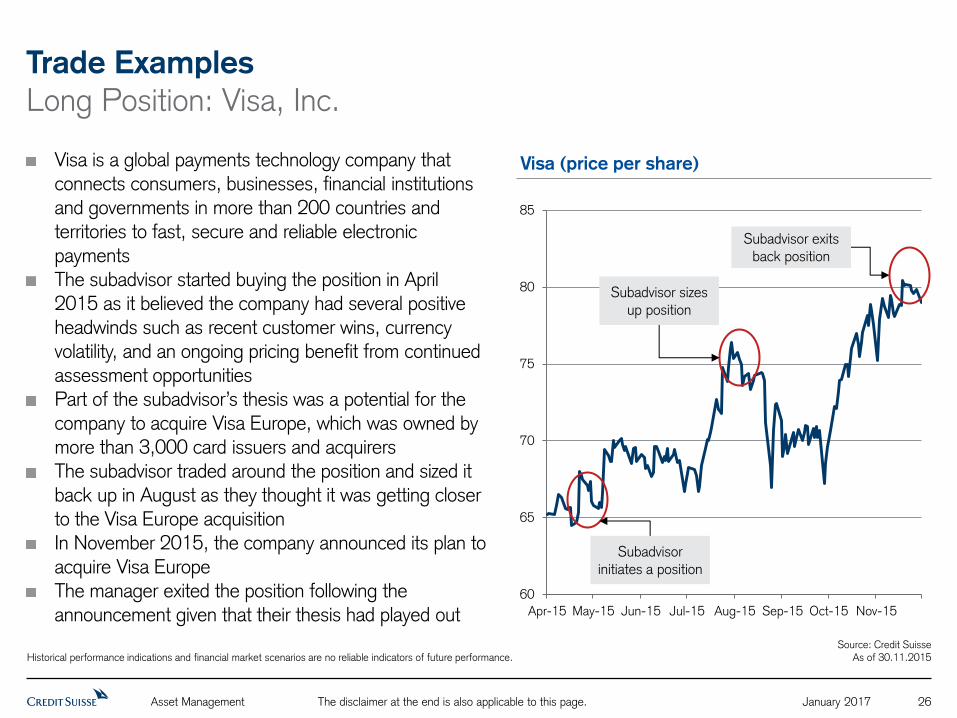
Trade Examples
Long Position: Visa, Inc.
Visa is a global payments technology company that connects consumers, businesses, financial institutions and governments in more than 200 countries and territories to fast, secure and reliable electronic
payments The subadvisor started buying the position in April 2015 as it believed the company had several positive headwinds such as recent customer wins, currency volatility, and an ongoing pricing benefit from continued
assessment opportunities Part of the subadvisor’s thesis was a potential for the
company to acquire Visa Europe, which was owned by more than 3,000 card issuers and acquirers The subadvisor traded around the position and sized it back up in August as they thought it was getting closer to the Visa Europe acquisition
In November 2015, the company announced its plan to
acquire Visa Europe The manager exited the position following the announcement given that their thesis had played out
Historical performance indications and financial market scenarios are no reliable indicators of future performance.
Source: Credit Suisse As of 30.11.2015
Visa (price per share)
60
65
70
75
80
85
Apr-15 May-15 Jun-15 Jul-15 Aug-15 Sep-15 Oct-15 Nov-15
Subadvisor initiates a position
Subadvisor sizes up position
Subadvisor exits back position
January 2017 Asset Management 27 The disclaimer at the end is also applicable to this page.
Trade Examples
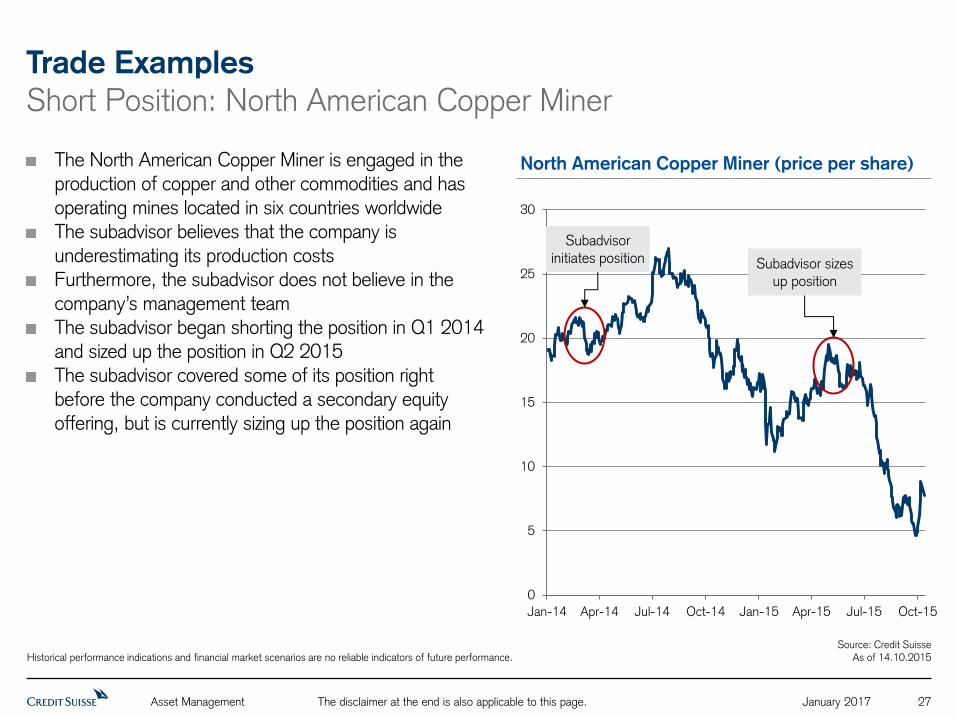
Short Position: North American Copper Miner
The North American Copper Miner is engaged in the production of copper and other commodities and has operating mines located in six countries worldwide The subadvisor believes that the company is
underestimating its production costs Furthermore, the subadvisor does not believe in the company’s management team The subadvisor began shorting the position in Q1 2014 and sized up the position in Q2 2015
The subadvisor covered some of its position right before the company conducted a secondary equity
offering, but is currently sizing up the position again
Historical performance indications and financial market scenarios are no reliable indicators of future performance. Source: Credit Suisse
As of 14.10.2015
North American Copper Miner (price per share)
0
5
10
15
20
25
30
Jan-14 Apr-14 Jul-14 Oct-14 Jan-15 Apr-15 Jul-15 Oct-15
Subadvisor initiates position Subadvisor sizes
up position

January 2017 Asset Management 28 The disclaimer at the end is also applicable to this page.
Robust Due Diligence Process
Coordinated Discussions between Independent Specific Expert Teams
The substantial professional resources of over 50 people are collectively committed to the business of AFS,
situated globally in five offices in New York, San Francisco, Tokyo, Singapore and Zurich.
Due Diligence Reports
Fund Review Committee
1. Investment Research
Experience and leadership
Cohesiveness
Market opportunity
and process
Industry knowledge
Value added
Competitive advantage
Internal resources
Economics
Investment Research
Operational Due Diligence
Legal Due Diligence
Market Risk Control
4. Risk Control
Processes and
infrastructure
Transparency
Exposures and limits
Decision-making
Performance
Risk/drawdown analysis
Realized/unrealized
returns
Portfolio composition
Adherence to strategy
2. Operational Due
Diligence
Manager overview
Legal and compliance
Governance and Conflicts
of Interests
Investment and trade
process
Pricing, Valuation
and NAV
Cash and counterparties
Service providers
3. Legal Due Diligence
Fund/investment
structure
Corporate and fund
governance
Liquidity terms
Fees and expenses
Regulatory events and
activity
Conflicts of interest
Steps
involved
Criteria
Schematic illustration. Source: Credit Suisse

January 2017 Asset Management 29 The disclaimer at the end is also applicable to this page.
Risks
There is no guarantee that losses can be avoided or that investment objectives will be achieved
The fund may have exposure to emerging markets which, by their nature, are riskier than developed
markets
Operational risks from deficient processes, technical failures or catastrophic events may cause losses
Political and legal risks: Investments are exposed to changes of rules and standards applied by specific
countries

January 2017 Asset Management 30 The disclaimer at the end is also applicable to this page.
Disclaimer
This document was produced by Credit Suisse AG and/or its affiliates (hereafter “CS”) with the greatest of care and to the best of its knowledge and belief. However, CS provides no guarantee with regard to its content and completeness and does not accept any liability for losses which might arise from making use of this information. The opinions expressed in this
document are those of CS at the time of writing and are subject to change at any time without notice. If nothing is indicated to the contrary, all figures are not audited. This document is provided for information purposes only and is for the exclusive use of the recipient. It does not constitute an offer or a recommendation to buy or sell financial instruments or banking services and does not release the recipient from exercising his/her own judgment. The recipient is in particular recommended to check that the information provided is in line with his/her
own circumstances with regard to any legal, regulatory, tax or other consequences, if necessary with the help of a professional advisor. This document may not be reproduced either in part
or in full without the written permission of CS. It is expressly not intended for persons who, due to their nationality or place of residence, are not permitted access to such information under local law. Neither this document nor any copy thereof may be sent, taken into or distributed in the United States or to any U.S. person (within the meaning of Regulation S under the US Securities Act of 1933, as amended). Every investment involves risk, especially with regard to fluctuations in value and return. Investments in foreign currencies involve the additional risk that the foreign currency might lose value against the investor's reference currency. Historical performance indications and financial market scenarios are not reliable indicators of current or
future performance. Performance indications do not consider commissions levied at subscription and/or redemption. Furthermore, no guarantee can be given that the performance of the benchmark will be reached or outperformed.
Emerging market investments usually result in higher risks such as political, economic, credit, exchange rate, market liquidity, legal, settlement, market, shareholder and creditor risks. Emerging markets are located in countries that possess one or more of the following characteristics: a certain degree of political instability, relatively unpredictable financial markets and economic growth patterns, a financial market that is still at the development stage or a weak economy.
Equities are subject to market forces and hence fluctuations in value, which are not entirely predictable. The investment funds mentioned in this publication have been established under Luxembourg law as undertakings for collective investment in transferable securities (UCITS) subject to EU
Directive 2009/65/EC, as amended. Subscriptions are only valid on the basis of the current sales prospectus, key investor information document (KIID) and the most recent annual report (or half-yearly report, if this is more recent). These and the funds management regulations and/or articles may be obtained free of charge, in English, from Credit Suisse Fund Management S.A., 5, rue Jean Monnet, L-2180 Luxembourg.
Copyright © 2017 Credit Suisse Group AG and/or its affiliates. All rights reserved.