credit suisse sicav one (lux) - teletrader.com€¦ · credit suisse sicav one (lux) ... (lux)...
TRANSCRIPT
Credit Suisse SICAV One (Lux)
Unaudited Semi-Annual Reportat 30.11.2010
Investment Company with Variable Capital under Luxembourglaw - R.C.S. Luxembourg B 124 019
Credit Suisse SICAV One (Lux) • Unaudited Semi-Annual Report at 30.11.2010
Page 2Table of Contents
Management and Administration 3
Consolidated Report 5
Report by SubfundCredit Suisse SICAV One (Lux) Challenger (Euro) 11Credit Suisse SICAV One (Lux) Challenger (Sfr) 15Credit Suisse SICAV One (Lux) Challenger (US$) 19Credit Suisse SICAV One (Lux) CommodityAllocation 20Credit Suisse SICAV One (Lux) Defender (Euro) 25Credit Suisse SICAV One (Lux) Defender (Sfr) 29Credit Suisse SICAV One (Lux) Defender (US$) 33Credit Suisse SICAV One (Lux) Equity Asian Dragon 34Credit Suisse SICAV One (Lux) Equity Europe 39Credit Suisse SICAV One (Lux) Equity Global Emerging Markets 43Credit Suisse SICAV One (Lux) Equity Global Emerging Market Property 48Credit Suisse SICAV One (Lux) Equity Japan Value 52Credit Suisse SICAV One (Lux) Equity Middle East & North Africa 57Credit Suisse SICAV One (Lux) European Equity Dividend Plus 62Credit Suisse SICAV One (Lux) Global Convertibles 67Credit Suisse SICAV One (Lux) Global Equity Dividend Plus 74Credit Suisse SICAV One (Lux) Global Tactical Asset Allocation (GTAA) VaR 10% 79Credit Suisse SICAV One (Lux) IndexSelection Balanced (Euro) 84Credit Suisse SICAV One (Lux) IndexSelection Balanced (Sfr) 88Credit Suisse SICAV One (Lux) IndexSelection Balanced (US$) 92Credit Suisse SICAV One (Lux) IndexSelection Capital Gains Oriented (Euro) 96Credit Suisse SICAV One (Lux) IndexSelection Capital Gains Oriented (Sfr) 100Credit Suisse SICAV One (Lux) IndexSelection Capital Gains Oriented (US$) 104Credit Suisse SICAV One (Lux) IndexSelection Income Oriented (Euro) 108Credit Suisse SICAV One (Lux) IndexSelection Income Oriented (Sfr) 112Credit Suisse SICAV One (Lux) IndexSelection Income Oriented (US$) 116Credit Suisse SICAV One (Lux) Small and Mid Cap Alpha Long/Short 120
Credit Suisse SICAV One (Lux) • Unaudited Semi-Annual Report at 30.11.2010
Management and Administration Page 3
Company
Credit Suisse SICAV One (Lux) 5, rue Jean Monnet, L-2180 Luxembourg R.C.S. Luxembourg B 124 019
Board of Directors of the Company
Raymond Melchers, Member of the Board (until 03.08.2010) Credit Suisse Asset Management Fund Service (Luxembourg) S.A., Luxembourg Luca Diener, Member of the Board Managing Director, Credit Suisse AG, Zurich Germain Trichies, Member of the Board Director, Credit Suisse Asset Management Fund Service (Luxembourg) S.A., Luxembourg Marnix van den Berge, Member of the Board (from 04.08.2010 to 26.10.2010) Director, Credit Suisse Asset Management Fund Service (Luxembourg) S.A., Luxembourg Guy Reiter, Member of the Board Director, Credit Suisse Asset Management Fund Service (Luxembourg) S.A., Luxembourg Mark Wallace, Member of the Board (until 17.11.2010) Managing Director, Credit Suisse AG, Zurich
Auditor of the Company
PricewaterhouseCoopers S.à r.l. 400, Route d'Esch, L-1471 Luxembourg
Management Company
Credit Suisse Fund Management S.A. 5, rue Jean Monnet, L-2180 Luxembourg R.C.S. Luxembourg B 72 925
Board of Directors of the Management Company
Raymond Melchers, Member of the Board (until 10.05.2010) Credit Suisse Asset Management Fund Service (Luxembourg) S.A., Luxembourg Luca Diener, Member of the Board Managing Director, Credit Suisse AG, Zurich Germain Trichies, Member of the Board Credit Suisse Asset Management Fund Service (Luxembourg) S.A., Luxembourg Marnix van den Berge, Member of the Board (from 10.05.2010 to 26.10.2010) Director, Credit Suisse Asset Management Fund Service (Luxembourg) S.A., Luxembourg Guy Reiter, Member of the Board Credit Suisse Asset Management Fund Service (Luxembourg) S.A., Luxembourg Mark Wallace, Member of the Board (until 17.11.2010) Managing Director, Credit Suisse AG, Zurich
Auditor of the Management Company
KPMG Audit S.à r.l. 9, Allée Scheffer, L-2520 Luxembourg
Representative in Switzerland
Credit Suisse Asset Management Funds AG Sihlcity - Kalandergasse 4, CH-8070 Zurich
Paying Agent in Switzerland
Credit Suisse AG Paradeplatz 8, CH-8001 Zurich
Paying and Information Agent in Germany
Deutsche Bank AG Junghofstrasse 5-9, D-60311 Frankfurt/Main
Information Agent in Germany
Credit Suisse (Deutschland) AG Junghofstrasse 16, D-60311 Frankfurt/Main
Paying Agent in Austria
UniCredit Bank Austria AG Schottengasse 6-8, A-1010 Vienna
Paying Agent in the Principality of Liechtenstein
LGT Bank in Liechtenstein Aktiengesellschaft Herrengasse 12, FL-9490 Vaduz
Custodian Bank
Credit Suisse (Luxembourg) S.A. 56, Grand-Rue, L-1660 Luxembourg
Distribution Agents
Credit Suisse AG Paradeplatz 8, CH-8001 Zurich Credit Suisse Asset Management Fund Service (Luxembourg) S.A. 5, rue Jean Monnet, L-2180 Luxembourg
Credit Suisse SICAV One (Lux) • Unaudited Semi-Annual Report at 30.11.2010
Management and Administration Page 4
Investment Adviser
Credit Suisse Asset Management, LLC Eleven Madison Avenue, NY-10010 New York
- Credit Suisse SICAV One (Lux) Global Tactical Asset Allocation (GTAA) VaR 10%
Credit Suisse AG Paradeplatz 8, CH-8001 Zurich
- Credit Suisse SICAV One (Lux) Challenger (Euro) - Credit Suisse SICAV One (Lux) Challenger (Sfr) - Credit Suisse SICAV One (Lux) Commodity Allocation - Credit Suisse SICAV One (Lux) Defender (Euro) - Credit Suisse SICAV One (Lux) Defender (Sfr) - Credit Suisse SICAV One (Lux) Equity Europe - Credit Suisse SICAV One (Lux) Equity Global Emerging Markets - Credit Suisse SICAV One (Lux) Equity Global Emerging Market
Property - Credit Suisse SICAV One (Lux) European Equity Dividend Plus - Credit Suisse SICAV One (Lux) Equity Japan Value - Credit Suisse SICAV One (Lux) Global Convertibles - Credit Suisse SICAV One (Lux) Global Equity Dividend Plus - Credit Suisse SICAV One (Lux) IndexSelection Balanced (Euro) - Credit Suisse SICAV One (Lux) IndexSelection Balanced (Sfr) - Credit Suisse SICAV One (Lux) IndexSelection Balanced (US$) - Credit Suisse SICAV One (Lux) IndexSelection Capital Gains Oriented
(Euro) - Credit Suisse SICAV One (Lux) IndexSelection Capital Gains Oriented
(Sfr) - Credit Suisse SICAV One (Lux) IndexSelection Capital Gains Oriented
(US$) - Credit Suisse SICAV One (Lux) IndexSelection Income Oriented (Euro) - Credit Suisse SICAV One (Lux) IndexSelection Income Oriented (Sfr) - Credit Suisse SICAV One (Lux) IndexSelection Income Oriented (US$) - Credit Suisse SICAV One (Lux) Small and Mid Cap Alpha Long/Short
Credit Suisse AG, Dubai Branch
- Credit Suisse SICAV One (Lux) Equity Middle East & North Africa Credit Suisse AG, Singapore Branch
- Credit Suisse SICAV One (Lux) Equity Asia Dragon
Central Administration
Credit Suisse Asset Management Fund Service (Luxembourg) S.A. 5, rue Jean Monnet, L-2180 Luxembourg No subscription may be accepted on the basis of the financial reports. Subscriptions are accepted only on the basis of the current sales prospectus accompanied by the simplified Prospectus, the latest annual report and the latest semi-annual report (if it is more recent). The issue and redemption prices are published in Luxembourg at the registered office of the Management Company. The net asset value is also published daily on the Internet www.credit-suisse.com and in different newspapers. Shareholders may obtain the Sales Prospectus, the simplified Prospectus, the latest annual and semi-annual reports, the changes in the composition of the securities portfolio during the reporting period and copies of the Management Regulations free of charge from the registered office of the Management Company, the local representatives in the countries where the Fund is registered or the Paying and Information Agent in Germany.
Credit Suisse SICAV One (Lux) • Unaudited Semi-Annual Report at 30.11.2010
Page 5Consolidated Report
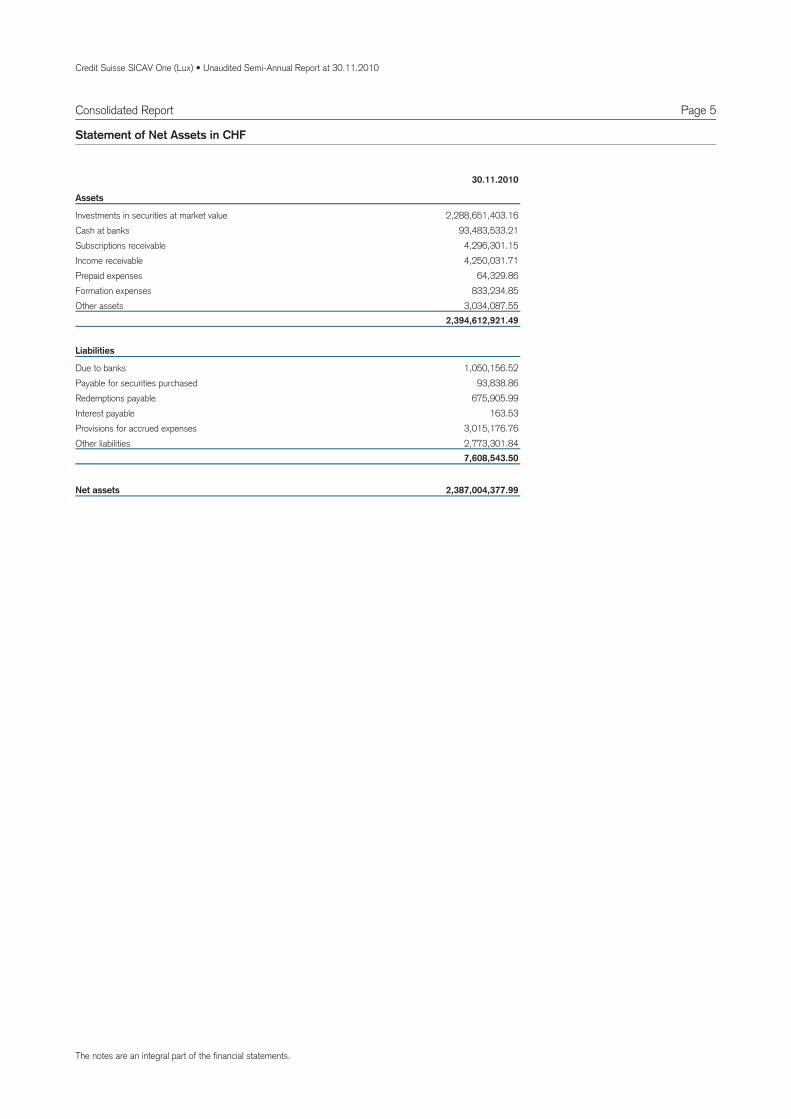
Statement of Net Assets in CHF
30.11.2010
Assets
Investments in securities at market value 2,288,651,403.16Cash at banks 93,483,533.21Subscriptions receivable 4,296,301.15Income receivable 4,250,031.71Prepaid expenses 64,329.86Formation expenses 833,234.85Other assets 3,034,087.55
2,394,612,921.49
Liabilities
Due to banks 1,050,156.52Payable for securities purchased 93,838.86Redemptions payable 675,905.99Interest payable 163.53Provisions for accrued expenses 3,015,176.76Other liabilities 2,773,301.84
7,608,543.50
Net assets 2,387,004,377.99
The notes are an integral part of the financial statements.
Credit Suisse SICAV One (Lux) • Unaudited Semi-Annual Report at 30.11.2010
Page 6
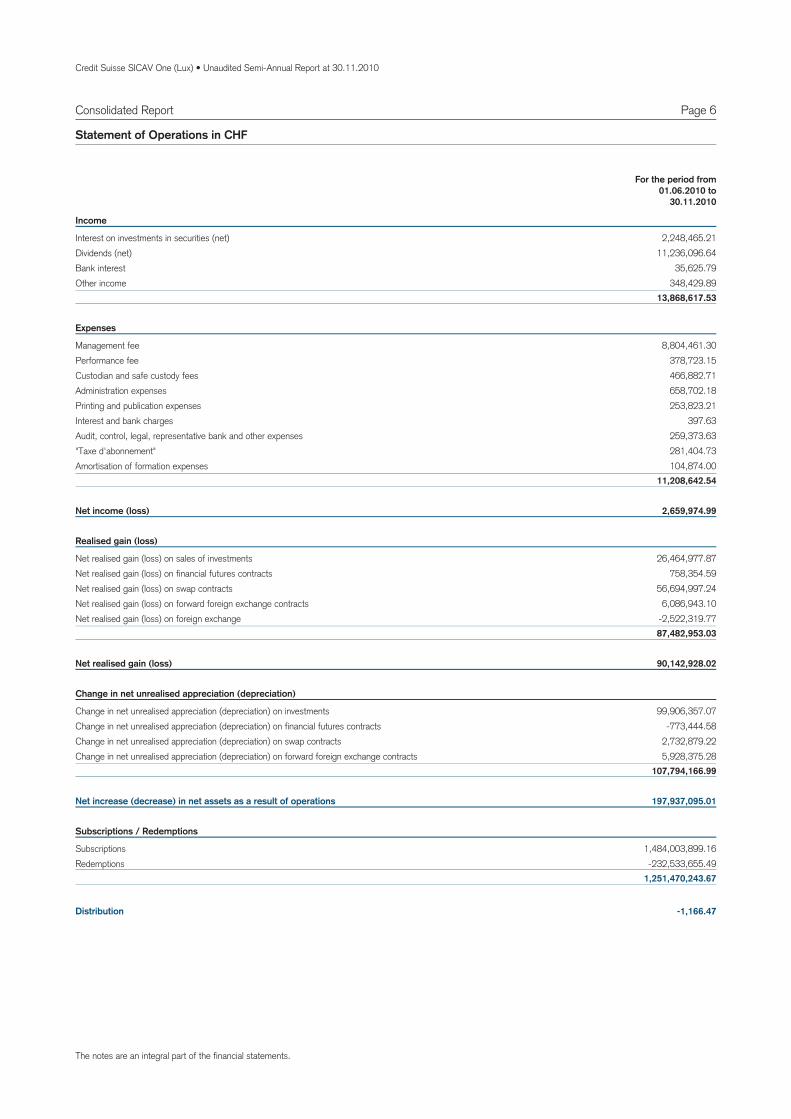
Income
Interest on investments in securities (net) 2,248,465.21Dividends (net) 11,236,096.64Bank interest 35,625.79Other income 348,429.89
13,868,617.53
Expenses
Management fee 8,804,461.30Performance fee 378,723.15Custodian and safe custody fees 466,882.71Administration expenses 658,702.18Printing and publication expenses 253,823.21Interest and bank charges 397.63Audit, control, legal, representative bank and other expenses 259,373.63"Taxe d'abonnement" 281,404.73Amortisation of formation expenses 104,874.00
11,208,642.54
Net income (loss) 2,659,974.99
Realised gain (loss)
Net realised gain (loss) on sales of investments 26,464,977.87Net realised gain (loss) on financial futures contracts 758,354.59Net realised gain (loss) on swap contracts 56,694,997.24Net realised gain (loss) on forward foreign exchange contracts 6,086,943.10Net realised gain (loss) on foreign exchange -2,522,319.77
87,482,953.03
Net realised gain (loss) 90,142,928.02
Change in net unrealised appreciation (depreciation)
Change in net unrealised appreciation (depreciation) on investments 99,906,357.07Change in net unrealised appreciation (depreciation) on financial futures contracts -773,444.58Change in net unrealised appreciation (depreciation) on swap contracts 2,732,879.22Change in net unrealised appreciation (depreciation) on forward foreign exchange contracts 5,928,375.28
107,794,166.99
Net increase (decrease) in net assets as a result of operations 197,937,095.01
Subscriptions / Redemptions
Subscriptions 1,484,003,899.16Redemptions -232,533,655.49
1,251,470,243.67
Distribution -1,166.47
The notes are an integral part of the financial statements.
Consolidated Report
Statement of Operations in CHF
For the period from01.06.2010 to
30.11.2010
Credit Suisse SICAV One (Lux) • Unaudited Semi-Annual Report at 30.11.2010
Consolidated Report Page 7
Notes
General
Credit Suisse SICAV One (Lux) ("the Company") is a Luxembourg investment company with variable capital (SICAV). The Company has an umbrella structure and was established on 05.02.2007 in Luxembourg as an undertaking for collective investment under Part I of the law of 20.12.2002. As of 30.11.2010 the Company had 25 subfunds. Changes: - Credit Suisse SICAV One (Lux) Challenger (US$) and Credit Suisse SICAV One (Lux) Defender (US$): the last NAV has been calculated on 23.07.2010. - Credit Suisse SICAV One (Lux) Equity Japan Value was launched on 15.07.2010. - Credit Suisse SICAV One (Lux) Equity Asian Dragon -I- was launched on 27.07.2010. - Credit Suisse SICAV One (Lux) Small and Mid Cap Alpha Long/Short was launched on 30.07.2010. - Credit Suisse SICAV One (Lux) Global Tactical Asset Allocation (GTAA) VaR 10% -D- : the last NAV has been calculated on 02.08.2010. - Credit Suisse SICAV One (Lux) Equity Global Emerging Market Property -I- was launched on 07.10.2010. - Credit Suisse SICAV One (Lux) Equity Europe was launched on 16.08.2010. - By a resolution of Management Company the Credit Suisse Equity Fund (Lux) Style Invest Europe (transferring subfund) transferred its assets and liabilities to Credit Suisse SICAV One (Lux) European Equity Dividend Plus (beneficiary subfund) as at 10.11.2010. Units in the respective classes of the transferring subfund merged with the Shares of the corresponding classes of the beneficiary subfund.
Summary of significant accounting policies
a) Presentation of financial statements The financial statements are presented in accordance with the requirements of the Luxembourg supervisory authorities. b) Computation of the net asset value of each subfund The net asset value of the Shares of each subfund shall be calculated in the reference currency of the respective subfund and shall be determined under the responsibility of the Company’s Board of Directors in Luxembourg on each banking day in Luxembourg (each such day being referred to as a “Valuation Day”). A banking day is defined as being a day on which banks are normally open for business in Luxembourg. The financial statements reflect the net asset values as calculated on 30.11.2010 based on the market prices of the investments as of 30.11.2010. Credit Suisse SICAV One (Lux) Global Tactical Asset Allocation (GTAA) VaR 10%: The net asset value of the shares of the Subfund is calculated in the Subfund’s reference currency on the last banking day of each week and on the first banking day of each month. Credit Suisse SICAV One (Lux) Small and Mid Cap Alpha Long/Short: The net asset value of the shares in the Subfund is calculated in the Subfund’s reference currency every second Thursday and also on the first banking day of each month. c) Valuation of investment securities of each subfund Securities which are listed or regularly traded on a stock exchange shall be valued at the last available purchase price. If such a price is not available for a particular trading day, but a closing mid-price (the mean of the closing bid and ask prices) or a closing bid price is available, the closing mid-price, or alternatively the closing bid price, may be taken as a basis for the valuation. If a security is traded on several stock exchanges, the valuation shall be made by reference to the exchange on which the security is chiefly traded. In the case of securities for which trading on a stock exchange is not significant whereas a secondary market with regulated trading among securities dealers does exist (with the effect that the price is set on a market basis), the valuation may be based on this secondary market. Securities traded on a regulated market shall be valued in the same way as securities listed on a stock exchange. Securities that are neither listed on a stock exchange nor traded on a regulated market shall be valued at their last available market price. If no such price is available, the Company shall value these securities in accordance with other criteria to be established by the Board of Directors and on the basis of the probable sales price, the value of which shall be estimated with due care and in good faith.
The valuation price of a money market instrument shall be progressively adjusted to the redemption price, based on the net acquisition price and keeping the resultant investment yield constant. In the event of a significant change in market conditions, the basis for the valuation of different investments shall be brought into line with the new market yields. If a valuation in accordance with the above rules is rendered impossible or incorrect owing to special or changed circumstances, then the Company’s Board of Directors shall be entitled to use other generally recognized and auditable valuation principles in order to value the subfund’s assets. In exceptional circumstances, further valuations may be carried out on the same day; such valuations will be valid for any applications for purchase and/or redemption subsequently received. d) Net realised gain/loss on sales of investments of each subfund The realised gains or losses on the sales of securities are calculated on the basis of the average acquisition cost. e) Foreign exchange conversion The financial statements are kept in the reference currency of each subfund and the consolidated financial statements are kept in CHF. Cash at banks, other net assets and the value of portfolio securities in currencies other than the reference currency of each subfund are converted into the reference currency at the foreign exchange rate prevailing on the date of valuation. Income and expenses in currencies other than the reference currency of each subfund are converted into the reference currency at the foreign exchange rate applicable at the date they accrue to the subfund. Realised gains or losses on foreign currencies are accounted for in the statement of operations. The acquisition cost of securities in currencies other than the reference currency of each subfund is converted into the reference currency at the foreign exchange rate valid at the date of acquisition. f) Transactions on investments in securities of each subfund The transactions on investments in securities are booked on a trade date basis. g) Formation expenses of each subfund Formation expenses are amortised over a period of five years. h) Valuation of financial futures contracts of each subfund Unmatured financial future contracts are valued at valuation date at market prices prevailing at this date and resulting unrealised gains or losses are posted to the statement of operations. i) Valuation of forward foreign exchange contracts of each subfund Unmatured forward foreign exchange contracts are valued at valuation date at forward exchange rates prevailing at this date and resulting unrealised gains or losses are posted to the statement of operations. j) Valuation of swaps On each valuation day, swap agreements are valued at the net present value of the future cash flows, using the relevant interest rate yield curve on valuation day. Asset swaps and the securities linked to the asset swaps are not revalued as the security and the asset swap are considered for the purpose of the valuation as a single instrument. For the valuation of excess return swaps and total return swaps, the relevant underlying is taken into account. k) Allocation of accrued expenses Accrued expenses which can be allocated directly to a subfund are charged to this subfund. Accrued expenses which cannot be allocated directly are divided among the subfunds in proportion to the net assets of each subfund. l) Securities Lending The Company can practise lending of securities included in its portfolios of its subfunds. The Company may only lend securities within a standardized system of securities lending organised by a recognised institution of securities compensation or by first class financial institutions specialised in this type of operations. m) Units or shares in UCI shall be valued on the basis of their most recently calculated net asset value, where necessary taking due account of the redemption fee. Where no net asset value and only buy and sell prices are available for units or shares in UCI, the units/shares in such UCI may be valued at the mean of such buy and sell prices.
Credit Suisse SICAV One (Lux) • Unaudited Semi-Annual Report at 30.11.2010
Consolidated Report Page 8
Notes
n) Fiduciary and fixed-term deposits shall be valued at their respective nominal value plus accrued interest.
Management fee (see detail at subfund level)
As remuneration for its services and reimbursement of its expenses, the Management Company is entitled to a monthly management fee, payable at the end of each month and calculated on the basis of the average of the daily net asset value of the relevant unit class during the that month. In addition to the management fee, the Management Company is entitled to a performance fee. Credit Suisse SICAV One (Lux) Challenger (Euro), Credit Suisse SICAV One (Lux) Challenger (Sfr), Credit Suisse SICAV One (Lux) Defender (Euro), Credit Suisse SICAV One (Lux) Defender (Sfr): If, on the Calculation Date, the net asset value of a Share Class is above the hurdle rate index value and is greater than the preceding net asset values (prior to deduction of the performance fee), a performance fee of 10% shall be deducted on the difference between the net asset value of the Share Class and the hurdle rate index value and high water mark (whichever is the greater of the two). The performance fee is calculated on the basis of the Shares of the relevant Class that are currently in circulation. Credit Suisse SICAV One (Lux) Global Tactical Asset Allocation (GTAA) VaR 10% and Credit Suisse SICAV One (Lux) Small and Mid Cap Alpha Long/Short: If, on the Calculation Date, the net asset value of a Share Class is greater than the preceding net asset values (prior to deduction of the performance fee), a performance fee of 20% shall be deducted on the difference between the net asset value of the Share Class and the high water mark. The performance fee is calculated on the basis of the Shares of the relevant Class that are currently in circulation.
"Taxe d'abonnement"
Under the prevailing laws and regulations, the Company is subject in Luxembourg, on the basis of its investments, to a "taxe d'abonnement" at the annual rate of 0.05%, payable quarterly and calculated on the basis of the net assets of each subfund at the end of each quarter. The portion of net assets, which is invested in other undertakings for collective investment in securities under Luxembourg law, is exempt from this tax. Exception: 0.01% for D, F-classes. Class D Shares may only be acquired by investors who have concluded a discretionary asset management agreement with the Asset Management Division (AMD) of Credit Suisse, Zurich, or one of its branches. Moreover, subject to the prior consent of the Company, Class D Shares may also be purchased by institutional investors which have concluded an advisory agreement with Asset Management Division (AMD) of Credit Suisse, Zurich, or one of its branches. Class F Shares may only be acquired by investors who have concluded a discretionary asset management agreement with a Business Unit of Credit Suisse AG.
Total Expense Ratio (TER) (see detail at subfund level)
The TER expresses the sum of all costs and commissions charged on an ongoing basis to the fund’s assets, taken retrospectively as a percentage of these assets. For the subfunds Credit Suisse SICAV One (Lux) Index Selection Income Oriented (Euro), Credit Suisse SICAV One (Lux) Index Selection Income Oriented (Sfr), Credit Suisse SICAV One (Lux) Index Selection Income Oriented (US$), Credit Suisse SICAV One (Lux) Index Selection Balanced (Euro), Credit Suisse SICAV One (Lux) Index Selection Balanced (Sfr), Credit Suisse SICAV One (Lux) Index Selection Balanced (US$), Credit Suisse SICAV One (Lux) Capital Gains Oriented (Euro), Credit Suisse SICAV One (Lux) Capital Gains Oriented (Sfr), Credit Suisse SICAV One (Lux) Capital Gains Oriented (US$) the TER corresponds to the sum of: The prorated TER of the individual target funds, weighted according to the share they represent in the overall assets of the fund of funds as of the closing date and the TER of the fund of funds.
Portfolio Turnover Rate (PTR) (see detail at subfund level)
The PTR is used as the indicator for the fund’s trading activities (excluding purchases and sales resulting from subscriptions and buybacks) and is expressed as a percentage of the average net assets of the fund during the preceding twelve-month period. The PTR is calculated following the SFA guideline.
Changes in the composition of the securities portfolio
Changes in the composition of the securities portfolio during the reporting period/year are available to Shareholders free of charge at the registered office of the Company or the local representatives in the countries where the Company is registered.
Exchange Rates
The consolidated financial statements are kept in CHF. For this purpose, the financial statements of the subfunds are converted into CHF at the foreign exchange rates as of 30.11.2010: - 1 EUR = 1.297450 CHF - 1 USD = 0.996697 CHF
Fund performance (see detail at subfund level)
The performance is based on the net asset values as calculated on the last business day of the year. Those net asset values reflect the market prices of the investments as of the last business day of the year. Historical performance is no indicator of current or future performance. The performance data given does not take into account commissions and costs incurred in the purchase or redemption of fund shares. For shares launched more than 3 years ago no performance since inception is disclosed. Performance of distributing shares includes reinvestments of dividends.
Management fee of target funds
ISIN DenominationManagementfee in %
CH0019852802 CS ETF (CH) on SMIM(r) 0.45IE00B3VTMJ91 CS ETF (IE) on iBoxx EUR GOVT 1-3 ETF 0.12IE00B3VTQ640 CS ETF (IE) on iBoxx EUR infl. linked 0.16IE00B3VWN179 CS ETF (IE) on iBoxx USD Govt 1-3 0.12
IE00B3VWN393 CS ETF (IE) on iBoxx USD Govt 3-7 0.12IE00B53QG562 CS ETF (IE) on MSCI EMU 0.20IE00B3VWMM18 CS ETF (IE) on MSCI EMU SMALL CAP 0.42IE00B53QDK08 CS ETF (IE) on MSCI JAPAN 0.36IE00B53SZB19 CS ETF (IE) on NASDAQ 100 0.17
IE00B52MJD48 CS ETF (IE) on NIKKEI 225 0.38IE00B5BMR087 CS ETF (IE) on S&P 500 0.09LU0254097446 CS ETF (Lux) on MSCI Emerging Markets 0.45IE00B3VTPS97 CS ETF(IE) on iBoxx USD Inflation Linked 0.16LU0449425007 CS FD SBI FOREIGN CORPORATE -f- (CHF) 0.20LU0449423721 CS FD SBI FOREIGN GOVERN. 1-5 -f- (CHF) 0.20LU0449424539 CS FD SBI FOREIGN GOVERN. 5+ -f- (CHF) 0.20LU0507202330 CS FUND (LUX) MONEY MARKET SFR -B- 0.10LU0337322282 CS SOLUT. (LUX) CS TREMONT ALLHEDGE b 1.00LU0337322878 CS SOLUT. (LUX) CS TREMONT ALLHEDGE rc 1.00LU0337322522 CS SOLUT. (LUX) CS TREMONT ALLHEDGE rch 1.00CH0101754387 CSIF SWITZERLAND BOND INDEX AAA-BBB 0.25
Credit Suisse SICAV One (Lux) • Unaudited Semi-Annual Report at 30.11.2010
Consolidated Report Page 9
Notes
Subsequent events
By resolution of CS Fund Management S.A., the Subfund Credit Suisse Systematic Alpha (Lux) Equity UK will transfer its assets and liabilities in Credit Suisse SICAV One (Lux) European Equity Dividend Plus. The exchange of Units into Shares will be effected on the basis of the net asset values calculated on December 23, 2010, with value date December 29, 2010. The Board of Directors of the below-mentioned company has decided: - to rename the Subfund Credit Suisse SICAV One (Lux) Equity Europe into Credit Suisse SICAV One (Lux) Equity Eurozone and to amend the investment policy. - to amend the investment policy of the following Subfunds: Credit Suisse SICAV One (Lux) Challenger (Euro), Credit Suisse SICAV One (Lux) Challenger (Sfr), Credit Suisse SICAV One (Lux) Defender (Euro), Credit Suisse SICAV One (Lux) Defender (Sfr), Credit Suisse SICAV One (Lux) CommodityAllocation, Credit Suisse SICAV One (Lux) Equity Asian Dragon, Credit Suisse SICAV One (Lux) Equity Europe (since 1. January 2011 Credit Suisse SICAV One (Lux) Equity Eurozone), Credit Suisse SICAV One (Lux) Equity Global Emerging Markets, Credit Suisse SICAV One (Lux) Equity Global Emerging Market Property, Credit Suisse SICAV One (Lux) Equity India, Credit Suisse SICAV One ( Lux) Equity Japan Value, and Credit Suisse SICAV One (Lux) Equity Middle East & North Africa. All of the above-mentioned changes will become effective as of January 1, 2011.
Unrealised result on OTC
The unrealised gain/loss on forward foreign exchange contracts, futures and Swap contracts is included in Other Assets or Other liabilities.
Credit Suisse SICAV One (Lux) • Unaudited Semi-Annual Report at 30.11.2010
Consolidated Report Page 10
Notes
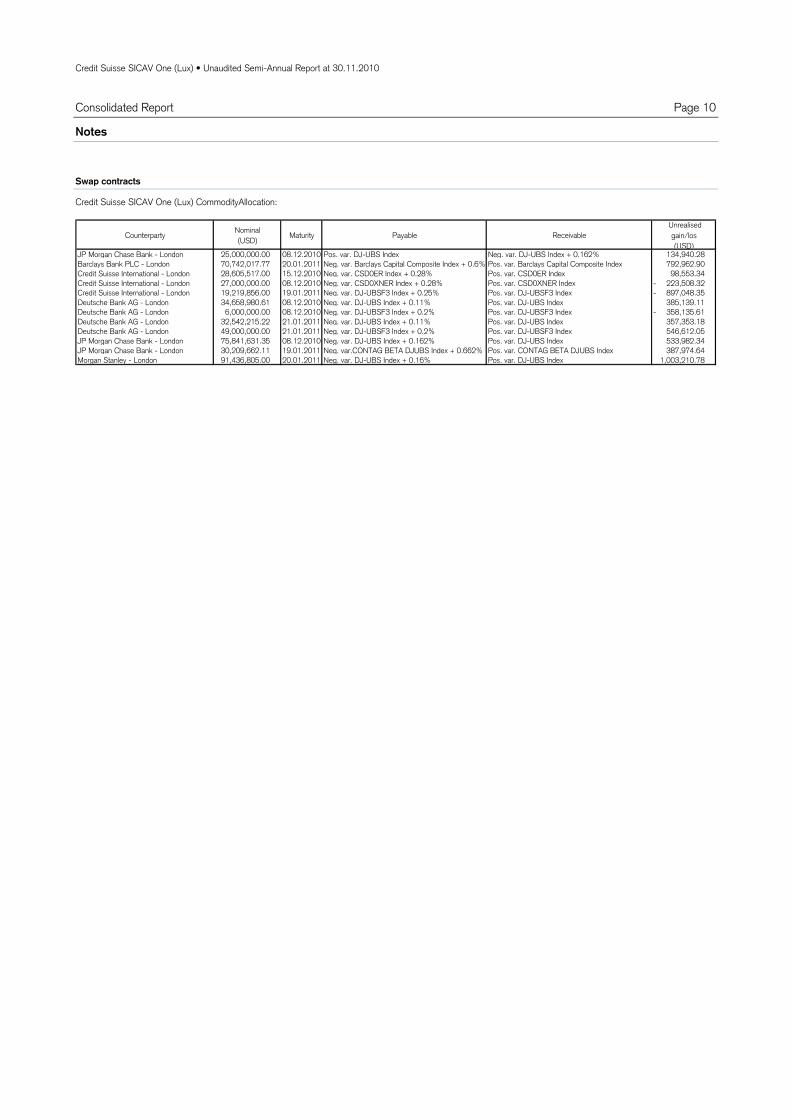
Swap contracts
Credit Suisse SICAV One (Lux) CommodityAllocation:
Counterparty Nominal(USD)
Maturity Payable ReceivableUnrealised gain/los(USD)
JP Morgan Chase Bank - London 25,000,000.00 08.12.2010 Pos. var. DJ-UBS Index Neg. var. DJ-UBS Index + 0.162% 134,940.28 Barclays Bank PLC - London 70,742,017.77 20.01.2011 Neg. var. Barclays Capital Composite Index + 0.6% Pos. var. Barclays Capital Composite Index 792,962.90 Credit Suisse International - London 28,605,517.00 15.12.2010 Neg. var. CSD0ER Index + 0.28% Pos. var. CSD0ER Index 98,553.34 Credit Suisse International - London 27,000,000.00 08.12.2010 Neg. var. CSD0XNER Index + 0.28% Pos. var. CSD0XNER Index 223,508.32 - Credit Suisse International - London 19,219,856.00 19.01.2011 Neg. var. DJ-UBSF3 Index + 0.25% Pos. var. DJ-UBSF3 Index 897,048.35 - Deutsche Bank AG - London 34,658,980.61 08.12.2010 Neg. var. DJ-UBS Index + 0.11% Pos. var. DJ-UBS Index 385,139.11 Deutsche Bank AG - London 6,000,000.00 08.12.2010 Neg. var. DJ-UBSF3 Index + 0.2% Pos. var. DJ-UBSF3 Index 358,135.61 - Deutsche Bank AG - London 32,542,215.22 21.01.2011 Neg. var. DJ-UBS Index + 0.11% Pos. var. DJ-UBS Index 357,353.18 Deutsche Bank AG - London 49,000,000.00 21.01.2011 Neg. var. DJ-UBSF3 Index + 0.2% Pos. var. DJ-UBSF3 Index 546,612.05 JP Morgan Chase Bank - London 75,841,631.35 08.12.2010 Neg. var. DJ-UBS Index + 0.162% Pos. var. DJ-UBS Index 533,982.34 JP Morgan Chase Bank - London 30,209,662.11 19.01.2011 Neg. var.CONTAG BETA DJUBS Index + 0.662% Pos. var. CONTAG BETA DJUBS Index 387,974.64 Morgan Stanley - London 91,436,805.00 20.01.2011 Neg. var. DJ-UBS Index + 0.16% Pos. var. DJ-UBS Index 1,003,210.78
Credit Suisse SICAV One (Lux) • Unaudited Semi-Annual Report at 30.11.2010
Page 11Credit Suisse SICAV One (Lux) Challenger (Euro)
Technical Data and Notes
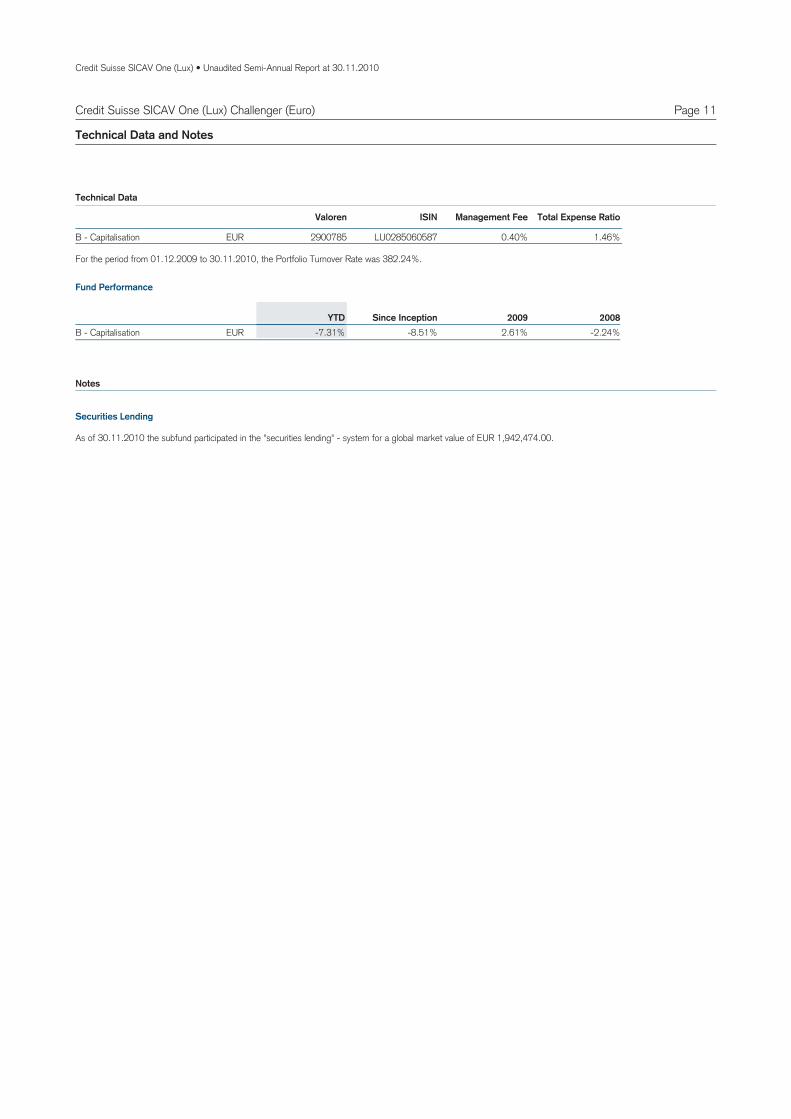
EURB 2900785 LU0285060587 0.40% 1.46%Capitalisation -
Valoren ISIN Management Fee Total Expense Ratio
Technical Data
EURB -2.24%2.61%-8.51%-7.31%Capitalisation - 2008YTD 2009Since Inception
Fund Performance
For the period from 01.12.2009 to 30.11.2010, the Portfolio Turnover Rate was 382.24%.
Notes
As of 30.11.2010 the subfund participated in the "securities lending" - system for a global market value of EUR 1,942,474.00.
Securities Lending

Credit Suisse SICAV One (Lux) • Unaudited Semi-Annual Report at 30.11.2010
Page 12
Assets
Investments in securities at market value 13,777,548.38Cash at banks 618,238.21Income receivable 198,354.46Prepaid expenses 109.94
14,594,250.99
Liabilities
Provisions for accrued expenses 6,589.406,589.40
14,587,661.59Net assets
Statement of Net Assets in EUR and Fund Evolution
30.11.2010
91.49 98.59EURB 91.43Capitalisation -
Total net assets
Net asset value per share
14,587,661.59 21,039,987.82 44,096,868.64EUR
Fund Evolution 30.11.2010 31.05.2010 31.05.2009
159,451.514 452.627B 230,113.426 71,114.539Capitalisation - EUR
Number of shares outstanding at the endof the period
at the beginningof the period
Number of shares issued
Number of shares redeemed
Credit Suisse SICAV One (Lux) Challenger (Euro)
The notes are an integral part of the financial statements.
Credit Suisse SICAV One (Lux) • Unaudited Semi-Annual Report at 30.11.2010
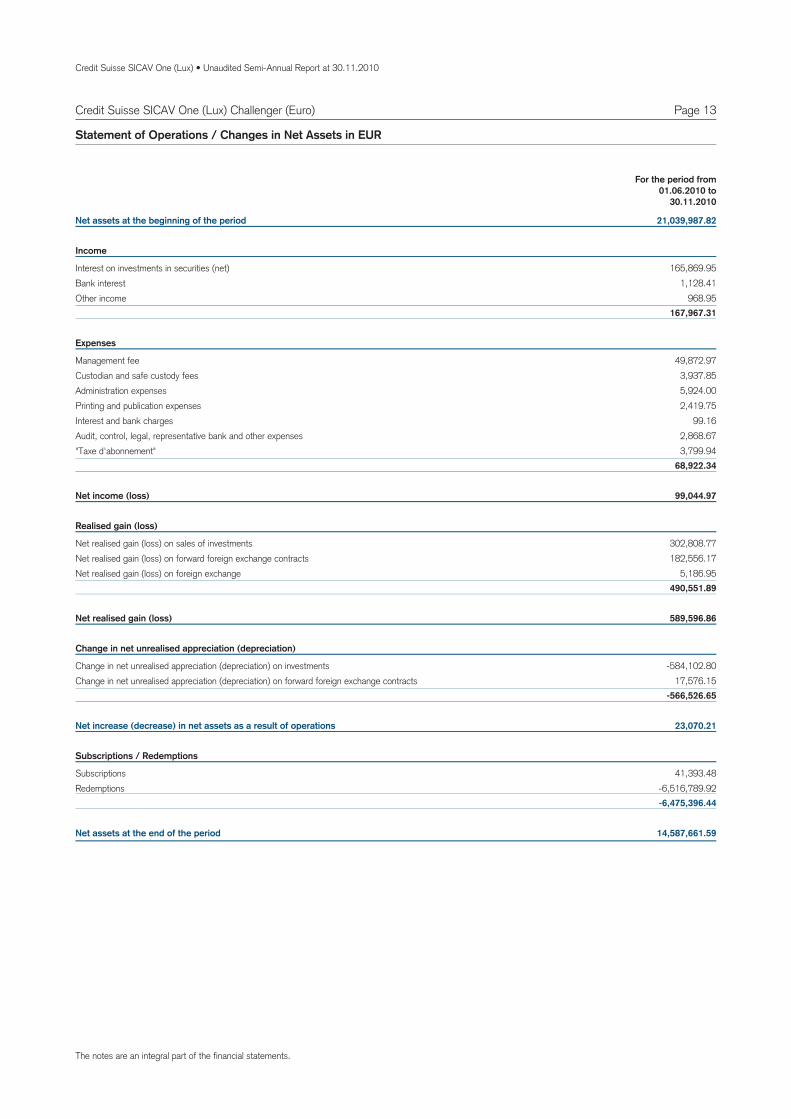
Page 13Credit Suisse SICAV One (Lux) Challenger (Euro)
Net assets at the beginning of the period 21,039,987.82
Income
Interest on investments in securities (net) 165,869.95Bank interest 1,128.41Other income 968.95
167,967.31
Expenses
Management fee 49,872.97Custodian and safe custody fees 3,937.85Administration expenses 5,924.00Printing and publication expenses 2,419.75Interest and bank charges 99.16Audit, control, legal, representative bank and other expenses 2,868.67"Taxe d'abonnement" 3,799.94
68,922.34
Net income (loss) 99,044.97
Realised gain (loss)
Net realised gain (loss) on sales of investments 302,808.77Net realised gain (loss) on forward foreign exchange contracts 182,556.17Net realised gain (loss) on foreign exchange 5,186.95
490,551.89
Net realised gain (loss) 589,596.86
Change in net unrealised appreciation (depreciation)
Change in net unrealised appreciation (depreciation) on investments -584,102.80Change in net unrealised appreciation (depreciation) on forward foreign exchange contracts 17,576.15
-566,526.65
Net increase (decrease) in net assets as a result of operations 23,070.21
Subscriptions / Redemptions
Subscriptions 41,393.48Redemptions -6,516,789.92
-6,475,396.44
Net assets at the end of the period 14,587,661.59
Statement of Operations / Changes in Net Assets in EUR
For the period from01.06.2010 to
30.11.2010
The notes are an integral part of the financial statements.
The notes are an integral part of the financial statements.Any differences in the percentage of Net Assets are the result of roundings.
Credit Suisse SICAV One (Lux) • Unaudited Semi-Annual Report at 30.11.2010
Page 14Credit Suisse SICAV One (Lux) Challenger (Euro)
Breakdown by Country and Economic Sector of the Investments in SecuritiesStatement of Investments in Securities and Other Net Assets
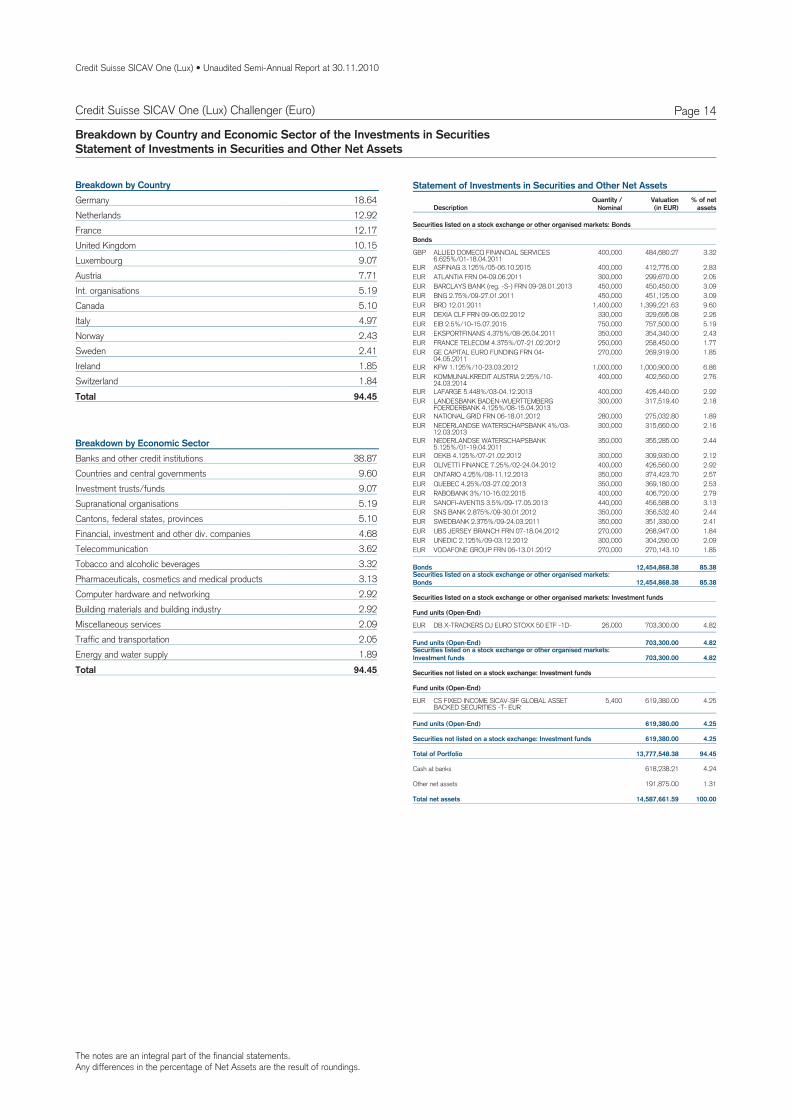
18.64GermanyBreakdown by Country
12.92Netherlands12.17France10.15United Kingdom9.07Luxembourg7.71Austria5.19Int. organisations5.10Canada4.97Italy2.43Norway2.41Sweden1.85Ireland1.84Switzerland
94.45Total
38.87Banks and other credit institutionsBreakdown by Economic Sector
9.60Countries and central governments9.07Investment trusts/funds5.19Supranational organisations5.10Cantons, federal states, provinces4.68Financial, investment and other div. companies3.62Telecommunication3.32Tobacco and alcoholic beverages3.13Pharmaceuticals, cosmetics and medical products2.92Computer hardware and networking2.92Building materials and building industry2.09Miscellaneous services2.05Traffic and transportation1.89Energy and water supply
94.45Total
Statement of Investments in Securities and Other Net Assets
DescriptionQuantity /
NominalValuation % of net
assets(in EUR)
Securities listed on a stock exchange or other organised markets: Bonds
Bonds
GBP ALLIED DOMECQ FINANCIAL SERVICES6.625%/01-18.04.2011
400,000 484,680.27 3.32
EUR ASFINAG 3.125%/05-06.10.2015 400,000 412,776.00 2.83EUR ATLANTIA FRN 04-09.06.2011 300,000 299,670.00 2.05EUR BARCLAYS BANK (reg. -S-) FRN 09-28.01.2013 450,000 450,450.00 3.09EUR BNG 2.75%/09-27.01.2011 450,000 451,125.00 3.09EUR BRD 12.01.2011 1,400,000 1,399,221.63 9.60EUR DEXIA CLF FRN 09-06.02.2012 330,000 329,695.08 2.26EUR EIB 2.5%/10-15.07.2015 750,000 757,500.00 5.19EUR EKSPORTFINANS 4.375%/08-26.04.2011 350,000 354,340.00 2.43EUR FRANCE TELECOM 4.375%/07-21.02.2012 250,000 258,450.00 1.77EUR GE CAPITAL EURO FUNDING FRN 04-
04.05.2011270,000 269,919.00 1.85
EUR KFW 1.125%/10-23.03.2012 1,000,000 1,000,900.00 6.86EUR KOMMUNALKREDIT AUSTRIA 2.25%/10-
24.03.2014400,000 402,560.00 2.76
EUR LAFARGE 5.448%/03-04.12.2013 400,000 425,440.00 2.92EUR LANDESBANK BADEN-WUERTTEMBERG
FOERDERBANK 4.125%/08-15.04.2013300,000 317,519.40 2.18
EUR NATIONAL GRID FRN 06-18.01.2012 280,000 275,032.80 1.89EUR NEDERLANDSE WATERSCHAPSBANK 4%/03-
12.03.2013300,000 315,660.00 2.16
EUR NEDERLANDSE WATERSCHAPSBANK5.125%/01-19.04.2011
350,000 355,285.00 2.44
EUR OEKB 4.125%/07-21.02.2012 300,000 309,930.00 2.12EUR OLIVETTI FINANCE 7.25%/02-24.04.2012 400,000 426,560.00 2.92EUR ONTARIO 4.25%/08-11.12.2013 350,000 374,423.70 2.57EUR QUEBEC 4.25%/03-27.02.2013 350,000 369,180.00 2.53EUR RABOBANK 3%/10-16.02.2015 400,000 406,720.00 2.79EUR SANOFI-AVENTIS 3.5%/09-17.05.2013 440,000 456,588.00 3.13EUR SNS BANK 2.875%/09-30.01.2012 350,000 356,532.40 2.44EUR SWEDBANK 2.375%/09-24.03.2011 350,000 351,330.00 2.41EUR UBS JERSEY BRANCH FRN 07-18.04.2012 270,000 268,947.00 1.84EUR UNEDIC 2.125%/09-03.12.2012 300,000 304,290.00 2.09EUR VODAFONE GROUP FRN 06-13.01.2012 270,000 270,143.10 1.85
Securities listed on a stock exchange or other organised markets:Bonds 12,454,868.38 85.38
Bonds 12,454,868.38 85.38
Securities listed on a stock exchange or other organised markets: Investment funds
Fund units (Open-End)
EUR DB X-TRACKERS DJ EURO STOXX 50 ETF -1D- 26,000 703,300.00 4.82
Securities listed on a stock exchange or other organised markets:Investment funds 703,300.00 4.82
Fund units (Open-End) 703,300.00 4.82
Securities not listed on a stock exchange: Investment funds
Fund units (Open-End)
EUR CS FIXED INCOME SICAV-SIF GLOBAL ASSETBACKED SECURITIES -T- EUR
5,400 619,380.00 4.25
Securities not listed on a stock exchange: Investment funds 619,380.00 4.25
Fund units (Open-End) 619,380.00 4.25
Total of Portfolio 13,777,548.38 94.45
Cash at banks 618,238.21 4.24
Other net assets 191,875.00 1.31
Total net assets 14,587,661.59 100.00
Credit Suisse SICAV One (Lux) • Unaudited Semi-Annual Report at 30.11.2010
Page 15Credit Suisse SICAV One (Lux) Challenger (Sfr)
Technical Data and Notes
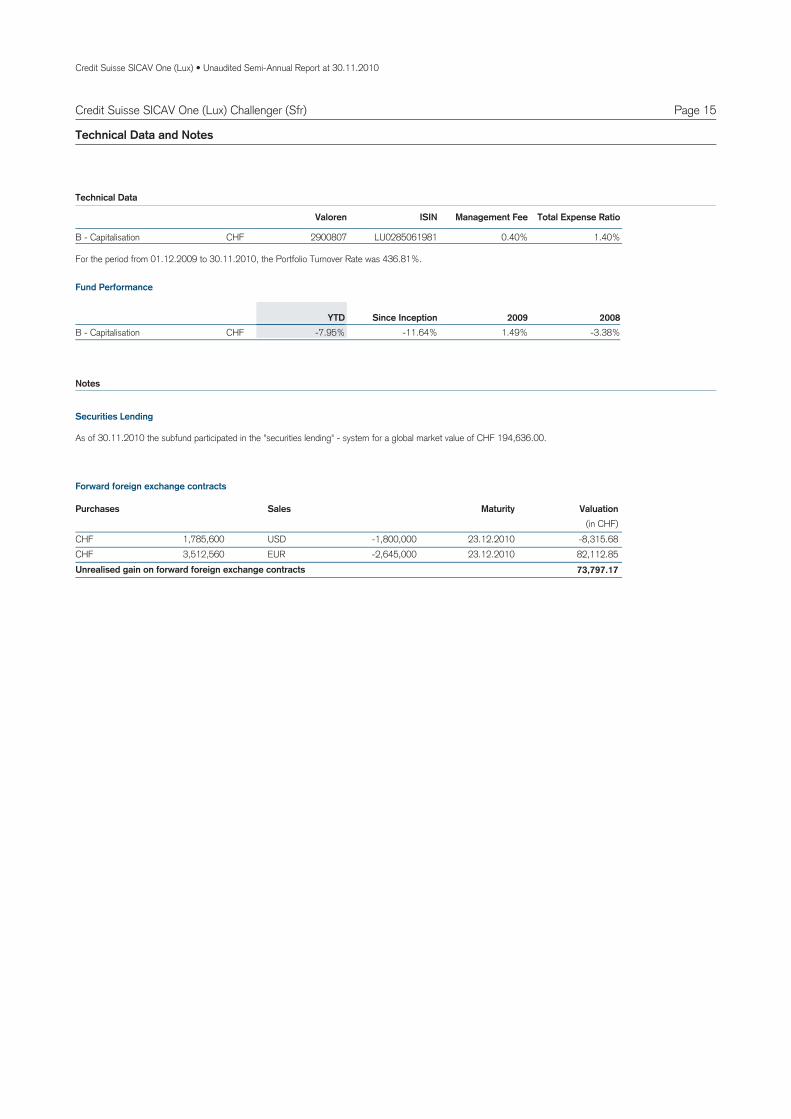
CHFB 2900807 LU0285061981 0.40% 1.40%Capitalisation -
Valoren ISIN Management Fee Total Expense Ratio
Technical Data
CHFB -3.38%1.49%-11.64%-7.95%Capitalisation - 2008YTD 2009Since Inception
Fund Performance
For the period from 01.12.2009 to 30.11.2010, the Portfolio Turnover Rate was 436.81%.
Notes
As of 30.11.2010 the subfund participated in the "securities lending" - system for a global market value of CHF 194,636.00.
Securities Lending
1,785,600CHF USD -1,800,000 -8,315.6823.12.20103,512,560CHF EUR -2,645,000 82,112.8523.12.2010
73,797.17Unrealised gain on forward foreign exchange contracts
SalesPurchases Valuation(in CHF)
Maturity
Forward foreign exchange contracts
Credit Suisse SICAV One (Lux) • Unaudited Semi-Annual Report at 30.11.2010
Page 16
Assets
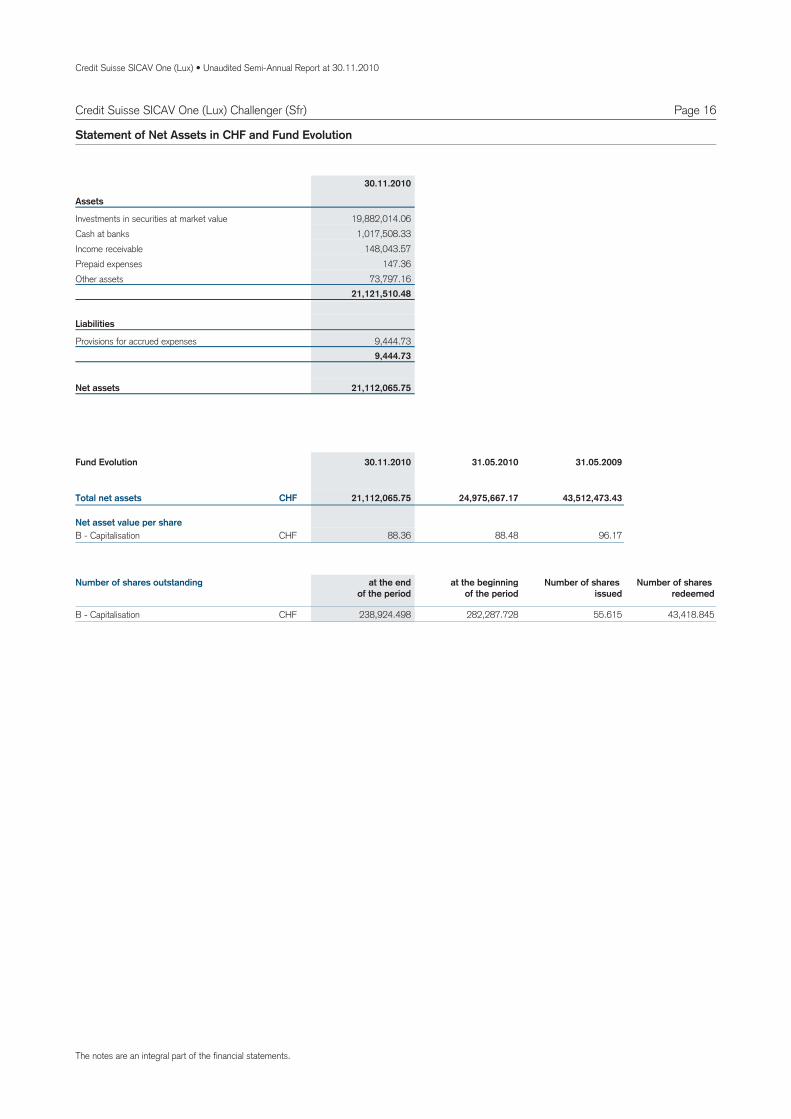
Investments in securities at market value 19,882,014.06Cash at banks 1,017,508.33Income receivable 148,043.57Prepaid expenses 147.36Other assets 73,797.16
21,121,510.48
Liabilities
Provisions for accrued expenses 9,444.739,444.73
21,112,065.75Net assets
Statement of Net Assets in CHF and Fund Evolution
30.11.2010
88.36 96.17CHFB 88.48Capitalisation -
Total net assets
Net asset value per share
21,112,065.75 24,975,667.17 43,512,473.43CHF
Fund Evolution 30.11.2010 31.05.2010 31.05.2009
238,924.498 55.615B 282,287.728 43,418.845Capitalisation - CHF
Number of shares outstanding at the endof the period
at the beginningof the period
Number of shares issued
Number of shares redeemed
Credit Suisse SICAV One (Lux) Challenger (Sfr)
The notes are an integral part of the financial statements.

Credit Suisse SICAV One (Lux) • Unaudited Semi-Annual Report at 30.11.2010
Page 17Credit Suisse SICAV One (Lux) Challenger (Sfr)
Net assets at the beginning of the period 24,975,667.17
Income
Interest on investments in securities (net) 155,251.49Bank interest 272.97Other income 518.48
156,042.94
Expenses
Management fee 64,277.13Custodian and safe custody fees 5,155.07Administration expenses 7,651.79Printing and publication expenses 2,973.98Interest and bank charges 33.70Audit, control, legal, representative bank and other expenses 3,726.65"Taxe d'abonnement" 5,346.62
89,164.94
Net income (loss) 66,878.00
Realised gain (loss)
Net realised gain (loss) on sales of investments -365,424.94Net realised gain (loss) on forward foreign exchange contracts 796,199.43Net realised gain (loss) on foreign exchange 152,222.60
582,997.09
Net realised gain (loss) 649,875.09
Change in net unrealised appreciation (depreciation)
Change in net unrealised appreciation (depreciation) on investments -748,849.97Change in net unrealised appreciation (depreciation) on forward foreign exchange contracts 68,089.27
-680,760.70
Net increase (decrease) in net assets as a result of operations -30,885.61
Subscriptions / Redemptions
Subscriptions 4,919.15Redemptions -3,837,634.96
-3,832,715.81
Net assets at the end of the period 21,112,065.75
Statement of Operations / Changes in Net Assets in CHF
For the period from01.06.2010 to
30.11.2010
The notes are an integral part of the financial statements.
The notes are an integral part of the financial statements.Any differences in the percentage of Net Assets are the result of roundings.
Credit Suisse SICAV One (Lux) • Unaudited Semi-Annual Report at 30.11.2010
Page 18Credit Suisse SICAV One (Lux) Challenger (Sfr)
Breakdown by Country and Economic Sector of the Investments in SecuritiesStatement of Investments in Securities and Other Net Assets
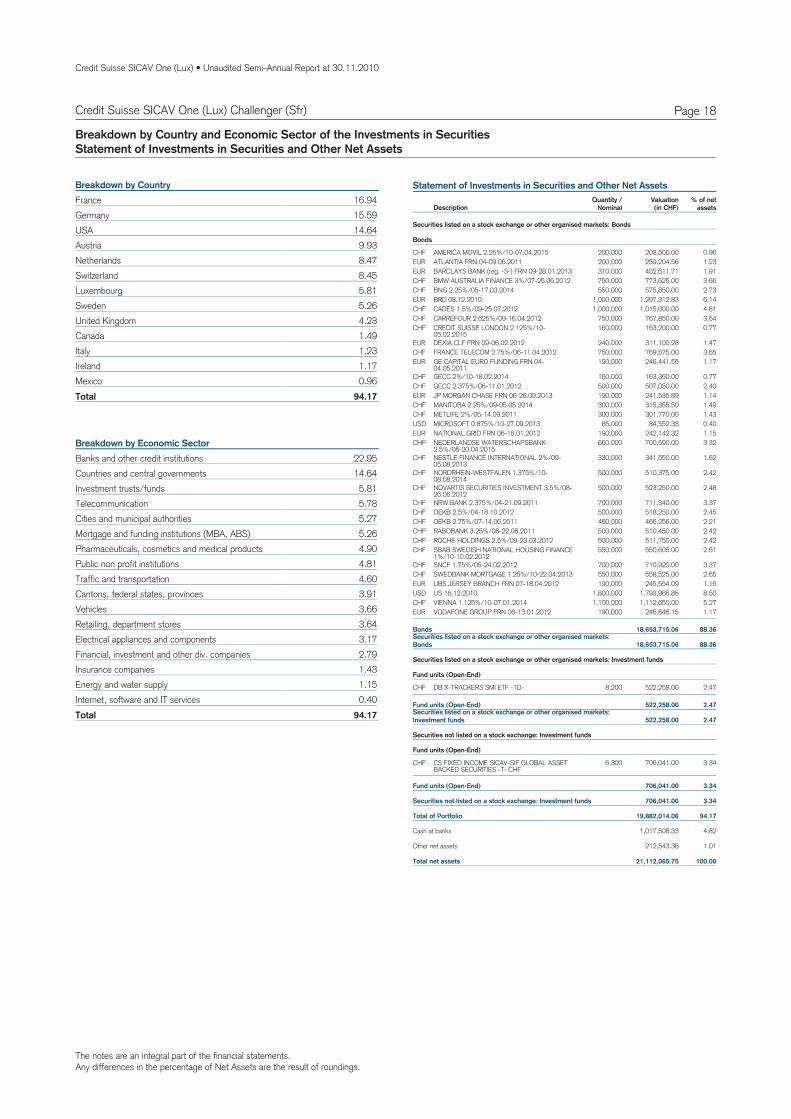
16.94FranceBreakdown by Country
15.59Germany14.64USA9.93Austria8.47Netherlands8.45Switzerland5.81Luxembourg5.26Sweden4.23United Kingdom1.49Canada1.23Italy1.17Ireland0.96Mexico
94.17Total
22.95Banks and other credit institutionsBreakdown by Economic Sector
14.64Countries and central governments5.81Investment trusts/funds5.78Telecommunication5.27Cities and municipal authorities5.26Mortgage and funding institutions (MBA, ABS)4.90Pharmaceuticals, cosmetics and medical products4.81Public non profit institutions4.60Traffic and transportation3.91Cantons, federal states, provinces3.66Vehicles3.64Retailing, department stores3.17Electrical appliances and components2.79Financial, investment and other div. companies1.43Insurance companies1.15Energy and water supply0.40Internet, software and IT services
94.17Total
Statement of Investments in Securities and Other Net Assets
DescriptionQuantity /
NominalValuation % of net
assets(in CHF)
Securities listed on a stock exchange or other organised markets: Bonds
Bonds
CHF AMERICA MOVIL 2.25%/10-07.04.2015 200,000 203,500.00 0.96EUR ATLANTIA FRN 04-09.06.2011 200,000 259,204.56 1.23EUR BARCLAYS BANK (reg. -S-) FRN 09-28.01.2013 310,000 402,611.71 1.91CHF BMW AUSTRALIA FINANCE 3%/07-25.06.2012 750,000 773,625.00 3.66CHF BNG 2.25%/05-17.03.2014 550,000 575,850.00 2.73EUR BRD 08.12.2010 1,000,000 1,297,312.83 6.14CHF CADES 1.5%/09-25.07.2012 1,000,000 1,015,000.00 4.81CHF CARREFOUR 2.625%/09-16.04.2012 750,000 767,850.00 3.64CHF CREDIT SUISSE LONDON 2.125%/10-
05.02.2015160,000 163,200.00 0.77
EUR DEXIA CLF FRN 09-06.02.2012 240,000 311,100.28 1.47CHF FRANCE TELECOM 2.75%/06-11.04.2012 750,000 769,575.00 3.65EUR GE CAPITAL EURO FUNDING FRN 04-
04.05.2011190,000 246,441.55 1.17
CHF GECC 2%/10-18.02.2014 160,000 163,360.00 0.77CHF GECC 2.375%/06-11.01.2012 500,000 507,050.00 2.40EUR JP MORGAN CHASE FRN 06-26.09.2013 190,000 241,535.89 1.14CHF MANITOBA 2.25%/09-05.05.2014 300,000 315,355.50 1.49CHF METLIFE 2%/05-14.09.2011 300,000 301,770.00 1.43USD MICROSOFT 0.875%/10-27.09.2013 85,000 84,552.33 0.40EUR NATIONAL GRID FRN 06-18.01.2012 190,000 242,142.32 1.15CHF NEDERLANDSE WATERSCHAPSBANK
2.5%/05-20.04.2015660,000 700,590.00 3.32
CHF NESTLE FINANCE INTERNATIONAL 2%/09-05.08.2013
330,000 341,550.00 1.62
CHF NORDRHEIN-WESTFALEN 1.375%/10-08.08.2014
500,000 510,375.00 2.42
CHF NOVARTIS SECURITIES INVESTMENT 3.5%/08-26.06.2012
500,000 523,250.00 2.48
CHF NRW.BANK 2.375%/04-21.09.2011 700,000 711,340.00 3.37CHF OEKB 2.5%/04-18.10.2012 500,000 518,250.00 2.45CHF OEKB 2.75%/07-14.06.2011 460,000 466,256.00 2.21CHF RABOBANK 3.25%/08-22.08.2011 500,000 510,450.00 2.42CHF ROCHE HOLDINGS 2.5%/09-23.03.2012 500,000 511,750.00 2.42CHF SBAB SWEDISH NATIONAL HOUSING FINANCE
1%/10-10.02.2012550,000 550,605.00 2.61
CHF SNCF 1.75%/05-24.02.2012 700,000 710,920.00 3.37CHF SWEDBANK MORTGAGE 1.25%/10-22.04.2013 550,000 558,525.00 2.65EUR UBS JERSEY BRANCH FRN 07-18.04.2012 190,000 245,554.09 1.16USD US 16.12.2010 1,800,000 1,793,966.85 8.50CHF VIENNA 1.125%/10-07.01.2014 1,100,000 1,112,650.00 5.27EUR VODAFONE GROUP FRN 06-13.01.2012 190,000 246,646.15 1.17
Securities listed on a stock exchange or other organised markets:Bonds 18,653,715.06 88.36
Bonds 18,653,715.06 88.36
Securities listed on a stock exchange or other organised markets: Investment funds
Fund units (Open-End)
CHF DB X-TRACKERS SMI ETF -1D- 8,200 522,258.00 2.47
Securities listed on a stock exchange or other organised markets:Investment funds 522,258.00 2.47
Fund units (Open-End) 522,258.00 2.47
Securities not listed on a stock exchange: Investment funds
Fund units (Open-End)
CHF CS FIXED INCOME SICAV-SIF GLOBAL ASSETBACKED SECURITIES -T- CHF
6,300 706,041.00 3.34
Securities not listed on a stock exchange: Investment funds 706,041.00 3.34
Fund units (Open-End) 706,041.00 3.34
Total of Portfolio 19,882,014.06 94.17
Cash at banks 1,017,508.33 4.82
Other net assets 212,543.36 1.01
Total net assets 21,112,065.75 100.00
Credit Suisse SICAV One (Lux) • Unaudited Semi-Annual Report at 30.11.2010
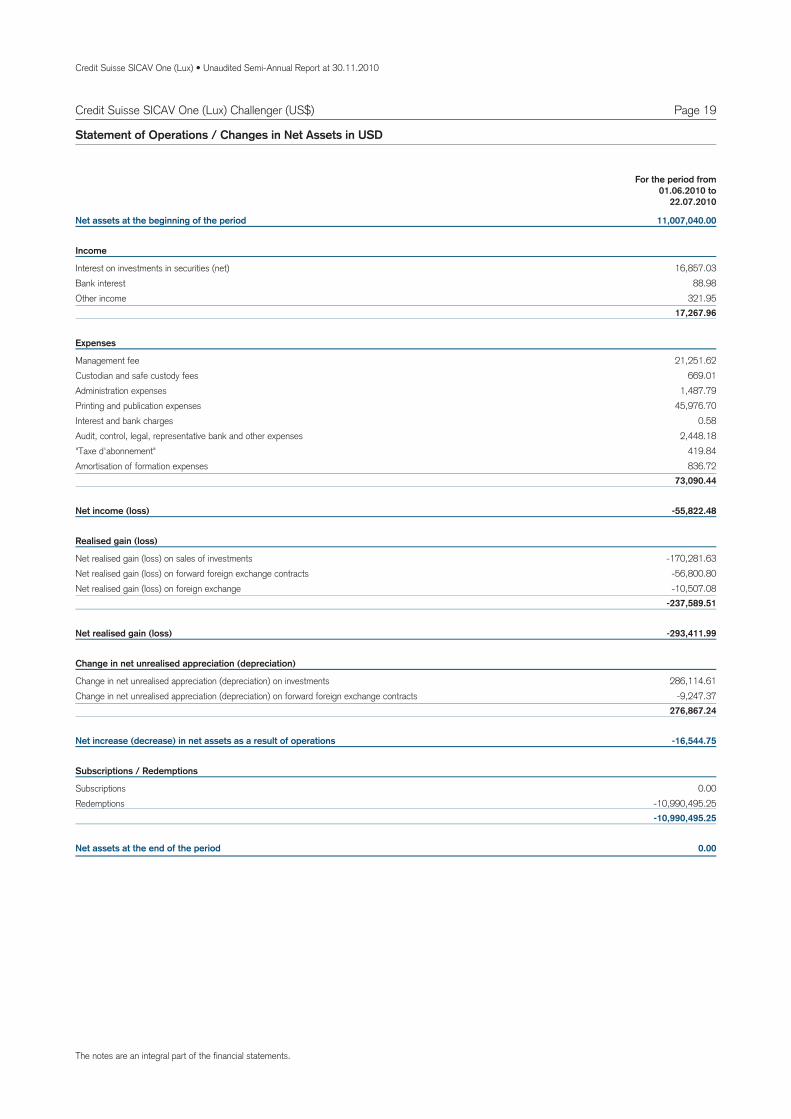
Page 19Credit Suisse SICAV One (Lux) Challenger (US$)
Net assets at the beginning of the period 11,007,040.00
Income
Interest on investments in securities (net) 16,857.03Bank interest 88.98Other income 321.95
17,267.96
Expenses
Management fee 21,251.62Custodian and safe custody fees 669.01Administration expenses 1,487.79Printing and publication expenses 45,976.70Interest and bank charges 0.58Audit, control, legal, representative bank and other expenses 2,448.18"Taxe d'abonnement" 419.84Amortisation of formation expenses 836.72
73,090.44
Net income (loss) -55,822.48
Realised gain (loss)
Net realised gain (loss) on sales of investments -170,281.63Net realised gain (loss) on forward foreign exchange contracts -56,800.80Net realised gain (loss) on foreign exchange -10,507.08
-237,589.51
Net realised gain (loss) -293,411.99
Change in net unrealised appreciation (depreciation)
Change in net unrealised appreciation (depreciation) on investments 286,114.61Change in net unrealised appreciation (depreciation) on forward foreign exchange contracts -9,247.37
276,867.24
Net increase (decrease) in net assets as a result of operations -16,544.75
Subscriptions / Redemptions
Subscriptions 0.00Redemptions -10,990,495.25
-10,990,495.25
Net assets at the end of the period 0.00
Statement of Operations / Changes in Net Assets in USD
For the period from01.06.2010 to
22.07.2010
The notes are an integral part of the financial statements.
Credit Suisse SICAV One (Lux) • Unaudited Semi-Annual Report at 30.11.2010
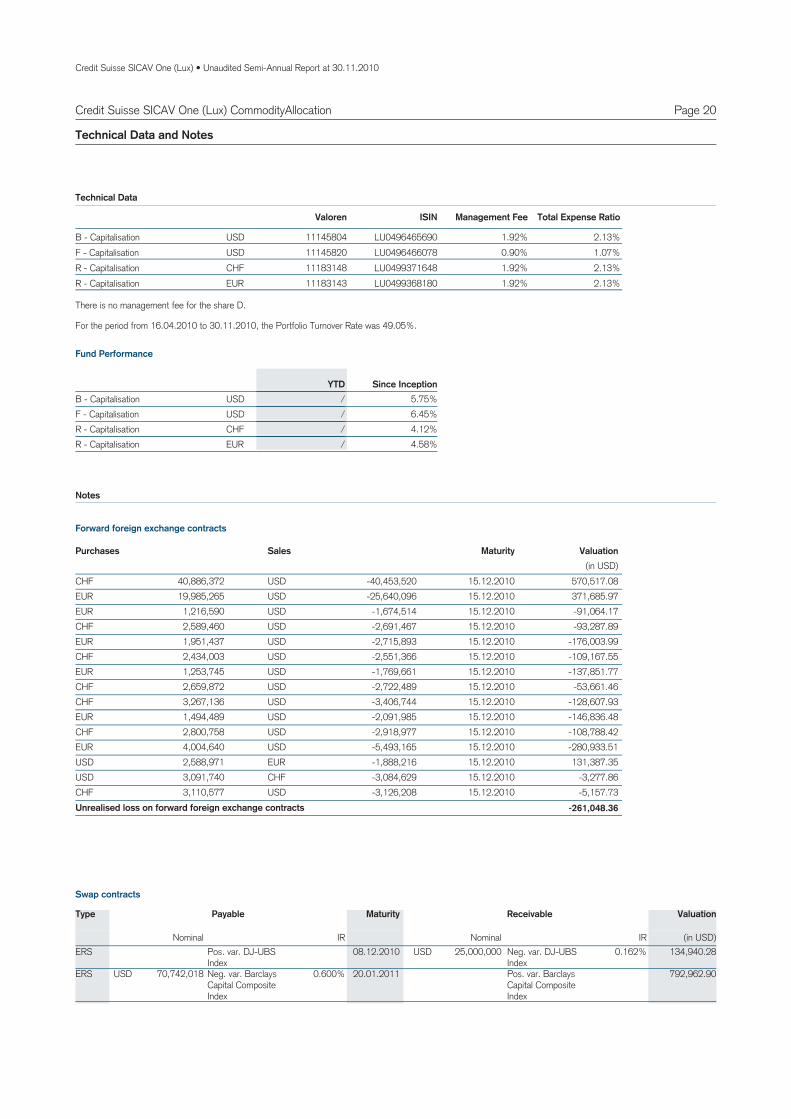
Page 20Credit Suisse SICAV One (Lux) CommodityAllocation
Technical Data and Notes
USDB 11145804 LU0496465690 1.92% 2.13%Capitalisation -
Valoren ISIN Management Fee Total Expense Ratio
USDF 11145820 LU0496466078 0.90% 1.07%Capitalisation - CHFR 11183148 LU0499371648 1.92% 2.13%Capitalisation - EURR 11183143 LU0499368180 1.92% 2.13%Capitalisation -
Technical Data
USDB 5.75%/Capitalisation - YTD Since Inception
USDF 6.45%/Capitalisation - CHFR 4.12%/Capitalisation - EURR 4.58%/Capitalisation -
Fund Performance
For the period from 16.04.2010 to 30.11.2010, the Portfolio Turnover Rate was 49.05%.
Notes
There is no management fee for the share D.
40,886,372CHF USD -40,453,520 570,517.0815.12.201019,985,265EUR USD -25,640,096 371,685.9715.12.20101,216,590EUR USD -1,674,514 -91,064.1715.12.20102,589,460CHF USD -2,691,467 -93,287.8915.12.20101,951,437EUR USD -2,715,893 -176,003.9915.12.20102,434,003CHF USD -2,551,366 -109,167.5515.12.20101,253,745EUR USD -1,769,661 -137,851.7715.12.20102,659,872CHF USD -2,722,489 -53,661.4615.12.20103,267,136CHF USD -3,406,744 -128,607.9315.12.20101,494,489EUR USD -2,091,985 -146,836.4815.12.20102,800,758CHF USD -2,918,977 -108,788.4215.12.20104,004,640EUR USD -5,493,165 -280,933.5115.12.20102,588,971USD EUR -1,888,216 131,387.3515.12.20103,091,740USD CHF -3,084,629 -3,277.8615.12.20103,110,577CHF USD -3,126,208 -5,157.7315.12.2010
-261,048.36Unrealised loss on forward foreign exchange contracts
SalesPurchases Valuation(in USD)
Maturity
Forward foreign exchange contracts
ERS Pos. var. DJ-UBSIndex
08.12.2010 134,940.28USD 25,000,000 Neg. var. DJ-UBSIndex
0.162%
ERS Neg. var. BarclaysCapital CompositeIndex
20.01.2011 792,962.90USD 70,742,018 0.600% Pos. var. BarclaysCapital CompositeIndex
Type Maturity ReceivablePayable Valuation
(in USD)Nominal IR Nominal IR
Swap contracts
Credit Suisse SICAV One (Lux) • Unaudited Semi-Annual Report at 30.11.2010
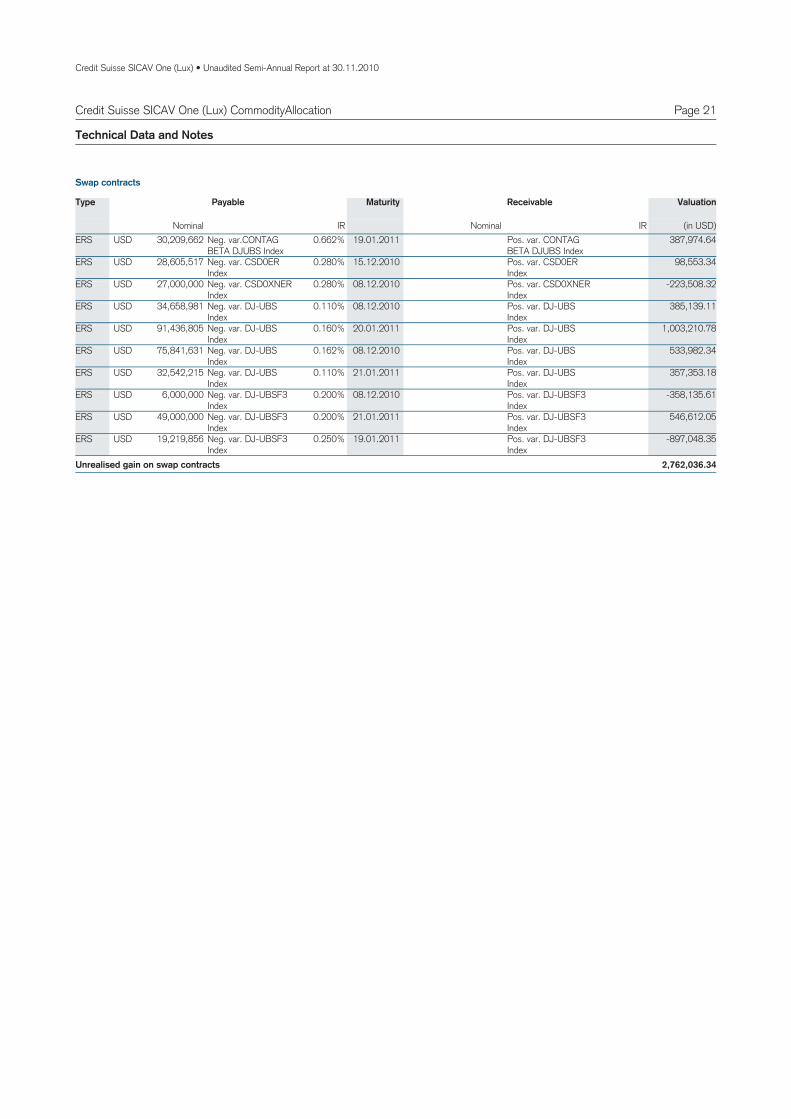
Page 21Credit Suisse SICAV One (Lux) CommodityAllocation
Technical Data and Notes
ERS Neg. var.CONTAGBETA DJUBS Index
19.01.2011 387,974.64USD 30,209,662 0.662% Pos. var. CONTAGBETA DJUBS Index
ERS Neg. var. CSD0ERIndex
15.12.2010 98,553.34USD 28,605,517 0.280% Pos. var. CSD0ERIndex
ERS Neg. var. CSD0XNERIndex
08.12.2010 -223,508.32USD 27,000,000 0.280% Pos. var. CSD0XNERIndex
ERS Neg. var. DJ-UBSIndex
08.12.2010 385,139.11USD 34,658,981 0.110% Pos. var. DJ-UBSIndex
ERS Neg. var. DJ-UBSIndex
20.01.2011 1,003,210.78USD 91,436,805 0.160% Pos. var. DJ-UBSIndex
ERS Neg. var. DJ-UBSIndex
08.12.2010 533,982.34USD 75,841,631 0.162% Pos. var. DJ-UBSIndex
ERS Neg. var. DJ-UBSIndex
21.01.2011 357,353.18USD 32,542,215 0.110% Pos. var. DJ-UBSIndex
ERS Neg. var. DJ-UBSF3Index
08.12.2010 -358,135.61USD 6,000,000 0.200% Pos. var. DJ-UBSF3Index
ERS Neg. var. DJ-UBSF3Index
21.01.2011 546,612.05USD 49,000,000 0.200% Pos. var. DJ-UBSF3Index
ERS Neg. var. DJ-UBSF3Index
19.01.2011 -897,048.35USD 19,219,856 0.250% Pos. var. DJ-UBSF3Index
2,762,036.34Unrealised gain on swap contracts
Type Maturity ReceivablePayable Valuation
(in USD)Nominal IR Nominal IR
Swap contracts
Credit Suisse SICAV One (Lux) • Unaudited Semi-Annual Report at 30.11.2010
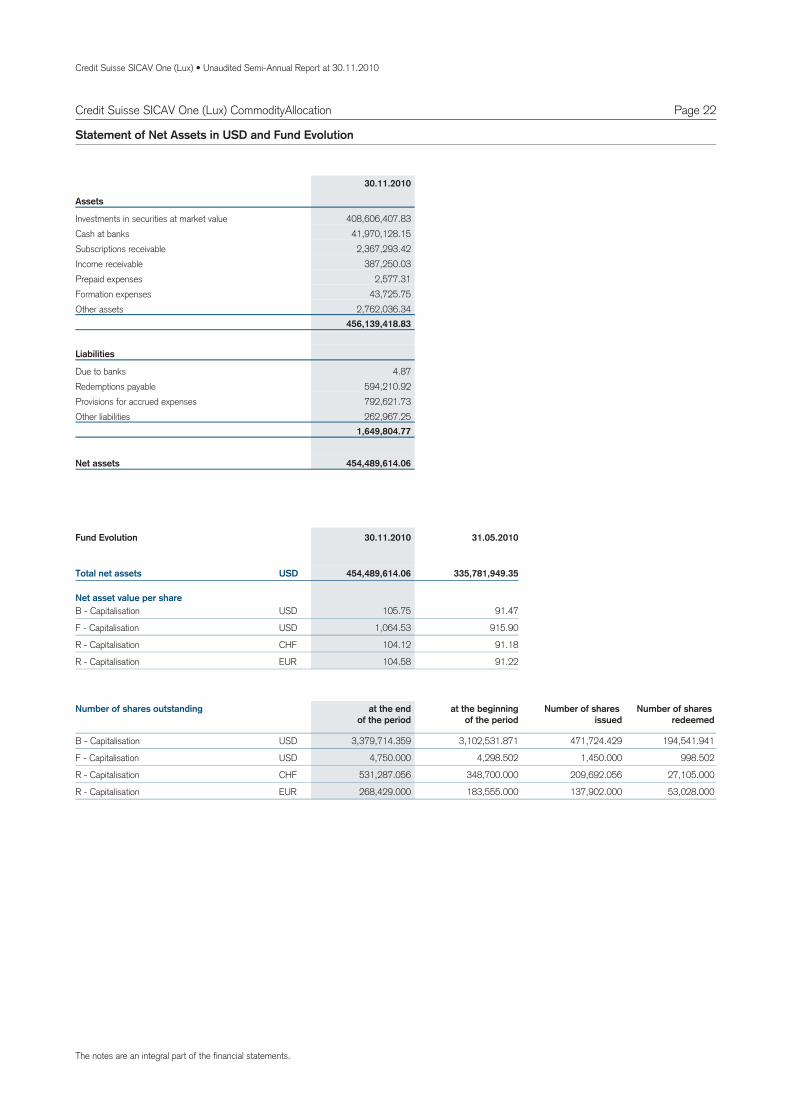
Page 22
Assets
Investments in securities at market value 408,606,407.83Cash at banks 41,970,128.15Subscriptions receivable 2,367,293.42Income receivable 387,250.03Prepaid expenses 2,577.31Formation expenses 43,725.75Other assets 2,762,036.34
456,139,418.83
Liabilities
Due to banks 4.87Redemptions payable 594,210.92Provisions for accrued expenses 792,621.73Other liabilities 262,967.25
1,649,804.77
454,489,614.06Net assets
Statement of Net Assets in USD and Fund Evolution
30.11.2010
105.75USDB 91.47Capitalisation -
1,064.53USDF 915.90Capitalisation -
104.12CHFR 91.18Capitalisation -
104.58EURR 91.22Capitalisation -
Total net assets
Net asset value per share
454,489,614.06 335,781,949.35USD
Fund Evolution 30.11.2010 31.05.2010
3,379,714.359 471,724.429B 3,102,531.871 194,541.941Capitalisation - USD
4,750.000 1,450.000F 4,298.502 998.502Capitalisation - USD
531,287.056 209,692.056R 348,700.000 27,105.000Capitalisation - CHF
268,429.000 137,902.000R 183,555.000 53,028.000Capitalisation - EUR
Number of shares outstanding at the endof the period
at the beginningof the period
Number of shares issued
Number of shares redeemed
Credit Suisse SICAV One (Lux) CommodityAllocation
The notes are an integral part of the financial statements.
Credit Suisse SICAV One (Lux) • Unaudited Semi-Annual Report at 30.11.2010
Page 23Credit Suisse SICAV One (Lux) CommodityAllocation
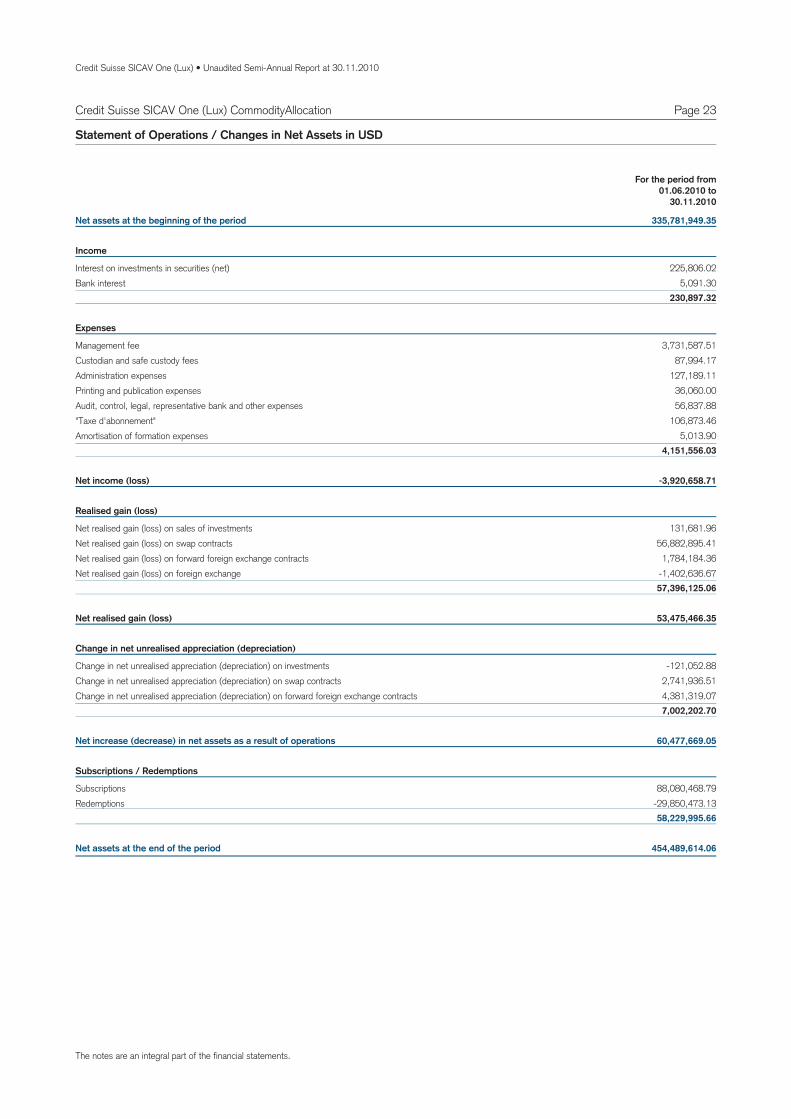
Net assets at the beginning of the period 335,781,949.35
Income
Interest on investments in securities (net) 225,806.02Bank interest 5,091.30
230,897.32
Expenses
Management fee 3,731,587.51Custodian and safe custody fees 87,994.17Administration expenses 127,189.11Printing and publication expenses 36,060.00Audit, control, legal, representative bank and other expenses 56,837.88"Taxe d'abonnement" 106,873.46Amortisation of formation expenses 5,013.90
4,151,556.03
Net income (loss) -3,920,658.71
Realised gain (loss)
Net realised gain (loss) on sales of investments 131,681.96Net realised gain (loss) on swap contracts 56,882,895.41Net realised gain (loss) on forward foreign exchange contracts 1,784,184.36Net realised gain (loss) on foreign exchange -1,402,636.67
57,396,125.06
Net realised gain (loss) 53,475,466.35
Change in net unrealised appreciation (depreciation)
Change in net unrealised appreciation (depreciation) on investments -121,052.88Change in net unrealised appreciation (depreciation) on swap contracts 2,741,936.51Change in net unrealised appreciation (depreciation) on forward foreign exchange contracts 4,381,319.07
7,002,202.70
Net increase (decrease) in net assets as a result of operations 60,477,669.05
Subscriptions / Redemptions
Subscriptions 88,080,468.79Redemptions -29,850,473.13
58,229,995.66
Net assets at the end of the period 454,489,614.06
Statement of Operations / Changes in Net Assets in USD
For the period from01.06.2010 to
30.11.2010
The notes are an integral part of the financial statements.
The notes are an integral part of the financial statements.Any differences in the percentage of Net Assets are the result of roundings.
Credit Suisse SICAV One (Lux) • Unaudited Semi-Annual Report at 30.11.2010
Page 24Credit Suisse SICAV One (Lux) CommodityAllocation
Breakdown by Country and Economic Sector of the Investments in SecuritiesStatement of Investments in Securities and Other Net Assets
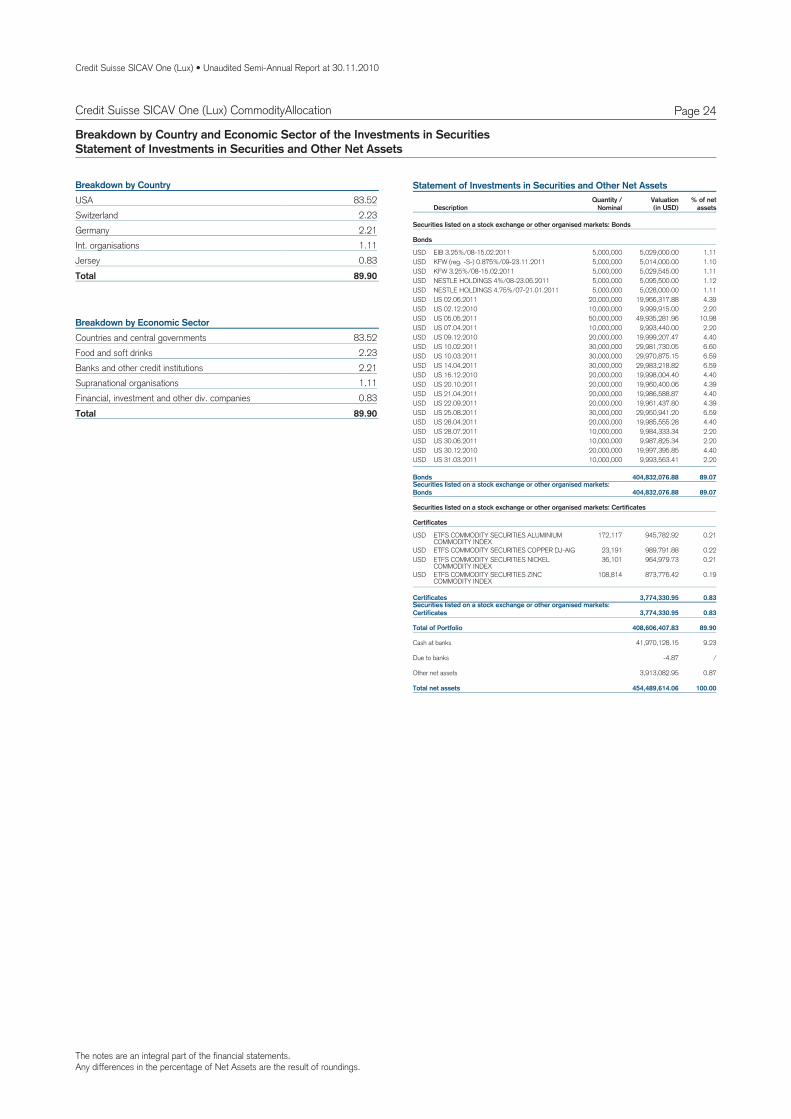
83.52USABreakdown by Country
2.23Switzerland2.21Germany1.11Int. organisations0.83Jersey
89.90Total
83.52Countries and central governmentsBreakdown by Economic Sector
2.23Food and soft drinks2.21Banks and other credit institutions1.11Supranational organisations0.83Financial, investment and other div. companies
89.90Total
Statement of Investments in Securities and Other Net Assets
DescriptionQuantity /
NominalValuation % of net
assets(in USD)
Securities listed on a stock exchange or other organised markets: Bonds
Bonds
USD EIB 3.25%/08-15.02.2011 5,000,000 5,029,000.00 1.11USD KFW (reg. -S-) 0.875%/09-23.11.2011 5,000,000 5,014,000.00 1.10USD KFW 3.25%/08-15.02.2011 5,000,000 5,029,545.00 1.11USD NESTLE HOLDINGS 4%/08-23.06.2011 5,000,000 5,095,500.00 1.12USD NESTLE HOLDINGS 4.75%/07-21.01.2011 5,000,000 5,028,000.00 1.11USD US 02.06.2011 20,000,000 19,966,317.88 4.39USD US 02.12.2010 10,000,000 9,999,915.00 2.20USD US 05.05.2011 50,000,000 49,935,281.96 10.98USD US 07.04.2011 10,000,000 9,993,440.00 2.20USD US 09.12.2010 20,000,000 19,999,207.47 4.40USD US 10.02.2011 30,000,000 29,981,730.05 6.60USD US 10.03.2011 30,000,000 29,970,875.15 6.59USD US 14.04.2011 30,000,000 29,983,218.82 6.59USD US 16.12.2010 20,000,000 19,998,004.40 4.40USD US 20.10.2011 20,000,000 19,960,400.06 4.39USD US 21.04.2011 20,000,000 19,986,588.87 4.40USD US 22.09.2011 20,000,000 19,961,437.80 4.39USD US 25.08.2011 30,000,000 29,950,941.20 6.59USD US 28.04.2011 20,000,000 19,985,555.28 4.40USD US 28.07.2011 10,000,000 9,984,333.34 2.20USD US 30.06.2011 10,000,000 9,987,825.34 2.20USD US 30.12.2010 20,000,000 19,997,395.85 4.40USD US 31.03.2011 10,000,000 9,993,563.41 2.20
Securities listed on a stock exchange or other organised markets:Bonds 404,832,076.88 89.07
Bonds 404,832,076.88 89.07
Securities listed on a stock exchange or other organised markets: Certificates
Certificates
USD ETFS COMMODITY SECURITIES ALUMINIUMCOMMODITY INDEX
172,117 945,782.92 0.21
USD ETFS COMMODITY SECURITIES COPPER DJ-AIG 23,191 989,791.88 0.22USD ETFS COMMODITY SECURITIES NICKEL
COMMODITY INDEX36,101 964,979.73 0.21
USD ETFS COMMODITY SECURITIES ZINCCOMMODITY INDEX
108,814 873,776.42 0.19
Securities listed on a stock exchange or other organised markets:Certificates 3,774,330.95 0.83
Certificates 3,774,330.95 0.83
Total of Portfolio 408,606,407.83 89.90
Cash at banks 41,970,128.15 9.23
Due to banks -4.87 /
Other net assets 3,913,082.95 0.87
Total net assets 454,489,614.06 100.00
Credit Suisse SICAV One (Lux) • Unaudited Semi-Annual Report at 30.11.2010
Page 25Credit Suisse SICAV One (Lux) Defender (Euro)
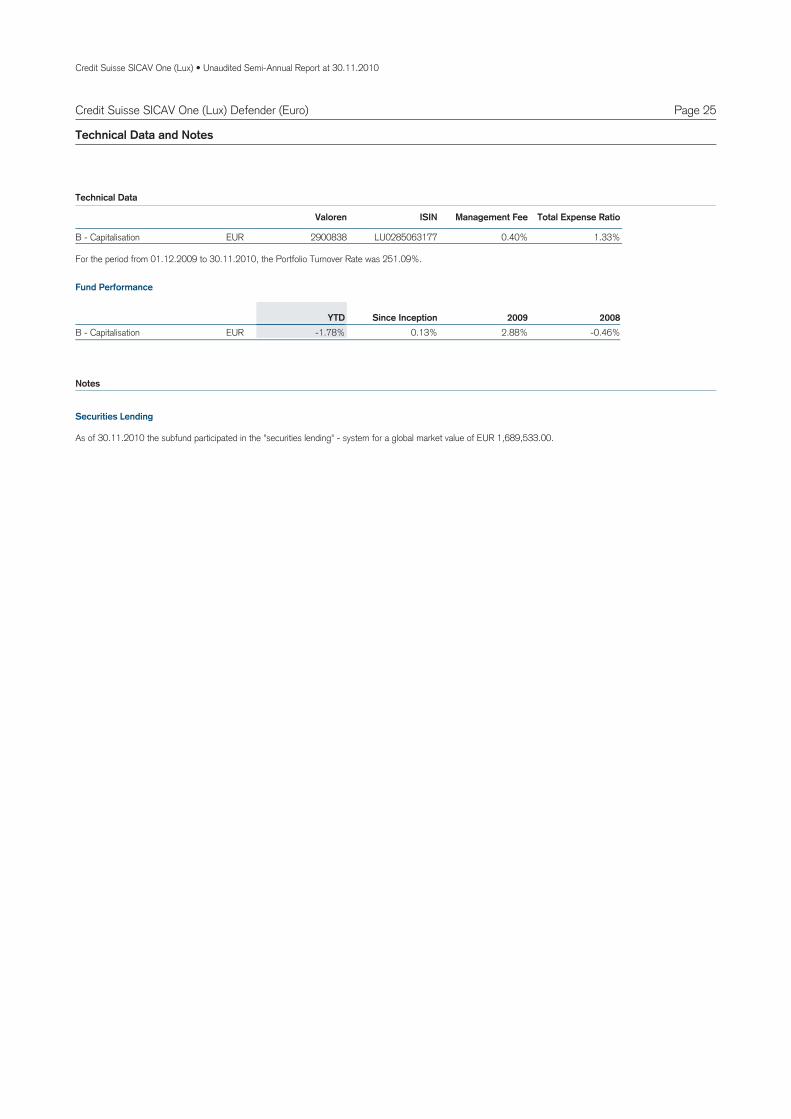
Technical Data and Notes
EURB 2900838 LU0285063177 0.40% 1.33%Capitalisation -
Valoren ISIN Management Fee Total Expense Ratio
Technical Data
EURB -0.46%2.88%0.13%-1.78%Capitalisation - 2008YTD 2009Since Inception
Fund Performance
For the period from 01.12.2009 to 30.11.2010, the Portfolio Turnover Rate was 251.09%.
Notes
As of 30.11.2010 the subfund participated in the "securities lending" - system for a global market value of EUR 1,689,533.00.
Securities Lending

Credit Suisse SICAV One (Lux) • Unaudited Semi-Annual Report at 30.11.2010
Page 26
Assets
Investments in securities at market value 12,570,749.08Cash at banks 17,511.08Income receivable 231,562.09Prepaid expenses 84.83
12,819,907.08
Liabilities
Provisions for accrued expenses 5,729.815,729.81
12,814,177.27Net assets
Statement of Net Assets in EUR and Fund Evolution
30.11.2010
100.13 101.20EURB 99.69Capitalisation -
Total net assets
Net asset value per share
12,814,177.27 18,378,914.22 36,075,751.75EUR
Fund Evolution 30.11.2010 31.05.2010 31.05.2009
127,978.975 25.000B 184,363.812 56,409.837Capitalisation - EUR
Number of shares outstanding at the endof the period
at the beginningof the period
Number of shares issued
Number of shares redeemed
Credit Suisse SICAV One (Lux) Defender (Euro)
The notes are an integral part of the financial statements.

Credit Suisse SICAV One (Lux) • Unaudited Semi-Annual Report at 30.11.2010
Page 27Credit Suisse SICAV One (Lux) Defender (Euro)
Net assets at the beginning of the period 18,378,914.22
Income
Interest on investments in securities (net) 214,610.97Dividends (net) 576.61Bank interest 785.89Other income 1,722.04
217,695.51
Expenses
Management fee 40,485.36Custodian and safe custody fees 3,355.94Administration expenses 5,123.00Printing and publication expenses 2,088.48Audit, control, legal, representative bank and other expenses 2,492.73"Taxe d'abonnement" 3,313.78
56,859.29
Net income (loss) 160,836.22
Realised gain (loss)
Net realised gain (loss) on sales of investments 631,874.74Net realised gain (loss) on forward foreign exchange contracts -7,176.74Net realised gain (loss) on foreign exchange 614.13
625,312.13
Net realised gain (loss) 786,148.35
Change in net unrealised appreciation (depreciation)
Change in net unrealised appreciation (depreciation) on investments -722,714.04Change in net unrealised appreciation (depreciation) on forward foreign exchange contracts 12,491.50
-710,222.54
Net increase (decrease) in net assets as a result of operations 75,925.81
Subscriptions / Redemptions
Subscriptions 2,493.75Redemptions -5,643,156.51
-5,640,662.76
Net assets at the end of the period 12,814,177.27
Statement of Operations / Changes in Net Assets in EUR
For the period from01.06.2010 to
30.11.2010
The notes are an integral part of the financial statements.
The notes are an integral part of the financial statements.Any differences in the percentage of Net Assets are the result of roundings.
Credit Suisse SICAV One (Lux) • Unaudited Semi-Annual Report at 30.11.2010
Page 28Credit Suisse SICAV One (Lux) Defender (Euro)
Breakdown by Country and Economic Sector of the Investments in SecuritiesStatement of Investments in Securities and Other Net Assets
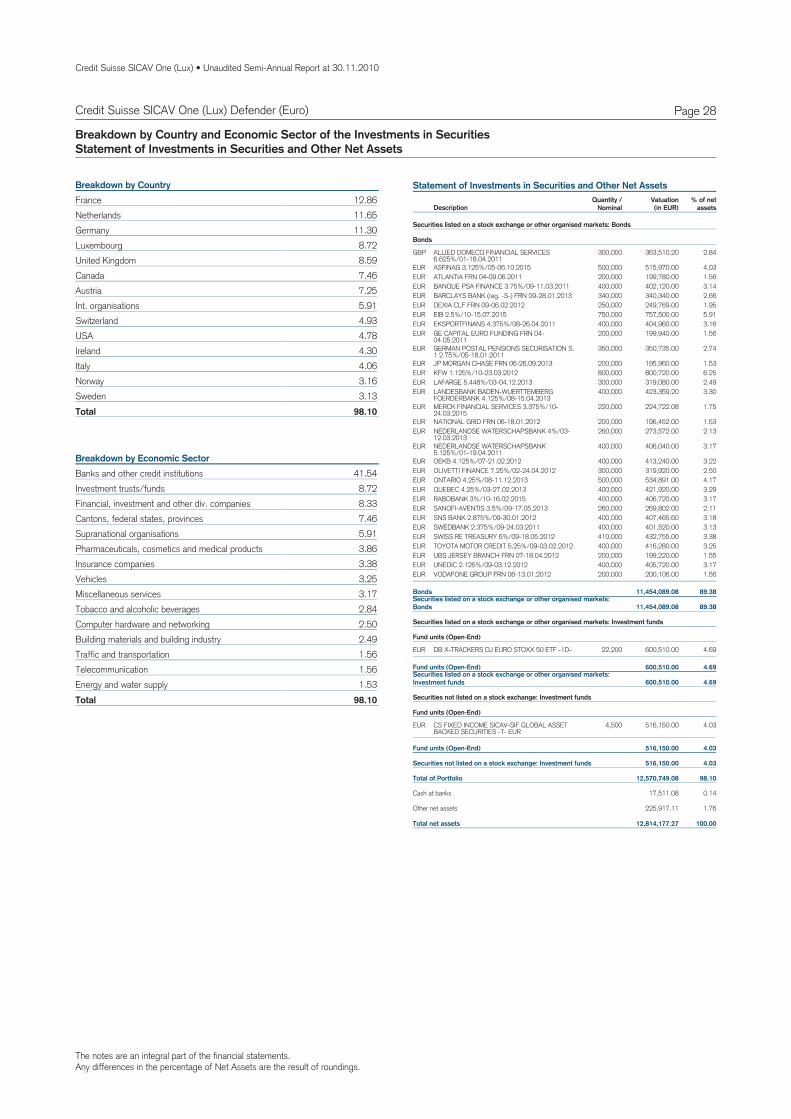
12.86FranceBreakdown by Country
11.65Netherlands11.30Germany8.72Luxembourg8.59United Kingdom7.46Canada7.25Austria5.91Int. organisations4.93Switzerland4.78USA4.30Ireland4.06Italy3.16Norway3.13Sweden
98.10Total
41.54Banks and other credit institutionsBreakdown by Economic Sector
8.72Investment trusts/funds8.33Financial, investment and other div. companies7.46Cantons, federal states, provinces5.91Supranational organisations3.86Pharmaceuticals, cosmetics and medical products3.38Insurance companies3.25Vehicles3.17Miscellaneous services2.84Tobacco and alcoholic beverages2.50Computer hardware and networking2.49Building materials and building industry1.56Traffic and transportation1.56Telecommunication1.53Energy and water supply
98.10Total
Statement of Investments in Securities and Other Net Assets
DescriptionQuantity /
NominalValuation % of net
assets(in EUR)
Securities listed on a stock exchange or other organised markets: Bonds
Bonds
GBP ALLIED DOMECQ FINANCIAL SERVICES6.625%/01-18.04.2011
300,000 363,510.20 2.84
EUR ASFINAG 3.125%/05-06.10.2015 500,000 515,970.00 4.03EUR ATLANTIA FRN 04-09.06.2011 200,000 199,780.00 1.56EUR BANQUE PSA FINANCE 3.75%/09-11.03.2011 400,000 402,120.00 3.14EUR BARCLAYS BANK (reg. -S-) FRN 09-28.01.2013 340,000 340,340.00 2.66EUR DEXIA CLF FRN 09-06.02.2012 250,000 249,769.00 1.95EUR EIB 2.5%/10-15.07.2015 750,000 757,500.00 5.91EUR EKSPORTFINANS 4.375%/08-26.04.2011 400,000 404,960.00 3.16EUR GE CAPITAL EURO FUNDING FRN 04-
04.05.2011200,000 199,940.00 1.56
EUR GERMAN POSTAL PENSIONS SECURISATION S.1 2.75%/05-18.01.2011
350,000 350,735.00 2.74
EUR JP MORGAN CHASE FRN 06-26.09.2013 200,000 195,960.00 1.53EUR KFW 1.125%/10-23.03.2012 800,000 800,720.00 6.25EUR LAFARGE 5.448%/03-04.12.2013 300,000 319,080.00 2.49EUR LANDESBANK BADEN-WUERTTEMBERG
FOERDERBANK 4.125%/08-15.04.2013400,000 423,359.20 3.30
EUR MERCK FINANCIAL SERVICES 3.375%/10-24.03.2015
220,000 224,722.08 1.75
EUR NATIONAL GRID FRN 06-18.01.2012 200,000 196,452.00 1.53EUR NEDERLANDSE WATERSCHAPSBANK 4%/03-
12.03.2013260,000 273,572.00 2.13
EUR NEDERLANDSE WATERSCHAPSBANK5.125%/01-19.04.2011
400,000 406,040.00 3.17
EUR OEKB 4.125%/07-21.02.2012 400,000 413,240.00 3.22EUR OLIVETTI FINANCE 7.25%/02-24.04.2012 300,000 319,920.00 2.50EUR ONTARIO 4.25%/08-11.12.2013 500,000 534,891.00 4.17EUR QUEBEC 4.25%/03-27.02.2013 400,000 421,920.00 3.29EUR RABOBANK 3%/10-16.02.2015 400,000 406,720.00 3.17EUR SANOFI-AVENTIS 3.5%/09-17.05.2013 260,000 269,802.00 2.11EUR SNS BANK 2.875%/09-30.01.2012 400,000 407,465.60 3.18EUR SWEDBANK 2.375%/09-24.03.2011 400,000 401,520.00 3.13EUR SWISS RE TREASURY 6%/09-18.05.2012 410,000 432,755.00 3.38EUR TOYOTA MOTOR CREDIT 5.25%/09-03.02.2012 400,000 416,280.00 3.25EUR UBS JERSEY BRANCH FRN 07-18.04.2012 200,000 199,220.00 1.55EUR UNEDIC 2.125%/09-03.12.2012 400,000 405,720.00 3.17EUR VODAFONE GROUP FRN 06-13.01.2012 200,000 200,106.00 1.56
Securities listed on a stock exchange or other organised markets:Bonds 11,454,089.08 89.38
Bonds 11,454,089.08 89.38
Securities listed on a stock exchange or other organised markets: Investment funds
Fund units (Open-End)
EUR DB X-TRACKERS DJ EURO STOXX 50 ETF -1D- 22,200 600,510.00 4.69
Securities listed on a stock exchange or other organised markets:Investment funds 600,510.00 4.69
Fund units (Open-End) 600,510.00 4.69
Securities not listed on a stock exchange: Investment funds
Fund units (Open-End)
EUR CS FIXED INCOME SICAV-SIF GLOBAL ASSETBACKED SECURITIES -T- EUR
4,500 516,150.00 4.03
Securities not listed on a stock exchange: Investment funds 516,150.00 4.03
Fund units (Open-End) 516,150.00 4.03
Total of Portfolio 12,570,749.08 98.10
Cash at banks 17,511.08 0.14
Other net assets 225,917.11 1.76
Total net assets 12,814,177.27 100.00
Credit Suisse SICAV One (Lux) • Unaudited Semi-Annual Report at 30.11.2010
Page 29Credit Suisse SICAV One (Lux) Defender (Sfr)
Technical Data and Notes
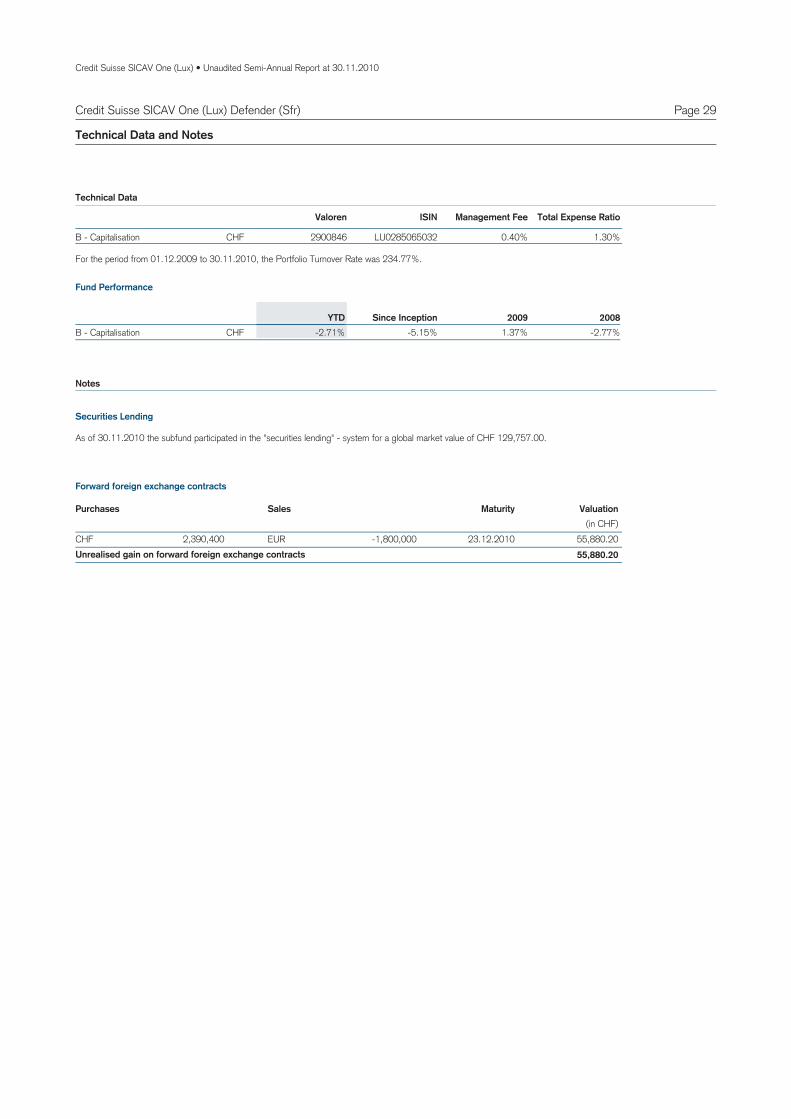
CHFB 2900846 LU0285065032 0.40% 1.30%Capitalisation -
Valoren ISIN Management Fee Total Expense Ratio
Technical Data
CHFB -2.77%1.37%-5.15%-2.71%Capitalisation - 2008YTD 2009Since Inception
Fund Performance
For the period from 01.12.2009 to 30.11.2010, the Portfolio Turnover Rate was 234.77%.
Notes
As of 30.11.2010 the subfund participated in the "securities lending" - system for a global market value of CHF 129,757.00.
Securities Lending
2,390,400CHF EUR -1,800,000 55,880.2023.12.201055,880.20Unrealised gain on forward foreign exchange contracts
SalesPurchases Valuation(in CHF)
Maturity
Forward foreign exchange contracts
Credit Suisse SICAV One (Lux) • Unaudited Semi-Annual Report at 30.11.2010
Page 30
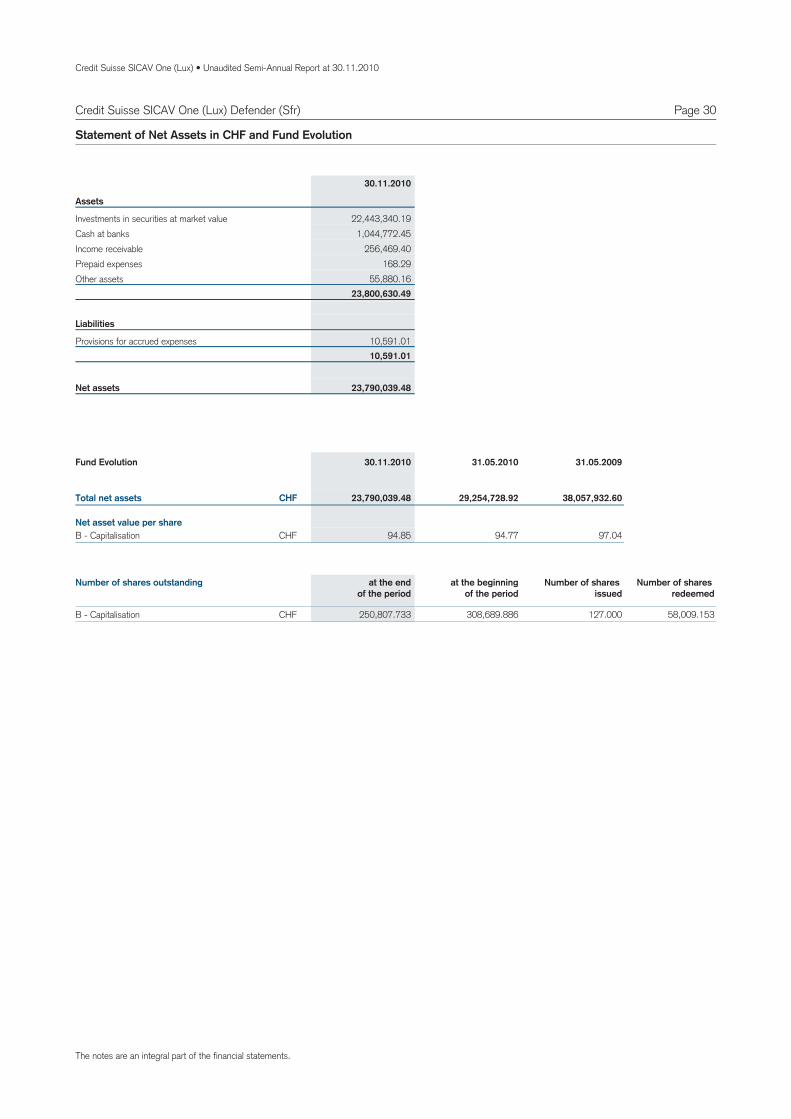
Assets
Investments in securities at market value 22,443,340.19Cash at banks 1,044,772.45Income receivable 256,469.40Prepaid expenses 168.29Other assets 55,880.16
23,800,630.49
Liabilities
Provisions for accrued expenses 10,591.0110,591.01
23,790,039.48Net assets
Statement of Net Assets in CHF and Fund Evolution
30.11.2010
94.85 97.04CHFB 94.77Capitalisation -
Total net assets
Net asset value per share
23,790,039.48 29,254,728.92 38,057,932.60CHF
Fund Evolution 30.11.2010 31.05.2010 31.05.2009
250,807.733 127.000B 308,689.886 58,009.153Capitalisation - CHF
Number of shares outstanding at the endof the period
at the beginningof the period
Number of shares issued
Number of shares redeemed
Credit Suisse SICAV One (Lux) Defender (Sfr)
The notes are an integral part of the financial statements.
Credit Suisse SICAV One (Lux) • Unaudited Semi-Annual Report at 30.11.2010
Page 31Credit Suisse SICAV One (Lux) Defender (Sfr)
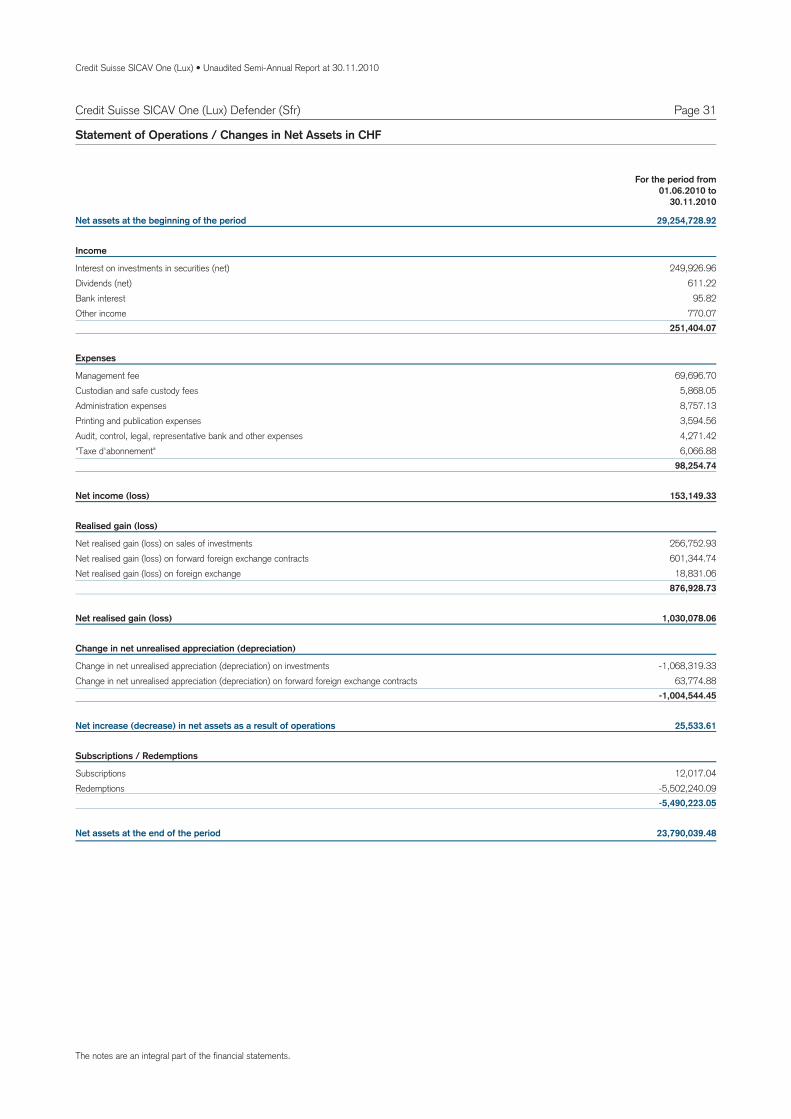
Net assets at the beginning of the period 29,254,728.92
Income
Interest on investments in securities (net) 249,926.96Dividends (net) 611.22Bank interest 95.82Other income 770.07
251,404.07
Expenses
Management fee 69,696.70Custodian and safe custody fees 5,868.05Administration expenses 8,757.13Printing and publication expenses 3,594.56Audit, control, legal, representative bank and other expenses 4,271.42"Taxe d'abonnement" 6,066.88
98,254.74
Net income (loss) 153,149.33
Realised gain (loss)
Net realised gain (loss) on sales of investments 256,752.93Net realised gain (loss) on forward foreign exchange contracts 601,344.74Net realised gain (loss) on foreign exchange 18,831.06
876,928.73
Net realised gain (loss) 1,030,078.06
Change in net unrealised appreciation (depreciation)
Change in net unrealised appreciation (depreciation) on investments -1,068,319.33Change in net unrealised appreciation (depreciation) on forward foreign exchange contracts 63,774.88
-1,004,544.45
Net increase (decrease) in net assets as a result of operations 25,533.61
Subscriptions / Redemptions
Subscriptions 12,017.04Redemptions -5,502,240.09
-5,490,223.05
Net assets at the end of the period 23,790,039.48
Statement of Operations / Changes in Net Assets in CHF
For the period from01.06.2010 to
30.11.2010
The notes are an integral part of the financial statements.
The notes are an integral part of the financial statements.Any differences in the percentage of Net Assets are the result of roundings.
Credit Suisse SICAV One (Lux) • Unaudited Semi-Annual Report at 30.11.2010
Page 32Credit Suisse SICAV One (Lux) Defender (Sfr)
Breakdown by Country and Economic Sector of the Investments in SecuritiesStatement of Investments in Securities and Other Net Assets
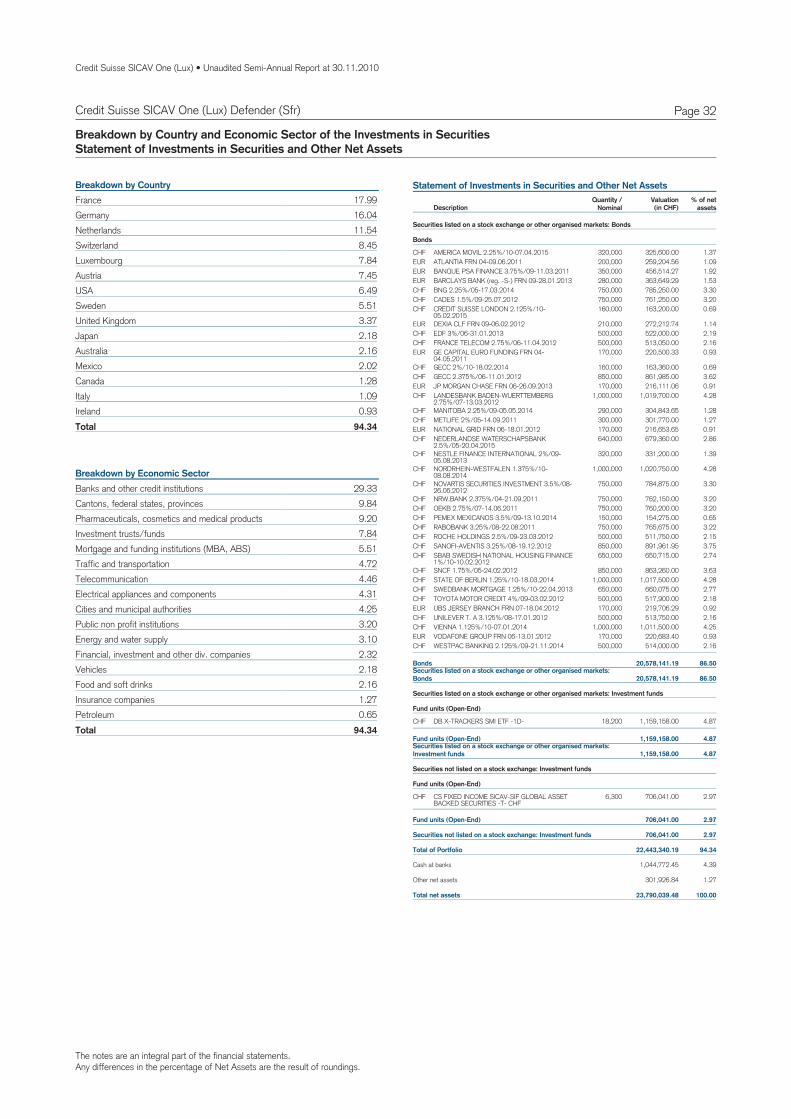
17.99FranceBreakdown by Country
16.04Germany11.54Netherlands8.45Switzerland7.84Luxembourg7.45Austria6.49USA5.51Sweden3.37United Kingdom2.18Japan2.16Australia2.02Mexico1.28Canada1.09Italy0.93Ireland
94.34Total
29.33Banks and other credit institutionsBreakdown by Economic Sector
9.84Cantons, federal states, provinces9.20Pharmaceuticals, cosmetics and medical products7.84Investment trusts/funds5.51Mortgage and funding institutions (MBA, ABS)4.72Traffic and transportation4.46Telecommunication4.31Electrical appliances and components4.25Cities and municipal authorities3.20Public non profit institutions3.10Energy and water supply2.32Financial, investment and other div. companies2.18Vehicles2.16Food and soft drinks1.27Insurance companies0.65Petroleum
94.34Total
Statement of Investments in Securities and Other Net Assets
DescriptionQuantity /
NominalValuation % of net
assets(in CHF)
Securities listed on a stock exchange or other organised markets: Bonds
Bonds
CHF AMERICA MOVIL 2.25%/10-07.04.2015 320,000 325,600.00 1.37EUR ATLANTIA FRN 04-09.06.2011 200,000 259,204.56 1.09EUR BANQUE PSA FINANCE 3.75%/09-11.03.2011 350,000 456,514.27 1.92EUR BARCLAYS BANK (reg. -S-) FRN 09-28.01.2013 280,000 363,649.29 1.53CHF BNG 2.25%/05-17.03.2014 750,000 785,250.00 3.30CHF CADES 1.5%/09-25.07.2012 750,000 761,250.00 3.20CHF CREDIT SUISSE LONDON 2.125%/10-
05.02.2015160,000 163,200.00 0.69
EUR DEXIA CLF FRN 09-06.02.2012 210,000 272,212.74 1.14CHF EDF 3%/06-31.01.2013 500,000 522,000.00 2.19CHF FRANCE TELECOM 2.75%/06-11.04.2012 500,000 513,050.00 2.16EUR GE CAPITAL EURO FUNDING FRN 04-
04.05.2011170,000 220,500.33 0.93
CHF GECC 2%/10-18.02.2014 160,000 163,360.00 0.69CHF GECC 2.375%/06-11.01.2012 850,000 861,985.00 3.62EUR JP MORGAN CHASE FRN 06-26.09.2013 170,000 216,111.06 0.91CHF LANDESBANK BADEN-WUERTTEMBERG
2.75%/07-13.03.20121,000,000 1,019,700.00 4.28
CHF MANITOBA 2.25%/09-05.05.2014 290,000 304,843.65 1.28CHF METLIFE 2%/05-14.09.2011 300,000 301,770.00 1.27EUR NATIONAL GRID FRN 06-18.01.2012 170,000 216,653.65 0.91CHF NEDERLANDSE WATERSCHAPSBANK
2.5%/05-20.04.2015640,000 679,360.00 2.86
CHF NESTLE FINANCE INTERNATIONAL 2%/09-05.08.2013
320,000 331,200.00 1.39
CHF NORDRHEIN-WESTFALEN 1.375%/10-08.08.2014
1,000,000 1,020,750.00 4.28
CHF NOVARTIS SECURITIES INVESTMENT 3.5%/08-26.06.2012
750,000 784,875.00 3.30
CHF NRW.BANK 2.375%/04-21.09.2011 750,000 762,150.00 3.20CHF OEKB 2.75%/07-14.06.2011 750,000 760,200.00 3.20CHF PEMEX MEXICANOS 3.5%/09-13.10.2014 150,000 154,275.00 0.65CHF RABOBANK 3.25%/08-22.08.2011 750,000 765,675.00 3.22CHF ROCHE HOLDINGS 2.5%/09-23.03.2012 500,000 511,750.00 2.15CHF SANOFI-AVENTIS 3.25%/08-19.12.2012 850,000 891,961.95 3.75CHF SBAB SWEDISH NATIONAL HOUSING FINANCE
1%/10-10.02.2012650,000 650,715.00 2.74
CHF SNCF 1.75%/05-24.02.2012 850,000 863,260.00 3.63CHF STATE OF BERLIN 1.25%/10-18.03.2014 1,000,000 1,017,500.00 4.28CHF SWEDBANK MORTGAGE 1.25%/10-22.04.2013 650,000 660,075.00 2.77CHF TOYOTA MOTOR CREDIT 4%/09-03.02.2012 500,000 517,900.00 2.18EUR UBS JERSEY BRANCH FRN 07-18.04.2012 170,000 219,706.29 0.92CHF UNILEVER T. A 3.125%/08-17.01.2012 500,000 513,750.00 2.16CHF VIENNA 1.125%/10-07.01.2014 1,000,000 1,011,500.00 4.25EUR VODAFONE GROUP FRN 06-13.01.2012 170,000 220,683.40 0.93CHF WESTPAC BANKING 2.125%/09-21.11.2014 500,000 514,000.00 2.16
Securities listed on a stock exchange or other organised markets:Bonds 20,578,141.19 86.50
Bonds 20,578,141.19 86.50
Securities listed on a stock exchange or other organised markets: Investment funds
Fund units (Open-End)
CHF DB X-TRACKERS SMI ETF -1D- 18,200 1,159,158.00 4.87
Securities listed on a stock exchange or other organised markets:Investment funds 1,159,158.00 4.87
Fund units (Open-End) 1,159,158.00 4.87
Securities not listed on a stock exchange: Investment funds
Fund units (Open-End)
CHF CS FIXED INCOME SICAV-SIF GLOBAL ASSETBACKED SECURITIES -T- CHF
6,300 706,041.00 2.97
Securities not listed on a stock exchange: Investment funds 706,041.00 2.97
Fund units (Open-End) 706,041.00 2.97
Total of Portfolio 22,443,340.19 94.34
Cash at banks 1,044,772.45 4.39
Other net assets 301,926.84 1.27
Total net assets 23,790,039.48 100.00
Credit Suisse SICAV One (Lux) • Unaudited Semi-Annual Report at 30.11.2010
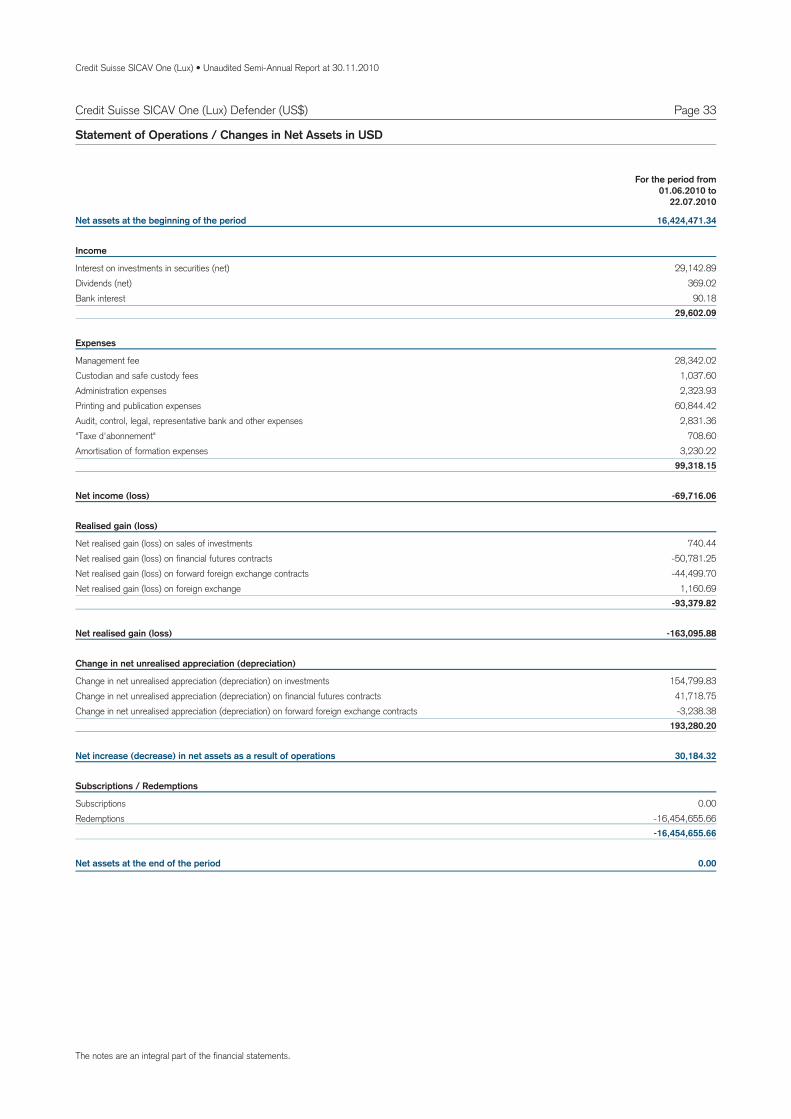
Page 33Credit Suisse SICAV One (Lux) Defender (US$)
Net assets at the beginning of the period 16,424,471.34
Income
Interest on investments in securities (net) 29,142.89Dividends (net) 369.02Bank interest 90.18
29,602.09
Expenses
Management fee 28,342.02Custodian and safe custody fees 1,037.60Administration expenses 2,323.93Printing and publication expenses 60,844.42Audit, control, legal, representative bank and other expenses 2,831.36"Taxe d'abonnement" 708.60Amortisation of formation expenses 3,230.22
99,318.15
Net income (loss) -69,716.06
Realised gain (loss)
Net realised gain (loss) on sales of investments 740.44Net realised gain (loss) on financial futures contracts -50,781.25Net realised gain (loss) on forward foreign exchange contracts -44,499.70Net realised gain (loss) on foreign exchange 1,160.69
-93,379.82
Net realised gain (loss) -163,095.88
Change in net unrealised appreciation (depreciation)
Change in net unrealised appreciation (depreciation) on investments 154,799.83Change in net unrealised appreciation (depreciation) on financial futures contracts 41,718.75Change in net unrealised appreciation (depreciation) on forward foreign exchange contracts -3,238.38
193,280.20
Net increase (decrease) in net assets as a result of operations 30,184.32
Subscriptions / Redemptions
Subscriptions 0.00Redemptions -16,454,655.66
-16,454,655.66
Net assets at the end of the period 0.00
Statement of Operations / Changes in Net Assets in USD
For the period from01.06.2010 to
22.07.2010
The notes are an integral part of the financial statements.
Credit Suisse SICAV One (Lux) • Unaudited Semi-Annual Report at 30.11.2010
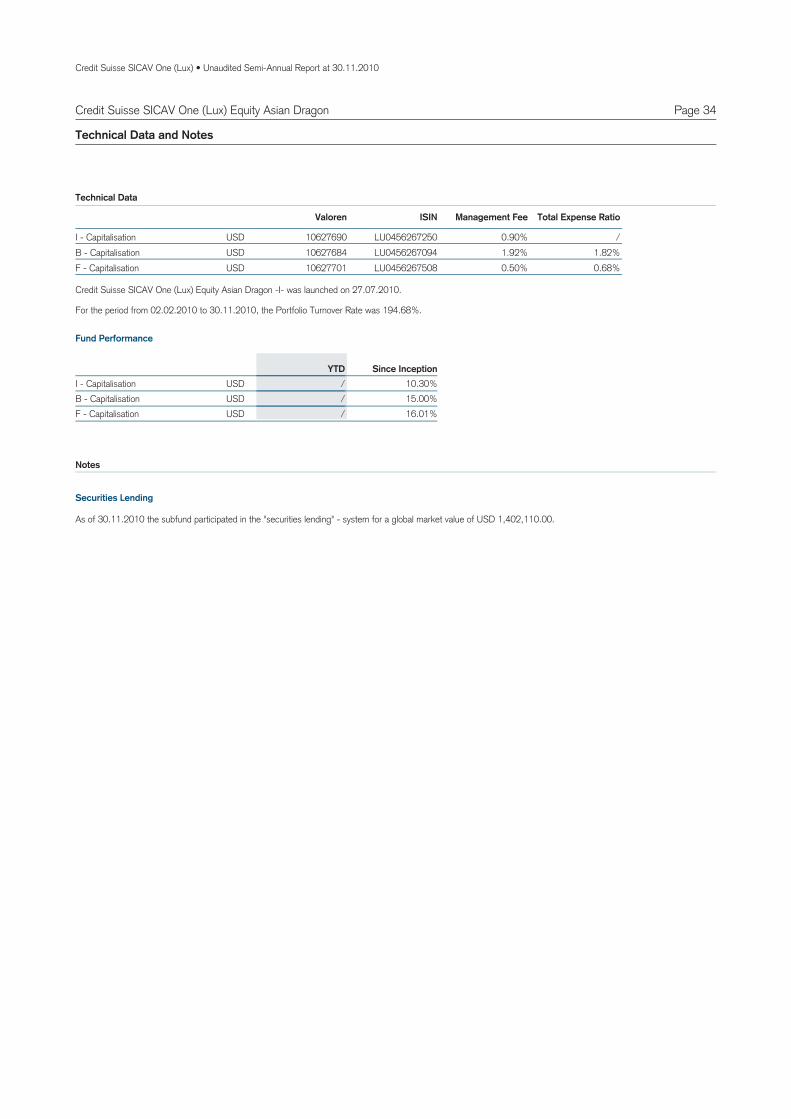
Page 34Credit Suisse SICAV One (Lux) Equity Asian Dragon
Technical Data and Notes
USDI 10627690 LU0456267250 0.90% /Capitalisation -
Valoren ISIN Management Fee Total Expense Ratio
USDB 10627684 LU0456267094 1.92% 1.82%Capitalisation - USDF 10627701 LU0456267508 0.50% 0.68%Capitalisation -
Technical Data
USDI 10.30%/Capitalisation - YTD Since Inception
USDB 15.00%/Capitalisation - USDF 16.01%/Capitalisation -
Fund Performance
For the period from 02.02.2010 to 30.11.2010, the Portfolio Turnover Rate was 194.68%.
Notes
Credit Suisse SICAV One (Lux) Equity Asian Dragon -I- was launched on 27.07.2010.
As of 30.11.2010 the subfund participated in the "securities lending" - system for a global market value of USD 1,402,110.00.
Securities Lending

Credit Suisse SICAV One (Lux) • Unaudited Semi-Annual Report at 30.11.2010
Page 35
Assets
Investments in securities at market value 91,878,047.34Cash at banks 2,470,691.21Income receivable 21,275.37Prepaid expenses 585.81Formation expenses 49,204.03
94,419,803.76
Liabilities
Payable for securities purchased 72,804.25Provisions for accrued expenses 159,263.38
232,067.63
94,187,736.13Net assets
Statement of Net Assets in USD and Fund Evolution
30.11.2010
1,103.00USDI /Capitalisation -
11.50USDB 9.85Capitalisation -
1,160.07USDF 986.59Capitalisation -
Total net assets
Net asset value per share
94,187,736.13 14,047,354.77USD
Fund Evolution 30.11.2010 31.05.2010
55,373.775 57,961.615I 0.000 2,587.840Capitalisation - USD
1,346,182.523 1,402,357.749B 947,454.235 1,003,629.461Capitalisation - USD
15,192.772 13,213.677F 4,776.649 2,797.554Capitalisation - USD
Number of shares outstanding at the endof the period
at the beginningof the period
Number of shares issued
Number of shares redeemed
Credit Suisse SICAV One (Lux) Equity Asian Dragon
The notes are an integral part of the financial statements.
Credit Suisse SICAV One (Lux) • Unaudited Semi-Annual Report at 30.11.2010
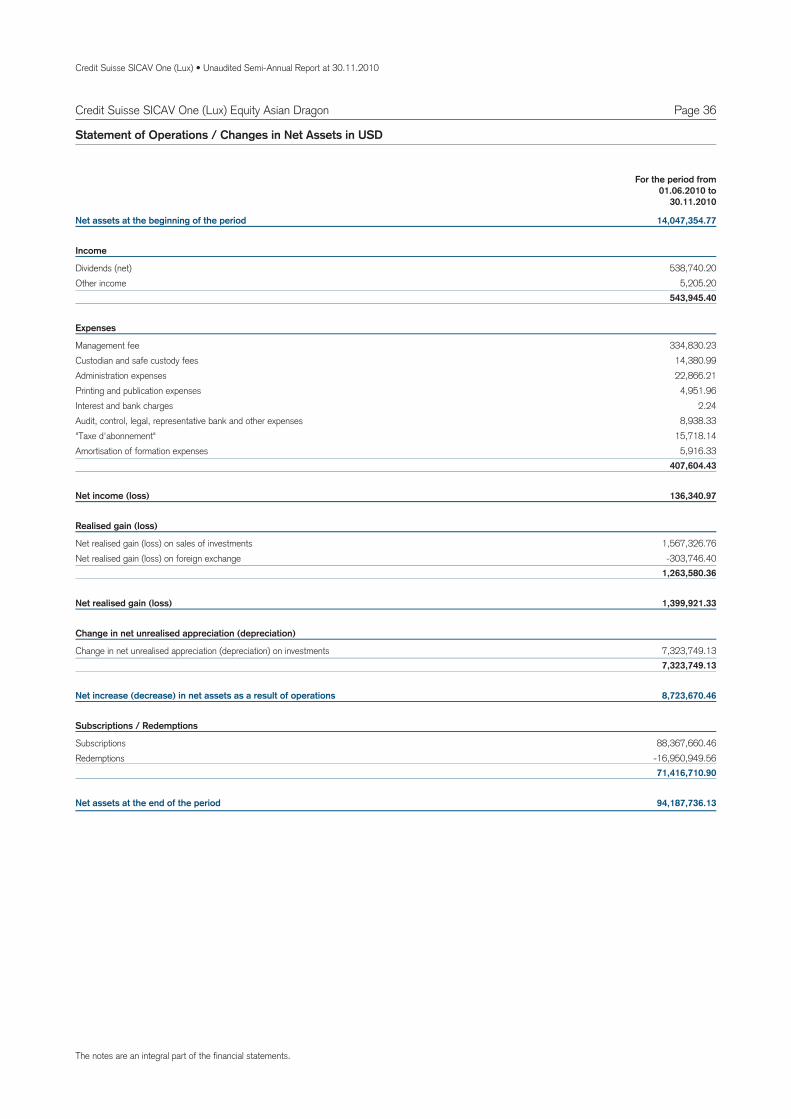
Page 36Credit Suisse SICAV One (Lux) Equity Asian Dragon
Net assets at the beginning of the period 14,047,354.77
Income
Dividends (net) 538,740.20Other income 5,205.20
543,945.40
Expenses
Management fee 334,830.23Custodian and safe custody fees 14,380.99Administration expenses 22,866.21Printing and publication expenses 4,951.96Interest and bank charges 2.24Audit, control, legal, representative bank and other expenses 8,938.33"Taxe d'abonnement" 15,718.14Amortisation of formation expenses 5,916.33
407,604.43
Net income (loss) 136,340.97
Realised gain (loss)
Net realised gain (loss) on sales of investments 1,567,326.76Net realised gain (loss) on foreign exchange -303,746.40
1,263,580.36
Net realised gain (loss) 1,399,921.33
Change in net unrealised appreciation (depreciation)
Change in net unrealised appreciation (depreciation) on investments 7,323,749.137,323,749.13
Net increase (decrease) in net assets as a result of operations 8,723,670.46
Subscriptions / Redemptions
Subscriptions 88,367,660.46Redemptions -16,950,949.56
71,416,710.90
Net assets at the end of the period 94,187,736.13
Statement of Operations / Changes in Net Assets in USD
For the period from01.06.2010 to
30.11.2010
The notes are an integral part of the financial statements.
The notes are an integral part of the financial statements.Any differences in the percentage of Net Assets are the result of roundings.
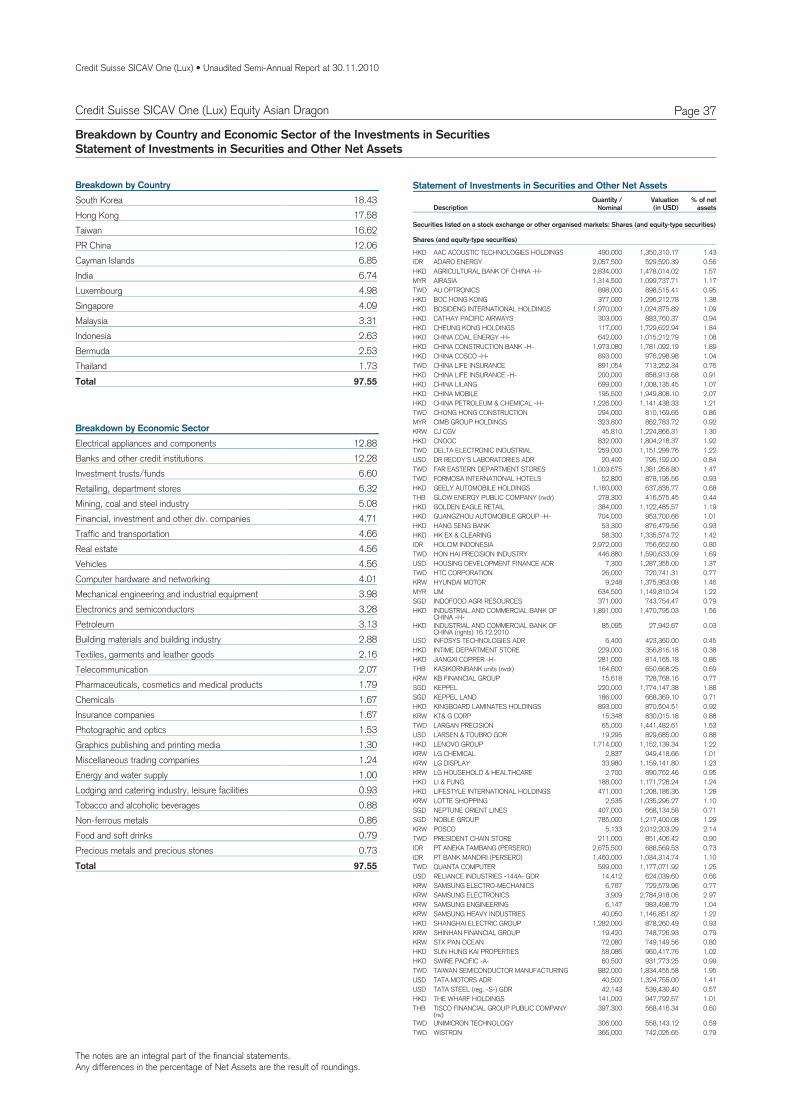
Credit Suisse SICAV One (Lux) • Unaudited Semi-Annual Report at 30.11.2010
Page 37Credit Suisse SICAV One (Lux) Equity Asian Dragon
Breakdown by Country and Economic Sector of the Investments in SecuritiesStatement of Investments in Securities and Other Net Assets
18.43South KoreaBreakdown by Country
17.58Hong Kong16.62Taiwan12.06PR China6.85Cayman Islands6.74India4.98Luxembourg4.09Singapore3.31Malaysia2.63Indonesia2.53Bermuda1.73Thailand
97.55Total
12.88Electrical appliances and componentsBreakdown by Economic Sector
12.28Banks and other credit institutions6.60Investment trusts/funds6.32Retailing, department stores5.08Mining, coal and steel industry4.71Financial, investment and other div. companies4.66Traffic and transportation4.56Real estate4.56Vehicles4.01Computer hardware and networking3.98Mechanical engineering and industrial equipment3.28Electronics and semiconductors3.13Petroleum2.88Building materials and building industry2.16Textiles, garments and leather goods2.07Telecommunication1.79Pharmaceuticals, cosmetics and medical products1.67Chemicals1.67Insurance companies1.53Photographic and optics1.30Graphics publishing and printing media1.24Miscellaneous trading companies1.00Energy and water supply0.93Lodging and catering industry, leisure facilities0.88Tobacco and alcoholic beverages0.86Non-ferrous metals0.79Food and soft drinks0.73Precious metals and precious stones
97.55Total
Statement of Investments in Securities and Other Net Assets
DescriptionQuantity /
NominalValuation % of net
assets(in USD)
Securities listed on a stock exchange or other organised markets: Shares (and equity-type securities)
Shares (and equity-type securities)
HKD AAC ACOUSTIC TECHNOLOGIES HOLDINGS 490,000 1,350,310.17 1.43IDR ADARO ENERGY 2,057,500 529,520.39 0.56HKD AGRICULTURAL BANK OF CHINA -H- 2,834,000 1,478,014.02 1.57MYR AIRASIA 1,314,500 1,099,737.71 1.17TWD AU OPTRONICS 898,000 898,515.41 0.95HKD BOC HONG KONG 377,000 1,296,212.78 1.38HKD BOSIDENG INTERNATIONAL HOLDINGS 1,970,000 1,024,875.89 1.09HKD CATHAY PACIFIC AIRWAYS 303,000 883,760.37 0.94HKD CHEUNG KONG HOLDINGS 117,000 1,729,622.94 1.84HKD CHINA COAL ENERGY -H- 642,000 1,015,212.79 1.08HKD CHINA CONSTRUCTION BANK -H- 1,973,080 1,781,092.19 1.89HKD CHINA COSCO -H- 893,000 976,298.98 1.04TWD CHINA LIFE INSURANCE 891,054 713,252.34 0.76HKD CHINA LIFE INSURANCE -H- 200,000 858,913.68 0.91HKD CHINA LILANG 699,000 1,008,135.45 1.07HKD CHINA MOBILE 195,500 1,949,808.10 2.07HKD CHINA PETROLEUM & CHEMICAL -H- 1,226,000 1,141,438.33 1.21TWD CHONG HONG CONSTRUCTION 294,000 810,169.65 0.86MYR CIMB GROUP HOLDINGS 323,800 862,783.72 0.92KRW CJ CGV 45,810 1,224,866.31 1.30HKD CNOOC 832,000 1,804,218.37 1.92TWD DELTA ELECTRONIC INDUSTRIAL 259,000 1,151,299.76 1.22USD DR REDDY'S LABORATORIES ADR 20,400 795,192.00 0.84TWD FAR EASTERN DEPARTMENT STORES 1,003,675 1,381,256.80 1.47TWD FORMOSA INTERNATIONAL HOTELS 52,800 878,195.56 0.93HKD GEELY AUTOMOBILE HOLDINGS 1,160,000 637,836.77 0.68THB GLOW ENERGY PUBLIC COMPANY (nvdr) 278,300 416,575.45 0.44HKD GOLDEN EAGLE RETAIL 384,000 1,122,485.57 1.19HKD GUANGZHOU AUTOMOBILE GROUP -H- 704,000 953,700.66 1.01HKD HANG SENG BANK 53,300 876,479.56 0.93HKD HK EX & CLEARING 58,300 1,335,574.72 1.42IDR HOLCIM INDONESIA 2,972,000 756,652.60 0.80TWD HON HAI PRECISION INDUSTRY 446,880 1,590,633.09 1.69USD HOUSING DEVELOPMENT FINANCE ADR 7,300 1,287,355.00 1.37TWD HTC CORPORATION 26,000 720,741.31 0.77KRW HYUNDAI MOTOR 9,248 1,375,953.08 1.46MYR IJM 634,500 1,149,810.24 1.22SGD INDOFOOD AGRI RESOURCES 371,000 743,754.47 0.79HKD INDUSTRIAL AND COMMERCIAL BANK OF
CHINA -H-1,891,000 1,470,795.03 1.56
HKD INDUSTRIAL AND COMMERCIAL BANK OFCHINA (rights) 16.12.2010
85,095 27,942.67 0.03
USD INFOSYS TECHNOLOGIES ADR 6,400 423,360.00 0.45HKD INTIME DEPARTMENT STORE 229,000 356,816.18 0.38HKD JIANGXI COPPER -H- 281,000 814,165.18 0.86THB KASIKORNBANK units (nvdr) 164,600 650,668.25 0.69KRW KB FINANCIAL GROUP 15,618 728,768.16 0.77SGD KEPPEL 220,000 1,774,147.38 1.88SGD KEPPEL LAND 186,000 668,369.10 0.71HKD KINGBOARD LAMINATES HOLDINGS 893,000 870,504.51 0.92KRW KT& G CORP 15,348 830,015.18 0.88TWD LARGAN PRECISION 65,000 1,441,482.61 1.53USD LARSEN & TOUBRO GDR 19,295 829,685.00 0.88HKD LENOVO GROUP 1,714,000 1,152,139.34 1.22KRW LG CHEMICAL 2,837 949,418.66 1.01KRW LG DISPLAY 33,980 1,159,141.80 1.23KRW LG HOUSEHOLD & HEALTHCARE 2,700 890,762.46 0.95HKD LI & FUNG 188,000 1,171,728.24 1.24HKD LIFESTYLE INTERNATIONAL HOLDINGS 471,000 1,208,186.36 1.28KRW LOTTE SHOPPING 2,535 1,035,296.27 1.10SGD NEPTUNE ORIENT LINES 407,000 668,134.58 0.71SGD NOBLE GROUP 785,000 1,217,400.08 1.29KRW POSCO 5,133 2,012,203.29 2.14TWD PRESIDENT CHAIN STORE 211,000 851,406.42 0.90IDR PT ANEKA TAMBANG (PERSERO) 2,675,500 688,569.53 0.73IDR PT BANK MANDIRI (PERSERO) 1,460,000 1,034,314.74 1.10TWD QUANTA COMPUTER 599,000 1,177,071.92 1.25USD RELIANCE INDUSTRIES -144A- GDR 14,412 624,039.60 0.66KRW SAMSUNG ELECTRO-MECHANICS 6,767 729,579.96 0.77KRW SAMSUNG ELECTRONICS 3,909 2,784,918.06 2.97KRW SAMSUNG ENGINEERING 6,147 983,498.79 1.04KRW SAMSUNG HEAVY INDUSTRIES 40,050 1,146,851.82 1.22HKD SHANGHAI ELECTRIC GROUP 1,282,000 878,260.49 0.93KRW SHINHAN FINANCIAL GROUP 19,420 748,726.93 0.79KRW STX PAN OCEAN 72,080 749,149.56 0.80HKD SUN HUNG KAI PROPERTIES 58,086 960,417.76 1.02HKD SWIRE PACIFIC -A- 60,500 931,773.25 0.99TWD TAIWAN SEMICONDUCTOR MANUFACTURING 882,000 1,834,455.58 1.95USD TATA MOTORS ADR 40,500 1,324,755.00 1.41USD TATA STEEL (reg. -S-) GDR 42,143 539,430.40 0.57HKD THE WHARF HOLDINGS 141,000 947,792.57 1.01THB TISCO FINANCIAL GROUP PUBLIC COMPANY
(nv)397,300 568,416.34 0.60
TWD UNIMICRON TECHNOLOGY 306,000 558,143.12 0.59TWD WISTRON 366,000 742,025.65 0.79
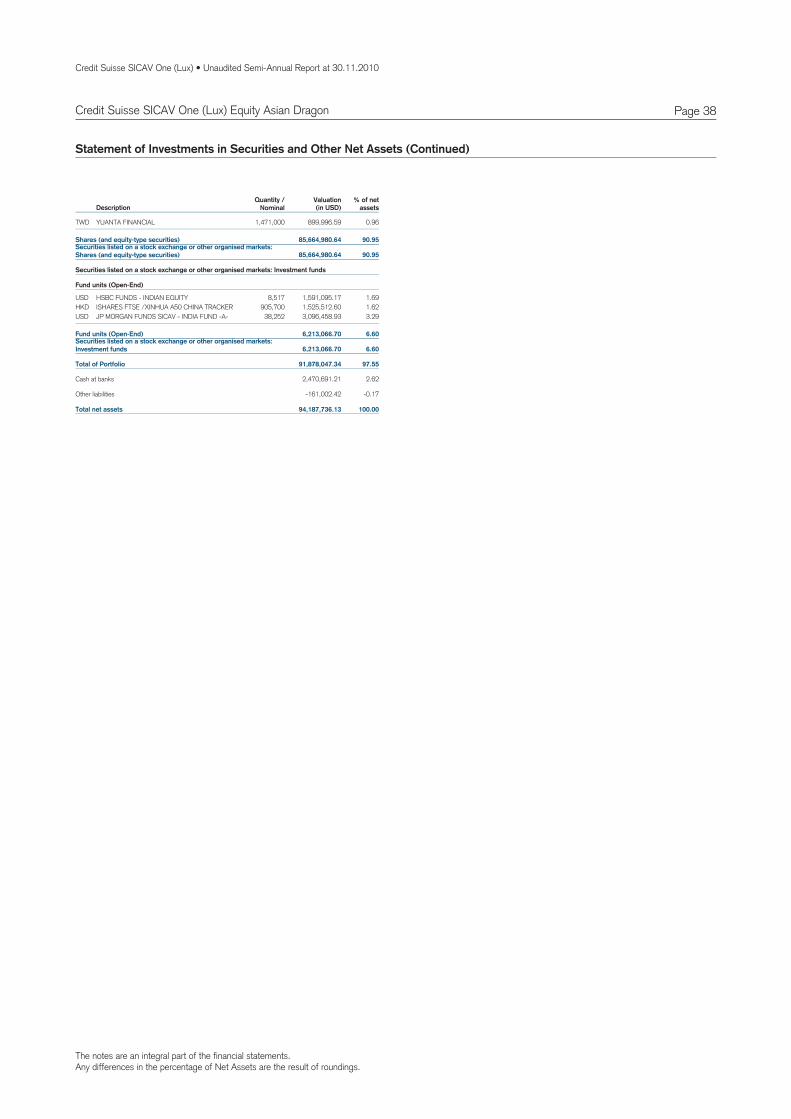
The notes are an integral part of the financial statements.Any differences in the percentage of Net Assets are the result of roundings.
Credit Suisse SICAV One (Lux) • Unaudited Semi-Annual Report at 30.11.2010
Page 38Credit Suisse SICAV One (Lux) Equity Asian Dragon
Statement of Investments in Securities and Other Net Assets (Continued)
DescriptionQuantity /
NominalValuation % of net
assets(in USD)
TWD YUANTA FINANCIAL 1,471,000 899,996.59 0.96
Securities listed on a stock exchange or other organised markets:Shares (and equity-type securities) 85,664,980.64 90.95
Shares (and equity-type securities) 85,664,980.64 90.95
Securities listed on a stock exchange or other organised markets: Investment funds
Fund units (Open-End)
USD HSBC FUNDS - INDIAN EQUITY 8,517 1,591,095.17 1.69HKD ISHARES FTSE /XINHUA A50 CHINA TRACKER 905,700 1,525,512.60 1.62USD JP MORGAN FUNDS SICAV - INDIA FUND -A- 38,252 3,096,458.93 3.29
Securities listed on a stock exchange or other organised markets:Investment funds 6,213,066.70 6.60
Fund units (Open-End) 6,213,066.70 6.60
Total of Portfolio 91,878,047.34 97.55
Cash at banks 2,470,691.21 2.62
Other liabilities -161,002.42 -0.17
Total net assets 94,187,736.13 100.00
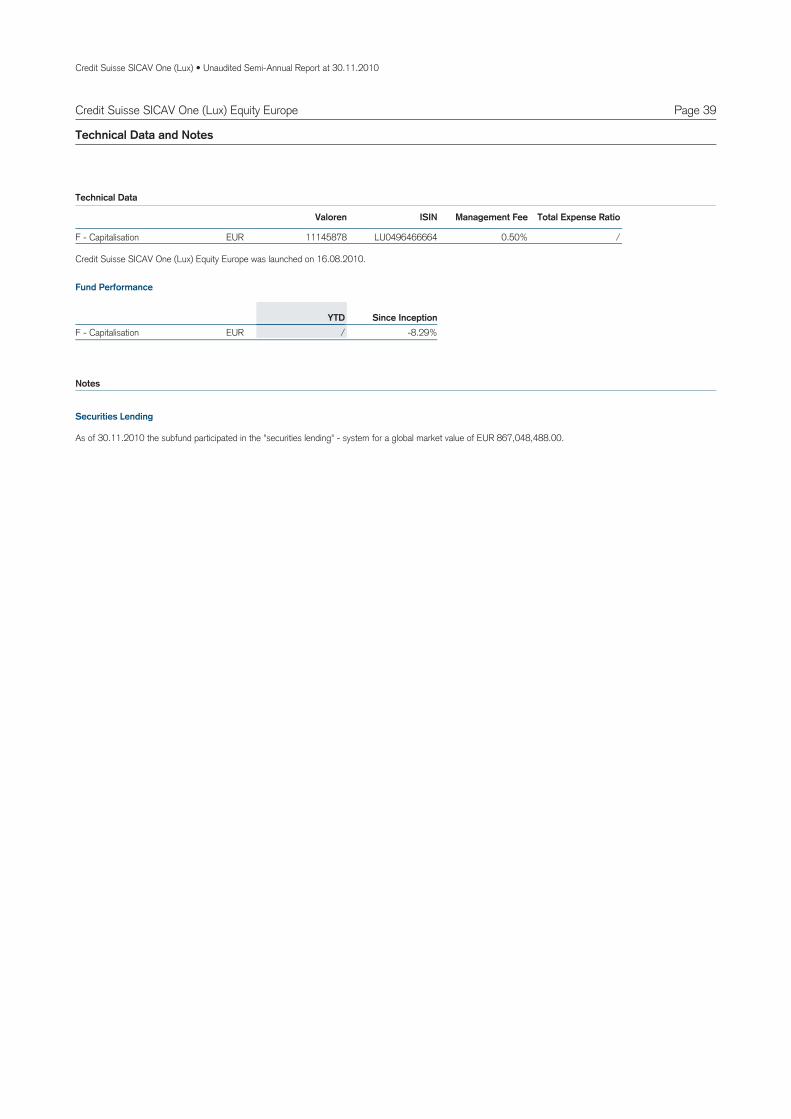
Credit Suisse SICAV One (Lux) • Unaudited Semi-Annual Report at 30.11.2010
Page 39Credit Suisse SICAV One (Lux) Equity Europe
Technical Data and Notes
EURF 11145878 LU0496466664 0.50% /Capitalisation -
Valoren ISIN Management Fee Total Expense Ratio
Technical Data
EURF -8.29%/Capitalisation - YTD Since Inception
Fund Performance
Notes
Credit Suisse SICAV One (Lux) Equity Europe was launched on 16.08.2010.
As of 30.11.2010 the subfund participated in the "securities lending" - system for a global market value of EUR 867,048,488.00.
Securities Lending
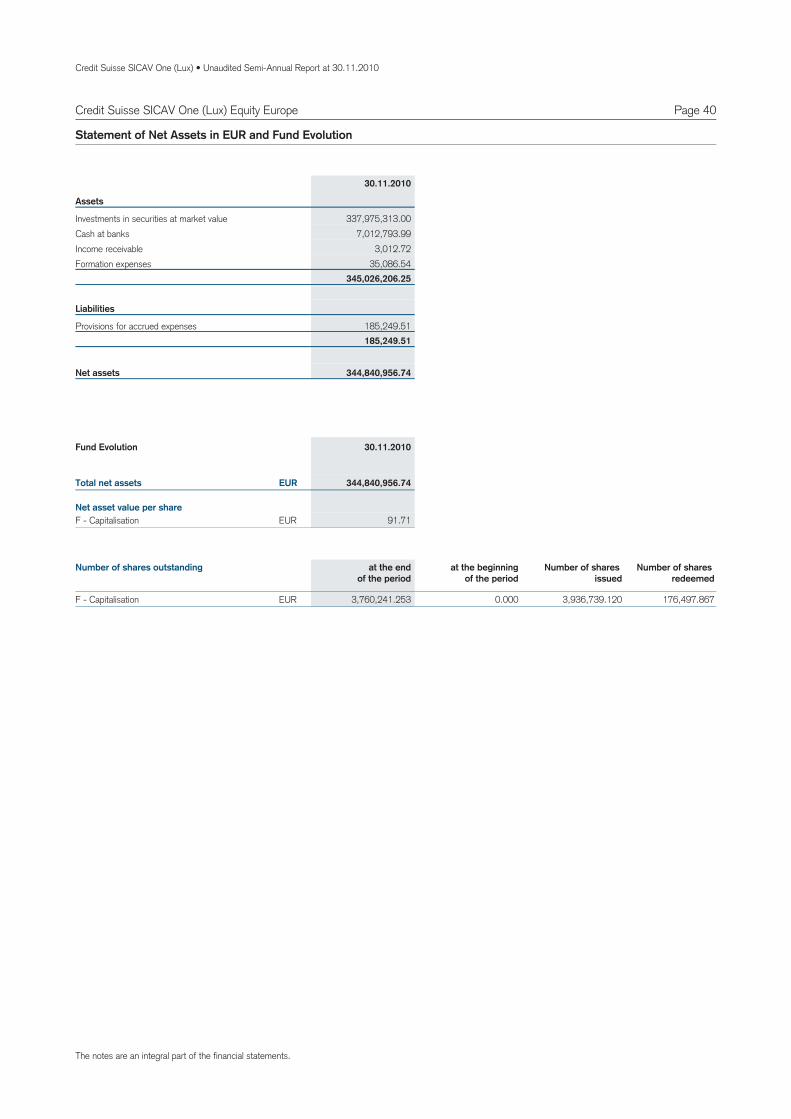
Credit Suisse SICAV One (Lux) • Unaudited Semi-Annual Report at 30.11.2010
Page 40
Assets
Investments in securities at market value 337,975,313.00Cash at banks 7,012,793.99Income receivable 3,012.72Formation expenses 35,086.54
345,026,206.25
Liabilities
Provisions for accrued expenses 185,249.51185,249.51
344,840,956.74Net assets
Statement of Net Assets in EUR and Fund Evolution
30.11.2010
91.71EURF Capitalisation -
Total net assets
Net asset value per share
344,840,956.74EUR
Fund Evolution 30.11.2010
3,760,241.253 3,936,739.120F 0.000 176,497.867Capitalisation - EUR
Number of shares outstanding at the endof the period
at the beginningof the period
Number of shares issued
Number of shares redeemed
Credit Suisse SICAV One (Lux) Equity Europe
The notes are an integral part of the financial statements.
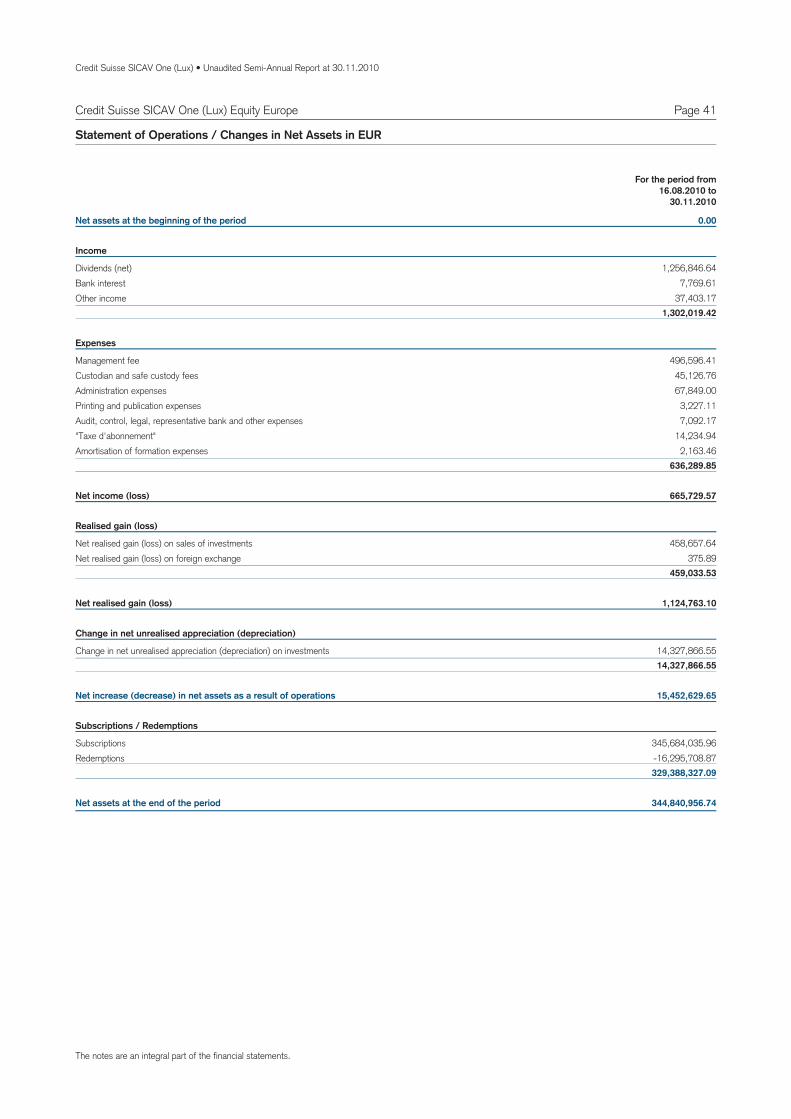
Credit Suisse SICAV One (Lux) • Unaudited Semi-Annual Report at 30.11.2010
Page 41Credit Suisse SICAV One (Lux) Equity Europe
Net assets at the beginning of the period 0.00
Income
Dividends (net) 1,256,846.64Bank interest 7,769.61Other income 37,403.17
1,302,019.42
Expenses
Management fee 496,596.41Custodian and safe custody fees 45,126.76Administration expenses 67,849.00Printing and publication expenses 3,227.11Audit, control, legal, representative bank and other expenses 7,092.17"Taxe d'abonnement" 14,234.94Amortisation of formation expenses 2,163.46
636,289.85
Net income (loss) 665,729.57
Realised gain (loss)
Net realised gain (loss) on sales of investments 458,657.64Net realised gain (loss) on foreign exchange 375.89
459,033.53
Net realised gain (loss) 1,124,763.10
Change in net unrealised appreciation (depreciation)
Change in net unrealised appreciation (depreciation) on investments 14,327,866.5514,327,866.55
Net increase (decrease) in net assets as a result of operations 15,452,629.65
Subscriptions / Redemptions
Subscriptions 345,684,035.96Redemptions -16,295,708.87
329,388,327.09
Net assets at the end of the period 344,840,956.74
Statement of Operations / Changes in Net Assets in EUR
For the period from16.08.2010 to
30.11.2010
The notes are an integral part of the financial statements.
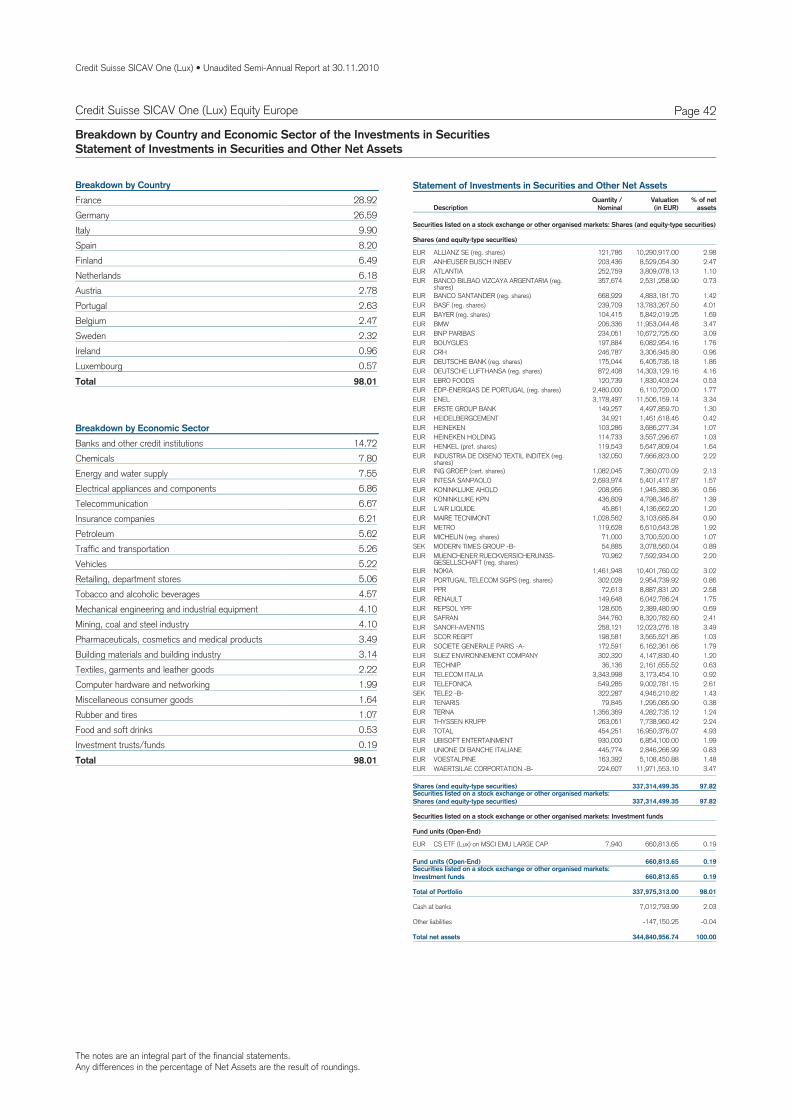
The notes are an integral part of the financial statements.Any differences in the percentage of Net Assets are the result of roundings.
Credit Suisse SICAV One (Lux) • Unaudited Semi-Annual Report at 30.11.2010
Page 42Credit Suisse SICAV One (Lux) Equity Europe
Breakdown by Country and Economic Sector of the Investments in SecuritiesStatement of Investments in Securities and Other Net Assets
28.92FranceBreakdown by Country
26.59Germany9.90Italy8.20Spain6.49Finland6.18Netherlands2.78Austria2.63Portugal2.47Belgium2.32Sweden0.96Ireland0.57Luxembourg
98.01Total
14.72Banks and other credit institutionsBreakdown by Economic Sector
7.80Chemicals7.55Energy and water supply6.86Electrical appliances and components6.67Telecommunication6.21Insurance companies5.62Petroleum5.26Traffic and transportation5.22Vehicles5.06Retailing, department stores4.57Tobacco and alcoholic beverages4.10Mechanical engineering and industrial equipment4.10Mining, coal and steel industry3.49Pharmaceuticals, cosmetics and medical products3.14Building materials and building industry2.22Textiles, garments and leather goods1.99Computer hardware and networking1.64Miscellaneous consumer goods1.07Rubber and tires0.53Food and soft drinks0.19Investment trusts/funds
98.01Total
Statement of Investments in Securities and Other Net Assets
DescriptionQuantity /
NominalValuation % of net
assets(in EUR)
Securities listed on a stock exchange or other organised markets: Shares (and equity-type securities)
Shares (and equity-type securities)
EUR ALLIANZ SE (reg. shares) 121,786 10,290,917.00 2.98EUR ANHEUSER BUSCH INBEV 203,436 8,529,054.30 2.47EUR ATLANTIA 252,759 3,809,078.13 1.10EUR BANCO BILBAO VIZCAYA ARGENTARIA (reg.
shares)357,674 2,531,258.90 0.73
EUR BANCO SANTANDER (reg. shares) 668,929 4,883,181.70 1.42EUR BASF (reg. shares) 239,709 13,783,267.50 4.01EUR BAYER (reg. shares) 104,415 5,842,019.25 1.69EUR BMW 206,336 11,953,044.48 3.47EUR BNP PARIBAS 234,051 10,672,725.60 3.09EUR BOUYGUES 197,884 6,082,954.16 1.76EUR CRH 246,787 3,306,945.80 0.96EUR DEUTSCHE BANK (reg. shares) 175,044 6,405,735.18 1.86EUR DEUTSCHE LUFTHANSA (reg. shares) 872,408 14,303,129.16 4.16EUR EBRO FOODS 120,739 1,830,403.24 0.53EUR EDP-ENERGIAS DE PORTUGAL (reg. shares) 2,480,000 6,110,720.00 1.77EUR ENEL 3,178,497 11,506,159.14 3.34EUR ERSTE GROUP BANK 149,257 4,497,859.70 1.30EUR HEIDELBERGCEMENT 34,921 1,461,618.46 0.42EUR HEINEKEN 103,286 3,686,277.34 1.07EUR HEINEKEN HOLDING 114,733 3,557,296.67 1.03EUR HENKEL (pref. shares) 119,543 5,647,809.04 1.64EUR INDUSTRIA DE DISENO TEXTIL INDITEX (reg.
shares)132,050 7,666,823.00 2.22
EUR ING GROEP (cert. shares) 1,082,045 7,360,070.09 2.13EUR INTESA SANPAOLO 2,693,974 5,401,417.87 1.57EUR KONINKLIJKE AHOLD 208,956 1,945,380.36 0.56EUR KONINKLIJKE KPN 436,809 4,798,346.87 1.39EUR L'AIR LIQUIDE 45,861 4,136,662.20 1.20EUR MAIRE TECNIMONT 1,028,562 3,103,685.84 0.90EUR METRO 119,628 6,610,643.28 1.92EUR MICHELIN (reg. shares) 71,000 3,700,520.00 1.07SEK MODERN TIMES GROUP -B- 54,885 3,078,560.04 0.89EUR MUENCHENER RUECKVERSICHERUNGS-
GESELLSCHAFT (reg. shares)70,962 7,592,934.00 2.20
EUR NOKIA 1,461,948 10,401,760.02 3.02EUR PORTUGAL TELECOM SGPS (reg. shares) 302,028 2,954,739.92 0.86EUR PPR 72,613 8,887,831.20 2.58EUR RENAULT 149,648 6,042,786.24 1.75EUR REPSOL YPF 128,605 2,389,480.90 0.69EUR SAFRAN 344,760 8,320,782.60 2.41EUR SANOFI-AVENTIS 258,121 12,023,276.18 3.49EUR SCOR REGPT 198,581 3,565,521.86 1.03EUR SOCIETE GENERALE PARIS -A- 172,591 6,162,361.66 1.79EUR SUEZ ENVIRONNEMENT COMPANY 302,320 4,147,830.40 1.20EUR TECHNIP 36,136 2,161,655.52 0.63EUR TELECOM ITALIA 3,343,998 3,173,454.10 0.92EUR TELEFONICA 549,285 9,002,781.15 2.61SEK TELE2 -B- 322,287 4,946,210.82 1.43EUR TENARIS 79,845 1,295,085.90 0.38EUR TERNA 1,356,369 4,282,735.12 1.24EUR THYSSEN KRUPP 263,051 7,738,960.42 2.24EUR TOTAL 454,251 16,950,376.07 4.93EUR UBISOFT ENTERTAINMENT 930,000 6,854,100.00 1.99EUR UNIONE DI BANCHE ITALIANE 445,774 2,846,266.99 0.83EUR VOESTALPINE 163,392 5,108,450.88 1.48EUR WAERTSILAE CORPORTATION -B- 224,607 11,971,553.10 3.47
Securities listed on a stock exchange or other organised markets:Shares (and equity-type securities) 337,314,499.35 97.82
Shares (and equity-type securities) 337,314,499.35 97.82
Securities listed on a stock exchange or other organised markets: Investment funds
Fund units (Open-End)
EUR CS ETF (Lux) on MSCI EMU LARGE CAP 7,940 660,813.65 0.19
Securities listed on a stock exchange or other organised markets:Investment funds 660,813.65 0.19
Fund units (Open-End) 660,813.65 0.19
Total of Portfolio 337,975,313.00 98.01
Cash at banks 7,012,793.99 2.03
Other liabilities -147,150.25 -0.04
Total net assets 344,840,956.74 100.00
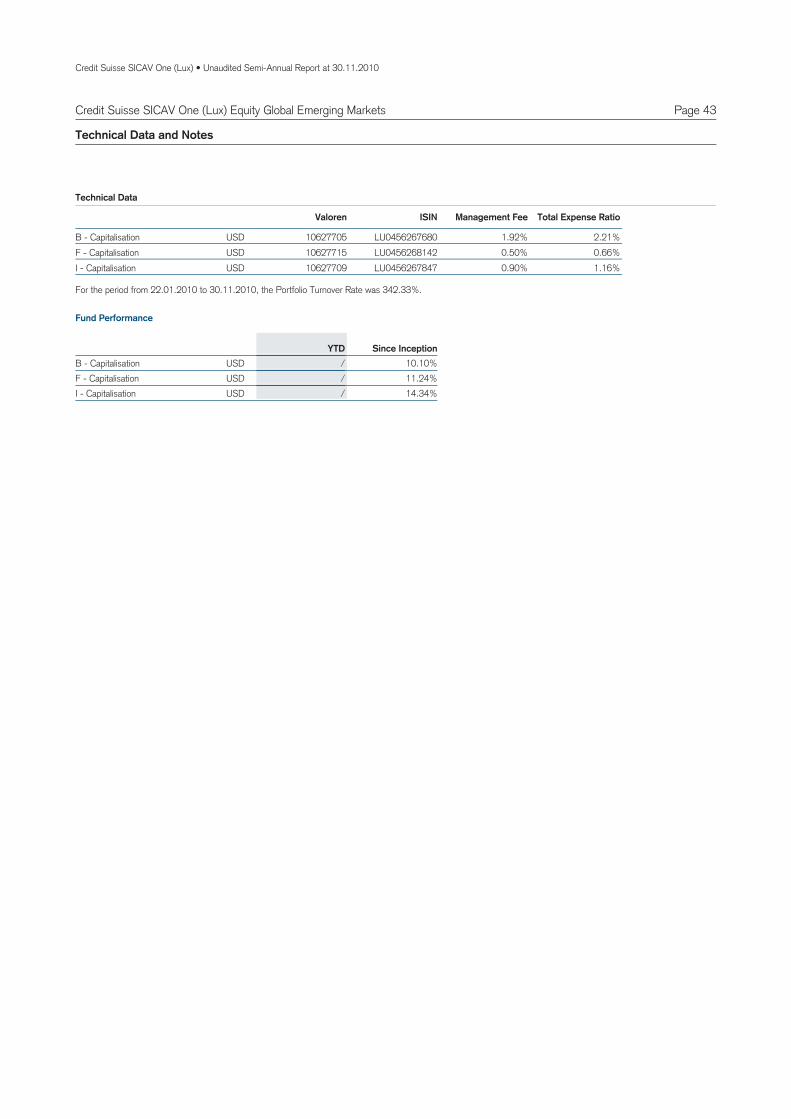
Credit Suisse SICAV One (Lux) • Unaudited Semi-Annual Report at 30.11.2010
Page 43Credit Suisse SICAV One (Lux) Equity Global Emerging Markets
Technical Data and Notes
USDB 10627705 LU0456267680 1.92% 2.21%Capitalisation -
Valoren ISIN Management Fee Total Expense Ratio
USDF 10627715 LU0456268142 0.50% 0.66%Capitalisation - USDI 10627709 LU0456267847 0.90% 1.16%Capitalisation -
Technical Data
USDB 10.10%/Capitalisation - YTD Since Inception
USDF 11.24%/Capitalisation - USDI 14.34%/Capitalisation -
Fund Performance
For the period from 22.01.2010 to 30.11.2010, the Portfolio Turnover Rate was 342.33%.
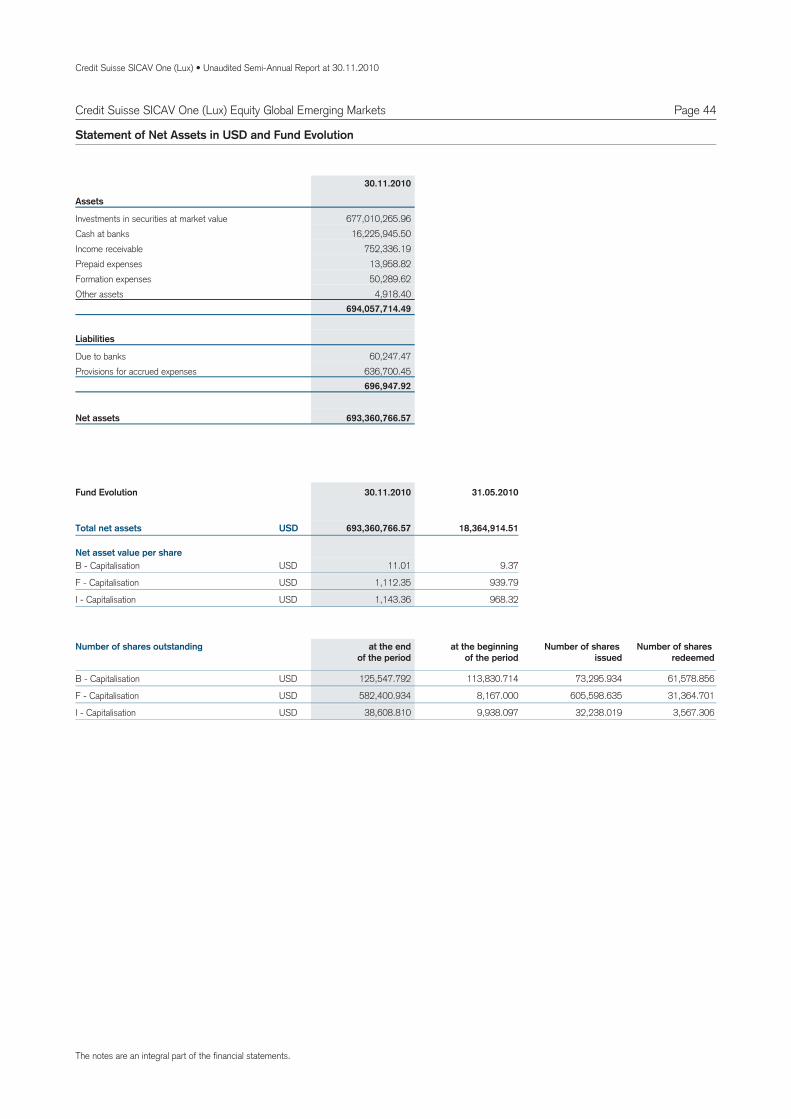
Credit Suisse SICAV One (Lux) • Unaudited Semi-Annual Report at 30.11.2010
Page 44
Assets
Investments in securities at market value 677,010,265.96Cash at banks 16,225,945.50Income receivable 752,336.19Prepaid expenses 13,958.82Formation expenses 50,289.62Other assets 4,918.40
694,057,714.49
Liabilities
Due to banks 60,247.47Provisions for accrued expenses 636,700.45
696,947.92
693,360,766.57Net assets
Statement of Net Assets in USD and Fund Evolution
30.11.2010
11.01USDB 9.37Capitalisation -
1,112.35USDF 939.79Capitalisation -
1,143.36USDI 968.32Capitalisation -
Total net assets
Net asset value per share
693,360,766.57 18,364,914.51USD
Fund Evolution 30.11.2010 31.05.2010
125,547.792 73,295.934B 113,830.714 61,578.856Capitalisation - USD
582,400.934 605,598.635F 8,167.000 31,364.701Capitalisation - USD
38,608.810 32,238.019I 9,938.097 3,567.306Capitalisation - USD
Number of shares outstanding at the endof the period
at the beginningof the period
Number of shares issued
Number of shares redeemed
Credit Suisse SICAV One (Lux) Equity Global Emerging Markets
The notes are an integral part of the financial statements.
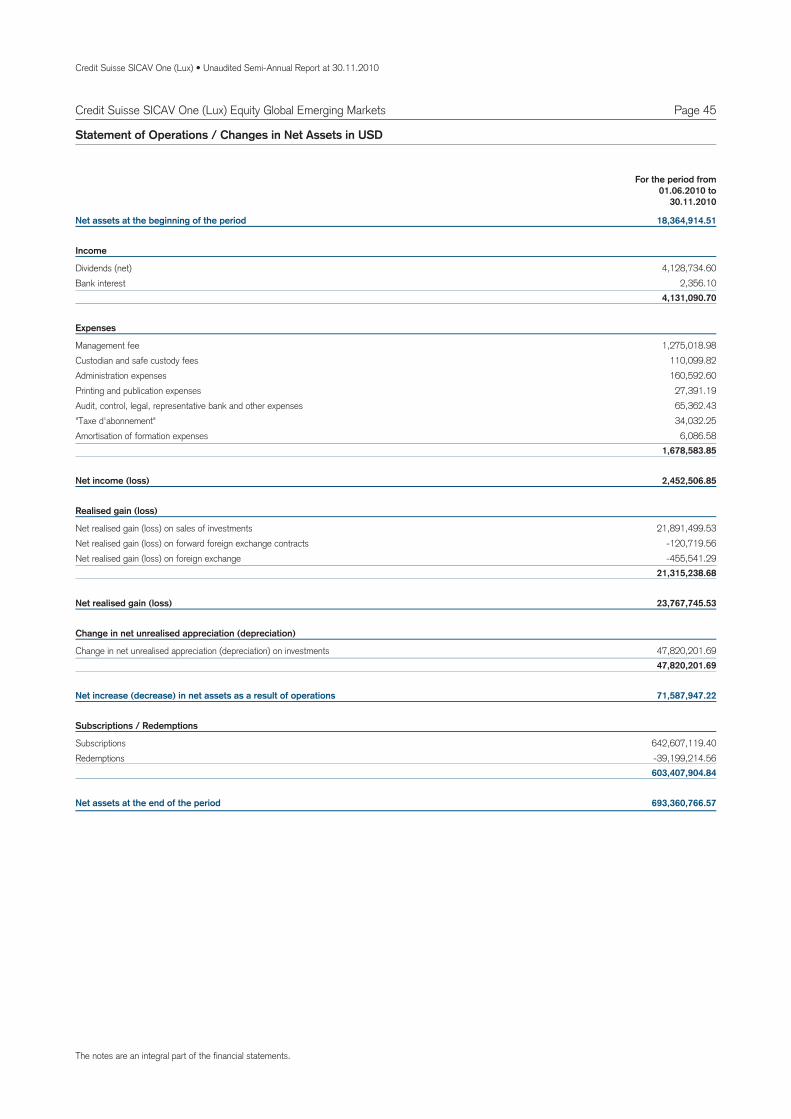
Credit Suisse SICAV One (Lux) • Unaudited Semi-Annual Report at 30.11.2010
Page 45Credit Suisse SICAV One (Lux) Equity Global Emerging Markets
Net assets at the beginning of the period 18,364,914.51
Income
Dividends (net) 4,128,734.60Bank interest 2,356.10
4,131,090.70
Expenses
Management fee 1,275,018.98Custodian and safe custody fees 110,099.82Administration expenses 160,592.60Printing and publication expenses 27,391.19Audit, control, legal, representative bank and other expenses 65,362.43"Taxe d'abonnement" 34,032.25Amortisation of formation expenses 6,086.58
1,678,583.85
Net income (loss) 2,452,506.85
Realised gain (loss)
Net realised gain (loss) on sales of investments 21,891,499.53Net realised gain (loss) on forward foreign exchange contracts -120,719.56Net realised gain (loss) on foreign exchange -455,541.29
21,315,238.68
Net realised gain (loss) 23,767,745.53
Change in net unrealised appreciation (depreciation)
Change in net unrealised appreciation (depreciation) on investments 47,820,201.6947,820,201.69
Net increase (decrease) in net assets as a result of operations 71,587,947.22
Subscriptions / Redemptions
Subscriptions 642,607,119.40Redemptions -39,199,214.56
603,407,904.84
Net assets at the end of the period 693,360,766.57
Statement of Operations / Changes in Net Assets in USD
For the period from01.06.2010 to
30.11.2010
The notes are an integral part of the financial statements.
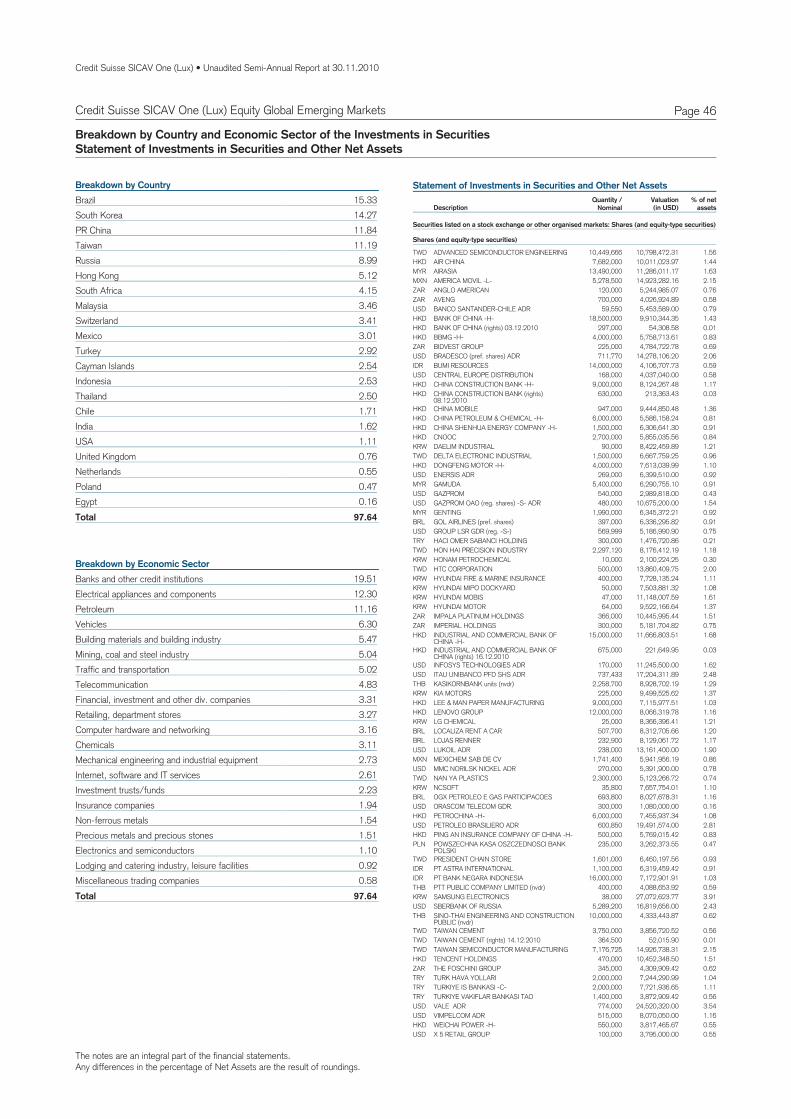
The notes are an integral part of the financial statements.Any differences in the percentage of Net Assets are the result of roundings.
Credit Suisse SICAV One (Lux) • Unaudited Semi-Annual Report at 30.11.2010
Page 46Credit Suisse SICAV One (Lux) Equity Global Emerging Markets
Breakdown by Country and Economic Sector of the Investments in SecuritiesStatement of Investments in Securities and Other Net Assets
15.33BrazilBreakdown by Country
14.27South Korea11.84PR China11.19Taiwan8.99Russia5.12Hong Kong4.15South Africa3.46Malaysia3.41Switzerland3.01Mexico2.92Turkey2.54Cayman Islands2.53Indonesia2.50Thailand1.71Chile1.62India1.11USA0.76United Kingdom0.55Netherlands0.47Poland0.16Egypt
97.64Total
19.51Banks and other credit institutionsBreakdown by Economic Sector
12.30Electrical appliances and components11.16Petroleum6.30Vehicles5.47Building materials and building industry5.04Mining, coal and steel industry5.02Traffic and transportation4.83Telecommunication3.31Financial, investment and other div. companies3.27Retailing, department stores3.16Computer hardware and networking3.11Chemicals2.73Mechanical engineering and industrial equipment2.61Internet, software and IT services2.23Investment trusts/funds1.94Insurance companies1.54Non-ferrous metals1.51Precious metals and precious stones1.10Electronics and semiconductors0.92Lodging and catering industry, leisure facilities0.58Miscellaneous trading companies
97.64Total
Statement of Investments in Securities and Other Net Assets
DescriptionQuantity /
NominalValuation % of net
assets(in USD)
Securities listed on a stock exchange or other organised markets: Shares (and equity-type securities)
Shares (and equity-type securities)
TWD ADVANCED SEMICONDUCTOR ENGINEERING 10,449,666 10,798,472.31 1.56HKD AIR CHINA 7,682,000 10,011,023.97 1.44MYR AIRASIA 13,490,000 11,286,011.17 1.63MXN AMERICA MOVIL -L- 5,278,500 14,923,282.16 2.15ZAR ANGLO AMERICAN 120,000 5,244,985.07 0.76ZAR AVENG 700,000 4,026,924.89 0.58USD BANCO SANTANDER-CHILE ADR 59,550 5,453,589.00 0.79HKD BANK OF CHINA -H- 18,500,000 9,910,344.35 1.43HKD BANK OF CHINA (rights) 03.12.2010 297,000 54,308.58 0.01HKD BBMG -H- 4,000,000 5,758,713.61 0.83ZAR BIDVEST GROUP 225,000 4,784,722.78 0.69USD BRADESCO (pref. shares) ADR 711,770 14,278,106.20 2.06IDR BUMI RESOURCES 14,000,000 4,106,707.73 0.59USD CENTRAL EUROPE DISTRIBUTION 168,000 4,037,040.00 0.58HKD CHINA CONSTRUCTION BANK -H- 9,000,000 8,124,267.48 1.17HKD CHINA CONSTRUCTION BANK (rights)
08.12.2010630,000 213,363.43 0.03
HKD CHINA MOBILE 947,000 9,444,850.48 1.36HKD CHINA PETROLEUM & CHEMICAL -H- 6,000,000 5,586,158.24 0.81HKD CHINA SHENHUA ENERGY COMPANY -H- 1,500,000 6,306,641.30 0.91HKD CNOOC 2,700,000 5,855,035.56 0.84KRW DAELIM INDUSTRIAL 90,000 8,422,459.89 1.21TWD DELTA ELECTRONIC INDUSTRIAL 1,500,000 6,667,759.25 0.96HKD DONGFENG MOTOR -H- 4,000,000 7,613,039.99 1.10USD ENERSIS ADR 269,000 6,399,510.00 0.92MYR GAMUDA 5,400,000 6,290,755.10 0.91USD GAZPROM 540,000 2,989,818.00 0.43USD GAZPROM OAO (reg. shares) -S- ADR 480,000 10,675,200.00 1.54MYR GENTING 1,990,000 6,345,372.21 0.92BRL GOL AIRLINES (pref. shares) 397,000 6,336,295.82 0.91USD GROUP LSR GDR (reg. -S-) 569,999 5,186,990.90 0.75TRY HACI OMER SABANCI HOLDING 300,000 1,476,720.86 0.21TWD HON HAI PRECISION INDUSTRY 2,297,120 8,176,412.19 1.18KRW HONAM PETROCHEMICAL 10,000 2,100,224.25 0.30TWD HTC CORPORATION 500,000 13,860,409.75 2.00KRW HYUNDAI FIRE & MARINE INSURANCE 400,000 7,728,135.24 1.11KRW HYUNDAI MIPO DOCKYARD 50,000 7,503,881.32 1.08KRW HYUNDAI MOBIS 47,000 11,148,007.59 1.61KRW HYUNDAI MOTOR 64,000 9,522,166.64 1.37ZAR IMPALA PLATINUM HOLDINGS 366,000 10,445,995.44 1.51ZAR IMPERIAL HOLDINGS 300,000 5,181,704.82 0.75HKD INDUSTRIAL AND COMMERCIAL BANK OF
CHINA -H-15,000,000 11,666,803.51 1.68
HKD INDUSTRIAL AND COMMERCIAL BANK OFCHINA (rights) 16.12.2010
675,000 221,649.95 0.03
USD INFOSYS TECHNOLOGIES ADR 170,000 11,245,500.00 1.62USD ITAU UNIBANCO PFD SHS ADR 737,433 17,204,311.89 2.48THB KASIKORNBANK units (nvdr) 2,258,700 8,928,702.19 1.29KRW KIA MOTORS 225,000 9,499,525.62 1.37HKD LEE & MAN PAPER MANUFACTURING 9,000,000 7,115,977.51 1.03HKD LENOVO GROUP 12,000,000 8,066,319.78 1.16KRW LG CHEMICAL 25,000 8,366,396.41 1.21BRL LOCALIZA RENT A CAR 507,700 8,312,705.66 1.20BRL LOJAS RENNER 232,900 8,129,061.72 1.17USD LUKOIL ADR 238,000 13,161,400.00 1.90MXN MEXICHEM SAB DE CV 1,741,400 5,941,956.19 0.86USD MMC NORILSK NICKEL ADR 270,000 5,391,900.00 0.78TWD NAN YA PLASTICS 2,300,000 5,123,266.72 0.74KRW NCSOFT 35,800 7,657,754.01 1.10BRL OGX PETROLEO E GAS PARTICIPACOES 693,800 8,027,678.31 1.16USD ORASCOM TELECOM GDR. 300,000 1,080,000.00 0.16HKD PETROCHINA -H- 6,000,000 7,455,937.34 1.08USD PETROLEO BRASILIERO ADR 600,850 19,491,574.00 2.81HKD PING AN INSURANCE COMPANY OF CHINA -H- 500,000 5,769,015.42 0.83PLN POWSZECHNA KASA OSZCZEDNOSCI BANK
POLSKI235,000 3,262,373.55 0.47
TWD PRESIDENT CHAIN STORE 1,601,000 6,460,197.56 0.93IDR PT ASTRA INTERNATIONAL 1,100,000 6,319,459.42 0.91IDR PT BANK NEGARA INDONESIA 16,000,000 7,172,901.91 1.03THB PTT PUBLIC COMPANY LIMITED (nvdr) 400,000 4,088,653.92 0.59KRW SAMSUNG ELECTRONICS 38,000 27,072,623.77 3.91USD SBERBANK OF RUSSIA 5,289,200 16,819,656.00 2.43THB SINO-THAI ENGINEERING AND CONSTRUCTION
PUBLIC (nvdr)10,000,000 4,333,443.87 0.62
TWD TAIWAN CEMENT 3,750,000 3,856,720.52 0.56TWD TAIWAN CEMENT (rights) 14.12.2010 364,500 52,015.90 0.01TWD TAIWAN SEMICONDUCTOR MANUFACTURING 7,176,725 14,926,738.31 2.15HKD TENCENT HOLDINGS 470,000 10,452,348.50 1.51ZAR THE FOSCHINI GROUP 345,000 4,309,909.42 0.62TRY TURK HAVA YOLLARI 2,000,000 7,244,290.99 1.04TRY TURKIYE IS BANKASI -C- 2,000,000 7,721,936.65 1.11TRY TURKIYE VAKIFLAR BANKASI TAO 1,400,000 3,872,909.42 0.56USD VALE ADR 774,000 24,520,320.00 3.54USD VIMPELCOM ADR 515,000 8,070,050.00 1.16HKD WEICHAI POWER -H- 550,000 3,817,465.67 0.55USD X 5 RETAIL GROUP 100,000 3,795,000.00 0.55
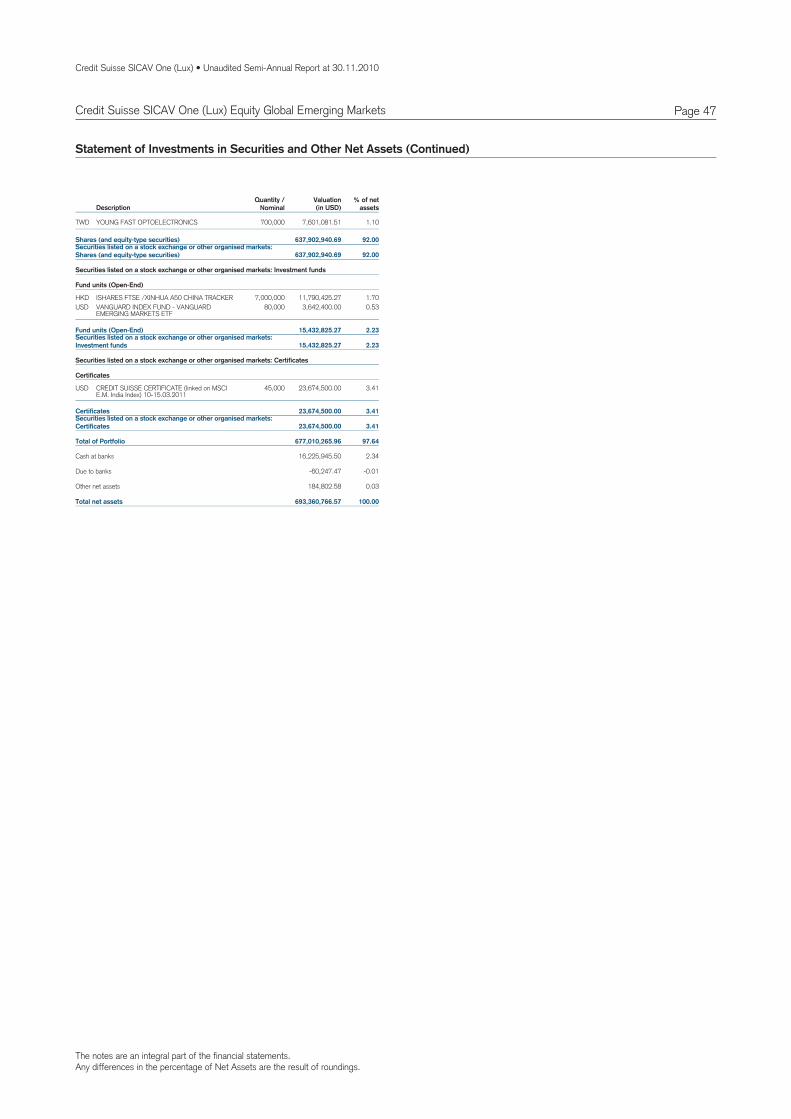
The notes are an integral part of the financial statements.Any differences in the percentage of Net Assets are the result of roundings.
Credit Suisse SICAV One (Lux) • Unaudited Semi-Annual Report at 30.11.2010
Page 47Credit Suisse SICAV One (Lux) Equity Global Emerging Markets
Statement of Investments in Securities and Other Net Assets (Continued)
DescriptionQuantity /
NominalValuation % of net
assets(in USD)
TWD YOUNG FAST OPTOELECTRONICS 700,000 7,601,081.51 1.10
Securities listed on a stock exchange or other organised markets:Shares (and equity-type securities) 637,902,940.69 92.00
Shares (and equity-type securities) 637,902,940.69 92.00
Securities listed on a stock exchange or other organised markets: Investment funds
Fund units (Open-End)
HKD ISHARES FTSE /XINHUA A50 CHINA TRACKER 7,000,000 11,790,425.27 1.70USD VANGUARD INDEX FUND - VANGUARD
EMERGING MARKETS ETF80,000 3,642,400.00 0.53
Securities listed on a stock exchange or other organised markets:Investment funds 15,432,825.27 2.23
Fund units (Open-End) 15,432,825.27 2.23
Securities listed on a stock exchange or other organised markets: Certificates
Certificates
USD CREDIT SUISSE CERTIFICATE (linked on MSCIE.M. India Index) 10-15.03.2011
45,000 23,674,500.00 3.41
Securities listed on a stock exchange or other organised markets:Certificates 23,674,500.00 3.41
Certificates 23,674,500.00 3.41
Total of Portfolio 677,010,265.96 97.64
Cash at banks 16,225,945.50 2.34
Due to banks -60,247.47 -0.01
Other net assets 184,802.58 0.03
Total net assets 693,360,766.57 100.00
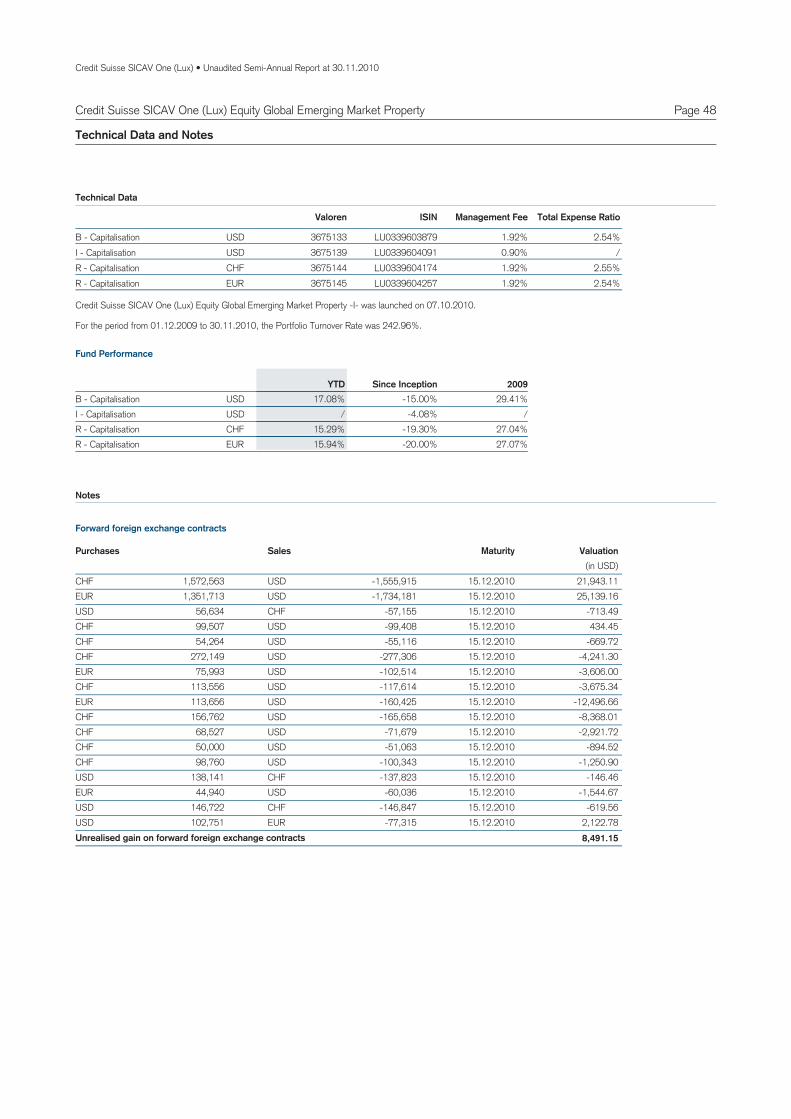
Credit Suisse SICAV One (Lux) • Unaudited Semi-Annual Report at 30.11.2010
Page 48Credit Suisse SICAV One (Lux) Equity Global Emerging Market Property
Technical Data and Notes
USDB 3675133 LU0339603879 1.92% 2.54%Capitalisation -
Valoren ISIN Management Fee Total Expense Ratio
USDI 3675139 LU0339604091 0.90% /Capitalisation - CHFR 3675144 LU0339604174 1.92% 2.55%Capitalisation - EURR 3675145 LU0339604257 1.92% 2.54%Capitalisation -
Technical Data
USDB 29.41%-15.00%17.08%Capitalisation - YTD 2009Since Inception
USDI /-4.08%/Capitalisation - CHFR 27.04%-19.30%15.29%Capitalisation - EURR 27.07%-20.00%15.94%Capitalisation -
Fund Performance
For the period from 01.12.2009 to 30.11.2010, the Portfolio Turnover Rate was 242.96%.
Notes
Credit Suisse SICAV One (Lux) Equity Global Emerging Market Property -I- was launched on 07.10.2010.
1,572,563CHF USD -1,555,915 21,943.1115.12.20101,351,713EUR USD -1,734,181 25,139.1615.12.2010
56,634USD CHF -57,155 -713.4915.12.201099,507CHF USD -99,408 434.4515.12.201054,264CHF USD -55,116 -669.7215.12.2010
272,149CHF USD -277,306 -4,241.3015.12.201075,993EUR USD -102,514 -3,606.0015.12.2010
113,556CHF USD -117,614 -3,675.3415.12.2010113,656EUR USD -160,425 -12,496.6615.12.2010156,762CHF USD -165,658 -8,368.0115.12.201068,527CHF USD -71,679 -2,921.7215.12.201050,000CHF USD -51,063 -894.5215.12.201098,760CHF USD -100,343 -1,250.9015.12.2010
138,141USD CHF -137,823 -146.4615.12.201044,940EUR USD -60,036 -1,544.6715.12.2010
146,722USD CHF -146,847 -619.5615.12.2010102,751USD EUR -77,315 2,122.7815.12.2010
8,491.15Unrealised gain on forward foreign exchange contracts
SalesPurchases Valuation(in USD)
Maturity
Forward foreign exchange contracts
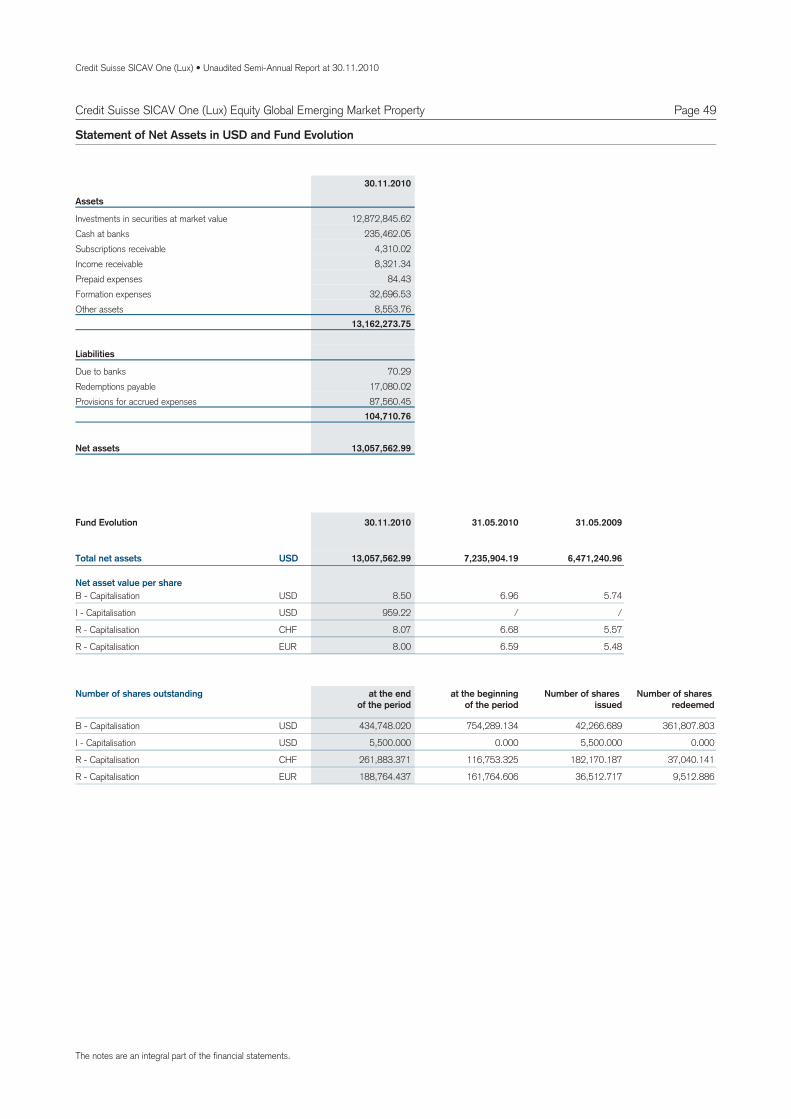
Credit Suisse SICAV One (Lux) • Unaudited Semi-Annual Report at 30.11.2010
Page 49
Assets
Investments in securities at market value 12,872,845.62Cash at banks 235,462.05Subscriptions receivable 4,310.02Income receivable 8,321.34Prepaid expenses 84.43Formation expenses 32,696.53Other assets 8,553.76
13,162,273.75
Liabilities
Due to banks 70.29Redemptions payable 17,080.02Provisions for accrued expenses 87,560.45
104,710.76
13,057,562.99Net assets
Statement of Net Assets in USD and Fund Evolution
30.11.2010
8.50 5.74USDB 6.96Capitalisation -
959.22 /USDI /Capitalisation -
8.07 5.57CHFR 6.68Capitalisation -
8.00 5.48EURR 6.59Capitalisation -
Total net assets
Net asset value per share
13,057,562.99 7,235,904.19 6,471,240.96USD
Fund Evolution 30.11.2010 31.05.2010 31.05.2009
434,748.020 42,266.689B 754,289.134 361,807.803Capitalisation - USD
5,500.000 5,500.000I 0.000 0.000Capitalisation - USD
261,883.371 182,170.187R 116,753.325 37,040.141Capitalisation - CHF
188,764.437 36,512.717R 161,764.606 9,512.886Capitalisation - EUR
Number of shares outstanding at the endof the period
at the beginningof the period
Number of shares issued
Number of shares redeemed
Credit Suisse SICAV One (Lux) Equity Global Emerging Market Property
The notes are an integral part of the financial statements.
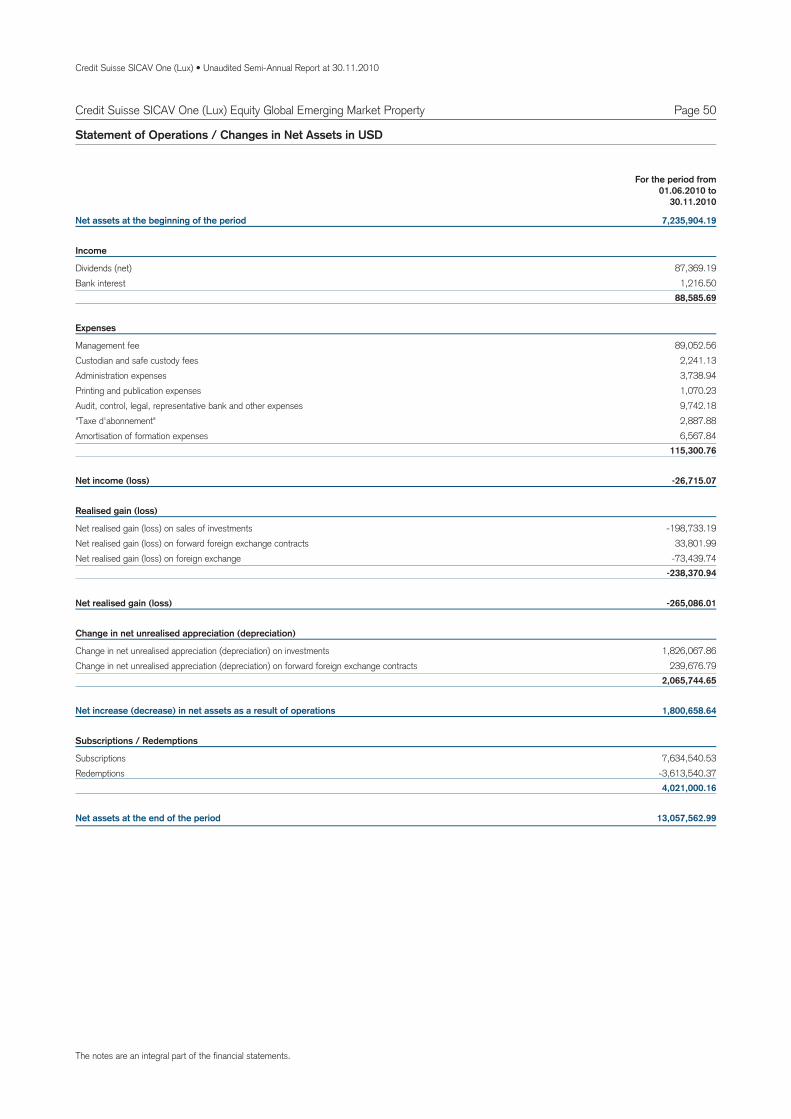
Credit Suisse SICAV One (Lux) • Unaudited Semi-Annual Report at 30.11.2010
Page 50Credit Suisse SICAV One (Lux) Equity Global Emerging Market Property
Net assets at the beginning of the period 7,235,904.19
Income
Dividends (net) 87,369.19Bank interest 1,216.50
88,585.69
Expenses
Management fee 89,052.56Custodian and safe custody fees 2,241.13Administration expenses 3,738.94Printing and publication expenses 1,070.23Audit, control, legal, representative bank and other expenses 9,742.18"Taxe d'abonnement" 2,887.88Amortisation of formation expenses 6,567.84
115,300.76
Net income (loss) -26,715.07
Realised gain (loss)
Net realised gain (loss) on sales of investments -198,733.19Net realised gain (loss) on forward foreign exchange contracts 33,801.99Net realised gain (loss) on foreign exchange -73,439.74
-238,370.94
Net realised gain (loss) -265,086.01
Change in net unrealised appreciation (depreciation)
Change in net unrealised appreciation (depreciation) on investments 1,826,067.86Change in net unrealised appreciation (depreciation) on forward foreign exchange contracts 239,676.79
2,065,744.65
Net increase (decrease) in net assets as a result of operations 1,800,658.64
Subscriptions / Redemptions
Subscriptions 7,634,540.53Redemptions -3,613,540.37
4,021,000.16
Net assets at the end of the period 13,057,562.99
Statement of Operations / Changes in Net Assets in USD
For the period from01.06.2010 to
30.11.2010
The notes are an integral part of the financial statements.
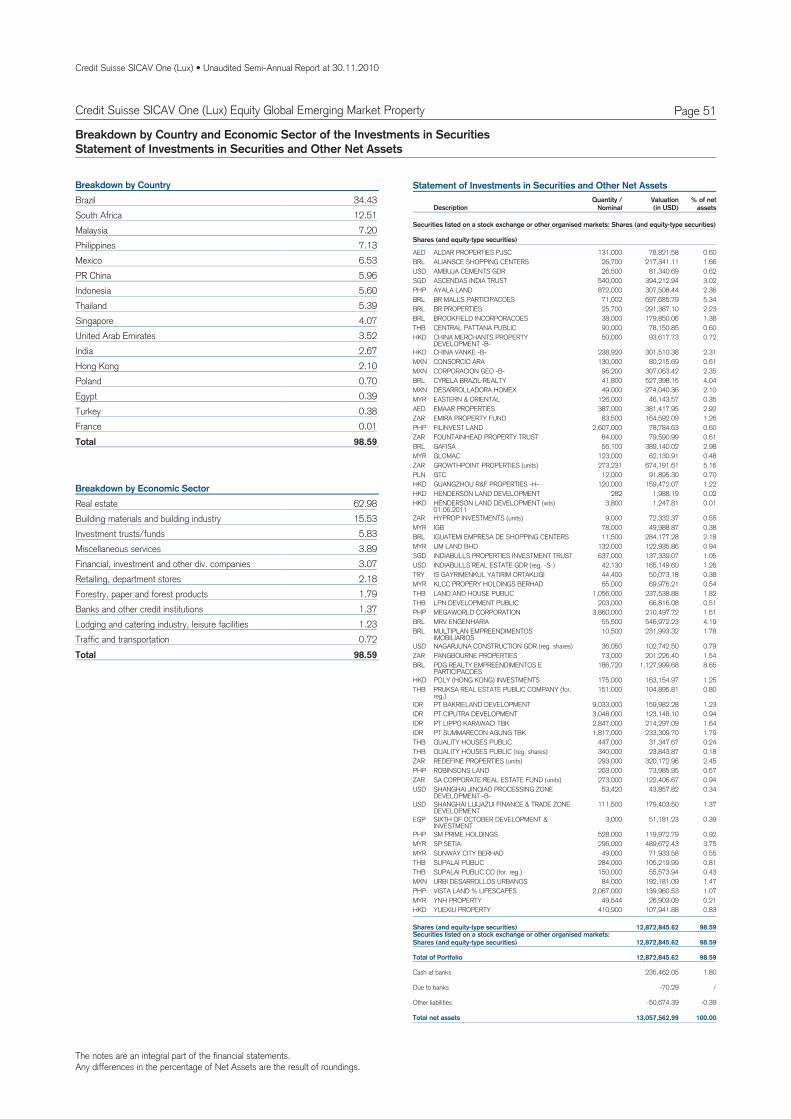
The notes are an integral part of the financial statements.Any differences in the percentage of Net Assets are the result of roundings.
Credit Suisse SICAV One (Lux) • Unaudited Semi-Annual Report at 30.11.2010
Page 51Credit Suisse SICAV One (Lux) Equity Global Emerging Market Property
Breakdown by Country and Economic Sector of the Investments in SecuritiesStatement of Investments in Securities and Other Net Assets
34.43BrazilBreakdown by Country
12.51South Africa7.20Malaysia7.13Philippines6.53Mexico5.96PR China5.60Indonesia5.39Thailand4.07Singapore3.52United Arab Emirates2.67India2.10Hong Kong0.70Poland0.39Egypt0.38Turkey0.01France
98.59Total
62.98Real estateBreakdown by Economic Sector
15.53Building materials and building industry5.83Investment trusts/funds3.89Miscellaneous services3.07Financial, investment and other div. companies2.18Retailing, department stores1.79Forestry, paper and forest products1.37Banks and other credit institutions1.23Lodging and catering industry, leisure facilities0.72Traffic and transportation
98.59Total
Statement of Investments in Securities and Other Net Assets
DescriptionQuantity /
NominalValuation % of net
assets(in USD)
Securities listed on a stock exchange or other organised markets: Shares (and equity-type securities)
Shares (and equity-type securities)
AED ALDAR PROPERTIES PJSC 131,000 78,821.58 0.60BRL ALIANSCE SHOPPING CENTERS 26,700 217,341.11 1.66USD AMBUJA CEMENTS GDR 26,500 81,340.69 0.62SGD ASCENDAS INDIA TRUST 540,000 394,212.94 3.02PHP AYALA LAND 872,000 307,508.44 2.36BRL BR MALLS PARTICIPACOES 71,002 697,685.79 5.34BRL BR PROPERTIES 25,700 291,387.10 2.23BRL BROOKFIELD INCORPORACOES 38,000 179,850.06 1.38THB CENTRAL PATTANA PUBLIC 90,000 78,150.85 0.60HKD CHINA MERCHANTS PROPERTY
DEVELOPMENT -B-50,000 93,617.73 0.72
HKD CHINA VANKE -B- 238,920 301,510.38 2.31MXN CONSORCIO ARA 130,000 80,215.69 0.61MXN CORPORACION GEO -B- 95,200 307,063.42 2.35BRL CYRELA BRAZIL REALTY 41,800 527,398.15 4.04MXN DESARROLLADORA HOMEX 49,000 274,040.36 2.10MYR EASTERN & ORIENTAL 126,000 46,143.57 0.35AED EMAAR PROPERTIES 387,000 381,417.95 2.92ZAR EMIRA PROPERTY FUND 83,500 164,592.09 1.26PHP FILINVEST LAND 2,607,000 78,784.63 0.60ZAR FOUNTAINHEAD PROPERTY TRUST 84,000 79,590.99 0.61BRL GAFISA 56,100 389,140.02 2.98MYR GLOMAC 123,000 62,130.91 0.48ZAR GROWTHPOINT PROPERTIES (units) 273,231 674,191.61 5.16PLN GTC 12,000 91,895.30 0.70HKD GUANGZHOU R&F PROPERTIES -H- 120,000 159,472.07 1.22HKD HENDERSON LAND DEVELOPMENT 282 1,988.19 0.02HKD HENDERSON LAND DEVELOPMENT (wts)
01.06.20113,800 1,247.81 0.01
ZAR HYPROP INVESTMENTS (units) 9,000 72,332.37 0.55MYR IGB 78,000 49,988.87 0.38BRL IGUATEMI EMPRESA DE SHOPPING CENTERS 11,500 284,177.28 2.18MYR IJM LAND BHD 132,000 122,935.86 0.94SGD INDIABULLS PROPERTIES INVESTMENT TRUST 637,000 137,339.07 1.05USD INDIABULLS REAL ESTATE GDR (reg. -S-) 42,130 165,149.60 1.26TRY IS GAYRIMENKUL YATIRIM ORTAKLIGI 44,400 50,073.18 0.38MYR KLCC PROPERY HOLDINGS BERHAD 65,000 69,976.21 0.54THB LAND AND HOUSE PUBLIC 1,056,000 237,538.88 1.82THB LPN DEVELOPMENT PUBLIC 203,000 66,816.08 0.51PHP MEGAWORLD CORPORATION 3,860,000 210,497.72 1.61BRL MRV ENGENHARIA 55,500 546,972.23 4.19BRL MULTIPLAN EMPREENDIMENTOS
IMOBILIARIOS10,500 231,993.32 1.78
USD NAGARJUNA CONSTRUCTION GDR (reg. shares) 36,050 102,742.50 0.79ZAR PANGBOURNE PROPERTIES 73,000 201,226.40 1.54BRL PDG REALTY EMPREENDIMENTOS E
PARTICIPACOES186,720 1,127,999.68 8.65
HKD POLY (HONG KONG) INVESTMENTS 175,000 163,154.97 1.25THB PRUKSA REAL ESTATE PUBLIC COMPANY (for.
reg.)151,000 104,895.81 0.80
IDR PT BAKRIELAND DEVELOPMENT 9,033,000 159,982.28 1.23IDR PT CIPUTRA DEVELOPMENT 3,048,000 123,148.10 0.94IDR PT LIPPO KARAWACI TBK 2,847,000 214,297.09 1.64IDR PT SUMMARECON AGUNG TBK 1,817,000 233,309.70 1.79THB QUALITY HOUSES PUBLIC 447,000 31,347.67 0.24THB QUALITY HOUSES PUBLIC (reg. shares) 340,000 23,843.87 0.18ZAR REDEFINE PROPERTIES (units) 293,000 320,172.96 2.45PHP ROBINSONS LAND 203,000 73,985.95 0.57ZAR SA CORPORATE REAL ESTATE FUND (units) 273,000 122,406.67 0.94USD SHANGHAI JINQIAO PROCESSING ZONE
DEVELOPMENT -B-53,420 43,857.82 0.34
USD SHANGHAI LUIJAZUI FINANCE & TRADE ZONEDEVELOPMENT
111,500 179,403.50 1.37
EGP SIXTH OF OCTOBER DEVELOPMENT &INVESTMENT
3,000 51,181.23 0.39
PHP SM PRIME HOLDINGS 528,000 119,972.79 0.92MYR SP SETIA 296,000 489,672.43 3.75MYR SUNWAY CITY BERHAD 49,000 71,933.58 0.55THB SUPALAI PUBLIC 284,000 105,219.99 0.81THB SUPALAI PUBLIC CO (for. reg.) 150,000 55,573.94 0.43MXN URBI DESARROLLOS URBANOS 84,000 192,181.09 1.47PHP VISTA LAND % LIFESCAPES 2,067,000 139,960.53 1.07MYR YNH PROPERTY 49,544 26,903.09 0.21HKD YUEXIU PROPERTY 410,900 107,941.88 0.83
Securities listed on a stock exchange or other organised markets:Shares (and equity-type securities) 12,872,845.62 98.59
Shares (and equity-type securities) 12,872,845.62 98.59
Total of Portfolio 12,872,845.62 98.59
Cash at banks 235,462.05 1.80
Due to banks -70.29 /
Other liabilities -50,674.39 -0.39
Total net assets 13,057,562.99 100.00
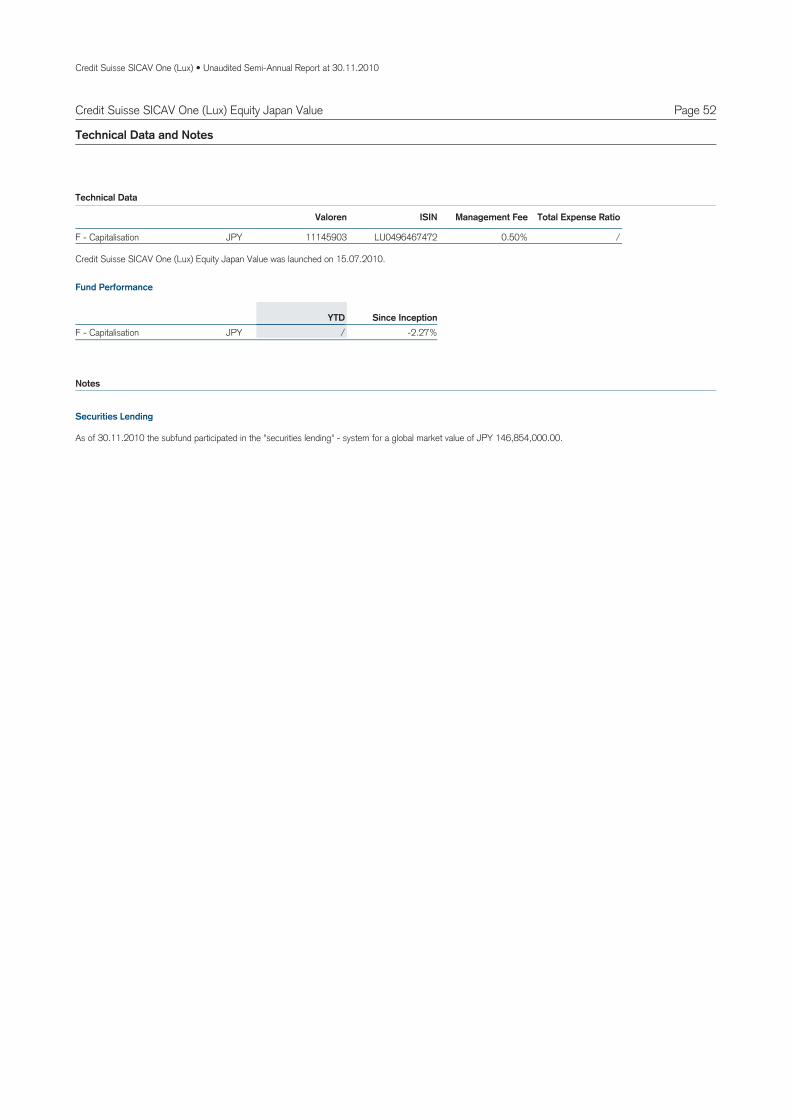
Credit Suisse SICAV One (Lux) • Unaudited Semi-Annual Report at 30.11.2010
Page 52Credit Suisse SICAV One (Lux) Equity Japan Value
Technical Data and Notes
JPYF 11145903 LU0496467472 0.50% /Capitalisation -
Valoren ISIN Management Fee Total Expense Ratio
Technical Data
JPYF -2.27%/Capitalisation - YTD Since Inception
Fund Performance
Notes
Credit Suisse SICAV One (Lux) Equity Japan Value was launched on 15.07.2010.
As of 30.11.2010 the subfund participated in the "securities lending" - system for a global market value of JPY 146,854,000.00.
Securities Lending
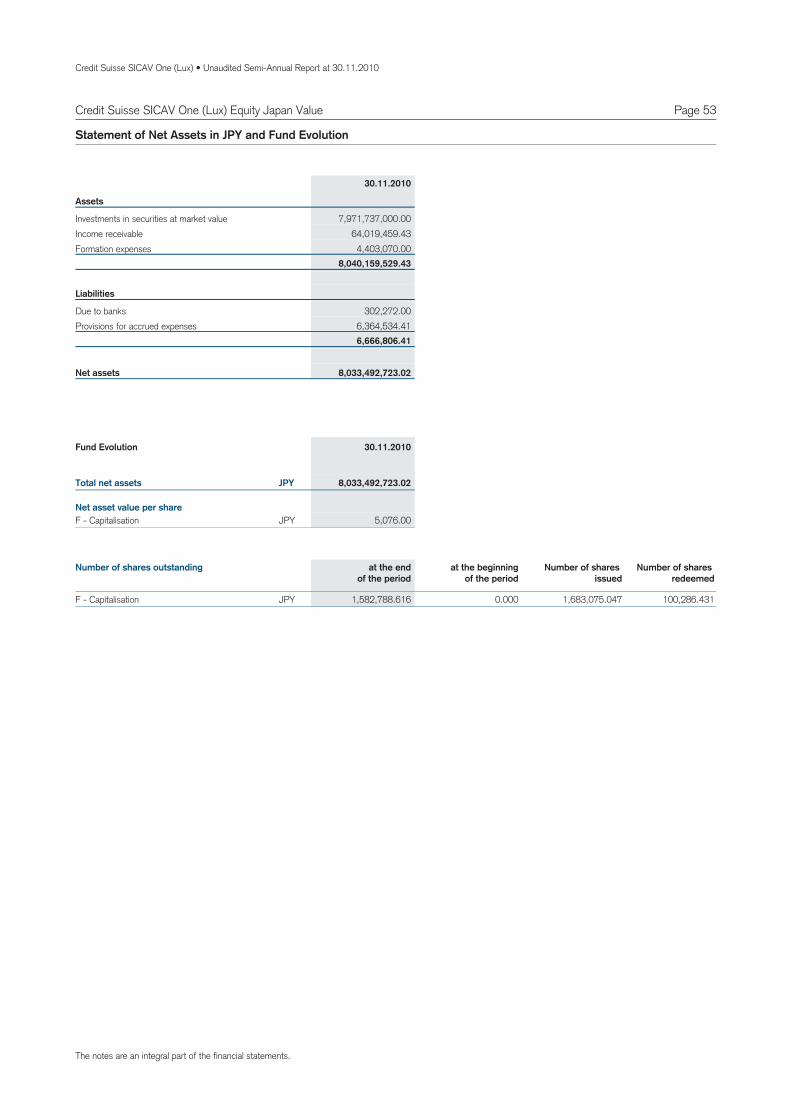
Credit Suisse SICAV One (Lux) • Unaudited Semi-Annual Report at 30.11.2010
Page 53
Assets
Investments in securities at market value 7,971,737,000.00Income receivable 64,019,459.43Formation expenses 4,403,070.00
8,040,159,529.43
Liabilities
Due to banks 302,272.00Provisions for accrued expenses 6,364,534.41
6,666,806.41
8,033,492,723.02Net assets
Statement of Net Assets in JPY and Fund Evolution
30.11.2010
5,076.00JPYF Capitalisation -
Total net assets
Net asset value per share
8,033,492,723.02JPY
Fund Evolution 30.11.2010
1,582,788.616 1,683,075.047F 0.000 100,286.431Capitalisation - JPY
Number of shares outstanding at the endof the period
at the beginningof the period
Number of shares issued
Number of shares redeemed
Credit Suisse SICAV One (Lux) Equity Japan Value
The notes are an integral part of the financial statements.
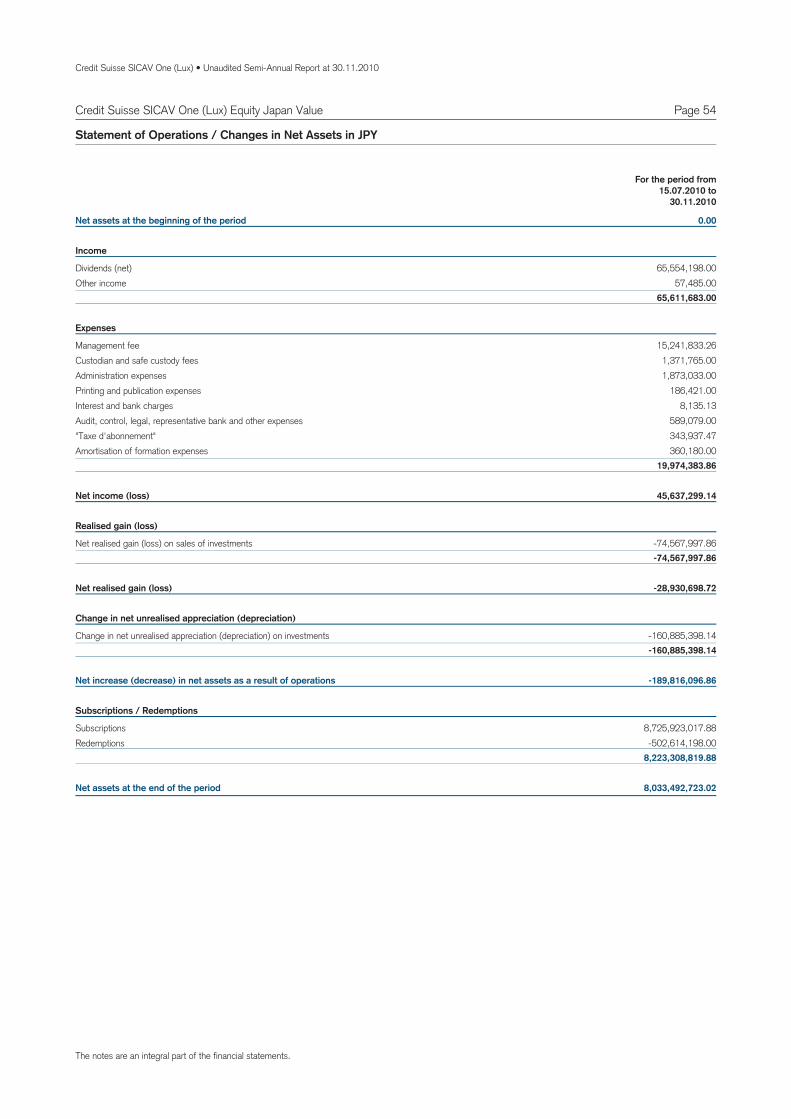
Credit Suisse SICAV One (Lux) • Unaudited Semi-Annual Report at 30.11.2010
Page 54Credit Suisse SICAV One (Lux) Equity Japan Value
Net assets at the beginning of the period 0.00
Income
Dividends (net) 65,554,198.00Other income 57,485.00
65,611,683.00
Expenses
Management fee 15,241,833.26Custodian and safe custody fees 1,371,765.00Administration expenses 1,873,033.00Printing and publication expenses 186,421.00Interest and bank charges 8,135.13Audit, control, legal, representative bank and other expenses 589,079.00"Taxe d'abonnement" 343,937.47Amortisation of formation expenses 360,180.00
19,974,383.86
Net income (loss) 45,637,299.14
Realised gain (loss)
Net realised gain (loss) on sales of investments -74,567,997.86-74,567,997.86
Net realised gain (loss) -28,930,698.72
Change in net unrealised appreciation (depreciation)
Change in net unrealised appreciation (depreciation) on investments -160,885,398.14-160,885,398.14
Net increase (decrease) in net assets as a result of operations -189,816,096.86
Subscriptions / Redemptions
Subscriptions 8,725,923,017.88Redemptions -502,614,198.00
8,223,308,819.88
Net assets at the end of the period 8,033,492,723.02
Statement of Operations / Changes in Net Assets in JPY
For the period from15.07.2010 to
30.11.2010
The notes are an integral part of the financial statements.
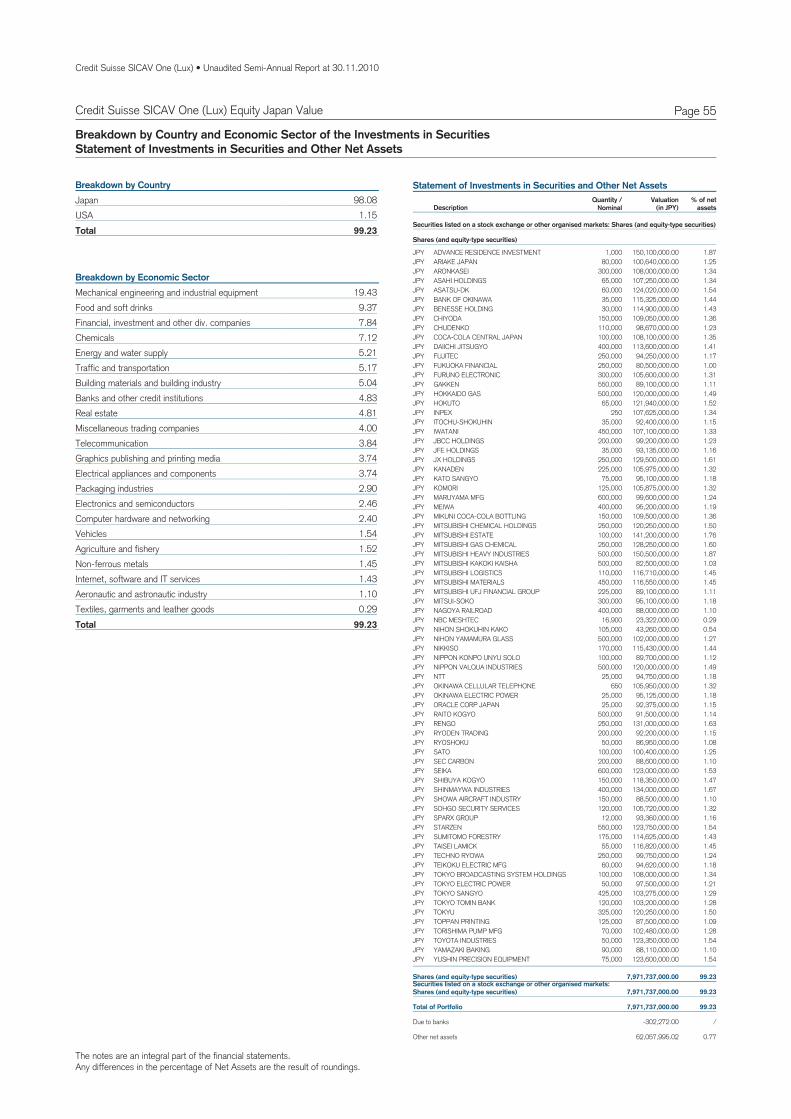
The notes are an integral part of the financial statements.Any differences in the percentage of Net Assets are the result of roundings.
Credit Suisse SICAV One (Lux) • Unaudited Semi-Annual Report at 30.11.2010
Page 55Credit Suisse SICAV One (Lux) Equity Japan Value
Breakdown by Country and Economic Sector of the Investments in SecuritiesStatement of Investments in Securities and Other Net Assets
98.08JapanBreakdown by Country
1.15USA99.23Total
19.43Mechanical engineering and industrial equipmentBreakdown by Economic Sector
9.37Food and soft drinks7.84Financial, investment and other div. companies7.12Chemicals5.21Energy and water supply5.17Traffic and transportation5.04Building materials and building industry4.83Banks and other credit institutions4.81Real estate4.00Miscellaneous trading companies3.84Telecommunication3.74Graphics publishing and printing media3.74Electrical appliances and components2.90Packaging industries2.46Electronics and semiconductors2.40Computer hardware and networking1.54Vehicles1.52Agriculture and fishery1.45Non-ferrous metals1.43Internet, software and IT services1.10Aeronautic and astronautic industry0.29Textiles, garments and leather goods
99.23Total
Statement of Investments in Securities and Other Net Assets
DescriptionQuantity /
NominalValuation % of net
assets(in JPY)
Securities listed on a stock exchange or other organised markets: Shares (and equity-type securities)
Shares (and equity-type securities)
JPY ADVANCE RESIDENCE INVESTMENT 1,000 150,100,000.00 1.87JPY ARIAKE JAPAN 80,000 100,640,000.00 1.25JPY ARONKASEI 300,000 108,000,000.00 1.34JPY ASAHI HOLDINGS 65,000 107,250,000.00 1.34JPY ASATSU-DK 60,000 124,020,000.00 1.54JPY BANK OF OKINAWA 35,000 115,325,000.00 1.44JPY BENESSE HOLDING 30,000 114,900,000.00 1.43JPY CHIYODA 150,000 109,050,000.00 1.36JPY CHUDENKO 110,000 98,670,000.00 1.23JPY COCA-COLA CENTRAL JAPAN 100,000 108,100,000.00 1.35JPY DAIICHI JITSUGYO 400,000 113,600,000.00 1.41JPY FUJITEC 250,000 94,250,000.00 1.17JPY FUKUOKA FINANCIAL 250,000 80,500,000.00 1.00JPY FURUNO ELECTRONIC 300,000 105,600,000.00 1.31JPY GAKKEN 550,000 89,100,000.00 1.11JPY HOKKAIDO GAS 500,000 120,000,000.00 1.49JPY HOKUTO 65,000 121,940,000.00 1.52JPY INPEX 250 107,625,000.00 1.34JPY ITOCHU-SHOKUHIN 35,000 92,400,000.00 1.15JPY IWATANI 450,000 107,100,000.00 1.33JPY JBCC HOLDINGS 200,000 99,200,000.00 1.23JPY JFE HOLDINGS 35,000 93,135,000.00 1.16JPY JX HOLDINGS 250,000 129,500,000.00 1.61JPY KANADEN 225,000 105,975,000.00 1.32JPY KATO SANGYO 75,000 95,100,000.00 1.18JPY KOMORI 125,000 105,875,000.00 1.32JPY MARUYAMA MFG 600,000 99,600,000.00 1.24JPY MEIWA 400,000 95,200,000.00 1.19JPY MIKUNI COCA-COLA BOTTLING 150,000 109,500,000.00 1.36JPY MITSUBISHI CHEMICAL HOLDINGS 250,000 120,250,000.00 1.50JPY MITSUBISHI ESTATE 100,000 141,200,000.00 1.76JPY MITSUBISHI GAS CHEMICAL 250,000 128,250,000.00 1.60JPY MITSUBISHI HEAVY INDUSTRIES 500,000 150,500,000.00 1.87JPY MITSUBISHI KAKOKI KAISHA 500,000 82,500,000.00 1.03JPY MITSUBISHI LOGISTICS 110,000 116,710,000.00 1.45JPY MITSUBISHI MATERIALS 450,000 116,550,000.00 1.45JPY MITSUBISHI UFJ FINANCIAL GROUP 225,000 89,100,000.00 1.11JPY MITSUI-SOKO 300,000 95,100,000.00 1.18JPY NAGOYA RAILROAD 400,000 88,000,000.00 1.10JPY NBC MESHTEC 16,900 23,322,000.00 0.29JPY NIHON SHOKUHIN KAKO 105,000 43,260,000.00 0.54JPY NIHON YAMAMURA GLASS 500,000 102,000,000.00 1.27JPY NIKKISO 170,000 115,430,000.00 1.44JPY NIPPON KONPO UNYU SOLO 100,000 89,700,000.00 1.12JPY NIPPON VALQUA INDUSTRIES 500,000 120,000,000.00 1.49JPY NTT 25,000 94,750,000.00 1.18JPY OKINAWA CELLULAR TELEPHONE 650 105,950,000.00 1.32JPY OKINAWA ELECTRIC POWER 25,000 95,125,000.00 1.18JPY ORACLE CORP JAPAN 25,000 92,375,000.00 1.15JPY RAITO KOGYO 500,000 91,500,000.00 1.14JPY RENGO 250,000 131,000,000.00 1.63JPY RYODEN TRADING 200,000 92,200,000.00 1.15JPY RYOSHOKU 50,000 86,950,000.00 1.08JPY SATO 100,000 100,400,000.00 1.25JPY SEC CARBON 200,000 88,600,000.00 1.10JPY SEIKA 600,000 123,000,000.00 1.53JPY SHIBUYA KOGYO 150,000 118,350,000.00 1.47JPY SHINMAYWA INDUSTRIES 400,000 134,000,000.00 1.67JPY SHOWA AIRCRAFT INDUSTRY 150,000 88,500,000.00 1.10JPY SOHGO SECURITY SERVICES 120,000 105,720,000.00 1.32JPY SPARX GROUP 12,000 93,360,000.00 1.16JPY STARZEN 550,000 123,750,000.00 1.54JPY SUMITOMO FORESTRY 175,000 114,625,000.00 1.43JPY TAISEI LAMICK 55,000 116,820,000.00 1.45JPY TECHNO RYOWA 250,000 99,750,000.00 1.24JPY TEIKOKU ELECTRIC MFG 60,000 94,620,000.00 1.18JPY TOKYO BROADCASTING SYSTEM HOLDINGS 100,000 108,000,000.00 1.34JPY TOKYO ELECTRIC POWER 50,000 97,500,000.00 1.21JPY TOKYO SANGYO 425,000 103,275,000.00 1.29JPY TOKYO TOMIN BANK 120,000 103,200,000.00 1.28JPY TOKYU 325,000 120,250,000.00 1.50JPY TOPPAN PRINTING 125,000 87,500,000.00 1.09JPY TORISHIMA PUMP MFG 70,000 102,480,000.00 1.28JPY TOYOTA INDUSTRIES 50,000 123,350,000.00 1.54JPY YAMAZAKI BAKING 90,000 88,110,000.00 1.10JPY YUSHIN PRECISION EQUIPMENT 75,000 123,600,000.00 1.54
Securities listed on a stock exchange or other organised markets:Shares (and equity-type securities) 7,971,737,000.00 99.23
Shares (and equity-type securities) 7,971,737,000.00 99.23
Total of Portfolio 7,971,737,000.00 99.23
Due to banks -302,272.00 /
Other net assets 62,057,995.02 0.77
The notes are an integral part of the financial statements.Any differences in the percentage of Net Assets are the result of roundings.
Credit Suisse SICAV One (Lux) • Unaudited Semi-Annual Report at 30.11.2010
Page 56Credit Suisse SICAV One (Lux) Equity Japan Value
Statement of Investments in Securities and Other Net Assets (Continued)
DescriptionQuantity /
NominalValuation % of net
assets(in JPY)
Total net assets 8,033,492,723.02 100.00
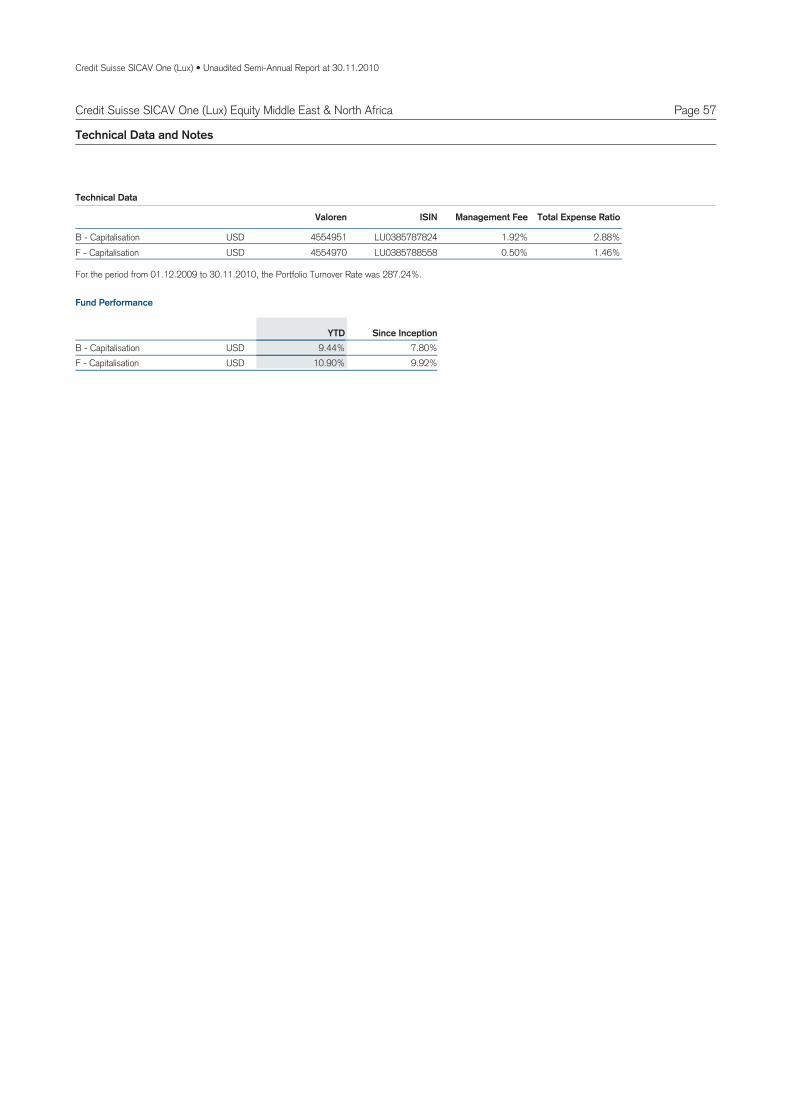
Credit Suisse SICAV One (Lux) • Unaudited Semi-Annual Report at 30.11.2010
Page 57Credit Suisse SICAV One (Lux) Equity Middle East & North Africa
Technical Data and Notes
USDB 4554951 LU0385787824 1.92% 2.88%Capitalisation -
Valoren ISIN Management Fee Total Expense Ratio
USDF 4554970 LU0385788558 0.50% 1.46%Capitalisation -
Technical Data
USDB 7.80%9.44%Capitalisation - YTD Since Inception
USDF 9.92%10.90%Capitalisation -
Fund Performance
For the period from 01.12.2009 to 30.11.2010, the Portfolio Turnover Rate was 287.24%.
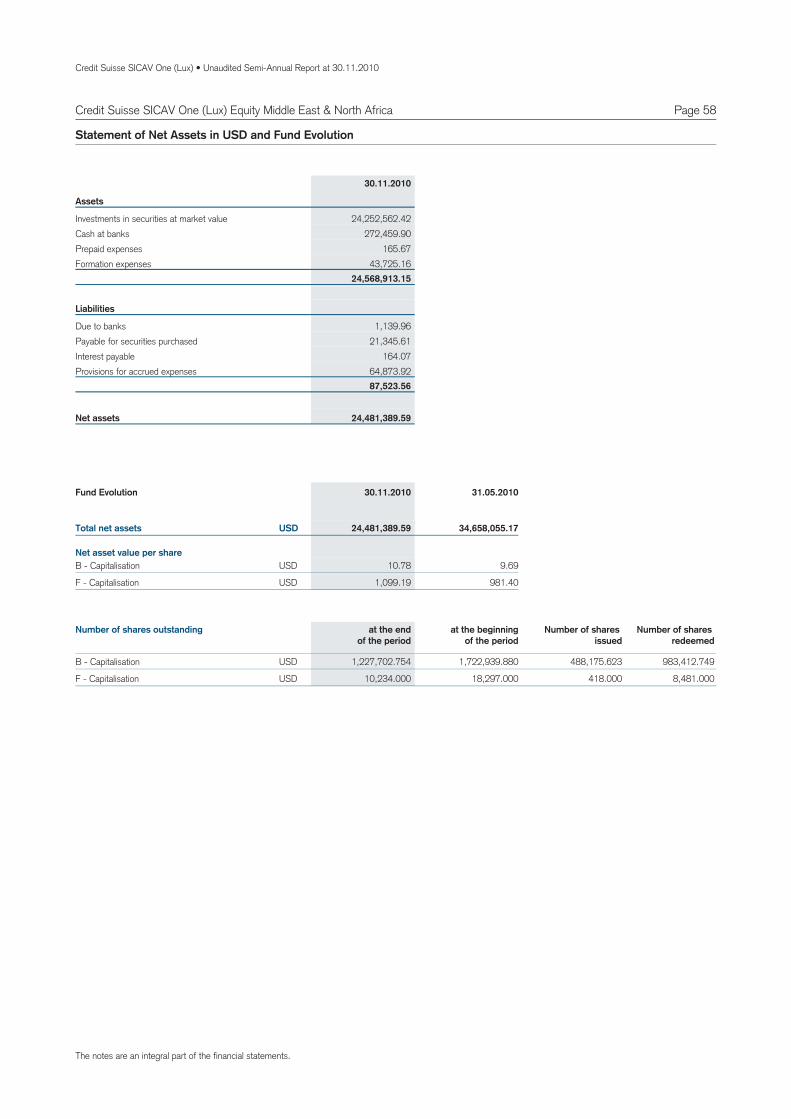
Credit Suisse SICAV One (Lux) • Unaudited Semi-Annual Report at 30.11.2010
Page 58
Assets
Investments in securities at market value 24,252,562.42Cash at banks 272,459.90Prepaid expenses 165.67Formation expenses 43,725.16
24,568,913.15
Liabilities
Due to banks 1,139.96Payable for securities purchased 21,345.61Interest payable 164.07Provisions for accrued expenses 64,873.92
87,523.56
24,481,389.59Net assets
Statement of Net Assets in USD and Fund Evolution
30.11.2010
10.78USDB 9.69Capitalisation -
1,099.19USDF 981.40Capitalisation -
Total net assets
Net asset value per share
24,481,389.59 34,658,055.17USD
Fund Evolution 30.11.2010 31.05.2010
1,227,702.754 488,175.623B 1,722,939.880 983,412.749Capitalisation - USD
10,234.000 418.000F 18,297.000 8,481.000Capitalisation - USD
Number of shares outstanding at the endof the period
at the beginningof the period
Number of shares issued
Number of shares redeemed
Credit Suisse SICAV One (Lux) Equity Middle East & North Africa
The notes are an integral part of the financial statements.
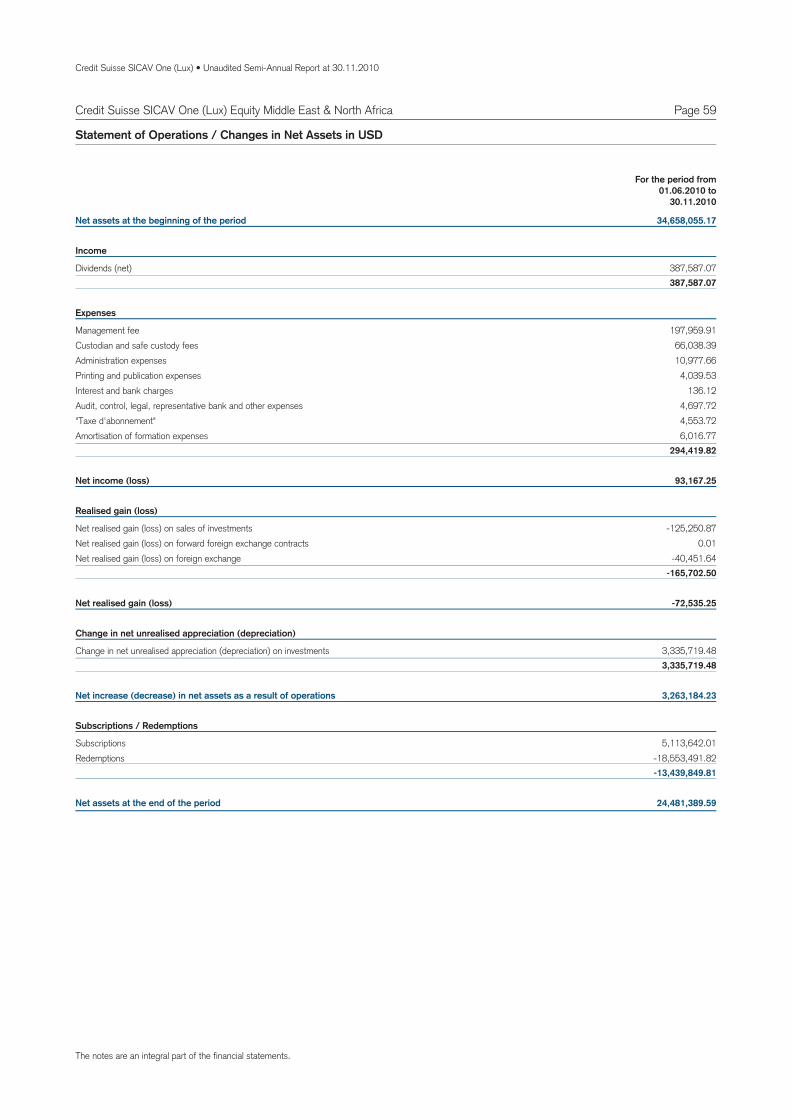
Credit Suisse SICAV One (Lux) • Unaudited Semi-Annual Report at 30.11.2010
Page 59Credit Suisse SICAV One (Lux) Equity Middle East & North Africa
Net assets at the beginning of the period 34,658,055.17
Income
Dividends (net) 387,587.07387,587.07
Expenses
Management fee 197,959.91Custodian and safe custody fees 66,038.39Administration expenses 10,977.66Printing and publication expenses 4,039.53Interest and bank charges 136.12Audit, control, legal, representative bank and other expenses 4,697.72"Taxe d'abonnement" 4,553.72Amortisation of formation expenses 6,016.77
294,419.82
Net income (loss) 93,167.25
Realised gain (loss)
Net realised gain (loss) on sales of investments -125,250.87Net realised gain (loss) on forward foreign exchange contracts 0.01Net realised gain (loss) on foreign exchange -40,451.64
-165,702.50
Net realised gain (loss) -72,535.25
Change in net unrealised appreciation (depreciation)
Change in net unrealised appreciation (depreciation) on investments 3,335,719.483,335,719.48
Net increase (decrease) in net assets as a result of operations 3,263,184.23
Subscriptions / Redemptions
Subscriptions 5,113,642.01Redemptions -18,553,491.82
-13,439,849.81
Net assets at the end of the period 24,481,389.59
Statement of Operations / Changes in Net Assets in USD
For the period from01.06.2010 to
30.11.2010
The notes are an integral part of the financial statements.
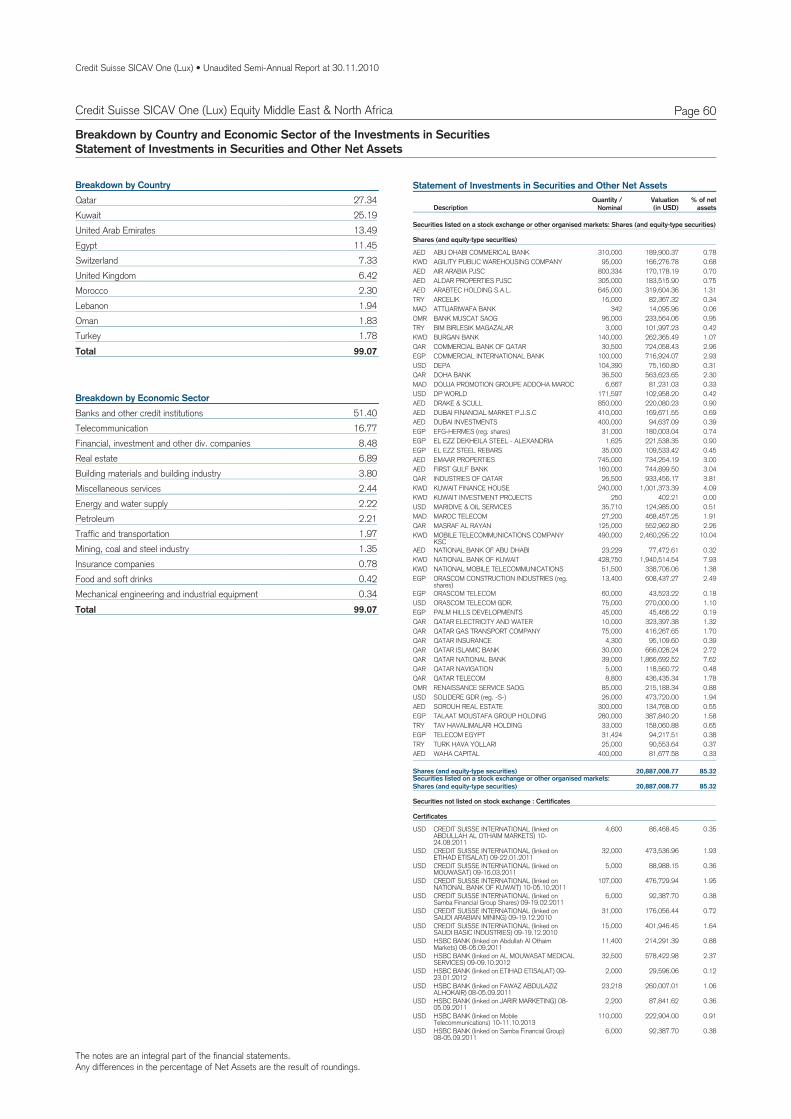
The notes are an integral part of the financial statements.Any differences in the percentage of Net Assets are the result of roundings.
Credit Suisse SICAV One (Lux) • Unaudited Semi-Annual Report at 30.11.2010
Page 60Credit Suisse SICAV One (Lux) Equity Middle East & North Africa
Breakdown by Country and Economic Sector of the Investments in SecuritiesStatement of Investments in Securities and Other Net Assets
27.34QatarBreakdown by Country
25.19Kuwait13.49United Arab Emirates11.45Egypt7.33Switzerland6.42United Kingdom2.30Morocco1.94Lebanon1.83Oman1.78Turkey
99.07Total
51.40Banks and other credit institutionsBreakdown by Economic Sector
16.77Telecommunication8.48Financial, investment and other div. companies6.89Real estate3.80Building materials and building industry2.44Miscellaneous services2.22Energy and water supply2.21Petroleum1.97Traffic and transportation1.35Mining, coal and steel industry0.78Insurance companies0.42Food and soft drinks0.34Mechanical engineering and industrial equipment
99.07Total
Statement of Investments in Securities and Other Net Assets
DescriptionQuantity /
NominalValuation % of net
assets(in USD)
Securities listed on a stock exchange or other organised markets: Shares (and equity-type securities)
Shares (and equity-type securities)
AED ABU DHABI COMMERICAL BANK 310,000 189,900.37 0.78KWD AGILITY PUBLIC WAREHOUSING COMPANY 95,000 166,276.78 0.68AED AIR ARABIA PJSC 800,334 170,178.19 0.70AED ALDAR PROPERTIES PJSC 305,000 183,515.90 0.75AED ARABTEC HOLDING S.A.L. 645,000 319,604.36 1.31TRY ARCELIK 16,000 82,367.32 0.34MAD ATTIJARIWAFA BANK 342 14,095.96 0.06OMR BANK MUSCAT SAOG 96,000 233,564.06 0.95TRY BIM BIRLESIK MAGAZALAR 3,000 101,997.23 0.42KWD BURGAN BANK 140,000 262,365.49 1.07QAR COMMERCIAL BANK OF QATAR 30,500 724,058.43 2.96EGP COMMERCIAL INTERNATIONAL BANK 100,000 716,924.07 2.93USD DEPA 104,390 75,160.80 0.31QAR DOHA BANK 36,500 563,623.65 2.30MAD DOUJA PROMOTION GROUPE ADDOHA MAROC 6,667 81,231.03 0.33USD DP WORLD 171,597 102,958.20 0.42AED DRAKE & SCULL 850,000 220,080.23 0.90AED DUBAI FINANCIAL MARKET P.J.S.C 410,000 169,671.55 0.69AED DUBAI INVESTMENTS 400,000 94,637.09 0.39EGP EFG-HERMES (reg. shares) 31,000 180,003.04 0.74EGP EL EZZ DEKHEILA STEEL - ALEXANDRIA 1,625 221,538.35 0.90EGP EL EZZ STEEL REBARS 35,000 109,533.42 0.45AED EMAAR PROPERTIES 745,000 734,254.19 3.00AED FIRST GULF BANK 160,000 744,899.50 3.04QAR INDUSTRIES OF QATAR 26,500 933,456.17 3.81KWD KUWAIT FINANCE HOUSE 240,000 1,001,373.39 4.09KWD KUWAIT INVESTMENT PROJECTS 250 402.21 0.00USD MARIDIVE & OIL SERVICES 35,710 124,985.00 0.51MAD MAROC TELECOM 27,200 468,457.25 1.91QAR MASRAF AL RAYAN 125,000 552,962.80 2.26KWD MOBILE TELECOMMUNICATIONS COMPANY
KSC490,000 2,460,295.22 10.04
AED NATIONAL BANK OF ABU DHABI 23,229 77,472.61 0.32KWD NATIONAL BANK OF KUWAIT 428,750 1,940,514.54 7.93KWD NATIONAL MOBILE TELECOMMUNICATIONS 51,500 338,706.06 1.38EGP ORASCOM CONSTRUCTION INDUSTRIES (reg.
shares)13,400 608,437.27 2.49
EGP ORASCOM TELECOM 60,000 43,523.22 0.18USD ORASCOM TELECOM GDR. 75,000 270,000.00 1.10EGP PALM HILLS DEVELOPMENTS 45,000 45,466.22 0.19QAR QATAR ELECTRICITY AND WATER 10,000 323,397.38 1.32QAR QATAR GAS TRANSPORT COMPANY 75,000 416,267.65 1.70QAR QATAR INSURANCE 4,300 95,109.60 0.39QAR QATAR ISLAMIC BANK 30,000 666,028.24 2.72QAR QATAR NATIONAL BANK 39,000 1,866,692.52 7.62QAR QATAR NAVIGATION 5,000 118,560.72 0.48QAR QATAR TELECOM 8,800 436,435.34 1.78OMR RENAISSANCE SERVICE SAOG 85,000 215,188.34 0.88USD SOLIDERE GDR (reg. -S-) 26,000 473,720.00 1.94AED SOROUH REAL ESTATE 300,000 134,768.00 0.55EGP TALAAT MOUSTAFA GROUP HOLDING 280,000 387,840.20 1.58TRY TAV HAVALIMALARI HOLDING 33,000 158,060.88 0.65EGP TELECOM EGYPT 31,424 94,217.51 0.38TRY TURK HAVA YOLLARI 25,000 90,553.64 0.37AED WAHA CAPITAL 400,000 81,677.58 0.33
Securities listed on a stock exchange or other organised markets:Shares (and equity-type securities) 20,887,008.77 85.32
Shares (and equity-type securities) 20,887,008.77 85.32
Securities not listed on stock exchange : Certificates
Certificates
USD CREDIT SUISSE INTERNATIONAL (linked onABDULLAH AL OTHAIM MARKETS) 10-24.08.2011
4,600 86,468.45 0.35
USD CREDIT SUISSE INTERNATIONAL (linked onETIHAD ETISALAT) 09-22.01.2011
32,000 473,536.96 1.93
USD CREDIT SUISSE INTERNATIONAL (linked onMOUWASAT) 09-16.03.2011
5,000 88,988.15 0.36
USD CREDIT SUISSE INTERNATIONAL (linked onNATIONAL BANK OF KUWAIT) 10-05.10.2011
107,000 476,729.94 1.95
USD CREDIT SUISSE INTERNATIONAL (linked onSamba Financial Group Shares) 09-19.02.2011
6,000 92,387.70 0.38
USD CREDIT SUISSE INTERNATIONAL (linked onSAUDI ARABIAN MINING) 09-19.12.2010
31,000 176,056.44 0.72
USD CREDIT SUISSE INTERNATIONAL (linked onSAUDI BASIC INDUSTRIES) 09-19.12.2010
15,000 401,946.45 1.64
USD HSBC BANK (linked on Abdullah Al OthaimMarkets) 08-05.09.2011
11,400 214,291.39 0.88
USD HSBC BANK (linked on AL MOUWASAT MEDICALSERVICES) 09-09.10.2012
32,500 578,422.98 2.37
USD HSBC BANK (linked on ETIHAD ETISALAT) 09-23.01.2012
2,000 29,596.06 0.12
USD HSBC BANK (linked on FAWAZ ABDULAZIZALHOKAIR) 08-05.09.2011
23,218 260,007.01 1.06
USD HSBC BANK (linked on JARIR MARKETING) 08-05.09.2011
2,200 87,841.62 0.36
USD HSBC BANK (linked on MobileTelecommunications) 10-11.10.2013
110,000 222,904.00 0.91
USD HSBC BANK (linked on Samba Financial Group)08-05.09.2011
6,000 92,387.70 0.38
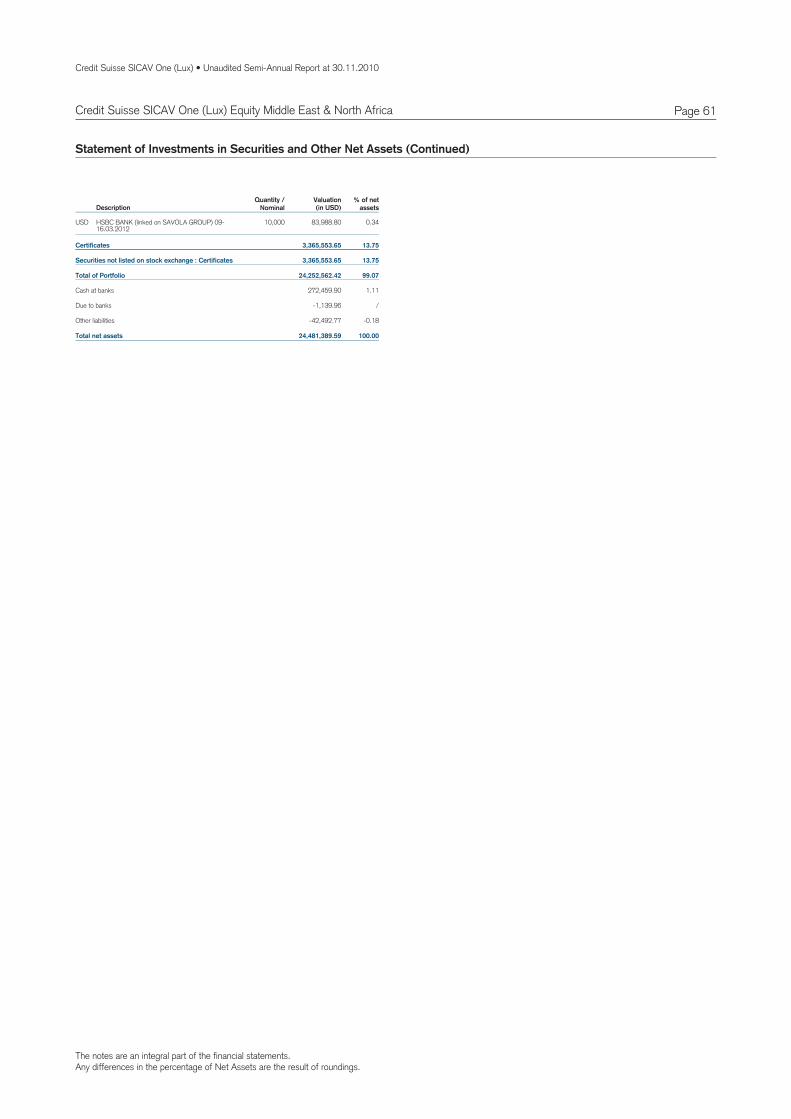
The notes are an integral part of the financial statements.Any differences in the percentage of Net Assets are the result of roundings.
Credit Suisse SICAV One (Lux) • Unaudited Semi-Annual Report at 30.11.2010
Page 61Credit Suisse SICAV One (Lux) Equity Middle East & North Africa
Statement of Investments in Securities and Other Net Assets (Continued)
DescriptionQuantity /
NominalValuation % of net
assets(in USD)
USD HSBC BANK (linked on SAVOLA GROUP) 09-16.03.2012
10,000 83,988.80 0.34
Securities not listed on stock exchange : Certificates 3,365,553.65 13.75
Certificates 3,365,553.65 13.75
Total of Portfolio 24,252,562.42 99.07
Cash at banks 272,459.90 1.11
Due to banks -1,139.96 /
Other liabilities -42,492.77 -0.18
Total net assets 24,481,389.59 100.00
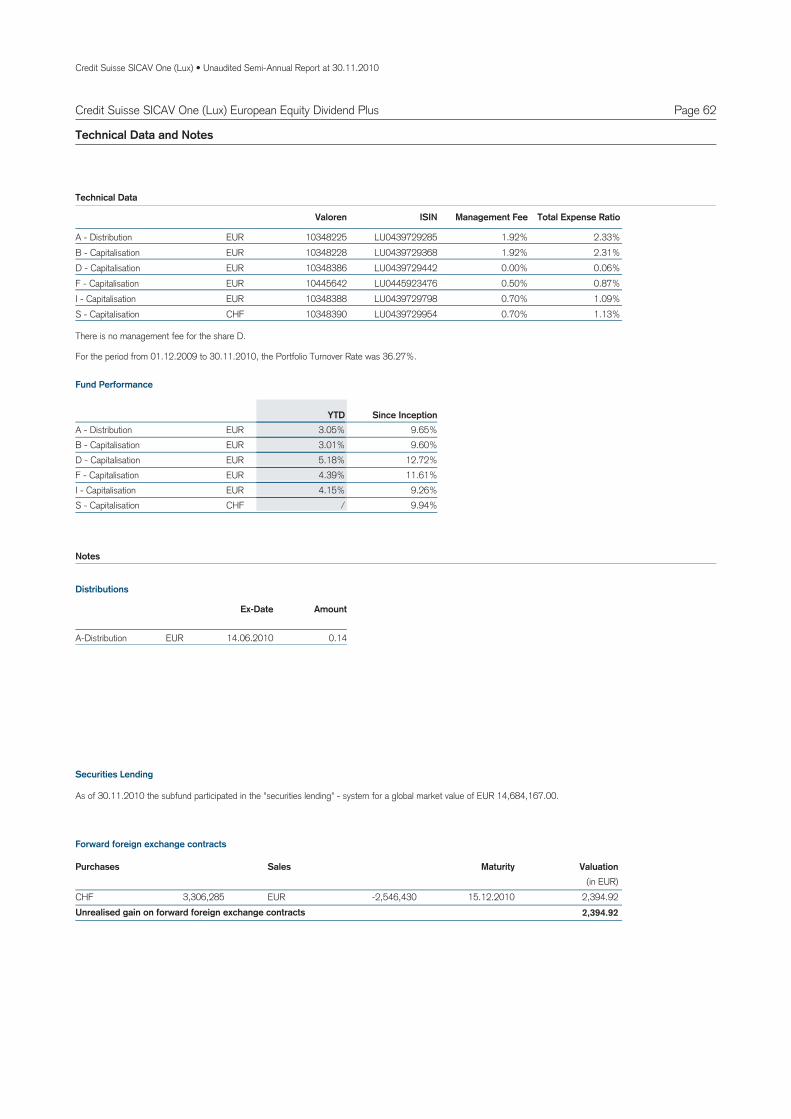
Credit Suisse SICAV One (Lux) • Unaudited Semi-Annual Report at 30.11.2010
Page 62Credit Suisse SICAV One (Lux) European Equity Dividend Plus
Technical Data and Notes
EURA 10348225 LU0439729285 1.92% 2.33%Distribution -
Valoren ISIN Management Fee Total Expense Ratio
EURB 10348228 LU0439729368 1.92% 2.31%Capitalisation - EURD 10348386 LU0439729442 0.00% 0.06%Capitalisation - EURF 10445642 LU0445923476 0.50% 0.87%Capitalisation - EURI 10348388 LU0439729798 0.70% 1.09%Capitalisation - CHFS 10348390 LU0439729954 0.70% 1.13%Capitalisation -
Technical Data
EURA 9.65%3.05%Distribution - YTD Since Inception
EURB 9.60%3.01%Capitalisation - EURD 12.72%5.18%Capitalisation - EURF 11.61%4.39%Capitalisation - EURI 9.26%4.15%Capitalisation - CHFS 9.94%/Capitalisation -
Fund Performance
For the period from 01.12.2009 to 30.11.2010, the Portfolio Turnover Rate was 36.27%.
Notes
There is no management fee for the share D.
A Distribution- EUR 14.06.2010 0.14
Ex-Date Amount
Distributions
As of 30.11.2010 the subfund participated in the "securities lending" - system for a global market value of EUR 14,684,167.00.
Securities Lending
3,306,285CHF EUR -2,546,430 2,394.9215.12.20102,394.92Unrealised gain on forward foreign exchange contracts
SalesPurchases Valuation(in EUR)
Maturity
Forward foreign exchange contracts
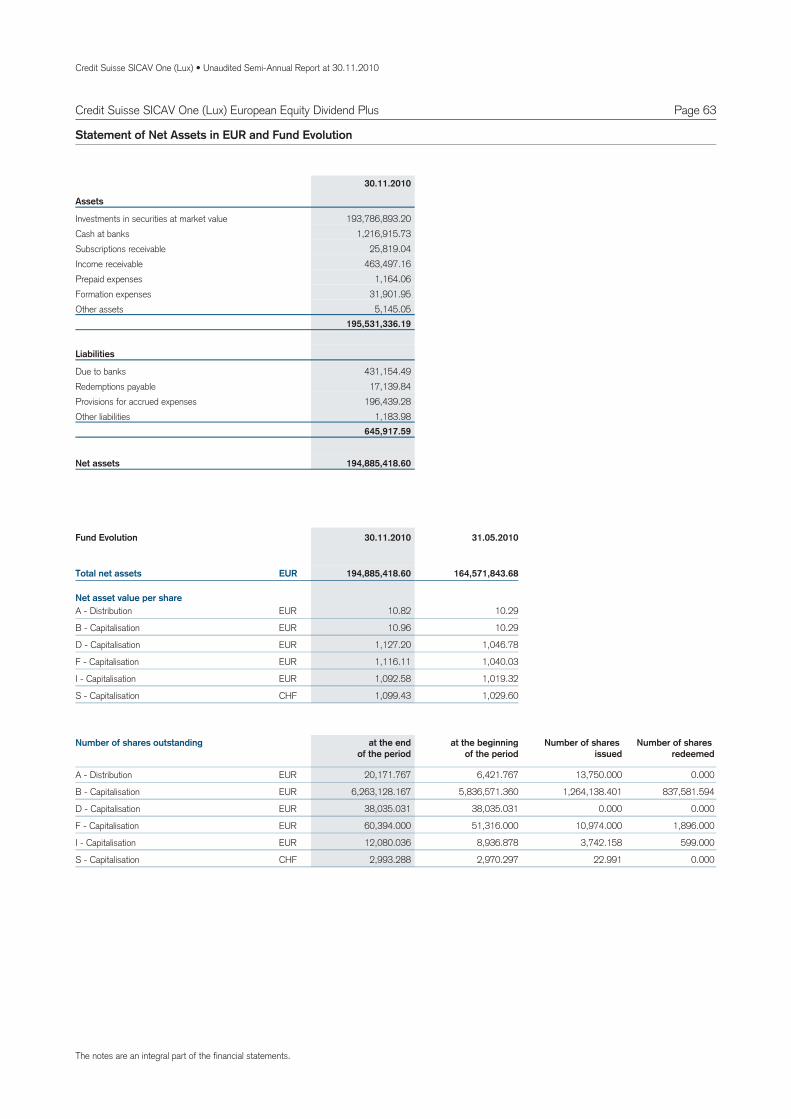
Credit Suisse SICAV One (Lux) • Unaudited Semi-Annual Report at 30.11.2010
Page 63
Assets
Investments in securities at market value 193,786,893.20Cash at banks 1,216,915.73Subscriptions receivable 25,819.04Income receivable 463,497.16Prepaid expenses 1,164.06Formation expenses 31,901.95Other assets 5,145.05
195,531,336.19
Liabilities
Due to banks 431,154.49Redemptions payable 17,139.84Provisions for accrued expenses 196,439.28Other liabilities 1,183.98
645,917.59
194,885,418.60Net assets
Statement of Net Assets in EUR and Fund Evolution
30.11.2010
10.82EURA 10.29Distribution -
10.96EURB 10.29Capitalisation -
1,127.20EURD 1,046.78Capitalisation -
1,116.11EURF 1,040.03Capitalisation -
1,092.58EURI 1,019.32Capitalisation -
1,099.43CHFS 1,029.60Capitalisation -
Total net assets
Net asset value per share
194,885,418.60 164,571,843.68EUR
Fund Evolution 30.11.2010 31.05.2010
20,171.767 13,750.000A 6,421.767 0.000Distribution - EUR
6,263,128.167 1,264,138.401B 5,836,571.360 837,581.594Capitalisation - EUR
38,035.031 0.000D 38,035.031 0.000Capitalisation - EUR
60,394.000 10,974.000F 51,316.000 1,896.000Capitalisation - EUR
12,080.036 3,742.158I 8,936.878 599.000Capitalisation - EUR
2,993.288 22.991S 2,970.297 0.000Capitalisation - CHF
Number of shares outstanding at the endof the period
at the beginningof the period
Number of shares issued
Number of shares redeemed
Credit Suisse SICAV One (Lux) European Equity Dividend Plus
The notes are an integral part of the financial statements.
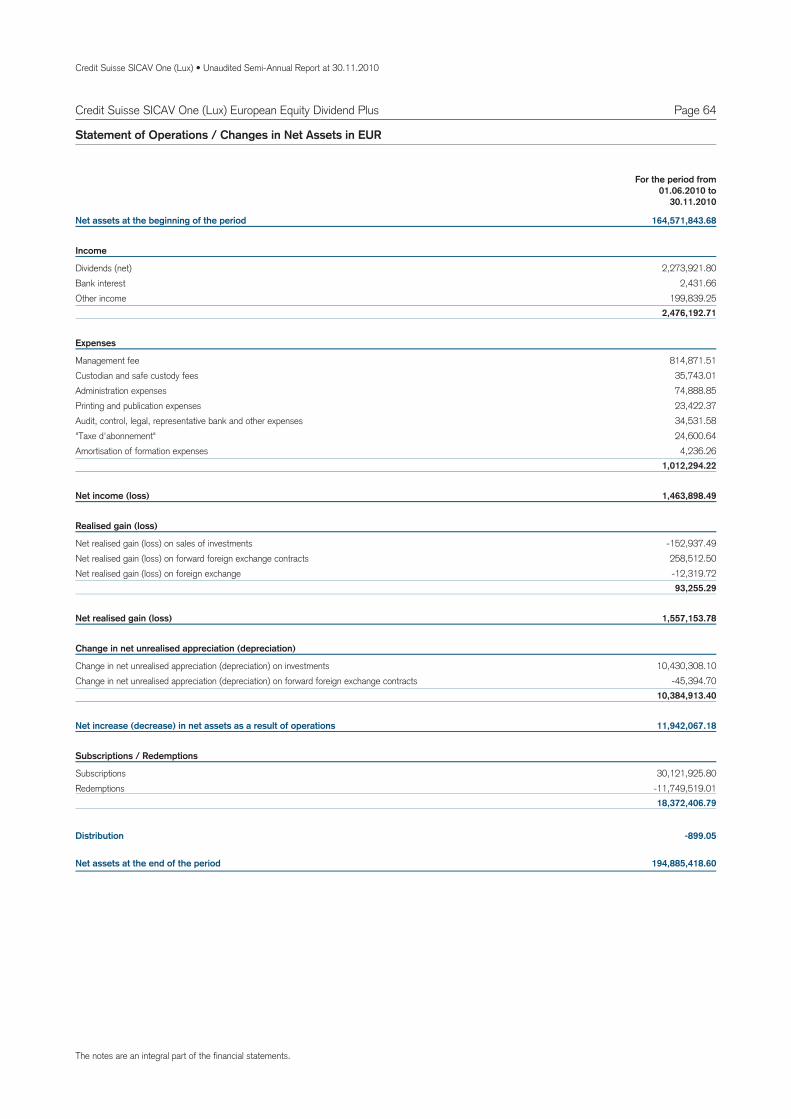
Credit Suisse SICAV One (Lux) • Unaudited Semi-Annual Report at 30.11.2010
Page 64Credit Suisse SICAV One (Lux) European Equity Dividend Plus
Net assets at the beginning of the period 164,571,843.68
Income
Dividends (net) 2,273,921.80Bank interest 2,431.66Other income 199,839.25
2,476,192.71
Expenses
Management fee 814,871.51Custodian and safe custody fees 35,743.01Administration expenses 74,888.85Printing and publication expenses 23,422.37Audit, control, legal, representative bank and other expenses 34,531.58"Taxe d'abonnement" 24,600.64Amortisation of formation expenses 4,236.26
1,012,294.22
Net income (loss) 1,463,898.49
Realised gain (loss)
Net realised gain (loss) on sales of investments -152,937.49Net realised gain (loss) on forward foreign exchange contracts 258,512.50Net realised gain (loss) on foreign exchange -12,319.72
93,255.29
Net realised gain (loss) 1,557,153.78
Change in net unrealised appreciation (depreciation)
Change in net unrealised appreciation (depreciation) on investments 10,430,308.10Change in net unrealised appreciation (depreciation) on forward foreign exchange contracts -45,394.70
10,384,913.40
Net increase (decrease) in net assets as a result of operations 11,942,067.18
Subscriptions / Redemptions
Subscriptions 30,121,925.80Redemptions -11,749,519.01
18,372,406.79
Distribution -899.05
Net assets at the end of the period 194,885,418.60
Statement of Operations / Changes in Net Assets in EUR
For the period from01.06.2010 to
30.11.2010
The notes are an integral part of the financial statements.
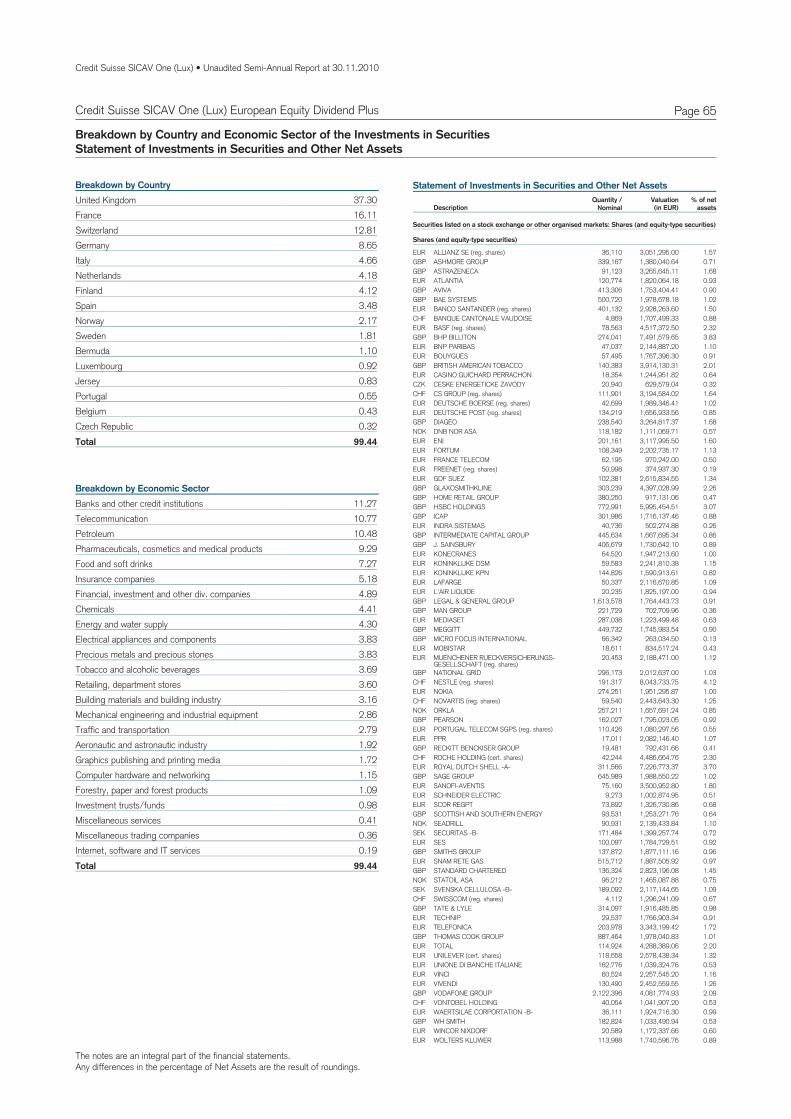
The notes are an integral part of the financial statements.Any differences in the percentage of Net Assets are the result of roundings.
Credit Suisse SICAV One (Lux) • Unaudited Semi-Annual Report at 30.11.2010
Page 65Credit Suisse SICAV One (Lux) European Equity Dividend Plus
Breakdown by Country and Economic Sector of the Investments in SecuritiesStatement of Investments in Securities and Other Net Assets
37.30United KingdomBreakdown by Country
16.11France12.81Switzerland8.65Germany4.66Italy4.18Netherlands4.12Finland3.48Spain2.17Norway1.81Sweden1.10Bermuda0.92Luxembourg0.83Jersey0.55Portugal0.43Belgium0.32Czech Republic
99.44Total
11.27Banks and other credit institutionsBreakdown by Economic Sector
10.77Telecommunication10.48Petroleum9.29Pharmaceuticals, cosmetics and medical products7.27Food and soft drinks5.18Insurance companies4.89Financial, investment and other div. companies4.41Chemicals4.30Energy and water supply3.83Electrical appliances and components3.83Precious metals and precious stones3.69Tobacco and alcoholic beverages3.60Retailing, department stores3.16Building materials and building industry2.86Mechanical engineering and industrial equipment2.79Traffic and transportation1.92Aeronautic and astronautic industry1.72Graphics publishing and printing media1.15Computer hardware and networking1.09Forestry, paper and forest products0.98Investment trusts/funds0.41Miscellaneous services0.36Miscellaneous trading companies0.19Internet, software and IT services
99.44Total
Statement of Investments in Securities and Other Net Assets
DescriptionQuantity /
NominalValuation % of net
assets(in EUR)
Securities listed on a stock exchange or other organised markets: Shares (and equity-type securities)
Shares (and equity-type securities)
EUR ALLIANZ SE (reg. shares) 36,110 3,051,295.00 1.57GBP ASHMORE GROUP 339,167 1,380,040.64 0.71GBP ASTRAZENECA 91,123 3,265,645.11 1.68EUR ATLANTIA 120,774 1,820,064.18 0.93GBP AVIVA 413,306 1,753,404.41 0.90GBP BAE SYSTEMS 500,720 1,978,678.18 1.02EUR BANCO SANTANDER (reg. shares) 401,132 2,928,263.60 1.50CHF BANQUE CANTONALE VAUDOISE 4,869 1,707,499.33 0.88EUR BASF (reg. shares) 78,563 4,517,372.50 2.32GBP BHP BILLITON 274,041 7,491,579.65 3.83EUR BNP PARIBAS 47,037 2,144,887.20 1.10EUR BOUYGUES 57,495 1,767,396.30 0.91GBP BRITISH AMERICAN TOBACCO 140,383 3,914,130.31 2.01EUR CASINO GUICHARD PERRACHON 18,354 1,244,951.82 0.64CZK CESKE ENERGETICKE ZAVODY 20,940 629,579.04 0.32CHF CS GROUP (reg. shares) 111,901 3,194,584.02 1.64EUR DEUTSCHE BOERSE (reg. shares) 42,699 1,989,346.41 1.02EUR DEUTSCHE POST (reg. shares) 134,219 1,656,933.56 0.85GBP DIAGEO 238,540 3,264,817.37 1.68NOK DNB NOR ASA 118,182 1,111,069.71 0.57EUR ENI 201,161 3,117,995.50 1.60EUR FORTUM 108,349 2,202,735.17 1.13EUR FRANCE TELECOM 62,195 970,242.00 0.50EUR FREENET (reg. shares) 50,998 374,937.30 0.19EUR GDF SUEZ 102,381 2,615,834.55 1.34GBP GLAXOSMITHKLINE 303,239 4,397,028.99 2.26GBP HOME RETAIL GROUP 380,250 917,131.06 0.47GBP HSBC HOLDINGS 772,991 5,995,454.51 3.07GBP ICAP 301,986 1,716,137.46 0.88EUR INDRA SISTEMAS 40,736 502,274.88 0.26GBP INTERMEDIATE CAPITAL GROUP 445,634 1,667,695.34 0.86GBP J. SAINSBURY 406,679 1,730,642.10 0.89EUR KONECRANES 64,520 1,947,213.60 1.00EUR KONINKLIJKE DSM 59,583 2,241,810.38 1.15EUR KONINKLIJKE KPN 144,826 1,590,913.61 0.82EUR LAFARGE 50,337 2,116,670.85 1.09EUR L'AIR LIQUIDE 20,235 1,825,197.00 0.94GBP LEGAL & GENERAL GROUP 1,613,578 1,764,443.73 0.91GBP MAN GROUP 221,729 702,709.96 0.36EUR MEDIASET 287,038 1,223,499.48 0.63GBP MEGGITT 449,732 1,745,983.54 0.90GBP MICRO FOCUS INTERNATIONAL 66,342 263,034.50 0.13EUR MOBISTAR 18,611 834,517.24 0.43EUR MUENCHENER RUECKVERSICHERUNGS-
GESELLSCHAFT (reg. shares)20,453 2,188,471.00 1.12
GBP NATIONAL GRID 296,173 2,012,637.00 1.03CHF NESTLE (reg. shares) 191,317 8,043,733.75 4.12EUR NOKIA 274,251 1,951,295.87 1.00CHF NOVARTIS (reg. shares) 59,540 2,443,643.30 1.25NOK ORKLA 257,211 1,657,691.24 0.85GBP PEARSON 162,027 1,795,023.05 0.92EUR PORTUGAL TELECOM SGPS (reg. shares) 110,426 1,080,297.56 0.55EUR PPR 17,011 2,082,146.40 1.07GBP RECKITT BENCKISER GROUP 19,481 792,431.66 0.41CHF ROCHE HOLDING (cert. shares) 42,244 4,486,664.76 2.30EUR ROYAL DUTCH SHELL -A- 311,566 7,226,773.37 3.70GBP SAGE GROUP 645,989 1,988,550.22 1.02EUR SANOFI-AVENTIS 75,160 3,500,952.80 1.80EUR SCHNEIDER ELECTRIC 9,273 1,002,874.95 0.51EUR SCOR REGPT 73,892 1,326,730.86 0.68GBP SCOTTISH AND SOUTHERN ENERGY 93,531 1,253,271.76 0.64NOK SEADRILL 90,931 2,139,433.84 1.10SEK SECURITAS -B- 171,484 1,399,257.74 0.72EUR SES 100,097 1,784,729.51 0.92GBP SMITHS GROUP 137,872 1,877,111.16 0.96EUR SNAM RETE GAS 515,712 1,887,505.92 0.97GBP STANDARD CHARTERED 136,324 2,823,196.08 1.45NOK STATOIL ASA 96,212 1,465,087.88 0.75SEK SVENSKA CELLULOSA -B- 189,092 2,117,144.65 1.09CHF SWISSCOM (reg. shares) 4,112 1,296,241.09 0.67GBP TATE & LYLE 314,097 1,916,485.85 0.98EUR TECHNIP 29,537 1,766,903.34 0.91EUR TELEFONICA 203,978 3,343,199.42 1.72GBP THOMAS COOK GROUP 887,464 1,978,040.83 1.01EUR TOTAL 114,924 4,288,389.06 2.20EUR UNILEVER (cert. shares) 118,658 2,578,438.34 1.32EUR UNIONE DI BANCHE ITALIANE 162,776 1,039,324.76 0.53EUR VINCI 60,524 2,257,545.20 1.16EUR VIVENDI 130,490 2,452,559.55 1.26GBP VODAFONE GROUP 2,122,396 4,081,774.93 2.09CHF VONTOBEL HOLDING 40,054 1,041,907.20 0.53EUR WAERTSILAE CORPORTATION -B- 36,111 1,924,716.30 0.99GBP WH SMITH 182,824 1,033,490.94 0.53EUR WINCOR NIXDORF 20,589 1,172,337.66 0.60EUR WOLTERS KLUWER 113,988 1,740,596.76 0.89
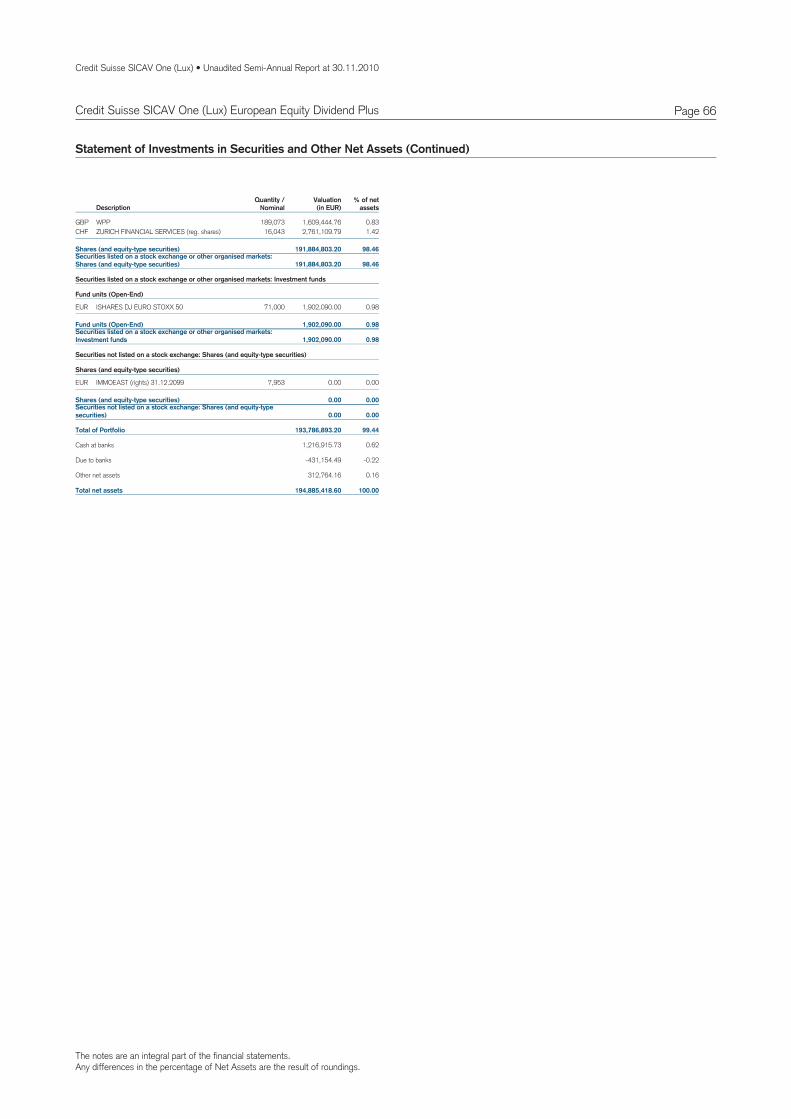
The notes are an integral part of the financial statements.Any differences in the percentage of Net Assets are the result of roundings.
Credit Suisse SICAV One (Lux) • Unaudited Semi-Annual Report at 30.11.2010
Page 66Credit Suisse SICAV One (Lux) European Equity Dividend Plus
Statement of Investments in Securities and Other Net Assets (Continued)
DescriptionQuantity /
NominalValuation % of net
assets(in EUR)
GBP WPP 189,073 1,609,444.76 0.83CHF ZURICH FINANCIAL SERVICES (reg. shares) 16,043 2,761,109.79 1.42
Securities listed on a stock exchange or other organised markets:Shares (and equity-type securities) 191,884,803.20 98.46
Shares (and equity-type securities) 191,884,803.20 98.46
Securities listed on a stock exchange or other organised markets: Investment funds
Fund units (Open-End)
EUR ISHARES DJ EURO STOXX 50 71,000 1,902,090.00 0.98
Securities listed on a stock exchange or other organised markets:Investment funds 1,902,090.00 0.98
Fund units (Open-End) 1,902,090.00 0.98
Securities not listed on a stock exchange: Shares (and equity-type securities)
Shares (and equity-type securities)
EUR IMMOEAST (rights) 31.12.2099 7,953 0.00 0.00
Securities not listed on a stock exchange: Shares (and equity-typesecurities) 0.00 0.00
Shares (and equity-type securities) 0.00 0.00
Total of Portfolio 193,786,893.20 99.44
Cash at banks 1,216,915.73 0.62
Due to banks -431,154.49 -0.22
Other net assets 312,764.16 0.16
Total net assets 194,885,418.60 100.00
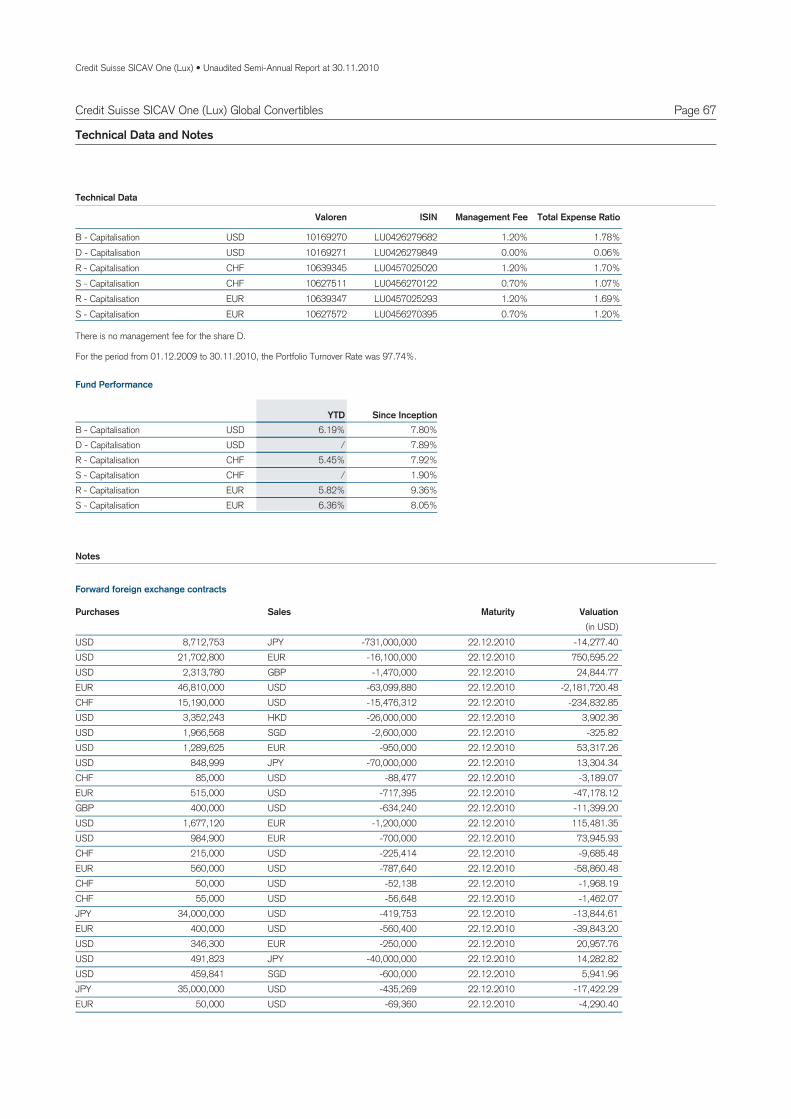
Credit Suisse SICAV One (Lux) • Unaudited Semi-Annual Report at 30.11.2010
Page 67Credit Suisse SICAV One (Lux) Global Convertibles
Technical Data and Notes
USDB 10169270 LU0426279682 1.20% 1.78%Capitalisation -
Valoren ISIN Management Fee Total Expense Ratio
USDD 10169271 LU0426279849 0.00% 0.06%Capitalisation - CHFR 10639345 LU0457025020 1.20% 1.70%Capitalisation - CHFS 10627511 LU0456270122 0.70% 1.07%Capitalisation - EURR 10639347 LU0457025293 1.20% 1.69%Capitalisation - EURS 10627572 LU0456270395 0.70% 1.20%Capitalisation -
Technical Data
USDB 7.80%6.19%Capitalisation - YTD Since Inception
USDD 7.89%/Capitalisation - CHFR 7.92%5.45%Capitalisation - CHFS 1.90%/Capitalisation - EURR 9.36%5.82%Capitalisation - EURS 8.05%6.36%Capitalisation -
Fund Performance
For the period from 01.12.2009 to 30.11.2010, the Portfolio Turnover Rate was 97.74%.
Notes
There is no management fee for the share D.
8,712,753USD JPY -731,000,000 -14,277.4022.12.201021,702,800USD EUR -16,100,000 750,595.2222.12.20102,313,780USD GBP -1,470,000 24,844.7722.12.2010
46,810,000EUR USD -63,099,880 -2,181,720.4822.12.201015,190,000CHF USD -15,476,312 -234,832.8522.12.20103,352,243USD HKD -26,000,000 3,902.3622.12.20101,966,568USD SGD -2,600,000 -325.8222.12.20101,289,625USD EUR -950,000 53,317.2622.12.2010
848,999USD JPY -70,000,000 13,304.3422.12.201085,000CHF USD -88,477 -3,189.0722.12.2010
515,000EUR USD -717,395 -47,178.1222.12.2010400,000GBP USD -634,240 -11,399.2022.12.2010
1,677,120USD EUR -1,200,000 115,481.3522.12.2010984,900USD EUR -700,000 73,945.9322.12.2010215,000CHF USD -225,414 -9,685.4822.12.2010560,000EUR USD -787,640 -58,860.4822.12.201050,000CHF USD -52,138 -1,968.1922.12.201055,000CHF USD -56,648 -1,462.0722.12.2010
34,000,000JPY USD -419,753 -13,844.6122.12.2010400,000EUR USD -560,400 -39,843.2022.12.2010346,300USD EUR -250,000 20,957.7622.12.2010491,823USD JPY -40,000,000 14,282.8222.12.2010459,841USD SGD -600,000 5,941.9622.12.2010
35,000,000JPY USD -435,269 -17,422.2922.12.201050,000EUR USD -69,360 -4,290.4022.12.2010
SalesPurchases Valuation(in USD)
Maturity
Forward foreign exchange contracts
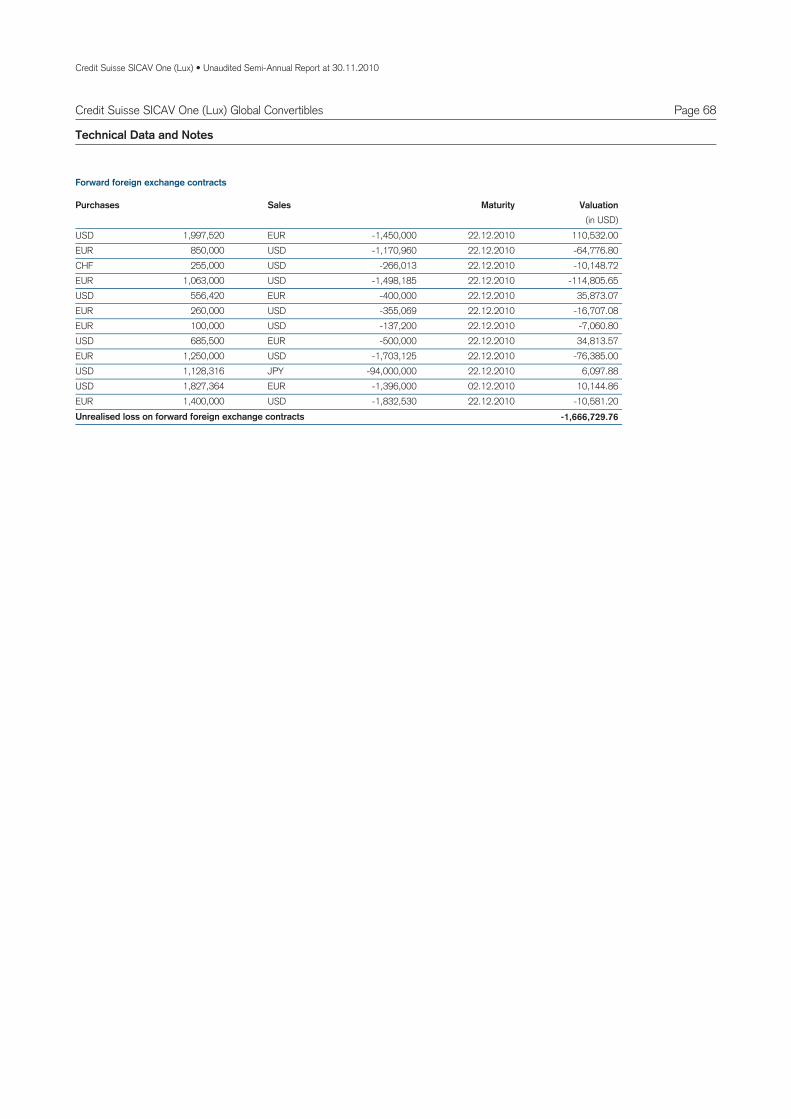
Credit Suisse SICAV One (Lux) • Unaudited Semi-Annual Report at 30.11.2010
Page 68Credit Suisse SICAV One (Lux) Global Convertibles
Technical Data and Notes
1,997,520USD EUR -1,450,000 110,532.0022.12.2010850,000EUR USD -1,170,960 -64,776.8022.12.2010255,000CHF USD -266,013 -10,148.7222.12.2010
1,063,000EUR USD -1,498,185 -114,805.6522.12.2010556,420USD EUR -400,000 35,873.0722.12.2010260,000EUR USD -355,069 -16,707.0822.12.2010100,000EUR USD -137,200 -7,060.8022.12.2010685,500USD EUR -500,000 34,813.5722.12.2010
1,250,000EUR USD -1,703,125 -76,385.0022.12.20101,128,316USD JPY -94,000,000 6,097.8822.12.20101,827,364USD EUR -1,396,000 10,144.8602.12.20101,400,000EUR USD -1,832,530 -10,581.2022.12.2010
-1,666,729.76Unrealised loss on forward foreign exchange contracts
SalesPurchases Valuation(in USD)
Maturity
Forward foreign exchange contracts
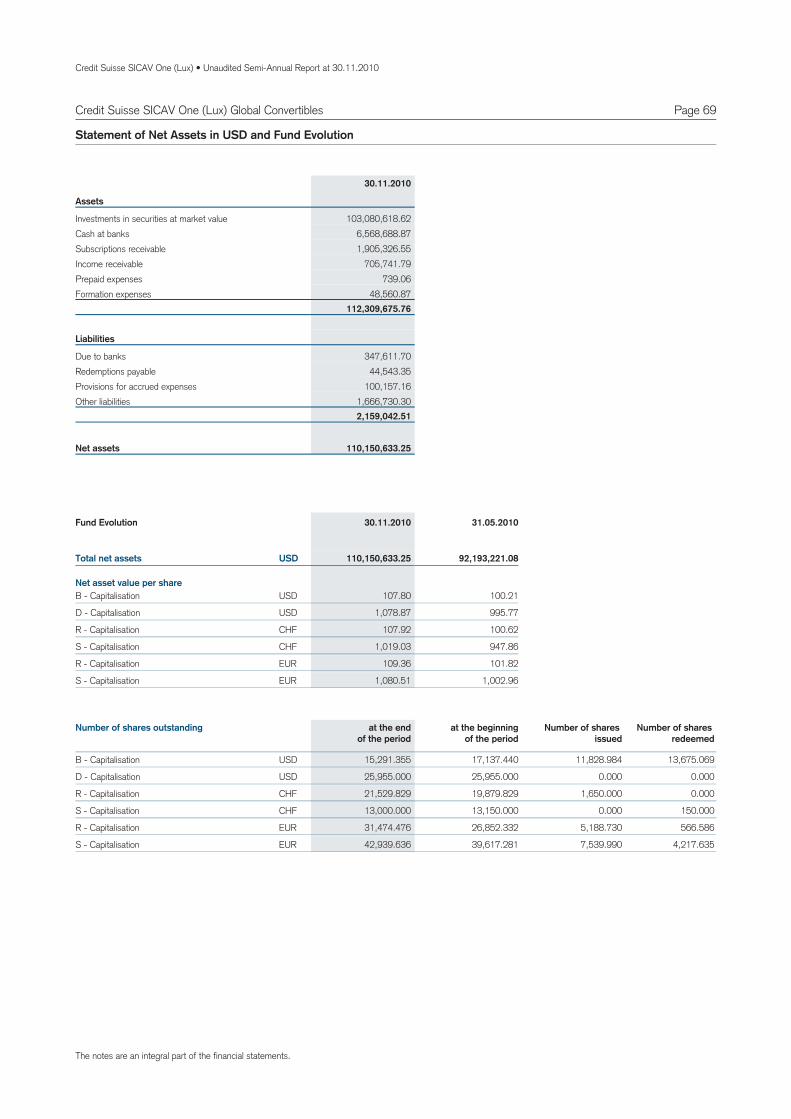
Credit Suisse SICAV One (Lux) • Unaudited Semi-Annual Report at 30.11.2010
Page 69
Assets
Investments in securities at market value 103,080,618.62Cash at banks 6,568,688.87Subscriptions receivable 1,905,326.55Income receivable 705,741.79Prepaid expenses 739.06Formation expenses 48,560.87
112,309,675.76
Liabilities
Due to banks 347,611.70Redemptions payable 44,543.35Provisions for accrued expenses 100,157.16Other liabilities 1,666,730.30
2,159,042.51
110,150,633.25Net assets
Statement of Net Assets in USD and Fund Evolution
30.11.2010
107.80USDB 100.21Capitalisation -
1,078.87USDD 995.77Capitalisation -
107.92CHFR 100.62Capitalisation -
1,019.03CHFS 947.86Capitalisation -
109.36EURR 101.82Capitalisation -
1,080.51EURS 1,002.96Capitalisation -
Total net assets
Net asset value per share
110,150,633.25 92,193,221.08USD
Fund Evolution 30.11.2010 31.05.2010
15,291.355 11,828.984B 17,137.440 13,675.069Capitalisation - USD
25,955.000 0.000D 25,955.000 0.000Capitalisation - USD
21,529.829 1,650.000R 19,879.829 0.000Capitalisation - CHF
13,000.000 0.000S 13,150.000 150.000Capitalisation - CHF
31,474.476 5,188.730R 26,852.332 566.586Capitalisation - EUR
42,939.636 7,539.990S 39,617.281 4,217.635Capitalisation - EUR
Number of shares outstanding at the endof the period
at the beginningof the period
Number of shares issued
Number of shares redeemed
Credit Suisse SICAV One (Lux) Global Convertibles
The notes are an integral part of the financial statements.
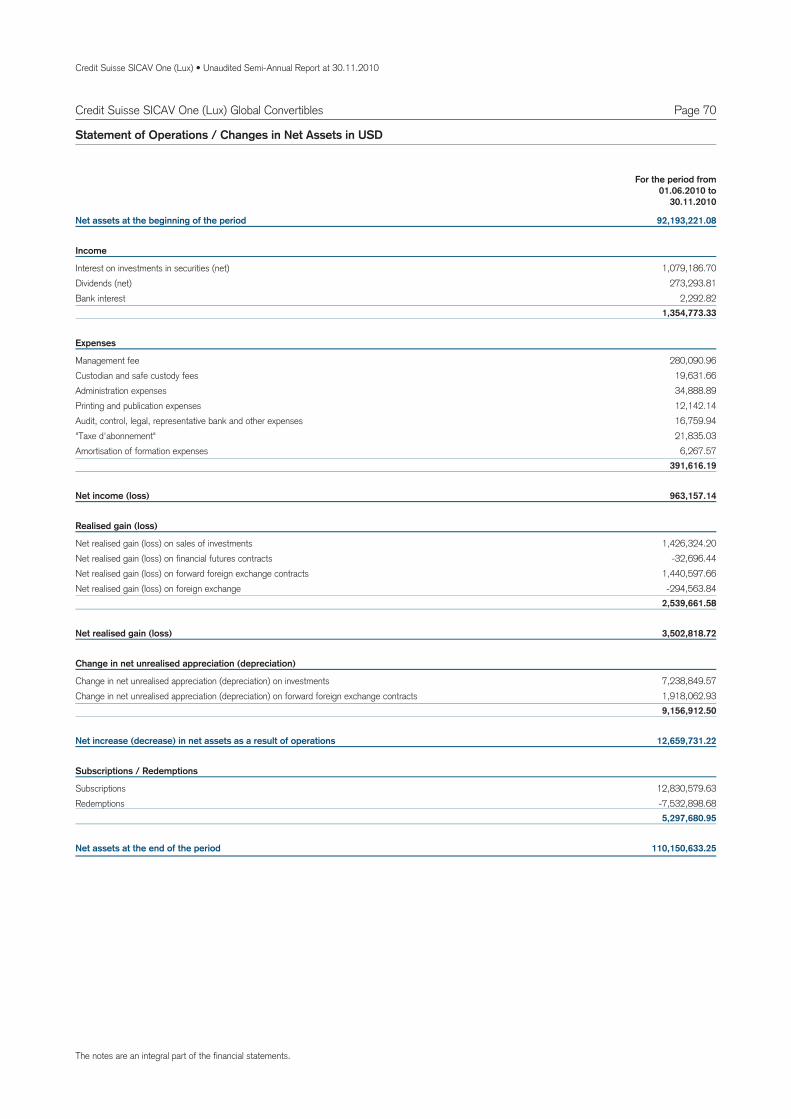
Credit Suisse SICAV One (Lux) • Unaudited Semi-Annual Report at 30.11.2010
Page 70Credit Suisse SICAV One (Lux) Global Convertibles
Net assets at the beginning of the period 92,193,221.08
Income
Interest on investments in securities (net) 1,079,186.70Dividends (net) 273,293.81Bank interest 2,292.82
1,354,773.33
Expenses
Management fee 280,090.96Custodian and safe custody fees 19,631.66Administration expenses 34,888.89Printing and publication expenses 12,142.14Audit, control, legal, representative bank and other expenses 16,759.94"Taxe d'abonnement" 21,835.03Amortisation of formation expenses 6,267.57
391,616.19
Net income (loss) 963,157.14
Realised gain (loss)
Net realised gain (loss) on sales of investments 1,426,324.20Net realised gain (loss) on financial futures contracts -32,696.44Net realised gain (loss) on forward foreign exchange contracts 1,440,597.66Net realised gain (loss) on foreign exchange -294,563.84
2,539,661.58
Net realised gain (loss) 3,502,818.72
Change in net unrealised appreciation (depreciation)
Change in net unrealised appreciation (depreciation) on investments 7,238,849.57Change in net unrealised appreciation (depreciation) on forward foreign exchange contracts 1,918,062.93
9,156,912.50
Net increase (decrease) in net assets as a result of operations 12,659,731.22
Subscriptions / Redemptions
Subscriptions 12,830,579.63Redemptions -7,532,898.68
5,297,680.95
Net assets at the end of the period 110,150,633.25
Statement of Operations / Changes in Net Assets in USD
For the period from01.06.2010 to
30.11.2010
The notes are an integral part of the financial statements.
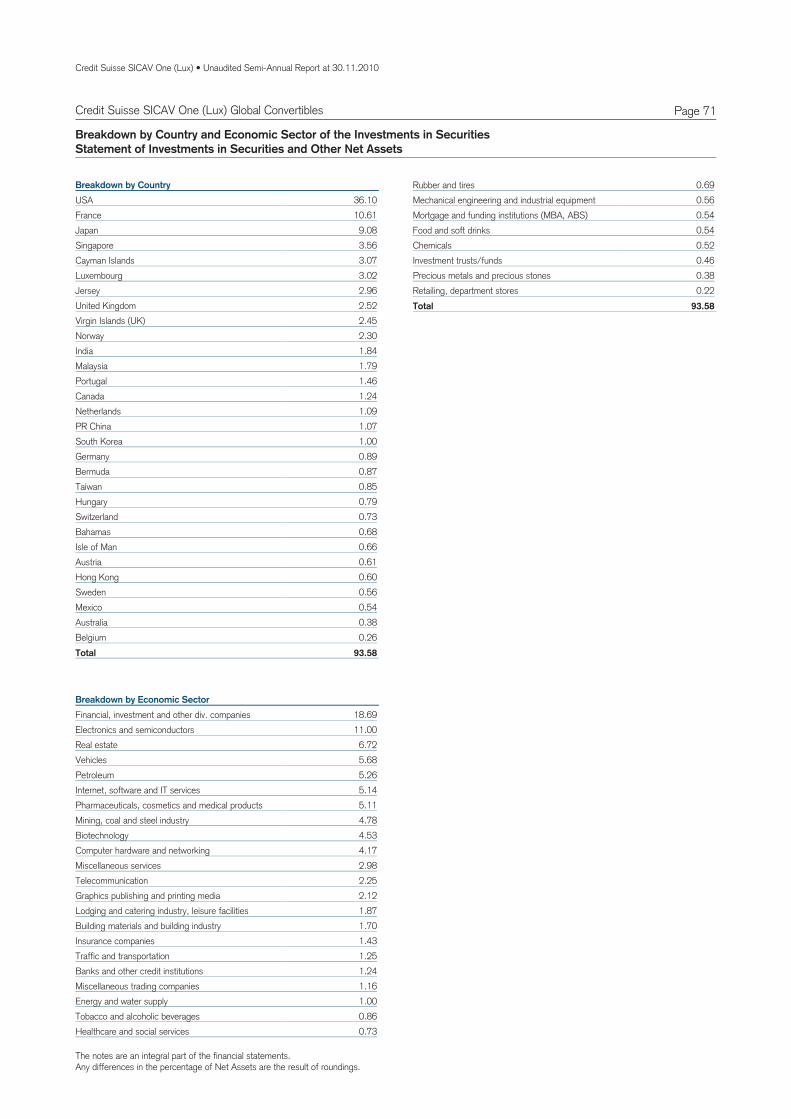
The notes are an integral part of the financial statements.Any differences in the percentage of Net Assets are the result of roundings.
Credit Suisse SICAV One (Lux) • Unaudited Semi-Annual Report at 30.11.2010
Page 71Credit Suisse SICAV One (Lux) Global Convertibles
Breakdown by Country and Economic Sector of the Investments in SecuritiesStatement of Investments in Securities and Other Net Assets
36.10USABreakdown by Country
10.61France9.08Japan3.56Singapore3.07Cayman Islands3.02Luxembourg2.96Jersey2.52United Kingdom2.45Virgin Islands (UK)2.30Norway1.84India1.79Malaysia1.46Portugal1.24Canada1.09Netherlands1.07PR China1.00South Korea0.89Germany0.87Bermuda0.85Taiwan0.79Hungary0.73Switzerland0.68Bahamas0.66Isle of Man0.61Austria0.60Hong Kong0.56Sweden0.54Mexico0.38Australia0.26Belgium
93.58Total
18.69Financial, investment and other div. companiesBreakdown by Economic Sector
11.00Electronics and semiconductors6.72Real estate5.68Vehicles5.26Petroleum5.14Internet, software and IT services5.11Pharmaceuticals, cosmetics and medical products4.78Mining, coal and steel industry4.53Biotechnology4.17Computer hardware and networking2.98Miscellaneous services2.25Telecommunication2.12Graphics publishing and printing media1.87Lodging and catering industry, leisure facilities1.70Building materials and building industry1.43Insurance companies1.25Traffic and transportation1.24Banks and other credit institutions1.16Miscellaneous trading companies1.00Energy and water supply0.86Tobacco and alcoholic beverages0.73Healthcare and social services
0.69Rubber and tires0.56Mechanical engineering and industrial equipment0.54Mortgage and funding institutions (MBA, ABS)0.54Food and soft drinks0.52Chemicals0.46Investment trusts/funds0.38Precious metals and precious stones0.22Retailing, department stores
93.58Total
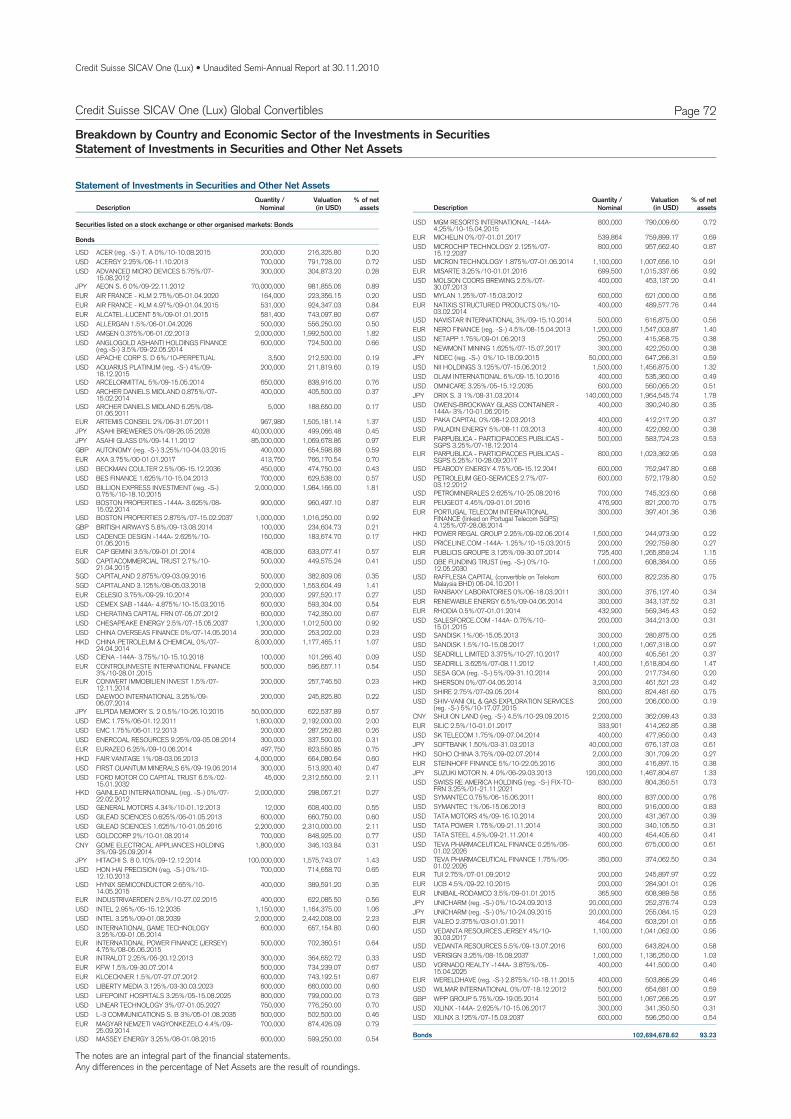
The notes are an integral part of the financial statements.Any differences in the percentage of Net Assets are the result of roundings.
Credit Suisse SICAV One (Lux) • Unaudited Semi-Annual Report at 30.11.2010
Page 72Credit Suisse SICAV One (Lux) Global Convertibles
Breakdown by Country and Economic Sector of the Investments in SecuritiesStatement of Investments in Securities and Other Net Assets
Statement of Investments in Securities and Other Net Assets
DescriptionQuantity /
NominalValuation % of net
assets(in USD)
Securities listed on a stock exchange or other organised markets: Bonds
Bonds
USD ACER (reg. -S-) T. A 0%/10-10.08.2015 200,000 216,325.80 0.20USD ACERGY 2.25%/06-11.10.2013 700,000 791,728.00 0.72USD ADVANCED MICRO DEVICES 5.75%/07-
15.08.2012300,000 304,873.20 0.28
JPY AEON S. 6 0%/09-22.11.2012 70,000,000 981,855.06 0.89EUR AIR FRANCE - KLM 2.75%/05-01.04.2020 164,000 223,356.15 0.20EUR AIR FRANCE - KLM 4.97%/09-01.04.2015 531,000 924,347.03 0.84EUR ALCATEL-LUCENT 5%/09-01.01.2015 581,400 743,097.80 0.67USD ALLERGAN 1.5%/06-01.04.2026 500,000 556,250.00 0.50USD AMGEN 0.375%/06-01.02.2013 2,000,000 1,992,500.00 1.82USD ANGLOGOLD ASHANTI HOLDINGS FINANCE
(reg.-S-) 3.5%/09-22.05.2014600,000 724,500.00 0.66
USD APACHE CORP S. D 6%/10-PERPETUAL 3,500 212,520.00 0.19USD AQUARIUS PLATINUM (reg. -S-) 4%/09-
18.12.2015200,000 211,819.60 0.19
USD ARCELORMITTAL 5%/09-15.05.2014 650,000 838,916.00 0.76USD ARCHER DANIELS MIDLAND 0.875%/07-
15.02.2014400,000 405,500.00 0.37
USD ARCHER DANIELS MIDLAND 6.25%/08-01.06.2011
5,000 188,650.00 0.17
EUR ARTEMIS CONSEIL 2%/06-31.07.2011 967,980 1,505,181.14 1.37JPY ASAHI BREWERIES 0%/08-26.05.2028 40,000,000 499,066.48 0.45JPY ASAHI GLASS 0%/09-14.11.2012 85,000,000 1,069,678.86 0.97GBP AUTONOMY (reg. -S-) 3.25%/10-04.03.2015 400,000 654,598.88 0.59EUR AXA 3.75%/00-01.01.2017 413,750 766,170.54 0.70USD BECKMAN COULTER 2.5%/06-15.12.2036 450,000 474,750.00 0.43USD BES FINANCE 1.625%/10-15.04.2013 700,000 629,538.00 0.57USD BILLION EXPRESS INVESTMENT (reg. -S-)
0.75%/10-18.10.20152,000,000 1,984,166.00 1.81
USD BOSTON PROPERTIES -144A- 3.625%/08-15.02.2014
900,000 960,497.10 0.87
USD BOSTON PROPERTIES 2.875%/07-15.02.2037 1,000,000 1,016,250.00 0.92GBP BRITISH AIRWAYS 5.8%/09-13.08.2014 100,000 234,604.73 0.21USD CADENCE DESIGN -144A- 2.625%/10-
01.06.2015150,000 183,674.70 0.17
EUR CAP GEMINI 3.5%/09-01.01.2014 408,000 633,077.41 0.57SGD CAPITACOMMERCIAL TRUST 2.7%/10-
21.04.2015500,000 449,575.24 0.41
SGD CAPITALAND 2.875%/09-03.09.2016 500,000 382,809.06 0.35SGD CAPITALAND 3.125%/08-05.03.2018 2,000,000 1,553,604.49 1.41EUR CELESIO 3.75%/09-29.10.2014 200,000 297,520.17 0.27USD CEMEX SAB -144A- 4.875%/10-15.03.2015 600,000 593,304.00 0.54USD CHERATING CAPITAL FRN 07-05.07.2012 600,000 742,350.00 0.67USD CHESAPEAKE ENERGY 2.5%/07-15.05.2037 1,200,000 1,012,500.00 0.92USD CHINA OVERSEAS FINANCE 0%/07-14.05.2014 200,000 253,202.00 0.23HKD CHINA PETROLEUM & CHEMICAL 0%/07-
24.04.20148,000,000 1,177,465.11 1.07
USD CIENA -144A- 3.75%/10-15.10.2018 100,000 101,266.40 0.09EUR CONTROLINVESTE INTERNATIONAL FINANCE
3%/10-28.01.2015500,000 596,657.11 0.54
EUR CONWERT IMMOBILIEN INVEST 1.5%/07-12.11.2014
200,000 257,746.50 0.23
USD DAEWOO INTERNATIONAL 3.25%/09-06.07.2014
200,000 245,825.80 0.22
JPY ELPIDA MEMORY S. 2 0.5%/10-26.10.2015 50,000,000 622,537.89 0.57USD EMC 1.75%/06-01.12.2011 1,600,000 2,192,000.00 2.00USD EMC 1.75%/06-01.12.2013 200,000 287,252.80 0.26USD ENERCOAL RESOURCES 9.25%/09-05.08.2014 300,000 337,500.00 0.31EUR EURAZEO 6.25%/09-10.06.2014 497,750 823,550.85 0.75HKD FAIR VANTAGE 1%/08-03.06.2013 4,000,000 664,080.64 0.60USD FIRST QUANTUM MINERALS 6%/09-19.06.2014 300,000 513,920.40 0.47USD FORD MOTOR CO CAPITAL TRUST 6.5%/02-
15.01.203245,000 2,312,550.00 2.11
HKD GAINLEAD INTERNATIONAL (reg. -S-) 0%/07-22.02.2012
2,000,000 298,057.21 0.27
USD GENERAL MOTORS 4.34%/10-01.12.2013 12,000 608,400.00 0.55USD GILEAD SCIENCES 0.625%/06-01.05.2013 600,000 660,750.00 0.60USD GILEAD SCIENCES 1.625%/10-01.05.2016 2,200,000 2,310,000.00 2.11USD GOLDCORP 2%/10-01.08.2014 700,000 848,925.00 0.77CNY GOME ELECTRICAL APPLIANCES HOLDING
3%/09-25.09.20141,800,000 346,103.84 0.31
JPY HITACHI S. 8 0.10%/09-12.12.2014 100,000,000 1,575,743.07 1.43USD HON HAI PRECISION (reg. -S-) 0%/10-
12.10.2013700,000 714,658.70 0.65
USD HYNIX SEMICONDUCTOR 2.65%/10-14.05.2015
400,000 389,591.20 0.35
EUR INDUSTRIVAERDEN 2.5%/10-27.02.2015 400,000 622,085.50 0.56USD INTEL 2.95%/05-15.12.2035 1,150,000 1,164,375.00 1.06USD INTEL 3.25%/09-01.08.2039 2,000,000 2,442,008.00 2.23USD INTERNATIONAL GAME TECHNOLOGY
3.25%/09-01.05.2014600,000 657,154.80 0.60
EUR INTERNATIONAL POWER FINANCE (JERSEY)4.75%/08-05.06.2015
500,000 702,360.51 0.64
EUR INTRALOT 2.25%/06-20.12.2013 300,000 364,652.72 0.33EUR KFW 1.5%/09-30.07.2014 500,000 734,239.07 0.67EUR KLOECKNER 1.5%/07-27.07.2012 600,000 743,192.51 0.67USD LIBERTY MEDIA 3.125%/03-30.03.2023 600,000 660,000.00 0.60USD LIFEPOINT HOSPITALS 3.25%/05-15.08.2025 800,000 799,000.00 0.73USD LINEAR TECHNOLOGY 3%/07-01.05.2027 750,000 776,250.00 0.70USD L-3 COMMUNICATIONS S. B 3%/05-01.08.2035 500,000 502,500.00 0.46EUR MAGYAR NEMZETI VAGYONKEZELO 4.4%/09-
25.09.2014700,000 874,426.09 0.79
USD MASSEY ENERGY 3.25%/08-01.08.2015 600,000 599,250.00 0.54
DescriptionQuantity /
NominalValuation % of net
assets(in USD)
USD MGM RESORTS INTERNATIONAL -144A-4.25%/10-15.04.2015
800,000 790,009.60 0.72
EUR MICHELIN 0%/07-01.01.2017 539,864 759,899.17 0.69USD MICROCHIP TECHNOLOGY 2.125%/07-
15.12.2037800,000 957,662.40 0.87
USD MICRON TECHNOLOGY 1.875%/07-01.06.2014 1,100,000 1,007,656.10 0.91EUR MISARTE 3.25%/10-01.01.2016 699,500 1,015,337.66 0.92USD MOLSON COORS BREWING 2.5%/07-
30.07.2013400,000 453,137.20 0.41
USD MYLAN 1.25%/07-15.03.2012 600,000 621,000.00 0.56EUR NATIXIS STRUCTURED PRODUCTS 0%/10-
03.02.2014400,000 489,577.76 0.44
USD NAVISTAR INTERNATIONAL 3%/09-15.10.2014 500,000 616,875.00 0.56EUR NERO FINANCE (reg. -S-) 4.5%/08-15.04.2013 1,200,000 1,547,003.87 1.40USD NETAPP 1.75%/09-01.06.2013 250,000 415,958.75 0.38USD NEWMONT MINING 1.625%/07-15.07.2017 300,000 422,250.00 0.38JPY NIDEC (reg. -S-) 0%/10-18.09.2015 50,000,000 647,266.31 0.59USD NII HOLDINGS 3.125%/07-15.06.2012 1,500,000 1,456,875.00 1.32USD OLAM INTERNATIONAL 6%/09-15.10.2016 400,000 535,360.00 0.49USD OMNICARE 3.25%/05-15.12.2035 600,000 560,065.20 0.51JPY ORIX S. 3 1%/08-31.03.2014 140,000,000 1,964,545.74 1.78USD OWENS-BROCKWAY GLASS CONTAINER -
144A- 3%/10-01.06.2015400,000 390,240.80 0.35
USD PAKA CAPITAL 0%/08-12.03.2013 400,000 412,217.20 0.37USD PALADIN ENERGY 5%/08-11.03.2013 400,000 422,092.00 0.38EUR PARPUBLICA - PARTICIPACOES PUBLICAS -
SGPS 3.25%/07-18.12.2014500,000 583,724.23 0.53
EUR PARPUBLICA - PARTICIPACOES PUBLICAS -SGPS 5.25%/10-28.09.2017
800,000 1,023,362.95 0.93
USD PEABODY ENERGY 4.75%/06-15.12.2041 600,000 752,947.80 0.68USD PETROLEUM GEO-SERVICES 2.7%/07-
03.12.2012600,000 572,179.80 0.52
USD PETROMINERALES 2.625%/10-25.08.2016 700,000 745,323.60 0.68EUR PEUGEOT 4.45%/09-01.01.2016 476,900 821,200.70 0.75EUR PORTUGAL TELECOM INTERNATIONAL
FINANCE (linked on Portugal Telecom SGPS)4.125%/07-28.08.2014
300,000 397,401.36 0.36
HKD POWER REGAL GROUP 2.25%/09-02.06.2014 1,500,000 244,973.90 0.22USD PRICELINE.COM -144A- 1.25%/10-15.03.2015 200,000 292,759.80 0.27EUR PUBLICIS GROUPE 3.125%/09-30.07.2014 725,400 1,265,859.24 1.15USD QBE FUNDING TRUST (reg. -S-) 0%/10-
12.05.20301,000,000 608,384.00 0.55
USD RAFFLESIA CAPITAL (convertible on TelekomMalaysia BHD) 06-04.10.2011
600,000 822,235.80 0.75
USD RANBAXY LABORATORIES 0%/06-18.03.2011 300,000 376,127.40 0.34EUR RENEWABLE ENERGY 6.5%/09-04.06.2014 300,000 343,137.52 0.31EUR RHODIA 0.5%/07-01.01.2014 432,900 569,345.43 0.52USD SALESFORCE.COM -144A- 0.75%/10-
15.01.2015200,000 344,213.00 0.31
USD SANDISK 1%/06-15.05.2013 300,000 280,875.00 0.25USD SANDISK 1.5%/10-15.08.2017 1,000,000 1,067,318.00 0.97USD SEADRILL LIMITED 3.375%/10-27.10.2017 400,000 405,561.20 0.37USD SEADRILL 3.625%/07-08.11.2012 1,400,000 1,618,804.60 1.47USD SESA GOA (reg. -S-) 5%/09-31.10.2014 200,000 217,734.60 0.20HKD SHERSON 0%/07-04.06.2014 3,200,000 461,521.23 0.42USD SHIRE 2.75%/07-09.05.2014 800,000 824,481.60 0.75USD SHIV-VANI OIL & GAS EXPLORATION SERVICES
(reg. -S-) 5%/10-17.07.2015200,000 206,000.00 0.19
CNY SHUI ON LAND (reg. -S-) 4.5%/10-29.09.2015 2,200,000 362,099.43 0.33EUR SILIC 2.5%/10-01.01.2017 333,901 414,262.85 0.38USD SK TELECOM 1.75%/09-07.04.2014 400,000 477,950.00 0.43JPY SOFTBANK 1.50%/03-31.03.2013 40,000,000 676,137.03 0.61HKD SOHO CHINA 3.75%/09-02.07.2014 2,000,000 301,709.20 0.27EUR STEINHOFF FINANCE 5%/10-22.05.2016 300,000 416,897.15 0.38JPY SUZUKI MOTOR N. 4 0%/06-29.03.2013 120,000,000 1,467,804.67 1.33USD SWISS RE AMERICA HOLDING (reg. -S-) FIX-TO-
FRN 3.25%/01-21.11.2021830,000 804,350.51 0.73
USD SYMANTEC 0.75%/06-15.06.2011 800,000 837,000.00 0.76USD SYMANTEC 1%/06-15.06.2013 800,000 916,000.00 0.83USD TATA MOTORS 4%/09-16.10.2014 200,000 431,367.00 0.39USD TATA POWER 1.75%/09-21.11.2014 300,000 340,105.50 0.31USD TATA STEEL 4.5%/09-21.11.2014 400,000 454,405.60 0.41USD TEVA PHARMACEUTICAL FINANCE 0.25%/06-
01.02.2026600,000 675,000.00 0.61
USD TEVA PHARMACEUTICAL FINANCE 1.75%/06-01.02.2026
350,000 374,062.50 0.34
EUR TUI 2.75%/07-01.09.2012 200,000 245,897.97 0.22EUR UCB 4.5%/09-22.10.2015 200,000 284,901.01 0.26EUR UNIBAIL-RODAMCO 3.5%/09-01.01.2015 365,900 608,989.58 0.55JPY UNICHARM (reg. -S-) 0%/10-24.09.2013 20,000,000 252,376.74 0.23JPY UNICHARM (reg. -S-) 0%/10-24.09.2015 20,000,000 255,084.15 0.23EUR VALEO 2.375%/03-01.01.2011 464,000 603,291.01 0.55USD VEDANTA RESOURCES JERSEY 4%/10-
30.03.20171,100,000 1,041,062.00 0.95
USD VEDANTA RESOURCES 5.5%/09-13.07.2016 600,000 643,824.00 0.58USD VERISIGN 3.25%/08-15.08.2037 1,000,000 1,136,250.00 1.03USD VORNADO REALTY -144A- 3.875%/05-
15.04.2025400,000 441,500.00 0.40
EUR WERELDHAVE (reg. -S-) 2.875%/10-18.11.2015 400,000 503,866.29 0.46USD WILMAR INTERNATIONAL 0%/07-18.12.2012 500,000 654,681.00 0.59GBP WPP GROUP 5.75%/09-19.05.2014 500,000 1,067,266.25 0.97USD XILINX -144A- 2.625%/10-15.06.2017 300,000 341,350.50 0.31USD XILINX 3.125%/07-15.03.2037 600,000 596,250.00 0.54
Bonds 102,694,678.62 93.23
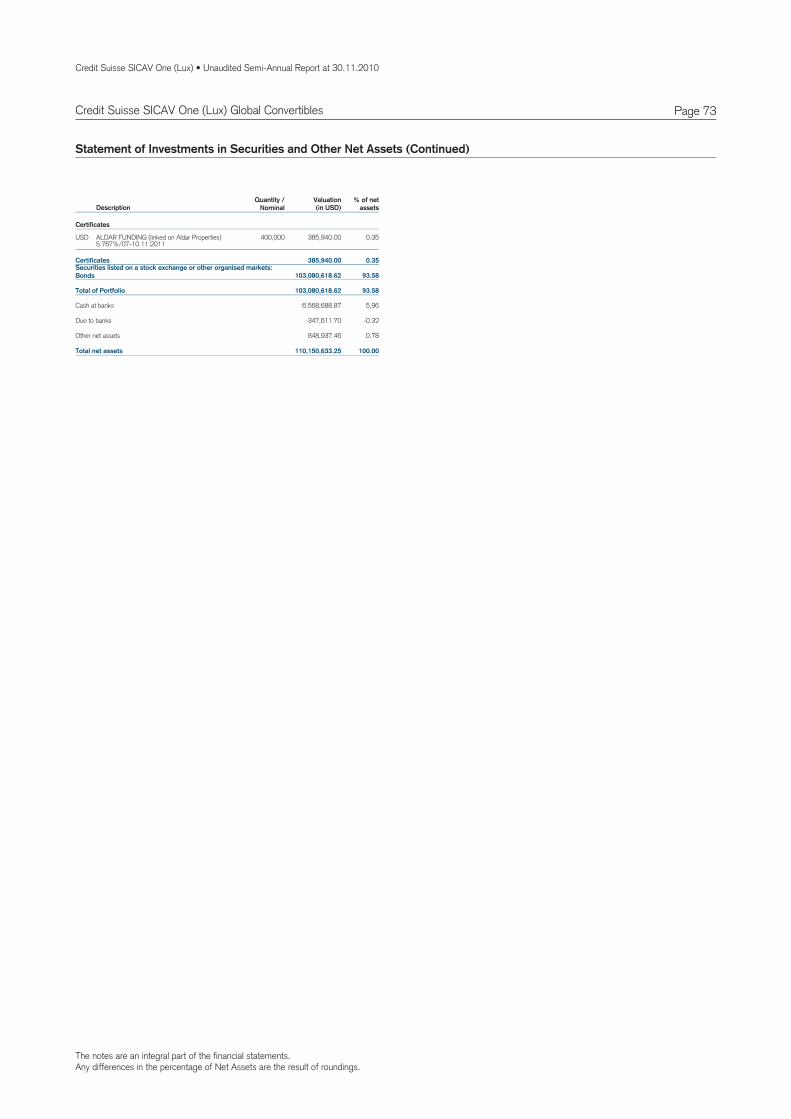
The notes are an integral part of the financial statements.Any differences in the percentage of Net Assets are the result of roundings.
Credit Suisse SICAV One (Lux) • Unaudited Semi-Annual Report at 30.11.2010
Page 73Credit Suisse SICAV One (Lux) Global Convertibles
Statement of Investments in Securities and Other Net Assets (Continued)
DescriptionQuantity /
NominalValuation % of net
assets(in USD)
Certificates
USD ALDAR FUNDING (linked on Aldar Properties)5.767%/07-10.11.2011
400,000 385,940.00 0.35
Securities listed on a stock exchange or other organised markets:Bonds 103,080,618.62 93.58
Certificates 385,940.00 0.35
Total of Portfolio 103,080,618.62 93.58
Cash at banks 6,568,688.87 5.96
Due to banks -347,611.70 -0.32
Other net assets 848,937.46 0.78
Total net assets 110,150,633.25 100.00

Credit Suisse SICAV One (Lux) • Unaudited Semi-Annual Report at 30.11.2010
Page 74Credit Suisse SICAV One (Lux) Global Equity Dividend Plus
Technical Data and Notes
USDA 10348395 LU0439730374 1.92% 1.74%Distribution -
Valoren ISIN Management Fee Total Expense Ratio
USDB 10348396 LU0439730457 1.92% 2.18%Capitalisation - USDF 10445644 LU0445928608 0.50% 0.56%Capitalisation -
Technical Data
USDA -0.40%/Distribution - YTD Since Inception
USDB -0.40%/Capitalisation - USDF 0.14%/Capitalisation -
Fund Performance
For the period from 16.04.2010 to 30.11.2010, the Portfolio Turnover Rate was 29.19%.

Credit Suisse SICAV One (Lux) • Unaudited Semi-Annual Report at 30.11.2010
Page 75
Assets
Investments in securities at market value 9,670,064.62Cash at banks 51,858.43Income receivable 32,344.44Prepaid expenses 60.36Formation expenses 43,725.75
9,798,053.60
Liabilities
Provisions for accrued expenses 31,307.1931,307.19
9,766,746.41Net assets
Statement of Net Assets in USD and Fund Evolution
30.11.2010
9.96USDA 8.83Distribution -
9.96USDB 8.83Capitalisation -
1,001.38USDF 883.44Capitalisation -
Total net assets
Net asset value per share
9,766,746.41 10,812,466.87USD
Fund Evolution 30.11.2010 31.05.2010
7,250.000 2,350.000A 4,900.000 0.000Distribution - USD
29,786.407 28,786.407B 1,000.000 0.000Capitalisation - USD
9,385.000 1,625.000F 12,180.000 4,420.000Capitalisation - USD
Number of shares outstanding at the endof the period
at the beginningof the period
Number of shares issued
Number of shares redeemed
Credit Suisse SICAV One (Lux) Global Equity Dividend Plus
The notes are an integral part of the financial statements.

Credit Suisse SICAV One (Lux) • Unaudited Semi-Annual Report at 30.11.2010
Page 76Credit Suisse SICAV One (Lux) Global Equity Dividend Plus
Net assets at the beginning of the period 10,812,466.87
Income
Dividends (net) 159,524.77Bank interest 30.59Other income 227.20
159,782.56
Expenses
Management fee 21,443.57Custodian and safe custody fees 2,470.88Administration expenses 4,098.73Printing and publication expenses 1,551.85Audit, control, legal, representative bank and other expenses 1,739.43"Taxe d'abonnement" 559.58Amortisation of formation expenses 5,013.85
36,877.89
Net income (loss) 122,904.67
Realised gain (loss)
Net realised gain (loss) on sales of investments -168,282.20Net realised gain (loss) on foreign exchange -16,009.81
-184,292.01
Net realised gain (loss) -61,387.34
Change in net unrealised appreciation (depreciation)
Change in net unrealised appreciation (depreciation) on investments 1,489,976.541,489,976.54
Net increase (decrease) in net assets as a result of operations 1,428,589.20
Subscriptions / Redemptions
Subscriptions 1,794,050.54Redemptions -4,268,360.20
-2,474,309.66
Net assets at the end of the period 9,766,746.41
Statement of Operations / Changes in Net Assets in USD
For the period from01.06.2010 to
30.11.2010
The notes are an integral part of the financial statements.
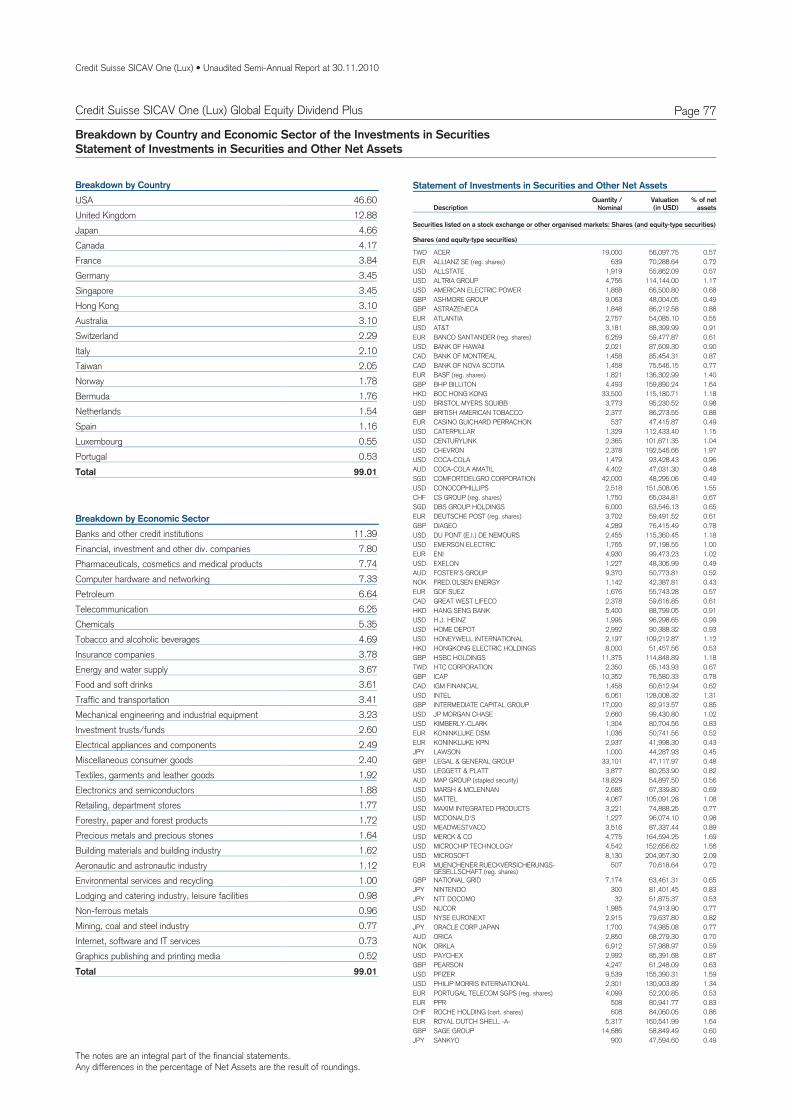
The notes are an integral part of the financial statements.Any differences in the percentage of Net Assets are the result of roundings.
Credit Suisse SICAV One (Lux) • Unaudited Semi-Annual Report at 30.11.2010
Page 77Credit Suisse SICAV One (Lux) Global Equity Dividend Plus
Breakdown by Country and Economic Sector of the Investments in SecuritiesStatement of Investments in Securities and Other Net Assets
46.60USABreakdown by Country
12.88United Kingdom4.66Japan4.17Canada3.84France3.45Germany3.45Singapore3.10Hong Kong3.10Australia2.29Switzerland2.10Italy2.05Taiwan1.78Norway1.76Bermuda1.54Netherlands1.16Spain0.55Luxembourg0.53Portugal
99.01Total
11.39Banks and other credit institutionsBreakdown by Economic Sector
7.80Financial, investment and other div. companies7.74Pharmaceuticals, cosmetics and medical products7.33Computer hardware and networking6.64Petroleum6.25Telecommunication5.35Chemicals4.69Tobacco and alcoholic beverages3.78Insurance companies3.67Energy and water supply3.61Food and soft drinks3.41Traffic and transportation3.23Mechanical engineering and industrial equipment2.60Investment trusts/funds2.49Electrical appliances and components2.40Miscellaneous consumer goods1.92Textiles, garments and leather goods1.88Electronics and semiconductors1.77Retailing, department stores1.72Forestry, paper and forest products1.64Precious metals and precious stones1.62Building materials and building industry1.12Aeronautic and astronautic industry1.00Environmental services and recycling0.98Lodging and catering industry, leisure facilities0.96Non-ferrous metals0.77Mining, coal and steel industry0.73Internet, software and IT services0.52Graphics publishing and printing media
99.01Total
Statement of Investments in Securities and Other Net Assets
DescriptionQuantity /
NominalValuation % of net
assets(in USD)
Securities listed on a stock exchange or other organised markets: Shares (and equity-type securities)
Shares (and equity-type securities)
TWD ACER 19,000 56,097.75 0.57EUR ALLIANZ SE (reg. shares) 639 70,288.64 0.72USD ALLSTATE 1,919 55,862.09 0.57USD ALTRIA GROUP 4,756 114,144.00 1.17USD AMERICAN ELECTRIC POWER 1,868 66,500.80 0.68GBP ASHMORE GROUP 9,063 48,004.05 0.49GBP ASTRAZENECA 1,848 86,212.58 0.88EUR ATLANTIA 2,757 54,085.10 0.55USD AT&T 3,181 88,399.99 0.91EUR BANCO SANTANDER (reg. shares) 6,259 59,477.87 0.61USD BANK OF HAWAII 2,021 87,509.30 0.90CAD BANK OF MONTREAL 1,458 85,454.31 0.87CAD BANK OF NOVA SCOTIA 1,458 75,546.15 0.77EUR BASF (reg. shares) 1,821 136,302.99 1.40GBP BHP BILLITON 4,493 159,890.24 1.64HKD BOC HONG KONG 33,500 115,180.71 1.18USD BRISTOL MYERS SQUIBB 3,773 95,230.52 0.98GBP BRITISH AMERICAN TOBACCO 2,377 86,273.55 0.88EUR CASINO GUICHARD PERRACHON 537 47,415.87 0.49USD CATERPILLAR 1,329 112,433.40 1.15USD CENTURYLINK 2,365 101,671.35 1.04USD CHEVRON 2,378 192,546.66 1.97USD COCA-COLA 1,479 93,428.43 0.96AUD COCA-COLA AMATIL 4,402 47,031.30 0.48SGD COMFORTDELGRO CORPORATION 42,000 48,295.06 0.49USD CONOCOPHILLIPS 2,518 151,508.06 1.55CHF CS GROUP (reg. shares) 1,750 65,034.81 0.67SGD DBS GROUP HOLDINGS 6,000 63,546.13 0.65EUR DEUTSCHE POST (reg. shares) 3,702 59,491.52 0.61GBP DIAGEO 4,289 76,415.49 0.78USD DU PONT (E.I.) DE NEMOURS 2,455 115,360.45 1.18USD EMERSON ELECTRIC 1,765 97,198.55 1.00EUR ENI 4,930 99,473.23 1.02USD EXELON 1,227 48,306.99 0.49AUD FOSTER'S GROUP 9,370 50,773.81 0.52NOK FRED.OLSEN ENERGY 1,142 42,387.81 0.43EUR GDF SUEZ 1,676 55,743.28 0.57CAD GREAT WEST LIFECO 2,378 59,616.85 0.61HKD HANG SENG BANK 5,400 88,799.05 0.91USD H.J. HEINZ 1,995 96,298.65 0.99USD HOME DEPOT 2,992 90,388.32 0.93USD HONEYWELL INTERNATIONAL 2,197 109,212.87 1.12HKD HONGKONG ELECTRIC HOLDINGS 8,000 51,457.56 0.53GBP HSBC HOLDINGS 11,375 114,848.89 1.18TWD HTC CORPORATION 2,350 65,143.93 0.67GBP ICAP 10,352 76,580.33 0.78CAD IGM FINANCIAL 1,458 60,612.94 0.62USD INTEL 6,061 128,008.32 1.31GBP INTERMEDIATE CAPITAL GROUP 17,020 82,913.57 0.85USD JP MORGAN CHASE 2,660 99,430.80 1.02USD KIMBERLY-CLARK 1,304 80,704.56 0.83EUR KONINKLIJKE DSM 1,036 50,741.56 0.52EUR KONINKLIJKE KPN 2,937 41,998.30 0.43JPY LAWSON 1,000 44,287.93 0.45GBP LEGAL & GENERAL GROUP 33,101 47,117.97 0.48USD LEGGETT & PLATT 3,877 80,253.90 0.82AUD MAP GROUP (stapled security) 18,829 54,897.50 0.56USD MARSH & MCLENNAN 2,685 67,339.80 0.69USD MATTEL 4,067 105,091.28 1.08USD MAXIM INTEGRATED PRODUCTS 3,221 74,888.25 0.77USD MCDONALD'S 1,227 96,074.10 0.98USD MEADWESTVACO 3,516 87,337.44 0.89USD MERCK & CO 4,775 164,594.25 1.69USD MICROCHIP TECHNOLOGY 4,542 152,656.62 1.56USD MICROSOFT 8,130 204,957.30 2.09EUR MUENCHENER RUECKVERSICHERUNGS-
GESELLSCHAFT (reg. shares)507 70,618.64 0.72
GBP NATIONAL GRID 7,174 63,461.31 0.65JPY NINTENDO 300 81,401.45 0.83JPY NTT DOCOMO 32 51,875.37 0.53USD NUCOR 1,985 74,913.90 0.77USD NYSE EURONEXT 2,915 79,637.80 0.82JPY ORACLE CORP JAPAN 1,700 74,985.08 0.77AUD ORICA 2,850 68,279.30 0.70NOK ORKLA 6,912 57,988.97 0.59USD PAYCHEX 2,992 85,391.68 0.87GBP PEARSON 4,247 61,248.09 0.63USD PFIZER 9,539 155,390.31 1.59USD PHILIP MORRIS INTERNATIONAL 2,301 130,903.89 1.34EUR PORTUGAL TELECOM SGPS (reg. shares) 4,099 52,200.85 0.53EUR PPR 508 80,941.77 0.83CHF ROCHE HOLDING (cert. shares) 608 84,060.05 0.86EUR ROYAL DUTCH SHELL -A- 5,317 160,541.99 1.64GBP SAGE GROUP 14,686 58,849.49 0.60JPY SANKYO 900 47,594.60 0.49
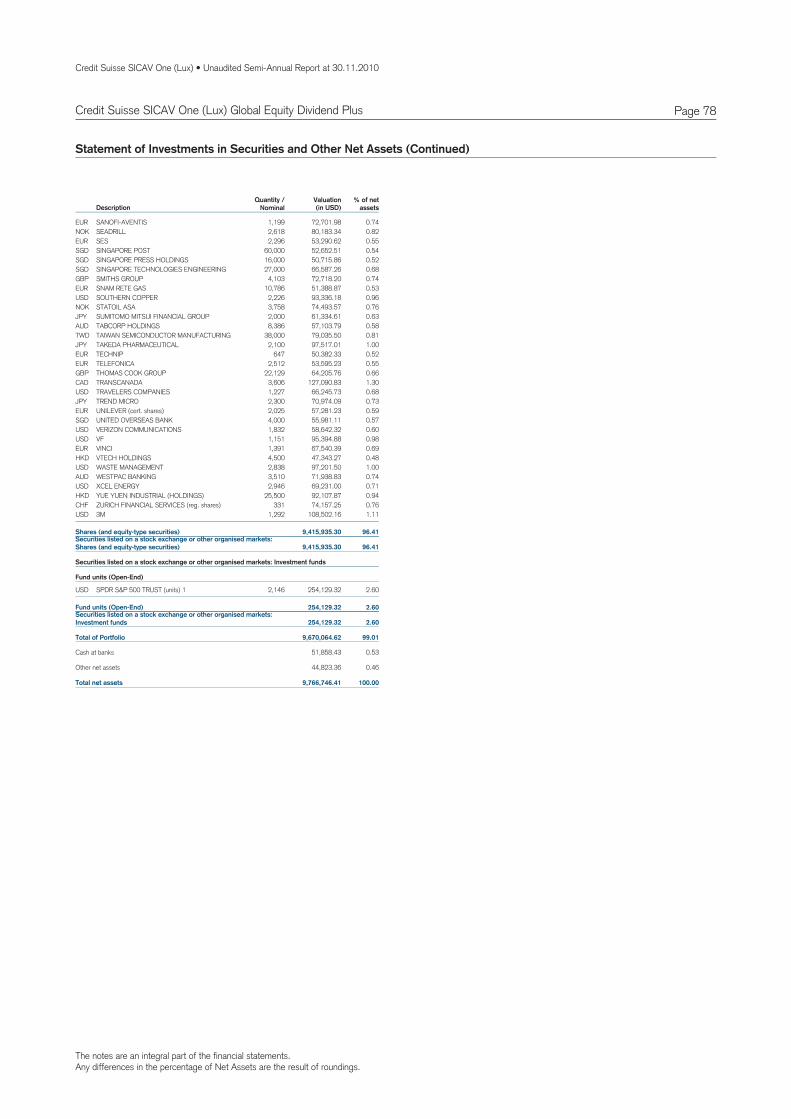
The notes are an integral part of the financial statements.Any differences in the percentage of Net Assets are the result of roundings.
Credit Suisse SICAV One (Lux) • Unaudited Semi-Annual Report at 30.11.2010
Page 78Credit Suisse SICAV One (Lux) Global Equity Dividend Plus
Statement of Investments in Securities and Other Net Assets (Continued)
DescriptionQuantity /
NominalValuation % of net
assets(in USD)
EUR SANOFI-AVENTIS 1,199 72,701.98 0.74NOK SEADRILL 2,618 80,183.34 0.82EUR SES 2,296 53,290.62 0.55SGD SINGAPORE POST 60,000 52,652.51 0.54SGD SINGAPORE PRESS HOLDINGS 16,000 50,715.86 0.52SGD SINGAPORE TECHNOLOGIES ENGINEERING 27,000 66,587.26 0.68GBP SMITHS GROUP 4,103 72,718.20 0.74EUR SNAM RETE GAS 10,786 51,388.87 0.53USD SOUTHERN COPPER 2,226 93,336.18 0.96NOK STATOIL ASA 3,758 74,493.57 0.76JPY SUMITOMO MITSUI FINANCIAL GROUP 2,000 61,334.61 0.63AUD TABCORP HOLDINGS 8,386 57,103.79 0.58TWD TAIWAN SEMICONDUCTOR MANUFACTURING 38,000 79,035.50 0.81JPY TAKEDA PHARMACEUTICAL 2,100 97,517.01 1.00EUR TECHNIP 647 50,382.33 0.52EUR TELEFONICA 2,512 53,595.23 0.55GBP THOMAS COOK GROUP 22,129 64,205.76 0.66CAD TRANSCANADA 3,606 127,090.83 1.30USD TRAVELERS COMPANIES 1,227 66,245.73 0.68JPY TREND MICRO 2,300 70,974.09 0.73EUR UNILEVER (cert. shares) 2,025 57,281.23 0.59SGD UNITED OVERSEAS BANK 4,000 55,981.11 0.57USD VERIZON COMMUNICATIONS 1,832 58,642.32 0.60USD VF 1,151 95,394.88 0.98EUR VINCI 1,391 67,540.39 0.69HKD VTECH HOLDINGS 4,500 47,343.27 0.48USD WASTE MANAGEMENT 2,838 97,201.50 1.00AUD WESTPAC BANKING 3,510 71,938.83 0.74USD XCEL ENERGY 2,946 69,231.00 0.71HKD YUE YUEN INDUSTRIAL (HOLDINGS) 25,500 92,107.87 0.94CHF ZURICH FINANCIAL SERVICES (reg. shares) 331 74,157.25 0.76USD 3M 1,292 108,502.16 1.11
Securities listed on a stock exchange or other organised markets:Shares (and equity-type securities) 9,415,935.30 96.41
Shares (and equity-type securities) 9,415,935.30 96.41
Securities listed on a stock exchange or other organised markets: Investment funds
Fund units (Open-End)
USD SPDR S&P 500 TRUST (units) 1 2,146 254,129.32 2.60
Securities listed on a stock exchange or other organised markets:Investment funds 254,129.32 2.60
Fund units (Open-End) 254,129.32 2.60
Total of Portfolio 9,670,064.62 99.01
Cash at banks 51,858.43 0.53
Other net assets 44,823.36 0.46
Total net assets 9,766,746.41 100.00
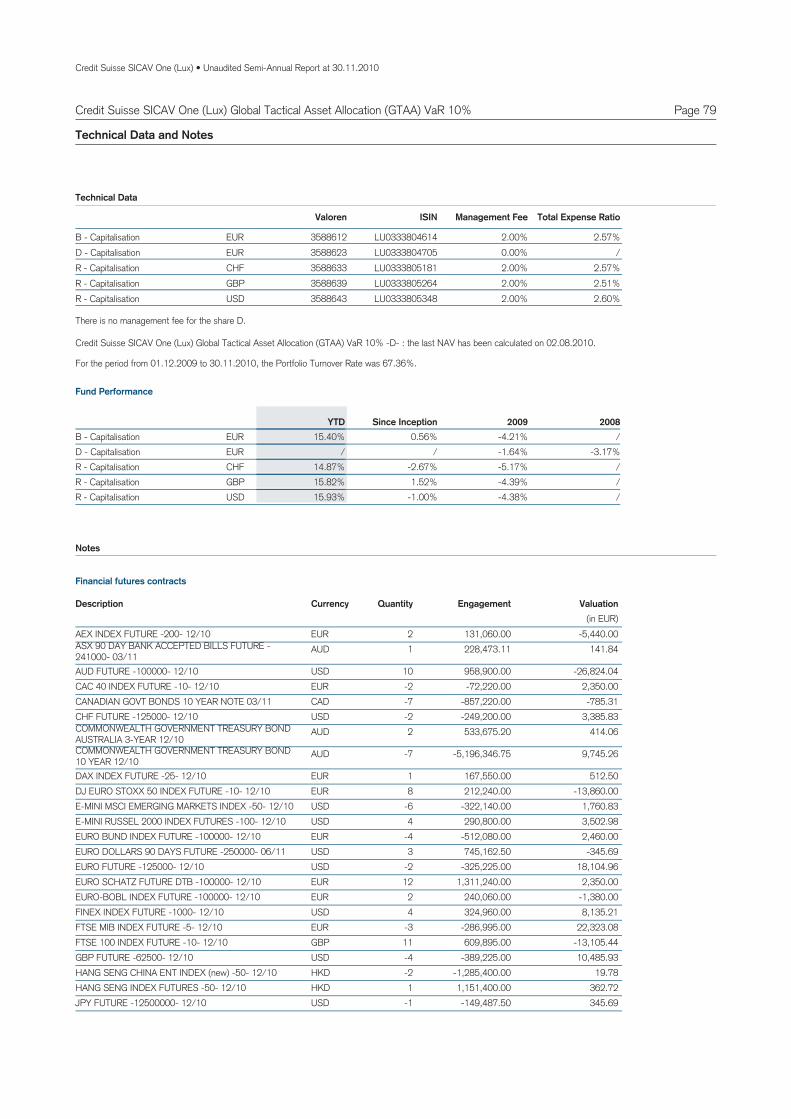
Credit Suisse SICAV One (Lux) • Unaudited Semi-Annual Report at 30.11.2010
Page 79Credit Suisse SICAV One (Lux) Global Tactical Asset Allocation (GTAA) VaR 10%
Technical Data and Notes
EURB 3588612 LU0333804614 2.00% 2.57%Capitalisation -
Valoren ISIN Management Fee Total Expense Ratio
EURD 3588623 LU0333804705 0.00% /Capitalisation - CHFR 3588633 LU0333805181 2.00% 2.57%Capitalisation - GBPR 3588639 LU0333805264 2.00% 2.51%Capitalisation - USDR 3588643 LU0333805348 2.00% 2.60%Capitalisation -
Technical Data
EURB /-4.21%0.56%15.40%Capitalisation - 2008YTD 2009Since Inception
EURD -3.17%-1.64%//Capitalisation - CHFR /-5.17%-2.67%14.87%Capitalisation - GBPR /-4.39%1.52%15.82%Capitalisation - USDR /-4.38%-1.00%15.93%Capitalisation -
Fund Performance
For the period from 01.12.2009 to 30.11.2010, the Portfolio Turnover Rate was 67.36%.
Notes
There is no management fee for the share D.
Credit Suisse SICAV One (Lux) Global Tactical Asset Allocation (GTAA) VaR 10% -D- : the last NAV has been calculated on 02.08.2010.
EURAEX INDEX FUTURE -200- 12/10 2 131,060.00 -5,440.00AUDASX 90 DAY BANK ACCEPTED BILLS FUTURE -
241000- 03/111 228,473.11 141.84
USDAUD FUTURE -100000- 12/10 10 958,900.00 -26,824.04EURCAC 40 INDEX FUTURE -10- 12/10 -2 -72,220.00 2,350.00CADCANADIAN GOVT BONDS 10 YEAR NOTE 03/11 -7 -857,220.00 -785.31USDCHF FUTURE -125000- 12/10 -2 -249,200.00 3,385.83AUDCOMMONWEALTH GOVERNMENT TREASURY BOND
AUSTRALIA 3-YEAR 12/102 533,675.20 414.06
AUDCOMMONWEALTH GOVERNMENT TREASURY BOND10 YEAR 12/10
-7 -5,196,346.75 9,745.26
EURDAX INDEX FUTURE -25- 12/10 1 167,550.00 512.50EURDJ EURO STOXX 50 INDEX FUTURE -10- 12/10 8 212,240.00 -13,860.00USDE-MINI MSCI EMERGING MARKETS INDEX -50- 12/10 -6 -322,140.00 1,760.83USDE-MINI RUSSEL 2000 INDEX FUTURES -100- 12/10 4 290,800.00 3,502.98EUREURO BUND INDEX FUTURE -100000- 12/10 -4 -512,080.00 2,460.00USDEURO DOLLARS 90 DAYS FUTURE -250000- 06/11 3 745,162.50 -345.69USDEURO FUTURE -125000- 12/10 -2 -325,225.00 18,104.96EUREURO SCHATZ FUTURE DTB -100000- 12/10 12 1,311,240.00 2,350.00EUREURO-BOBL INDEX FUTURE -100000- 12/10 2 240,060.00 -1,380.00USDFINEX INDEX FUTURE -1000- 12/10 4 324,960.00 8,135.21EURFTSE MIB INDEX FUTURE -5- 12/10 -3 -286,995.00 22,323.08GBPFTSE 100 INDEX FUTURE -10- 12/10 11 609,895.00 -13,105.44USDGBP FUTURE -62500- 12/10 -4 -389,225.00 10,485.93HKDHANG SENG CHINA ENT INDEX (new) -50- 12/10 -2 -1,285,400.00 19.78HKDHANG SENG INDEX FUTURES -50- 12/10 1 1,151,400.00 362.72USDJPY FUTURE -12500000- 12/10 -1 -149,487.50 345.69
Quantity EngagementDescription Currency Valuation(in EUR)
Financial futures contracts
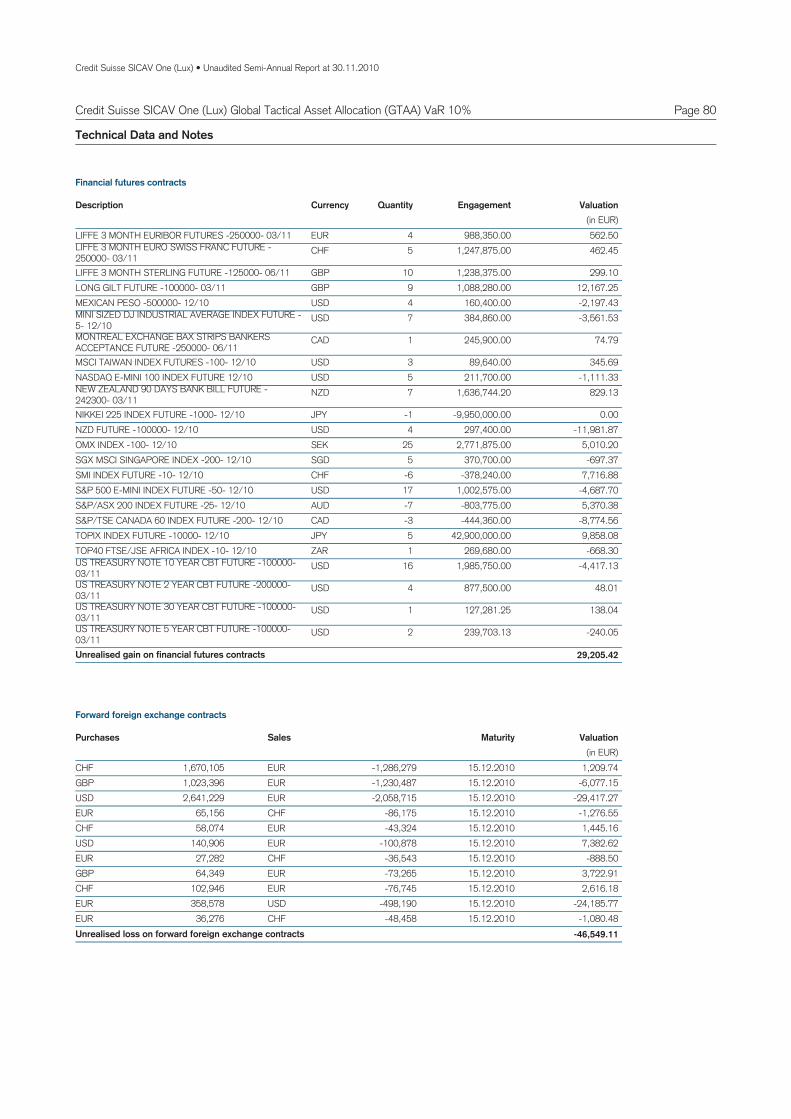
Credit Suisse SICAV One (Lux) • Unaudited Semi-Annual Report at 30.11.2010
Page 80Credit Suisse SICAV One (Lux) Global Tactical Asset Allocation (GTAA) VaR 10%
Technical Data and Notes
EURLIFFE 3 MONTH EURIBOR FUTURES -250000- 03/11 4 988,350.00 562.50CHFLIFFE 3 MONTH EURO SWISS FRANC FUTURE -
250000- 03/115 1,247,875.00 462.45
GBPLIFFE 3 MONTH STERLING FUTURE -125000- 06/11 10 1,238,375.00 299.10GBPLONG GILT FUTURE -100000- 03/11 9 1,088,280.00 12,167.25USDMEXICAN PESO -500000- 12/10 4 160,400.00 -2,197.43USDMINI SIZED DJ INDUSTRIAL AVERAGE INDEX FUTURE -
5- 12/107 384,860.00 -3,561.53
CADMONTREAL EXCHANGE BAX STRIPS BANKERSACCEPTANCE FUTURE -250000- 06/11
1 245,900.00 74.79
USDMSCI TAIWAN INDEX FUTURES -100- 12/10 3 89,640.00 345.69USDNASDAQ E-MINI 100 INDEX FUTURE 12/10 5 211,700.00 -1,111.33NZDNEW ZEALAND 90 DAYS BANK BILL FUTURE -
242300- 03/117 1,636,744.20 829.13
JPYNIKKEI 225 INDEX FUTURE -1000- 12/10 -1 -9,950,000.00 0.00USDNZD FUTURE -100000- 12/10 4 297,400.00 -11,981.87SEKOMX INDEX -100- 12/10 25 2,771,875.00 5,010.20SGDSGX MSCI SINGAPORE INDEX -200- 12/10 5 370,700.00 -697.37CHFSMI INDEX FUTURE -10- 12/10 -6 -378,240.00 7,716.88USDS&P 500 E-MINI INDEX FUTURE -50- 12/10 17 1,002,575.00 -4,687.70AUDS&P/ASX 200 INDEX FUTURE -25- 12/10 -7 -803,775.00 5,370.38CADS&P/TSE CANADA 60 INDEX FUTURE -200- 12/10 -3 -444,360.00 -8,774.56JPYTOPIX INDEX FUTURE -10000- 12/10 5 42,900,000.00 9,858.08ZARTOP40 FTSE/JSE AFRICA INDEX -10- 12/10 1 269,680.00 -668.30USDUS TREASURY NOTE 10 YEAR CBT FUTURE -100000-
03/1116 1,985,750.00 -4,417.13
USDUS TREASURY NOTE 2 YEAR CBT FUTURE -200000-03/11
4 877,500.00 48.01
USDUS TREASURY NOTE 30 YEAR CBT FUTURE -100000-03/11
1 127,281.25 138.04
USDUS TREASURY NOTE 5 YEAR CBT FUTURE -100000-03/11
2 239,703.13 -240.05
29,205.42Unrealised gain on financial futures contracts
Quantity EngagementDescription Currency Valuation(in EUR)
Financial futures contracts
1,670,105CHF EUR -1,286,279 1,209.7415.12.20101,023,396GBP EUR -1,230,487 -6,077.1515.12.20102,641,229USD EUR -2,058,715 -29,417.2715.12.2010
65,156EUR CHF -86,175 -1,276.5515.12.201058,074CHF EUR -43,324 1,445.1615.12.2010
140,906USD EUR -100,878 7,382.6215.12.201027,282EUR CHF -36,543 -888.5015.12.201064,349GBP EUR -73,265 3,722.9115.12.2010
102,946CHF EUR -76,745 2,616.1815.12.2010358,578EUR USD -498,190 -24,185.7715.12.201036,276EUR CHF -48,458 -1,080.4815.12.2010
-46,549.11Unrealised loss on forward foreign exchange contracts
SalesPurchases Valuation(in EUR)
Maturity
Forward foreign exchange contracts
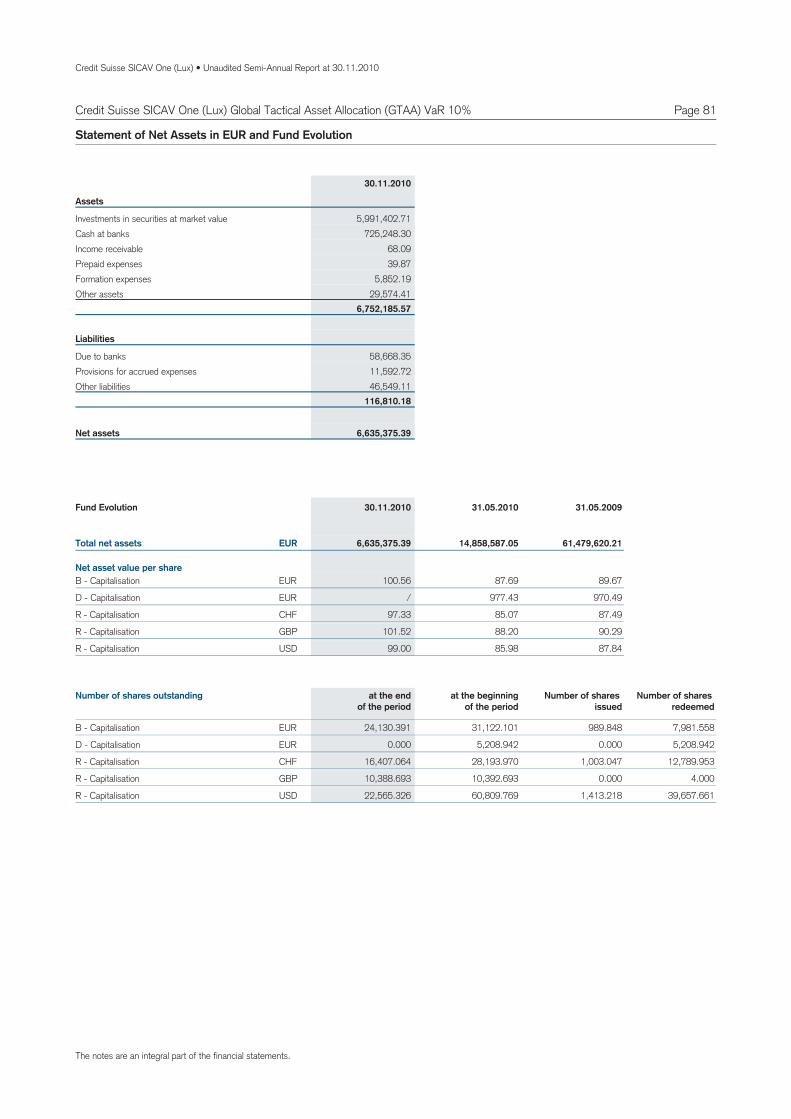
Credit Suisse SICAV One (Lux) • Unaudited Semi-Annual Report at 30.11.2010
Page 81
Assets
Investments in securities at market value 5,991,402.71Cash at banks 725,248.30Income receivable 68.09Prepaid expenses 39.87Formation expenses 5,852.19Other assets 29,574.41
6,752,185.57
Liabilities
Due to banks 58,668.35Provisions for accrued expenses 11,592.72Other liabilities 46,549.11
116,810.18
6,635,375.39Net assets
Statement of Net Assets in EUR and Fund Evolution
30.11.2010
100.56 89.67EURB 87.69Capitalisation -
/ 970.49EURD 977.43Capitalisation -
97.33 87.49CHFR 85.07Capitalisation -
101.52 90.29GBPR 88.20Capitalisation -
99.00 87.84USDR 85.98Capitalisation -
Total net assets
Net asset value per share
6,635,375.39 14,858,587.05 61,479,620.21EUR
Fund Evolution 30.11.2010 31.05.2010 31.05.2009
24,130.391 989.848B 31,122.101 7,981.558Capitalisation - EUR
0.000 0.000D 5,208.942 5,208.942Capitalisation - EUR
16,407.064 1,003.047R 28,193.970 12,789.953Capitalisation - CHF
10,388.693 0.000R 10,392.693 4.000Capitalisation - GBP
22,565.326 1,413.218R 60,809.769 39,657.661Capitalisation - USD
Number of shares outstanding at the endof the period
at the beginningof the period
Number of shares issued
Number of shares redeemed
Credit Suisse SICAV One (Lux) Global Tactical Asset Allocation (GTAA) VaR 10%
The notes are an integral part of the financial statements.
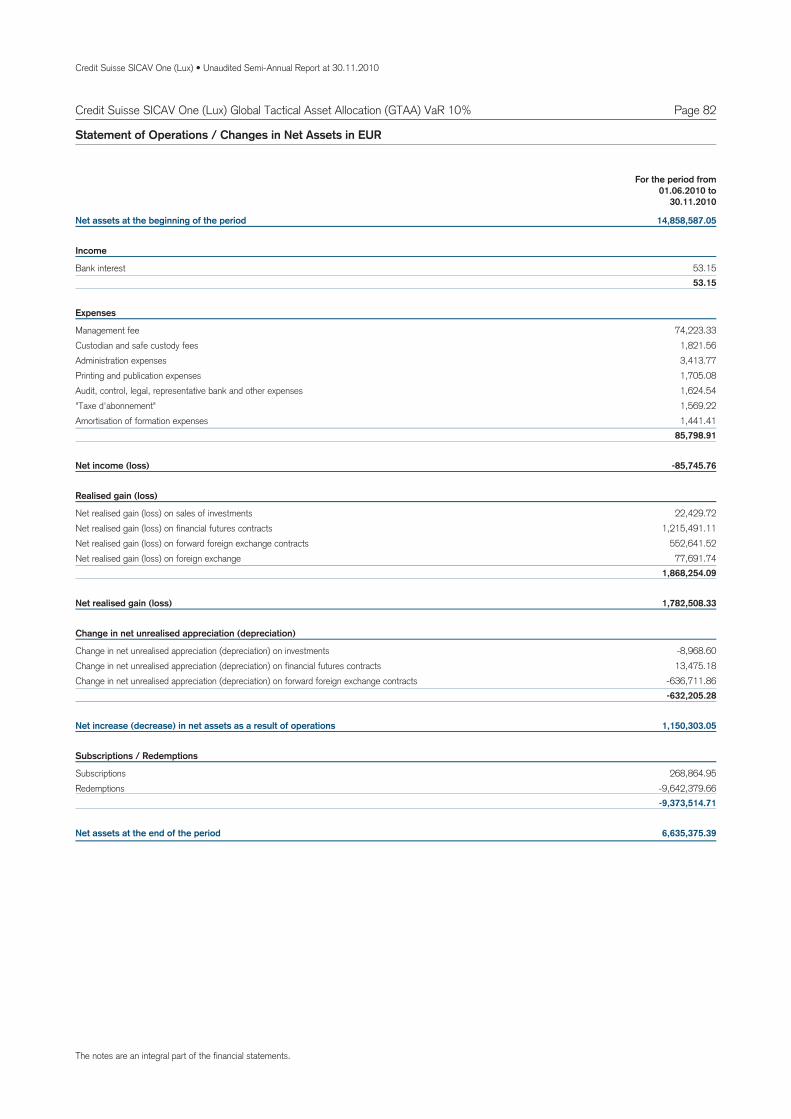
Credit Suisse SICAV One (Lux) • Unaudited Semi-Annual Report at 30.11.2010
Page 82Credit Suisse SICAV One (Lux) Global Tactical Asset Allocation (GTAA) VaR 10%
Net assets at the beginning of the period 14,858,587.05
Income
Bank interest 53.1553.15
Expenses
Management fee 74,223.33Custodian and safe custody fees 1,821.56Administration expenses 3,413.77Printing and publication expenses 1,705.08Audit, control, legal, representative bank and other expenses 1,624.54"Taxe d'abonnement" 1,569.22Amortisation of formation expenses 1,441.41
85,798.91
Net income (loss) -85,745.76
Realised gain (loss)
Net realised gain (loss) on sales of investments 22,429.72Net realised gain (loss) on financial futures contracts 1,215,491.11Net realised gain (loss) on forward foreign exchange contracts 552,641.52Net realised gain (loss) on foreign exchange 77,691.74
1,868,254.09
Net realised gain (loss) 1,782,508.33
Change in net unrealised appreciation (depreciation)
Change in net unrealised appreciation (depreciation) on investments -8,968.60Change in net unrealised appreciation (depreciation) on financial futures contracts 13,475.18Change in net unrealised appreciation (depreciation) on forward foreign exchange contracts -636,711.86
-632,205.28
Net increase (decrease) in net assets as a result of operations 1,150,303.05
Subscriptions / Redemptions
Subscriptions 268,864.95Redemptions -9,642,379.66
-9,373,514.71
Net assets at the end of the period 6,635,375.39
Statement of Operations / Changes in Net Assets in EUR
For the period from01.06.2010 to
30.11.2010
The notes are an integral part of the financial statements.
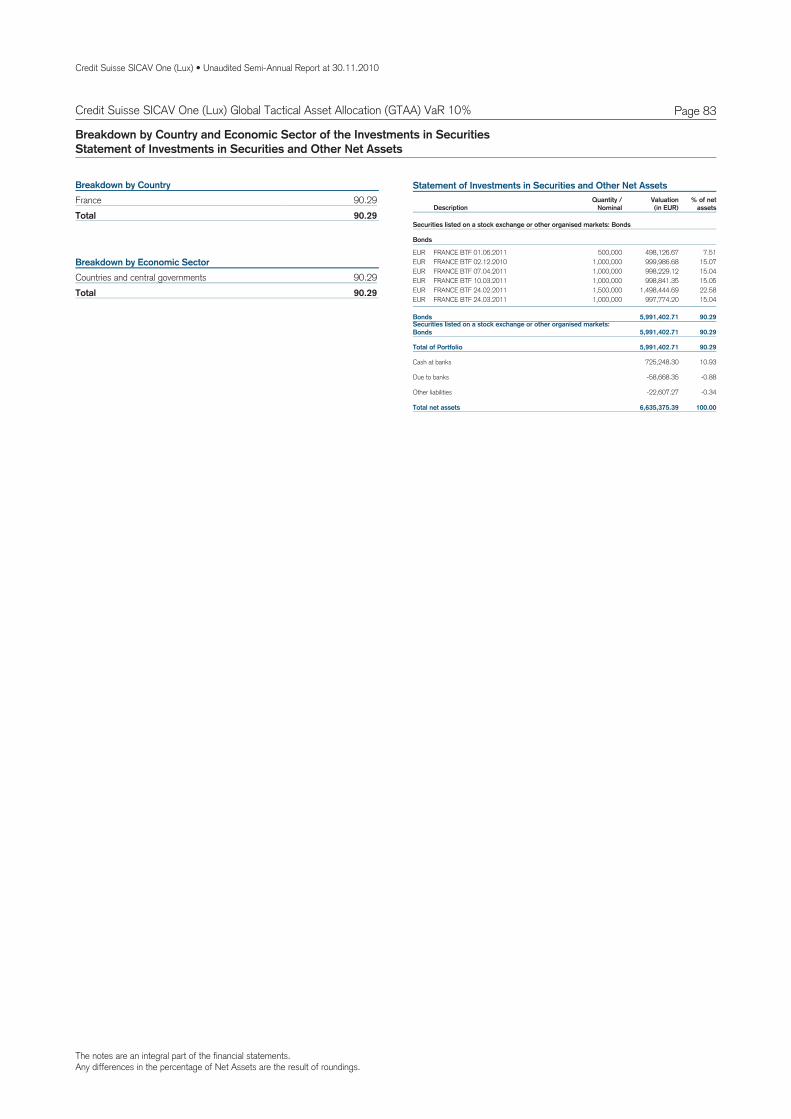
The notes are an integral part of the financial statements.Any differences in the percentage of Net Assets are the result of roundings.
Credit Suisse SICAV One (Lux) • Unaudited Semi-Annual Report at 30.11.2010
Page 83Credit Suisse SICAV One (Lux) Global Tactical Asset Allocation (GTAA) VaR 10%
Breakdown by Country and Economic Sector of the Investments in SecuritiesStatement of Investments in Securities and Other Net Assets
90.29France90.29Total
Breakdown by Country
90.29Countries and central governments90.29Total
Breakdown by Economic Sector
Statement of Investments in Securities and Other Net Assets
DescriptionQuantity /
NominalValuation % of net
assets(in EUR)
Securities listed on a stock exchange or other organised markets: Bonds
Bonds
EUR FRANCE BTF 01.06.2011 500,000 498,126.67 7.51EUR FRANCE BTF 02.12.2010 1,000,000 999,986.68 15.07EUR FRANCE BTF 07.04.2011 1,000,000 998,229.12 15.04EUR FRANCE BTF 10.03.2011 1,000,000 998,841.35 15.05EUR FRANCE BTF 24.02.2011 1,500,000 1,498,444.69 22.58EUR FRANCE BTF 24.03.2011 1,000,000 997,774.20 15.04
Securities listed on a stock exchange or other organised markets:Bonds 5,991,402.71 90.29
Bonds 5,991,402.71 90.29
Total of Portfolio 5,991,402.71 90.29
Cash at banks 725,248.30 10.93
Due to banks -58,668.35 -0.88
Other liabilities -22,607.27 -0.34
Total net assets 6,635,375.39 100.00

Credit Suisse SICAV One (Lux) • Unaudited Semi-Annual Report at 30.11.2010
Page 84Credit Suisse SICAV One (Lux) IndexSelection Balanced (Euro)
Technical Data and Notes
EURB 10348415 LU0439731265 1.30% 2.11%Capitalisation -
Valoren ISIN Management Fee Total Expense Ratio
Technical Data
EURB 7.27%4.39%Capitalisation - YTD Since Inception
Fund Performance
For the period from 01.12.2009 to 30.11.2010, the Portfolio Turnover Rate was 135.15%.

Credit Suisse SICAV One (Lux) • Unaudited Semi-Annual Report at 30.11.2010
Page 85
Assets
Investments in securities at market value 3,737,686.65Cash at banks 332,803.29Income receivable 2,872.58Prepaid expenses 2,677.92Formation expenses 24,722.55
4,100,762.99
Liabilities
Provisions for accrued expenses 19,744.8219,744.82
4,081,018.17Net assets
Statement of Net Assets in EUR and Fund Evolution
30.11.2010
107.27EURB 104.03Capitalisation -
Total net assets
Net asset value per share
4,081,018.17 3,845,460.16EUR
Fund Evolution 30.11.2010 31.05.2010
38,045.167 1,173.811B 36,965.582 94.226Capitalisation - EUR
Number of shares outstanding at the endof the period
at the beginningof the period
Number of shares issued
Number of shares redeemed
Credit Suisse SICAV One (Lux) IndexSelection Balanced (Euro)
The notes are an integral part of the financial statements.
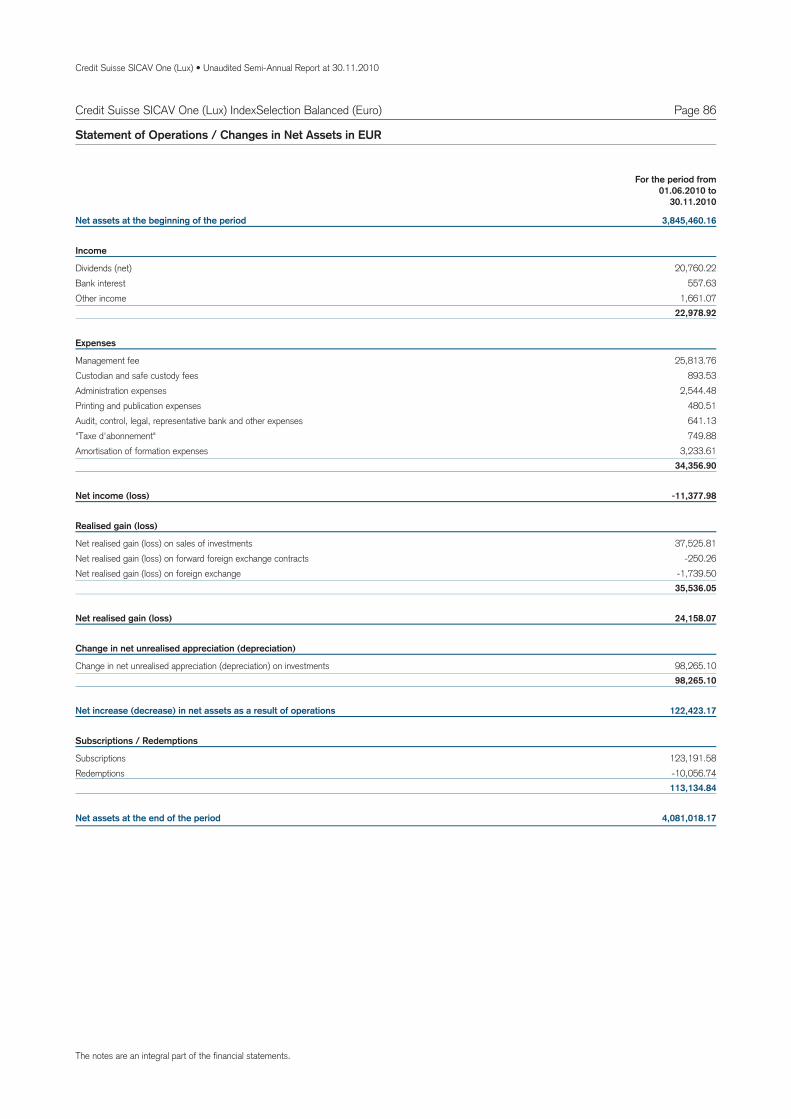
Credit Suisse SICAV One (Lux) • Unaudited Semi-Annual Report at 30.11.2010
Page 86Credit Suisse SICAV One (Lux) IndexSelection Balanced (Euro)
Net assets at the beginning of the period 3,845,460.16
Income
Dividends (net) 20,760.22Bank interest 557.63Other income 1,661.07
22,978.92
Expenses
Management fee 25,813.76Custodian and safe custody fees 893.53Administration expenses 2,544.48Printing and publication expenses 480.51Audit, control, legal, representative bank and other expenses 641.13"Taxe d'abonnement" 749.88Amortisation of formation expenses 3,233.61
34,356.90
Net income (loss) -11,377.98
Realised gain (loss)
Net realised gain (loss) on sales of investments 37,525.81Net realised gain (loss) on forward foreign exchange contracts -250.26Net realised gain (loss) on foreign exchange -1,739.50
35,536.05
Net realised gain (loss) 24,158.07
Change in net unrealised appreciation (depreciation)
Change in net unrealised appreciation (depreciation) on investments 98,265.1098,265.10
Net increase (decrease) in net assets as a result of operations 122,423.17
Subscriptions / Redemptions
Subscriptions 123,191.58Redemptions -10,056.74
113,134.84
Net assets at the end of the period 4,081,018.17
Statement of Operations / Changes in Net Assets in EUR
For the period from01.06.2010 to
30.11.2010
The notes are an integral part of the financial statements.
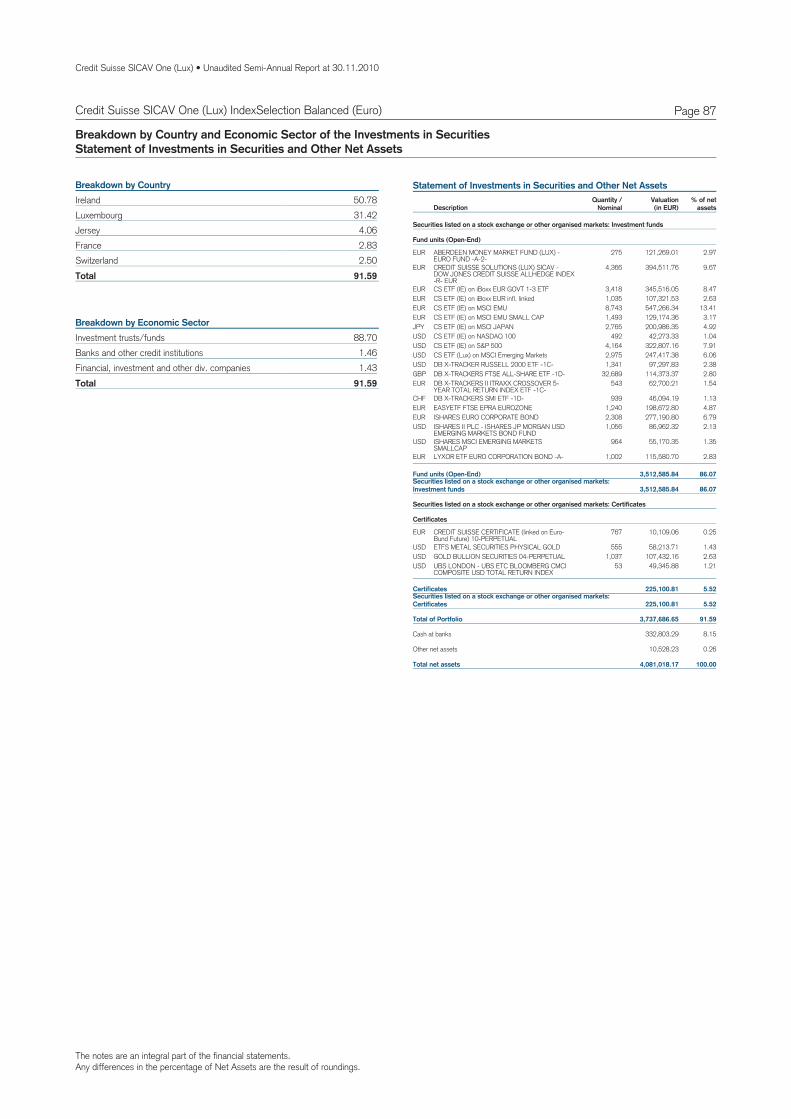
The notes are an integral part of the financial statements.Any differences in the percentage of Net Assets are the result of roundings.
Credit Suisse SICAV One (Lux) • Unaudited Semi-Annual Report at 30.11.2010
Page 87Credit Suisse SICAV One (Lux) IndexSelection Balanced (Euro)
Breakdown by Country and Economic Sector of the Investments in SecuritiesStatement of Investments in Securities and Other Net Assets
50.78IrelandBreakdown by Country
31.42Luxembourg4.06Jersey2.83France2.50Switzerland
91.59Total
88.70Investment trusts/fundsBreakdown by Economic Sector
1.46Banks and other credit institutions1.43Financial, investment and other div. companies
91.59Total
Statement of Investments in Securities and Other Net Assets
DescriptionQuantity /
NominalValuation % of net
assets(in EUR)
Securities listed on a stock exchange or other organised markets: Investment funds
Fund units (Open-End)
EUR ABERDEEN MONEY MARKET FUND (LUX) -EURO FUND -A-2-
275 121,269.01 2.97
EUR CREDIT SUISSE SOLUTIONS (LUX) SICAV -DOW JONES CREDIT SUISSE ALLHEDGE INDEX-R- EUR
4,366 394,511.76 9.67
EUR CS ETF (IE) on iBoxx EUR GOVT 1-3 ETF 3,418 345,516.05 8.47EUR CS ETF (IE) on iBoxx EUR infl. linked 1,035 107,321.53 2.63EUR CS ETF (IE) on MSCI EMU 8,743 547,266.34 13.41EUR CS ETF (IE) on MSCI EMU SMALL CAP 1,493 129,174.36 3.17JPY CS ETF (IE) on MSCI JAPAN 2,765 200,986.35 4.92USD CS ETF (IE) on NASDAQ 100 492 42,273.33 1.04USD CS ETF (IE) on S&P 500 4,164 322,807.16 7.91USD CS ETF (Lux) on MSCI Emerging Markets 2,975 247,417.38 6.06USD DB X-TRACKER RUSSELL 2000 ETF -1C- 1,341 97,297.83 2.38GBP DB X-TRACKERS FTSE ALL-SHARE ETF -1D- 32,689 114,373.37 2.80EUR DB X-TRACKERS II ITRAXX CROSSOVER 5-
YEAR TOTAL RETURN INDEX ETF -1C-543 62,700.21 1.54
CHF DB X-TRACKERS SMI ETF -1D- 939 46,094.19 1.13EUR EASYETF FTSE EPRA EUROZONE 1,240 198,672.80 4.87EUR ISHARES EURO CORPORATE BOND 2,308 277,190.80 6.79USD ISHARES II PLC - ISHARES JP MORGAN USD
EMERGING MARKETS BOND FUND1,056 86,962.32 2.13
USD ISHARES MSCI EMERGING MARKETSSMALLCAP
964 55,170.35 1.35
EUR LYXOR ETF EURO CORPORATION BOND -A- 1,002 115,580.70 2.83
Securities listed on a stock exchange or other organised markets:Investment funds 3,512,585.84 86.07
Fund units (Open-End) 3,512,585.84 86.07
Securities listed on a stock exchange or other organised markets: Certificates
Certificates
EUR CREDIT SUISSE CERTIFICATE (linked on Euro-Bund Future) 10-PERPETUAL
767 10,109.06 0.25
USD ETFS METAL SECURITIES PHYSICAL GOLD 555 58,213.71 1.43USD GOLD BULLION SECURITIES 04-PERPETUAL 1,037 107,432.16 2.63USD UBS LONDON - UBS ETC BLOOMBERG CMCI
COMPOSITE USD TOTAL RETURN INDEX53 49,345.88 1.21
Securities listed on a stock exchange or other organised markets:Certificates 225,100.81 5.52
Certificates 225,100.81 5.52
Total of Portfolio 3,737,686.65 91.59
Cash at banks 332,803.29 8.15
Other net assets 10,528.23 0.26
Total net assets 4,081,018.17 100.00

Credit Suisse SICAV One (Lux) • Unaudited Semi-Annual Report at 30.11.2010
Page 88Credit Suisse SICAV One (Lux) IndexSelection Balanced (Sfr)
Technical Data and Notes
CHFB 10348440 LU0439731851 1.30% 2.07%Capitalisation -
Valoren ISIN Management Fee Total Expense Ratio
Technical Data
CHFB 1.46%-0.34%Capitalisation - YTD Since Inception
Fund Performance
For the period from 01.12.2009 to 30.11.2010, the Portfolio Turnover Rate was 104.73%.

Credit Suisse SICAV One (Lux) • Unaudited Semi-Annual Report at 30.11.2010
Page 89
Assets
Investments in securities at market value 11,409,770.57Cash at banks 1,048,399.64Income receivable 1,056.11Prepaid expenses 8,110.82Formation expenses 37,333.64
12,504,670.78
Liabilities
Provisions for accrued expenses 36,846.5336,846.53
12,467,824.25Net assets
Statement of Net Assets in CHF and Fund Evolution
30.11.2010
101.46CHFB 102.66Capitalisation -
Total net assets
Net asset value per share
12,467,824.25 9,020,939.40CHF
Fund Evolution 30.11.2010 31.05.2010
122,889.618 41,226.628B 87,875.355 6,212.365Capitalisation - CHF
Number of shares outstanding at the endof the period
at the beginningof the period
Number of shares issued
Number of shares redeemed
Credit Suisse SICAV One (Lux) IndexSelection Balanced (Sfr)
The notes are an integral part of the financial statements.

Credit Suisse SICAV One (Lux) • Unaudited Semi-Annual Report at 30.11.2010
Page 90Credit Suisse SICAV One (Lux) IndexSelection Balanced (Sfr)
Net assets at the beginning of the period 9,020,939.40
Income
Dividends (net) 45,918.00Bank interest 287.81Other income 5,045.92
51,251.73
Expenses
Management fee 72,308.19Custodian and safe custody fees 2,503.05Administration expenses 7,363.82Printing and publication expenses 1,232.57Audit, control, legal, representative bank and other expenses 1,784.41"Taxe d'abonnement" 1,414.15Amortisation of formation expenses 4,882.72
91,488.91
Net income (loss) -40,237.18
Realised gain (loss)
Net realised gain (loss) on sales of investments -8,972.64Net realised gain (loss) on forward foreign exchange contracts -4,931.14Net realised gain (loss) on foreign exchange -25,760.70
-39,664.48
Net realised gain (loss) -79,901.66
Change in net unrealised appreciation (depreciation)
Change in net unrealised appreciation (depreciation) on investments -10,640.90-10,640.90
Net increase (decrease) in net assets as a result of operations -90,542.56
Subscriptions / Redemptions
Subscriptions 4,161,560.70Redemptions -624,133.29
3,537,427.41
Net assets at the end of the period 12,467,824.25
Statement of Operations / Changes in Net Assets in CHF
For the period from01.06.2010 to
30.11.2010
The notes are an integral part of the financial statements.

The notes are an integral part of the financial statements.Any differences in the percentage of Net Assets are the result of roundings.
Credit Suisse SICAV One (Lux) • Unaudited Semi-Annual Report at 30.11.2010
Page 91Credit Suisse SICAV One (Lux) IndexSelection Balanced (Sfr)
Breakdown by Country and Economic Sector of the Investments in SecuritiesStatement of Investments in Securities and Other Net Assets
54.10LuxembourgBreakdown by Country
21.28Ireland12.33Switzerland3.80Jersey
91.51Total
85.51Investment trusts/fundsBreakdown by Economic Sector
3.93Banks and other credit institutions2.07Financial, investment and other div. companies
91.51Total
Statement of Investments in Securities and Other Net Assets
DescriptionQuantity /
NominalValuation % of net
assets(in CHF)
Securities listed on a stock exchange or other organised markets: Investment funds
Fund units (Open-End)
CHF CREDIT SUISSE FUND (LUX) FOREIGNCORPORATE -F- (CHF)
909 935,488.26 7.50
CHF CREDIT SUISSE FUND (LUX) FOREIGNGOVERNMENT 1-5 -F- (CHF)
1,099 1,112,649.58 8.92
CHF CREDIT SUISSE FUND (LUX) MONEY MARKETSFR -B-
679 484,806.00 3.89
CHF CREDIT SUISSE INTERNATIONAL FUNDSWITZERLAND BOND INDEX AAA-BBB -F-
500 535,016.34 4.29
CHF CREDIT SUISSE SOLUTIONS (LUX) SICAV -DOW JONES CREDIT SUISSE ALLHEDGE INDEX-R- CHF
14,038 1,245,451.36 9.99
CHF CS ETF (CH) on SMIM(r) 2,746 383,067.00 3.07EUR CS ETF (IE) on iBoxx EUR infl. linked 2,082 280,103.07 2.25EUR CS ETF (IE) on MSCI EMU 4,947 401,763.80 3.22JPY CS ETF (IE) on MSCI JAPAN 6,216 586,236.78 4.70USD CS ETF (IE) on NASDAQ 100 1,158 129,092.38 1.04USD CS ETF (IE) on S&P 500 9,514 956,943.32 7.68USD CS ETF (Lux) on MSCI Emerging Markets 7,143 770,751.76 6.18USD DB X-TRACKER RUSSELL 2000 ETF -1C- 2,907 273,659.19 2.19GBP DB X-TRACKERS FTSE ALL-SHARE ETF -1D- 61,911 281,048.76 2.25EUR DB X-TRACKERS II ITRAXX CROSSOVER 5-
YEAR TOTAL RETURN INDEX ETF -1C-1,073 160,753.16 1.29
CHF DB X-TRACKERS SMI ETF -1D- 23,263 1,481,620.47 11.89USD ISHARES II PLC - ISHARES JP MORGAN USD
EMERGING MARKETS BOND FUND2,341 250,126.23 2.01
USD ISHARES MSCI EMERGING MARKETSSMALLCAP
2,385 177,095.57 1.42
Securities listed on a stock exchange or other organised markets:Investment funds 10,445,673.03 83.78
Fund units (Open-End) 10,445,673.03 83.78
Securities listed on a stock exchange or other organised markets: Certificates
Certificates
CHF CREDIT SUISSE CERTIFICATE (linked on 10-yearSwiss Federal Bond Future) 10-30.08.2011
1,102 14,425.18 0.12
CHF CREDIT SUISSE CERTIFICATE MINI-FUTURES(linked on EUR/CHF) 10-18.03.2011
259 25,304.30 0.20
USD ETFS METAL SECURITIES PHYSICAL GOLD 1,895 257,888.61 2.07USD GOLD BULLION SECURITIES 04-PERPETUAL 1,606 215,869.73 1.73USD UBS LONDON - UBS ETC BLOOMBERG CMCI
COMPOSITE USD TOTAL RETURN INDEX78 94,223.72 0.76
CHF ZUERCHER KB (linked on SWX Immofonds Index)06-PERPETUAL
1,460 356,386.00 2.85
Securities listed on a stock exchange or other organised markets:Certificates 964,097.54 7.73
Certificates 964,097.54 7.73
Total of Portfolio 11,409,770.57 91.51
Cash at banks 1,048,399.64 8.41
Other net assets 9,654.04 0.08
Total net assets 12,467,824.25 100.00

Credit Suisse SICAV One (Lux) • Unaudited Semi-Annual Report at 30.11.2010
Page 92Credit Suisse SICAV One (Lux) IndexSelection Balanced (US$)
Technical Data and Notes
USDB 10348452 LU0439732230 1.30% 2.24%Capitalisation -
Valoren ISIN Management Fee Total Expense Ratio
Technical Data
USDB 4.52%2.47%Capitalisation - YTD Since Inception
Fund Performance
For the period from 01.12.2009 to 30.11.2010, the Portfolio Turnover Rate was 152.25%.

Credit Suisse SICAV One (Lux) • Unaudited Semi-Annual Report at 30.11.2010
Page 93
Assets
Investments in securities at market value 2,997,951.79Cash at banks 262,438.12Income receivable 289.86Prepaid expenses 2,176.59Formation expenses 36,182.99
3,299,039.35
Liabilities
Provisions for accrued expenses 25,966.0625,966.06
3,273,073.29Net assets
Statement of Net Assets in USD and Fund Evolution
30.11.2010
104.52USDB 97.46Capitalisation -
Total net assets
Net asset value per share
3,273,073.29 3,036,659.24USD
Fund Evolution 30.11.2010 31.05.2010
31,316.552 160.000B 31,156.552 0.000Capitalisation - USD
Number of shares outstanding at the endof the period
at the beginningof the period
Number of shares issued
Number of shares redeemed
Credit Suisse SICAV One (Lux) IndexSelection Balanced (US$)
The notes are an integral part of the financial statements.

Credit Suisse SICAV One (Lux) • Unaudited Semi-Annual Report at 30.11.2010
Page 94Credit Suisse SICAV One (Lux) IndexSelection Balanced (US$)
Net assets at the beginning of the period 3,036,659.24
Income
Dividends (net) 19,551.42Bank interest 119.25Other income 1,451.80
21,122.47
Expenses
Management fee 20,826.02Custodian and safe custody fees 720.94Administration expenses 2,069.12Printing and publication expenses 383.40Audit, control, legal, representative bank and other expenses 509.75"Taxe d'abonnement" 608.84Amortisation of formation expenses 4,732.65
29,850.72
Net income (loss) -8,728.25
Realised gain (loss)
Net realised gain (loss) on sales of investments -56,167.21Net realised gain (loss) on forward foreign exchange contracts 217.16Net realised gain (loss) on foreign exchange 2,951.20
-52,998.85
Net realised gain (loss) -61,727.10
Change in net unrealised appreciation (depreciation)
Change in net unrealised appreciation (depreciation) on investments 282,467.55282,467.55
Net increase (decrease) in net assets as a result of operations 220,740.45
Subscriptions / Redemptions
Subscriptions 15,673.60Redemptions 0.00
15,673.60
Net assets at the end of the period 3,273,073.29
Statement of Operations / Changes in Net Assets in USD
For the period from01.06.2010 to
30.11.2010
The notes are an integral part of the financial statements.

The notes are an integral part of the financial statements.Any differences in the percentage of Net Assets are the result of roundings.
Credit Suisse SICAV One (Lux) • Unaudited Semi-Annual Report at 30.11.2010
Page 95Credit Suisse SICAV One (Lux) IndexSelection Balanced (US$)
Breakdown by Country and Economic Sector of the Investments in SecuritiesStatement of Investments in Securities and Other Net Assets
44.49IrelandBreakdown by Country
30.37Luxembourg10.09USA4.63Jersey2.01Switzerland
91.59Total
88.22Investment trusts/fundsBreakdown by Economic Sector
2.19Financial, investment and other div. companies1.18Banks and other credit institutions
91.59Total
Statement of Investments in Securities and Other Net Assets
DescriptionQuantity /
NominalValuation % of net
assets(in USD)
Securities listed on a stock exchange or other organised markets: Investment funds
Fund units (Open-End)
USD ABERDEEN MONEY MARKET FUND (LUX) - USDOLLAR FUND -A-2-
22 67,077.78 2.05
USD CREDIT SUISSE SOLUTIONS (LUX) DOW JONESCREDIT SUISSE ALLHEDGE INDEX -B-
3,560 321,859.60 9.83
USD CS ETF (IE) on iBoxx USD Govt 1-3 2,477 254,644.76 7.78USD CS ETF (IE) on iBoxx USD Govt 3-7 880 96,318.90 2.94USD CS ETF (IE) on iBoxx USD Inflation Linked 869 98,768.63 3.02EUR CS ETF (IE) on MSCI EMU 3,066 249,826.21 7.63JPY CS ETF (IE) on MSCI JAPAN 2,315 219,053.40 6.69USD CS ETF (IE) on NASDAQ 100 243 27,179.11 0.83USD CS ETF (IE) on S&P 500 2,289 230,996.72 7.06USD CS ETF (Lux) on MSCI Emerging Markets 3,034 328,462.96 10.05USD DB X-TRACKER RUSSELL 2000 ETF -1C- 816 77,071.20 2.35GBP DB X-TRACKERS FTSE ALL-SHARE ETF -1D- 28,232 128,585.67 3.93CHF DB X-TRACKERS SMI ETF -1D- 1,107 70,738.48 2.16USD ISHARES BARCLAYS 1-3 YEAR CREDIT BOND
FUND668 69,993.04 2.14
USD ISHARES FTSE EPRA/NAREIT DEVELOPEDMARKETS PROPERTY YIELD FUND
8,970 165,227.40 5.05
USD ISHARES IBOXX USD INVESTMENT GRADECORPORATE BOND FUND
1,413 155,599.56 4.75
USD ISHARES II PLC - ISHARES JP MORGAN USDEMERGING MARKETS BOND FUND
623 66,785.60 2.04
USD ISHARES MSCI EMERGING MARKETSSMALLCAP
1,002 74,649.00 2.28
USD SPDR BARCLAYS CAPITAL HIGH YIELD BONDETF
1,253 49,894.46 1.52
USD SPDR BARCLAYS CAPITAL SHORT TERMCORPORATE BOND ETF
1,809 55,047.87 1.68
Securities listed on a stock exchange or other organised markets:Investment funds 2,807,780.35 85.78
Fund units (Open-End) 2,807,780.35 85.78
Securities listed on a stock exchange or other organised markets: Certificates
Certificates
USD ETFS METAL SECURITIES PHYSICAL GOLD 526 71,820.04 2.19USD GOLD BULLION SECURITIES 04-PERPETUAL 590 79,567.40 2.44USD UBS LONDON - UBS ETC BLOOMBERG CMCI
COMPOSITE USD TOTAL RETURN INDEX32 38,784.00 1.18
Securities listed on a stock exchange or other organised markets:Certificates 190,171.44 5.81
Certificates 190,171.44 5.81
Total of Portfolio 2,997,951.79 91.59
Cash at banks 262,438.12 8.02
Other net assets 12,683.38 0.39
Total net assets 3,273,073.29 100.00

Credit Suisse SICAV One (Lux) • Unaudited Semi-Annual Report at 30.11.2010
Page 96Credit Suisse SICAV One (Lux) IndexSelection Capital Gains Oriented (Euro)
Technical Data and Notes
EURB 10348463 LU0439732669 1.40% 2.27%Capitalisation -
Valoren ISIN Management Fee Total Expense Ratio
Technical Data
EURB 8.88%4.85%Capitalisation - YTD Since Inception
Fund Performance
For the period from 01.12.2009 to 30.11.2010, the Portfolio Turnover Rate was 150.94%.

Credit Suisse SICAV One (Lux) • Unaudited Semi-Annual Report at 30.11.2010
Page 97
Assets
Investments in securities at market value 3,408,992.21Cash at banks 265,612.96Income receivable 299.81Prepaid expenses 2,339.52Formation expenses 24,722.55
3,701,967.05
Liabilities
Provisions for accrued expenses 19,555.6219,555.62
3,682,411.43Net assets
Statement of Net Assets in EUR and Fund Evolution
30.11.2010
108.88EURB 104.53Capitalisation -
Total net assets
Net asset value per share
3,682,411.43 3,354,015.72EUR
Fund Evolution 30.11.2010 31.05.2010
33,820.442 1,833.617B 32,086.825 100.000Capitalisation - EUR
Number of shares outstanding at the endof the period
at the beginningof the period
Number of shares issued
Number of shares redeemed
Credit Suisse SICAV One (Lux) IndexSelection Capital Gains Oriented (Euro)
The notes are an integral part of the financial statements.
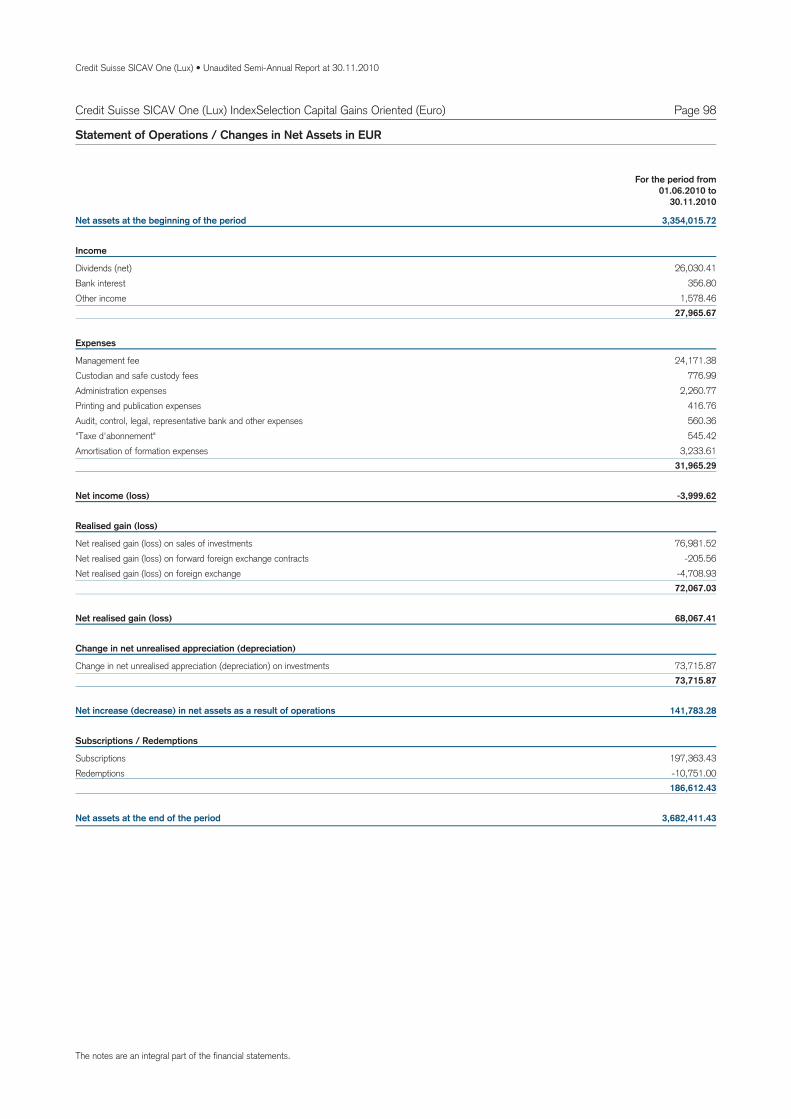
Credit Suisse SICAV One (Lux) • Unaudited Semi-Annual Report at 30.11.2010
Page 98Credit Suisse SICAV One (Lux) IndexSelection Capital Gains Oriented (Euro)
Net assets at the beginning of the period 3,354,015.72
Income
Dividends (net) 26,030.41Bank interest 356.80Other income 1,578.46
27,965.67
Expenses
Management fee 24,171.38Custodian and safe custody fees 776.99Administration expenses 2,260.77Printing and publication expenses 416.76Audit, control, legal, representative bank and other expenses 560.36"Taxe d'abonnement" 545.42Amortisation of formation expenses 3,233.61
31,965.29
Net income (loss) -3,999.62
Realised gain (loss)
Net realised gain (loss) on sales of investments 76,981.52Net realised gain (loss) on forward foreign exchange contracts -205.56Net realised gain (loss) on foreign exchange -4,708.93
72,067.03
Net realised gain (loss) 68,067.41
Change in net unrealised appreciation (depreciation)
Change in net unrealised appreciation (depreciation) on investments 73,715.8773,715.87
Net increase (decrease) in net assets as a result of operations 141,783.28
Subscriptions / Redemptions
Subscriptions 197,363.43Redemptions -10,751.00
186,612.43
Net assets at the end of the period 3,682,411.43
Statement of Operations / Changes in Net Assets in EUR
For the period from01.06.2010 to
30.11.2010
The notes are an integral part of the financial statements.
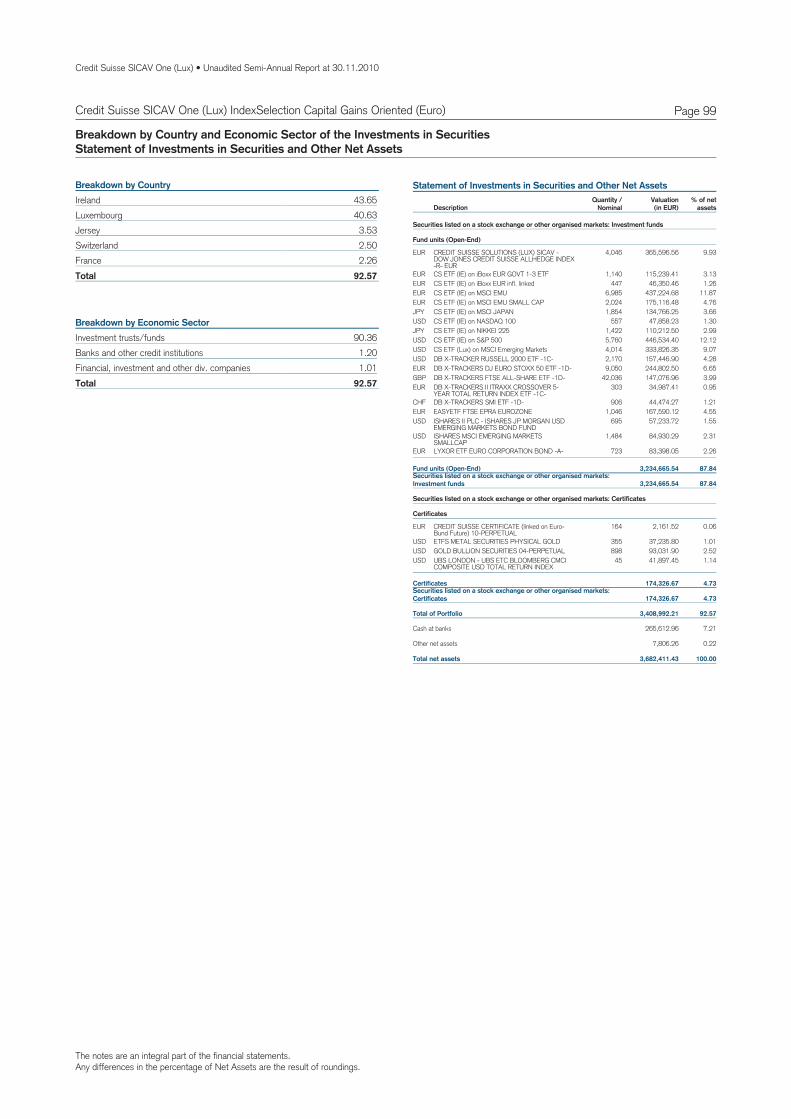
The notes are an integral part of the financial statements.Any differences in the percentage of Net Assets are the result of roundings.
Credit Suisse SICAV One (Lux) • Unaudited Semi-Annual Report at 30.11.2010
Page 99Credit Suisse SICAV One (Lux) IndexSelection Capital Gains Oriented (Euro)
Breakdown by Country and Economic Sector of the Investments in SecuritiesStatement of Investments in Securities and Other Net Assets
43.65IrelandBreakdown by Country
40.63Luxembourg3.53Jersey2.50Switzerland2.26France
92.57Total
90.36Investment trusts/fundsBreakdown by Economic Sector
1.20Banks and other credit institutions1.01Financial, investment and other div. companies
92.57Total
Statement of Investments in Securities and Other Net Assets
DescriptionQuantity /
NominalValuation % of net
assets(in EUR)
Securities listed on a stock exchange or other organised markets: Investment funds
Fund units (Open-End)
EUR CREDIT SUISSE SOLUTIONS (LUX) SICAV -DOW JONES CREDIT SUISSE ALLHEDGE INDEX-R- EUR
4,046 365,596.56 9.93
EUR CS ETF (IE) on iBoxx EUR GOVT 1-3 ETF 1,140 115,239.41 3.13EUR CS ETF (IE) on iBoxx EUR infl. linked 447 46,350.46 1.26EUR CS ETF (IE) on MSCI EMU 6,985 437,224.68 11.87EUR CS ETF (IE) on MSCI EMU SMALL CAP 2,024 175,116.48 4.76JPY CS ETF (IE) on MSCI JAPAN 1,854 134,766.25 3.66USD CS ETF (IE) on NASDAQ 100 557 47,858.23 1.30JPY CS ETF (IE) on NIKKEI 225 1,422 110,212.50 2.99USD CS ETF (IE) on S&P 500 5,760 446,534.40 12.12USD CS ETF (Lux) on MSCI Emerging Markets 4,014 333,826.35 9.07USD DB X-TRACKER RUSSELL 2000 ETF -1C- 2,170 157,446.90 4.28EUR DB X-TRACKERS DJ EURO STOXX 50 ETF -1D- 9,050 244,802.50 6.65GBP DB X-TRACKERS FTSE ALL-SHARE ETF -1D- 42,036 147,076.96 3.99EUR DB X-TRACKERS II ITRAXX CROSSOVER 5-
YEAR TOTAL RETURN INDEX ETF -1C-303 34,987.41 0.95
CHF DB X-TRACKERS SMI ETF -1D- 906 44,474.27 1.21EUR EASYETF FTSE EPRA EUROZONE 1,046 167,590.12 4.55USD ISHARES II PLC - ISHARES JP MORGAN USD
EMERGING MARKETS BOND FUND695 57,233.72 1.55
USD ISHARES MSCI EMERGING MARKETSSMALLCAP
1,484 84,930.29 2.31
EUR LYXOR ETF EURO CORPORATION BOND -A- 723 83,398.05 2.26
Securities listed on a stock exchange or other organised markets:Investment funds 3,234,665.54 87.84
Fund units (Open-End) 3,234,665.54 87.84
Securities listed on a stock exchange or other organised markets: Certificates
Certificates
EUR CREDIT SUISSE CERTIFICATE (linked on Euro-Bund Future) 10-PERPETUAL
164 2,161.52 0.06
USD ETFS METAL SECURITIES PHYSICAL GOLD 355 37,235.80 1.01USD GOLD BULLION SECURITIES 04-PERPETUAL 898 93,031.90 2.52USD UBS LONDON - UBS ETC BLOOMBERG CMCI
COMPOSITE USD TOTAL RETURN INDEX45 41,897.45 1.14
Securities listed on a stock exchange or other organised markets:Certificates 174,326.67 4.73
Certificates 174,326.67 4.73
Total of Portfolio 3,408,992.21 92.57
Cash at banks 265,612.96 7.21
Other net assets 7,806.26 0.22
Total net assets 3,682,411.43 100.00
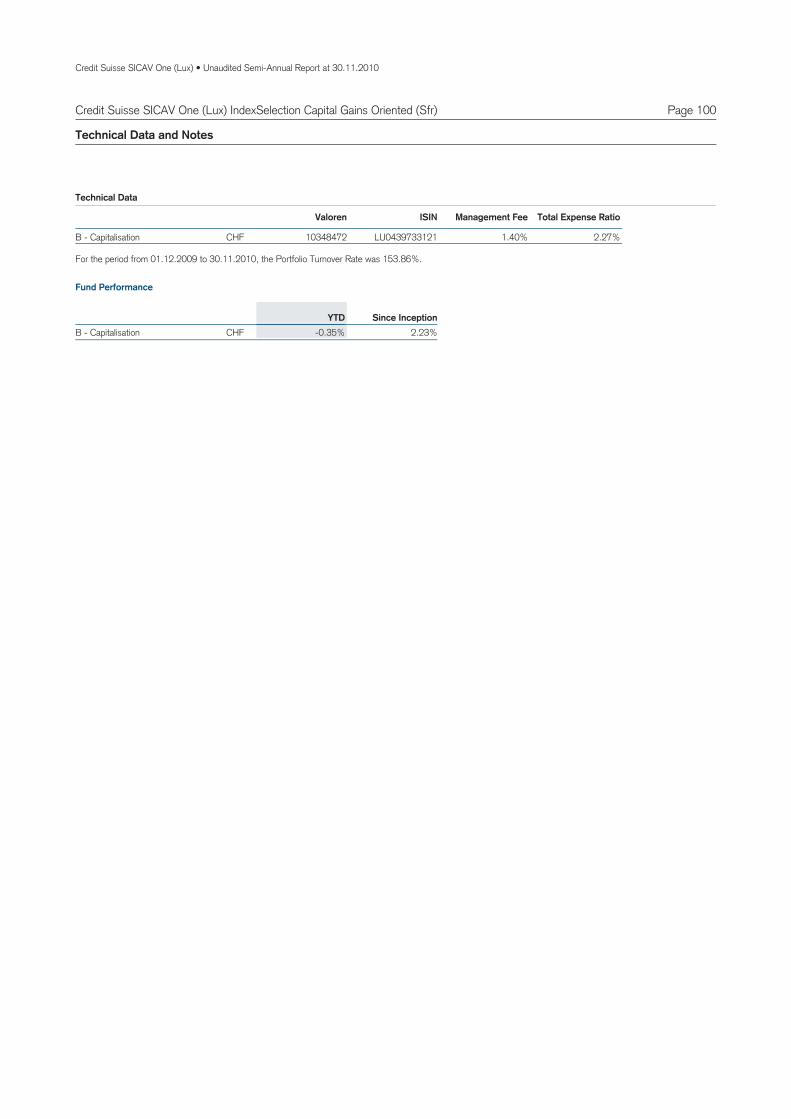
Credit Suisse SICAV One (Lux) • Unaudited Semi-Annual Report at 30.11.2010
Page 100Credit Suisse SICAV One (Lux) IndexSelection Capital Gains Oriented (Sfr)
Technical Data and Notes
CHFB 10348472 LU0439733121 1.40% 2.27%Capitalisation -
Valoren ISIN Management Fee Total Expense Ratio
Technical Data
CHFB 2.23%-0.35%Capitalisation - YTD Since Inception
Fund Performance
For the period from 01.12.2009 to 30.11.2010, the Portfolio Turnover Rate was 153.86%.

Credit Suisse SICAV One (Lux) • Unaudited Semi-Annual Report at 30.11.2010
Page 101
Assets
Investments in securities at market value 5,797,031.56Cash at banks 528,558.29Income receivable 345.00Prepaid expenses 4,164.00Formation expenses 37,333.64
6,367,432.49
Liabilities
Provisions for accrued expenses 30,424.7430,424.74
6,337,007.75Net assets
Statement of Net Assets in CHF and Fund Evolution
30.11.2010
102.23CHFB 103.32Capitalisation -
Total net assets
Net asset value per share
6,337,007.75 5,159,237.79CHF
Fund Evolution 30.11.2010 31.05.2010
61,989.095 12,549.491B 49,935.976 496.372Capitalisation - CHF
Number of shares outstanding at the endof the period
at the beginningof the period
Number of shares issued
Number of shares redeemed
Credit Suisse SICAV One (Lux) IndexSelection Capital Gains Oriented (Sfr)
The notes are an integral part of the financial statements.
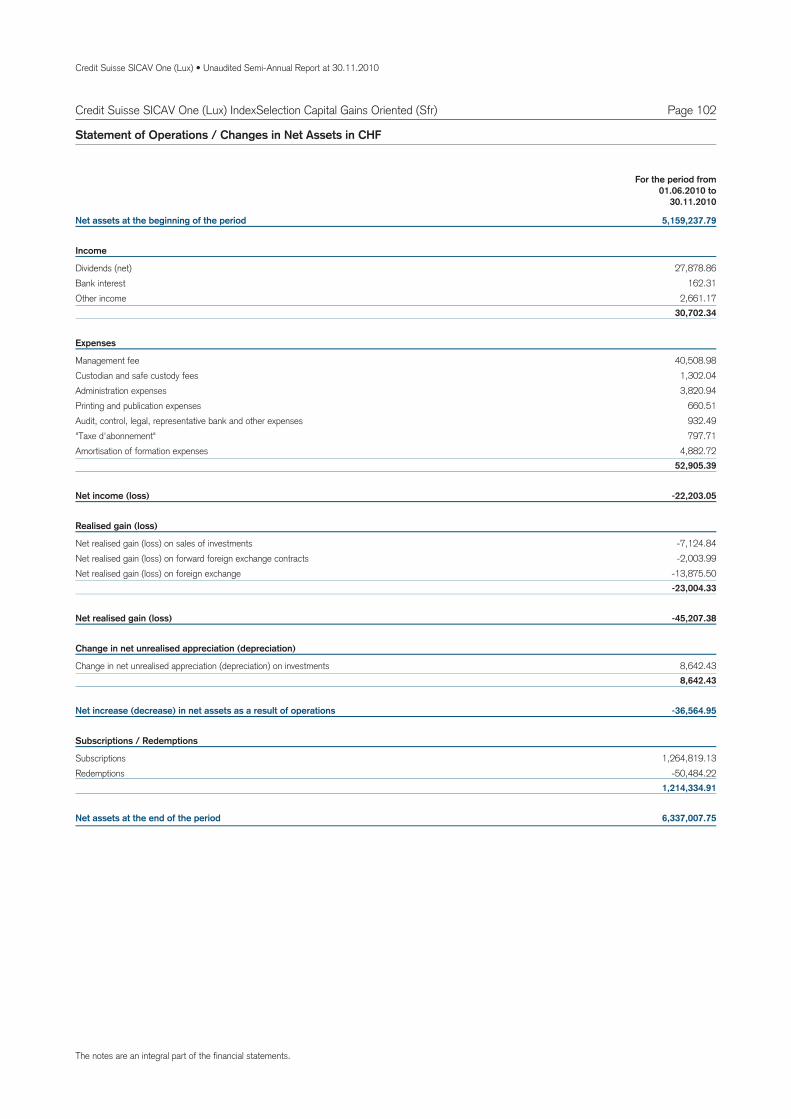
Credit Suisse SICAV One (Lux) • Unaudited Semi-Annual Report at 30.11.2010
Page 102Credit Suisse SICAV One (Lux) IndexSelection Capital Gains Oriented (Sfr)
Net assets at the beginning of the period 5,159,237.79
Income
Dividends (net) 27,878.86Bank interest 162.31Other income 2,661.17
30,702.34
Expenses
Management fee 40,508.98Custodian and safe custody fees 1,302.04Administration expenses 3,820.94Printing and publication expenses 660.51Audit, control, legal, representative bank and other expenses 932.49"Taxe d'abonnement" 797.71Amortisation of formation expenses 4,882.72
52,905.39
Net income (loss) -22,203.05
Realised gain (loss)
Net realised gain (loss) on sales of investments -7,124.84Net realised gain (loss) on forward foreign exchange contracts -2,003.99Net realised gain (loss) on foreign exchange -13,875.50
-23,004.33
Net realised gain (loss) -45,207.38
Change in net unrealised appreciation (depreciation)
Change in net unrealised appreciation (depreciation) on investments 8,642.438,642.43
Net increase (decrease) in net assets as a result of operations -36,564.95
Subscriptions / Redemptions
Subscriptions 1,264,819.13Redemptions -50,484.22
1,214,334.91
Net assets at the end of the period 6,337,007.75
Statement of Operations / Changes in Net Assets in CHF
For the period from01.06.2010 to
30.11.2010
The notes are an integral part of the financial statements.
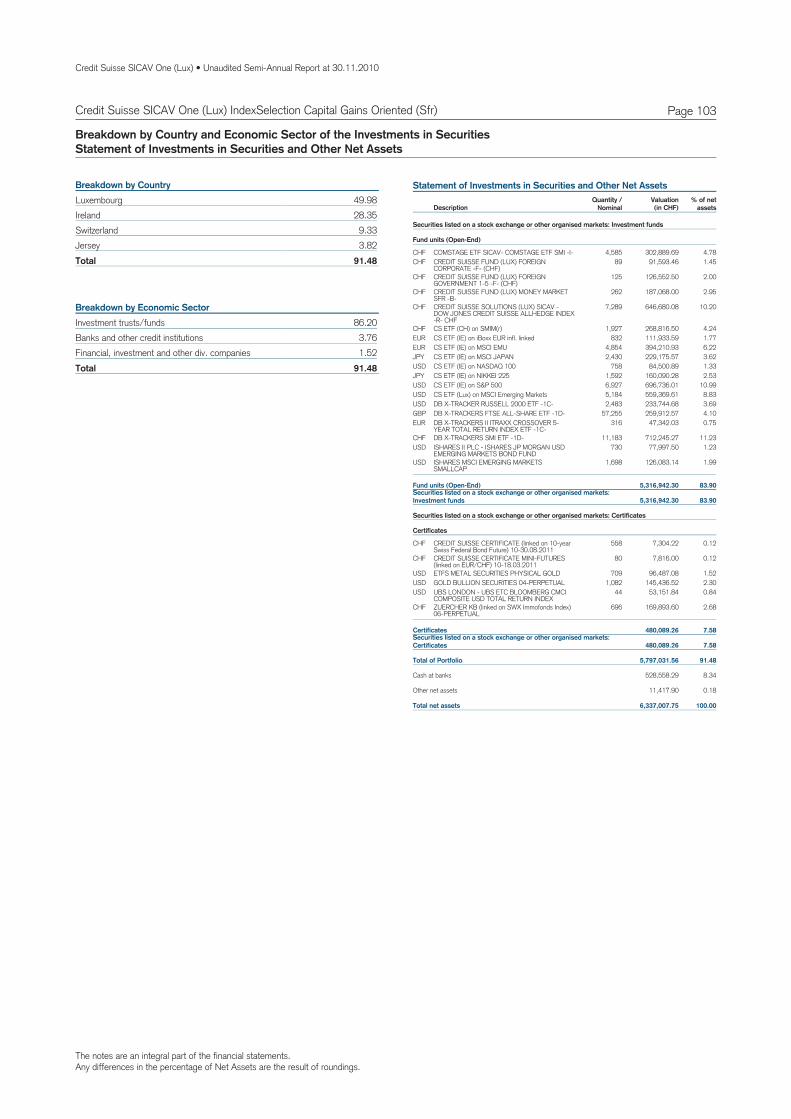
The notes are an integral part of the financial statements.Any differences in the percentage of Net Assets are the result of roundings.
Credit Suisse SICAV One (Lux) • Unaudited Semi-Annual Report at 30.11.2010
Page 103Credit Suisse SICAV One (Lux) IndexSelection Capital Gains Oriented (Sfr)
Breakdown by Country and Economic Sector of the Investments in SecuritiesStatement of Investments in Securities and Other Net Assets
49.98LuxembourgBreakdown by Country
28.35Ireland9.33Switzerland3.82Jersey
91.48Total
86.20Investment trusts/fundsBreakdown by Economic Sector
3.76Banks and other credit institutions1.52Financial, investment and other div. companies
91.48Total
Statement of Investments in Securities and Other Net Assets
DescriptionQuantity /
NominalValuation % of net
assets(in CHF)
Securities listed on a stock exchange or other organised markets: Investment funds
Fund units (Open-End)
CHF COMSTAGE ETF SICAV- COMSTAGE ETF SMI -I- 4,585 302,889.69 4.78CHF CREDIT SUISSE FUND (LUX) FOREIGN
CORPORATE -F- (CHF)89 91,593.46 1.45
CHF CREDIT SUISSE FUND (LUX) FOREIGNGOVERNMENT 1-5 -F- (CHF)
125 126,552.50 2.00
CHF CREDIT SUISSE FUND (LUX) MONEY MARKETSFR -B-
262 187,068.00 2.95
CHF CREDIT SUISSE SOLUTIONS (LUX) SICAV -DOW JONES CREDIT SUISSE ALLHEDGE INDEX-R- CHF
7,289 646,680.08 10.20
CHF CS ETF (CH) on SMIM(r) 1,927 268,816.50 4.24EUR CS ETF (IE) on iBoxx EUR infl. linked 832 111,933.59 1.77EUR CS ETF (IE) on MSCI EMU 4,854 394,210.93 6.22JPY CS ETF (IE) on MSCI JAPAN 2,430 229,175.57 3.62USD CS ETF (IE) on NASDAQ 100 758 84,500.89 1.33JPY CS ETF (IE) on NIKKEI 225 1,592 160,090.28 2.53USD CS ETF (IE) on S&P 500 6,927 696,736.01 10.99USD CS ETF (Lux) on MSCI Emerging Markets 5,184 559,369.61 8.83USD DB X-TRACKER RUSSELL 2000 ETF -1C- 2,483 233,744.68 3.69GBP DB X-TRACKERS FTSE ALL-SHARE ETF -1D- 57,255 259,912.57 4.10EUR DB X-TRACKERS II ITRAXX CROSSOVER 5-
YEAR TOTAL RETURN INDEX ETF -1C-316 47,342.03 0.75
CHF DB X-TRACKERS SMI ETF -1D- 11,183 712,245.27 11.23USD ISHARES II PLC - ISHARES JP MORGAN USD
EMERGING MARKETS BOND FUND730 77,997.50 1.23
USD ISHARES MSCI EMERGING MARKETSSMALLCAP
1,698 126,083.14 1.99
Securities listed on a stock exchange or other organised markets:Investment funds 5,316,942.30 83.90
Fund units (Open-End) 5,316,942.30 83.90
Securities listed on a stock exchange or other organised markets: Certificates
Certificates
CHF CREDIT SUISSE CERTIFICATE (linked on 10-yearSwiss Federal Bond Future) 10-30.08.2011
558 7,304.22 0.12
CHF CREDIT SUISSE CERTIFICATE MINI-FUTURES(linked on EUR/CHF) 10-18.03.2011
80 7,816.00 0.12
USD ETFS METAL SECURITIES PHYSICAL GOLD 709 96,487.08 1.52USD GOLD BULLION SECURITIES 04-PERPETUAL 1,082 145,436.52 2.30USD UBS LONDON - UBS ETC BLOOMBERG CMCI
COMPOSITE USD TOTAL RETURN INDEX44 53,151.84 0.84
CHF ZUERCHER KB (linked on SWX Immofonds Index)06-PERPETUAL
696 169,893.60 2.68
Securities listed on a stock exchange or other organised markets:Certificates 480,089.26 7.58
Certificates 480,089.26 7.58
Total of Portfolio 5,797,031.56 91.48
Cash at banks 528,558.29 8.34
Other net assets 11,417.90 0.18
Total net assets 6,337,007.75 100.00

Credit Suisse SICAV One (Lux) • Unaudited Semi-Annual Report at 30.11.2010
Page 104Credit Suisse SICAV One (Lux) IndexSelection Capital Gains Oriented (US$)
Technical Data and Notes
USDB 10348481 LU0439733634 1.40% 2.38%Capitalisation -
Valoren ISIN Management Fee Total Expense Ratio
Technical Data
USDB 4.79%2.04%Capitalisation - YTD Since Inception
Fund Performance
For the period from 01.12.2009 to 30.11.2010, the Portfolio Turnover Rate was 175.29%.

Credit Suisse SICAV One (Lux) • Unaudited Semi-Annual Report at 30.11.2010
Page 105
Assets
Investments in securities at market value 3,169,530.02Cash at banks 167,240.31Income receivable 233.13Prepaid expenses 2,240.33Formation expenses 36,182.99
3,375,426.78
Liabilities
Provisions for accrued expenses 26,343.2026,343.20
3,349,083.58Net assets
Statement of Net Assets in USD and Fund Evolution
30.11.2010
104.79USDB 96.02Capitalisation -
Total net assets
Net asset value per share
3,349,083.58 3,211,013.48USD
Fund Evolution 30.11.2010 31.05.2010
31,961.416 0.000B 33,441.416 1,480.000Capitalisation - USD
Number of shares outstanding at the endof the period
at the beginningof the period
Number of shares issued
Number of shares redeemed
Credit Suisse SICAV One (Lux) IndexSelection Capital Gains Oriented (US$)
The notes are an integral part of the financial statements.

Credit Suisse SICAV One (Lux) • Unaudited Semi-Annual Report at 30.11.2010
Page 106Credit Suisse SICAV One (Lux) IndexSelection Capital Gains Oriented (US$)
Net assets at the beginning of the period 3,211,013.48
Income
Dividends (net) 21,704.03Bank interest 118.91Other income 1,727.23
23,550.17
Expenses
Management fee 23,471.20Custodian and safe custody fees 754.43Administration expenses 2,145.84Printing and publication expenses 405.40Audit, control, legal, representative bank and other expenses 538.14"Taxe d'abonnement" 552.75Amortisation of formation expenses 4,732.65
32,600.41
Net income (loss) -9,050.24
Realised gain (loss)
Net realised gain (loss) on sales of investments -81,684.26Net realised gain (loss) on forward foreign exchange contracts 19.14Net realised gain (loss) on foreign exchange 4,328.61
-77,336.51
Net realised gain (loss) -86,386.75
Change in net unrealised appreciation (depreciation)
Change in net unrealised appreciation (depreciation) on investments 378,579.85378,579.85
Net increase (decrease) in net assets as a result of operations 292,193.10
Subscriptions / Redemptions
Subscriptions 0.00Redemptions -154,123.00
-154,123.00
Net assets at the end of the period 3,349,083.58
Statement of Operations / Changes in Net Assets in USD
For the period from01.06.2010 to
30.11.2010
The notes are an integral part of the financial statements.
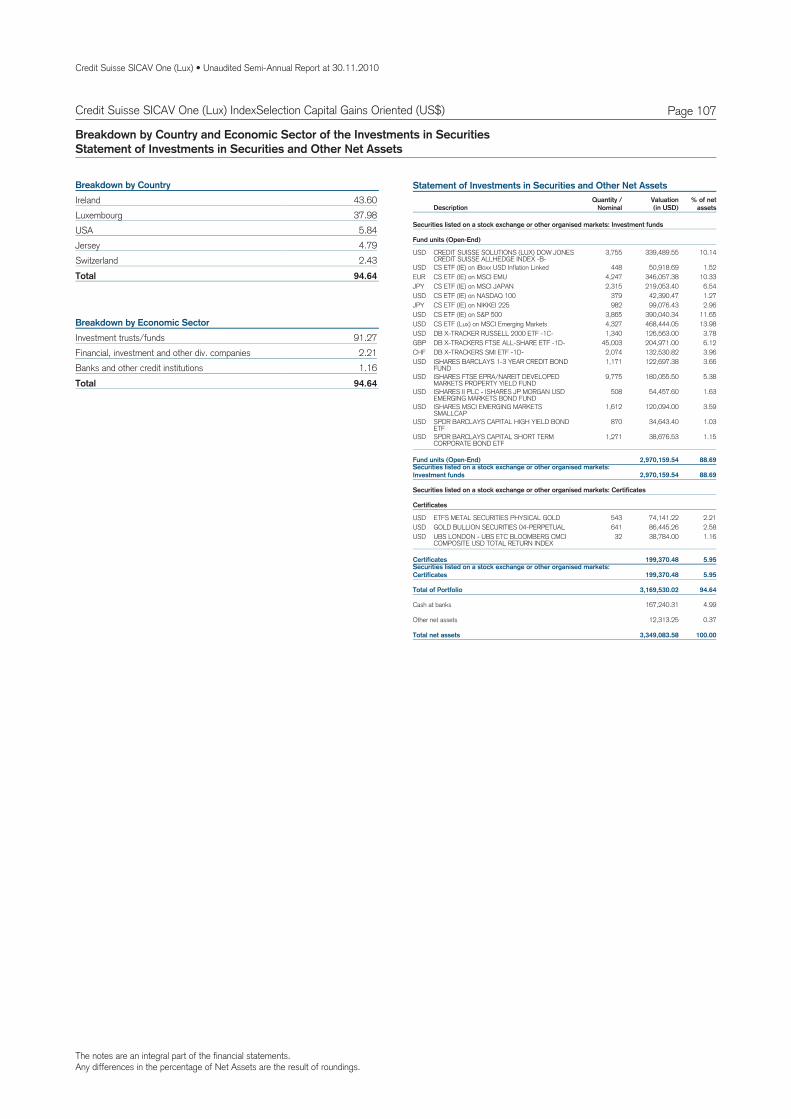
The notes are an integral part of the financial statements.Any differences in the percentage of Net Assets are the result of roundings.
Credit Suisse SICAV One (Lux) • Unaudited Semi-Annual Report at 30.11.2010
Page 107Credit Suisse SICAV One (Lux) IndexSelection Capital Gains Oriented (US$)
Breakdown by Country and Economic Sector of the Investments in SecuritiesStatement of Investments in Securities and Other Net Assets
43.60IrelandBreakdown by Country
37.98Luxembourg5.84USA4.79Jersey2.43Switzerland
94.64Total
91.27Investment trusts/fundsBreakdown by Economic Sector
2.21Financial, investment and other div. companies1.16Banks and other credit institutions
94.64Total
Statement of Investments in Securities and Other Net Assets
DescriptionQuantity /
NominalValuation % of net
assets(in USD)
Securities listed on a stock exchange or other organised markets: Investment funds
Fund units (Open-End)
USD CREDIT SUISSE SOLUTIONS (LUX) DOW JONESCREDIT SUISSE ALLHEDGE INDEX -B-
3,755 339,489.55 10.14
USD CS ETF (IE) on iBoxx USD Inflation Linked 448 50,918.69 1.52EUR CS ETF (IE) on MSCI EMU 4,247 346,057.38 10.33JPY CS ETF (IE) on MSCI JAPAN 2,315 219,053.40 6.54USD CS ETF (IE) on NASDAQ 100 379 42,390.47 1.27JPY CS ETF (IE) on NIKKEI 225 982 99,076.43 2.96USD CS ETF (IE) on S&P 500 3,865 390,040.34 11.65USD CS ETF (Lux) on MSCI Emerging Markets 4,327 468,444.05 13.98USD DB X-TRACKER RUSSELL 2000 ETF -1C- 1,340 126,563.00 3.78GBP DB X-TRACKERS FTSE ALL-SHARE ETF -1D- 45,003 204,971.00 6.12CHF DB X-TRACKERS SMI ETF -1D- 2,074 132,530.82 3.96USD ISHARES BARCLAYS 1-3 YEAR CREDIT BOND
FUND1,171 122,697.38 3.66
USD ISHARES FTSE EPRA/NAREIT DEVELOPEDMARKETS PROPERTY YIELD FUND
9,775 180,055.50 5.38
USD ISHARES II PLC - ISHARES JP MORGAN USDEMERGING MARKETS BOND FUND
508 54,457.60 1.63
USD ISHARES MSCI EMERGING MARKETSSMALLCAP
1,612 120,094.00 3.59
USD SPDR BARCLAYS CAPITAL HIGH YIELD BONDETF
870 34,643.40 1.03
USD SPDR BARCLAYS CAPITAL SHORT TERMCORPORATE BOND ETF
1,271 38,676.53 1.15
Securities listed on a stock exchange or other organised markets:Investment funds 2,970,159.54 88.69
Fund units (Open-End) 2,970,159.54 88.69
Securities listed on a stock exchange or other organised markets: Certificates
Certificates
USD ETFS METAL SECURITIES PHYSICAL GOLD 543 74,141.22 2.21USD GOLD BULLION SECURITIES 04-PERPETUAL 641 86,445.26 2.58USD UBS LONDON - UBS ETC BLOOMBERG CMCI
COMPOSITE USD TOTAL RETURN INDEX32 38,784.00 1.16
Securities listed on a stock exchange or other organised markets:Certificates 199,370.48 5.95
Certificates 199,370.48 5.95
Total of Portfolio 3,169,530.02 94.64
Cash at banks 167,240.31 4.99
Other net assets 12,313.25 0.37
Total net assets 3,349,083.58 100.00

Credit Suisse SICAV One (Lux) • Unaudited Semi-Annual Report at 30.11.2010
Page 108Credit Suisse SICAV One (Lux) IndexSelection Income Oriented (Euro)
Technical Data and Notes
EURB 10348509 LU0439734012 1.20% 1.98%Capitalisation -
Valoren ISIN Management Fee Total Expense Ratio
Technical Data
EURB 5.48%3.56%Capitalisation - YTD Since Inception
Fund Performance
For the period from 01.12.2009 to 30.11.2010, the Portfolio Turnover Rate was 100.17%.
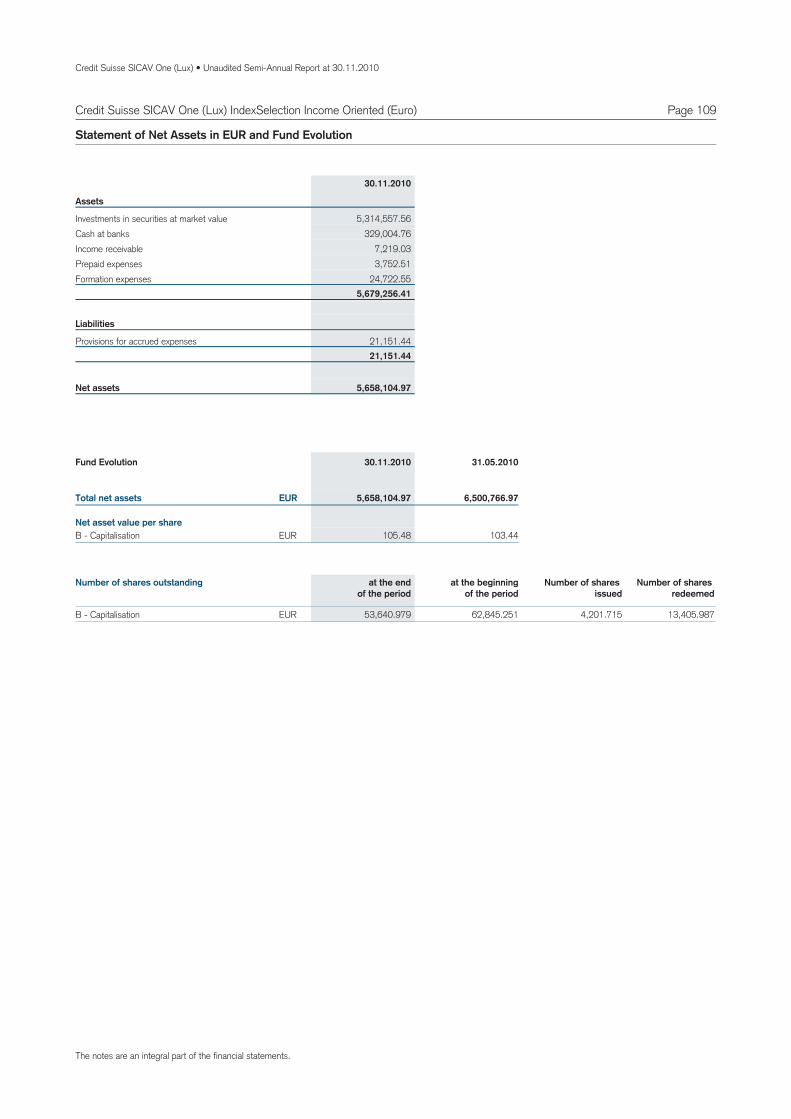
Credit Suisse SICAV One (Lux) • Unaudited Semi-Annual Report at 30.11.2010
Page 109
Assets
Investments in securities at market value 5,314,557.56Cash at banks 329,004.76Income receivable 7,219.03Prepaid expenses 3,752.51Formation expenses 24,722.55
5,679,256.41
Liabilities
Provisions for accrued expenses 21,151.4421,151.44
5,658,104.97Net assets
Statement of Net Assets in EUR and Fund Evolution
30.11.2010
105.48EURB 103.44Capitalisation -
Total net assets
Net asset value per share
5,658,104.97 6,500,766.97EUR
Fund Evolution 30.11.2010 31.05.2010
53,640.979 4,201.715B 62,845.251 13,405.987Capitalisation - EUR
Number of shares outstanding at the endof the period
at the beginningof the period
Number of shares issued
Number of shares redeemed
Credit Suisse SICAV One (Lux) IndexSelection Income Oriented (Euro)
The notes are an integral part of the financial statements.
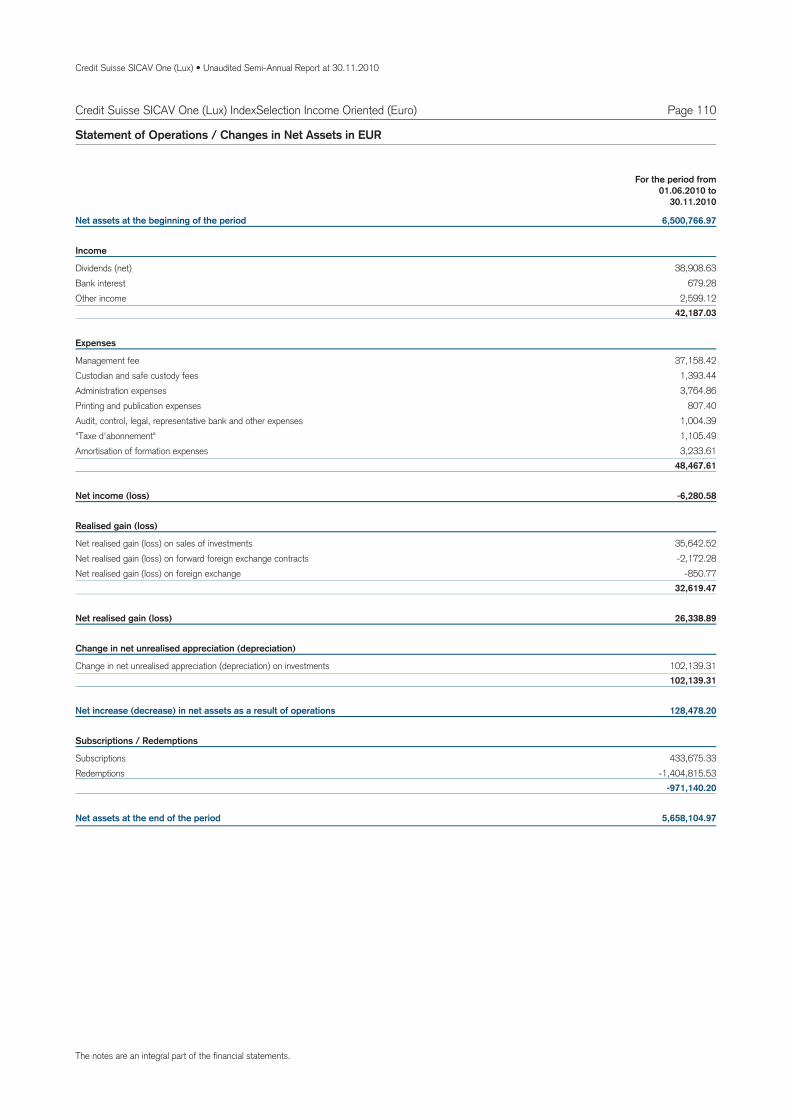
Credit Suisse SICAV One (Lux) • Unaudited Semi-Annual Report at 30.11.2010
Page 110Credit Suisse SICAV One (Lux) IndexSelection Income Oriented (Euro)
Net assets at the beginning of the period 6,500,766.97
Income
Dividends (net) 38,908.63Bank interest 679.28Other income 2,599.12
42,187.03
Expenses
Management fee 37,158.42Custodian and safe custody fees 1,393.44Administration expenses 3,764.86Printing and publication expenses 807.40Audit, control, legal, representative bank and other expenses 1,004.39"Taxe d'abonnement" 1,105.49Amortisation of formation expenses 3,233.61
48,467.61
Net income (loss) -6,280.58
Realised gain (loss)
Net realised gain (loss) on sales of investments 35,642.52Net realised gain (loss) on forward foreign exchange contracts -2,172.28Net realised gain (loss) on foreign exchange -850.77
32,619.47
Net realised gain (loss) 26,338.89
Change in net unrealised appreciation (depreciation)
Change in net unrealised appreciation (depreciation) on investments 102,139.31102,139.31
Net increase (decrease) in net assets as a result of operations 128,478.20
Subscriptions / Redemptions
Subscriptions 433,675.33Redemptions -1,404,815.53
-971,140.20
Net assets at the end of the period 5,658,104.97
Statement of Operations / Changes in Net Assets in EUR
For the period from01.06.2010 to
30.11.2010
The notes are an integral part of the financial statements.

The notes are an integral part of the financial statements.Any differences in the percentage of Net Assets are the result of roundings.
Credit Suisse SICAV One (Lux) • Unaudited Semi-Annual Report at 30.11.2010
Page 111Credit Suisse SICAV One (Lux) IndexSelection Income Oriented (Euro)
Breakdown by Country and Economic Sector of the Investments in SecuritiesStatement of Investments in Securities and Other Net Assets
48.60IrelandBreakdown by Country
29.71Luxembourg7.95France3.82Jersey1.96USA1.89Switzerland
93.93Total
90.73Investment trusts/fundsBreakdown by Economic Sector
1.89Banks and other credit institutions1.31Financial, investment and other div. companies
93.93Total
Statement of Investments in Securities and Other Net Assets
DescriptionQuantity /
NominalValuation % of net
assets(in EUR)
Securities listed on a stock exchange or other organised markets: Investment funds
Fund units (Open-End)
EUR ABERDEEN MONEY MARKET FUND (LUX) -EURO FUND -A-2-
385 169,776.61 3.00
EUR CREDIT SUISSE SOLUTIONS (LUX) SICAV -DOW JONES CREDIT SUISSE ALLHEDGE INDEX-R- EUR
7,480 675,892.80 11.95
EUR CS ETF (IE) on iBoxx EUR GOVT 1-3 ETF 7,116 719,336.52 12.71EUR CS ETF (IE) on iBoxx EUR infl. linked 3,113 322,794.13 5.70EUR CS ETF (IE) on MSCI EMU 6,197 387,899.98 6.86EUR CS ETF (IE) on MSCI EMU SMALL CAP 1,434 124,069.68 2.19JPY CS ETF (IE) on MSCI JAPAN 2,049 148,940.70 2.63USD CS ETF (IE) on S&P 500 2,257 174,970.16 3.09USD CS ETF (Lux) on MSCI Emerging Markets 3,221 267,876.10 4.73USD DB X-TRACKER RUSSELL 2000 ETF -1C- 930 67,477.24 1.19GBP DB X-TRACKERS FTSE ALL-SHARE ETF -1D- 36,849 128,928.52 2.28EUR DB X-TRACKERS II ITRAXX CROSSOVER 5-
YEAR TOTAL RETURN INDEX ETF -1C-922 106,463.34 1.88
EUR EASYETF FTSE EPRA EUROZONE 1,651 264,523.22 4.68EUR ISHARES EURO CORPORATE BOND 6,339 761,313.90 13.47USD ISHARES II PLC - ISHARES JP MORGAN USD
EMERGING MARKETS BOND FUND1,341 110,432.26 1.95
EUR LYXOR ETF EURO CORPORATION BOND -A- 1,599 184,444.65 3.26EUR LYXOR ETF EUROMTS 1-3Y 2,282 265,601.98 4.69USD POWERSHARES EMERGING MARKETS
SOVEREIGN DEBT5,362 110,679.42 1.96
Securities listed on a stock exchange or other organised markets:Investment funds 4,991,421.21 88.22
Fund units (Open-End) 4,991,421.21 88.22
Securities listed on a stock exchange or other organised markets: Certificates
Certificates
EUR CREDIT SUISSE CERTIFICATE (linked on Euro-Bund Future) 10-PERPETUAL
1,317 17,358.06 0.31
USD ETFS METAL SECURITIES PHYSICAL GOLD 706 74,052.04 1.31USD GOLD BULLION SECURITIES 04-PERPETUAL 1,374 142,345.03 2.51USD UBS LONDON - UBS ETC BLOOMBERG CMCI
COMPOSITE USD TOTAL RETURN INDEX96 89,381.22 1.58
Securities listed on a stock exchange or other organised markets:Certificates 323,136.35 5.71
Certificates 323,136.35 5.71
Total of Portfolio 5,314,557.56 93.93
Cash at banks 329,004.76 5.81
Other net assets 14,542.65 0.26
Total net assets 5,658,104.97 100.00

Credit Suisse SICAV One (Lux) • Unaudited Semi-Annual Report at 30.11.2010
Page 112Credit Suisse SICAV One (Lux) IndexSelection Income Oriented (Sfr)
Technical Data and Notes
CHFB 10348562 LU0439734368 1.20% 1.95%Capitalisation -
Valoren ISIN Management Fee Total Expense Ratio
Technical Data
CHFB 1.02%0.01%Capitalisation - YTD Since Inception
Fund Performance
For the period from 01.12.2009 to 30.11.2010, the Portfolio Turnover Rate was 90.66%.

Credit Suisse SICAV One (Lux) • Unaudited Semi-Annual Report at 30.11.2010
Page 113
Assets
Investments in securities at market value 13,411,605.86Cash at banks 1,264,742.27Income receivable 943.06Prepaid expenses 9,721.66Formation expenses 37,333.64
14,724,346.49
Liabilities
Provisions for accrued expenses 38,294.9138,294.91
14,686,051.58Net assets
Statement of Net Assets in CHF and Fund Evolution
30.11.2010
101.02CHFB 102.19Capitalisation -
Total net assets
Net asset value per share
14,686,051.58 12,133,356.87CHF
Fund Evolution 30.11.2010 31.05.2010
145,375.505 30,976.611B 118,733.376 4,334.482Capitalisation - CHF
Number of shares outstanding at the endof the period
at the beginningof the period
Number of shares issued
Number of shares redeemed
Credit Suisse SICAV One (Lux) IndexSelection Income Oriented (Sfr)
The notes are an integral part of the financial statements.
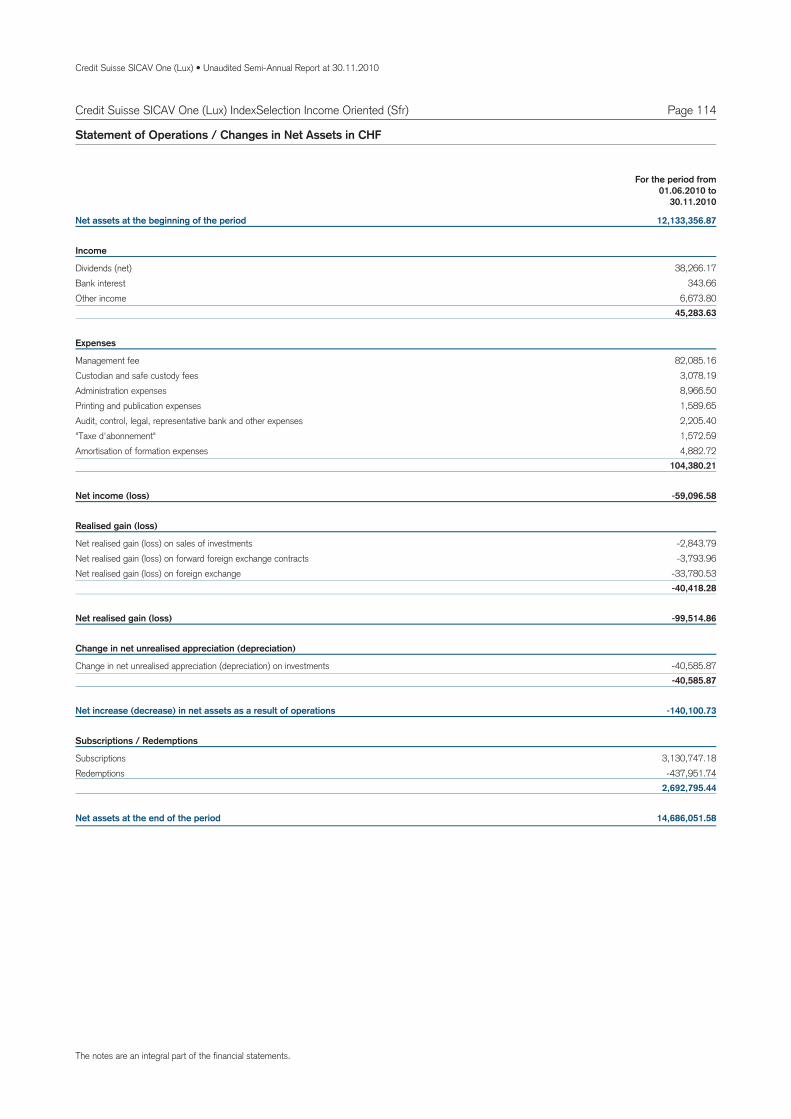
Credit Suisse SICAV One (Lux) • Unaudited Semi-Annual Report at 30.11.2010
Page 114Credit Suisse SICAV One (Lux) IndexSelection Income Oriented (Sfr)
Net assets at the beginning of the period 12,133,356.87
Income
Dividends (net) 38,266.17Bank interest 343.66Other income 6,673.80
45,283.63
Expenses
Management fee 82,085.16Custodian and safe custody fees 3,078.19Administration expenses 8,966.50Printing and publication expenses 1,589.65Audit, control, legal, representative bank and other expenses 2,205.40"Taxe d'abonnement" 1,572.59Amortisation of formation expenses 4,882.72
104,380.21
Net income (loss) -59,096.58
Realised gain (loss)
Net realised gain (loss) on sales of investments -2,843.79Net realised gain (loss) on forward foreign exchange contracts -3,793.96Net realised gain (loss) on foreign exchange -33,780.53
-40,418.28
Net realised gain (loss) -99,514.86
Change in net unrealised appreciation (depreciation)
Change in net unrealised appreciation (depreciation) on investments -40,585.87-40,585.87
Net increase (decrease) in net assets as a result of operations -140,100.73
Subscriptions / Redemptions
Subscriptions 3,130,747.18Redemptions -437,951.74
2,692,795.44
Net assets at the end of the period 14,686,051.58
Statement of Operations / Changes in Net Assets in CHF
For the period from01.06.2010 to
30.11.2010
The notes are an integral part of the financial statements.
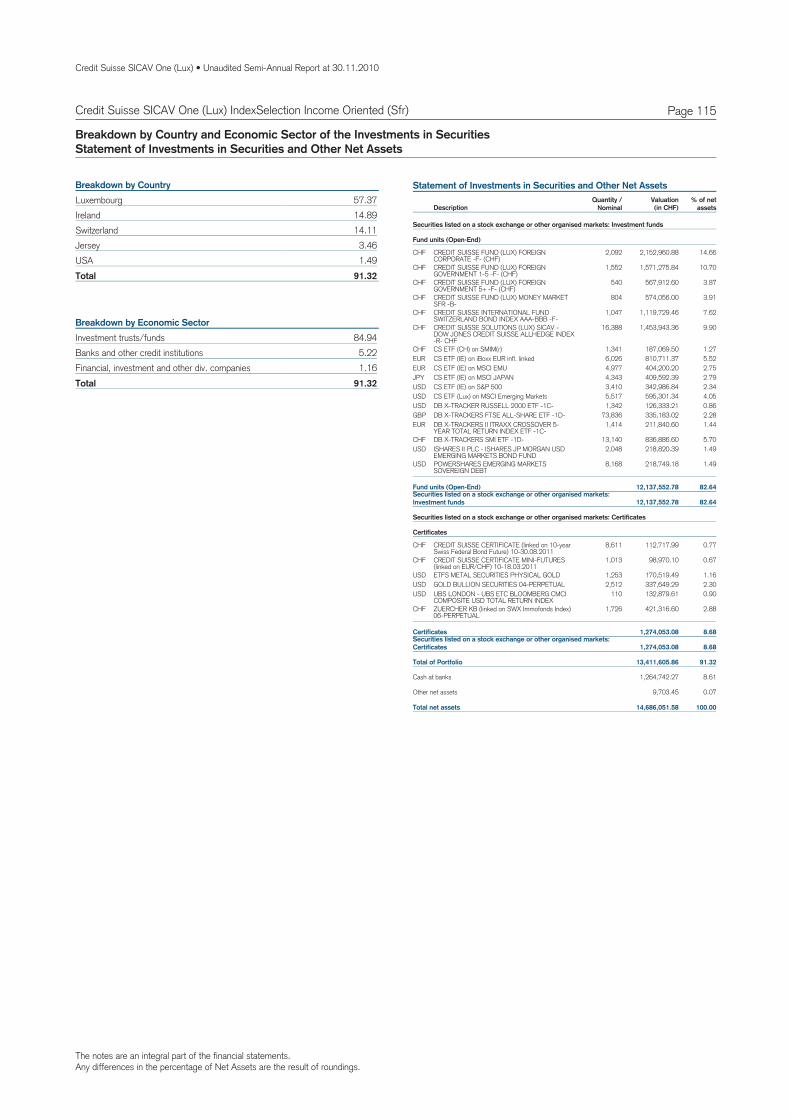
The notes are an integral part of the financial statements.Any differences in the percentage of Net Assets are the result of roundings.
Credit Suisse SICAV One (Lux) • Unaudited Semi-Annual Report at 30.11.2010
Page 115Credit Suisse SICAV One (Lux) IndexSelection Income Oriented (Sfr)
Breakdown by Country and Economic Sector of the Investments in SecuritiesStatement of Investments in Securities and Other Net Assets
57.37LuxembourgBreakdown by Country
14.89Ireland14.11Switzerland3.46Jersey1.49USA
91.32Total
84.94Investment trusts/fundsBreakdown by Economic Sector
5.22Banks and other credit institutions1.16Financial, investment and other div. companies
91.32Total
Statement of Investments in Securities and Other Net Assets
DescriptionQuantity /
NominalValuation % of net
assets(in CHF)
Securities listed on a stock exchange or other organised markets: Investment funds
Fund units (Open-End)
CHF CREDIT SUISSE FUND (LUX) FOREIGNCORPORATE -F- (CHF)
2,092 2,152,960.88 14.66
CHF CREDIT SUISSE FUND (LUX) FOREIGNGOVERNMENT 1-5 -F- (CHF)
1,552 1,571,275.84 10.70
CHF CREDIT SUISSE FUND (LUX) FOREIGNGOVERNMENT 5+ -F- (CHF)
540 567,912.60 3.87
CHF CREDIT SUISSE FUND (LUX) MONEY MARKETSFR -B-
804 574,056.00 3.91
CHF CREDIT SUISSE INTERNATIONAL FUNDSWITZERLAND BOND INDEX AAA-BBB -F-
1,047 1,119,729.46 7.62
CHF CREDIT SUISSE SOLUTIONS (LUX) SICAV -DOW JONES CREDIT SUISSE ALLHEDGE INDEX-R- CHF
16,388 1,453,943.36 9.90
CHF CS ETF (CH) on SMIM(r) 1,341 187,069.50 1.27EUR CS ETF (IE) on iBoxx EUR infl. linked 6,026 810,711.37 5.52EUR CS ETF (IE) on MSCI EMU 4,977 404,200.20 2.75JPY CS ETF (IE) on MSCI JAPAN 4,343 409,592.39 2.79USD CS ETF (IE) on S&P 500 3,410 342,986.84 2.34USD CS ETF (Lux) on MSCI Emerging Markets 5,517 595,301.34 4.05USD DB X-TRACKER RUSSELL 2000 ETF -1C- 1,342 126,333.21 0.86GBP DB X-TRACKERS FTSE ALL-SHARE ETF -1D- 73,836 335,183.02 2.28EUR DB X-TRACKERS II ITRAXX CROSSOVER 5-
YEAR TOTAL RETURN INDEX ETF -1C-1,414 211,840.60 1.44
CHF DB X-TRACKERS SMI ETF -1D- 13,140 836,886.60 5.70USD ISHARES II PLC - ISHARES JP MORGAN USD
EMERGING MARKETS BOND FUND2,048 218,820.39 1.49
USD POWERSHARES EMERGING MARKETSSOVEREIGN DEBT
8,168 218,749.18 1.49
Securities listed on a stock exchange or other organised markets:Investment funds 12,137,552.78 82.64
Fund units (Open-End) 12,137,552.78 82.64
Securities listed on a stock exchange or other organised markets: Certificates
Certificates
CHF CREDIT SUISSE CERTIFICATE (linked on 10-yearSwiss Federal Bond Future) 10-30.08.2011
8,611 112,717.99 0.77
CHF CREDIT SUISSE CERTIFICATE MINI-FUTURES(linked on EUR/CHF) 10-18.03.2011
1,013 98,970.10 0.67
USD ETFS METAL SECURITIES PHYSICAL GOLD 1,253 170,519.49 1.16USD GOLD BULLION SECURITIES 04-PERPETUAL 2,512 337,649.29 2.30USD UBS LONDON - UBS ETC BLOOMBERG CMCI
COMPOSITE USD TOTAL RETURN INDEX110 132,879.61 0.90
CHF ZUERCHER KB (linked on SWX Immofonds Index)06-PERPETUAL
1,726 421,316.60 2.88
Securities listed on a stock exchange or other organised markets:Certificates 1,274,053.08 8.68
Certificates 1,274,053.08 8.68
Total of Portfolio 13,411,605.86 91.32
Cash at banks 1,264,742.27 8.61
Other net assets 9,703.45 0.07
Total net assets 14,686,051.58 100.00
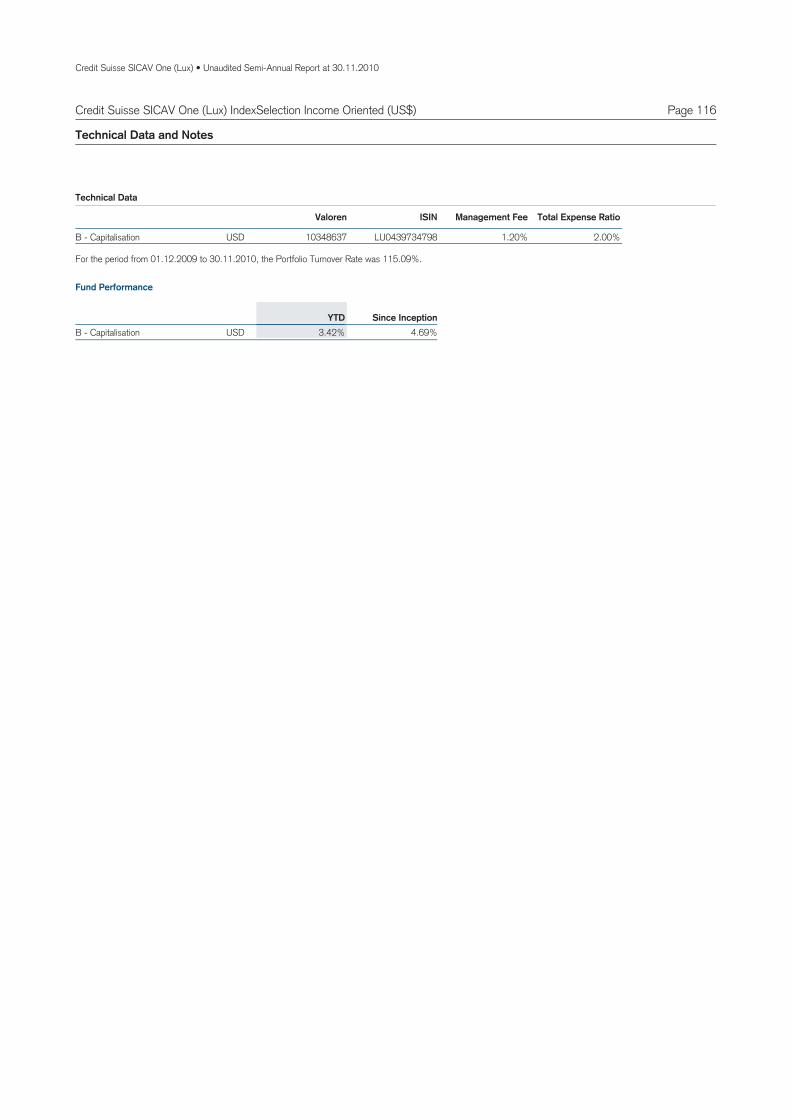
Credit Suisse SICAV One (Lux) • Unaudited Semi-Annual Report at 30.11.2010
Page 116Credit Suisse SICAV One (Lux) IndexSelection Income Oriented (US$)
Technical Data and Notes
USDB 10348637 LU0439734798 1.20% 2.00%Capitalisation -
Valoren ISIN Management Fee Total Expense Ratio
Technical Data
USDB 4.69%3.42%Capitalisation - YTD Since Inception
Fund Performance
For the period from 01.12.2009 to 30.11.2010, the Portfolio Turnover Rate was 115.09%.

Credit Suisse SICAV One (Lux) • Unaudited Semi-Annual Report at 30.11.2010
Page 117
Assets
Investments in securities at market value 9,245,033.08Cash at banks 640,078.51Income receivable 619.10Prepaid expenses 6,331.56Formation expenses 36,182.99
9,928,245.24
Liabilities
Provisions for accrued expenses 32,844.7932,844.79
9,895,400.45Net assets
Statement of Net Assets in USD and Fund Evolution
30.11.2010
104.69USDB 99.40Capitalisation -
Total net assets
Net asset value per share
9,895,400.45 10,400,259.04USD
Fund Evolution 30.11.2010 31.05.2010
94,517.343 14,368.936B 104,634.693 24,486.286Capitalisation - USD
Number of shares outstanding at the endof the period
at the beginningof the period
Number of shares issued
Number of shares redeemed
Credit Suisse SICAV One (Lux) IndexSelection Income Oriented (US$)
The notes are an integral part of the financial statements.
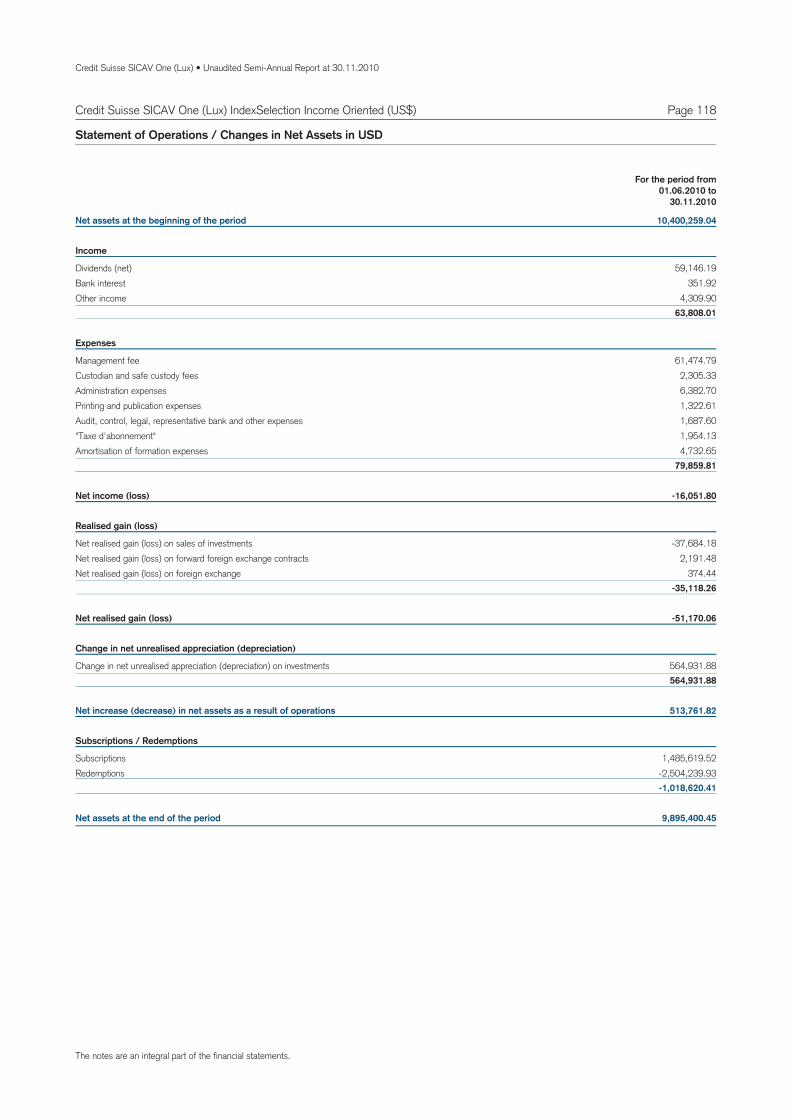
Credit Suisse SICAV One (Lux) • Unaudited Semi-Annual Report at 30.11.2010
Page 118Credit Suisse SICAV One (Lux) IndexSelection Income Oriented (US$)
Net assets at the beginning of the period 10,400,259.04
Income
Dividends (net) 59,146.19Bank interest 351.92Other income 4,309.90
63,808.01
Expenses
Management fee 61,474.79Custodian and safe custody fees 2,305.33Administration expenses 6,382.70Printing and publication expenses 1,322.61Audit, control, legal, representative bank and other expenses 1,687.60"Taxe d'abonnement" 1,954.13Amortisation of formation expenses 4,732.65
79,859.81
Net income (loss) -16,051.80
Realised gain (loss)
Net realised gain (loss) on sales of investments -37,684.18Net realised gain (loss) on forward foreign exchange contracts 2,191.48Net realised gain (loss) on foreign exchange 374.44
-35,118.26
Net realised gain (loss) -51,170.06
Change in net unrealised appreciation (depreciation)
Change in net unrealised appreciation (depreciation) on investments 564,931.88564,931.88
Net increase (decrease) in net assets as a result of operations 513,761.82
Subscriptions / Redemptions
Subscriptions 1,485,619.52Redemptions -2,504,239.93
-1,018,620.41
Net assets at the end of the period 9,895,400.45
Statement of Operations / Changes in Net Assets in USD
For the period from01.06.2010 to
30.11.2010
The notes are an integral part of the financial statements.

The notes are an integral part of the financial statements.Any differences in the percentage of Net Assets are the result of roundings.
Credit Suisse SICAV One (Lux) • Unaudited Semi-Annual Report at 30.11.2010
Page 119Credit Suisse SICAV One (Lux) IndexSelection Income Oriented (US$)
Breakdown by Country and Economic Sector of the Investments in SecuritiesStatement of Investments in Securities and Other Net Assets
41.47IrelandBreakdown by Country
25.57Luxembourg20.39USA4.63Jersey1.37Switzerland
93.43Total
89.67Investment trusts/fundsBreakdown by Economic Sector
2.39Financial, investment and other div. companies1.37Banks and other credit institutions
93.43Total
Statement of Investments in Securities and Other Net Assets
DescriptionQuantity /
NominalValuation % of net
assets(in USD)
Securities listed on a stock exchange or other organised markets: Investment funds
Fund units (Open-End)
USD ABERDEEN MONEY MARKET FUND (LUX) - USDOLLAR FUND -A-2-
94 286,605.06 2.90
USD CREDIT SUISSE SOLUTIONS (LUX) DOW JONESCREDIT SUISSE ALLHEDGE INDEX -B-
12,637 1,142,511.17 11.56
USD CS ETF (IE) on iBoxx USD Govt 1-3 5,986 615,382.95 6.22USD CS ETF (IE) on iBoxx USD Govt 3-7 5,255 575,177.09 5.81USD CS ETF (IE) on iBoxx USD Inflation Linked 5,427 616,820.88 6.23EUR CS ETF (IE) on MSCI EMU 4,718 384,435.77 3.88JPY CS ETF (IE) on MSCI JAPAN 4,572 432,618.64 4.37USD CS ETF (IE) on S&P 500 2,641 266,519.16 2.69USD CS ETF (Lux) on MSCI Emerging Markets 5,792 627,045.97 6.34USD DB X-TRACKER RUSSELL 2000 ETF -1C- 1,607 151,781.15 1.53GBP DB X-TRACKERS FTSE ALL-SHARE ETF -1D- 42,918 195,474.64 1.98CHF DB X-TRACKERS SMI ETF -1D- 1,944 124,223.68 1.26USD ISHARES BARCLAYS 1-3 YEAR CREDIT BOND
FUND6,712 703,283.36 7.11
USD ISHARES FTSE EPRA/NAREIT DEVELOPEDMARKETS PROPERTY YIELD FUND
27,031 497,911.02 5.03
USD ISHARES IBOXX USD INVESTMENT GRADECORPORATE BOND FUND
5,968 657,196.16 6.64
USD ISHARES II PLC - ISHARES JP MORGAN USDEMERGING MARKETS BOND FUND
1,296 138,931.20 1.40
USD ISHARES PLC - ISHARES BARCLAYS CAPITALUSD TREASURY BOND 1-3
4,397 578,073.59 5.84
USD POWERSHARES EMERGING MARKETSSOVEREIGN DEBT
5,186 139,347.82 1.41
USD SPDR BARCLAYS CAPITAL HIGH YIELD BONDETF
4,249 169,195.18 1.71
USD SPDR BARCLAYS CAPITAL SHORT TERMCORPORATE BOND ETF
11,459 348,697.37 3.52
Securities listed on a stock exchange or other organised markets:Investment funds 8,651,231.86 87.43
Fund units (Open-End) 8,651,231.86 87.43
Securities listed on a stock exchange or other organised markets: Certificates
Certificates
USD ETFS METAL SECURITIES PHYSICAL GOLD 1,729 236,077.66 2.39USD GOLD BULLION SECURITIES 04-PERPETUAL 1,646 221,979.56 2.24USD UBS LONDON - UBS ETC BLOOMBERG CMCI
COMPOSITE USD TOTAL RETURN INDEX112 135,744.00 1.37
Securities listed on a stock exchange or other organised markets:Certificates 593,801.22 6.00
Certificates 593,801.22 6.00
Total of Portfolio 9,245,033.08 93.43
Cash at banks 640,078.51 6.47
Other net assets 10,288.86 0.10
Total net assets 9,895,400.45 100.00
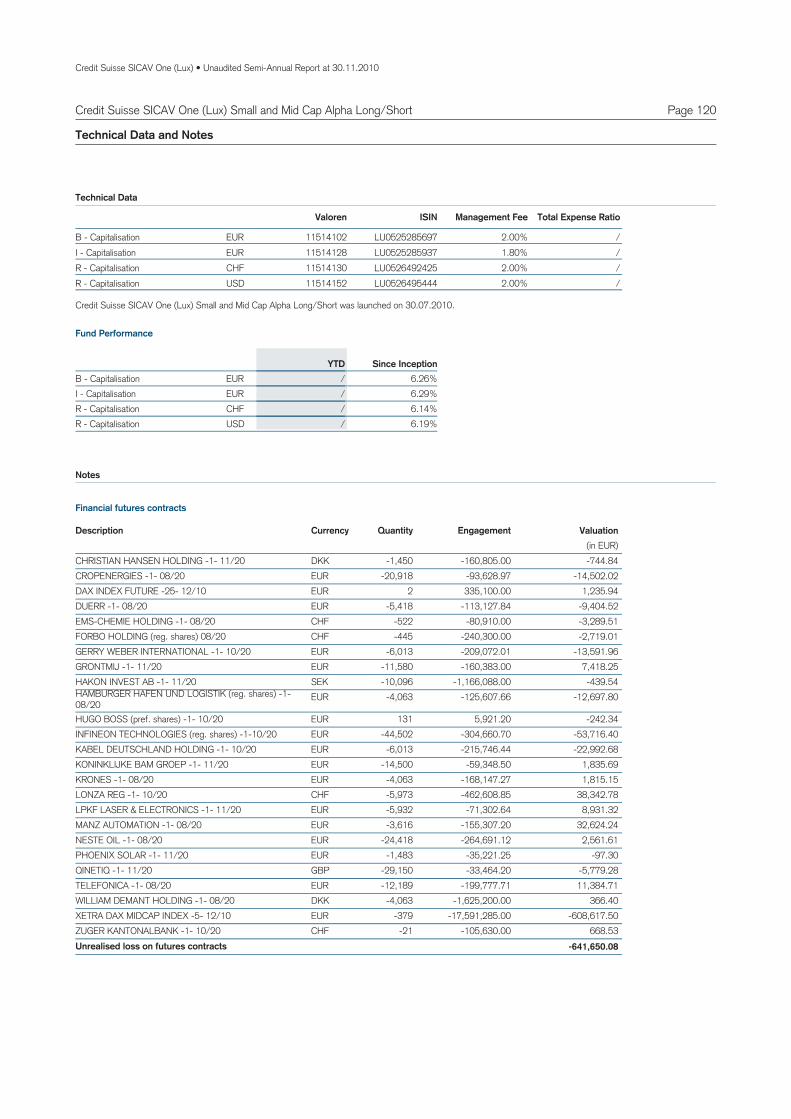
Credit Suisse SICAV One (Lux) • Unaudited Semi-Annual Report at 30.11.2010
Page 120Credit Suisse SICAV One (Lux) Small and Mid Cap Alpha Long/Short
Technical Data and Notes
EURB 11514102 LU0525285697 2.00% /Capitalisation -
Valoren ISIN Management Fee Total Expense Ratio
EURI 11514128 LU0525285937 1.80% /Capitalisation - CHFR 11514130 LU0526492425 2.00% /Capitalisation - USDR 11514152 LU0526495444 2.00% /Capitalisation -
Technical Data
EURB 6.26%/Capitalisation - YTD Since Inception
EURI 6.29%/Capitalisation - CHFR 6.14%/Capitalisation - USDR 6.19%/Capitalisation -
Fund Performance
Notes
Credit Suisse SICAV One (Lux) Small and Mid Cap Alpha Long/Short was launched on 30.07.2010.
DKKCHRISTIAN HANSEN HOLDING -1- 11/20 -1,450 -160,805.00 -744.84EURCROPENERGIES -1- 08/20 -20,918 -93,628.97 -14,502.02EURDAX INDEX FUTURE -25- 12/10 2 335,100.00 1,235.94EURDUERR -1- 08/20 -5,418 -113,127.84 -9,404.52CHFEMS-CHEMIE HOLDING -1- 08/20 -522 -80,910.00 -3,289.51CHFFORBO HOLDING (reg. shares) 08/20 -445 -240,300.00 -2,719.01EURGERRY WEBER INTERNATIONAL -1- 10/20 -6,013 -209,072.01 -13,591.96EURGRONTMIJ -1- 11/20 -11,580 -160,383.00 7,418.25SEKHAKON INVEST AB -1- 11/20 -10,096 -1,166,088.00 -439.54EURHAMBURGER HAFEN UND LOGISTIK (reg. shares) -1-
08/20-4,063 -125,607.66 -12,697.80
EURHUGO BOSS (pref. shares) -1- 10/20 131 5,921.20 -242.34EURINFINEON TECHNOLOGIES (reg. shares) -1-10/20 -44,502 -304,660.70 -53,716.40EURKABEL DEUTSCHLAND HOLDING -1- 10/20 -6,013 -215,746.44 -22,992.68EURKONINKLIJKE BAM GROEP -1- 11/20 -14,500 -59,348.50 1,835.69EURKRONES -1- 08/20 -4,063 -168,147.27 1,815.15CHFLONZA REG -1- 10/20 -5,973 -462,608.85 38,342.78EURLPKF LASER & ELECTRONICS -1- 11/20 -5,932 -71,302.64 8,931.32EURMANZ AUTOMATION -1- 08/20 -3,616 -155,307.20 32,624.24EURNESTE OIL -1- 08/20 -24,418 -264,691.12 2,561.61EURPHOENIX SOLAR -1- 11/20 -1,483 -35,221.25 -97.30GBPQINETIQ -1- 11/20 -29,150 -33,464.20 -5,779.28EURTELEFONICA -1- 08/20 -12,189 -199,777.71 11,384.71DKKWILLIAM DEMANT HOLDING -1- 08/20 -4,063 -1,625,200.00 366.40EURXETRA DAX MIDCAP INDEX -5- 12/10 -379 -17,591,285.00 -608,617.50CHFZUGER KANTONALBANK -1- 10/20 -21 -105,630.00 668.53
-641,650.08Unrealised loss on futures contracts
Quantity EngagementDescription Currency Valuation(in EUR)
Financial futures contracts
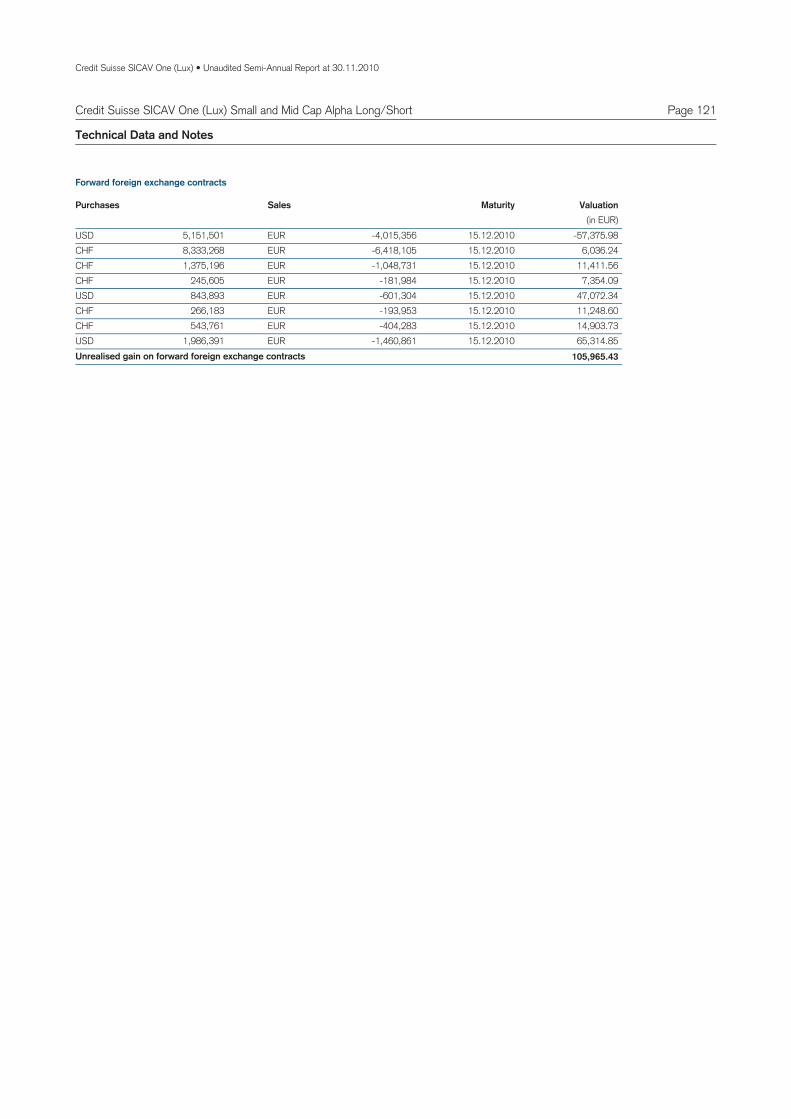
Credit Suisse SICAV One (Lux) • Unaudited Semi-Annual Report at 30.11.2010
Page 121Credit Suisse SICAV One (Lux) Small and Mid Cap Alpha Long/Short
Technical Data and Notes
5,151,501USD EUR -4,015,356 -57,375.9815.12.20108,333,268CHF EUR -6,418,105 6,036.2415.12.20101,375,196CHF EUR -1,048,731 11,411.5615.12.2010
245,605CHF EUR -181,984 7,354.0915.12.2010843,893USD EUR -601,304 47,072.3415.12.2010266,183CHF EUR -193,953 11,248.6015.12.2010543,761CHF EUR -404,283 14,903.7315.12.2010
1,986,391USD EUR -1,460,861 65,314.8515.12.2010105,965.43Unrealised gain on forward foreign exchange contracts
SalesPurchases Valuation(in EUR)
Maturity
Forward foreign exchange contracts
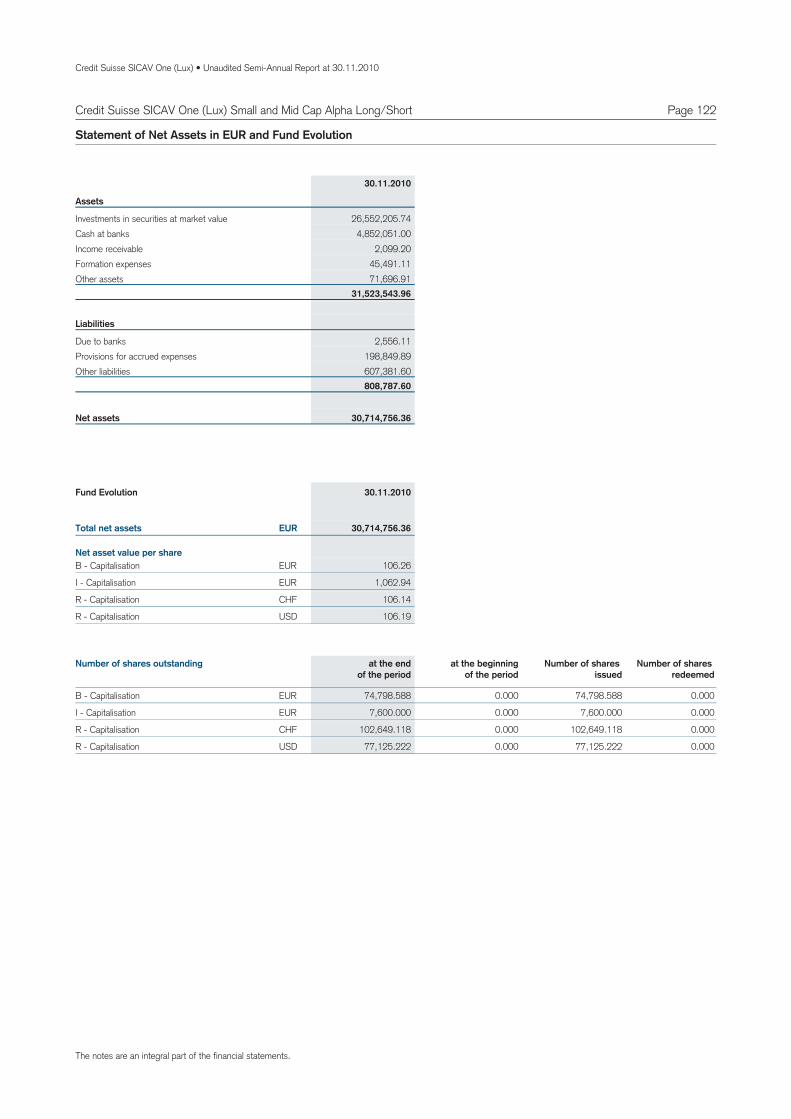
Credit Suisse SICAV One (Lux) • Unaudited Semi-Annual Report at 30.11.2010
Page 122
Assets
Investments in securities at market value 26,552,205.74Cash at banks 4,852,051.00Income receivable 2,099.20Formation expenses 45,491.11Other assets 71,696.91
31,523,543.96
Liabilities
Due to banks 2,556.11Provisions for accrued expenses 198,849.89Other liabilities 607,381.60
808,787.60
30,714,756.36Net assets
Statement of Net Assets in EUR and Fund Evolution
30.11.2010
106.26EURB Capitalisation -
1,062.94EURI Capitalisation -
106.14CHFR Capitalisation -
106.19USDR Capitalisation -
Total net assets
Net asset value per share
30,714,756.36EUR
Fund Evolution 30.11.2010
74,798.588 74,798.588B 0.000 0.000Capitalisation - EUR
7,600.000 7,600.000I 0.000 0.000Capitalisation - EUR
102,649.118 102,649.118R 0.000 0.000Capitalisation - CHF
77,125.222 77,125.222R 0.000 0.000Capitalisation - USD
Number of shares outstanding at the endof the period
at the beginningof the period
Number of shares issued
Number of shares redeemed
Credit Suisse SICAV One (Lux) Small and Mid Cap Alpha Long/Short
The notes are an integral part of the financial statements.
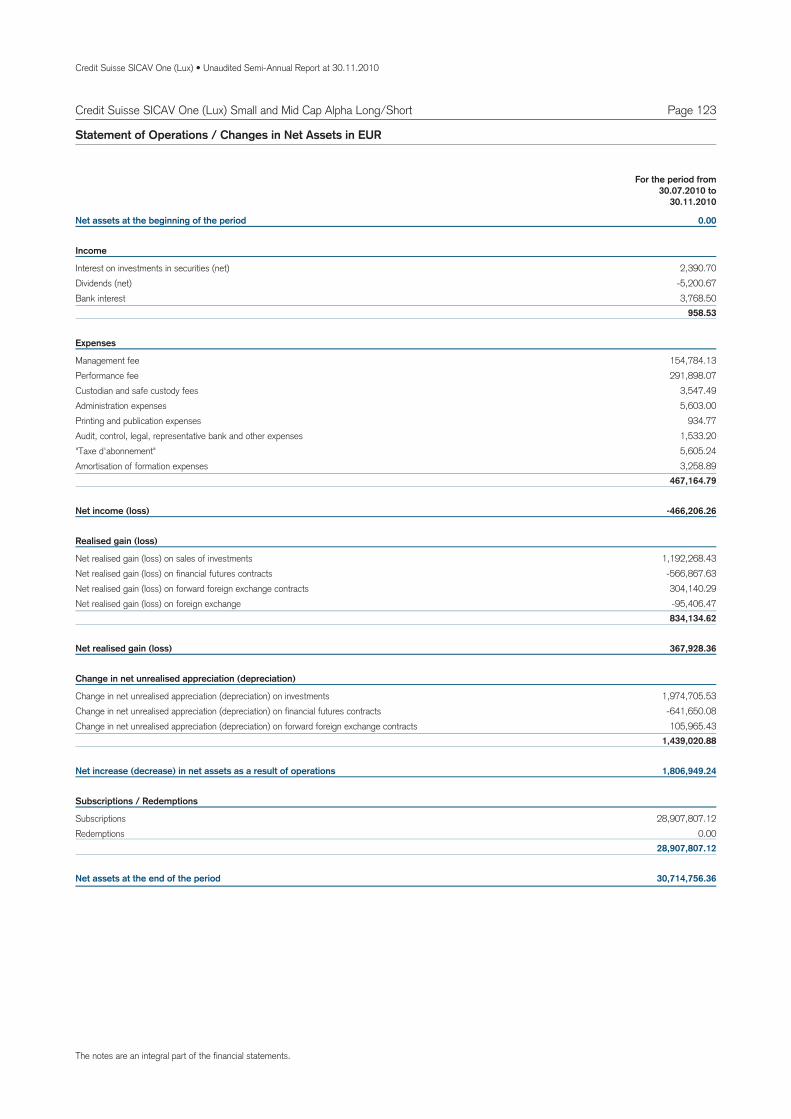
Credit Suisse SICAV One (Lux) • Unaudited Semi-Annual Report at 30.11.2010
Page 123Credit Suisse SICAV One (Lux) Small and Mid Cap Alpha Long/Short
Net assets at the beginning of the period 0.00
Income
Interest on investments in securities (net) 2,390.70Dividends (net) -5,200.67Bank interest 3,768.50
958.53
Expenses
Management fee 154,784.13Performance fee 291,898.07Custodian and safe custody fees 3,547.49Administration expenses 5,603.00Printing and publication expenses 934.77Audit, control, legal, representative bank and other expenses 1,533.20"Taxe d'abonnement" 5,605.24Amortisation of formation expenses 3,258.89
467,164.79
Net income (loss) -466,206.26
Realised gain (loss)
Net realised gain (loss) on sales of investments 1,192,268.43Net realised gain (loss) on financial futures contracts -566,867.63Net realised gain (loss) on forward foreign exchange contracts 304,140.29Net realised gain (loss) on foreign exchange -95,406.47
834,134.62
Net realised gain (loss) 367,928.36
Change in net unrealised appreciation (depreciation)
Change in net unrealised appreciation (depreciation) on investments 1,974,705.53Change in net unrealised appreciation (depreciation) on financial futures contracts -641,650.08Change in net unrealised appreciation (depreciation) on forward foreign exchange contracts 105,965.43
1,439,020.88
Net increase (decrease) in net assets as a result of operations 1,806,949.24
Subscriptions / Redemptions
Subscriptions 28,907,807.12Redemptions 0.00
28,907,807.12
Net assets at the end of the period 30,714,756.36
Statement of Operations / Changes in Net Assets in EUR
For the period from30.07.2010 to
30.11.2010
The notes are an integral part of the financial statements.
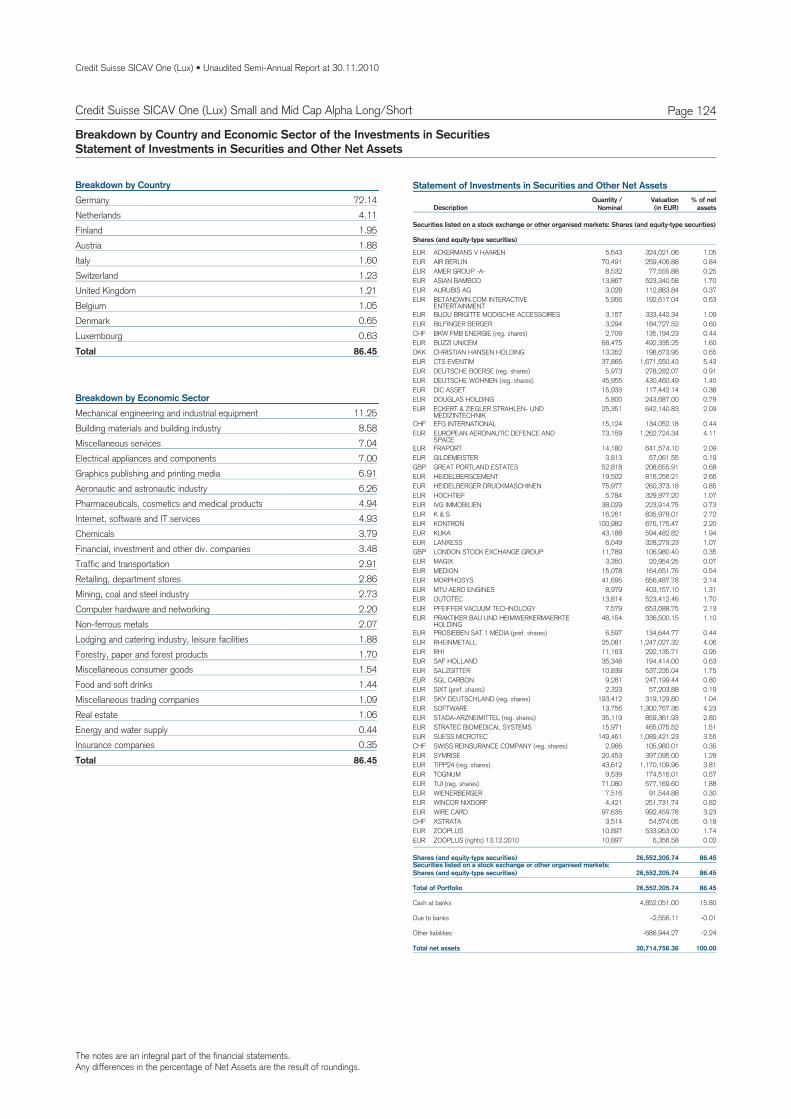
The notes are an integral part of the financial statements.Any differences in the percentage of Net Assets are the result of roundings.
Credit Suisse SICAV One (Lux) • Unaudited Semi-Annual Report at 30.11.2010
Page 124Credit Suisse SICAV One (Lux) Small and Mid Cap Alpha Long/Short
Breakdown by Country and Economic Sector of the Investments in SecuritiesStatement of Investments in Securities and Other Net Assets
72.14GermanyBreakdown by Country
4.11Netherlands1.95Finland1.88Austria1.60Italy1.23Switzerland1.21United Kingdom1.05Belgium0.65Denmark0.63Luxembourg
86.45Total
11.25Mechanical engineering and industrial equipmentBreakdown by Economic Sector
8.58Building materials and building industry7.04Miscellaneous services7.00Electrical appliances and components6.91Graphics publishing and printing media6.26Aeronautic and astronautic industry4.94Pharmaceuticals, cosmetics and medical products4.93Internet, software and IT services3.79Chemicals3.48Financial, investment and other div. companies2.91Traffic and transportation2.86Retailing, department stores2.73Mining, coal and steel industry2.20Computer hardware and networking2.07Non-ferrous metals1.88Lodging and catering industry, leisure facilities1.70Forestry, paper and forest products1.54Miscellaneous consumer goods1.44Food and soft drinks1.09Miscellaneous trading companies1.06Real estate0.44Energy and water supply0.35Insurance companies
86.45Total
Statement of Investments in Securities and Other Net Assets
DescriptionQuantity /
NominalValuation % of net
assets(in EUR)
Securities listed on a stock exchange or other organised markets: Shares (and equity-type securities)
Shares (and equity-type securities)
EUR ACKERMANS V HAAREN 5,643 324,021.06 1.05EUR AIR BERLIN 70,491 259,406.88 0.84EUR AMER GROUP -A- 8,532 77,555.88 0.25EUR ASIAN BAMBOO 13,867 523,340.58 1.70EUR AURUBIS AG 3,028 112,883.84 0.37EUR BETANDWIN.COM INTERACTIVE
ENTERTAINMENT5,956 192,617.04 0.63
EUR BIJOU BRIGITTE MODISCHE ACCESSOIRES 3,157 333,442.34 1.09EUR BILFINGER BERGER 3,294 184,727.52 0.60CHF BKW FMB ENERGIE (reg. shares) 2,709 135,194.23 0.44EUR BUZZI UNICEM 68,475 492,335.25 1.60DKK CHRISTIAN HANSEN HOLDING 13,352 198,673.95 0.65EUR CTS EVENTIM 37,865 1,671,550.43 5.43EUR DEUTSCHE BOERSE (reg. shares) 5,973 278,282.07 0.91EUR DEUTSCHE WOHNEN (reg. shares) 45,955 430,460.49 1.40EUR DIC ASSET 15,933 117,442.14 0.38EUR DOUGLAS HOLDING 5,800 243,687.00 0.79EUR ECKERT & ZIEGLER STRAHLEN- UND
MEDIZINTECHNIK25,351 642,140.83 2.09
CHF EFG INTERNATIONAL 15,124 134,052.18 0.44EUR EUROPEAN AERONAUTIC DEFENCE AND
SPACE73,159 1,262,724.34 4.11
EUR FRAPORT 14,180 641,574.10 2.09EUR GILDEMEISTER 3,813 57,061.55 0.19GBP GREAT PORTLAND ESTATES 52,818 208,655.91 0.68EUR HEIDELBERGCEMENT 19,502 816,256.21 2.66EUR HEIDELBERGER DRUCKMASCHINEN 75,977 260,373.18 0.85EUR HOCHTIEF 5,784 329,977.20 1.07EUR IVG IMMOBILIEN 38,029 223,914.75 0.73EUR K & S 16,261 835,978.01 2.72EUR KONTRON 100,982 676,175.47 2.20EUR KUKA 43,188 594,482.82 1.94EUR LANXESS 6,049 328,279.23 1.07GBP LONDON STOCK EXCHANGE GROUP 11,789 106,980.40 0.35EUR MAGIX 3,350 20,954.25 0.07EUR MEDION 15,078 164,651.76 0.54EUR MORPHOSYS 41,695 656,487.78 2.14EUR MTU AERO ENGINES 8,979 403,157.10 1.31EUR OUTOTEC 13,814 523,412.46 1.70EUR PFEIFFER VACUUM TECHNOLOGY 7,579 653,688.75 2.13EUR PRAKTIKER BAU UND HEIMWERKERMAERKTE
HOLDING48,154 336,500.15 1.10
EUR PROSIEBEN SAT.1 MEDIA (pref. shares) 6,597 134,644.77 0.44EUR RHEINMETALL 25,081 1,247,027.32 4.06EUR RHI 11,163 292,135.71 0.95EUR SAF HOLLAND 35,348 194,414.00 0.63EUR SALZGITTER 10,839 537,235.04 1.75EUR SGL CARBON 9,281 247,199.44 0.80EUR SIXT (pref. shares) 2,323 57,203.88 0.19EUR SKY DEUTSCHLAND (reg. shares) 193,412 319,129.80 1.04EUR SOFTWARE 13,756 1,300,767.36 4.23EUR STADA-ARZNEIMITTEL (reg. shares) 35,119 859,361.93 2.80EUR STRATEC BIOMEDICAL SYSTEMS 15,971 465,075.52 1.51EUR SUESS MICROTEC 149,461 1,089,421.23 3.55CHF SWISS REINSURANCE COMPANY (reg. shares) 2,966 105,980.01 0.35EUR SYMRISE 20,453 397,095.00 1.29EUR TIPP24 (reg. shares) 43,612 1,170,109.96 3.81EUR TOGNUM 9,539 174,516.01 0.57EUR TUI (reg. shares) 71,080 577,169.60 1.88EUR WIENERBERGER 7,516 91,544.88 0.30EUR WINCOR NIXDORF 4,421 251,731.74 0.82EUR WIRE CARD 97,635 992,459.78 3.23CHF XSTRATA 3,514 54,574.05 0.18EUR ZOOPLUS 10,897 533,953.00 1.74EUR ZOOPLUS (rights) 13.12.2010 10,897 6,356.58 0.02
Securities listed on a stock exchange or other organised markets:Shares (and equity-type securities) 26,552,205.74 86.45
Shares (and equity-type securities) 26,552,205.74 86.45
Total of Portfolio 26,552,205.74 86.45
Cash at banks 4,852,051.00 15.80
Due to banks -2,556.11 -0.01
Other liabilities -686,944.27 -2.24
Total net assets 30,714,756.36 100.00
CREDIT SUISSE SICAV ONE (LUX)5, rue Jean MonnetL-2180 Luxembourg
www.credit-suisse.com