cruise report s197 scientific data collected aboard ssv ... · cruise report s197 scientific data...
TRANSCRIPT

CRUISE REPORT S197
Scientific data collected aboard SSV Robert C. Seamans
Papeete, Tahiti – Nuku Hiva, Marquesas – Honolulu, Hawaii
8 February, 2005 - 19 March, 2005
Photo by Shore Gregory and James Passanisi
Sea Education Association
Woods Hole, Massachusetts

1
Contact Information: Dr. Jeffrey M. Schell Sea Education Association P.O. Box 6 Woods Hole, MA 02543 508-540-3954 (phone) 800-552-3633 (phone) 508-457-4673 (fax) www.sea.edu

1
Table of Contents Table 1
Ship’s Company 2
Data Description
3
Figure 1
Cruise track 4
Table 2
Summary of oceanographic sampling stations 5-8
Table 3
Surface station data 9-10
Figure 2 Surface plots of temperature, salinity and fluorescence
11
Table 4
CTD station data 12
Table 5
Hydrocast station data 13-18
Figure 3
Temperature, salinity, and sound velocity profiles with T-S diagrams
19
Figure 4
Temperature, salinity, and sound velocity cross-section plots
20
Figure 5
Current direction and magnitude cross-section plots for east/west and north/south directions along with an echo amplitude cross section plot
21
Table 6
Neuston tow station data 22-23
Figure 6a
Seamount bathymetry and surface currents for seamounts 1 and 2
24
Figure 6b
Seamount bathymetry and surface currents for seamounts 3
25
Figure 7
Seamount mass effect data 26
Figure 8
DVM trends in Myctophidae 27
Figure 9
DVM trends in Pteropoda 27
Table 7 Student projects 28

2
Table 1. S197 Ship’s crew and student participants Nautical Staff Binh Le Captain PJ Meyer Chief Mate Andrew McKee 2nd Mate Dave Green 3rd Mate Dusty Smith Engineer Liz Stefany Assistant Engineer Maggie McCullough Steward Charlie Feste Deckhand Scientific Staff Jeff Schell Chief Scientist Meg Estapa 1st Scientist Cina Loarie 2nd Scientist Alicia Long 3rd Scientist Students Bart P. Critser Boston University Daniel L. Gagliano Cornell University Brittany Q. Gerack College of Charleston John S. Gregory Trinity College-CT Ella H. Haselswerdt Sarah Lawrence College Hadley W. Jensen Colorado College Daniel M. Kayne University of Colorado, Boulder Nicole E. Kinsman Colgate University Marian C. Lyman Hamilton College Sadie M. Marden Dartmouth College James S. Passanisi St. Lawrence University Lindsay A. Rasel Boston University Heidi A. Roop Mount Holyoke College Kevin M. Sullivan Hamilton College Rosemary S. Tracy Colorado College Lauren K. Vickery University of Hawaii, Manoa Maria Vizcaino Florida Atlantic University Caitlin A. Warbelow Boston University Sarah E. Wegmueller Carleton College Stephen A. Wheless Davidson College Sarina A. Yospin Carleton College

3
Data Description
This cruise report provides a record of data collected during S197 aboard the SSV Robert C. Seamans from Papeete, Tahiti to Nuku Hiva, Marquesas and continuing on to Honolulu, Hawaii (Figure 1). We collected samples or data with 150 individual deployments from 77 discrete stations (Table 2) along our cruise track. In addition we continuously sampled water depth, sub-bottom profiles and Acoustic Doppler Current Profiles (ADCP) along with flow-through sea surface temperature, salinity and in vivo fluorescence. This report summarizes physical, chemical and biological characteristics at the sea surface (Table 3, Figure 2) and at depth (Tables 4 and 5, Figure 3) along our cruise track. Large scale hydrography are summarized by contour plots of temperature, salinity and sound velocity (Figure 4); whereas large scale current patterns are summarized by contour plots of current direction, magnitude and echo amplitude (Figure 5). In addition, the distribution and density plankton and selected nekton species at the sea surface (Table 6) are presented.
A complete oceanographic survey of three seamounts, west of the Marquesas Islands was completed. Bathymetry and surface currents for each seamount are given here (Figure 6a and b) as well as evidence for a biological mass effect (Figure 7). In addition, myctophid and pteropod migration patterns were examined in relation to moon phase (Figures 8 and 9). Additional CTD, CHIRP and ADCP and biological data are not reported here but are available on request through Sea Education Association (SEA) and the Chief Scientist. The information in this report is not intended to represent final interpretation of the data and should not be excerpted or cited without written permission from SEA.
As part of SEA’s educational program, undergraduates conducted student-designed oceanographic research during the cruise. Project topics included physical, chemical, biological and geological oceanography (Table 7). Student research efforts culminated in a written report and public presentation to the ship’s company. These papers are available on request from SEA.
Jeff Schell Chief Scientist S197

4
Figure 1. Final cruise track for S-197 based on noon and midnight (local time) positions.

5
Table 2. Station summary of oceanographic sampling for S197.
Station # (S197-)
Date (2005)
Time (local +10 GMT)
Log (nm)
Lat (dec Deg N)
Lon (dec Deg W)
Location Station Type
001 9-Feb 16:05 3.0 -17.17 -149.36 15 nm N of Tahiti CTD 002 10-Feb 00:30 15.6 -16.85 -149.27 15.6 nm NE of Tetiaroa NT 003 10-Feb 10:15 26.0 -16.60 -149.18 31 nm NE of Tetiaroa CTD 003 10-Feb 10:17 26.0 -16.60 -149.18 31 nm NE of Tetiaroa PN 004 10-Feb 23:58 31.5 -16.40 -149.02 NE of Tetiaroa NT 005 11-Feb 09:59 50.0 -16.11 -148.70 32 nm NE of Tetiaroa Atoll CTD 005 11-Feb 09:59 50.0 -16.11 -148.70 32 nm NE of Tetiaroa Atoll HC 005 11-Feb 09:59 50.0 -16.11 -148.70 32 nm NE of Tetiaroa PN 005 11-Feb 09:59 50.0 -16.11 -148.70 32 nm NE of Tetiaroa Atoll SD 006 12-Feb 00:09 99.2 -15.67 -149.00 45 nm SW of Mataiva NT 007 12-Feb 10:19 151.0 -15.02 -149.49 36 nm W of Mataiva CTD 007 12-Feb 10:21 151.0 -15.02 -149.49 36 nm W of Mataiva PN 008 13-Feb 00:11 221.4 -14.30 -150.25 312 nm NW of Maketea NT 009 13-Feb 10:58 253.1 -14.43 -150.06 NW of Mataiva CTD 009 13-Feb 10:58 253.1 -14.43 -150.06 NW of Mataiva HC 009 13-Feb 10:56 253.1 -14.43 -150.06 NW of Mataiva PN 009 13-Feb 10:58 253.1 -14.43 -150.06 NW of Mataiva SD 010 14-Feb 00:10 315.0 -13.81 -149.85 120 nm NW of Mataiva NT 011 14-Feb 10:00 371.3 -13.04 -149.92 196 nm NW of Mataiva CTD 011 14-Feb 10:06 371.3 -13.04 -149.92 196 nm NW of Mataiva PN 012 15-Feb 00:04 439.6 -12.59 -149.53 155 nm N x W of Mataiva NT 013 15-Feb 10:04 505.0 -12.01 -149.06 173 nm SE of Caroline Island CTD 013 15-Feb 10:04 505.0 -12.01 -149.06 173 nm SE of Caroline Island HC 013 15-Feb 10:33 505.0 -12.03 -149.06 173 nm SE of Caroline Island PN 013 15-Feb 10:04 505.0 -12.01 -149.06 173 nm SE of Caroline Island SD 014 16-Feb 00:07 574.1 -11.74 -148.42 120 nm SW of Caroline Is. NT 015 16-Feb 10:04 639.3 -11.20 -147.85 160 nm ESE of Caroline Is. CTD 015 16-Feb 10:10 639.3 -11.20 -147.85 160 nm ESE of Caroline Is. PN 016 16-Feb 17:04 659.9 -11.04 -147.92 160 nm from Caroline Is. NT 017 16-Feb 20:00 679.8 -10.96 -147.62 156 nm NNW of Manihi NT 018 17-Feb 00:03 703.9 -10.84 -147.24 400 nm W of Nuka Hiva NT 019 17-Feb 04:05 718.8 -10.72 -146.81 243 nm E of Caroline Is. NT 020 17-Feb 08:01 745.3 -10.60 -146.37 190 nm SE x E of Caroline Is. NT 021 18-Feb 00:00 860.0 -10.01 -144.52 260 nm SW of Nuku Hiva NT 022 18-Feb 10:11 938.0 -9.52 -143.43 210 nm SWxW of Nuku Hiva CTD 022 18-Feb 10:11 938.0 -9.52 -143.43 210 nm SWxW of Nuku Hiva HC 022 18-Feb 10:40 938.0 -9.52 -143.43 210 nm SWxW of Nuku Hiva PN 022 18-Feb 10;11 938.0 -9.52 -143.43 210 nm SWxW of Nuku Hiva SD 023 19-Feb 00:11 1008.9 -9.70 -142.41 120 nm W of Nuku Hiva NT 024 19-Feb 10:30 1090.1 -9.53 -141.06 45 nm W of of Ua Pou CTD 024 19-Feb 10:30 1090.1 -9.53 -141.06 45 nm W of Ua Pou HC 024 19-Feb 10:13 1090.1 -9.53 -141.06 45 nm W of Ua Pou PN 024 19-Feb 10;30 1090.1 -9.53 -141.06 45 nm W of Ua Pou SD 025 20-Feb 06:16 1186.8 -9.89 -139.57 27.5nm NwxW of Tahuata CTD 025 20-Feb 06:16 1186.8 -9.89 -139.57 27.5 nm NWxW of Tahuata HC 025 20-Feb 08:06 1186.9 -9.87 -139.57 24 nm W of Cap Kiukiu NT

6
025 20-Feb 06:18 1186.8 -9.89 -139.57 27.5 nm NWxW of Tahuata PN 026 20-Feb 13:00 1202.0 -9.84 -139.59 30 nm NWxW of Tahuata CTD 026 20-Feb 12:48 1202.0 -9.84 -139.59 30 nm NWxW of Tahuata PN 027 20-Feb 15:11 1204.9 -9.80 -139.63 26 nm W of Hiva Oa CTD 027 20-Feb 15:11 1204.9 -9.80 -139.63 26 nm W of Hiva Oa HC 027 20-Feb 16:31 1205.1 -9.79 -139.64 30 nm W of Hiva Oa NT 027 20-Feb 15:03 1204.9 -9.80 -139.63 26 nm W of Hiva Oa PN 028 20-Feb 18:29 1214.0 -9.75 -139.64 30 nm W of Hiva Oa CTD 028 20-Feb 18:27 1214.0 -9.75 -139.64 30 nm W of Hiva Oa PN 029 20-Feb 21:40 1225.1 -9.71 -139.71 50nm SSE of Nuku Hiva CTD 029 20-Feb 21:40 1225.1 -9.71 -139.71 50 nm SSE of Nuku Hiva HC 029 20-Feb 23:45 1225.3 -9.70 -139.72 50 nm SSE of Nuku Hiva NT 029 20-Feb 21:40 1225.1 -9.71 -139.71 50 nm SSE of Nuku Hiva PN 030 21-Feb 03:20 1237.7 -9.63 -139.75 20 nm SE of Ua-Pou CTD 030 21-Feb 03:25 1237.7 -9.63 -139.75 20 nm SE of Ua Pou PN 031 21-Feb 06:02 1245.9 -9.58 -139.78 17 nm SE of Ua Pou CTD 031 21-Feb 06:02 1245.9 -9.58 -139.78 12 nm SE of Ua-Pou HC 031 21-Feb 07:19 1246.1 -9.60 -139.78 NW of Guyot Kena Seamount NT 031 21-Feb 06:00 1245.9 -9.58 -139.78 12 nm SE of Ua Pou PN 032 21-Feb 20:49 1279.4 -9.54 -139.81 12 nm ExS of Ua Pou CTD 032 21-Feb 20:44 1279.4 -9.54 -139.81 12 nm ExS of Ua Pou PN 033 21-Feb 22:22 1284.8 -9.49 -139.84 40 nm SE of Nuku Hiva CTD 033 21-Feb 22:22 1284.8 -9.49 -139.84 40 nm SE of Nuku Hiva HC 033 21-Feb 23:49 1285.9 -9.52 -139.83 39 nm SE of Nuka Hiva NT 033 21-Feb 22:33 1284.8 -9.50 -139.84 40 nm SE of Nuku Hiva PN 034 25-Feb 17:07 1330.3 -8.99 -140.16 1.6 nm S of Nuku Hiva NT 035 25-Feb 20:08 1332.8 -8.90 -140.32 2.5 nm SW of Nuku Hiva NT 036 26-Feb 00:03 1362.5 -8.61 -140.51 6 nm NE of Motu Iti NT 037 26-Feb 04:03 1382.5 -8.31 -140.69 16 nm S of Eiao NT 038 26-Feb 08:03 1405.0 -8.00 -140.91 7 nm from Banc Hinakura NT 039 26-Feb 13:04 1428.1 -7.84 -140.94 17 nm NW of Eiao CTD 039 26-Feb 12:35 1428.1 -7.83 -140.94 17 nm NW of Eiao HC 039 26-Feb 14:11 1428.2 -7.86 -140.93 17 nm NW of Eiao NT 039 26-Feb 13:07 1428.1 -7.84 -140.94 17 nm NW of Eiao PN 039 26-Feb 12:35 1428.1 -7.83 -140.94 17 nm NW of Eiao SD 040 26-Feb 17:52 1439.1 -7.87 -140.96 16 nm NW of Eiao CTD 040 26-Feb 17:49 1439.1 -7.87 -140.96 16 nm NW of Eiao PN 041 26-Feb 23:04 1455.0 -7.91 -140.97 70 nm NW of Nuku Hiva CTD 041 26-Feb 23:04 1455.0 -7.91 -140.97 70 nm NW of Nuku Hiva HC 041 27-Feb 00:28 1456.1 -7.93 -140.95 70 nm NW of Nuku Hiva NT 041 26-Feb 23:04 1455.0 -7.91 -140.97 70 nm NW of Nuku Hiva PN 042 27-Feb 02:30 1457.9 -7.96 -141.00 17 nm W of Eiao CTD 042 27-Feb 02:33 1457.9 -7.96 -141.00 17 nm W of Eiao PN 043 27-Feb 06:58 1468.2 -8.01 -141.01 17.5 nm WNW of Eiao CTD 043 27-Feb 06:58 1468.2 -8.01 -141.01 17.5 nm WNW of Eiao HC 043 27-Feb 08:53 1468.4 -8.04 -141.01 17.5 nm WNW of Eiao NT 043 27-Feb 07:00 1468.2 -8.01 -141.01 17.5 nm WNW of Eiao PN 044 28-Feb 00:12 1554.9 -6.86 -141.64 NW of Nuku Hiva NT 045 28-Feb 10:22 1621.0 -5.83 -141.93 97 nm NNW of Eiao CTD 045 28-Feb 10:22 1621.0 -5.83 -141.93 97 nm NNW of Eiao HC 045 28-Feb 10:18 1621.0 -5.83 -141.93 97 nm NNW of Eiao PN

7
045 28-Feb 10:22 1621.0 -5.83 -141.93 97 nm NNW of Eiao SD 046 1-Mar 00:16 1694.5 -4.61 -142.42 880 nm ExN of Christmas Is. NT 047 1-Mar 10:08 1741.5 -3.86 -142.64 585 nm NW of Nuku Hiva CTD 047 1-Mar 10:10 1741.5 -3.86 -142.64 585 nm NW of Nuku Hiva PN 048 1-Mar 17:43 1768.0 -3.45 -142.80 800 nm E of Starbuck Island MN1 048 1-Mar 18:10 1768.5 -3.45 -142.80 800 nm E of Starbuck Island MN2 048 1-Mar 18:18 1768.6 -3.47 -142.81 800 nm E of Starbuck Island NT 049 2-Mar 00:09 1788.5 -3.24 -142.95 360 nm NNW of Nuku Hiva NT 050 2-Mar 10:11 1830.0 -2.61 -143.18 433 nm NWxW of Nuku Hiva CTD 050 2-Mar 10:11 1830.0 -2.61 -143.18 433 nm NWxN of Nuku Hiva HC 050 2-Mar 10:18 1830.0 -2.61 -143.18 433nm NW x N of Nuku Hiva PN 050 2-Mar 10:11 1830.0 -2.61 -143.18 433 nm NWxW of Nuku Hiva SD
Transition from SPEW to NPEW
051 3-Mar 00:11 1887.9 -1.67 -143.52 100nm S of Equator NT 052 3-Mar 10:04 1940.1 -0.76 -143.61 1290 nm SE of Hawaii CTD 052 3-Mar 10:01 1940.1 -0.76 -143.61 1290 nm SE of Hawaii PN 053 3-Mar 11:18 1940.3 -0.76 -143.62 1290 nm SE of Hawaii MN1 053 3-Mar 11:42 1940.9 -0.76 -143.62 1290 nm SE of Hawaii MN2 053 3-Mar 11:49 1941.3 -0.78 -143.62 1290nm SE of Hawaii NT 054 3-Mar 17:26 1959.6 -0.47 -143.70 28 nm S of the Line NT 055 3-Mar 20:08 1968.0 -0.37 -143.72 20 NM S of the Line NT 056 4-Mar 00:07 1987.0 -0.08 -143.79 4.9 nm S of the Line NT 057 4-Mar 04:00 2004.7 0.24 -143.84 14.1 nm N of the Line NT 058 4-Mar 07:33 2022.8 0.52 -143.88 540 nm NNW of Eiao NT 059 4-Mar 16:32 2045.6 1.01 -143.97 600nm NNE of Nuku Hiva CTD 059 4-Mar 16:32 2045.6 1.01 -143.97 600 nm NNE of Nuku Hiva HC 059 4-Mar 16:26 2045.6 1.01 -143.97 600 nm NNE of Nuku Hiva PN 059 4-Mar 16:32 2045.6 1.01 -143.97 600 nm NNE of Nuku Hiva SD 060 5-Mar 00:05 2074.9 1.56 -144.12 540 nm N of Nuku Hiva NT 061 5-Mar 10:23 2118.8 2.38 -144.42 700nm NNE of Nuku Hiva CTD 061 5-Mar 10:21 2118.8 2.37 -144.42 700nm NNE of Nuku Hiva PN 062 6-Mar 00:19 2183.5 3.61 -144.70 755 nm NWxN of Nuku Hiva NT 063 6-Mar 10:09 2226.7 4.34 -144.67 1300 nm SE of Hawaii CTD 063 6-Mar 10:08 2226.7 4.34 -144.67 1300 nm SE of Hawaii PN 064 7-Mar 00:00 2304.6 5.61 -144.56 1050 nm SE of Hawaii NT
Transition from NPEW to ENPCW
065 7-Mar 10:23 2348.1 6.29 -144.43 840 nm NE of Christmas Is. CTD 065 7-Mar 10:23 2348.1 6.29 -144.43 840 nm NE of Christmas Is. HC 065 7-Mar 10:26 2348.1 6.29 -144.43 840 nm NE of Christmas Is. PN 065 7-Mar 10:23 2348.1 6.29 -144.43 840 nm NE of Christmas Is. SD 066 8-Mar 00:16 2401.9 7.20 -144.49 800 nm SWxW of Christmas NT 067 8-Mar 10:14 2451.5 7.97 -144.79 880 nm SxE of Hawaii CTD 067 8-Mar 10:14 2451.5 7.97 -144.79 880 nm SxE of Hawaii HC 067 8-Mar 10:20 2451.5 7.97 -144.79 880 nm SxE of Hawaii PN 067 8-Mar 10:14 2451.5 7.97 -144.79 880 nm SxE of Hawaii SD 068 8-Mar 23:59 2528.2 9.01 -145.52 988 nm SE of Oahu NT 069 9-Mar 09:58 2585.1 9.80 -146.00 800 nm SE of Big Island CTD 070 9-Mar 23:57 2654.8 10.82 -146.43 780 nm SE of Hilo NT 071 10-Mar 10:22 2713.1 11.60 -146.90 660 nm SE of Big Island CTD 072 10-Mar 17:00 2743.8 12.01 -147.13 660 nm SE of Big Island NT

8
073 10-Mar 20:05 2755.8 12.13 -147.19 600 nm SE of Big Island NT 074 11-Mar 00:02 2775.2 12.37 -147.30 620 nm SE of Big Island NT 075 11-Mar 04:05 2795.6 12.63 -147.43 600 nm SE of Hilo NT 076 11-Mar 08:11 2813.4 12.82 -147.58 600 nm SE of Hawaii NT 077 11-Mar 09:21 2814.9 12.79 -147.58 600 nm SE of Hawaii CTD
Duplicate station numbers refer to different oceanographic equipment that was either deployed concurrently in the same location or was deployed sequentially in the same General Location but different latitude and longitude. The General Location for stations has been categorized by position (N – north, S – south, W – west, E – east, SW – southwest, NW – northwest, NE – northeast) relative to nearest island or by relevant sea surface currents. The latter are identified using the following abbreviations: NEC – north equatorial current, SEC – south equatorial current and the NECC – north equatorial counter-current. Lettered entries refer to different geographic locations along a continuous on-to-offshore transect around different Hawaiian Islands. Abbreviations for type of oceanographic equipment deployed: NT – neuston tow, PN – phytoplankton net, MN – meter net (either 1 or 2 m diameter), TT – tucker trawl, DN – dip net, CTD – conductivity, temperature and depth profiler, HC – hydrocast with 12 Niskin bottles, SG – shipek grab and GC – gravity core. Transition between surface water masses: SPEW (stations 001-050), NPEW (stations 051-064), and ENPCW (stations 065-077).
9
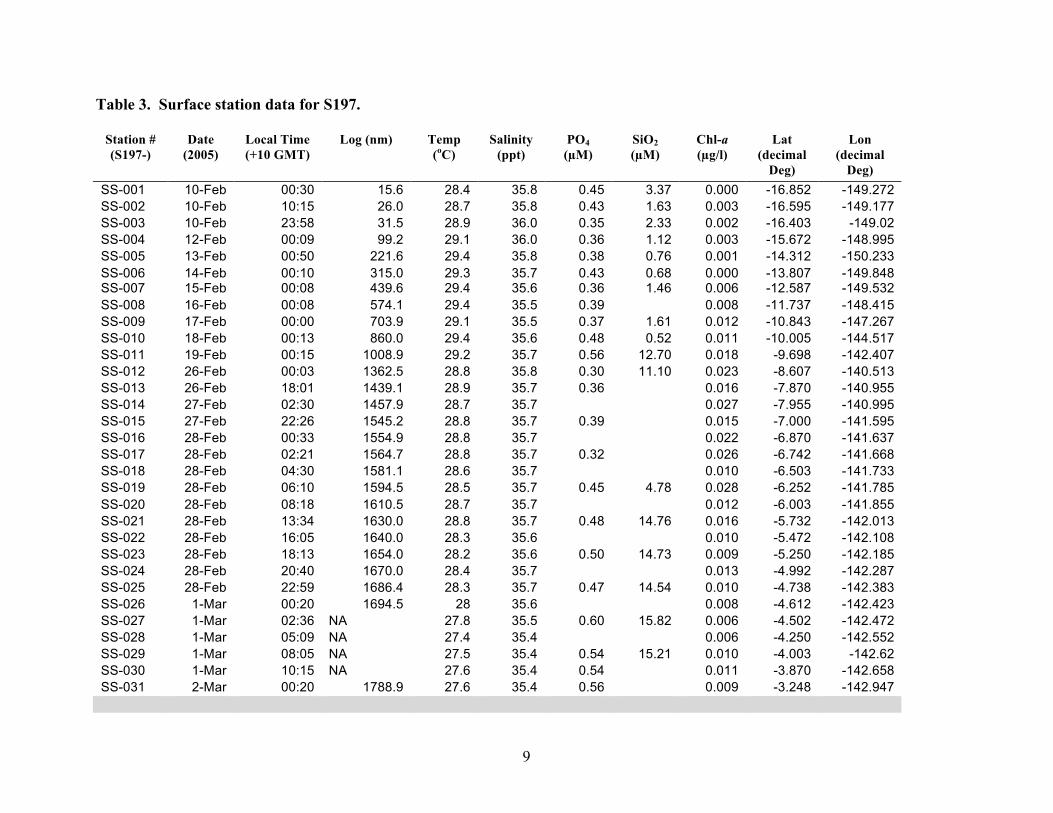
Table 3. Surface station data for S197.
Station # (S197-)
Date (2005)
Local Time (+10 GMT)
Log (nm) Temp (oC)
Salinity (ppt)
PO4 (µM)
SiO2 (µM)
Chl-a (µg/l)
Lat (decimal
Deg)
Lon (decimal
Deg) SS-001 10-Feb 00:30 15.6 28.4 35.8 0.45 3.37 0.000 -16.852 -149.272 SS-002 10-Feb 10:15 26.0 28.7 35.8 0.43 1.63 0.003 -16.595 -149.177 SS-003 10-Feb 23:58 31.5 28.9 36.0 0.35 2.33 0.002 -16.403 -149.02 SS-004 12-Feb 00:09 99.2 29.1 36.0 0.36 1.12 0.003 -15.672 -148.995 SS-005 13-Feb 00:50 221.6 29.4 35.8 0.38 0.76 0.001 -14.312 -150.233 SS-006 14-Feb 00:10 315.0 29.3 35.7 0.43 0.68 0.000 -13.807 -149.848 SS-007 15-Feb 00:08 439.6 29.4 35.6 0.36 1.46 0.006 -12.587 -149.532 SS-008 16-Feb 00:08 574.1 29.4 35.5 0.39 0.008 -11.737 -148.415 SS-009 17-Feb 00:00 703.9 29.1 35.5 0.37 1.61 0.012 -10.843 -147.267 SS-010 18-Feb 00:13 860.0 29.4 35.6 0.48 0.52 0.011 -10.005 -144.517 SS-011 19-Feb 00:15 1008.9 29.2 35.7 0.56 12.70 0.018 -9.698 -142.407 SS-012 26-Feb 00:03 1362.5 28.8 35.8 0.30 11.10 0.023 -8.607 -140.513 SS-013 26-Feb 18:01 1439.1 28.9 35.7 0.36 0.016 -7.870 -140.955 SS-014 27-Feb 02:30 1457.9 28.7 35.7 0.027 -7.955 -140.995 SS-015 27-Feb 22:26 1545.2 28.8 35.7 0.39 0.015 -7.000 -141.595 SS-016 28-Feb 00:33 1554.9 28.8 35.7 0.022 -6.870 -141.637 SS-017 28-Feb 02:21 1564.7 28.8 35.7 0.32 0.026 -6.742 -141.668 SS-018 28-Feb 04:30 1581.1 28.6 35.7 0.010 -6.503 -141.733 SS-019 28-Feb 06:10 1594.5 28.5 35.7 0.45 4.78 0.028 -6.252 -141.785 SS-020 28-Feb 08:18 1610.5 28.7 35.7 0.012 -6.003 -141.855 SS-021 28-Feb 13:34 1630.0 28.8 35.7 0.48 14.76 0.016 -5.732 -142.013 SS-022 28-Feb 16:05 1640.0 28.3 35.6 0.010 -5.472 -142.108 SS-023 28-Feb 18:13 1654.0 28.2 35.6 0.50 14.73 0.009 -5.250 -142.185 SS-024 28-Feb 20:40 1670.0 28.4 35.7 0.013 -4.992 -142.287 SS-025 28-Feb 22:59 1686.4 28.3 35.7 0.47 14.54 0.010 -4.738 -142.383 SS-026 1-Mar 00:20 1694.5 28 35.6 0.008 -4.612 -142.423 SS-027 1-Mar 02:36 NA 27.8 35.5 0.60 15.82 0.006 -4.502 -142.472 SS-028 1-Mar 05:09 NA 27.4 35.4 0.006 -4.250 -142.552 SS-029 1-Mar 08:05 NA 27.5 35.4 0.54 15.21 0.010 -4.003 -142.62 SS-030 1-Mar 10:15 NA 27.6 35.4 0.54 0.011 -3.870 -142.658 SS-031 2-Mar 00:20 1788.9 27.6 35.4 0.56 0.009 -3.248 -142.947

10
Station # (S197-)
Date (2005)
Local Time (+10 GMT)
Log (nm) Temp (oC)
Salinity (ppt)
PO4 (µM)
SiO2 (µM)
Chl-a (µg/l)
Lat (decimal
Deg)
Lon (decimal
Deg) SS-032 3-Mar 00:15 1887.9 26.7 35.1 0.57 0.008 -1.670 -143.515 SS-033 3-Mar 10:07 1940.1 26.6 35.1 0.56 0.025 -0.762 -143.610 SS-034 4-Mar 00:08 1987.0 26.3 35.1 0.57 0.027 -0.085 -143.788 SS-035 5-Mar 00:35 2074.9 26.5 34.9 0.28 0.013 1.555 -144.133 SS-036 5-Mar 10:31 2118.8 27.5 34.9 0.013 2.367 -144.420 SS-037 6-Mar 00:25 2183.5 27.3 34.9 0.38 0.017 3.607 -144.703 SS-038 6-Mar 10:14 2226.7 27.7 35.0 0.012 4.342 -144.672 SS-039 7-Mar 00:05 2304.6 28.5 34.8 0.29 0.033 5.603 -144.560 SS-040 7-Mar 06:06 2330.0 28.5 34.5 0.26 0.015 6.003 -144.500 SS-041 7-Mar 09:13 2345.2 28.3 34.1 0.13 0.019 6.252 -144.445 SS-042 7-Mar 17:05 2366.3 28.4 34.2 0.20 0.013 6.602 -144.427 SS-043 7-Mar 18:40 2374.4 28.2 34.0 0.20 0.007 6.752 -144.445 SS-044 7-Mar 21:55 2390.1 28.1 34.0 0.09 0.007 7.005 -144.463 SS-045 8-Mar 00:16 2401.9 28.1 34.0 0.17 0.000 7.197 -144.487 SS-046 8-Mar 04:31 2420.5 28.1 34.1 0.012 7.502 -144.575 SS-047 8-Mar 07:13 2436.5 27.5 34.0 0.17 0.006 7.752 -144.690 SS-048 9-Mar 00:09 2528.2 27.3 34.3 0.007 9.007 -145.515
Temperature and salinity and were determined using a continuous salinity/temperature flow-thru data logger. Phosphate (PO4) and silicate (SiO2) levels were measured by colorimetric analysis with and Ocean Optics Chem2000 digital spectrophotometer and chlorophyll-a (Chl-a) concentrations were determined with a Turner Designs Model 10-AU Fluorometer following methods outlined in Parsons, Maita and Lalli (1984; A Manual of Chemical and Biological Methods for Seawater Analysis, Pergamon Press). Transition between surface water masses: SPEW (stations 001-031), NPEW (stations 032-040), and ENPCW (stations 041-048).

11
Figure 2. Surface plots of temperature, salinity and fluorescence for S197.

12
Table 4. CTD station data for S197.
Station # (S197-)
Date (2005)
Local Time (+10 GMT)
Log (nm) Cast Depth (m)
Locale
001-CTD 9-Feb 16:05 3.0 1471 15 nm N of Tahiti 003-CTD 10-Feb 10:15 26.0 1496 31 nm NE of Tetiaroa 005-CTD 11-Feb 09:59 50.0 1485 32 nm NE of Tetiaroa Atoll 007-CTD 12-Feb 10:19 151.0 1490 36 nm W of Mataiva 009-CTD 13-Feb 10:58 253.1 1185 Mataiva 011-CTD 14-Feb 10:00 371.3 1412 196 nm NW of Mataiva 013-CTD 15-Feb 10:04 505.0 1294 173 nm SE of Caroline Island 015-CTD 16-Feb 10:04 639.3 1492 160 nm ESE of Caroline Island 022-CTD 18-Feb 10:11 938.0 24 210 nm SW x W from Nuku Hiva 024-CTD 19-Feb 10:30 1090.1 1383 45 nm W of of Ua Pou 025-CTD 20-Feb 06:16 1186.8 1068 27.5nm NwxW of Tahuata 026-CTD 20-Feb 13:00 1202.0 935 30 nm NWxW of Tahuata 027-CTD 20-Feb 15:11 1204.9 299 26 nm W of Hiva Oa 028-CTD 20-Feb 18:29 1214.0 980 30 nm W of Hiva Oa 029-CTD 20-Feb 21:40 1225.1 1455 50nm SSE of Nuku Hiva 030-CTD 21-Feb 03:20 1237.7 956 20 nm SE of Ua-Pou 031-CTD 21-Feb 06:02 1245.9 564 17 nm SE of Ua Pou 032-CTD 21-Feb 20:49 1279.4 979 12 nm ExS of Ua Pou 033-CTD 21-Feb 22:22 1284.8 1039 40 nm SE of Nuku Hiva 039-CTD 26-Feb 13:04 1428.1 766 17 nm NW of Eiao 040-CTD 26-Feb 17:52 1439.1 744 16 nm NW of Eiao 041-CTD 26-Feb 23:04 1455.0 192 70 nm NW of Nuku Hiva 042-CTD 27-Feb 02:30 1457.9 956 17 nm W of Eiao 043-CTD 27-Feb 06:58 1468.2 1569 17.5 nm WNW of Eiao 045-CTD 28-Feb 10:22 1621.0 1335 97 nm NNW of Eiao 047-CTD 1-Mar 10:08 1741.5 1293 585 nm NW of Nuku Hiva 050-CTD 2-Mar 10:11 1830.0 1369 433 nm NWxW of Nuku Hiva 052-CTD 3-Mar 10:04 1940.1 1526 1290 nm SE of Hawaii 059-CTD 4-Mar 16:32 2045.6 1396 600nm NNE of Nuku Hiva 061-CTD 5-Mar 10:23 2118.8 1039 700nm NNE of Nuku Hiva 063-CTD 6-Mar 10:09 2226.7 1495 1300 nm SE of Hawaii 065-CTD 7-Mar 10:23 2348.1 1445 840 nm NE of Christmas Island 067-CTD 8-Mar 10:14 2451.5 1445 880 nm SxE of Hawaii 069-CTD 9-Mar 09:58 2585.1 1379 800 nm SE of Big Island 071-CTD 10-Mar 10:22 2713.1 1586 660 nm SE of Big Island 077-CTD 11-Mar 09:21 2814.9 2467 600 nm SE of Hawaii
Transition between surface water masses: SPEW (stations 001-050), NPEW (stations 052-063), and ENPCW (stations 065-077).
13
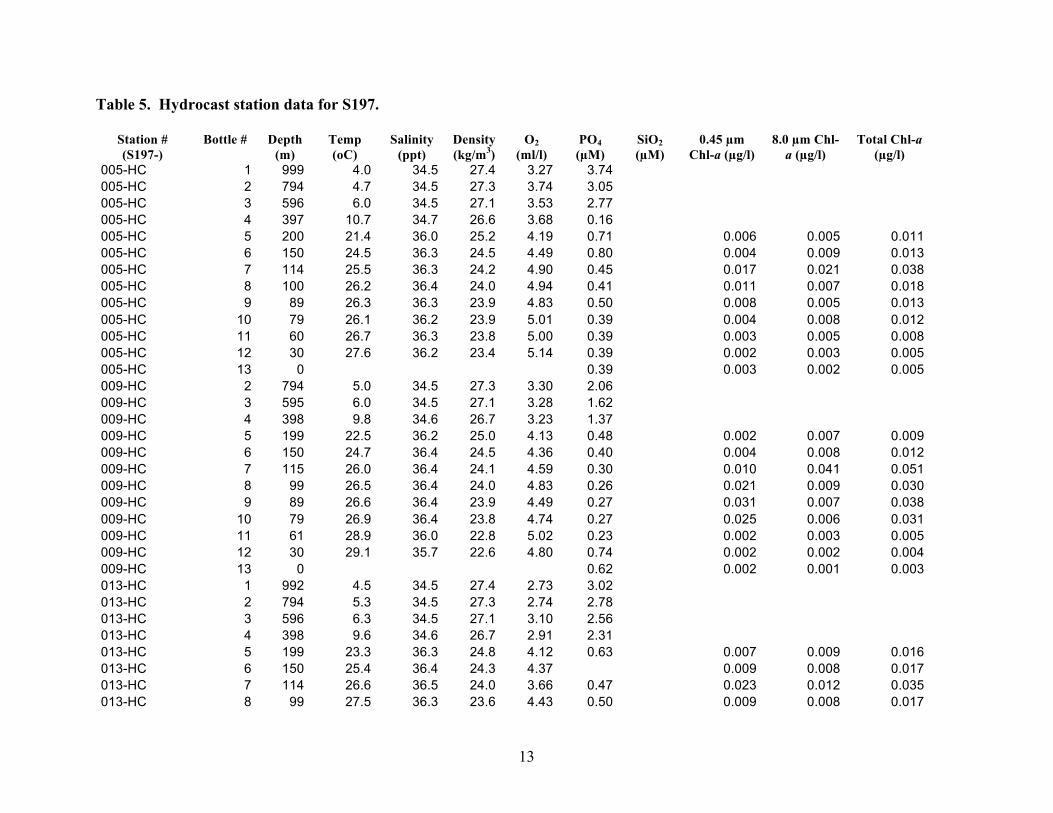
Table 5. Hydrocast station data for S197.
Station # (S197-)
Bottle # Depth (m)
Temp (oC)
Salinity (ppt)
Density (kg/m3)
O2 (ml/l)
PO4 (µM)
SiO2 (µM)
0.45 µm Chl-a (µg/l)
8.0 µm Chl-a (µg/l)
Total Chl-a (µg/l)
005-HC 1 999 4.0 34.5 27.4 3.27 3.74 005-HC 2 794 4.7 34.5 27.3 3.74 3.05 005-HC 3 596 6.0 34.5 27.1 3.53 2.77 005-HC 4 397 10.7 34.7 26.6 3.68 0.16 005-HC 5 200 21.4 36.0 25.2 4.19 0.71 0.006 0.005 0.011 005-HC 6 150 24.5 36.3 24.5 4.49 0.80 0.004 0.009 0.013 005-HC 7 114 25.5 36.3 24.2 4.90 0.45 0.017 0.021 0.038 005-HC 8 100 26.2 36.4 24.0 4.94 0.41 0.011 0.007 0.018 005-HC 9 89 26.3 36.3 23.9 4.83 0.50 0.008 0.005 0.013 005-HC 10 79 26.1 36.2 23.9 5.01 0.39 0.004 0.008 0.012 005-HC 11 60 26.7 36.3 23.8 5.00 0.39 0.003 0.005 0.008 005-HC 12 30 27.6 36.2 23.4 5.14 0.39 0.002 0.003 0.005 005-HC 13 0 0.39 0.003 0.002 0.005 009-HC 2 794 5.0 34.5 27.3 3.30 2.06 009-HC 3 595 6.0 34.5 27.1 3.28 1.62 009-HC 4 398 9.8 34.6 26.7 3.23 1.37 009-HC 5 199 22.5 36.2 25.0 4.13 0.48 0.002 0.007 0.009 009-HC 6 150 24.7 36.4 24.5 4.36 0.40 0.004 0.008 0.012 009-HC 7 115 26.0 36.4 24.1 4.59 0.30 0.010 0.041 0.051 009-HC 8 99 26.5 36.4 24.0 4.83 0.26 0.021 0.009 0.030 009-HC 9 89 26.6 36.4 23.9 4.49 0.27 0.031 0.007 0.038 009-HC 10 79 26.9 36.4 23.8 4.74 0.27 0.025 0.006 0.031 009-HC 11 61 28.9 36.0 22.8 5.02 0.23 0.002 0.003 0.005 009-HC 12 30 29.1 35.7 22.6 4.80 0.74 0.002 0.002 0.004 009-HC 13 0 0.62 0.002 0.001 0.003 013-HC 1 992 4.5 34.5 27.4 2.73 3.02 013-HC 2 794 5.3 34.5 27.3 2.74 2.78 013-HC 3 596 6.3 34.5 27.1 3.10 2.56 013-HC 4 398 9.6 34.6 26.7 2.91 2.31 013-HC 5 199 23.3 36.3 24.8 4.12 0.63 0.007 0.009 0.016 013-HC 6 150 25.4 36.4 24.3 4.37 0.009 0.008 0.017 013-HC 7 114 26.6 36.5 24.0 3.66 0.47 0.023 0.012 0.035 013-HC 8 99 27.5 36.3 23.6 4.43 0.50 0.009 0.008 0.017

14
Station # (S197-)
Bottle # Depth (m)
Temp (oC)
Salinity (ppt)
Density (kg/m3)
O2 (ml/l)
PO4 (µM)
SiO2 (µM)
0.45 µm Chl-a (µg/l)
8.0 µm Chl-a (µg/l)
Total Chl-a (µg/l)
013-HC 9 89 27.9 36.3 23.4 4.52 0.47 0.025 0.020 0.045 013-HC 10 80 28.2 36.2 23.3 4.80 0.43 0.009 0.004 0.013 013-HC 11 60 29.2 35.6 22.5 4.70 0.42 0.003 0.004 0.007 013-HC 12 30 29.2 35.6 22.5 4.71 0.37 0.001 0.002 0.003 013-HC 13 0 29.6 35.6 0.40 0.003 0.003 0.006 022-HC 13 0 0.45 0.013 0.007 0.020 024-HC 1 993 4.2 34.2 27.1 2.53 2.97 024-HC 2 794 5.1 34.2 27.0 2.32 2.81 024-HC 3 596 6.5 34.2 26.9 2.34 3.23 024-HC 4 397 8.1 34.3 26.7 2.87 2.33 024-HC 5 199 15.2 33.6 24.9 4.12 0.76 0.012 0.035 0.047 024-HC 6 149 19.5 33.2 23.5 4.18 0.46 0.058 0.015 0.073 024-HC 7 114 22.1 33.2 22.8 4.44 0.90 0.043 0.018 0.061 024-HC 8 99 23.2 33.3 22.6 4.42 0.48 0.062 0.003 0.065 024-HC 9 90 23.8 33.4 22.4 4.58 0.42 0.050 0.028 0.078 024-HC 10 79 24.6 33.4 22.3 4.64 0.40 0.027 0.029 0.056 024-HC 11 60 25.7 33.6 22.1 4.77 0.40 0.019 0.013 0.032 024-HC 12 30 26.8 33.9 21.9 4.20 0.41 024-HC 13 0 0.36 0.029 0.008 0.037 025-HC 5 538 7.2 34.6 27.1 2.67 21.79 025-HC 6 538 7.2 34.6 27.1 2.54 21.66 025-HC 7 536 7.2 34.6 27.1 2.82 21.53 025-HC 8 397 9.0 34.7 26.9 2.06 21.36 025-HC 11 99 26.4 36.4 24.0 0.36 0.00 0.027 0.027 025-HC 12 50 28.3 35.9 23.0 0.39 0.00 0.038 0.038 025-HC 13 0 0.32 0.00 0.019 0.019 027-HC 3 197 21.4 36.0 25.2 0.77 0.00 0.004 0.004 027-HC 4 150 24.6 36.5 24.6 0.50 0.00 0.015 0.015 027-HC 9 96 26.9 36.3 23.7 0.51 0.00 0.044 0.044 027-HC 12 48 28.3 35.9 23.0 0.39 0.00 0.056 0.056 027-HC 13 0 29.1 35.8 0.36 0.00 0.006 0.006 029-HC 1 1000 4.6 34.5 27.4 3.59 20.36 029-HC 2 800 5.6 34.5 27.2 3.88 20.88 029-HC 3 599 7.0 34.6 27.1 3.35 21.23 029-HC 4 400 9.0 34.7 26.9 2.83 21.42

15
Station # (S197-)
Bottle # Depth (m)
Temp (oC)
Salinity (ppt)
Density (kg/m3)
O2 (ml/l)
PO4 (µM)
SiO2 (µM)
0.45 µm Chl-a (µg/l)
8.0 µm Chl-a (µg/l)
Total Chl-a (µg/l)
029-HC 5 201 20.8 35.9 25.3 0.90 0.00 0.003 0.003 029-HC 7 150 25.1 36.5 24.5 0.53 0.00 0.008 0.008 029-HC 9 101 27.6 36.1 23.3 0.52 0.00 0.036 0.036 029-HC 11 50 28.6 35.8 22.8 0.55 2.19 0.019 0.019 029-HC 13 0 28.9 35.8 0.17 0.28 0.009 0.009 031-HC 2 494 7.4 34.6 27.1 2.65 21.91 031-HC 4 397 9.1 34.7 26.9 2.85 25.82 031-HC 6 199 21.8 35.1 25.1 0.89 0.00 0.005 0.005 031-HC 8 147 25.0 36.5 24.5 0.46 0.46 0.009 0.009 031-HC 10 98 27.4 36.1 23.5 0.52 0.00 0.086 0.086 031-HC 12 48 28.6 35.8 22.8 0.48 0.00 0.024 0.024 031-HC 13 0 28.9 35.8 0.46 0.00 0.028 0.028 033-HC 1 993 4.6 34.5 27.4 3.74 64.18 033-HC 2 794 5.6 34.5 27.2 3.98 55.29 033-HC 3 596 7.0 34.6 27.1 2.11 22.11 033-HC 4 397 9.2 34.7 26.8 2.17 23.28 033-HC 6 198 21.4 36.0 25.1 1.08 0.00 0.003 0.003 033-HC 8 146 24.3 36.4 24.6 0.76 0.00 0.010 0.010 033-HC 10 97 26.4 36.4 24.0 0.75 0.00 0.047 0.047 033-HC 12 48 28.5 35.8 22.8 0.56 0.00 0.021 0.021 033-HC 13 0 28.9 35.0 0.20 0.00 039-HC 1 762 5.6 34.6 27.3 2.72 51.19 039-HC 2 760 5.7 34.5 27.2 2.71 65.31 039-HC 3 600 7.0 34.6 27.1 2.51 43.40 039-HC 4 400 9.3 34.7 26.9 2.27 27.00 039-HC 5 200 20.9 35.9 25.2 9.69 0.002 0.002 039-HC 7 150 24.6 36.4 24.5 0.80 11.37 0.010 0.010 039-HC 9 100 28.0 35.8 23.0 10.42 0.022 0.022 039-HC 11 50 28.4 35.7 22.8 0.63 8.45 0.034 0.034 039-HC 13 0 28.9 35.7 0.63 8.24 0.015 0.015 041-HC 1 40 28.5 35.7 22.8 0.55 5.91 0.019 0.019 041-HC 4 30 28.5 35.7 22.8 0.47 0.015 0.015 041-HC 7 20 28.5 35.7 22.8 0.53 0.020 0.020 041-HC 10 10 28.5 35.7 22.8 0.56 0.022 0.022 041-HC 13 0 28.5 35.7 22.8 0.56 0.022 0.022

16
Station # (S197-)
Bottle # Depth (m)
Temp (oC)
Salinity (ppt)
Density (kg/m3)
O2 (ml/l)
PO4 (µM)
SiO2 (µM)
0.45 µm Chl-a (µg/l)
8.0 µm Chl-a (µg/l)
Total Chl-a (µg/l)
043-HC 2 794 5.7 34.5 27.2 2.88 56.90 043-HC 3 596 7.1 34.6 27.1 2.73 44.28 043-HC 4 398 9.2 34.7 26.9 2.56 33.24 043-HC 5 198 20.2 35.9 25.4 0.84 7.57 0.001 0.001 043-HC 7 149 24.9 36.3 24.4 0.74 6.76 0.007 0.007 043-HC 9 100 28.2 35.8 22.9 0.60 8.01 0.047 0.047 043-HC 11 49 28.4 35.7 22.8 0.67 6.29 0.020 0.020 043-HC 13 0 28.7 35.7 0.66 6.88 0.022 0.022 045-HC 1 992 4.5 34.5 27.4 2.09 2.75 045-HC 2 794 5.5 34.5 27.3 1.49 3.10 045-HC 3 596 6.9 34.6 27.1 1.50 045-HC 4 397 9.5 34.7 26.8 1.70 2.41 045-HC 5 199 17.4 35.6 25.8 3.20 1.17 0.000 0.001 0.001 045-HC 6 150 25.2 36.4 24.3 3.80 0.92 0.005 0.010 0.014 045-HC 7 115 27.9 35.7 23.0 4.42 0.000 0.018 0.018 045-HC 8 100 28.0 35.7 22.9 4.51 0.009 0.021 0.030 045-HC 9 90 28.1 35.7 22.9 4.65 0.82 0.008 0.021 0.029 045-HC 10 81 28.3 35.7 22.8 4.80 0.58 0.022 0.015 0.037 045-HC 11 60 28.3 35.7 22.8 4.92 0.57 0.006 0.008 0.014 045-HC 12 30 28.3 35.7 22.8 4.94 0.004 0.009 0.013 045-HC 13 0 28.7 35.7 0.49 0.026 0.007 0.033 050-HC 1 992 4.3 34.6 27.4 2.07 2.90 050-HC 2 795 5.4 34.5 27.3 2.01 2.95 050-HC 3 596 7.1 34.6 27.1 1.37 050-HC 4 397 9.7 34.7 26.8 0.80 2.85 050-HC 5 199 13.0 34.9 26.4 1.06 2.24 0.000 0.002 0.002 050-HC 6 148 20.0 35.7 25.3 3.38 1.06 0.004 0.013 0.017 050-HC 7 114 26.9 35.4 23.1 4.56 0.66 0.003 0.005 0.008 050-HC 8 100 26.9 35.4 23.0 4.97 0.007 0.009 0.016 050-HC 9 89 26.9 35.4 23.0 4.97 0.64 0.007 0.007 0.014 050-HC 10 80 26.9 35.4 23.0 5.09 0.009 0.005 0.014 050-HC 11 60 26.8 35.3 23.0 4.62 0.65 0.003 0.006 0.009 050-HC 12 30 26.8 35.3 23.0 4.75 0.002 0.012 0.014 050-HC 13 0 27.2 35.3 0.67 0.085 0.008 0.093

17
Station # (S197-)
Bottle # Depth (m)
Temp (oC)
Salinity (ppt)
Density (kg/m3)
O2 (ml/l)
PO4 (µM)
SiO2 (µM)
0.45 µm Chl-a (µg/l)
8.0 µm Chl-a (µg/l)
Total Chl-a (µg/l)
059-HC 1 1000 4.8 34.6 27.4 1.94 2.95 059-HC 2 800 5.6 34.6 27.3 1.77 2.78 059-HC 3 601 7.1 34.6 27.1 1.50 059-HC 4 399 10.1 34.7 26.7 1.20 2.36 059-HC 5 199 13.7 34.8 26.1 2.93 1.28 059-HC 6 150 20.7 34.9 24.5 3.23 0.94 0.005 0.010 0.015 059-HC 7 115 25.3 35.0 23.3 4.23 0.016 0.011 0.027 059-HC 8 99 25.6 35.0 23.2 4.51 0.50 0.011 0.016 0.028 059-HC 9 89 25.6 35.0 23.2 4.46 0.61 0.014 0.022 0.036 059-HC 10 80 25.6 35.0 23.2 4.58 0.46 0.000 0.010 0.010 059-HC 11 60 25.7 35.0 23.2 4.65 0.008 0.013 0.021 059-HC 12 30 25.7 35.0 23.2 4.73 0.005 0.011 0.016 059-HC 13 0 26.3 35.1 0.50 0.025 0.005 0.030 065-HC 1 992 4.5 34.6 27.4 0.19 2.22 065-HC 2 794 5.5 34.6 27.3 0.93 2.98 065-HC 3 596 6.9 34.6 27.1 0.34 065-HC 4 398 9.1 34.7 26.8 0.59 2.48 065-HC 5 199 10.8 34.7 26.6 1.20 2.09 065-HC 6 149 12.3 34.6 26.2 1.15 0.56 0.030 0.009 0.039 065-HC 7 115 17.4 34.8 25.2 3.08 0.015 0.020 0.034 065-HC 8 100 20.2 34.9 24.6 3.82 0.021 0.029 0.050 065-HC 9 90 22.9 34.8 23.8 4.20 0.29 0.029 0.020 0.049 065-HC 10 79 25.6 34.8 23.0 4.50 0.21 0.026 0.027 0.052 065-HC 11 60 27.9 34.5 22.0 4.83 0.16 0.045 0.016 0.060 065-HC 12 30 27.9 34.2 21.8 4.86 0.13 0.008 0.010 0.017 065-HC 13 0 28.6 34.1 0.117 0.004 0.122 067-HC 1 1000 4.6 34.6 27.4 1.25 2.91 067-HC 2 800 5.5 34.6 27.3 0.86 3.02 067-HC 3 599 7.1 34.6 27.1 0.36 067-HC 4 399 9.1 34.7 26.8 0.43 2.63 067-HC 5 201 10.7 34.7 26.6 0.56 2.31 067-HC 6 150 11.2 34.7 26.5 0.68 2.05 0.002 0.003 0.006 067-HC 7 116 12.2 34.6 26.3 0.74 0.007 0.006 0.013 067-HC 8 101 12.8 34.5 26.0 1.37 0.013 0.008 0.021

18
Station # (S197-)
Bottle # Depth (m)
Temp (oC)
Salinity (ppt)
Density (kg/m3)
O2 (ml/l)
PO4 (µM)
SiO2 (µM)
0.45 µm Chl-a (µg/l)
8.0 µm Chl-a (µg/l)
Total Chl-a (µg/l)
067-HC 9 90 13.8 34.4 25.8 2.36 0.94 0.012 0.009 0.021 067-HC 10 80 15.2 34.5 25.6 3.25 1.05 0.010 0.016 0.026 067-HC 11 59 19.8 34.7 24.6 5.10 0.24 0.007 0.010 0.017 067-HC 12 29 27.0 34.0 22.0 5.06 0.17 0.004 0.004 0.008 067-HC 13 0 27.4 34.0 0.004 0.003 0.007
Water samples were collected in 2.5 liter Niskin bottles deployed on a self-contained carousel system with a SBE-019Plus CTD sensor (Seabird Instruments, Inc.). Dissolved oxygen (O2) concentrations were determined chemically by Winkler titration. Phosphate (PO4) and silicate (SiO2) levels were measured by colorimetric analysis with an Ocean Optics Chem2000 digital spectrophotometer and chlorophyll-a (Chl-a) concentrations were determined with a Turner Designs Model 10-AU Fluorometer following methods outlined in Parsons, Maita and Lalli (1984; A Manual of Chemical and Biological Methods for Seawater Analysis, Pergamon Press). Chlorophyll-a samples were sequentially filtered through 8.0 and 0.45 µm filters. Blank indicates that an analysis was not performed for that sample. Transition between surface water masses: SPEW (stations 001-050), NPEW (station 059), and ENPCW (stations 065-067).
19
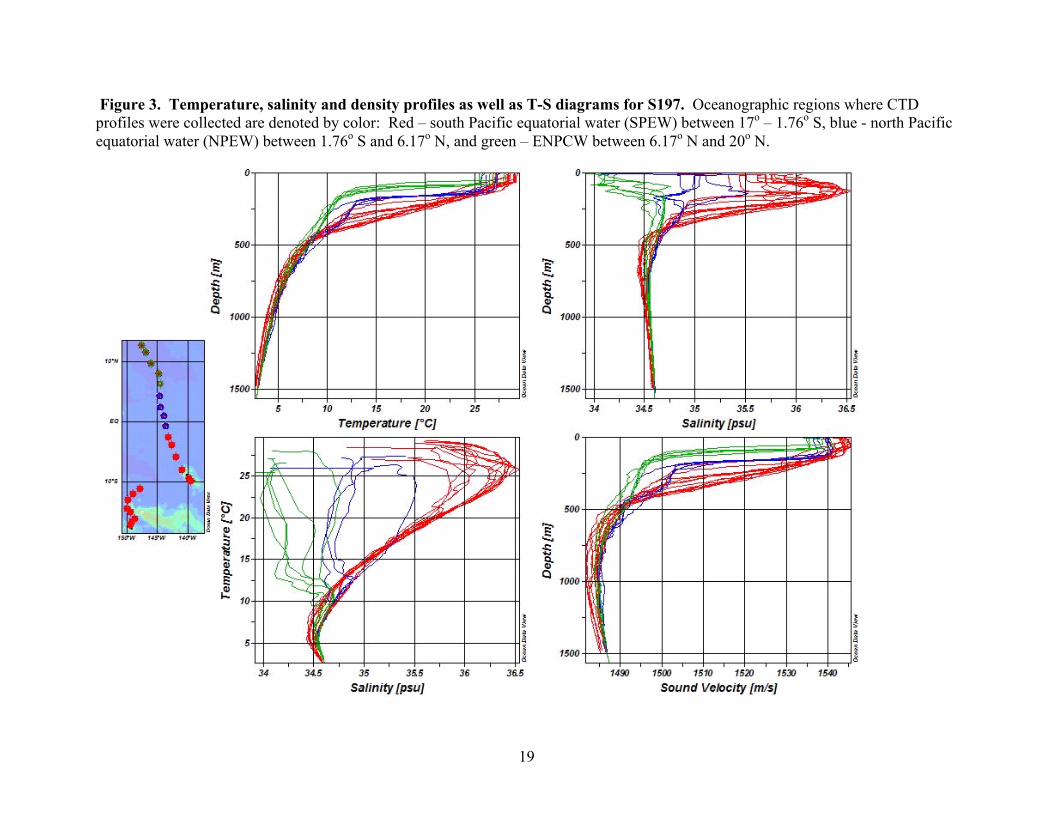
Figure 3. Temperature, salinity and density profiles as well as T-S diagrams for S197. Oceanographic regions where CTD profiles were collected are denoted by color: Red – south Pacific equatorial water (SPEW) between 17o – 1.76o S, blue - north Pacific equatorial water (NPEW) between 1.76o S and 6.17o N, and green – ENPCW between 6.17o N and 20o N.

20
Figure 4. Temperature, salinity and sound velocity cross-sections for S197. Vertical black lines denote location and depth of CTD stations. At 10 and 7.5o S stations were taken over three seamounts.

21
Figure 5. Current direction and magnitude cross-section plots as well as echo amplitude, for S197.
22
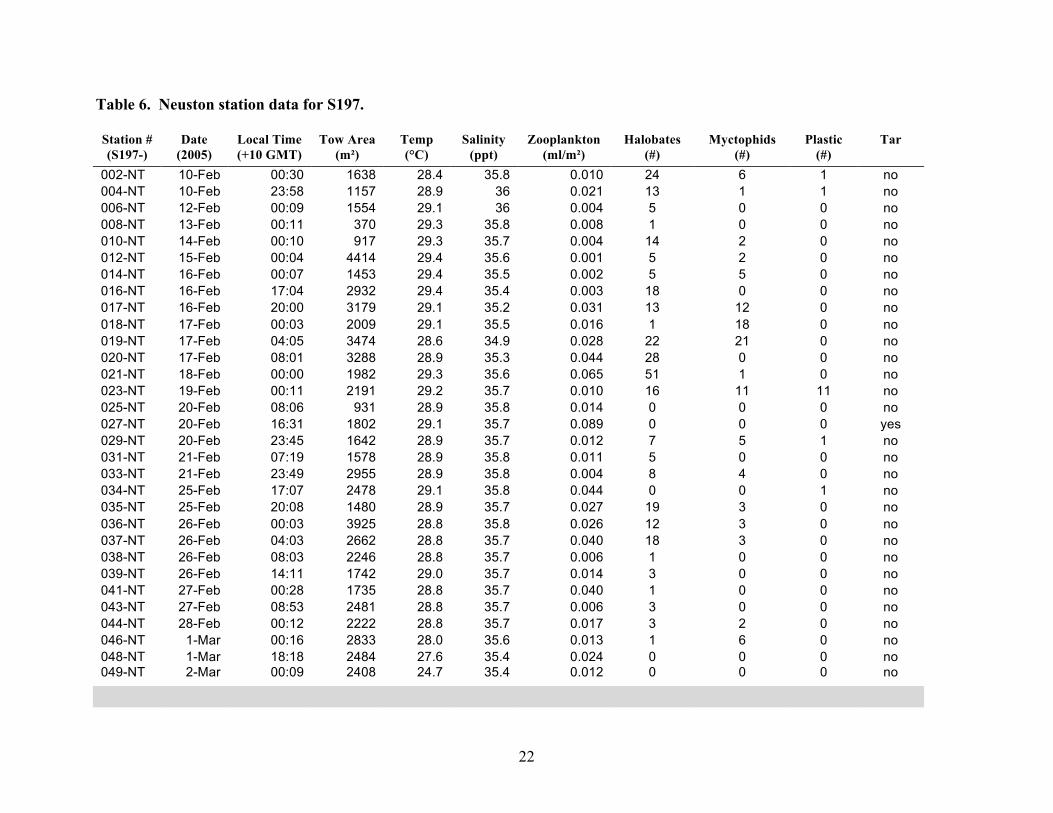
Table 6. Neuston station data for S197. Station # (S197-)
Date (2005)
Local Time (+10 GMT)
Tow Area (m²)
Temp (°C)
Salinity (ppt)
Zooplankton (ml/m²)
Halobates (#)
Myctophids (#)
Plastic (#)
Tar
002-NT 10-Feb 00:30 1638 28.4 35.8 0.010 24 6 1 no 004-NT 10-Feb 23:58 1157 28.9 36 0.021 13 1 1 no 006-NT 12-Feb 00:09 1554 29.1 36 0.004 5 0 0 no 008-NT 13-Feb 00:11 370 29.3 35.8 0.008 1 0 0 no 010-NT 14-Feb 00:10 917 29.3 35.7 0.004 14 2 0 no 012-NT 15-Feb 00:04 4414 29.4 35.6 0.001 5 2 0 no 014-NT 16-Feb 00:07 1453 29.4 35.5 0.002 5 5 0 no 016-NT 16-Feb 17:04 2932 29.4 35.4 0.003 18 0 0 no 017-NT 16-Feb 20:00 3179 29.1 35.2 0.031 13 12 0 no 018-NT 17-Feb 00:03 2009 29.1 35.5 0.016 1 18 0 no 019-NT 17-Feb 04:05 3474 28.6 34.9 0.028 22 21 0 no 020-NT 17-Feb 08:01 3288 28.9 35.3 0.044 28 0 0 no 021-NT 18-Feb 00:00 1982 29.3 35.6 0.065 51 1 0 no 023-NT 19-Feb 00:11 2191 29.2 35.7 0.010 16 11 11 no 025-NT 20-Feb 08:06 931 28.9 35.8 0.014 0 0 0 no 027-NT 20-Feb 16:31 1802 29.1 35.7 0.089 0 0 0 yes 029-NT 20-Feb 23:45 1642 28.9 35.7 0.012 7 5 1 no 031-NT 21-Feb 07:19 1578 28.9 35.8 0.011 5 0 0 no 033-NT 21-Feb 23:49 2955 28.9 35.8 0.004 8 4 0 no 034-NT 25-Feb 17:07 2478 29.1 35.8 0.044 0 0 1 no 035-NT 25-Feb 20:08 1480 28.9 35.7 0.027 19 3 0 no 036-NT 26-Feb 00:03 3925 28.8 35.8 0.026 12 3 0 no 037-NT 26-Feb 04:03 2662 28.8 35.7 0.040 18 3 0 no 038-NT 26-Feb 08:03 2246 28.8 35.7 0.006 1 0 0 no 039-NT 26-Feb 14:11 1742 29.0 35.7 0.014 3 0 0 no 041-NT 27-Feb 00:28 1735 28.8 35.7 0.040 1 0 0 no 043-NT 27-Feb 08:53 2481 28.8 35.7 0.006 3 0 0 no 044-NT 28-Feb 00:12 2222 28.8 35.7 0.017 3 2 0 no 046-NT 1-Mar 00:16 2833 28.0 35.6 0.013 1 6 0 no 048-NT 1-Mar 18:18 2484 27.6 35.4 0.024 0 0 0 no 049-NT 2-Mar 00:09 2408 24.7 35.4 0.012 0 0 0 no
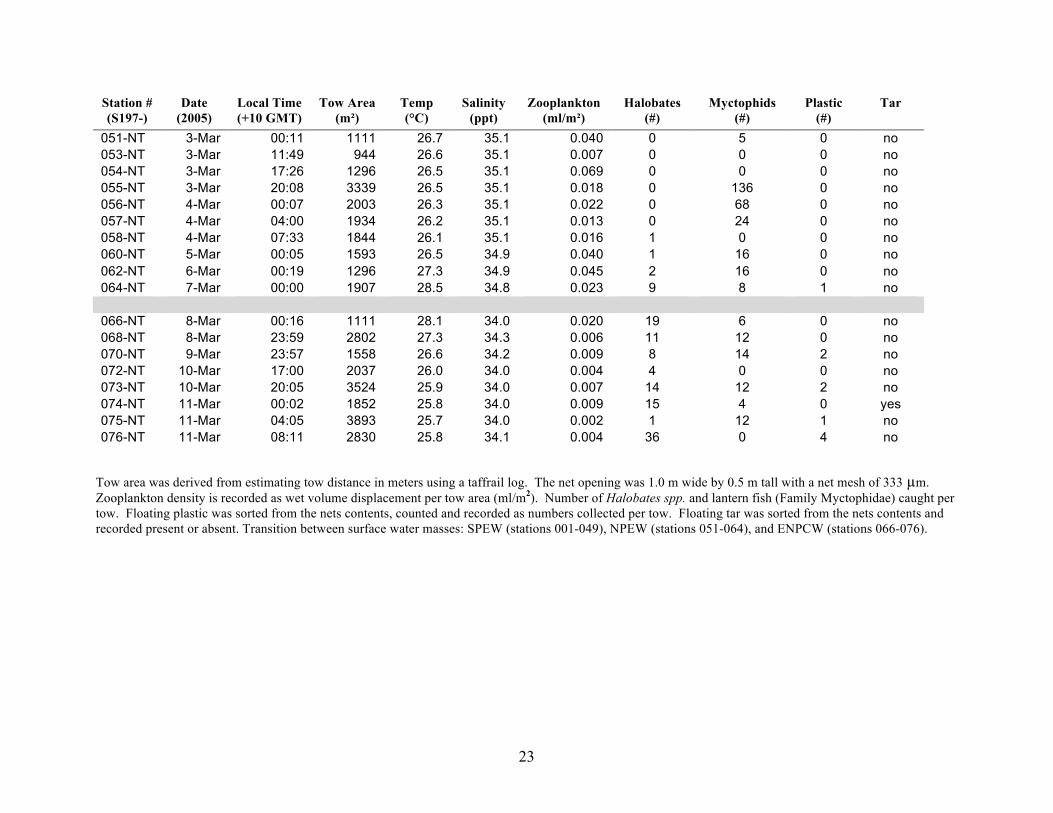
23
Station # (S197-)
Date (2005)
Local Time (+10 GMT)
Tow Area (m²)
Temp (°C)
Salinity (ppt)
Zooplankton (ml/m²)
Halobates (#)
Myctophids (#)
Plastic (#)
Tar
051-NT 3-Mar 00:11 1111 26.7 35.1 0.040 0 5 0 no 053-NT 3-Mar 11:49 944 26.6 35.1 0.007 0 0 0 no 054-NT 3-Mar 17:26 1296 26.5 35.1 0.069 0 0 0 no 055-NT 3-Mar 20:08 3339 26.5 35.1 0.018 0 136 0 no 056-NT 4-Mar 00:07 2003 26.3 35.1 0.022 0 68 0 no 057-NT 4-Mar 04:00 1934 26.2 35.1 0.013 0 24 0 no 058-NT 4-Mar 07:33 1844 26.1 35.1 0.016 1 0 0 no 060-NT 5-Mar 00:05 1593 26.5 34.9 0.040 1 16 0 no 062-NT 6-Mar 00:19 1296 27.3 34.9 0.045 2 16 0 no 064-NT 7-Mar 00:00 1907 28.5 34.8 0.023 9 8 1 no 066-NT 8-Mar 00:16 1111 28.1 34.0 0.020 19 6 0 no 068-NT 8-Mar 23:59 2802 27.3 34.3 0.006 11 12 0 no 070-NT 9-Mar 23:57 1558 26.6 34.2 0.009 8 14 2 no 072-NT 10-Mar 17:00 2037 26.0 34.0 0.004 4 0 0 no 073-NT 10-Mar 20:05 3524 25.9 34.0 0.007 14 12 2 no 074-NT 11-Mar 00:02 1852 25.8 34.0 0.009 15 4 0 yes 075-NT 11-Mar 04:05 3893 25.7 34.0 0.002 1 12 1 no 076-NT 11-Mar 08:11 2830 25.8 34.1 0.004 36 0 4 no
Tow area was derived from estimating tow distance in meters using a taffrail log. The net opening was 1.0 m wide by 0.5 m tall with a net mesh of 333 µm. Zooplankton density is recorded as wet volume displacement per tow area (ml/m2). Number of Halobates spp. and lantern fish (Family Myctophidae) caught per tow. Floating plastic was sorted from the nets contents, counted and recorded as numbers collected per tow. Floating tar was sorted from the nets contents and recorded present or absent. Transition between surface water masses: SPEW (stations 001-049), NPEW (stations 051-064), and ENPCW (stations 066-076).

24
Figure 6a. Seamount bathymetry and surface current plots for Haut-Fend Dumont D’Urvile from S197.

25
Figure 6b. Seamount bathymetry and surface current plots for Hina Kura from S197.

26
Figure 7. Seamount biological data for S197. Average values for On seamounts (n=3), Off seamounts n=5, and Distant from seamounts n=3.

27
Figure 8. Myctophid DVM patterns for S197. Number of myctophids collected in consecutive neuston tows during four separate moon phases.
Figure 9. Pteropod DVM patterns for S197. Total number of pteropods collected in consecutive neuston tows from all four moon phases.

28
Table 7. Student research topics for S197. Research Team I: ENSO related temporal trends in oceanographic conditions Heidi Roop Waters of the Central Pacific: Investigating Annual Variations of Surface Water Mass Boundaries Shore Gregory Temporal Variation of the Surface Currents in the Equatorial Pacific In Relation to the ENSO Cycle Sadie Marden Temporal Variation of the Pacific Subsurface Equatorial Currents and Countercurrents During the
Development of a Strong ENSO Period Daniel Gagliano Variation of Phytoplankton Productivity and Composition in the Surface Water Masses of the
Tropical Pacific Ocean and Inter-Annual Change related to El Nino Southern Oscillation (ENSO) Danny Kayne and Matt Sullivan
Myctophid and Euthecosomatous Pteropoda Distribution as Indicator Species to Establish Water Mass Boundaries in the Central Pacific
Research Team II: Regional comparison of vertical structure in oceanographic conditions Stephen Wheless Deep Chlorophyll-a Maximum in the Tropical and Subtropical Pacific: a study of the physical and
chemical factors affecting the vertical distribution of plant biomass in the water column Caitlin Warbelow The effects of dissolved oxygen and phosphate on the vertical distribution of heterotrophic and
photosynthetic bacteria in the Equatorial Pacific Ku’ulei Vickery Comparing the Pacific Sub-arctic Intermediate Water and Antarctic Intermediate Water Masses along
the Tahiti-Marquesas-Hawai`i S197 Cruise Track Lilly Rasel Barrier Layer Formation and Variation in the Central Equatorial Pacific Nicole Kinsman Location and Velocity of SOFAR Channel Axes in the Equatorial and Sub-equatorial Pacific Research Team III: DVM Brittany Gerack, Ella Haselswerdt
Causes of Vertical Migration of Myctophid Fish and the Importance of Bioluminescence in Relation to the Lunar Cycle
Marian C. Lyman, Maria Vizcaino
The Effect of Size and Shape on the Diel Vertical Migration of Pteropods in the Pacific Ocean
Research Team IV: Seamounts James Passanisi, Sarina Yospin
The Effects of Pacific Seamount Morphology on Ocean Currents
Bart Critser Investigation of ocean stratigraphy changes in response to deep water current impedance by seamounts in the Equatorial Pacific
Rosie Tracy, Hadley Jensen and Sarah Wegmueller
Central Pacific Equatorial Seamounts: A Study of Composition, Diversity and Biomass of Phytoplankton, Zooplankton and Nekton