cross-tab-presentation
TRANSCRIPT

© 2014 Northern Trust Corporation
The Power of the Cross-Tab
Andy Curtis, Senior Vice President, Northern Trust
Big Data & Analytics for Banking Summit

Topics to be Covered
Evolution of Analytics
Discussion of Cross-Tabs
Intro to Markov Chains
“What If” Models
Pulling It All Together

Evolution of Analytics
Business Intelligence• What Happened?
Business Analytics• Why Did it
Happen?
Predictive Analytics• What Could
Happen?

Business Intelligence—What Happened?
Leverage one-way frequencies* to answer:
Status # (K) %
New 400 20
Active 600 30
Lapsed
1,000 50
Source %
Web 50
Print 20
Walk In 20
Referral 10
12 Mo Rev %
$5 K+ 5
$2 to $5 K 15
$1 to $2 K 20
< $1 K 60
Average $1,500
What does our client base look like?
What is the source of new clients?
What is the annual revenue per client?
* All numbers are fictional

Business Intelligence—Best Practices
Understand every field in the database
Eliminate fields that are too new, poorly filled, or
unreliable
Look at distributions of values for each field
Know what every field means
Work with the finance team to define the business rules for
properly attributing revenue, cost, and other key business
drivers
Support tools (i.e. Tableau, Microsoft BI, etc.) that allow
users to “safely” do their own data discovery

Business Analytics—Why Did it Happen?
Leverage two-way frequencies* to answer:
Bank-
ingLoan
Broke-rage
Trusts
Profit
Index
Y Y Y Y 400
Y Y Y 280
Y Y 175
Y 80
Y 75
Y 50
Y 30
Client Size Web Print
Walk-Ins
Refer-ral
5 M+ 5% 20% 30% 40%
2-5 M 30% 17% 23% 30%
1- 2 M
50% 14% 16% 20%
< 1 M 70% 11% 9% 10%
Year 2
Year 1 Active
Lapse
New 50% 50%
Active 70% 30%
Lapsed
10% 90%
What product bundles are most profitable?
What sources are best for acquiring large clients?
What is the client retention rate?
* All numbers are fictional

Business Analytics—Best Practices
This step begins the process of converting data into insights
Divide key variables into meaningful groups large enough to be meaningful, and not too small to be spurious
Leverage cross-tabs to identify key interactions
Understand client profitability across product bundles
Understand source of new customers Understand retention by client group
Use multivariate techniques to build predictive models, segments, etc.

Andrey Markov, Russian mathematician (1856-1922)
Studied random process where future based solely on present state (i.e., Coin Flips and Population Migrations)
Example of migration of 100 new clients across 3 years
Year 2Year 1 Active Lapsed
New 50% 50%
Active 70% 30%
Lapsed 10% 90%
YearStatus 0 1 2 3
New 100
Active 50 40 34
Lapse 50 60 66
50
5035 28
45 54
15 5 12 6
Predictive Analytics—Markov Chains
* All numbers are fictional

Predictive Analytics—What Could Happen?
Build 3 year forecast leveraging Starting population Revenue per active
YearStatus 0 1 2 3New 400 400 400 400 Active 600 720 832 939
Lapse 1,000 1,280 1,568 1,861 Rev ($M) 1,080 1,248 1,409 3,737
Year 2
Year 1 Active
Lapse
New 50% 50%
Active 70% 40%
Lapsed
10% 90%
Status # (K) %
New 400 20
Active 600 30
Lapsed
1,000 50
12 Mo Rev %
$5 K+ 5
$2 to $5 K 15
$1 to $2 K 20
< $1 K 60
Average $1,500
200
100420
720 K * $1.5 K =
* All numbers are fictional

10% Acquisition Improvement: $3.9 B
10% Cross-Sell Improvement: $4.1 B
10% Retention Improvement: $4.5 B
Prescriptive Analytics—What Could Happen?
Year 2 YearYear 1 Active Lapsed Status 0 1 2 3New 60% 40% New 400 400 400 400 Active 80% 20% Active 600 820 1,014 1,190 Lapsed 10% 90% Lapse 1,000 1,180 1,386 1,610 Rev / Year $1,500 Rev ($M) 1,230 1,521 1,785 4,536
Year 2 YearYear 1 Active Lapsed Status 0 1 2 3New 50% 50% New 440 440 440 440 Active 70% 30% Active 600 740 868 989 Lapsed 10% 90% Lapse 1,000 1,300 1,612 1,931 Rev / Year $1,500 Rev ($M) 1,110 1,302 1,483 3,895
Year 2 YearYear 1 Active Lapsed Status 0 1 2 3New 50% 50% New 400 400 400 400 Active 70% 30% Active 600 720 832 940 Lapsed 10% 90% Lapse 1,000 1,280 1,568 1,861 Rev / Year $1,650 Rev ($M) 1,188 1,373 1,551 4,111
* All numbers are fictional
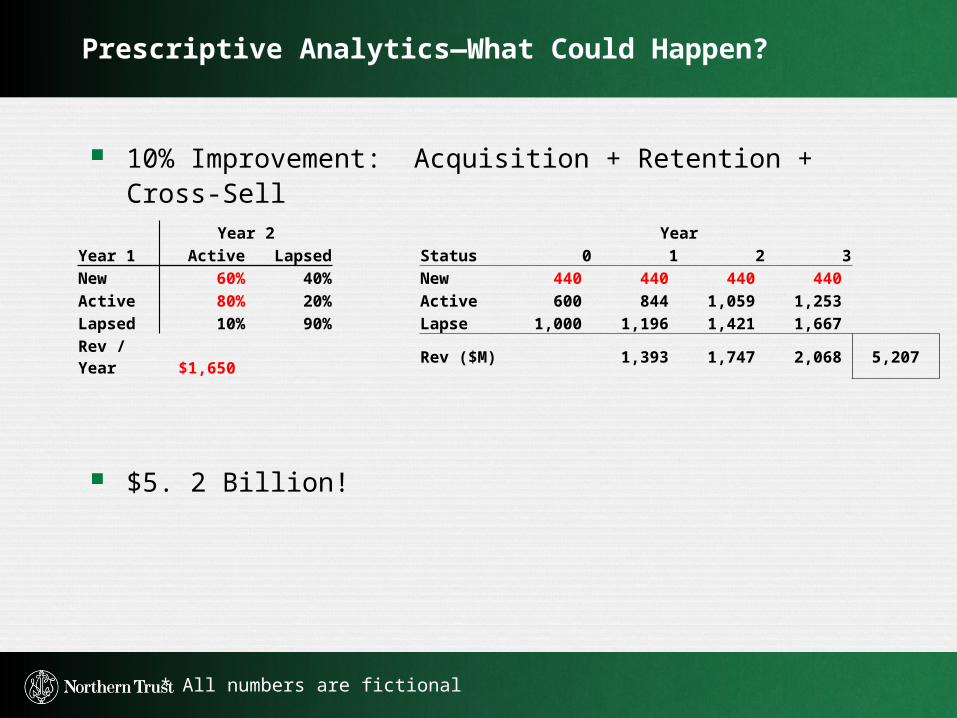
10% Improvement: Acquisition + Retention + Cross-Sell
$5. 2 Billion!
Prescriptive Analytics—What Could Happen?
Year 2 YearYear 1 Active Lapsed Status 0 1 2 3New 60% 40% New 440 440 440 440 Active 80% 20% Active 600 844 1,059 1,253 Lapsed 10% 90% Lapse 1,000 1,196 1,421 1,667 Rev / Year $1,650 Rev ($M) 1,393 1,747 2,068 5,207
* All numbers are fictional

12
Concluding Thoughts
Driver Business Intelligence Business Analytics Predictive Analytics
Acquisition • Marketing Effectiveness
• SEO / Web Reporting
• Acquisition Models• Channel Optimization• Lifetime Value• Web Analytics
• Behavioral Triggers
Cross-Sell • Client Profitability• Client Migration
• Segmentation• Cross-Sell Models• Product Bundles
• Recommend-ation Engines
Retention • Market Research• Quality KPIs
• Process Improvement• Retention Models• Satisfaction Analysis
• Sentiment Analysis
To achieve goals, organizations must leverage BI, BA, and Predictive Analytics

13
Questions

© 2014 Northern Trust Corporation
Big Data & Analytics for Banking SummitThank You