creditreform rating summary...2018/08/15 · banco central hispano in 1990, banco santander became...
TRANSCRIPT

© Creditreform Rating AG 2018 15 August 2018 1/13
Creditreform Bank Rating
Banco Santander S.A. (Group)
SWOT-Analysis
Strengths
+ Spain’s largest bank with high systematic relevance for the global banking sector
+ Internationally diversified business model with strong market positions in key markets
+ Stable business model with constant net profit
+ Cost Income Ratio exceeds peers
+ Solid liquidity situation
Weaknesses
- Low capital ratios in peer group comparison
- Below-average performance in the 2016 EBA stress test
Opportunities / Threats
+ Leading positions in 10 core markets with a high population and providing growth op-portunities
+ Digital transformation is driven by high investments
+/- Dependent on the economic development in South America
- Challenging outlook in UK as a result of Brexit-related macro uncertainty
- Increasing banking regulation leads to rising costs
Rating object Rating information
Banco Santander S.A. (Group)
Creditreform ID: 6226
Incorporation: 1857
(Main-) Industry: Banks
Management: F. Ana Botín-Sanz (Group Executive Chairman)
H. José Antonio Álvarez Álvarez (CEO)
Bruce N. Carnegie-Brown (Vice Chairman)
Guillermo de la Dehesa Romero (Vice Chairman)
Rodrigo Echenique Gordillo (Vice Chairman)
Long Term Issuer Rating / Outlook:
A / stable
Short Term:
L2
Rating of Bank Capital and Unsecured Debt Instruments:
Senior Unsecured
A
Tier 2
BBB-
Additional Tier 1
BB+
Rating Date: 15 August 2018
Monitoring until: withdrawal of the rating
Rating Type: unsolicited
Rating Methodology: bank ratings;
rating of bank capital and
unsecured debt instruments
Contents
SWOT-Analysis .................................. 1 Company Overview ............................ 2 Business Development ....................... 4 Profitability ...................................... 4 Asset Situation and Asset Quality ... 5 Refinancing and Capital Quality ...... 6 Liquidity .......................................... 8 Conclusion ......................................... 9 Ratings Detail ................................... 10
Analysts
Tobias Stroetges
Lead-Analyst
Philipp J. Beckmann
Co-Analyst / Senior Analyst
© Creditreform Rating AG 2018 15 August 2018 2/13
Creditreform Bank Rating
Banco Santander S.A. (Group)
Company Overview
Founded in 1857, the Banco Santander S.A. is managed by the Botín family in the fourth
generation. The bank developed from a series of mergers and acquisitions into a globally
operating and multinational financial group, beginning in the 1990s. After the merger with
Banco Central Hispano in 1990, Banco Santander became the largest universal bank in
Spain. Moreover, the bank is the largest bank in the eurozone in terms of its market capi-
talization of EUR 88.410 million in 2017. As Banco Santander is one of the global sys-
tematically important banks (G-SIB), the bank must comply with additional regulatory
requirements. The bank’s headquarter is in Madrid.
Santander’s business model is based on geographic diversification and focuses on com-
mercial banking, which accounted for approximately 91% of the bank’s revenue in 2017.
The bank operates in ten core markets with a distribution between mature markets and
developing markets. In detail, these are the countries of Argentina, Brazil, Chile, Germa-
ny, Mexico, Poland, Portugal, Spain, the United Kingdom and USA, each with a central-
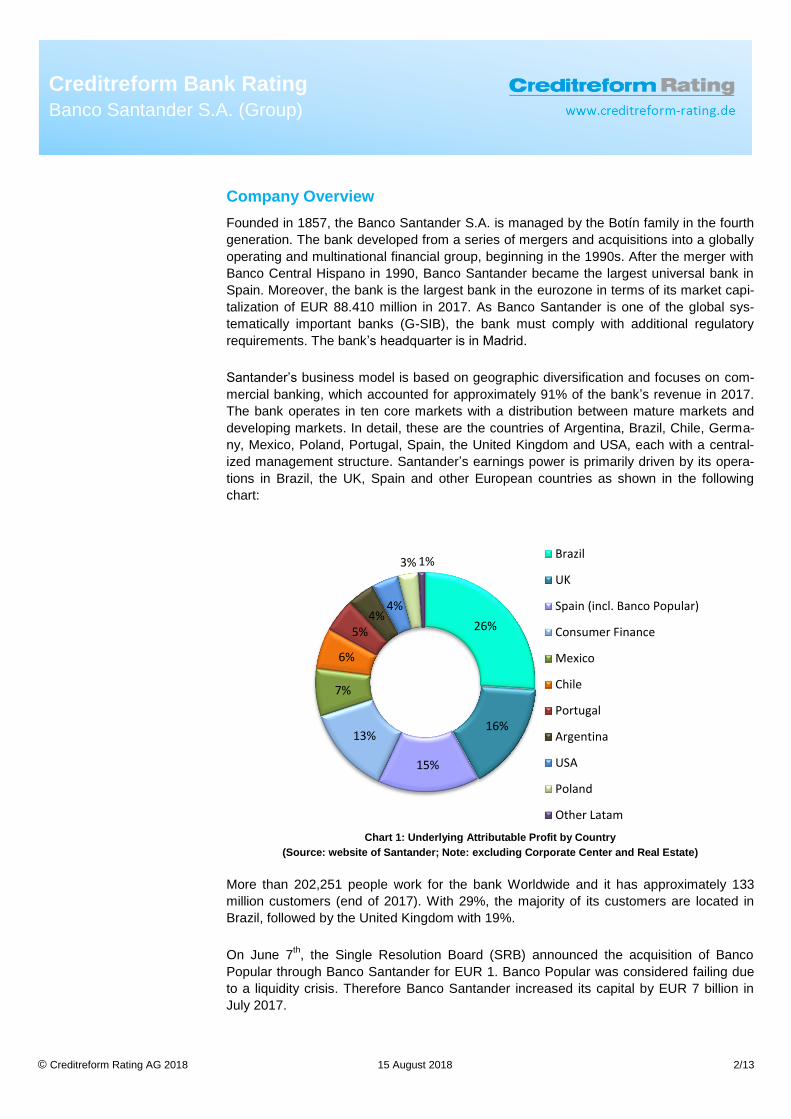
ized management structure. Santander’s earnings power is primarily driven by its opera-
tions in Brazil, the UK, Spain and other European countries as shown in the following
chart:
Chart 1: Underlying Attributable Profit by Country
(Source: website of Santander; Note: excluding Corporate Center and Real Estate)
More than 202,251 people work for the bank Worldwide and it has approximately 133
million customers (end of 2017). With 29%, the majority of its customers are located in
Brazil, followed by the United Kingdom with 19%.
On June 7th, the Single Resolution Board (SRB) announced the acquisition of Banco
Popular through Banco Santander for EUR 1. Banco Popular was considered failing due
to a liquidity crisis. Therefore Banco Santander increased its capital by EUR 7 billion in
July 2017.
26%
16%
15%
13%
7%
6%
5% 4%
4%
3% 1% Brazil
UK
Spain (incl. Banco Popular)
Consumer Finance
Mexico
Chile
Portugal
Argentina
USA
Poland
Other Latam

© Creditreform Rating AG 2018 15 August 2018 3/13
Creditreform Bank Rating
Banco Santander S.A. (Group)
The two major globally acting subsidiaries are Santander Private Banking and Santander
Consumer Finance (SCF). In Germany, Santander is represented by Santander Con-
sumer Bank, which is specialized in sales financing of motor vehicles and consumer
goods.
The shareholder structure of Banco Santander is as follows:
Chart 2: Major shareholders of Banco Santander S.A.
(Source: Own presentation based on data of S&P Global Market Intelligence)
13%
9%
6%
56%
16%
State Street Global AdvisorsInc.
BNY Asset Management
BlackRock Inc.
Free Float
Other
© Creditreform Rating AG 2018 15 August 2018 4/13
Creditreform Bank Rating
Banco Santander S.A. (Group)
Business Development
Profitability
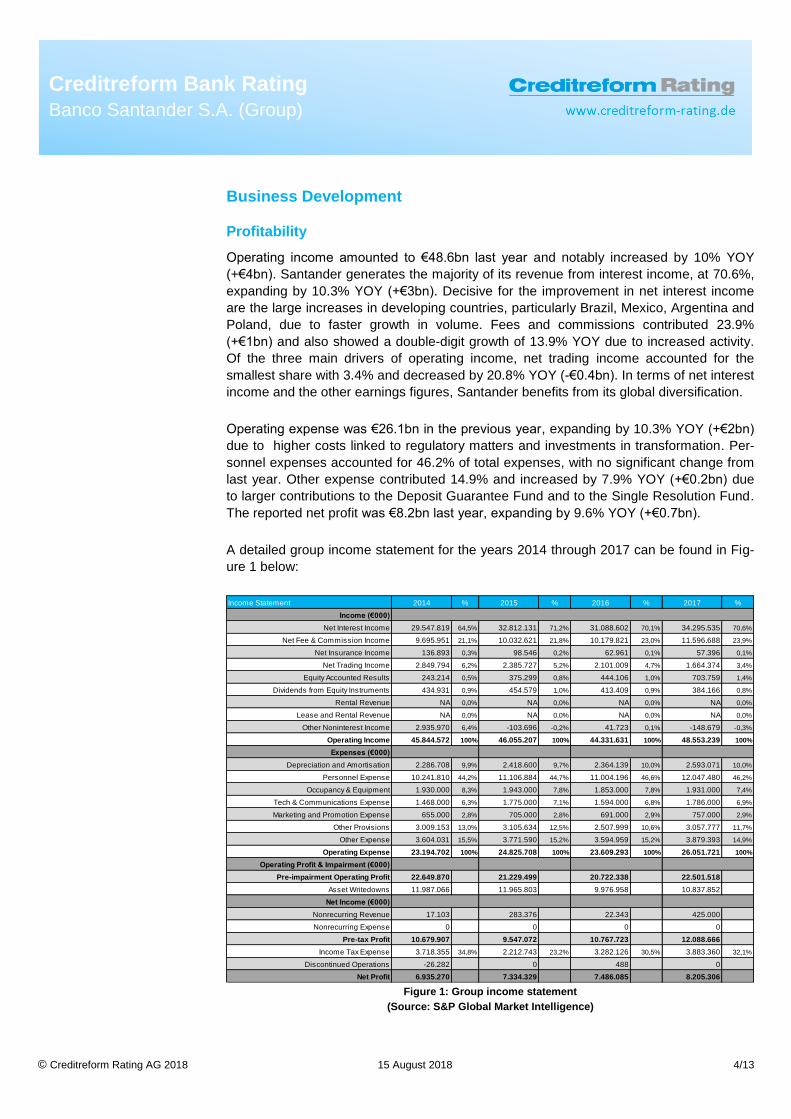
Operating income amounted to €48.6bn last year and notably increased by 10% YOY
(+€4bn). Santander generates the majority of its revenue from interest income, at 70.6%,
expanding by 10.3% YOY (+€3bn). Decisive for the improvement in net interest income
are the large increases in developing countries, particularly Brazil, Mexico, Argentina and
Poland, due to faster growth in volume. Fees and commissions contributed 23.9%
(+€1bn) and also showed a double-digit growth of 13.9% YOY due to increased activity.
Of the three main drivers of operating income, net trading income accounted for the
smallest share with 3.4% and decreased by 20.8% YOY (-€0.4bn). In terms of net interest
income and the other earnings figures, Santander benefits from its global diversification.
Operating expense was €26.1bn in the previous year, expanding by 10.3% YOY (+€2bn)
due to higher costs linked to regulatory matters and investments in transformation. Per-
sonnel expenses accounted for 46.2% of total expenses, with no significant change from
last year. Other expense contributed 14.9% and increased by 7.9% YOY (+€0.2bn) due
to larger contributions to the Deposit Guarantee Fund and to the Single Resolution Fund.
The reported net profit was €8.2bn last year, expanding by 9.6% YOY (+€0.7bn).
A detailed group income statement for the years 2014 through 2017 can be found in Fig-
ure 1 below:
Figure 1: Group income statement
(Source: S&P Global Market Intelligence)
Income Statement 2014 % 2015 % 2016 % 2017 %
Income (€000)
Net Interest Income 29.547.819 64,5% 32.812.131 71,2% 31.088.602 70,1% 34.295.535 70,6%
Net Fee & Commission Income 9.695.951 21,1% 10.032.621 21,8% 10.179.821 23,0% 11.596.688 23,9%
Net Insurance Income 136.893 0,3% 98.546 0,2% 62.961 0,1% 57.396 0,1%
Net Trading Income 2.849.794 6,2% 2.385.727 5,2% 2.101.009 4,7% 1.664.374 3,4%
Equity Accounted Results 243.214 0,5% 375.299 0,8% 444.106 1,0% 703.759 1,4%
Dividends from Equity Instruments 434.931 0,9% 454.579 1,0% 413.409 0,9% 384.166 0,8%
Rental Revenue NA 0,0% NA 0,0% NA 0,0% NA 0,0%
Lease and Rental Revenue NA 0,0% NA 0,0% NA 0,0% NA 0,0%
Other Noninterest Income 2.935.970 6,4% -103.696 -0,2% 41.723 0,1% -148.679 -0,3%
Operating Income 45.844.572 100% 46.055.207 100% 44.331.631 100% 48.553.239 100%
Expenses (€000)
Depreciation and Amortisation 2.286.708 9,9% 2.418.600 9,7% 2.364.139 10,0% 2.593.071 10,0%
Personnel Expense 10.241.810 44,2% 11.106.884 44,7% 11.004.196 46,6% 12.047.480 46,2%
Occupancy & Equipment 1.930.000 8,3% 1.943.000 7,8% 1.853.000 7,8% 1.931.000 7,4%
Tech & Communications Expense 1.468.000 6,3% 1.775.000 7,1% 1.594.000 6,8% 1.786.000 6,9%
Marketing and Promotion Expense 655.000 2,8% 705.000 2,8% 691.000 2,9% 757.000 2,9%
Other Provisions 3.009.153 13,0% 3.105.634 12,5% 2.507.999 10,6% 3.057.777 11,7%
Other Expense 3.604.031 15,5% 3.771.590 15,2% 3.594.959 15,2% 3.879.393 14,9%
Operating Expense 23.194.702 100% 24.825.708 100% 23.609.293 100% 26.051.721 100%
Operating Profit & Impairment (€000)
Pre-impairment Operating Profit 22.649.870 21.229.499 20.722.338 22.501.518
Asset Writedowns 11.987.066 11.965.803 9.976.958 10.837.852
Net Income (€000)
Nonrecurring Revenue 17.103 283.376 22.343 425.000
Nonrecurring Expense 0 0 0 0
Pre-tax Profit 10.679.907 9.547.072 10.767.723 12.088.666
Income Tax Expense 3.718.355 34,8% 2.212.743 23,2% 3.282.126 30,5% 3.883.360 32,1%
Discontinued Operations -26.282 0 488 0
Net Profit 6.935.270 7.334.329 7.486.085 8.205.306

© Creditreform Rating AG 2018 15 August 2018 5/13
Creditreform Bank Rating
Banco Santander S.A. (Group)
The cost/ income ratio changed only slightly compared to the previous year, still exceed-
ing that of its peers. The ROAA figure of the bank was significantly more favorable than
that of its peers, increasing marginally compared to the previous year, while the same
figure improved for the peer group in the reporting year. The ROAE figure of the bank
was well above the average and displayed an increase of 0.36 percentage points over
the previous year, whereas the improvement for peer banks was more noticeable. The
bank’s RORWA was comparable to that of the peer group; however, the peer group
showed a noticeable increase in that figure, while Santander only saw a marginal in-
crease. The net interest margin increased by 0.11 percentage points from the previous
year and is well above the average in peer group comparison. Of the four business de-
velopment aspects examined, the earnings figures achieved the highest relative score.
The disproportionate improvement in the income ratios compared to the peer group is
attributable to the strong growth in Santander’s customer loans.
A detailed overview of the income ratios for the years of 2014 through 2017 can be found
in Figure 2 below:
Figure 2: Group key earnings figures
(Source: S&P Global Market Intelligence)
Asset Situation and Asset Quality
In terms of total assets, financial assets made up 92%, increasing markedly by 7.4% YOY
(+€91bn). Net loans to customers contributed the largest share to Santander’s total as-
sets with 58.8%, increasing significantly by 7.4% YOY (+€58bn). These assets were
broadly diversified within mature markets and developing markets. Total securities pro-
vided 20.3%, remaining largely unchanged over the previous year. Of the three main
constituents of the asset side, cash positions comprised the smallest share with 7.7%,
increasing considerably by 45.2% YOY (+€35bn). Total assets added up to €1,444bn,
increasing markedly by 7.9% YOY (+€105bn).
A detailed overview of the development of the asset side for the years of 2014 through
2017 is shown in Figure 3 below:
Income Ratios (%) 2014 % 2015 % 2016 % 2017 %
Return on Average Assets (ROAA) 0,58 0,14 0,55 -0,03 0,56 0,01 0,58 0,02
Return on Equity (ROAE) 8,15 1,67 7,39 -0,76 7,47 0,08 7,83 0,36
RoRWA 1,26 0,26 1,22 -0,04 1,29 0,06 1,34 0,05
Net Interest Margin 2,67 0,39 2,66 -0,01 2,52 -0,14 2,63 0,11
Cost income Ratio ex. Trading 53,95 -4,19 56,85 2,90 55,91 -0,94 55,56 -0,35
Cost income Ratio 50,59 -2,82 53,90 3,31 53,26 -0,65 53,66 0,40
Change in %-Points

© Creditreform Rating AG 2018 15 August 2018 6/13
Creditreform Bank Rating
Banco Santander S.A. (Group)
Figure 3: Development of assets
(Source: S&P Global Market Intelligence)
The NPL ratio of the bank was less favorable than that of its peers and displayed an in-
crease of 0.18 percentage points over the previous year, whereas the peer group showed
a decline in that figure. The NPL / RWA figure of the bank was comparable to that of its
peers, but showed a significant increase of 0.49 percentage points over the previous year
due to the acquisition and integration of Banco Popular. The same figure decreased for
the peer group. Potential problem loans / NPLs of the bank were far better than that of its
peers and displayed a significant decrease of 2.47 percentage points from the previous
year. The reserved / impaired loans figure of the bank was more favorable than that of its
peers but showed a decrease of 8.92 percentage points over the previous year, while the
same ratio decreased more dramatically for the peer group. Net write-offs/ RWA of the
bank was less favorable than that of its peers, remaining largely unchanged over the
previous year; the same figure decreased for the peer group. The RWA / assets figure of
the bank was significantly less favorable than that of its peers, showing a decrease of
2.02% over the previous year, with the same ratio decreasing for the peer group.
A detailed overview of the asset quality for the years of 2014 through 2017 can be seen
in Figure 4 below:
Figure 4: Development of asset quality
(Source: S&P Global Market Intelligence)
Refinancing and Capital Quality
Santander’s total liabilities increased significantly by 8% YOY (+€101bn); in the same
period, equity was built up by 4%, and financial liabilities accounted for 97% of total liabili-
ties, increasing significantly by 8.3% YOY (+€100bn). Customer deposits represented the
largest share of total liabilities with 58.1%, increasing by 12.5% YOY (+€87bn). Total debt
made up 16.3% of total liabilities, falling by 0.05% YOY (-€11bn) All other positions on the
liabilities side have remained relatively unchanged in recent years.
Assets (€000) 2014 % 2015 % 2016 % 2017 %
Cash and Balances with Central Banks 69.853.000 5,5% 77.750.799 5,8% 76.454.014 5,7% 110.994.931 7,7%
Net Loans to Banks 81.287.602 6,4% 82.530.558 6,2% 76.686.336 5,7% 77.430.687 5,4%
Net Loans to Customers 734.710.668 58,0% 790.848.130 59,0% 790.469.921 59,0% 848.914.175 58,8%
Total Securities 281.152.233 22,2% 289.665.641 21,6% 295.743.498 22,1% 293.492.439 20,3%
Financial Assets 1.167.004.301 92% 1.240.795.128 93% 1.239.353.769 93% 1.330.832.232 92%
Equity Accounted Investments 3.470.692 0,3% 3.250.427 0,2% 4.836.278 0,4% 6.183.588 0,4%
Other Investments 0 0,0% 0 0,0% 0 0,0% 0 0,0%
Insurance Assets 340.304 0,0% 331.185 0,0% 330.946 0,0% 341.273 0,0%
Noncurrent Assets HFS & Discontinued Ops 5.376.308 0,4% 5.645.869 0,4% 5.772.098 0,4% 15.280.296 1,1%
Tangible and Intangible Assets 53.656.861 4,2% 54.749.613 4,1% 52.706.357 3,9% 51.657.810 3,6%
Tax Assets 27.954.730 2,2% 27.813.409 2,1% 27.678.027 2,1% 30.243.202 2,1%
Total Other Assets 8.493.089 0,7% 7.676.104 0,6% 8.447.276 0,6% 9.766.394 0,7%
Total Assets 1.266.295.665 100% 1.340.261.735 100% 1.339.124.751 100% 1.444.304.795 100%
Asset-Quality (%) 2014 % 2015 % 2016 % 2017 %
Non Performing Loans (NPL) / Loans 5,77 -0,63 4,81 -0,96 4,41 -0,41 4,59 0,18
NPL / RWA 7,12 -1,39 6,33 -0,79 5,72 -0,61 6,21 0,49
Potential Problem Loans / NPL 27,87 -3,99 0,00 -27,87 0,00 0,00 0,00 0,00
Reserves / Impaired Loans 67,42 5,65 73,39 5,97 74,89 1,50 65,97 -8,92
Net Write-offs / Risk-adjusted Assets 1,91 0,10 1,83 -0,08 1,92 0,09 1,95 0,02
Risk-weighted Assets/ Assets 46,26 2,37 43,70 -2,57 43,92 0,22 41,89 -2,02
Change in %-Points

© Creditreform Rating AG 2018 15 August 2018 7/13
Creditreform Bank Rating
Banco Santander S.A. (Group)
A detailed overview of the development of liabilities for the years of 2014 through 2017
can be found in Figure 5 below:
Figure 5: Development of refinancing and capital adequacy
(Source: S&P Global Market Intelligence)
The bank’s CET1 ratio, tier 1 ratio and total capital ratio were less favorable than those of
its peers; the CET1 ratio decreased by 0.27 percentage points compared to the previous
year. In the reporting year the peer banks observed an increase. The leverage ratio of the
bank was comparable to that of its peers and showed an insignificant increase over the
previous year, while the total equity / total assets ratio of the bank was more favorable
than that of its peers; however, it decreased by 0.27 percentage points compared to the
previous year, whereas the same figure increased for the peer group. The capital ade-
quacy figures were the weakest compared to all of the other business development as-
pects examined.
A detailed overview of the development of capital ratios for the years 2014 through 2017
can be seen in Figure 6 below:
Figure 6: Development of capital ratios
(Source: S&P Global Market Intelligence)
Due to Santander’s bank capital and debt structure, the Group’s senior unsecured debt
instruments have not been notched down to the long-term issuer rating. However, the
Group’s Tier 2 capital rating is four notches below the long-term issuer rating based on
the bank´s capital structure and seniority in accordance with our rating methodology.
Liabilities (€000) 2014 % 2015 % 2016 % 2017 %
Total Deposits from Banks 155.616.649 13,2% 175.373.057 14,1% 149.397.733 12,1% 190.313.945 14,2%
Total Deposits from Customers 647.705.684 55,0% 683.142.112 55,0% 691.111.676 55,9% 777.730.390 58,1%
Total Debt 213.695.366 18,2% 226.160.175 18,2% 228.869.169 18,5% 217.966.347 16,3%
Derivative Liabilities 86.333.212 7,3% 85.525.466 6,9% 82.972.733 6,7% 66.265.672 5,0%
Securities Sold, not yet Purchased 17.628.350 1,5% 17.362.420 1,4% 23.004.801 1,9% 20.979.014 1,6%
Other Financial Liabilities 19.468.172 1,7% 20.877.782 1,7% 26.516.136 2,1% 28.427.224 2,1%
Total Financial Liabilities 1.140.447.917 97% 1.208.441.012 97% 1.201.872.248 97% 1.301.682.592 97%
Insurance Liabilities 712.508 0,1% 626.936 0,1% 652.217 0,1% 1.117.359 0,1%
Non-Current Liab. HFS & Discontinued Ops 21.474 0,0% 0 0,0% 0 0,0% 0 0,0%
Unit-Linked Insurance and Investment Contr. 0 0,0% 0 0,0% 0 0,0% 0 0,0%
Tax Liabilities 9.378.527 0,8% 7.724.369 0,6% 8.372.503 0,7% 7.591.821 0,6%
Noncurrent Asset Retirement Obligations 9.411.794 0,8% 8.272.368 0,7% 8.287.878 0,7% 8.031.415 0,6%
Other Provisions 5.963.923 0,5% 6.221.378 0,5% 6.170.726 0,5% 6.458.337 0,5%
Total Other Liabilities 10.645.323 0,9% 10.221.207 0,8% 11.069.276 0,9% 12.590.834 0,9%
Total Liabilities 1.176.581.466 92,9% 1.241.507.270 92,6% 1.236.424.848 92,3% 1.337.472.358 92,6%
Total Equity 89.714.199 7,1% 98.754.465 7,4% 102.699.903 7,7% 106.832.437 7,4%
Total Passiva 1.266.295.665 100% 1.340.261.735 100% 1.339.124.751 100% 1.444.304.795 100%
Deposits from Customers Growth* 6,56 NA 5,47 -1,09 1,17 -4,30 12,53 11,37
Change in %-Points
Capital (€000) 2014 % 2015 % 2016 % 2017 %
Total Capital 70.482.639 -1,36 84.349.762 19,67 86.336.900 2,36 90.705.743 5,06
Total Risk-weighted Assets 585.828.893 19,62 585.633.290 -0,03 588.087.593 0,42 605.063.831 2,89
Capital Ratios (%)
Core Tier 1 Ratio 10,97 -0,74 12,55 1,58 12,53 -0,01 12,26 -0,27
Tier 1 Ratio 10,97 -1,64 12,55 1,58 12,53 -0,01 12,77 0,24
Total Capital Ratio 12,03 -2,56 14,40 2,37 14,68 0,28 14,99 0,31
Leverage Ratio 3,70 -1,20 4,73 1,03 4,98 0,25 5,02 0,04
Fully Loaded: Common Equity Tier 1 Ratio 8,27 -3,44 10,05 1,79 10,55 0,50 10,84 0,28
Fully Loaded: Tier 1 Ratio 9,08 -3,52 11,00 1,92 11,53 0,54 12,11 0,58
Fully Loaded: Risk-weighted Capital Ratio 10,37 -4,22 13,05 2,68 13,87 0,82 14,48 0,60
Total Equity/ Total Assets 7,08 -0,05 7,37 0,28 7,67 0,30 7,40 -0,27
Change in %-Points

© Creditreform Rating AG 2018 15 August 2018 8/13
Creditreform Bank Rating
Banco Santander S.A. (Group)
Additional Tier 1 capital is rated five notches below the long-term issuer rating, reflecting
a high bail-in risk in event of resolution.
Liquidity
The LTD ratio of Europe’s largest bank was comparable to that of its peers, with a de-
crease of 5.2 percentage points over the previous year. The decrease for peer banks was
less pronounced. The interbank ratio significantly exceeds that of its peers, showing a
considerable decrease of 10.6 percentage points over the previous year, with peer banks
displaying a steeper decline. The liquidity coverage ratio deteriorated by 13.0 percentage
points but is still well above the regulatory threshold.
A detailed overview of the development of liquidity for the years 2014 through 2017 can
be seen in Figure 7 below:
Figure 7: Development of liquidity
(Source: S&P Global Market Intelligence)
Liquidity (%) 2014 % 2015 % 2016 % 2017 %
Liquidity Coverage Ratio 120,00 NA 146,00 26,00 146,00 0,00 133,00 -13,00
Interbank Ratio 52,24 -16,29 47,06 -5,18 51,33 4,27 40,69 -10,64
Loan to Deposit (LTD) 113,43 3,39 115,77 2,33 114,38 -1,39 109,15 -5,22
Change in %-Points

© Creditreform Rating AG 2018 15 August 2018 9/13
Creditreform Bank Rating
Banco Santander S.A. (Group)
Conclusion
Santander can look back on a year of favorable performance. Despite the low-interest
environment in Europe, Santander was able to noticeably improve its net interest income
in 2017 through its regional diversification of business activities in the different core mar-
kets of Central Europe, the United Kingdom, South America and the United States, as
well as the bank’s strong market position in its respective core markets. In addition, the
bank was able to considerably increase its income from net fees and commissions. The
bank was generally able to post stable profits in a multi-year comparison.
Due to the acquisition and integration of Banco Popular, the NPL-ratio and the total risk-
weighted assets increased, which had a negative impact on the bank’s asset quality;
however, the geographic diversification of Santander’s business model has a positive
impact on the quality of its assets.
The building up of equity should remain a priority in the coming years. The gap between
Santander’s capital ratios and those of the peer group has increased in recent years;
retaining a larger share of profits could close this gap.
Due to its high systemic relevance and worldwide networking, the liquidity situation was
guaranteed all times.
Brexit and the surrounding uncertainties regarding the relationship between the UK and
the European Union may negatively impact Santander’s earning potential. In the near
future, growing regulation and the ECB's low interest rate policy pose a general challenge
for the banking landscape; however, an interest rate reversal is becoming more likely
amid rising inflation, and the ECB has announced the termination of its bond-buying pro-
gram. In particular, a rapid increase in the interest rates would go hand-in-hand with an
interest rate adjustment risk for banks, which have grown accustomed to long-term low-
interest rates. Overall, the Santander Group has the potential to grow organically in the
coming years and to improve its profitability with increased digitalization.
In a scenario analysis, the rating developed slightly better in the best case scenario and
considerably worse in the worst case scenario. The ratings of bank capital and senior
unsecured debt would behave similarly based on our rating system. These ratings are
especially sensitive to changes in total equity and to the bank capital and debt structure in
general.

© Creditreform Rating AG 2018 15 August 2018 10/13
Creditreform Bank Rating
Banco Santander S.A. (Group)
Ratings Detail
Bank ratings
The bank ratings are dependent on a host of quantitative and qualitative factors. An im-
provement in either sub-category may result in a higher rating score.
LT Issuer / Short-Term / Outlook A / L2 / stable
Bank Capital and Debt Instruments Ratings
The ratings for bank capital and debt instruments are inter alia dependent on subordina-
tion and relative size of the instrument class, based on the long-term issuer rating of the
bank.
Tier 1 (AT1): BB+
Tier 2 (T2): BBB-
Senior unsecured debt: A
Ratings Detail and History
Ratings
Bank Capital und Debt Instruments
Instruments Rating Date Publication Date Ratings
Senior Unsecured / T2 / AT1 15.08.2018 16,08,2018 A / BBB- / BB+
Bank Issuer Ratings
Type Rating Date Publication Date Ratings
LT Issuer / Outlook / Short-Term 15.08.2018 16,08,2018 A / stable / L2
Figure 8: Ratings Detail and History

© Creditreform Rating AG 2018 15 August 2018 11/13
Creditreform Bank Rating
Banco Santander S.A. (Group)
Regulatory
Creditreform Rating AG was neither commissioned by the rating object nor by any other
third parties for the rating. The analysis took place on a voluntary basis by Creditreform
Rating AG and is to be described in the regulatory sense as an unsolicited rating.
The rating is based on publicly available information and internal evaluation methods for
the rated bank. The quantitative analysis is based mainly on the latest annual accounts,
interim reports, other investor relations information of the bank, and calculated key figures
by S&P Global Market Intelligence subject to a peer group analysis were 25 competing
institutes.
The information and documents processed satisfied the requirements according to the
rating system of Creditreform Rating AG published on the website www.creditreform-
rating.de. The rating was carried out on the basis of the rating methodology for unsolicit-
ed bank ratings as well as the methodology for the rating of bank capital and unsecured
debt instruments in conjunction with Creditreform`s basic document “Rating Criteria and
Definitions”.
On 15 August 2018, the rating was presented by the analysts to the rating committee and
adopted in a resolution.
The rating result was communicated to Santander Group and the preliminary rating report
was made available to it. There was no change in the rating score.
The rating is subject to one-year monitoring from the creation date (see cover sheet).
Within this period, the rating can be updated. At the latest after one year, a follow-up is
required to maintain the validity of the rating.
In 2011 Creditreform Rating AG was registered within the European Union according to
EU Regulation 1060/2009 (CRA-Regulation). Based on the registration, Creditreform
Rating AG (CRA) is allowed to issue credit ratings within the EU and is bound to comply
with the provisions of the CRA-Regulation.
Conflict of Interests
No conflicts of interest were identified during the rating process that might influence the
analyses and judgements of the rating analysts involved or any other natural person
whose services are placed at the disposal or under the control of Creditreform Rating AG
and who are directly involved in credit rating activities or in approving credit ratings and
rating outlooks.
In case of providing ancillary services to the rated entity, CRA will disclose all ancillary
services in the credit rating report.
Rules on the Presentation of Credit Ratings and Rating Outlooks
The approval of credit ratings and rating outlooks follows our internal policies and proce-
dures. In line with our ‘Rating Committee’ policy, all credit ratings and rating outlooks are
approved by a rating committee based on the principle of unanimity.
To prepare this credit rating, CRA has used following substantially material sources:
1. Transaction structure and participants
2. Transaction documents

© Creditreform Rating AG 2018 15 August 2018 12/13
Creditreform Bank Rating
Banco Santander S.A. (Group)
3. Issuance documents
There are no other attributes and limitations of the credit rating or rating outlook other
than those displayed on the CRA website. Furthermore CRA considers satisfactory the
quality and extent of information available on the rated entity. In regard to the rated entity
Creditreform Rating AG regarded available historical data as sufficient.
Between the time of disclosure of the credit rating to the rated entity and the public dis-
closure, no amendments were made to the credit rating.
The ‘Basic Data’ information card indicates the principal methodology or version of meth-
odology that was used in determining the rating, with a reference to its comprehensive
description.
In cases where the credit rating is based on more than one methodology or where refer-
ence only to the principal methodology might cause investors to overlook other important
aspects of the credit rating, including any significant adjustments and deviations, Credit-
reform Rating AG explains this fact in the rating report and indicates how the different
methodologies or other aspects are taken into account in the credit rating. This infor-
mation is integrated in the credit rating report.
The meaning of each rating category, the definition of default or recovery and any appro-
priate risk warning, including a sensitivity analysis of the relevant key rating assumptions
such as mathematical or correlation assumptions, accompanied by worst-case scenario
credit ratings and best-case scenario credit ratings are explained.
The date at which the credit rating was initially released for distribution and the date when
it was last updated including any rating outlooks is indicated clearly and prominently in
the ‘Basic Data’ card as a “rating action”; initial release is indicated as “initial rating”, other
updates are indicated as an “update”, “upgrade” or “downgrade”, “not rated”, “confirmed”,
“selective default” or “default”.
In the case of a rating outlook, the time horizon is provided during which a change in the
credit rating is expected. This information is available within ‘Basic Data’ information card.
In accordance to Article 11 (2) EU-Regulation (EC) No 1060/2009, a registered or certi-
fied credit rating agency shall make available, in a central repository established by
ESMA, information on its historical performance data including the rating transition fre-
quency and information about credit ratings issued in the past and on their changes. Re-
quested data are available at the ESMA website: https://cerep.esma.europa.eu/cerep-
web/statistics/defaults.xhtml.
An explanatory statement of the meaning of Creditreform`s default rates are available in
the credit rating methodologies disclosed on the website.

© Creditreform Rating AG 2018 15 August 2018 13/13
Creditreform Bank Rating
Banco Santander S.A. (Group)
Disclaimer
Any rating performed by Creditreform Rating AG is subject to the Creditreform Rating AG
Code of Conduct which has been published on the web pages of Creditreform Rating AG.
In this Code of Conduct, Creditreform Rating AG commits itself – systematically and with
due diligence – to establish its independent and objective opinion as to the sustainability,
risks and opportunities concerning the enterprise or the issue under review.
Future events are uncertain, and forecasts are necessarily based on assessments and
assumptions. This rating is therefore no statement of fact, but an opinion. For this reason,
Creditreform Rating AG cannot be held liable for the consequences of decisions made on
the basis of any of their ratings. Neither should these ratings be construed as recommen-
dations for investors, buyers or sellers. They should only be used by market participants
(entrepreneurs, bankers, investors etc.) as one factor among others when arriving at cor-
porate or investment decisions. Ratings are not meant to be used as substitutes for one’s
own research, inquiries and assessments.
We have assumed that the documents and information made available to us by the client
are complete and accurate and that the copies provided to us represent the full and un-
changed contents of the original documents. Creditreform Rating AG assumes no re-
sponsibility for the true and fair representation of the original information.
This report is protected by copyright. Any commercial use is prohibited without prior writ-
ten permission from Creditreform Rating AG. Only the full report may be published in
order to prevent distortion of the report’s overall assessment. Excerpts may only be used
with the express consent of Creditreform Rating AG. Publication of the report without the
consent of Creditreform Rating AG is prohibited. Only ratings published on the Creditre-
form Rating AG web pages remain valid.
Creditreform Rating AG
Contact information
Creditreform Rating AG Hellersbergstraße 11 D-41460 Neuss
Phone +49 (0) 2131 / 109-626 Fax +49 (0) 2131 / 109-627
E-Mail [email protected] www.creditreform-rating.de
CEO: Dr. Michael Munsch Chairman of the Board: Prof. Dr. Helmut Rödl HR Neuss B 10522