santander-chile bank banco santander-chile form 20-f
TRANSCRIPT

UNITED STATESSECURITIES AND EXCHANGE COMMISSION
Washington, D.C. 20549
FORM 20-F(Mark One) o REGISTRATION STATEMENT PURSUANT TO SECTION 12(b) OR (g) OF THE SECURITIES EXCHANGE ACT OF 1934
OR x ANNUAL REPORT PURSUANT TO SECTION 13 OR 15(d) OF THE SECURITIES EXCHANGE ACT OF 1934 for the fiscal year ended
December 31, 2009OR
o TRANSITION REPORT PURSUANT TO SECTION 13 OR 15(d) OF THE SECURITIES EXCHANGE ACT OF 1934
Commission file number: 1-14554
BANCO SANTANDER-CHILE(d/b/a Santander, Banco Santander, Banco Santander Santiago, and Santander Santiago)
(Exact name of Registrant as specified in its charter)
SANTANDER-CHILE BANK
(d/b/a Santander, Banco Santander, Santander Santiago Bank, and Santander Santiago)
(Translation of Registrant’s name into English)
Chile(Jurisdiction of incorporation or organization)
Bandera 140
Santiago, ChileTelephone: 011-562-320-2000
(Address of principal executive offices)
Robert Moreno HeimlichTel: +562-320-8284, Fax: +562-687-3855, E-mail: [email protected]
Bandera 140, 19th Floor, Santiago, Chile(Name, Telephone, E-mail and/or Facsimile number and Address of Company Contact Person)
Securities registered or to be registered pursuant to Section 12(b) of the Act:
Title of each class Name of each exchange on which registered
American Depositary Shares (“ADS”), each representing the right to receive 1,039 Shares ofCommon Stock without par value
New York Stock Exchange
Shares of Common Stock, without par value* New York Stock Exchange
* Santander-Chile’s shares of common stock are not listed for trading, but only in connection with the registration of the American Depositary Shares pursuantto the requirements of the New York Stock Exchange.
Securities registered or to be registered pursuant to Section 12(g) of the Act:
None(Title of Class)
Securities for which there is a reporting obligation pursuant to Section 15(d) of the Act:
7.375% Subordinated Notes due 2012(Title of Class)
The number of outstanding shares of each class of common stock of Banco Santander-Chile at December 31, 2009, was:
188,446,126,794 Shares of Common Stock, without par value Indicate by check mark if the registrant is a well-known seasoned issuer, as defined in Rule 405 of the Securities Act.
x Yes o No If this report is an annual or transition report, indicate by check mark if the registrant is not required to file reports pursuant to Section 13 or 15(d) of theSecurities Exchange Act of 1934.

o Yes x No
Note – Checking the box above will not relieve any registrant required to file reports pursuant to Section 13 or 15(d) of the Securities Exchange Act of 1934from their obligations under those Sections. Indicate by check mark whether the registrant (1) has filed all reports required to be filed by Section 13 or 15(d) of the Securities Exchange Act of 1934 duringthe preceding 12 months (or for such shorter period that the registrant was required to file such reports), and (2) has been subject to such filing requirements forthe past 90 days.
x Yes o No Indicate by check mark whether the registrant is a large accelerated filer, an accelerated filer, or a non-accelerated filer. See definition of “accelerated filer andlarge accelerated filer” in Rule 12b-2 of the Exchange Act. (Check one):
Large accelerated filer x Accelerated filer o Non-Accelerated filer o
Indicate by check mark which basis of accounting the registrant has used to prepare the financial statements included in this filing: oU.S. GAAP
xInternational Financial Reporting Standards as issued by the International Accounting Standards Board
oOther
If “Other” has been checked in response to the previous question, indicate by check mark which financial statement item the registrant has elected to follow. oItem 17 oItem 18
If this is an annual report, indicate by check mark whether the registrant is a shell company (as defined in Rule 12b-2 of the Exchange Act).
o Yes x No

TABLE OF CONTENTSPage
CAUTIONARY STATEMENT CONCERNING FORWARD-LOOKING STATEMENTS 1CERTAIN TERMS AND CONVENTIONS 2PRESENTATION OF FINANCIAL INFORMATION 3PART I 5ITEM 1. IDENTITY OF DIRECTORS, SENIOR MANAGEMENT AND ADVISORS 5ITEM 2. OFFER STATISTICS AND EXPECTED TIMETABLE 5ITEM 3. KEY INFORMATION 5ITEM 4. INFORMATION ON THE COMPANY 22ITEM 4A. UNRESOLVED STAFF COMMENTS 41ITEM 5. OPERATING AND FINANCIAL REVIEW AND PROSPECTS 42ITEM 6. DIRECTORS, SENIOR MANAGEMENT AND EMPLOYEES 106ITEM 7. MAJOR SHAREHOLDERS AND RELATED PARTY TRANSACTIONS 118ITEM 8. FINANCIAL INFORMATION 122ITEM 9. THE OFFER AND LISTING 123ITEM 10. ADDITIONAL INFORMATION 124ITEM 11. QUANTITATIVE AND QUALITATIVE DISCLOSURES ABOUT MARKET RISK 140ITEM 12. DESCRIPTION OF SECURITIES OTHER THAN EQUITY SECURITIES 153PART II 155ITEM 13. DEFAULTS, DIVIDEND ARREARAGES AND DELINQUENCIES 155ITEM 14. MATERIAL MODIFICATIONS TO THE RIGHTS OF SECURITY HOLDERS AND USE OF PROCEEDS 155ITEM 15. CONTROLS AND PROCEDURES 155ITEM 16. [RESERVED] 158ITEM 16A. AUDIT COMMITTEE FINANCIAL EXPERT 158ITEM 16B. CODE OF ETHICS 158ITEM 16C. PRINCIPAL ACCOUNTANT FEES AND SERVICES 158ITEM 16D. EXEMPTIONS FROM THE LISTING STANDARDS FOR AUDIT COMMITTEES 159ITEM 16E. PURCHASES OF EQUITY SECURITIES BY THE ISSUER AND AFFILIATED PURCHASERS 159ITEM 16F. CHANGE IN REGISTRANT’S CERTIFYING ACCOUNTANT 159ITEM 16G. CORPORATE GOVERNANCE 159PART III 161ITEM 17. FINANCIAL STATEMENTS 161ITEM 18. FINANCIAL STATEMENTS 161ITEM 19. EXHIBITS 161
i

Table of Contents
CAUTIONARY STATEMENT CONCERNINGFORWARD-LOOKING STATEMENTS
We have made statements in this Annual Report on Form 20-F that constitute forward-looking statements within the meaning of the Private Securities
Litigation Reform Act of 1995. These statements appear throughout this report and include statements regarding our intent, belief or current expectationsregarding: · asset growth and alternative sources of funding · growth of our fee-based business · financing plans · impact of competition · impact of regulation · exposure to market risks: · interest rate risk · foreign exchange risk · equity price risk · projected capital expenditures · liquidity · trends affecting: · our financial condition · our results of operation
The sections of this Annual Report which contain forward-looking statements include, without limitation, “Item 3: Key Information—Risk Factors,” “Item4: Information on the Company—Strategy,” “Item 5: Operating and Financial Review and Prospects,” “Item 8: Financial Information—Legal Proceedings,” and“Item 11: Quantitative and Qualitative Disclosures About Market Risk.” Our forward-looking statements also may be identified by words such as “believes,”“expects,” “anticipates,” “projects,” “intends,” “should,” “could,” “may,” “seeks,” “aim,” “combined,” “estimates,” “probability,” “r isk,” “VaR,” “target,”“goal,” “objective,” “future” or similar expressions.
You should understand that the following important factors, in addition to those discussed elsewhere in this Annual Report and in the documents which areincorporated by reference, could affect our future results and could cause those results or other outcomes to differ materially from those expressed in ourforward-looking statements: · changes in capital markets in general that may affect policies or attitudes towards lending to Chile or Chilean companies · changes in economic conditions · the monetary and interest rate policies of the Banco Central de Chile (the “Central Bank”) · inflation · deflation · unemployment

Table of Contents
· unanticipated turbulence in interest rates · movements in foreign exchange rates · movements in equity prices or other rates or prices · changes in Chilean and foreign laws and regulations · changes in taxes
· competition, changes in competition and pricing environments · our inability to hedge certain risks economically · the adequacy of loss allowances · technological changes · changes in consumer spending and saving habits · increased costs · unanticipated increases in financing and other costs or the inability to obtain additional debt or equity financing on attractive terms · changes in, or failure to comply with, banking regulations · our ability to successfully market and sell additional services to our existing customers · disruptions in client service · natural disasters · implementation of new technologies · an inaccurate or ineffective client segmentation model
You should not place undue reliance on such statements, which speak only as of the date that they were made. The forward-looking statements contained inthis document speak only as of the date of this Annual Report, and we do not undertake to update any forward-looking statement to reflect events orcircumstances after the date hereof or to reflect the occurrence of unanticipated events.
CERTAIN TERMS AND CONVENTIONS
As used in this Annual Report, “Santander-Chile”, “the Bank”, “we,” “our” and “us” refer to Banco Santander-Chile and its consolidated subsidiaries.
When we refer to “Banco Santander Spain” or “Santander Spain”, we refer to our parent company, Banco Santander, S.A.
As used in this Annual Report, the term “billion” means one thousand million (1,000,000,000).
In this Annual Report, references to “$”, “US$”, “U.S. dollars” and “dollars” are to United States dollars, references to “Chilean pesos,” “pesos” or “Ch$”are to Chilean pesos and references to “UF” are to Unidades de Fomento. The UF is an inflation-indexed Chilean monetary unit with a value in Chilean pesosthat changes daily to reflect changes in the official Consumer Price Index (“CPI”) of the Instituto Nacional de Estadísticas (the Chilean National Institute ofStatistics) for the previous month. The Bank does not perform inflation accounting, but some loan and deposits products are contract ed in “UF” and areaccounted for in a similar fashion as a variable rate financial instrument. See “Item 5: Operating and Financial Review and Prospects”.
2

Table of Contents
In this Annual Report, references to the Audit Committee are to the Bank’s Comité de Directores y Auditoría.
In this Annual Report, references to “BIS” are to the Bank for International Settlement, and references to “BIS ratio” are to the capital adequacy ratio as
calculated in accordance with the Basel Capital Accord.
PRESENTATION OF FINANCIAL INFORMATION
Santander-Chile is a Chilean bank and maintains its financial books and records in Chilean pesos and prepares its consolidated financial statements inaccordance with International Financial Reporting Standards (“IFRS”) issued by the International Accounting Standards Board (“IASB”), in order to complywith requirements of the Securities and Exchange Commission (the “SEC”).
As required by local regulations, our locally filed consolidated financial statements have been prepared in accordance with accounting principles issued bythe Superintendency of Banks and Financial Institutions (the “SBIF”). The accounting principles issued by the SBIF are substantially similar to IFRS but thereare some exceptions. Therefore, our locally filed consolidated financial statements have been adjusted according to IFRS 1: First Time Adoption of InternationalFinancial Reporting Standards (see Note 2 to our audited consolidated financial statements attached to this Annual Report).
The notes to the audited consolidated financial statements contain information in addition to that presented in the Consolidated Statement of FinancialPosition, Consolidated Statement of Income, Consolidated Statement of Comprehensive Income, Consolidated Statement of Changes in Equity and ConsolidatedStatement of Cash Flows. The notes provide narrative descriptions or details of these financial statements.
The audited consolidated financial statements included in this Annual Report have been prepared from accounting records maintained by the Bank and itssubsidiaries.
The Consolidated Statement of Financial Position as of December 31, 2008, and January 1, 2008, as well as the Consolidated Statement of Income,Consolidated Statement of Comprehensive Income, Consolidated Statement of Changes in Equity and Consolidated Statement of Cash Flows for the year endedDecember 31, 2008, included for comparative purposes, were also prepared in accordance with IFRS, on a basis consistent with the financial statements for theperiod ending December 31, 2009.
The transition of the consolidated financial statements of the Bank to IFRS has been carried out through the application of IFRS 1: First time adoption ofInternational Financial Reporting Standards, applying the exemptions provided by this standard.
We have formatted our financial information according to the classification format for banks used in Chile. We have not reclassified the line items to complywith Article 9 of Regulation S-X. Article 9 is a regulation of the U.S. Securities and Exchange Commission that contains formatting requirements for bankholding company financial statements.
Our auditors, Deloitte Auditores y Consultores Limitada, an independent registered public accounting firm, have audited our consolidated financialstatements in respect of the years ended December 31, 2009 and 2008 included in this Annual Report in accordance with IFRS. See page F-1 to our consolidatedfinancial statements for the 2009 and 2008 report prepared by Deloitte Auditores y Consultores Limitada. Functional and Presentation currency
According to International Accounting Standard No 21, the Chilean peso, which is the currency of the primary economic area in which the Bank operatesand the currency which influences its structure of costs and revenues, has been defined as the functional and presentation currency. Accordingly, all the balancesand transactions denominated in currencies other than the Chilean peso are treated as “foreign currency.”
For presentation purposes we have translated millions of Chilean pesos (MCh$) into thousands of US dollars (ThUS$) using the rate as indicated below, forthe Consolidated Statement of Financial Position, Consolidated Statement of Income, Consolidated Statement of Comprehensive Income, ConsolidatedStatement of Changes in Equity and Consolidated Statement of Cash Flow for the period ended as of December 31, 2009.
3

Table of Contents
Loans
Unless otherwise specified, all references herein (except in the Audited Consolidated Financial Statements) to loans are to loans and financial leases beforededuction for loan loss allowance, and, except as otherwise specified, all market share data presented herein are based on information published periodically bythe Superintendency of Banks. Non-performing loans include loans for which either principal or interest is overdue, and which do not accrue interest.Restructured loans for which no payments are overdue are not ordinarily classified as non-performing loans. Past due loans include, with respect to any loan,only the portion of principal and interest that is overdue for 90 or more days, and do not include the installments of such loan that are not overdue or that areoverdue for less than 90 days, unless leg al proceedings have been commenced for the entire outstanding balance according to the terms of the loan, in whichcase the entire loan is considered past due within 90 days after initiation of such proceedings. See “Item 5: F. Selected Statistical Information—Classification ofLoan Portfolio Based on the Borrower’s Payment Performance.”
According to the regulations established by IFRS, a loan is evaluated on each financial statement filing date to determine whether objective evidence ofimpairment exists. A loans will be impaired if, and only if, objective evidence of impairment exists as a result of one or more events that occurred after theinitial recognition of the loan, and such event or events have an impact on the estimated future cash flows of such loan that can be reliably estimated. It may notbe possible to identify a single event that was the individual cause of the impairment.
An impairment loss relating to a loan is calculated as the difference between the recorded amount of the asset and the present value of estimated future cashflows, discounted at the effective interest rate.
Individually significant loans are individually tested to determine if impairment exists. The remaining financial assets are evaluated collectively in groupswith similar credit risk characteristics.
The reversal of an impairment loss occurs only if it can be objectively related to an event occurring after the initial impairment loss was recorded. In the caseof loans recorded at amortized cost, the reversal is recorded in income. See “Item 5: F. Selected Statistical Information—Analysis of Loan Loss Allowance.”
Outstanding loans and the related percentages of Santander-Chile’s loan portfolio consisting of corporate and consumer loans in the section entitled “Item 4:C. Business Overview” are categorized based on the nature of the borrower. Outstanding loans and related percentages of the loan portfolio of Santander-Chileconsisting of corporate and consumer loans in the section entitled “Item 5: F. Selected Statistical Information” are categorized in accordance with the reportingrequirements of the Superintendency of Banks, which are based on the type and term of loans. This disclosure is consistent with IFRS. Effect of Rounding
Certain figures included in this Annual Report and in the Audited Consolidated Financial Statements have been rounded for ease of presentation. Percentagefigures included in this Annual Report have not in all cases been calculated on the basis of such rounded figures but on the basis of such amounts prior torounding. For this reason, certain percentage amounts in this Annual Report may vary from those obtained by performing the same calculations using the figuresin the Audited Consolidated Financial Statements. Certain other amounts that appear in this Annual Report may not sum due to rounding. Economic and Market Data
In this Annual Report, unless otherwise indicated, all macroeconomic data related to the Chilean economy is based on information published by the CentralBank, and all market share and other data related to the Chilean financial system is based on information published by the Superintendency of Banks and ouranalysis of such information. Information regarding the consolidated risk index of the Chilean financial system as a whole is not available. Exchange Rates
This Annual Report contains translations of certain Chilean peso amounts into U.S. dollars at specified rates solely for the convenience of the reader. Thesetranslations should not be construed as representations that the Chilean peso amounts actually represent such U.S. dollar amounts, were converted from U.S.dollars at the rate
4
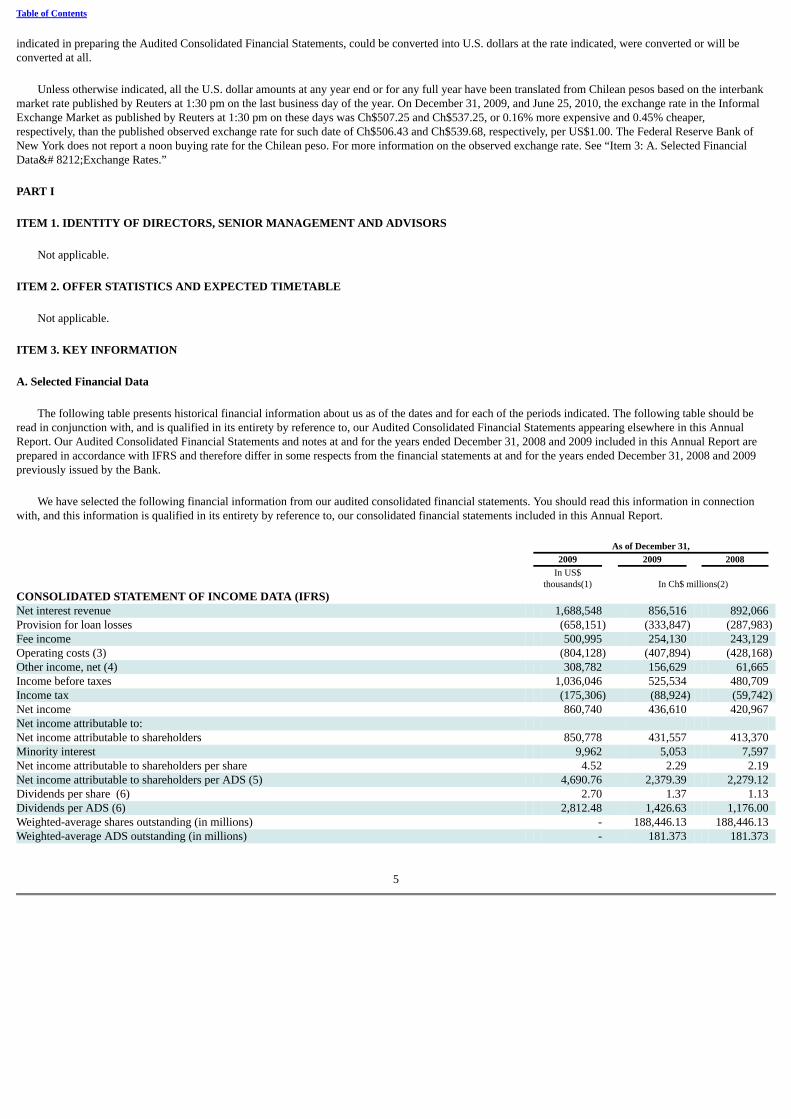
Table of Contents
indicated in preparing the Audited Consolidated Financial Statements, could be converted into U.S. dollars at the rate indicated, were converted or will beconverted at all.
Unless otherwise indicated, all the U.S. dollar amounts at any year end or for any full year have been translated from Chilean pesos based on the interbankmarket rate published by Reuters at 1:30 pm on the last business day of the year. On December 31, 2009, and June 25, 2010, the exchange rate in the InformalExchange Market as published by Reuters at 1:30 pm on these days was Ch$507.25 and Ch$537.25, or 0.16% more expensive and 0.45% cheaper,respectively, than the published observed exchange rate for such date of Ch$506.43 and Ch$539.68, respectively, per US$1.00. The Federal Reserve Bank ofNew York does not report a noon buying rate for the Chilean peso. For more information on the observed exchange rate. See “Item 3: A. Selected FinancialData&# 8212;Exchange Rates.” PART I ITEM 1. IDENTITY OF DIRECTORS, SENIOR MANAGEMENT AND ADVISORS
Not applicable. ITEM 2. OFFER STATISTICS AND EXPECTED TIMETABLE
Not applicable. ITEM 3. KEY INFORMATION A. Selected Financial Data
The following table presents historical financial information about us as of the dates and for each of the periods indicated. The following table should beread in conjunction with, and is qualified in its entirety by reference to, our Audited Consolidated Financial Statements appearing elsewhere in this AnnualReport. Our Audited Consolidated Financial Statements and notes at and for the years ended December 31, 2008 and 2009 included in this Annual Report areprepared in accordance with IFRS and therefore differ in some respects from the financial statements at and for the years ended December 31, 2008 and 2009previously issued by the Bank.
We have selected the following financial information from our audited consolidated financial statements. You should read this information in connectionwith, and this information is qualified in its entirety by reference to, our consolidated financial statements included in this Annual Report. As of December 31, 2009 2009 2008
In US$
thousands(1) In Ch$ millions(2) CONSOLIDATED STATEMENT OF INCOME DATA (IFRS) Net interest revenue 1,688,548 856,516 892,066 Provision for loan losses (658,151) (333,847) (287,983)Fee income 500,995 254,130 243,129 Operating costs (3) (804,128) (407,894) (428,168)Other income, net (4) 308,782 156,629 61,665 Income before taxes 1,036,046 525,534 480,709 Income tax (175,306) (88,924) (59,742)Net income 860,740 436,610 420,967 Net income attributable to: Net income attributable to shareholders 850,778 431,557 413,370 Minority interest 9,962 5,053 7,597 Net income attributable to shareholders per share 4.52 2.29 2.19 Net income attributable to shareholders per ADS (5) 4,690.76 2,379.39 2,279.12 Dividends per share (6) 2.70 1.37 1.13 Dividends per ADS (6) 2,812.48 1,426.63 1,176.00 Weighted-average shares outstanding (in millions) - 188,446.13 188,446.13 Weighted-average ADS outstanding (in millions) - 181.373 181.373
5

Table of Contents
As of December 31, 2009 2009 2008
In US$
thousands(1) In Ch$ millions(2) CONSOLIDATED STATEMENT OF FINANCIAL POSITION DATA (IFRS) Cash and deposits in banks 4,028,503 2,043,458 855,411 Financial investments (7) 5,209,756 2,642,649 2,746,666 Loans 27,109,465 13,751,276 14,681,088 Loan loss allowance (689,063) (349,527) (274,240)Financial derivative contracts (assets) (8) 2,747,911 1,393,878 1,846,509 Other assets (9) 2,545,374 1,291,141 1,229,073 Total assets 40,951,946 20,772,875 21,084,507 Deposits 21,111,466 10,708,791 12,704,428 Other interest bearing liabilities 12,287,790 6,232,982 4,769,980 Financial derivative contracts (liabilities) (8) 2,659,253 1,348,906 1,469,724 Total shareholder’s equity (10) 3,331,500 1,689,903 1,517,649 Attributable to shareholders (11) 3,272,754 1,660,104 1,491,770 As of December 31, 2009 2008 CONSOLIDATED RATIOS(IFRS)
Profitability and performance: Net interest margin (12) 5.3% 5.7%Return on average total assets (13) 2.2% 2.3%Return on average equity (14) 27.3 32.4%
Capital: Average equity as a percentage of average total assets (15) 8.0% 7.0%Total liabilities as a multiple of equity (16) 11.3 12.9
Credit Quality: Non-performing loans as a percentage of total loans (17) 2.97% 2.61%Allowance for loan losses as percentage of total loans 2.54% 1.87%
Operating Ratios: Operating expenses /operating revenue (18) 34.0% 37.6%Operating expenses /average total assets 2.2% 2.5%
OTHER DATA
Inflation Rate (19) -1.4% 7.1%Revaluation (devaluation) rate (Ch$/US$) at period end (19) -19.5% 26.9%Number of employees at period end 11,118 11,592 Number of branches and offices at period end 498 505
(1) Amounts stated in U.S. dollars at and for the year ended December 31, 2009, have been translated from Chilean pesos at the interbank market exchange rateof Ch$507.25 = US$1.00 as of December 31, 2009. See “Item 3: A. Selected Financial Data—Exchange Rates” for more information on the observedexchange rate.
(2) Except per share data, percentages and ratios, share numbers, employee numbers and branch numbers. (3) Operating costs is equal to the sum of personnel expenses, administrative expenses, depreciation and amortization and impairment. See “Note 1—
Impairment” to our Audited Consolidated Financial Statements. (4) Other income, net is the sum of other operating income, other operating expenses, net gains (losses) from mark-to-market and trading and foreign exchange
transactions, and income from investments in other companies. (5) 1 ADS = 1,039 shares of common stock. (6) The dividends per share of common stock and per ADS are determined based on the previous year’s net income. The dividend per ADS is calculated on the
basis of 1,039 shares per ADS. (7) Includes financial investments held for trading, repos, financial investments available for sale and financial investments held to maturity. (8) For figures at December 31, 2008, derivatives are valued at market price and classified as a separate line item on the balance sheet. See “Note 1” of our
Audited Consolidated Financial Statements. (9) Includes unsettled transactions, investments in other companies, intangible assets, property, plant and equipment, current taxes, deferred taxes and other
assets.
6

Table of Contents
(10) Equity includes shareholders’ equity plus non-minority interest. According to IFRS, equity must include minority interest and a minimum provision for
mandatory dividends. This provision is made pursuant to Article 79 of the Corporations Act, in accordance with the Bank’s internal policy, and pursuant towhich at least 30% of net income for the period is distributed, except in the case of a contrary resolution adopted at the respective shareholders’ meeting bythe unanimous vote of the outstanding shares.
(11) Shareholders’ equity is calculated according to IFRS. The main difference between this and equity is that the provision for mandatory dividends equal to
30% of net income and minority interest are not included. (12) Net interest revenue divided by average interest earning assets (as presented in “Item 5: F. Selected Statistical Information”). (13) Net income divided by average total assets (as presented in “Item 5: F. Selected Statistical Information”). (14) Net income divided by average equity (as presented in “Item 5: F. Selected Statistical Information”). (15) This ratio is calculated using total equity including minority interest. (16) Total liabilities divided by equity. (17) Non-performing loans include the aggregate unpaid principal and accrued but unpaid interest on all loans with at least one installment over 90 days
overdue. December 31, 2008 non-performing loans amount is as reported on January 1, 2009. (18) The efficiency ratio is equal to operating expenses over operating revenue. Operating expenses includes personnel expenses, administrative expenses,
depreciation and amortizations, deterioration (See “Note 1—Impairment” to our Audited Consolidated Financial Statements) and other operating expenses.Operating revenue includes net interest revenue, fee income, net gain (loss) from mark-to-market and trading, foreign exchange transactions and otheroperating income.
(19) Based on information published by the Central Bank.
Exchange Rates
Chile has two currency markets, the Mercado Cambiario Formal, or the Formal Exchange Market and the Mercado Cambiario Informal, or the InformalExchange Market. According to Law 18,840, the organic law of the Central Bank, and the Central Bank Act (Ley Orgánica Constitucional del Banco Central deChile), the Central Bank determines which purchases and sales of foreign currencies must be carried out in the Formal Exchange Market. Pursuant to CentralBank regulations which are currently in effect, all payments, remittances or transfers of foreign currency abroad which are required to be effected through theFormal Exchange Market may be effected wi th foreign currency procured outside the Formal Exchange Market. The Formal Exchange Market is comprised ofthe banks and other entities so authorized by the Central Bank. The conversion from pesos to U.S. dollars of all payments and distributions with respect to theADSs described in this Annual Report must be transacted at the spot market rate in the Formal Exchange Market. Current regulations require that the CentralBank be informed of certain transactions and that they be effected through the Formal Exchange Market.
Purchases and sales of foreign currencies performed may be legally carried out in the Informal Exchange Market. The Informal Exchange Market reflectstransactions carried out at informal exchange rates by entities not expressly authorized to operate in the Formal Exchange Market. There are no limits imposedon the extent to which the rate of exchange in the Informal Exchange Market can fluctuate above or below the observed exchange rate. On December 31, 2009,and June 25, 2010, the exchange rate in the Informal Exchange Market as published by Reuters at 1:30 pm on these days was Ch$507.25 and Ch$537.25, or0.16% more expensive and 0.45% cheaper, respectively, than the published observed exchange rate for such date of Ch$506.43 and Ch$539.68, respectively, perUS$1.00.
The following table sets forth the annual low, high, average and period end observed exchange rate for U.S. dollars for each of the following periods, asreported by the Central Bank. We make no representation that the Chilean peso or the U.S. dollar amounts referred to herein actually represent, could have beenor could be converted into U.S. dollars or Chilean pesos, as the case may be, at the rates indicated, at any particular rate or at all. Daily Observed Exchange Rate Ch$ Per US$(1)
Low(2) High(2) Average(3) PeriodEnd(4)
Year 2004 559.21 649.45 609.55 559.83 2005 509.70 592.75 559.86 514.21 2006 511.44 549.63 530.26 534.43 2007 493.14 548.67 522.69 495.82 2008 431.22 676.75 521.79 629.11 2009 491.09 643.87 559.67 506.43
7

Table of Contents
Daily Observed Exchange Rate Ch$ Per US$(1)
Low(2) High(2) Average(3) PeriodEnd(4)
Month November 2009 491.09 531.83 507.78 495.84 December 2009 494.82 508.75 501.45 506.43 January 2010 489.47 531.75 500.66 531.75 February 2010 525.48 546.18 532.56 529.69 March 2010 508.66 533.87 523.16 526.29 April 2010 514.91 527.38 520.62 520.99 May 2010 517.23 549.17 533.21 529.23 June 2010 (up to June 25, 2010) 530.32 548.16 536.27 539.68
Source: Central Bank. (1) Nominal figures. (2) Exchange rates are the actual low and high, on a day-by-day basis for each period. (3) The average of monthly average rates during the year. (4) As reported by the Central Bank the first business day of the following period.
Dividends
Under the current General Banking Law, a Chilean bank may only pay a single dividend per year (i.e., interim dividends are not permitted). Santander-Chile’s annual dividend is proposed by its Board of Directors and is approved by the shareholders at the annual ordinary shareholders’ meeting held the yearfollowing that in which the dividend is generated. For example, the 2009 dividend must be proposed and approved during the first four months of 2010.Following shareholder approval, the proposed dividend is declared and paid. Historically, the dividend for a particular year has been declared and paid no laterthan one month following the shareholders’ meeting. Dividends are paid to shareholders of record on the fifth day preceding the date set f or payment of thedividend. The applicable record dated for the payment of dividends to holders of ADSs will, to the extent practicable, be the same.
Under the General Banking Law, a bank must distribute cash dividends in respect of any fiscal year in an amount equal to at least 30% of its net income forthat year, as long as the dividend does not result in the infringement of minimum capital requirements. The balances of our distributable net income are generallyretained for use in our business (including for the maintenance of any required legal reserves). Although our Board of Directors currently intends to pay regularannual dividends, the amount of dividend payments will depend upon, among other factors, our then current level of earnings, capital and legal reserverequirements, as well as market conditions, and there can be no assurance as to the amount or timing of future dividends.
Dividends payable to holders of ADSs are net of foreign currency conversion expenses of JPMorgan Chase Bank, N.A., as depositary (the “Depositary”) andwill be subject to the Chilean withholding tax currently at the rate of 35% (subject to credits in certain cases as described in “Item 10: E. Taxation—Material TaxConsequences of Owning Shares of Our Common Stock or ADSs”).
Under the Foreign Investment Contract (as defined herein), the Depositary, on behalf of ADS holders, is granted access to the Formal Exchange Market toconvert cash dividends from Chilean pesos to U.S. dollars and to pay such U.S. dollars to ADS holders outside Chile, net of taxes, and no separate registration byADS holders is required. In the past, Chilean law required that holders of shares of Chilean companies who were not residents of Chile to register as foreigninvestors under one of the foreign investment regimes contemplated by Chilean law in order to have dividends, sale proceeds or other amounts with respect totheir shares remitted outside Chile through the Formal Exchange Market. On April 19, 2001, the Central Bank deregulated the Exchange Market and eliminatedthe need to obtain approval from the Central Bank in order to remit dividends, but at the same time this eliminated the possibility of accessing the FormalExchange Market. These changes do not affect the current Foreign Investment Contract, which was signed prior to April 19, 2001, which grants access to theFormal Exchange Market with prior approval of the Central Bank. See “Item 10: D. Exchange Controls.”
8

Table of Contents
The following table presents dividends declared and paid by us in nominal terms in the past two years:
Year
DividendCh$ mn (1)
Per shareCh$/share (2)
Per ADRCh$/ADR (3)
% overearnings (4)
% overearnings (5)
2009 213,295 1.13 1,176.00 65 52 2010 258,751 1.37 1,426.63 60 60
(1) Million of nominal pesos.
(2) Calculated on the basis of 188,446 million shares.
(3) Calculated on the basis of 1,039 shares per ADS.
(4) Calculated by dividing dividend paid in the year by net income attributable to shareholders for the previous year as required by local regulations.
(5) Calculated by dividing dividend paid in the year by net income attributable to shareholders for the previous year under IFRS.
B. Capitalization and Indebtedness
Not applicable. C. Reasons for the Offer and Use of Proceeds
Not applicable. D. Risk Factors
You should carefully consider the following risk factors, which should be read in conjunction with all the other information presented in this Annual Report.The risks and uncertainties described below are not the only ones that we face. Additional risks and uncertainties that we do not know about or that we currentlythink are immaterial may also impair our business operations. Any of the following risks, if they actually occur, could materially and adversely affect ourbusiness, results of operations, prospects and financial condition.
We are subject to market risks that are presented both in this subsection and in “Item 5: Operating and Financial Review and Prospects” and “Item 11:Quantitative and Qualitative Disclosures about Market Risk.” Risks Associated with Our Business
We are vulnerable to the current disruptions and volatility in the global financial markets.
In the past two years, the global financial system has experienced difficult credit and liquidity conditions and disruptions leading to less liquidity, greatervolatility, general widening of spreads and, in some cases, lack of price transparency on interbank lending rates. Global economic conditions deterioratedsignificantly in the second half of 2008, and many countries, including the United States, fell into recession. Many major financial institutions, including some ofthe world’s largest global commercial banks, investment banks, mortgage lenders, mortgage guarantors and insurance companies, have been experiencingsignificant difficulties. Around the world, there have also been runs on deposits at several financial institutions, numerous institutions have sought additionalcapital and many lenders and inst itutional investors have reduced or ceased providing funding to borrowers (including to other financial institutions).
Continued or worsening disruption and volatility in the global financial markets could have a material adverse effect on our ability to access capital andliquidity on financial terms acceptable to us, if at all. If capital markets financing ceases to become available, or becomes excessively expensive, we may beforced to raise the rates we pay on deposits to attract more customers. Any such increase in capital markets funding costs or deposit rates could have a materialadverse effect on our interest margins.
In Chile, the continued economic recession has also caused a rise in unemployment, a fall in consumer spending, a fall in real estate prices and a generaldecline in economic activity. All of these may lead to a decrease in demand for individual and corporate borrowing, a decrease in demand for financial servicesand a decrease in credit card spending, which may in turn materially adversely affect our financial condition and results of operation.
9

Table of Contents
Increased competition and industry consolidation may adversely affect our results of operations.
The Chilean market for financial services is highly competitive. We compete with other private sector Chilean and non-Chilean banks, with Banco del
Estado, the principal public sector bank, with department stores and larger supermarket chains that make consumer loans and sell other financial products to alarge portion of the Chilean population. The lower middle- to middle-income segments of the Chilean population and the small- and mid-sized corporatesegments have become the target markets of several banks and competition in these segments is likely to increase. As a result, net interest margins in thesesegments are likely to decline. Although we believe that demand for financial products and services from individuals and for small- and mid-sized companieswill continue to grow during the remainder of the decade, we cannot assure you that net interest margins will be maintained at their current levels.
We also face competition from non-bank and non-finance competitors (principally department stores and larger supermarket chains) with respect to some ofour credit products, such as credit cards, consumer loans and insurance brokerage. In addition, we face competition from non-bank finance competitors, such asleasing, factoring and automobile finance companies, with respect to credit products, and from mutual funds, pension funds and insurance companies withrespect to savings products.
The increase in competition within the Chilean banking industry in recent years has led to consolidation in the industry. We expect the trends of increasedcompetition and consolidation to continue and result in the formation of large new financial groups. Consolidation in the industry, which can result in thecreation of larger and stronger competitors, may adversely affect our financial condition and results of operations by decreasing the net interest margins we areable to generate. In addition, since November 7, 2001, insurance companies have been allowed to participate and compete with banks in the residential mortgageand credit card businesses.
Our allowances for impairment losses may not be adequate to cover future actual losses to our loan portfolio.
At December 31, 2009, our allowance for impairment losses on loans and other assets was Ch$349,527 million, and the ratio of our allowance forimpairment losses to total loans was 2.5%. The amount of allowances is based on our current assessment of and expectations concerning various factors affectingthe quality of our loan portfolio. These factors include, among other things, our borrowers’ financial condition, repayment abilities and repayment intentions, therealizable value of any collateral, the prospects for support from any guarantor, Chile’s economy, government macroeconomic policies, interest rates and thelegal and regulatory environment. As the recent global financial crisis has demonstrated, many of these factors are beyond our control. In addition, as thesefactors evolve, the models we use to determine the appropriate level of allowance for impairment losses on loans and other assets require recalibration, whichcan lead to increased provision expense. See “Management’s Discussion and Analysis of Financial Condition and Results of Operations—Results of Operationsfor Years Ended December 31, 2008 and 2009—Provision for loan losses”. We believe our allowance is adequate as of the date hereof for all known losses. Ifour assessment of and expectations concerning the above mentioned factors differ from actual developments, or if the quality of our loan portfolio deteriorates orthe future actual losses exceed our estimates, our allowance for impairment losses may not be adequate to cover actual losses and we may need to makeadditional provisions for impairment losses, which may materially and adversely affect our results of operations and financial condition.
Our exposure to individuals and small businesses could lead to higher levels of past due loans, allowances for loan losses and charge-offs.
A substantial number of our customers consist of individuals (approximately 53.0% of the value of the total loan portfolio at December 31, 2009, ifinterbank loans are included) and, to a lesser extent, small- and mid-sized companies (those with annual sales of less than US$2.4 million), which comprisedapproximately 18.1% of the value of the total loan portfolio at December 31, 2009. As part of our business strategy, we seek to increase lending and otherservices to small companies and individuals. Small companies and lower- to middle-income individuals are, however, more likely to be adversely affected bydownturns in the Chilean economy than large corporations and individuals with high incomes. In addition, at December 31, 2009, our residential mortgage loanbook totaled Ch$4,159,053 million, representing 30.2% of o ur total loans. (See “Note 9: Interbank Loans” and “Note 10: Loans and Accounts Receivables fromCustomers” in our Audited Consolidated Financial Statements for a description and presentation of residential mortgages in the balance sheet). If the economyand real estate market in Chile experience a significant downturn, as it may due to the global financial and economic crisis, this could materially adversely affectthe liquidity, businesses and financial conditions of our customers, which may in turn cause us to
10
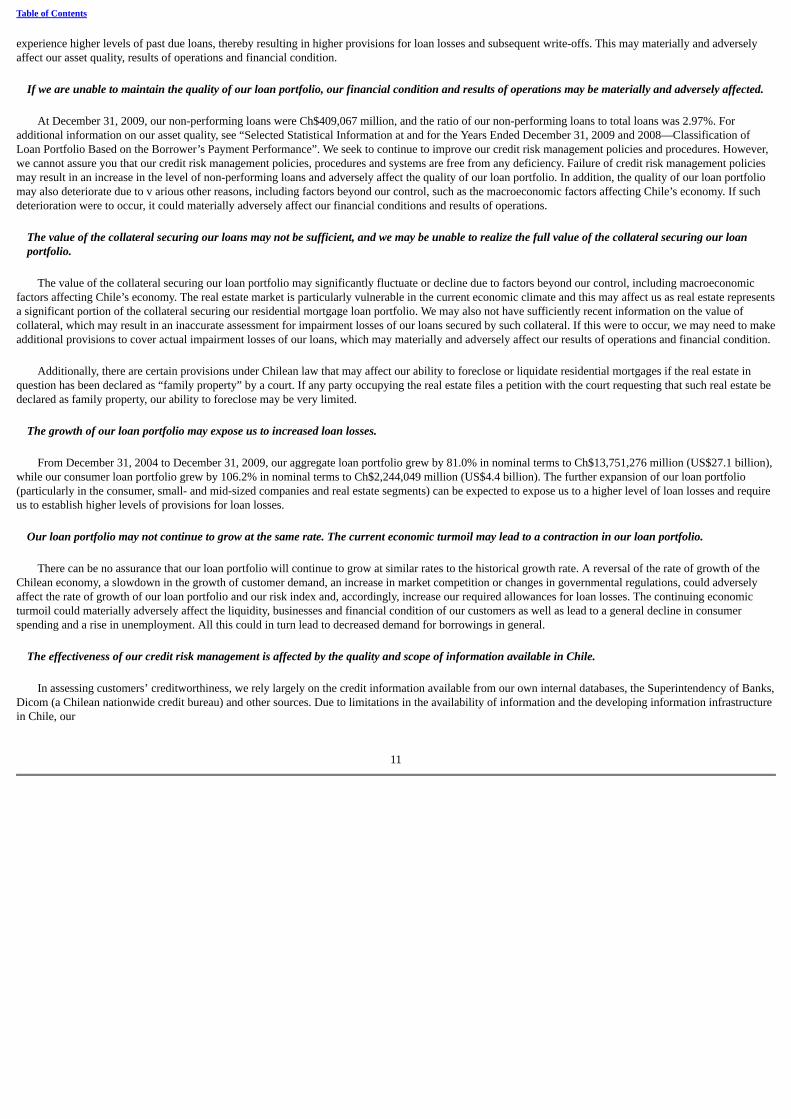
Table of Contents
experience higher levels of past due loans, thereby resulting in higher provisions for loan losses and subsequent write-offs. This may materially and adverselyaffect our asset quality, results of operations and financial condition.
If we are unable to maintain the quality of our loan portfolio, our financial condition and results of operations may be materially and adversely affected.
At December 31, 2009, our non-performing loans were Ch$409,067 million, and the ratio of our non-performing loans to total loans was 2.97%. Foradditional information on our asset quality, see “Selected Statistical Information at and for the Years Ended December 31, 2009 and 2008—Classification ofLoan Portfolio Based on the Borrower’s Payment Performance”. We seek to continue to improve our credit risk management policies and procedures. However,we cannot assure you that our credit risk management policies, procedures and systems are free from any deficiency. Failure of credit risk management policiesmay result in an increase in the level of non-performing loans and adversely affect the quality of our loan portfolio. In addition, the quality of our loan portfoliomay also deteriorate due to v arious other reasons, including factors beyond our control, such as the macroeconomic factors affecting Chile’s economy. If suchdeterioration were to occur, it could materially adversely affect our financial conditions and results of operations.
The value of the collateral securing our loans may not be sufficient, and we may be unable to realize the full value of the collateral securing our loanportfolio.
The value of the collateral securing our loan portfolio may significantly fluctuate or decline due to factors beyond our control, including macroeconomic
factors affecting Chile’s economy. The real estate market is particularly vulnerable in the current economic climate and this may affect us as real estate representsa significant portion of the collateral securing our residential mortgage loan portfolio. We may also not have sufficiently recent information on the value ofcollateral, which may result in an inaccurate assessment for impairment losses of our loans secured by such collateral. If this were to occur, we may need to makeadditional provisions to cover actual impairment losses of our loans, which may materially and adversely affect our results of operations and financial condition.
Additionally, there are certain provisions under Chilean law that may affect our ability to foreclose or liquidate residential mortgages if the real estate inquestion has been declared as “family property” by a court. If any party occupying the real estate files a petition with the court requesting that such real estate bedeclared as family property, our ability to foreclose may be very limited.
The growth of our loan portfolio may expose us to increased loan losses.
From December 31, 2004 to December 31, 2009, our aggregate loan portfolio grew by 81.0% in nominal terms to Ch$13,751,276 million (US$27.1 billion),while our consumer loan portfolio grew by 106.2% in nominal terms to Ch$2,244,049 million (US$4.4 billion). The further expansion of our loan portfolio(particularly in the consumer, small- and mid-sized companies and real estate segments) can be expected to expose us to a higher level of loan losses and requireus to establish higher levels of provisions for loan losses.
Our loan portfolio may not continue to grow at the same rate. The current economic turmoil may lead to a contraction in our loan portfolio.
There can be no assurance that our loan portfolio will continue to grow at similar rates to the historical growth rate. A reversal of the rate of growth of theChilean economy, a slowdown in the growth of customer demand, an increase in market competition or changes in governmental regulations, could adverselyaffect the rate of growth of our loan portfolio and our risk index and, accordingly, increase our required allowances for loan losses. The continuing economicturmoil could materially adversely affect the liquidity, businesses and financial condition of our customers as well as lead to a general decline in consumerspending and a rise in unemployment. All this could in turn lead to decreased demand for borrowings in general.
The effectiveness of our credit risk management is affected by the quality and scope of information available in Chile.
In assessing customers’ creditworthiness, we rely largely on the credit information available from our own internal databases, the Superintendency of Banks,Dicom (a Chilean nationwide credit bureau) and other sources. Due to limitations in the availability of information and the developing information infrastructurein Chile, our
11

Table of Contents
assessment of the credit risks associated with a particular customer may not be based on complete, accurate or reliable information. In addition, although we havebeen improving our credit scoring systems to better assess borrowers’ credit risk profiles, we cannot assure you that our credit scoring systems collect completeor accurate information reflecting the actual behavior of customers or that their credit risk can be assessed correctly. Without complete, accurate and reliableinformation, we have to rely on other publicly available resources and our internal resources, which may not be effective. As a result, our ability to effectivelymanage our credit risk may be materially adversely affected.
Fluctuations in the rate of inflation may affect our results of operations.
Inflation in Chile gained momentum in 2007 and 2008. In 2007 and 2008, inflation reached 7.1% and 7.8%, respectively. High levels of inflation in Chilecould adversely affect the Chilean economy and have an adverse effect on our business, financial condition and results of operations. Extended periods ofdeflation could also have an adverse effect on our business, financial condition and results of operations. In 2009, inflation was (1.4%).
Our assets and liabilities are denominated in Chilean pesos, UF and foreign currencies. The UF is revalued in monthly cycles. On each day in the periodbeginning on the tenth day of any given month through the ninth day of the succeeding month, the nominal peso value of the UF is indexed up (or down in theevent of deflation) in order to reflect a proportionate amount of the change in the Chilean Consumer Price Index during the prior calendar month. For moreinformation regarding the UF, see “Management’s Discussion and Analysis of Financial Condition and Results of Operations—Impact of Inflation”, “SelectedStatistical Information at and for the Years Ended December 31, 2009 and 2008—Average Balance Sheets, Income Earned from Interest-Earning Assets AndInterest Paid on Interest-Bea ring Liabilities” and “Item 5: F. Selected Statistical Information—Average Balance Sheets, Income Earned from Interest-EarningAssets And Interest Paid on Interest-Bearing Liabilities.” Although we benefit from inflation in Chile, due to the current structure of our assets and liabilities(i.e., a significant portion of our loans are indexed to the inflation rate, but there are no corresponding features in deposits, or other funding sources that wouldincrease the size of our funding base), there can be no assurance that our business, financial condition and result of operations in the future will not be adverselyaffected by changing levels of inflation, including from extended periods of inflation that adversely affect economic growth or periods of deflation.
Our results of operations are affected by interest rate volatility.
Our results of operations depend to a great extent on our net interest income. Net interest income represented 72.4% of our operating income in 2008 and65.7% in 2009. Changes in market interest rates could affect the interest rates earned on our interest-earning assets differently from the interest rates paid on ourinterest-bearing liabilities, leading to a reduction in our net interest income or a decrease in customer demand for our loan or deposit products. Interest rates arehighly sensitive to many factors beyond our control, including the reserve policies of the Central Bank, deregulation of the financial sector in Chile, domestic andinternational economic and political conditions and other factors. In the current economic climate, there is a greater degree of uncertainty and unpredictability inthe policy deci sions and the setting of interest rates by the Central Bank. Any changes in interest rates could adversely affect our business, our future financialperformance and the price of our securities. The following table shows the yields on the Chilean government’s 90-day notes as reported by the Central Bank ofChile at year-end 2004 to 2009 and up to March 31, 2010.
Year
Yield on90-day note at
Period-end 2004 2.24% 2005 4.90 2006 5.11 2007 6.15 2008 7.86 2009 0.48
March 31, 2010 0.50%
Source: Central Bank.
12

Table of Contents
Since our principal sources of funds are short-term deposits, a sudden shortage of funds could cause an increase in costs of funding and an adverse effecton our revenues.
Customer deposits are our primary source (56.1%) of funding. At December 31, 2009, 90.3% of our customer deposits had remaining maturities of one year
or less, or were payable on demand. A significant portion of our assets have longer maturities, resulting in a mismatch between the maturities of liabilities andthe maturities of assets. If a substantial number of our depositors withdraw their demand deposits or do not roll over their time deposits upon maturity, ourliquidity position, results of operations and financial condition may be materially and adversely affected. We cannot assure you that in the event of a sudden orunexpected shortage of funds in the banking system, any money markets in which we operate will be able to maintain levels of funding without incurring highfunding costs or the liquidation of certa in assets. If this were to happen, our results of operations and financial condition may be materially adversely affected.
The legal restrictions on the exposure of Chilean pension funds may affect our access to funding.
Chilean regulations impose restrictions on the share of assets that a Chilean pension fund management company (Administradora de Fondos de Pension, an“AFP”) may allocate to a single issuer, which is currently 7% per fund managed by an AFP (including any securities issued by the issuer and any bank depositswith the issuer). If the exposure of an AFP to a single issuer exceeds the 7% limit, the AFP is required to reduce its exposure below the limit within three years.At December 31, 2009, the aggregate exposure of AFPs to us was approximately US$4.7 billion or 3.9% of their total assets. If the exposure of any AFP to usexceeds the regulatory limit, we would need to seek alternative sources of funding, which could be more expensive and, as a consequence, may have a materialadverse effect on our financial condition and results of operations.
Pension funds must also comply with other investment limits. Recently approved legislation in Chile (Reformas al Mercado de Capitales II (also known asMK2) relaxed the limits on making investments abroad in order to permit pension funds to further diversify their investment portfolios. As of December 31,2009, the limit on making investments abroad was 60%. This limit was increased from 55% as of April 1, 2009 to its current level in August 2009, and willgradually increase to 80% in 2011. As a result, pension funds may change the composition of their portfolios, including reducing their deposits with local banks.At December 31, 2009, 15.8% of our time deposits were from AFPs. Although the legislation referred to above is intended to promote a gradual relaxation of theinvestment limits, and we may be able to substitute the reduced institutional funds with retail deposits, there can be no assurance that this occurrence will nothave a materially adverse impact on our business, financial condition and results of operations.
We may be unable to meet requirements relating to capital adequacy.
Chilean banks are required by the General Banking Law to maintain regulatory capital of at least 8% of risk-weighted assets, net of required loan lossallowance and deductions, and paid-in capital and reserves (“basic capital”) of at least 3% of our total assets, net of required loan loss allowances. As we are theresult of the merger between two predecessors, we are currently required to maintain a minimum regulatory capital to risk-weighted assets ratio of 11%. AtDecember 31, 2009, the ratio of our regulatory capital to risk-weighted assets, net of loan loss allowance and deductions, was 15.59%. Certain developmentscould affect our ability to continue to satisfy the current capital adequacy requirements applicable to us, including: · the increase of risk-weighted assets as a result of the expansion of our business or regulatory changes; · the failure to increase our capital correspondingly; · losses resulting from a deterioration in our asset quality; · declines in the value of our investment instrument portfolio; · changes in accounting rules; · changes in provisioning guidelines that are charged directly against our equity or net income; and · changes in the guidelines regarding the calculation of the capital adequacy ratios of banks in Chile.
13

Table of Contents
In 2012, Chilean banks will most likely adopt the guidelines set forth under Basel II with adjustments incorporated by the Superintendency of Banks. This
should result in a different level of minimum capital required to be maintained by us. No assurance can be given that these changes will not have a materialimpact on our capitalization ratio.
We may also be required to raise additional capital in the future in order to maintain our capital adequacy ratios above the minimum required levels. Ourability to raise additional capital may be limited by numerous factors, including: our future financial condition, results of operations and cash flows; anynecessary government regulatory approvals; our credit ratings; general market conditions for capital raising activities by commercial banks and other financialinstitutions; and domestic and international economic, political and other conditions.
If we require additional capital in the future, we cannot assure you that we will be able to obtain such capital on favorable terms, in a timely manner or at all.Furthermore, the Superintendency of Banks may increase the minimum capital adequacy requirements applicable to us. Accordingly, although we currently meetthe applicable capital adequacy requirements, we may face difficulties in meeting these requirements in the future. If we fail to meet the capital adequacyrequirements, we may be required to take corrective actions. These measures could materially and adversely affect our business reputation, financial conditionand results of operations. In addition, if we are unable to raise sufficient capital in a timely manner, the growth of our loan portfolio and other risk-weightedassets may be restricted, and we ma y face significant challenges in implementing our business strategy. As a result, our prospects, results of operations andfinancial condition could be materially and adversely affected.
Our business is highly dependent on proper functioning and improvement of information technology systems.
Our business is highly dependent on the ability of our information technology systems to accurately process a large number of transactions across numerousand diverse markets and products in a timely manner. The proper functioning of our financial control, risk management, accounting, customer service and otherdata processing systems is critical to our business and our ability to compete effectively. We have backup data for our key data processing systems that could beused in the event of a catastrophe or a failure of our primary systems, and have established alternative communication networks where available. However, wedo not operate all of our redundant systems on a real time basis and cannot assure you that our business activities would not be materially disrupted if there werea partial or complete failure of a ny of these primary information technology systems or communication networks. Such failures could be caused by, among otherthings, major natural catastrophes (such as earthquakes), software bugs, computer virus attacks or conversion errors due to system upgrading. In addition, anysecurity breach caused by unauthorized access to information or systems, or intentional malfunctions or loss or corruption of data, software, hardware or othercomputer equipment, could have a material adverse effect on our business, results of operations and financial condition.
Our ability to remain competitive and achieve further growth will depend in part on our ability to upgrade our information technology systems and increaseour capacity on a timely and cost effective basis. Any substantial failure to improve or upgrade information technology systems effectively or on a timely basiscould materially and adversely affect our competitiveness, results of operations and financial condition.
Operational problems or errors can have a material adverse impact on our business, financial condition and results of operations.
Like all large financial institutions, we are exposed to many types of operational risks, including the risk of fraud by employees and outsiders, failure toobtain proper internal authorizations, failure to properly document transactions, equipment failures and errors by employees. Fraud or other misconduct byemployees or third parties may be difficult to detect and prevent and could subject us to financial losses and sanctions imposed by governmental authorities aswell as seriously harm our reputation. Although we maintain a system of operational controls, there can be no assurance that operational problems or errors willnot occur and that their occurrence will not have a materially adverse impact on our business, financial condition and results of operations.
Banking regulations may restrict our operations and thereby adversely affect our financial condition and results of operations.
We are subject to regulation by the Superintendency of Banks. In addition, we are subject to regulation by the Central Bank with regard to certain matters,including reserve requirements, interest rates, foreign exchange
14

Table of Contents
mismatches and market risks. During the Chilean financial crisis of 1982 and 1983, the Central Bank and the Superintendency of Banks strictly controlled thefunding, lending and general business matters of the banking industry in Chile.
Pursuant to the General Banking Law, all Chilean banks may, subject to the approval of the Superintendency of Banks, engage in certain businesses otherthan commercial banking depending on the risk associated with such business and their financial strength. Such additional businesses include securitiesbrokerage, mutual fund management, securitization, insurance brokerage, leasing, factoring, financial advisory, custody and transportation of securities, loancollection and financial services. The General Banking Law also applies to the Chilean banking system a modified version of the capital adequacy guidelinesissued by the Basel Committee on Banking Regulation and Supervisory Practices and limits the discretion of the Superintendency of Banks to deny new bankinglicenses. There can be no assurance that regulators wil l not in the future impose more restrictive limitations on the activities of banks, including us. Any suchchange could have a material adverse effect on our financial condition or results of operations.
Historically, Chilean banks have not paid interest on amounts deposited in checking accounts. However, since June 1, 2002, the Central Bank has allowedbanks to pay interest on checking accounts. Currently, there are no applicable restrictions on the interest that may be paid on checking accounts. We have begunto pay interest on some checking accounts under certain conditions. If competition or other factors lead us to pay higher interest rates on checking accounts, torelax the conditions under which we pay interest or to increase the number of checking accounts on which we pay interest, any such change could have amaterial adverse effect on our financial condition or results of operations.
We must maintain higher regulatory capital to risk-weighted assets than other banks in Chile. Our current required minimum regulatory capital to risk-weighted assets ratio is 11% and as of December 31, 2009, we were at 15.59%. Although we have not failed in the past to comply with our capital maintenanceobligations, there can be no assurance that we will be able to do so in the future.
We are subject to regulatory inspections and examinations.
We are also subject to various inspections, examinations, inquiries, audits and other regulatory requirements by Chilean regulatory authorities. We cannotassure you that we will be able to meet all of the applicable regulatory requirements and guidelines, or that we will not be subject to sanctions, fines, restrictionson our business or other penalties in the future as a result of noncompliance. If sanctions, fines, restrictions on our business or other penalties are imposed on usfor failure to comply with applicable requirements, guidelines or regulations, our business, financial condition, results of operations and our reputation andability to engage in business may be materially and adversely affected. Risks Relating to Chile
The recent earthquake in Chile is likely to adversely affect the quality of our loan portfolio in segments of the Chilean economy that have been negativelyaffected and, as a result, is likely to negatively affect our results of operations.
Chile lies on the Nazca tectonic plate, making it one of the world’s most seismically active regions. Chile has been adversely affected by powerful
earthquakes in the past, including an 8.0 magnitude earthquake that struck Santiago in 1985 and a 9.5 magnitude earthquake in 1960 which was the largestearthquake ever recorded.
On February 27, 2010, an 8.8 magnitude earthquake struck central Chile. The quake epicenter was located 200 miles southwest of Santiago and 70 milesnorth of Concepción, Chile’s second largest city. Due to the severity of the earthquake and its devastating consequences, former President Michelle Bacheletdeclared a national “state of catastrophe” on February 28, 2010. Significant aftershocks followed the initial earthquake, including aftershocks of 6.2, 5.4 and 5.6magnitudes within an hour of the initial earthquake, aftershocks of 6.9, 6.7 and 6.0 magnitudes on March 11, 2010 and a 7.2 magnitude earthquake on March 13,2010.
The regions of Bío Bío and Maule were the most severely affected regions. Concepción, located approximately 200 miles south of Santiago, was the mostaffected city, with its infrastructure and numerous buildings severely damaged. The coastal area of Concepción, including the neighboring cities Talcahuano andPenco, were hit by a
15

Table of Contents
tsunami shortly after the earthquake that significantly damaged port facilities. Several cities in the Maule region, including its capital city of Talca, were alsoseriously affected by the earthquake. The region of Valparaíso, including the port of Valparaíso and the city of Viña del Mar, was also severely affected. RegionVI suffered serious damages as a result of the 7.2 magnitude quake on March 13, 2010 which forced President Sebastián Piñera to declare a “state ofcatastrophe” in that region. Rancagua, the capital city of Region VI, located approximately 56 miles from Santiago, also suffered significant damages.
The earthquake and its aftershocks, as well as tsunamis from adjacent coastal waters, caused severe damage to Chile’s infrastructure, including roads,bridges, ports and Santiago’s international airport. According to an initial assessment by Chile’s Minister of Infrastructure, the repair of these damages, excludingdamages to port facilities, is likely to take between three and four years. On March 12, 2010, President Piñera said that preliminary assessments of reconstructioncosts indicate that they could total approximately US$30 billion. As of March 23, 2010, at least 1,500,000 homes are believed to have been damaged, more than400 people are believed to have been killed and hundreds of people are missing.
The Bank’s branches, systems and employees were all impacted by the recent earthquake. Of the Bank’s 498 branches, 405 had some form of damage, ofwhich 32 sustained serious damages and 9 were closed as of May 31, 2010. Of the Bank’s 1,856 ATMs, 100% were operating normally as of May 31, 2010. TheBank’s systems were not functioning immediately following the earthquake, but by March 1, 2010 the systems were functioning normally, all open brancheswere online and all remote channels were operating normally.
Of the Bank’s 11,118 employees, 194 sustained damage to their homes but there was no loss of lives. The Bank offered employees with severe damage totheir homes an emergency loan of two months salary with a cap of Ch$2,000,000. The terms of these employee loans include no interest, an 18 month maturityand a 3 month grace period. The Bank expects additional costs from the earthquake, net of insurance proceeds, to total US$7.5 million related to the repair ofbranches, systems, ATMs and other costs. The Bank expects additional administrative expenses from the earthquake, net of insurance proceeds, recognized in2010 to be US$6 million.
The damage to Chile’s roads, port and other infrastructure is likely to have an adverse impact on the Chilean economy, and in particular on export businessesthat operate in the affected areas. The Central Bank of Chile has stated that it expects the growth of Chilean gross domestic product to slow in 2010 as a result ofthe earthquake. The regions of Chile most affected by the earthquake, regions VI, VII and VIII, account for approximately 12% of our loan portfolio and abroadly similar portion of our fee income. Although it is premature to assess the extent of the adverse effect of the recent earthquake on our customers and ourloan portfolio, it is likely that these events will adversely affect economic activity of our customers. As a result, we may experience deteri oration of assetquality and an increase in provision expense, lower fee growth due to lower consumer spending and usage of bank products and an uncertain impact on loangrowth as some sectors will be negatively affected while others will be positively affected by the earthquake. All of these factors could have a material adverseimpact on us, including our results of operations and financial condition. We and our corporate customers may also experience an increase in the corporate taxrate as certain government officials have proposed legislation that would raise the corporate income tax rate in order to pay for reconstruction following theearthquake, which if enacted would have an adverse effect on us. The proposed legislation would increase the corporate tax rate to 20% in 2011 from 17%currently. In 2012 the rate would be 18.5% and 17% in 2013.
Our growth and profitability depend on the level of economic activity in Chile.
A substantial amount of our loans are to borrowers doing business in Chile. Accordingly, the recoverability of these loans in particular, and our ability toincrease the amount of loans outstanding and our results of operations and financial condition in general, are dependent to a significant extent on the level ofeconomic activity in Chile. Our results of operations and financial condition could be affected by changes in economic or other policies of the Chileangovernment, which has exercised and continues to exercise substantial influence over many aspects of the private sector, or other political or economicdevelopments in Chile. Chile’s economy may not continue to grow in the future and future developments could negatively affect Chile’s exports and economicactivity. In line with the global economi c climate, Chile’s economy contracted in 2009 for the first time since 1999. Although the economy is expected torecover in 2010, overall economic activity in Chile could be negatively affected as a consequence of the 2010 earthquake that struck parts of Chile. All this maymaterially adversely affect our business, financial condition or results of operations.
16

Table of Contents
Economic and political problems encountered by other countries may adversely affect the Chilean economy, our results of operations and the market valueof our securities.
The prices of securities issued by Chilean companies, including banks, are to varying degrees influenced by economic and market considerations in other
countries. We cannot assure you that future developments in or affecting the Chilean economy, including consequences of economic difficulties in other markets,will not materially and adversely affect our business, financial condition or results of operations.
We are directly exposed to risks related to the weakness and volatility of the economic and political situation in Asia, the United States, Europe, Brazil,Argentina and other nations, including the recent global credit crunch and economic world crisis. If these nations’ economic environments deteriorate, theeconomy in Chile could also be affected and could experience slower growth than in recent years. Thus, we may need to increase our allowances for loan losses,thus affecting our financial results, our results of operations and the price of our securities. At December 31, 2009, approximately 0.83% of our assets were heldabroad. The global financial and sub-prime crisis has had a significant impact on the growth rate of the Chilean economy in 2009 and is expected to continue tonegativel y impact growth, consumption, unemployment, investment and the price of exports.
Chile is also involved in an international litigation with Peru regarding maritime borders and has had other conflicts with neighboring countries in the past.We cannot assure you that crisis and political uncertainty in other Latin American countries will not have an adverse effect on Chile, the price of our securities orour business.
Current economic conditions may make it more difficult for us to continue funding our business on favorable terms.
Historically, one of our principal sources of funds has been time deposits. Time deposits represented 49.9% and 37.6% of our total funding as of December31, 2008 and December 31, 2009, respectively. Large-denominations in time deposits from institutional investors may, under some circumstances, be a lessstable source of funding than savings and bonds, such as during periods of significant changes in market interest rates for these types of deposit products and anyresulting increased competition for such funds. The recent liquidity crisis triggered by the U.S. subprime market impacted global markets and affected sources offunding, including time deposits. As of December 31, 2009, our investment portfolio did not contain instruments (i) backed by, or otherwise related to, U .S.subprime mortgages or (ii) with exposure to monoline financial guarantors. Although our results of operations and financial position have not suffered asignificant impact as a consequence of the recent credit market instability in the U.S. and the liquidity available in the Chilean market has permitted us to fundout operations and maintain our regular business activities, we cannot assure you that we will be able to continue funding our business or, if so, maintain ourcurrent levels of funding without incurring higher funding costs or having to liquidate certain assets.
Currency fluctuations could adversely affect our financial condition and results of operations and the value of our securities.
Any future changes in the value of the Chilean peso against the U.S. dollar will affect the U.S. dollar value of our securities. The Chilean peso has beensubject to large devaluations and appreciations in the past and could be subject to significant fluctuations in the future. Our results of operations may be affectedby fluctuations in the exchange rates between the peso and the dollar despite our policy and Chilean regulations relating to the general avoidance of materialexchange rate exposure. In order to avoid material exchange rate exposure, we enter into forward exchange transactions. The following table shows the value ofthe Chilean peso relative to the U.S. dollar as reported by the Central Bank at period end for the last six years and the five months ended May 31, 2010 and thedevaluation or revaluation of the peso relative to the U.S. dollar in each of those periods.
Year
Exchange rate(Ch$)
Period-end
Devaluation(Revaluation)
(%) 2004 559.83 (6.6%)2005 514.21 (8.1%)2006 534.43 3.9%2007 495.82 (7.2%)2008 629.11 26.9%2009 506.43 (19.5%)
May 31, 2010 529.23 4.5%
Source: Central Bank.
17

Table of Contents
We may decide to change our policy regarding exchange rate exposure. Regulations that limit such exposures may also be amended or eliminated. Greater
exchange rate risk will increase our exposure to the devaluation of the peso, and any such devaluation may impair our capacity to service foreign currencyobligations and may, therefore, materially and adversely affect our financial condition and results of operations. Notwithstanding the existence of general policiesand regulations that limit material exchange rate exposures, the economic policies of the Chilean government and any future fluctuations of the peso against thedollar could affect our financial condition and results of operations.
Furthermore, Chilean trading in the shares underlying our ADSs is conducted in pesos. Cash distributions with respect to our shares of common stock arereceived in Chilean pesos by the Depositary, which converts such amounts to U.S. dollars at the then-prevailing exchange rate for the purpose of makingpayments in respect of our ADSs. If the value of the Chilean peso falls relative to the U.S. dollar, the dollar value of our ADSs and any distributions to bereceived by our ADS holders from the Depositary will be reduced.
Chile’s banking regulatory and capital markets environment is continually evolving and may change.
Changes in banking regulations may materially and adversely affect our business, financial condition and results of operations. Chilean laws, regulations,policies and interpretations of laws relating to the banking sector and financial institutions are continually evolving and changing. In 2007, new regulationsgoverning the Chilean capital markets were approved (Reformas al Mercado de Capitales II (also known as MK2)). These regulations, among other things,modified certain provisions set forth in the General Banking Law. Under new legislation, the limit on the amount that a bank is allowed to grant as an unsecuredloan to a single individual or entity was increased to 10% of our regulatory capital (and up to 30% of our regulatory capital if any loans granted in excess of the10% is secured by collateral). Previously , these limits were set at 5% and 25%, respectively. Although any such increase may increase our lending activity, itmay also increase the risks associated with the growth of our loan portfolio and increase competition as the number of banks that can compete in the corporatesegment increases.
Further new regulations governing the Chilean capital markets are being discussed. Chile’s Congress passed a new bill on June 1, 2010 (known as MK3) thataims to increase trading in Chile, Latin America’s third-biggest securities market, by allowing new instruments such as exchange-traded funds and coveredbonds. The Chamber of Deputies, Chile’s lower house, voted in favor of the bill, which also seeks to ease credit access for consumers and small companies. Themeasures will make it easier for foreign banks to offer loans in Chile, cut securitization costs and allow banks to sell bonds backed by mortgages. The new lawwill also offer tax breaks to foreign investors in Chilean mutual funds. The bill also aims to reduce the cost of setting up mutual funds and create an exchange-traded funds industry by modifying mutual fund rules to allow secondary trading and enable pension funds to invest in them. The new law also removes limits onemploying non-Chileans that may have prevented overseas fund managers from opening offices in Chile. It also strikes down a law that prevented foreign banksfrom advertising loans. The new class of bonds, known as “mortgage bonds,” will be debt backed by the company that sells them as well as by a pool ofmortgages, as in European covered bonds. Unlike covered bonds, they may be issued by non-banks as well as banks.
The current Finance Minister, Felipe Larrain, plans another package of reforms known as MKB (Reformas al Mercado Financiero Bicentenario). The MKBis comprised of a series of administrative changes and new regulations over the next four years. The reforms include the creation of a financial consumerprotection agency, the transformation of the local securities exchange regulator (SVS) into a securities commission and giving more autonomy to the SBIF. Thenew regulations would also aim to expand the use of the Chilean peso and simplify taxes on fixed-income securities. The proposed legislation would also includemeasures to increase bank penetration and household savings. The reforms also aim to create new instruments that give more efficient financing alternatives tosmall and mid-sized companies and individuals, toget her with creating specific statutes for niche banks and micro credit financing. The proposed legislationwould also reduce the pro-cyclicality of loan loss provisions and seek to enhance solvency and liquidity (the latter must be done through a change in the GeneralBanking Law).
These new reforms could result in increased competition in the industry and thus may have a material adverse effect on our financial condition and results ofoperations.
18

Table of Contents
Increased regulation of the financial services industry in Chile could increase our costs and result in lower profits.
As a result of the recent global financial crisis, there has been an increase in government regulation of the financial services industry in many countries.
Such regulation may also be increased in Chile, including the imposition of higher capital requirements, heightened disclosure standards and restrictions oncertain types of transaction structures. In addition, novel regulatory proposals abound in the current environment. If enacted, new regulations could require us toinject further capital into our business as well as in businesses we acquire, restrict the type or volume of transactions we enter into, or set limits on or require themodification of rates or fees that we charge on certain loans or other products, any of which could lower the return on our investments, assets and equity. We may also face increased compliance costs and limitations on our ability to pursue certain business opportunities.
In line with the future adoption of Basel II regulations in Chile, the Superintendency of Banks has recently proposed to increase the minimum regulatorycapital ratio from 8% to 10%, which would require an amendment to the General Banking Law. Although currently we have a regulatory capital ratio of 15.59%,this change could require us to inject additional capital to our business in the future.
A worsening of labor relations in Chile could impact our business.
As of December 31, 2009, on a consolidated basis we had 11,118 employees, of which 58.2% were unionized. In May 2010, a new collective bargainingagreement was signed, which will become effective on January 1, 2011 and that will expire on December 31, 2014, but this may be negotiated ahead of schedulewith the consent of management and the union. We generally apply the terms of our collective bargaining agreement to unionized and non-unionized employees.We have traditionally enjoyed good relations with our employees and their unions, but we cannot assure you that in the future a strengthening of cross-industrylabor movements will not materially and adversely affect our business, financial condition or results of operations.
Any downgrading of Chile’s debt credit rating for domestic and international debt and/or our parent company’s ratings by international credit ratingagencies may also affect our ratings, our business, our future financial performance, stockholder’s equity and the price of our shares and ADSs.
Our foreign currency deposit ratings are equivalent to the Chilean sovereign ratings. On July 31, 2009, Moody’s downgraded our foreign currency senior
ratings, foreign currency subordinated bond ratings and local currency deposit ratings, following similar action on the ratings of our parent company, BancoSantander Spain. In addition, on February 23, 2010, Moody’s further downgraded the subordinated debt ratings and preferred share ratings of our parentcompany. Moody’s and Standard and Poor’s both have a negative outlook for our parent company’s ratings. Any adverse revisions to our parent company’sratings and/or Chile’s credit ratings for domestic and international debt by international rating agencies may adversely affect our ratings, our business, fu turefinancial performance, stockholder’s equity and the price of our equity shares and ADSs.
Chile has different corporate disclosure and accounting standards than those you may be familiar with in the United States.
Accounting, financial reporting and securities disclosure requirements in Chile differ from those in the United States. Accordingly, the information about usavailable to you will not be the same as the information available to shareholders of a U.S. financial institution. There are also material differences between IFRSand U.S. accounting and financial reporting standards.
The securities laws of Chile, which govern open or publicly listed companies such as us, aim to promote disclosure of all material corporate information tothe public. Chilean disclosure requirements, however, differ from those in the United States in some material respects. In addition, although Chilean law imposesrestrictions on insider trading and price manipulation, applicable Chilean laws are different from those in the United States and in certain respects the Chileansecurities markets are not as highly regulated and supervised as the U.S. securities markets.
19
Table of Contents
Our status as a controlled company and a foreign private issuer exempts us from certain of the corporate governance standards of the New York StockExchange (“NYSE”), limiting the protections afforded to investors.
We are a “controlled company” and a “foreign private issuer” within the meaning of the NYSE corporate governance standards. Under the NYSE rules, a
controlled company is exempt from certain NYSE corporate governance requirements. In addition, a foreign private issuer may elect to comply with the practiceof its home country and not to comply with certain NYSE corporate governance requirements, including the requirements that (1) a majority of the Board ofDirectors consist of independent directors, (2) a nominating and corporate governance committee be established that is composed entirely of independentdirectors and has a written charter addressing the committee’s purpose and responsibilities, (3) a compensation committee be established that is composedentirely of independent directors and has a written charter addressing the committee’s purpose and responsibilities and (4) an annual performance evaluation ofthe nominating and corporate governance and compensation committees be undertaken. We currently use these exemptions and intend to continue using theseexemptions. Accordingly, you will not have the same protections afforded to shareholders of companies that are subject to all NYSE corporate governancerequirements. For more details on the differences between our corporate governance standards and the NYSE standards, please see “Item 6: C. Board Practices –Summary Comparison of Corporate Governance Standards and NYSE Listed Company Standards”.
Chile imposes controls on foreign investment and repatriation of investments that may affect your investment in, and earnings from, our ADSs.
Equity investments in Chile by persons who are not Chilean residents have generally been subject to various exchange control regulations which restrict therepatriation of the investments and earnings therefrom. In April 2001, the Central Bank eliminated the regulations that affected foreign investors except thatinvestors are still required to provide the Central Bank with information relating to equity investments and conduct such operations within Chile’s FormalExchange Market. The ADSs are subject to a contract, dated May 17, 1994, among the Depositary, us and the Central Bank (the “Foreign Investment Contract”)that remains in full force and effect. The ADSs continue to be governed by the provisions of the Foreign Investment Contract subje ct to the regulations inexistence prior to April 2001. The Foreign Investment Contract grants the Depositary and the holders of the ADSs access to the Formal Exchange Market, whichpermits the Depositary to remit dividends it receives from us to the holders of the ADSs. The Foreign Investment Contract also permits ADS holders to repatriatethe proceeds from the sale of shares of our common stock withdrawn from the ADR facility, or that have been received free of payment as a consequence of spinoffs, mergers, capital increases, wind ups, share dividends or preemptive rights transfers, enabling them to acquire the foreign currency necessary to repatriateearnings from such investments. Pursuant to Chilean law, the Foreign Investment Contract cannot be amended unilaterally by the Central Bank, and there arejudicial precedents (although not binding with respect to future judicial decisions) indica ting that contracts of this type may not be abrogated by futurelegislative changes or resolutions of the Advisory Council of the Central Bank. Holders of shares of our common stock, except for shares of our common stockwithdrawn from the ADS facility or received in the manner described above, are not entitled to the benefits of the Foreign Investment Contract, may not haveaccess to the Formal Exchange Market, and may have restrictions on their ability to repatriate investments in shares of our common stock and earningstherefrom.
Holders of ADSs are entitled to receive dividends on the underlying shares to the same extent as the holders of shares. Dividends received by holders ofADSs will be paid net of foreign currency exchange fees and expenses of the Depositary and will be subject to Chilean withholding tax, currently imposed at arate of 35.0% (subject to credits in certain cases). If for any reason, including changes in Chilean law, the Depositary were unable to convert Chilean pesos toU.S. dollars, investors would receive dividends and other distributions, if any, in Chilean pesos.
We cannot assure you that additional Chilean restrictions applicable to holders of our ADSs, the disposition of the shares underlying them or the repatriationof the proceeds from such disposition or the payment of dividends will not be imposed in the future, nor can we advise you as to the duration or impact of suchrestrictions if imposed.
20

Table of Contents
ADS holders may not be able to effect service of process on, or enforce judgments or bring original actions against, us, our directors or our executiveofficers, which may limit the ability of holders of ADSs to seek relief against us.
We are a Chilean corporation. None of our directors are residents of the United States and most of our executive officers reside outside the United States. In
addition, a substantial portion of our assets and the assets of our directors and executive officers are located outside the United States. As a result, it may bedifficult for ADS holders to effect service of process outside Chile upon us or our directors and executive officers or to bring an action against us or such personsin the United States or Chile to enforce liabilities based on U.S. federal securities laws. It may also be difficult for ADS holders to enforce in the United States orin Chilean courts money judgments obtained in United States courts against us or our directors and executive officers based on civil liability provisions of theU.S. federal securities laws. If a U.S. court grants a final money judgment in an action based on the civil liability provisions of the federal securities laws of theUnited States, enforceability of this money judgment in Chile will be subject to the obtaining of the relevant “exequatur” (i.e., recognition and enforcement ofthe foreign judgment) according to Chilean civil procedure law currently in force, and consequently, subject to the satisfaction of certain factors. The mostimportant of these factors are the existence of reciprocity, the absence of a conflicting judgment by a Chilean court relating to the same parties and arising fromthe same facts and circumstances and the Chilean courts’ determination that the U.S. courts had jurisdiction, that process was appropriately served on thedefendant and that enforcement would not violate Chilean public policy. Failure to satisfy any of such requirements may result in non-enforcement of yourrights.
We cannot assure you of the accuracy or comparability of facts, forecasts and statistics contained in this report with respect to Chile, its economy andglobal banking industries.
Facts, forecasts and statistics in this document relating to Chile, Chile’s economy and the Chilean banking industry, including market share information, are
derived from various official and other publicly available sources that we generally believe to be reliable. However, we cannot guarantee the quality andreliability of such official and other sources of materials. In addition, these facts, forecasts and statistics have not been independently verified by us and,therefore, we make no representation as to the accuracy of such facts, forecasts and statistics, which may not be consistent with other information compiledwithin or outside of Chile and may not be complete or up to date. We have taken reasonable care in reproducing or extracting the information from such sources.However, because of possibly flawed or ineffective methodologies underlying the published information or discrepancies between the published information andmarket practice and other problems, these facts, forecasts or statistics may be inaccurate and may not be comparable from period to period or to facts, forecastsor statistics produced for other economies, and you should not unduly rely upon them. Risks Relating to Our ADSs
There may be a lack of liquidity and market for our shares and ADSs.
Our ADSs are listed and traded on the NYSE. Our common stock is listed and traded on the Santiago Stock Exchange, the Chile Electronic Stock Exchangeand the Valparaiso Stock Exchange, which we refer to collectively as the Chilean Stock Exchanges, although the trading market for the common stock is smallby international standards. At December 31, 2009, we had 188,446,126,794 shares of common stock outstanding. The Chilean securities markets aresubstantially smaller, less liquid and more volatile than major securities markets in the United States. According to Article 14 of the Ley de Mercado de Valores,Ley No. 18,045, or the Chilean Securities Market Law, the Superintendencia de Valores y Seguros, or the Superintendency of Securities and Insurance, maysuspend the offer, quotation or trading of shares of any company listed on one or more Chilean Stock Exchanges for up to 30 days if, in its opinion, suchsuspension is necessary to protect investors or is justified for reasons of public interest. Such suspension may be extended for up to 120 days. If, at the expirationof the extension, the circumstances giving rise to the original suspension have not changed, the Superintendency of Securities and Insurance will then cancel therelevant listing in the registry of securities. In addition, the Santiago Stock Exchange may inquire as to any movement in the price of any securities in excess of10% and suspend trading in such securities for a day if it deems necessary.
Although our common stock is traded on the Chilean Stock Exchanges, there can be no assurance that a liquid trading market for our common stock willcontinue to exist. Approximately 23.09% of our outstanding common stock is held by the public (i.e., shareholders other than Banco Santander Spain and itsaffiliates), including our
21

Table of Contents
shares that are represented by ADSs trading on the NYSE. A limited trading market in general and our concentrated ownership in particular may impair theability of an ADS holder to sell in the Chilean market shares of common stock obtained upon withdrawal of such shares from the ADR facility in the amount andat the price and time such holder desires, and could increase the volatility of the price of the ADSs.
You may be unable to exercise preemptive rights.
The Ley Sobre Sociedades Anónimas, Ley No. 18,046 and the Reglamento de Sociedades Anónimas, which we refer to collectively as the ChileanCompanies Law, and applicable regulations require that whenever we issue new common stock for cash, we grant preemptive rights to all of our shareholders(including holders of ADSs), giving them the right to purchase a sufficient number of shares to maintain their existing ownership percentage. Such an offeringwould not be possible in the United States unless a registration statement under the U.S. Securities Act of 1933 (“Securities Act”), as amended, were effectivewith respect to such rights and common stock or an exemption from the registration requirements thereunder were available.
Since we are not obligated to make a registration statement available with respect to such rights and the common stock, you may not be able to exercise yourpreemptive rights in the United States. If a registration statement is not filed or an applicable exemption is not available under U.S. securities law, the Depositarywill sell such holders’ preemptive rights and distribute the proceeds thereof if a premium can be recognized over the cost of any such sale.
You may have fewer and less clearly defined shareholders’ rights than with shares of a company in the United States.
Our corporate affairs are governed by our estatutos, or by-laws, and the laws of Chile. Under such laws, our shareholders may have fewer or less clearlydefined rights than they might have as shareholders of a corporation incorporated in a U.S. jurisdiction. For example, under legislation applicable to Chileanbanks, our shareholders would not be entitled to appraisal rights in the event of a merger or other business combination undertaken by us.
Holders of ADSs may find it difficult to exercise voting rights at our shareholders’ meetings.
Holders of ADSs will not be direct shareholders of our company and will be unable to enforce directly the rights of shareholders under our by-laws and thelaws of Chile. Holders of ADSs may exercise voting rights with respect to the common stock represented by ADSs only in accordance with the depositagreement governing the ADSs. Holders of ADSs will face practical limitations in exercising their voting rights because of the additional steps involved in ourcommunications with ADS holders. Holders of our common stock will be able to exercise their voting rights by attending a shareholders’ meeting in person orvoting by proxy. By contrast, holders of ADSs will receive notice of a shareholders’ meeting by mail from the Depositary following our notice to the Depositary requesting the Depository to do so. To exercise their voting rights, holders of ADSs must instruct the Depositary on a timely basis on how they wish tovote. This voting process necessarily will take longer for holders of ADSs than for holders of our common stock. If the Depositary fails to receive timely votinginstructions for all or part of the ADSs, the Depositary will assume that the holders of those ADSs are instructing it to give a discretionary proxy to a persondesignated by us to vote their ADSs, except in limited circumstances.
Holders of ADSs also may not receive the voting materials in time to instruct the Depositary to vote the common stock underlying their ADSs. In addition,the Depositary and its agents are not responsible for failing to carry out voting instructions of the holders of ADSs or for the manner of carrying out those votinginstructions. Accordingly, holders of ADSs may not be able to exercise voting rights, and they will have little, if any, recourse if the common stock underlyingtheir ADSs are not voted as requested. ITEM 4. INFORMATION ON THE COMPANY A. History and Development of the Company Overview
We are the largest bank in Chile in terms of total assets, total deposits and shareholders’ equity. At December 31, 2009, we had total assets ofCh$20,772,875 million (US$40,952 million), loans net of allowances outstanding of Ch$13,751,276 million (US$27,109 million), total deposits ofCh$10,708,791 million (US$21,111 million) and
22

Table of Contents
shareholders’ equity of Ch$1,689,903 million (US$3,331 million). As of December 31, 2009, we employed 11,118 people (on a consolidated basis) and had thelargest private branch network in Chile with 498 branches. Our headquarters are located in Santiago and we operate in every major region of Chile.
We provide a broad range of commercial and retail banking services to our customers, including Chilean peso and foreign currency denominated loans tofinance a variety of commercial transactions, trade, foreign currency forward contracts and credit lines and a variety of retail banking services, includingmortgage financing. We seek to offer our customers a wide range of products while providing high levels of service. In addition to our traditional bankingoperations, we offer a variety of financial services including financial leasing, financial advisory services, mutual fund management, securities brokerage,insurance brokerage and investment management.
The legal predecessor of Santander-Chile was Banco Santiago (“Santiago”). Santiago was incorporated by public deed dated September 7, 1977 granted atthe Notary Office of Alfredo Astaburuaga Gálvez. Santiago received its permission to incorporate and function as a bank by Resolution No. 118 of theSuperintendency of Banks on October 27, 1977. Santiago’s by-laws were approved by Resolution No. 103 of the Superintendency of Banks on September 22,1977. In January 1997, Santiago merged with Banco O’Higgins with Santiago being the surviving entity. In 1999, Santiago became a controlled subsidiary ofBanco Santander Spain. As of June 30, 2002, Santiago was the second largest private sector bank in Chile in terms of total assets, deposits, loans andshareholders’ equity.
Old Santander-Chile was established as a subsidiary of Banco Santander Spain in 1978. In 1982, Old Santander-Chile acquired a significant portion of theassets and liabilities of Banco Español-Chile, a domestic bank that had become insolvent. In July 1996, Old Santander-Chile was merged into Banco Osorno y laUnión becoming “Banco Santander-Chile”, the third largest private bank in terms of outstanding loans at that date.
On August 1, 2002, Santiago and Old Santander Chile merged, whereby the latter ceased to exist and Santander-Chile (formerly known as Santiago) beingthe surviving entity.
Our principal executive offices are located at Bandera 140, Santiago, Chile. Our telephone number is +562-320-2000 and our website is www.santander.cl.None of the information contained on our website is incorporated by reference into, or forms part of, this Annual Report. Relationship with Banco Santander Spain
We believe that our relationship with our controlling shareholder, Banco Santander Spain, offers us a significant competitive advantage over our peerChilean banks. Banco Santander Spain is one of the largest financial groups in Brazil and the rest of Latin America, in terms of total assets measured on aregional basis. It is the largest financial group in Spain and is a major player elsewhere in Europe, including the United Kingdom through its Abbey subsidiaryand Portugal, where it is the third-largest banking group. Through Santander Consumer, it also operates a leading consumer finance franchise in the United Statesas well as in Germany, Italy, Spain, and several other European countries.
Our relationship with Banco Santander Spain provides us with access to the group’s client base, while its multinational focus allows us to offer internationalsolutions to our clients’ financial needs. We also have the benefit of selectively borrowing from Banco Santander Spain’s product offerings in other countries aswell as benefiting from their know-how in systems management. We believe that our relationship with Banco Santander Spain will also enhance our ability tomanage credit and market risks by adopting policies and know-how developed by Banco Santander Spain. Our internal auditing function has been strengthenedand is more independent from management as a result of the addition of an internal auditing department that concurrently reports directly to our AuditCommittee and the audit committ ee of Banco Santander Spain. We believe that this structure leads to improved monitoring and control of our exposure tooperational risks.
Banco Santander Spain’s support includes the assignment of managerial personnel to key supervisory areas of Santander-Chile, like Risks, Auditing,Accounting and Financial Control. Santander-Chile does not pay any management fees to Banco Santander Spain in connection with these support services.
23

Table of Contents
B. Organizational Structure
Banco Santander Spain controls Santander-Chile through its holdings in Teatinos Siglo XXI Inversiones Ltda. and Santander-Chile Holding, which arecontrolled subsidiaries. This gives Banco Santander Spain control over 76.91% of the shares of the Bank and actual participation when excluding minorityshareholders that participate in Santander Chile Holding is 76.74%.
Shareholder Number of
Shares Percentage Teatinos Siglo XXI Inversiones Ltda. 78,108,391,607 41.45%Santander Chile Holding 66,822,519,695 35.46%
Management Team
The chart below sets forth the names and areas of responsibility of our senior commercial managers.
The chart below sets forth the names and areas of responsibilities of our operating managers.
24

Table of Contents
C. Business Overview
We have 498 total branches, 260 of which are operated under the Santander brand name, with the balance under certain specialty names, including 98 underthe Santander Banefe brand name, 46 under the SuperCaja brand name, 24 under the BancaPrime brand name and 41 as auxiliary and payment centers. Weprovide a full range of financial services to corporate and individual customers. We divide our clients into the following segments: (i) Retail, (ii) Middle–Marketand (iii) Global Banking and Markets.
The Retail segment is comprised of the following sub–segments: · Lower–middle to middle–income, consisting of individuals with monthly incomes between Ch$150,000 (US$296) and Ch$400,000 (US$789) and
served through our Banefe branch network. This segment accounts for 4.4% of our total loans outstanding at December 31, 2009. This segment offerscustomers a range of products, including consumer loans, credit cards, auto loans, residential mortgage loans, debit card accounts, savings products,mutual funds and insurance brokerage.
· Middle– and upper–income, consisting of individuals with a monthly income greater than Ch$400,000 (US$789). Clients in this segment account for
48.6% of our total loans outstanding at December 31, 2009 and are offered a range of products, including consumer loans, credit cards, auto loans,commercial loans, foreign trade financing, residential mortgage loans, checking accounts, savings products, mutual funds and insurance brokerage.
· Small and mid-sized companies, consisting of small companies with annual revenue of less than Ch$1,200 million (US$2.4 million). At December 31,
2009, this segment represented approximately 18.1% of our total loans outstanding. Customers in this segment are offered a range of products,including commercial loans, leasing, factoring, foreign trade, credit cards, mortgage loans, checking accounts, savings products, mutual funds andinsurance brokerage.
· Institutional, such as universities, government agencies, municipalities and regional governments. At December 31, 2009, these clients represented
2.1% of our total loans outstanding. Customers in this sub-segment are also offered the same products that are offered to the customers in our smallbusinesses segment. This sub-segment is included in the Retail segment because customers in this sub-segment are a potential source for new individualcustomers.
The Middle–Market segment is comprised of the following sub–segments:
· Companies, consisting of companies with annual revenue over Ch$1,200 million (US$2.4 million) and up to Ch$10,000 million (US$19.7 million).
Customers in this segment are offered a wide range of products, including commercial loans, leasing, factoring, foreign trade, credit cards, mortgageloans, checking accounts, cash management, treasury services, financial advisory, savings products, mutual funds and insurance brokerage. AtDecember 31, 2009, these clients represented 7.6% of our total loans outstanding.
· Real estate, consisting of all companies in the real estate sector with annual revenue over Ch$800 million (US$1.6 million), including construction
companies and real estate companies that execute projects for sale to third parties. At December 31, 2009, these clients represented 7.1% of our totalloans outstanding. To these clients we offer, in addition to traditional banking services, specialized services for financing, primarily residential projects,in order to increase the sale of residential mortgage loans.
· Large corporations, consisting of companies with annual revenue over Ch$10,000 million (US$19.7 million). Customers in this segment are also
offered the same products that are offered to the customers in our mid–sized companies segment. At December 31, 2009, these clients represented 3.2%of our total loans outstanding.
25

Table of Contents
The Global Banking and Markets segment is comprised of the following sub–segments:
· Wholesale banking corporate, consisting of companies that are foreign multinationals or part of a larger Chilean economic group with sales of over
Ch$10,000 million (US$19.7 million). At December 31, 2009, these clients represented 8.7% of our total loans outstanding. Customers in this segmentare offered a wide range of products, including commercial loans, leasing, factoring, foreign trade, mortgage loans, checking accounts, cashmanagement, treasury services, financial advisory, savings products, mutual funds and insurance brokerage.
· The Treasury Division provides sophisticated financial products mainly to companies in the wholesale banking and the middle–market segments. This
includes products such as short–term financing and funding, securities brokerage, interest rate and foreign currency derivatives, securitization servicesand other tailor made financial products. The Treasury division also manages our trading positions.
In addition, we have a Corporate Activities segment comprised of all other operational and administrative activities that are not assigned to a specific
segment or product mentioned above. These activities include Financial Management, which manages global functions such as the management of our structuralforeign exchange gap position, our structural interest rate risk and our liquidity risk. Financial Management also oversees the use of our resources, thedistribution of capital among our different units and the overall financing cost of investments.
The table below sets forth our lines of business and certain statistical information relating to each of them for the year ended December 31, 2009. Please see“Note 4” to our Audited Consolidated Financial Statements for details of revenue by business segment in the last three years.
26

Table of Contents
As of Dec ember 31, 2009 (Ch$ million)
Loans andaccounts
receivable fromcustomers (1)
Net interestincome Net fee income
Financialtransactions, net
(2) Net loan loss
allowances (3) Operating
expenses (4) Net segment
contribution (5) SEGMENTS Individuals 7,287,925 532,060 171,433 19,027 (230,503) (268,934) 223,083 Santander Banefe 609,808 115,840 29,452 5,078 (82,588) (54,913) 12,869 Commercial Banking 6,678,117 416,220 141,981 13,949 (147,915) (214,021) 210,214 SMEs 2,485,505 228,928 41,917 11,037 (76,075) (58,741) 147,066 Institutional 282,933 18,789 1,962 664 (327) (6,799) 14,289 Companies 2,471,162 114,432 20,567 16,181 (24,333) (30,628) 96,219 Companies 1,051,875 53,407 9,813 7,248 (8,618) (15,989) 45,861 Real estate 982,938 17,792 2,338 148 2,041 (4,280) 18,039 Large Corporations 436,349 43,233 8,416 8,785 (17,756) (10,359) 32,319 Global Banking & Markets 1,194,706 33,738 18,747 64,557 (2,511) (29,485) 85,046 Corporate 1,194,706 54,728 19,387 5 (2,511) (14,803) 56,806 Treasury (6) - (20,990) (640) 64,552 - (14,682) 28,240 Other (7) 29,045 (71,431) (496) 55,662 (98) (13,307) (29,670) TOTAL 13,751,276 856,516 254,130 167,128 (333,847) (407,894) 536,033 Other operating income 25,866 Other operating expenses (36,662)Income from investments in other companies 297 Income tax (88,924)Consolidated profit (loss) for the year 436,610
(1) Loans and accounts receivables from customers plus interbank loans, gross of loan loss allowances.
(2) Includes net gains from trading, net mark-to-market gains and foreign exchange transactions.
(3) Includes gross provisions for loan losses, net of releases on recoveries.
(4) Equal to the sum of personnel expenses, administrative expenses, amortizations and depreciations and deterioration.
(5) Equal to the sum of the net interest revenue, net fee income and net financial transactions, minus net provision for loan losses and operating expenses.
(6) Includes the Treasury’s client business and trading business.
(7) Includes contribution of non-segmented items such as interbank loans, the cost of the Bank’s capital and fixed assets. Financial transactions, net included in other is mainly comprised of the results
from the Financial Management Division (Gestion Financiera). The area of Financial Management carries out the function of managing the structural interest rate risk, the structural position ininflation indexed assets and liabilities, shareholder’s equity and liquity. The aim of Financial Management is to inject stability and recurrence into the net income of commercial activities and toassure the Bank complies with internal and regulatory limits regarding liquidity, regulatory capital, reserve requirements and market risk.
27

Table of Contents
Operations through Subsidiaries
Today, the General Banking Law permits us to directly provide the leasing and financial advisory services that we could formerly offer only through our
subsidiaries, to offer investment advisory services outside of Chile and to undertake activities we could not formerly offer directly or through subsidiaries, suchas factoring, securitization, foreign investment funds, custody and transport of securities and insurance brokerage services. For the twelve–month period endedDecember 31, 2009, our subsidiaries collectively accounted for 2.8% of our total consolidated assets. Percentage Owned
Subsidiary As of December 2009 As of December 2008 Direct Indirect Total Direct Indirect Total % % % % % % Santander S.A. Corredores de Bolsa(1) (2) 50.59 0.41 51.00 50.59 0.41 51.00 Santander Corredores de Seguro Ltda. (Ex–Santander Leasing
S.A.) (2) (3) (4) 99.75 0.01 99.76 99.75 0.01 99.76 Santander Asset Management S.A. Administradora General de
Fondos 99.96 0.02 99.98 99.96 0.02 99.98 Santander S.A. Agente de Valores 99.03 – 99.03 99.03 – 99.03 Santander S.A. Sociedad Securitizadora 99.64 – 99.64 99.64 – 99.64 Santander Servicios de Recaudación y Pagos Limitada 99.90 0.10 100.00 99.90 0.10 100.00
(1) During the Extraordinary Shareholders’ Meeting held on January 15, 2007 by Santander Investment S.A. Corredores de Bolsa, a related company to BancoSantander Chile, the merger between Santiago Corredores de Bolsa Limitada, a subsidiary of Banco Santander Chile, into Santander Investment S.A.Corredores de Bolsa was approved and became effective January 1, 2007. Santander Investment S.A. Corredores de Bolsa, as of January 15, 2007, became asubsidiary of Banco Santander Chile and the legal successor of Santiago Corredores de Bolsa Limitada.
(2) During fiscal year 2008, the following subsidiaries changed their registered commercial names: a. Santander Corredores de Seguro Ltda. b. Santander S.A. Corredores de Bolsa (3) On December 4, 2007, the Superintendency of Bank, authorized the statutes modification, social rights sell and merger of the subsidiaries Santander Leasing
S.A. (formerly Santiago Leasing S.A.) and Santander Corredora de Seguros Limitada (formerly Santander Santiago Corredora de Seguros Limitada). (4) During the Extraordinary Shareholders’ Meeting held on October 1, 2008 by Santander Corredora de Seguros S.A., a company affiliated with Banco
Santander Chile, approved the merger which incorporated the affiliated Santander Corredora de Seguros Limitada into Santander Corredora de Seguro S.A.(previously Santander Leasing S.A.). The merger was effective January 1, 2008. At the time of the above mentioned merger, Santander Corredora deSeguros S.A. became a legal extension of Santander Corredora de Seguros Limitada. The merger of Santander Corredora de Seguros S.A. and SantanderCorredora de Seguros Limitada did not result in any changes in accounting for Banco Santander Chile.
The consolidation/valuation methods used up to December 31, 2008 will continue to be used for subsidiaries and investment in other companies.
Furthermore, pursuant to the provisions of International Accounting Standard (IAS) 27 and Standard Interpretations Committee (SIC) 12, we must determine theexistence of Special Purpose Entities (SPE), which must be consolidated with the financial results of the Bank. As a result, we have incorporated into ourfinancial statements the following companies: · Santander Gestión de Recaudación y Cobranzas Ltda. (collection services) · Multinegocios S.A. (management of sales force) · Servicios Administrativos y Financieros Ltda. (management of sales force) · Servicios de Cobranzas Fiscalex Ltda. (collection services) · Multiservicios de Negocios Ltda. (call center) · Bansa Santander S.A. (management of repossessed assets and leasing of properties)
28

Table of Contents
Competition
Overview
The Chilean financial services market consists of a variety of largely distinct sectors. The most important sector, commercial banking, includes a number ofprivately–owned banks and one public–sector bank, Banco del Estado (which operates within the same legal and regulatory framework as the private sectorbanks). The private–sector banks include local banks and a number of foreign–owned banks which are operating in Chile. The Chilean banking system iscomprised of 24 private–sector banks and one public–sector bank. The five largest private–sector banks along with the state–owned bank together accounted for82.1% of all outstanding loans by Chilean financial institutions at December 31, 2009.
The Chilean banking system has experienced increased competition in recent years largely due to consolidation in the industry and new legislation. Effectivein November 2007, Scotiabank Sud Americano merged with Banco del Desarrollo, while in January 2008, Banco de Chile merged with Citibank Chile. We alsoface competition from non–bank and non–finance competitors (principally department stores) with respect to some of our credit products, such as credit cards,consumer loans and insurance brokerage. In addition, we face competition from non–bank finance competitors, such as leasing, factoring and automobile financecompanies, with respect to credit products, and mutual funds, pension funds and insurance companies, with respect to savings products. Currently, bankscontinue to be the main suppliers of leasing, factoring and mutual funds, and the insurance sales business has grown rapidly.
As shown in the following table, we are the market leader for nearly every banking service in Chile:
As of December 31, 2009,
unless otherwise noted Market Share Rank Commercial loans 17.2% 2 Consumer loans 25.8 1 Residential mortgage loans 23.7 2 Foreign trade loans (loans for export, import and contingent) 17.9 2 Total loans 19.9 1 Deposits(1) 18.2 3 Mutual funds (assets managed) 19.7 2 Credit card accounts 34.8 1 Checking Accounts(2) 26.2 1 Branches(3) 19.9 1
Source: Superintendency of Banks (1) Net of clearance (excludes amounts being cleared with other banks). (2) According to latest data available as of November 2009. (3) According to latest data available as of September 2009. Excludes special–service payment centers.
The following tables set out certain statistics comparing our market position to that of our peer group, defined as the five largest banks in Chile in terms oftotal loans market share as of December 31, 2009.
Loans
As of December 31, 2009, our loan portfolio was the largest among Chilean banks. Our loan portfolio on a stand–alone basis represented 19.9% of themarket for loans in the Chilean financial system at such date. The following table sets forth our and our peer group’s market shares in terms of loans at the datesindicated.
29

Table of Contents
As of December 31, 2009
Loans Ch$ million US$ million
MarketShare
Santander Chile 13,727,864 27,063 19.9%Banco de Chile 13,184,553 25,992 19.1 Banco del Estado 11,078,221 21,840 16.1 Banco de Crédito e Inversiones 8,797,325 17,343 12.8 Corpbanca 5,011,656 9,880 7.3 BBVA, Chile 4,818,896 9,500 7.0 Others 12,319,530 24,287 17.9 Chilean financial system 68,938,045 135,905 100.0%
Source: Superintendency of Banks
Deposits
On a stand alone basis, we had a 18.3% market share in deposits, ranking third among banks in Chile at December 31, 2009. Deposit market share is basedon total time and demand deposits at the respective dates. The following table sets forth our and our peer group’s market shares in terms of deposits at the datesindicated. As of December 31, 2009
Deposits Ch$ million US$ million
MarketShare
Santander Chile 10,708,791 21,111 18.2%Banco de Chile 11,145,557 21,973 19.0 Banco del Estado 10,763,983 21,220 18.4 Banco de Crédito e Inversiones 7,892,111 15,559 13.5 BBVA, Chile 3,837,236 7,565 6.6 Corpbanca 3,812,315 7,516 6.5 Others 10,409,967 20,522 17.8 Chilean financial system 58,569,960 115,466 100.0%
Source: Superintendency of Banks
Shareholders’ equity
With Ch$1,658,316 million (US$3,269 million) in shareholders’ equity at December 31, 2009, we were the largest commercial bank in Chile in terms ofshareholders’ equity. The following table sets forth our and our peer group’s shareholders’ equity at December 31, 2009. As of December 31, 2009
Shareholders’ Equity(1) Ch$ million(2) US$ million
MarketShare
Santander Chile 1,658,316 3,269 20.7%Banco de Chile 1,392,745 2,746 17.4 Banco del Estado 933,484 1,840 11.7 Banco de Crédito e Inversiones 896,150 1,767 11.2 Corpbanca 503,535 993 6.3 BBVA, Chile 479,960 946 6.0 Others 2,139,319 4,217 26.7 Chilean financial system 8,003,509 15,778 100.0%
Source: Superintendency of Banks. (1) Percentage of total shareholders’ equity of all Chilean banks. (2) As required by local regulations.
30

Table of Contents
Efficiency
For the year ended December 31, 2009, we were the most efficient bank in our peer group. The following table sets forth our and our peer group’s efficiencyratio (defined as operating expenses as a percentage of operating revenue, which is the aggregate of net interest income, fees and income from services (net), netgains from mark–to–market and trading, exchange differences (net) and other operating income (net)) for the twelve–month period indicated. Efficiency ratio
As of December31, 2009(1)
% Santander Chile 32.2%Banco de Chile 46.7 Banco del Estado 61.9 Banco de Crédito e Inversiones 46.4 BBVA, Chile 48.0 Corpbanca 40.8 Chilean financial system 46.1%
Source: Superintendency of Banks. (1) As required by local regulations.
Net income
For the twelve–month period ended December 31, 2009, we were the largest bank in Chile in terms of net income with Ch$436,306 million (US$860.1million). The following table sets forth our and our peer group’s net income for the year ended December 31, 2009. As of December 31, 2009
Net income(1) Ch$ million(2) US$ million
MarketShare
Santander Chile 436,306 860.1 35.6%Banco de Chile 257,887 508.4 21.0 Banco de Crédito e Inversiones 160,774 317.0 13.1 Corpbanca 85,109 167.8 6.9 BBVA, Chile 68,030 134.1 5.6 Banco del Estado 60,357 119.0 4.9 Others 156,724 309.0 12.8 Chilean financial system 1,225,187 2,415.4 100.0%
Source: Superintendency of Banks. (1) Net income before minority interest. (2) As required by local regulations.
31

Table of Contents
Return on average equity
As of December 31, 2009, we were the most profitable bank in our peer group (as measured by return on average equity) and the most capitalized bank asmeasured by the BIS ratio. The following table sets forth our and our peer group’s return on average equity and BIS ratio for the year ended December 31, 2009.
Return onaverageequityas of
December 31,2009
BIS Ratio asof
December 31,2009
Santander Chile 27.3 15.6%Banco de Chile 19.0 12.7 Banco del Estado 6.3 12.4 Banco de Crédito e Inversiones 19.3 12.1 BBVA, Chile 14.7 14.0 Corpbanca 17.5 13.9 Chilean Financial System 15.5% 14.3%
Source: Superintendency of Banks,except Santander Chile. Calculated by dividing annual net income by monthly average equity. For Santander Chile, theaverage equity is calculated on a daily basis.
Asset Quality
At December 31, 2009, on a stand alone basis, we had the second highest loan loss allowance to total loans ratio (expected loss ratio) in our peer group. The
following table sets forth our and our peer group’s loan loss allowance to total loans ratio as defined by the Superintendency of Banks at the dates indicated.
Loan lossallowances/total
loans as ofDecember 31,
2009 Santander Chile 2.54%Banco de Chile 2.45 Banco del Estado 2.75 Banco de Crédito e Inversiones 2.21 BBVA, Chile 1.61 Corpbanca 1.91 Chilean financial system 2.43%
Source: Superintendency of Banks
32

Table of Contents
Regulation and Supervision General
In Chile, only banks may maintain checking accounts for their customers, conduct foreign trade operations, and together with non-banking financialinstitutions, accept time deposits. The principal authorities that regulate financial institutions in Chile are the Superintendency of Banks and the Central Bank.Chilean banks are primarily subject to the General Banking Law and secondarily, to the extent not inconsistent with this statute, the provisions of the ChileanCompanies Law governing public corporations, except for certain provisions which are expressly excluded.
The modern Chilean banking system dates from 1925 and has been characterized by periods of substantial regulation and state intervention, as well asperiods of deregulation. The most recent period of deregulation commenced in 1975 and culminated in the adoption of a series of amendments to GeneralBanking Law. That law, amended most recently in 2001, granted additional powers to banks, including general underwriting powers for new issues of certaindebt and equity securities and the power to create subsidiaries to engage in activities related to banking, such as brokerage, investment advisory and mutual fundservices, administration of investment funds, factoring, securitization products and financial leasing services.
The Central Bank
The Central Bank is an autonomous legal entity created by the Chilean Constitution. It is subject to the Chilean Constitution and its own ley orgánicaconstitucional, or organic constitutional law. To the extent not inconsistent with the Chilean Constitution or the Central Bank’s organic constitutional law, theCentral Bank is also subject to private sector laws (but in no event is it subject to the laws applicable to the public sector). It is directed and administered by aBoard of Directors composed of five members designated by the President of Chile, subject to the approval of the Senate.
The legal purpose of the Central Bank is to maintain the stability of the Chilean peso and the orderly functioning of Chile’s internal and external paymentsystem. The Central Bank’s powers include setting reserve requirements, regulating the amount of money and credit in circulation, establishing regulations andguidelines regarding finance companies, foreign exchange (including the Formal Exchange Market) and banks’ deposit-taking activities.
The Superintendency of Banks
Banks are supervised and controlled by the Superintendency of Banks, an independent Chilean governmental agency. The Superintendency of Banksauthorizes the creation of new banks and has broad powers to interpret and enforce legal and regulatory requirements applicable to banks and financialcompanies. Furthermore, in cases of noncompliance with such legal and regulatory requirements, the Superintendency of Banks has the ability to imposesanctions. In extreme cases, it can appoint, with the prior approval of the Board of Directors of the Central Bank, a provisional administrator to manage a bank. Itmust also approve any amendment to a bank’s by-laws or any increase in its capital.
The Superintendency of Banks examines all banks from time to time, generally at least once a year. Banks are also required to submit their financialstatements monthly to the Superintendency of Banks, and a bank’s financial statements are published at least four times a year in a newspaper with countrywidecoverage. In addition, banks are required to provide extensive information regarding their operations at various periodic intervals to the Superintendency ofBanks. A bank’s annual financial statements and the opinion of its independent auditors must also be submitted to the Superintendency of Banks.
Any person wishing to acquire, directly or indirectly, 10.0% or more of the share capital of a bank must obtain the prior approval of the Superintendency ofBanks. Absent such approval, the acquiror of shares so acquired will not have the right to vote. The Superintendency of Banks may only refuse to grant itsapproval, based on specific grounds set forth in the General Banking Law.
According to Article 35bis of the General Banking Law, the prior authorization of the Superintendency of Banks is required for:
33

Table of Contents
· the merger of two or more banks; · the acquisition of all or a substantial portion of a banks’ assets and liabilities by another bank; · the control by the same person, or controlling group, of two or more banks; or · a substantial increase in the existing control of a bank by a controlling shareholder of that bank.
Such prior authorization is required solely when the acquiring bank or the resulting group of banks would own a significant market share in loans, definedby the Superintendency of Banks to be more than 15.0% of all loans in the Chilean banking system. The intended purchase, merger or expansion may be deniedby the Superintendency of Banks; or, if the acquiring bank or resulting group would own a market share in loans determined to be more than 20.0% of all loansin the Chilean banking system, the purchase, merger, or expansion may be conditioned on one or more of the following: · that the bank or banks maintain regulatory capital higher than 8.0% and up to 14.0% of their risk-weighted assets; · that the technical reserve established in Article 65 of the General Banking Law be applicable when deposits exceed one and a half times the resulting
bank’s paid-in capital and reserves; or · that the margin for interbank loans be reduced to 20.0% of the resulting bank’s regulatory capital.
If the acquiring bank or resulting group would own a market share in loans determined by the Superintendency of Banks to be more than 15% but less than20%, the authorization will be conditioned on the bank or banks maintaining a regulatory capital not lower than 10% of their risks-weighted assets for the periodspecified by the Superintendency of Banks, which may not be less than one year. The calculation of the risk-weighted assets is based on a five-category riskclassification system applied to a bank’s assets that is based on the Basel Committee recommendations.
Pursuant to the regulations of the Superintendency of Banks, the following ownership disclosures are required: · a bank is required to inform the Superintendency of Banks of the identity of any person owning, directly or indirectly, 5.0% or more of such banks’
shares; · holders of ADSs must disclose to the Depositary the identity of beneficial owners of ADSs registered under such holders’ names; · the Depositary is required to notify the bank as to the identity of beneficial owners of ADSs which such Depositary has registered and the bank, in turn,
is required to notify the Superintendency of Banks as to the identity of the beneficial owners of the ADSs representing 5.0% or more of such banks’shares; and
· bank shareholders who individually hold 10.0% or more of a bank’s capital stock and who are controlling shareholders must periodically inform the
Superintendency of Banks of their financial condition. Limitations on Types of Activities
Chilean banks can only conduct those activities allowed by the General Banking Law: making loans, accepting deposits and, subject to limitations, makinginvestments and performing financial services. Investments are restricted to real estate for the bank’s own use, gold, foreign exchange and debt securities.Through subsidiaries, banks may also engage in other specific financial service activities such as securities brokerage services, equity investments, securities,mutual fund management, investment fund management, financial advisory and leasing activities. Subject to specific limitations and the prior approval of theSuperintendency of Banks and the Central Bank, Chilean banks may own majority or minority interests in foreign banks.
Since June 1, 2002, Chilean banks are allowed to offer a new checking account product that pays interest. The Superintendency of Banks also stated thatthese accounts may be subject to minimum balance limits and different interest rates depending on average balances held in the account and that banks may alsocharge fees for the use of
34

Table of Contents
this new product. For banks with a solvency score of less than A the Central Bank has also imposed additional caps to the interest rate that can be paid.
On June 5, 2007, pursuant to Law 20.190, new regulations became effective authorizing banks to enter into transactions involving a wider range ofderivatives, such as futures, options, swaps, forwards and other derivative instruments or contracts subject to specific limitations established by the Central Bankof Chile. Previously, banks were able to enter into transactions involving derivatives, but subject to more restrictive guidelines. Deposit Insurance
The Chilean government guarantees up to 90.0% of the principal amount of certain time and demand deposits and savings accounts held by natural personswith a maximum value of UF120 per person (Ch$2,513,146 or US$4,954 as of December 31, 2009) per calendar year in the entire financial system. Reserve Requirements
Deposits are subject to a reserve requirement of 9.0% for demand deposits and 3.6% for time deposits (with terms of less than one year). For purposes ofcalculating the reserve obligation, banks are authorized to deduct daily from their foreign currency denominated liabilities, the balance in foreign currency ofcertain loans and financial investments held outside of Chile, the most relevant of which include: · cash clearance account, which should be deducted from demand deposit for calculating reserve requirement; · certain payment orders issued by pension providers; and · the amount set aside for “technical reserve” (as described below), which can be deducted from reserve requirement.
The Central Bank has statutory authority to require banks to maintain reserves of up to an average of 40.0% for demand deposits and up to 20.0% for timedeposits (irrespective, in each case, of the currency in which they are denominated) to implement monetary policy. In addition, to the extent that the aggregateamount of the following types of liabilities exceeds 2.5 times the amount of a bank’s regulatory capital, a bank must maintain a 100% “technical reserve” againstthem: demand deposits, deposits in checking accounts, or obligations payable on sight incurred in the ordinary course of business, and in general all depositsunconditionally payable immediately. Minimum Capital
Under the General Banking Law, a bank is required to have a minimum of UF800,000 (approximately Ch$16,754 million or US$33.0 million as ofDecember 31, 2009) of paid-in capital and reserves, regulatory capital of at least 8% of its risk weighted assets, net of required allowances, and paid in capitaland reserves of at least 3% of its total assets, net of required allowances.
Regulatory capital is defined as the aggregate of: · a bank’s paid-in capital and reserves, excluding capital attributable to subsidiaries and foreign branches or capital básico; · its subordinated bonds, valued at their placement price (but decreasing by 20.0% for each year during the period commencing six years prior to
maturity), for an amount up to 50.0% of its basic capital; and · its voluntary allowances for loan losses for an amount of up to 1.25% of risk weighted-assets.
Capital Adequacy Requirements
According to the General Banking Law, each bank should have regulatory capital of at least 8.0% of its risk-weighted assets, net of required allowances. Thecalculation of risk weighted assets is based on a five-category risk classification system for bank assets that is based on the Basel Committee recommendations.On 2009, the Superintendency of Banks postponed until 2012 the application of the third pillar of Basel II in Chile, which
35

Table of Contents
includes the implementation of capital limits with market risk and operational risk-weighted assets. These changes must be approved by Congress as it involves amodification to the General Banking Law.
Banks should also have capital básico, or basic capital, of at least 3.0% of their total assets, net of allowances. Basic capital is defined as a bank’s paid-incapital and reserves and is similar to Tier 1 capital except that it does not include net income for the period.
Starting in 2008, banks are able to include net income for the period as basic capital, net of a 30% deduction for minimum dividends accrued.
Within the scope of Basel II in Chile, further changes in regulation may occur. See “Risk Factors—Risks Relating to Chile—Chile’s banking regulatory andcapital markets environment is continually evolving and may change.” Lending Limits
Under the General Banking Law, Chilean banks are subject to certain lending limits, including the following material limits: · A bank may not extend to any entity or individual (or any one group of related entities), except for another financial institution, directly or indirectly,
unsecured credit in an amount that exceeds 10.0% of the bank’s regulatory capital, or in an amount that exceeds 30.0% of its regulatory capital if theexcess over 10.0% is secured by certain assets with a value equal to or higher than such excess. These limits were raised from 5.0% and 25.0%,respectively, in 2007 by the Reformas al Mercado de Capitales II (also known as MK2). In the case of financing infrastructure projects built bygovernment concession, the 10.0% ceiling for unsecured credits is raised to 15.0% if secured by a pledge over the concession, or if granted by two ormore banks or finance companies which have executed a credit agreement with the builder or holder of the concession;
· a bank may not extend loans to another financial institution subject to the General Banking Law in an aggregate amount exceeding 30.0% of its
regulatory capital; · a bank may not directly or indirectly grant a loan whose purpose is to allow an individual or entity to acquire shares of the lender bank; · a bank may not lend, directly or indirectly, to a director or any other person who has the power to act on behalf of the bank; and · a bank may not grant loans to related parties (including holders of more than 1.0% of its shares) on more favorable terms than those generally offered to
non-related parties. Loans granted to related parties are subject to the limitations described in the first bullet point above. In addition, the aggregateamount of loans to related parties may not exceed a bank’s regulatory capital.
In addition, the General Banking Law limits the aggregate amount of loans that a bank may grant to its employees to 1.5% of its regulatory capital, and
provides that no individual employee may receive loans in excess of 10.0% of this 1.5% limit. Notwithstanding these limitations, a bank may grant to each of itsemployees a single residential mortgage loan for personal use once during such employee’s term of employment. Allowance for Loan Losses
Chilean banks are required to provide to the Superintendency of Banks detailed information regarding their loan portfolio on a monthly basis. TheSuperintendency of Banks examines and evaluates each financial institution’s credit management process, including its compliance with the loan classificationguidelines. Banks are classified into four categories: 1, 2, 3 and 4. Each bank’s category depends on the models and methods used by the bank to classify its loanportfolio, as determined by the Superintendency of Banks. Category 1 banks are those banks whose methods and models are satisfactory to the Superintendencyof Banks. Category 1 banks will be entitled to continue using the same methods and models they currently have in place. A bank classified as a category 2 bankwill have to maintain the minimum le vels of reserves established by the Superintendency of Banks while its Board of Directors will be made aware of theproblems detected by the Superintendency of Banks and required to take steps to correct
36

Table of Contents
them. Banks classified as categories 3 and 4 will have to maintain the minimum levels of reserves established by the Superintendency of Banks until they areauthorized by the Superintendency of Banks to do otherwise.
Under our loan classification categories loans are divided into: (i) consumer loans (including loans granted to individuals for the purpose of financing thepurchase of consumer goods or payment of services); (ii) residential mortgage loans (including loans granted to individuals for the purchase, construction orimprovements of residential real estate, in which the value of the property covers at least 100% of the amount of the loan); and (iii) commercial loans (includesall loans other than consumer loans and residential mortgage loans). A detailed description of the models established for determining loan loss allowances is setforth in “Item 5: F. Selected Statistical Information—Classification of Loan Portfolio” and in Note 1 of our Audited Consolidated Financial Statements. New Guidelines of Provisioning Levels for Contingent Loans in 2010
Commencing in January 2010, all Chilean banks will be required by the SBIF to include in the calculation of expected loss and reserve levels, a percentageof off-balance sheet contingent loans. This includes, among others, lines of credit approved but not disbursed, unused credit card lines, stand-by letters of creditand other operations guaranteed by the Bank. As a result, a greater percentage of these assets will be included in the calculation of risk weighted assets. Theimpact of this change was Ch$52,662 million charged against equity as of March 31, 2010. This provision only applies to locally filed financial statements.
Off-balance sheet contingent operations Percentage of total debt outstanding to be included in new riskweightings
Guarantees 50%-100%Lines of credit and unused credit card balances 50%
Stand-by letters of credit 20%
Capital Markets
Under the General Banking Law, banks in Chile may purchase, sell, place, underwrite and act as paying agents with respect to certain debt securities.Likewise, banks in Chile may place and underwrite certain equity securities. Bank subsidiaries may also engage in debt placement and dealing, equity issuanceadvice and securities brokerage, as well as in financial leasing, mutual fund and investment fund administration, investment advisory services and merger andacquisition services. These subsidiaries are regulated by the Superintendency of Banks and, in some cases, also by the Superintendency of Securities andInsurance, the regulator of the Chilean securities market, open-stock corporations and insurance companies. Legal Provisions Regarding Banking Institutions with Economic Difficulties
The General Banking Law provides that if specified adverse circumstances exist at any bank, its Board of Directors must correct the situation within 30 daysfrom the date of receipt of the relevant financial statements. If the Board of Directors is unable to do so, it must call a special shareholders’ meeting to increasethe capital of the bank by the amount necessary to return the bank to financial stability. If the shareholders reject the capital increase, or if it is not effected withinthe term and in the manner agreed to at the meeting, or if the Superintendency of Banks does not approve the Board of Directors’ proposal, the bank will bebarred from increasing its loan portfolio beyond that stated in the financial statements presented to the Board of Directors and from making any furtherinvestments in any instrument other than in instruments issued by the Central Bank. In such a case, or in the event that a bank is unable to make timely paymentin respect of its obligations, or if a bank is under provisional administration of the Superintendency of Banks, the General Banking Law provides that the bankmay receive a two-year term loan from another bank. The terms and conditions of such a loan must be approved by the directors of both banks, as well as by theSuperintendency of Banks, but need not be submitted to the borrowing bank’s shareholders for their approval. In any event, a creditor bank cannot grantinterbank loans to an insolvent bank in an amount exceeding 25.0% of the creditor bank’s regulatory capital. The Board of Directors of a bank that is unable tomake timely payment of its obligations must present a reorganization plan to its creditors in order to capitalize the credits, extend their respective terms, condonedebts or take other measures for the payment of the debts. If the B oard of Directors of a bank submits a reorganization plan to its creditors and such arrangementis approved, all subordinated debt issued by the bank, whether or not matured, will be converted by operation of law into common stock in the amount required
37

Table of Contents
for the ratio of regulatory capital to risk-weighted assets not to be lower than 12.0%. If a bank fails to pay an obligation, it must notify the Superintendency ofBanks, which shall determine if the bank is solvent. Dissolution and Liquidation of Banks
The Superintendency of Banks may establish that a bank should be liquidated for the benefit of its depositors or other creditors when such bank does nothave the necessary solvency to continue its operations. In such case, the Superintendency of Banks must revoke a bank’s authorization to exist and order itsmandatory liquidation, subject to agreement by the Central Bank. The Superintendency of Banks must also revoke a bank’s authorization if the reorganizationplan of such bank has been rejected twice. The resolution by the Superintendency of Banks must state the reason for ordering the liquidation and must name aliquidator, unless the Chilean Superintendency of Banks assumes this responsibility. When a liquidation is declared, all checking accounts and other demanddeposits received in the ordinary cours e of business, are required to be paid by using existing funds of the bank, its deposits with the Central Bank or itsinvestments in instruments that represent its reserves. If these funds are insufficient to pay these obligations, the liquidator may seize the rest of the bank’s assets,as needed. If necessary and in specified circumstances, the Central Bank will lend the bank the funds necessary to pay these obligations. Any such loans arepreferential to any claims of other creditors of the liquidated bank. Obligations Denominated in Foreign Currencies
Foreign currency denominated obligations of Chilean banks are subject to various limits and obligations. The regulations of the Central Bank do not permitthe difference, whether positive or negative, between a bank’s assets and liabilities denominated in any foreign currency (including assets and liabilitiesdenominated in U.S. dollars but payable in pesos, as well as those denominated in pesos and indexed to the U.S. dollar exchange rate) to exceed 20% of thebank’s paid-in capital and reserves; except in the case where the balance of such assets exceeds the balance of such liabilities and the excess difference does notexceed the bank’s allowances and reserves denominated in such foreign currency (excluding profits to be remitted abroad). Santander-Chile must also complywith various regulatory and internal limits regarding exposure to movements in foreign exchange rates (See “Item 11: Quantitative and Qualitative DisclosuresAbout Market Risks”). Investments in Foreign Securities
Under current Chilean banking regulations, banks in Chile may grant loans to foreign individuals and entities and invest in certain securities of foreignissuers. Chilean banks may only invest in equity securities of foreign banks and certain other foreign companies which may be affiliates of the bank or whichwould be complementary to the bank’s business if such companies were incorporated in Chile. Banks in Chile may also invest in debt securities traded in formalsecondary markets. Such debt securities must be (1) securities issued or guaranteed by foreign sovereign states or their central banks or other foreign orinternational financial entities, and (2) bonds issued by foreign companies. A bank may invest up to 5% of its regulatory capital in securities of foreign issuers.Such securities must have a minimu m rating as follows.
Table 1 Rating Agency Short Term Long TermMoody’s P2 Baa3Standard and Poor’s A3 BBB-Fitch F2 BBB-Duff & Phelps D2 BBB-
In the event that the sum of the investments in foreign securities which have a: (i) rating that is below that indicated in Table 1 above, but is equal to orexceeds the ratings mentioned in the Table 2 below; and (ii) loans granted to other entities resident abroad exceed 20% (and 30% for banks with a BIS ratio equalor exceeding 10%) of the regulatory capital of such bank, the excess is subject to a mandatory reserve of 100%.
38

Table of Contents
Table 2
Rating Agency Short Term Long TermMoody’s P2 Ba3Standard and Poor’s A3 BB-Fitch F2 BB-Duff & Phelps D2 BB-
In addition, banks may invest in foreign securities for an additional amount equal to a 70% of their regulatory capital which ratings are equal or exceedsthose mentioned in the following Table 3. This limit constitutes an additional margin and it is not subject to the 100% mandatory reserve.
Additionally, a Chilean Bank may invest in foreign securities whose rating is equal to or exceeds those mentioned in the following Table 3 in: (i) termdeposits with foreign banks; and (ii) securities issued or guaranteed by sovereign states or their central banks or those securities issued or guaranteed by foreignentities within the Chilean State; such investment will be subject to the limits by issuer up to 30% and 50%, respectively, of the regulatory capital of the Chileanbank that makes the investment.
Table 3 Rating Agency Short Term Long TermMoody’s P1 Aa3Standard and Poor’s A1+ AA-Fitch F1+ AA-Duff & Phelps D1+ AA-
Chilean banks may invest in securities without ratings issued or guaranteed by sovereign states or their central banks and structured notes issued byinvestment banks with a rating equal to or above that in the immediately preceding Table 3, which return is linked with a corporate or sovereign note with arating equal to or above that in Table 2.
Subject to specific conditions, a bank may grant loans in U.S. dollars to subsidiaries or branches of Chilean companies located abroad, to companies listedon foreign stock exchanges authorized by the Central Bank and, in general, to individuals and entities domiciled abroad, as long as the Central Bank is keptinformed of such activities. New regulations for the financial markets
Further new regulations governing the Chilean capital markets are being discussed. Chile’s Congress passed a new bill on June 1, 2010 (known as MK3) thataims to increase trading in Chile, Latin America’s third-biggest securities market, by allowing new instruments such as exchange-traded funds and coveredbonds. The Chamber of Deputies, Chile’s lower house, voted in favor of the bill, which also seeks to ease credit access for consumers and small companies. Themeasures will make it easier for foreign banks to offer loans in Chile, cut securitization costs and allow banks to sell bonds backed by mortgages. The new lawwill also offer tax breaks to foreign investors in Chilean mutual funds. The bill also aims to reduce the cost of setting up mutual funds and create an exchange-traded funds industry by modifying mutual fund rules to allow secondary trading and enable pension funds to invest in them. The new law also removes limits onemploying non-Chileans that may have prevented overseas fund managers from opening offices in Chile. It also strikes down a law that prevented foreign banksfrom advertising loans. The new class of bonds, known as “mortgage bonds,” will be debt backed by the company that sells them as well as by a pool ofmortgages, as in European covered bonds. Unlike covered bonds, they may be issued by non-banks as well as banks.
The current Finance Minister, Felipe Larrain, plans another package of reforms known as MKB (Reformas al Mercado Financiero Bicentenario). The MKBis comprised of a series of administrative changes and new regulations over the next four years. The reforms include the creation of a financial consumerprotection agency, the transformation of the local securities exchange regulator (SVS) into a securities commission and giving more autonomy to the SBIF. Thenew regulations would also aim to expand the use of the Chilean peso and simplify taxes on fixed-income securities. The proposed legislation would also includemeasures to increase bank penetration and household savings. The reforms also aim to create new instruments that give more efficient financing alternatives to
39

Table of Contents
small and mid-sized companies and individuals, together with creating specific statutes for niche banks and micro credit financing. The proposed legislationwould also reduce the pro-cyclicality of loan loss provisions and seek to enhance solvency and liquidity (the latter must be done through a change in the GeneralBanking Law).
U.S. Anti-Money Laundering, Anti-Terrorist Financing, and Foreign Corrupt Practices Act Regulations
The Bank, as a foreign private issuer whose securities are registered under the U.S. Securities Exchange Act of 1934, is subject to the U.S. Foreign CorruptPractices Act (the “FCPA”). The FCPA generally prohibits such issuers and their directors, officers, employees and agents from using any means orinstrumentality of U.S. interstate commerce in furtherance of any offer or payment of money to any foreign official or political party for the purpose ofinfluencing a decision of such person in order to obtain or retain business. It also requires that the issuer maintain books and records and a system of internalaccounting controls sufficient to provide reasonable assurance that accountability of assets is maintained and accurate financial statements can be prepared.Penalties, fines and imprisonm ent of the Bank’s officers and/or directors can be imposed for violations of the FCPA.
Furthermore, the Bank is subject to a variety of U.S. anti-money laundering and anti-terrorist financing laws and regulations, such as the Bank Secrecy Actof 1970, as amended, and the USA PATRIOT ACT of 2001, as amended, and a violation of such laws and regulations may result in substantial penalties, finesand imprisonment of the Bank’s officers and/or directors. D. Property, Plants and Equipment
We are domiciled in Chile and own our principal executive offices located at Bandera 140, Santiago, Chile. We also own ten other buildings in the vicinityof our headquarters and we rent five other buildings. At December 31, 2009, we owned the locations at which 33.5% of our branches were located. Theremaining branches operate at rented locations. We believe that our existing physical facilities are adequate for our needs.
The Bank’s branches, systems and employees were all impacted by the recent earthquake. Of the Bank’s 498 branches, 405 had some form of damage, ofwhich 32 sustained serious damages and 9 were closed as of May 31, 2010. Of the Bank’s 1,856 all were operating normally as of May 31, 2010. The Bank’ssystems were not functioning immediately following the earthquake, but by March 1, 2010 the systems were functioning normally, all open branches were onlineand all remote channels were operating normally. The Bank expects additional administrative expenses from the earthquake, net of insurance proceeds,recognized in 2010 to be US$6 million. Main properties as of December 31, 2009 Number Central Offices Own 10 Rented 5 Total 15 Branches (1) Own 167 Rented 245 Total 412 Other property (2) Own 62 Rented 6 Total 68
(1) Some branches are located inside central office buildings and other properties. Including these branches the total number of branches is 498. Specialpayment centers are included in Other property.
(2) Consists mainly of parking lots, mini-branches and property owned by our subsidiaries.
40

Table of Contents
The following table sets forth a summary of the main computer hardware and other systems-equipment that we own.
Category Brand ApplicationMainframe IBM Back-end, Core-System Altair, Payment means and foreign trade.Midrange IBM Interconnections between Mainframe and mid-rangeMidrange SUN/Unix
SUN/UNIXInterconnections applications Credit & debit cardsTreasury, MIS, Work Flow, Accounting
Midrange IBM WEBDesktop IBM/HP/Lenovo Platform applicationsCall Center Avaya
GenesysNicePeriphonics
Telephone systemIntegration Voice/dataVoice recorderIVR
The main software systems that we use are:
Category Product OriginCore-System ALTAMIRA AccentureData base DB2 IBMData base Oracle OracleData base SQL Server MicrosoftWEB Service Internet Information Server MicrosoftMessage Service MQSeries IBMTransformation MQIntegrator IBM
ITEM 4A. UNRESOLVED STAFF COMMENTS
As of the date of the filing of this Annual Report on 20-F, we do not have any unresolved comments from the U.S. Securities and Exchange Commission.
41

Table of Contents
ITEM 5. OPERATING AND FINANCIAL REVIEW AND PROSPECTS A. Accounting Standards Applied in 2009
Santander-Chile is a Chilean bank and maintains its financial books and records in Chilean pesos and prepares its consolidated financial statements inaccordance with International Financial Reporting Standards (“IFRS”) issued by the International Accounting Standards Board (“IASB”), in order to complywith requirements of the Securities and Exchange Commission (the “SEC”).
As required by local regulations, our locally filed consolidated financial statements have been prepared in accordance with accounting principles issued bythe Superintendency of Banks and Financial Institutions (the “SBIF”). The accounting principles issued by the SBIF are substantially similar to IFRS but thereare some exceptions. Therefore, our locally filed consolidated financial statements have been adjusted according to IFRS 1: First Time Adoption of InternationalFinancial Reporting Standards (see Note 2 to our audited consolidated financial statements attached to this Annual Report).
In Chile, the local securities exchange regulator (SVS) announced in 2004 that all public companies will be required to present full IFRS financialstatements beginning in 2009. The convergence from local accounting regulations to IFRS is to follow a gradual adoption plan which will take place over at leasta three-year period from 2009 to 2011, beginning with banking institutions in 2009. Full convergence is the intended goal of the transition to IFRS. However,due to the gradual approach to the adoption of IFRS and because not all regulators require full IFRS, different accounting frameworks will coexist for a period oftime.
Chilean banks are subject to the regulatory supervision of the SBIF under the provisions of the General Banking Act (“Act”) of 1997. The Act establishesthat in accordance with legal regulations, Chilean banks must abide by the accounting standards stipulated by the SBIF.
The SBIF, by means of Circular No. 3,410 (2007) and Circular No. 3,443 (2008) announced the “Compendium of Accounting Standards”, which containsnew accounting standards and reporting formats for the financial industry required to be adopted by banking institutions effective January 1, 2009. Banks arerequired to apply the new accounting and reporting to the current period financial statements for 2009 and to retrospectively apply the new standard to January 1,2008 and include an opening balance sheet for the reporting period ended December 31, 2008.
Although banks are required to apply IFRS as of January 1, 2009, certain exceptions introduced by the SBIF prevent the banks from achieving fullconvergence with IFRS. In those situations which are not addressed by the guidance issued by the SBIF, institutions shall follow the generally acceptedaccounting principles issued by the Association of Chilean Accountants which coincide with IFRS as issued by the IASB (“IFRS-IASB”).
Therefore, as stated above, in order to comply with requirements of the SEC, the Bank has prepared the consolidated financial statements included in thisAnnual Report under IFRS-IASB.
Santander-Chile’s transition date to IFRS is January 1, 2008. The Bank prepared its opening balance under these standards as of such date. Consequently,the date of adoption of the new standards by the Bank and its subsidiaries is January 1, 2009.
Note 2 to our consolidated financial statements, “First time adoption of International Financial Reporting Standards”, provides a reconciliation between thebalances of the Consolidated Statement of Financial Position at the opening and closing of the year ending December 31, 2008 and the correspondingConsolidated Statement of Income, Consolidated Statement of Comprehensive Income and Consolidated Statement of Cash Flows generated during suchyear. Therefore, the figures shown in the Bank’s financial statements for 2008, included in the attached financial statements, differ from those reported in theprevious year, which were prepared under the previous accounting standards.
The notes to the audited consolidated financial statements contain information in addition to that presented in the Consolidated Statement of FinancialPosition, Consolidated Statement of Income, Consolidated Statement of Comprehensive Income, Consolidated Statement of Changes in Equity and ConsolidatedStatement of Cash Flows. These notes provide a narrative description of such statements.
42

Table of Contents
The financial statements for the period ending as of December 31, 2009 were the first prepared according to IFRS. This change incorporates the following
important aspects: - Significant changes in accounting policies, valuation criteria, and forms of presentation of financial statements.
- A significant increase in the information included in the notes to the financial statements.
The following is a description of the nature of the principal effects or adjustments arising from the first time adoption of IFRS:
Financial Statements—Consolidation Requirements
The consolidation/valuation methods used up to December 31, 2008 under previous accounting standards have continued to be used for subsidiaries andinvestments in other companies. Furthermore, pursuant to the provisions of International Accounting Standard (IAS) 27 and Standard Interpretations Committee(SIC) 12, the Bank must determine the existence of Special Purpose Entities (SPE), which must be consolidated with the financial results of the Bank. As aresult, we have incorporated into our financial statements the following companies: -Santander Gestión de Recaudación y Cobranzas Ltda. (collection services)-Multinegocios S.A. (management of sales force)-Servicios Administrativos y Financieros Ltda. (management of sales force)-Fiscalex Ltda. (collection services)-Multiservicios de Negocios Ltda. (call center)-Bansa Santander S.A. (management of repossessed assets and leasing of properties)
Investments in other companies
The effects generated by adopting IFRS on each of the companies in which we have investments consolidated by the equity method are reflected in this itembased on the percentage of these companies’ equity that is held by us.
Price level restatement
Pursuant to IAS 29 “Financial Information in Hyperinflationary Economies,” a price level restatement will henceforth be applied only when the entity whosefunctional currency is that of a hyperinflationary economy (defined as an economy experiencing 100 percentage points of inflation in 3 years). The Bank’sfunctional currency is the Chilean peso. Since the Chilean economy does not meet the aforementioned requirements, the Bank was required to eliminate the pricelevel restatement as of January 1, 2008. Pursuant to the use of exceptions permitted or required by IFRS 1, the price level restatement applied up to December31, 2007 was not reversed.
Property, plant and equipment and intangible assets
The main effects of the recalculation of depreciation and amortization of intangible assets (software and information technology developments) andproperty, plant and equipment as a result of the elimination of the price-level restatement (as described above) and the determination of the cost of property, plantand equipment on January 01, 2008 are included.
In accordance with IFRS 1, a first-time adopter may elect to use a revaluation pursuant to previous accounting standards of an item of property, plant andequipment at, or before, the date of transition to IFRS at deemed cost at the date of the revaluation, if the revaluation was, at the date of the revaluation, broadlycomparable to: (i) fair value; or (ii) cost or depreciated cost in accordance with IFRS. The Bank has elected to revalue certain items of property, plant andequipment at its fair value and use that fair value at its deemed cost. For the remaining items of property, plant and equipment, it has used the depreciated costfor revaluation pursuant to previous accounting standards as its deemed cost.
Assets received in lieu of payment
Previously, assets received in lieu of payment (“ARP”) were valued at cost (the price agreed upon with the debtor for the transfer in payment or the valuedetermined at a judicial auction, as the case may be, after price-level restatement), minus a provision for individual valuation based on an independent appraisal.
43

Table of Contents
The most important change in the valuation of ARP in IFRS (in addition to the elimination of the price-level restatement as described previously) is that,
when making the provision for initial valuation, it is necessary to take into account its net realizable value, i.e., its fair value (independent appraised value),minus the necessary costs of maintaining and divesting it.
According to studies performed by the Bank, an average cost of sale (the cost of maintaining and divesting the good) estimated at 5.8% of the appraisedvalue was determined as of January 1, 2008; such cost rose to 6.5% as of December 31, 2008.
The effects generated by the application of the cost of sale described above are presented in this item.
Charge-offs
Under previous accounting standards, the term for charging off (or impairment loss on loans) past-due and late installments on credits and accountsreceivable was calculated from the time of their classification in the past-due portfolio, which represented loans in arrears for payment of principal and interestby ninety days or more. This method was realized previously on a scheduled payment by payment basis.
Under IAS 39 “Financial Instruments: Recognition and Measurement” an impairment loss of a financial asset or a group of financial assets is recognized if,and only if , objective evidence of impairment as a result of one or more events that occurred after initial recognition of the asset (a loss event), and that loss (orevents) has an impact on the estimated future cash flows of a financial asset or group of financial assets that can be reliably estimated. It may not be possible toidentify a single event that caused the impairment. According to this definition, the impairment is determined for each loan by considering its total amount andno longer on a scheduled payment by payment basis as under previous accounting standards.
An impairment relating to a loan is calculated as the difference between the recorded asset’s carrying value and the present value of estimated future cashflows, discounted at the effective interest rate.
Individually significant financial assets are individually tested to determine their impairment. All impairments are recorded in the Consolidated Statementof Income.
The Bank has recognized the effects arising from the application of IFRS for charge-offs of loans and accounts receivable, as well as the associated effectcaused in the allowances established for each transaction (when 100% of the transaction was charged-off, the related allowances were released).
Deferred taxes
This item brings together the tax effects (deferred taxes) generated by the timing differences arising, in turn, out of the aforementioned adjustments, whetherthey apply directly to shareholders' equity or to income. B. First time adoption of International Financial Reporting Standards (IFRS)
The transition of the consolidated financial statements of the Bank to IFRS has been carried out through the application of IFRS 1: First time adoption ofInternational Financial Reporting Standards, applying the exemption provided by this standard.
The Bank has applied the following exemptions as permitted by IFRS 1:
i. Business Combinations
The Bank has applied the exemption provided under IFRS 1 for business combinations, and, therefore, did not apply IFRS 3, Business Combinationsretrospectively to those business combinations that occurred prior to the transition date of January 1, 2008.
44

Table of Contents
ii. Value or revaluations as deemed cost
The Bank elected to measure certain items of property, plant and equipment at the date of transition at their fair value and use that fair value as their deemed
cost at that date. Likewise, the Bank decided to measure the other items of property, plant and equipment at their price-level restated cost as of January 1, 2008. C. Other Critical Accounting Policies
Our consolidated financial statements include various estimates and assumptions, including but not limited to the adequacy of the allowance for loan losses,estimates of the fair value of certain financial instruments, the selection of useful lives of certain assets and the valuation and recoverability of goodwill. Weevaluate these estimates and assumptions on an ongoing basis. Management bases its estimates and assumptions on historical experience and on various otherfactors that it believes to be reasonable under the circumstances. Actual results in future periods could differ from those estimates and assumptions, and if thesedifferences were significant enough, our reported results of operations would be affected materially. We believe that the following are the more critical judgmentareas or involve a higher de gree of complexity in the application of the accounting policies that currently affect our financial condition and results of operations.
Derivative activities
As of December 31, 2008 and 2009, derivatives are valued at market price on the balance sheet and the net unrealized gain (loss) on derivatives is classifiedas a separate line item on the income statement. In prior periods, the notional amounts were carried off the balance sheet.
Pursuant to the new accounting standards, banks must mark-to-market derivatives. A derivative financial instrument held for trading purposes must bemarked to market and the unrealized gain or loss recognized in the income statement. The Superintendency of Banks recognizes three kinds of hedge accounting:(i) cash flow hedges, (ii) fair value hedges and (iii) hedging of foreign investments. · When a cash flow hedge exists, the fair value movements on the part of the hedging instrument that is effective are recognized in equity. Any ineffective
portion of the fair value movement on the hedging instrument is recognized in the income statement. · When a fair value hedge exists, the fair value movements on the hedging instrument and the corresponding fair value movements on the hedged item are
recognized in the income statement. Hedged items in the balance sheet are presented at their market value since 2006. · When a hedge of foreign investment exposure exists (i.e., investment in a foreign branch), the fair value movements on the part of the hedging
instrument that is effective are recognized in equity. Any ineffective portion of the fair value movement on the hedging instrument is recognized in theincome statement.
Allowance for loan losses
The Bank maintains loan loss allowances in amounts determined in accordance with its internal models. These models for rating and evaluating credit risk
are approved by the Bank’s Board of Directors. Our credit scoring system considers both the length of time by which the loan is overdue and the borrower’s riskprofile, which includes the borrower’s overall indebtedness and credit behavior under the borrower’s obligations to third parties. (See “Item 5: F. SelectedStatistical Information—Loan Portfolio—Classification of Loan Portfolio.”
Our internal provisioning models use statistical models that take into account a borrower’s credit history and indebtedness levels. Group ratings thatdetermine loan loss allowances based only on non-performance are being phased out and replaced by statistical scoring systems. Large commercial loans arerated on an individual basis. For large commercial loans, leasing and factoring, we assign a risk category level to each borrower and its respective loans. Weconsider the following risk factors in classifying a borrower’s risk category: (i) the borrower’s industry or sector, (ii) owners or managers, (iii) financialcondition, (iv) payment ability and (v) payment behavior. For a detailed description of the models we use to determine loan loss allowances for commercialloans. See “Item 5: F. Selec ted Statistical Information—Loan Portfolio—Classification of Loan Portfolio—Allowances for large commercial loans.” Groupassessment for loan loss allowances is applied for a large number of borrowers whose individual loan amounts are relatively insignificant. Currently, we usegroup analysis to determine loan loss
45

Table of Contents
allowances for certain types of loans, such as loans to small- and mid-sized companies and commercial loans to individuals. (See “Item 5: F. Selected StatisticalInformation—Loan Portfolio—Classification of Loan Portfolio—Allowances for group evaluations on small- and mid-sized commercial loans.”) D. Operating Results Chilean Economy
All of our operations and substantially all of our customers are located in Chile. Accordingly, our financial condition and results of operations aresubstantially dependent upon economic conditions prevailing in this country. In the first half of 2009, the Chilean economy continued to feel the effects of theglobal financial crisis while in the second half of the year economic growth began to gather momentum. As a result, for the full year 2009, GDP contracted 1.4%compared to an increase of 3.4% in 2008. In 1Q10, the economy contracted 1.5% mainly due to the impacts of the earthquake that occurred in February 2010.
Quarterly and Yearly Evolution of GDP, %
The decline in the Chilean economy in 2009 was due in part to the fall in the average prices of Chile’s main exports. The average price of copper in 2009 fell
28% compared to the average price in 2008. In the same period, the average price of fish meal increased 1.7% and average paper pulp prices decreased 29.2%.This led to a 20.2% decrease in total exports which totaled US$53.0 billion in 2009 compared to US$66.5 billion in 2008. The recovery of the Chilean economyin the second half was led in part by a recovery of the prices of Chile’s main exports. The year-end price of copper increased 126.7%, fish meal increased 46%and paper pulp prices rose 19.4% compared to the year-end price of these products in 2008.
Evolution of Prices of Chile’s Main Exports (Base 100 = Dec. 2007)
Source: Banco Central de Chile
46

Table of Contents
The global economic crisis also affected domestic demand levels (investment and consumption) in 2009. Total investment in 2009 decreased 33.3% andprivate sector consumption increased 0.2%. This was partially offset by an 8.2% rise in government spending levels as the government used part of the sovereignfunds accumulated in previous years. At year-end 2009 the Chilean government still had US$17 billion in sovereign funds and the Chilean Central Bank hadreserves of US$26.2 billion. The general decline in domestic demand had a negative impact on unemployment, which averaged 9.9% in 2009 compared to 9.6%compared to 7.7% in 2008.
The CPI reversed the upward trend seen in 2008 and prices fell in 2009. CPI deflation reached 1.4% in 2009 compared to a 7.1% rise in prices in 2008. As aresult of the contraction of price levels and lower economic activity, interest rates declined in 2009. The overnight interbank rate set by the Central Bank waslowered by 750 basis points in 2009 and is currently at 1.0%. Despite this deflation, the Chilean peso appreciated in 2009 as the value of the dollar weakenedworldwide. As of December 31, 2009, the Chilean peso had appreciated 19.5% against the dollar since year-end 2008.
Central Bank Reference Rate, %
Source: Banco Central de Chile
Banking Sector
The Chilean banking sector also evolved in line with the economic developments during 2009 with a reduction in the volume of loan growth as result of theeconomic slowdown and an increase in disintermediation among large corporate clients through the local bond market. Total loans as of December 31, 2009 inthe Chilean financial system were Ch$68,938,045 million (US$136 billion), a decrease of 1.9% compared to the balance of loans as of December 31,2008. Total customer funds defined as time deposits plus checking accounts plus mutual funds totaled Ch$75,929,201 million (US$150 billion) as of December31, 2009, an increase of 5.0% compared to year-end 2008. The table below demonstrates the deterioration of asset quality in the Chilean financial system wasobservable as a result of the e conomic slowdown from 2008 to 2009:
47

Table of Contents
Evolution of expected loan loss ratio*
* Expected loss divided by Total loans. Expected loss = Loan loss reserves / Total loans. Source: Superintendency of Banks
Earthquake
On February 27, 2010, Chile was struck by an 8.8 magnitude earthquake, which mainly affected the mid-southern regions of Chile. As a result of thesedevelopments, economic activity in Chile could be adversely affected in 2010. We also expect the economy and banking activity generally and our results ofoperations specifically in 2010 to be adversely affected. We may experience any or all of the following: · deterioration of our asset quality and an increase in our provision expense; · lower fee growth or fee decreases due to lower consumer expenditure and usage of bank products; · higher net interest margins as a result of higher inflation; and · uncertainty in our loan growth as some sectors will be negatively affected while others will be positively affected by the temblor. Impact of Inflation
Our assets and liabilities are denominated in Chilean pesos, Unidades de Fomento (UF) and foreign currencies. The Bank no longer performs inflationaccounting and has eliminated price level restatement in line with IFRS, but inflation impacts our results of operations as some loan and deposit products arecontracted in UF. The UF is revalued in monthly cycles. Each day in the period beginning on the tenth day of the current month through the ninth day of thesucceeding month, the nominal peso value of the UF is indexed up (or down in the event of deflation) in order to reflect a proportionate amount of the change inthe Chilean Consumer Price Index during the prior calendar month. One UF equaled Ch$21,452.57 at December 31, 2008 and Ch$20,942.88 at December 31,2009. High levels of inflation in Chile could a dversely affect the Chilean economy and have an adverse effect on our business, financial condition and results ofoperations. Negative inflation rates also negatively impact our results. In 2009, CPI deflation reached 1.6% compared to a rise of 7.1% and 7.8% in 2008 and2007, respectively. There can be no assurance that Chilean inflation will not change significantly from the current level. Although we currently benefit frommoderate levels of inflation, due to the current structure of our assets and liabilities (i.e., a significant portion of our loans are indexed to the inflation rate, butthere are no corresponding features in deposits or other funding sources that would increase the size of our funding base), there can be no assurance that ourbusiness, financial condition and result of operations in the future will not be adversely affected by changing levels of inflation. In summary:
48

Table of Contents
· UF-denominated assets and liabilities. In 2009, UF inflation was -2.4% compared to +9.3% in 2008. The effect of any changes in the nominal peso
value of our UF-denominated interest earning assets and interest bearing liabilities is reflected in our results of operations as an increase (or decrease, inthe event of deflation) in interest income and expense, respectively. Our net interest income will be positively affected by an inflationary environmentto the extent that our average UF-denominated interest earning assets exceed our average UF-denominated interest bearing liabilities. Our net interestincome will be negatively affected in a deflationary environment if our average UF-denominated interest earning assets exceed our average UF-denominated interest bearing liabilities. Our net interest income will be negatively affected by inflation in any period in which our average UF-denominated interest bearing liabilities exceed our average UF-denominated interest earning assets. Our average UF-denominated interest earning assetsexceeded our average UF-denominated interest bearing liabilities by Ch$2,689,614 million in 2009 compared to Ch$2,439,563 million in 2008. See“Selected Statistical Information at and for the Years Ended December 31, 2009 and 2008―Average Balance Sheets, Income Earned from Interest-Earning Assets And Interest Paid on Interest Bearing Liabilities.” In general, the Bank has more UF-denominated financial assets than UF-denominatedfinancial liabilities. In the year ended December 31, 2009, the interest gained on interest earning assets denominated in UF decreased 77.3% comparedto 2008 as a result of the deflation rates in 2009 compared to 2008. The interest paid on these liabiliti es decreased by 90.3% during this period.
· Inflation and interest rate hedge. A key component of our asset and liability policy is the management of interest rate risk. The Bank’s assets generallyhave a longer maturity than our liabilities. As the Bank’s mortgage portfolio grows, the maturity gap tends to rise as these loans, which are contracted inUF, have a longer maturity than the average maturity of our funding base. As most of our long term financial instruments and mortgage loans arecontracted in UF and most of our deposits are in nominal pesos, the rise in mortgage lending increases the Bank’s exposure to inflation and to interestrate risk. The size of this gap is limited by internal and regulatory guidelines in order to avoid excessive potential losses due to strong shifts in interestrates (see “Ite m 11: Quantitative and Qualitative Disclosures About Market Risk”). In order to keep this duration gap below regulatory limits the Bankissues long term bonds denominated in UF or interest rate swaps. The financial cost of the bonds and the efficient part of these hedges is recorded as netinterest income. In 2009, the gain from the swaps taken in order to hedge mainly for inflation and interest rate risk totaled Ch$24,988 million comparedto a financial cost of Ch$53,956 million in 2008. The gain in 2009 compared to a negative result in 2008 was a direct result of the deflation rate in2009.
As of December 31, % Change
Inflation sensitive income 2009 2008 2009/2008 (In million of Chilean pesos) Interest gained on UF assets(1) 224,614 990,430 (77.3%)Interest paid on UF liabilities(1) (67,559) (694,758) (90.3%)Hedging results 24,988 (53,956) (146.3%)Net gain 182,043 241,716 (24.7%)
(1) Excludes results from hedging · Peso-denominated assets and liabilities. Interest rates prevailing in Chile during any period primarily reflect the inflation rate during the period and the
expectations of future inflation. The sensitivity of our peso-denominated interest earning assets and interest bearing liabilities to changes to suchprevailing rates varies. (See “Item 5: D. Operating Results—Interest Rates”). We maintain a substantial amount of non-interest bearing peso-denominated demand deposits. Because such deposits are not sensitive to inflation, any decline in the rate of inflation would adversely affect our netinterest margin on inflation indexed assets funded with such deposits, and any increase in the rate of inflation would increase the net interest margin onsuch assets. (See “Item 11: Quantitative and Qualitative Disclosures About Market Risk” in our 2008 20-F). The ratio of the average of such demanddeposits to average interest-earning assets was 15.66% and 15.12% for the years ended December 31, 2008 and 2009, respectively.
49

Table of Contents
Interest Rates
Interest rates earned and paid on our assets and liabilities reflect, to a certain degree, inflation, expectations regarding inflation, changes in short term interestrates set by the Central Bank and movements in long term real rates. The Central Bank manages short term interest rates based on its objectives of balancing lowinflation and economic growth. Because our liabilities generally reprice sooner than our assets, changes in the rate of inflation or short term rates in the economyare reflected in the rates of interest paid by us on our liabilities before such changes are reflected in the rates of interest earned by us on our assets. Therefore,when short term interest rates fall, our net interest margin is positively impacted, but when short term rates increase, our interest margin is negatively affected. Atth e same time, our net interest margin tends to be adversely affected in the short term by a decrease in inflation rates since generally our UF-denominated assetsexceed our UF-denominated liabilities. (See “Item 5: C. Operating Results—Impact of Inflation—Peso-denominated Assets and Liabilities”). An increase inlong term rates has a positive effect on our net interest margin, because our interest earning assets generally have longer terms than our interest bearing liabilities.In addition, because our peso-denominated liabilities have relatively short repricing periods, they are generally more responsive to changes in inflation or shortterm rates than our UF-denominated liabilities. As a result, during periods when current inflation or expected inflation exceeds the previous period’s inflation,customers often switch funds from UF-denominated deposits to peso-denominated deposits, which generally bear higher interest rates, thereby adverselyaffecting our net interest margin. Foreign Exchange Fluctuations
The Chilean government’s economic policies and any future changes in the value of the Chilean peso against the U.S. dollar could adversely affect ourfinancial condition and results of operations. The Chilean peso has been subject to significant devaluation in the past and may be subject to significantfluctuations in the future. In 2009, the Chilean peso in relation to the U.S. dollar appreciated 19.5% compared to a 26.9% depreciation in 2008. (See “Item 3: A.Selected Financial Data—Exchange Rates”). A significant portion of our assets and liabilities are denominated in foreign currencies, principally the U.S. dollar,and we historically have maintained and may continue to maintain material gaps between the balances of such assets and liabilities. Because such assets andliabilities, as well a s interest earned or paid on such assets and liabilities, and gains and losses realized upon the sale of such assets, are translated to Chileanpesos in preparing our financial statements, our reported income is affected by changes in the value of the Chilean peso relative to foreign currencies (principallythe U.S. dollar). The translation gain or loss over assets and liabilities (excluding derivatives held for trading) is included as foreign exchange transactions in theincome statement. The translation and mark-to-market of foreign currency derivatives held for trading is recognized as a gain or loss in the net results frommark-to-market and trading.
The Bank also uses a sensitivity analysis both internal limits and according to regulatory limits to minimize the potential loss in net interest income resultingfrom fluctuations of interest rates on U.S. dollar denominated assets and liabilities and a VaR model to limit foreign currency trading risk (see “Item 11:Quantitative and Qualitative Disclosures About Market Risk”). Results of Operations for the Years Ended December 31, 2008 and 2009
The following discussion is based upon and should be read in conjunction with the Audited Consolidated Financial Statements. The Audited ConsolidatedFinancial Statements have been prepared in accordance with IFRS. The following table sets forth the principal components of our net income for the years endedDecember 31, 2008 and 2009.
50

Table of Contents 2009 2009 2008
CONSOLIDATED INCOME STATEMENT DATA US$ ths.(1) Ch$ million of constant pesos % Change2009 /2008
IFRS: Interest income and expense Interest income 2,381,031 1,207,778 2,061,346 (41.4%)Interest expense (692,483) (351,262) (1,169,280) (70.0%)
Net interest income 1,688,548 856,516 892,066 (4.0%)Fees and income from services
Fees and commission income 622,819 315,925 295,969 6.7%Fees and commission expense (121,824) (61,795) (52,840) 16.9%
Total net fees and commission income 500,995 254,130 243,129 4.5%Other operating income
Net income from financial operations 7,663 3,887 273,477 (98.6%)Foreign exchange profit (loss), net 321,816 163,241 (187,042) (187.3%)
Financial transactions, net 329,479 167,128 86,435 93.4%Other operating income 50,993 25,866 10,896 137.4%
Total other operating income 380,472 192,994 97,331 98.3%Total operating income 2,570,015 1,303,640 1,232,526 5.8%Provision for loan losses (658,151) (333,847) (287,983) 15.9%Operating income, net of provisions 1,911,864 969,793 944,543 2.7%Operating expenses
Personnel salaries and expenses (442,551) (224,484) (246,775) (9.0%)Administrative expenses (269,516) (136,712) (133,682) 2.3%Depreciation and amortization (91,913) (46,623) (47,627) (2.1%)Impairment (148) (75) (84) (10.7%)Other operating expenses (72,276) (36,662) (36,298) 1.0%
Total operating expenses (876,404) (444,556) (464,466) (4.3%)Net Operating income 1,035,460 525,237 480,077 9.4%Other non-operating results
Income from investments in other companies 586 297 632 (53.0%)Total other non-operating results 586 297 632 (53.0%)
Income before tax 1,036,046 525,534 480,709 9.3%Income tax (175,306) (88,924) (59,742) 48.8 Net income 860,740 436,610 420,967 3.7 Net income attributable to: Equity holders of the Bank 850,778 431,557 413,370 4.4 Minority interest 9,962 5,053 7,597 (33.5%)
(1) Amounts stated in U.S. dollars at and for the year ended December 31, 2009, have been translated from Chilean pesos at the exchange rate of Ch$507.25 =US$1.00 as of December 31, 2009. See “Item 3: A. Selected Financial Data—Exchange Rates” for more information on exchange rate.
Net income for the year ended December 31, 2009, increased 3.7% to Ch$436,610 million. Net income attributable to equity holders of the Bank in the same
period increased 4.4% to Ch$431,557 million. Our return on average equity was 27.4% in 2009 compared to 32.7% in 2008.
Total operating income was Ch$1,303,640 million in 2009, an increase of 5.8% compared to the corresponding period in 2008. Our net interest incomedecreased by 4.0% to Ch$856,516 million. The average balance of our interest-earning assets increased by 3.7% in 2009 compared to 2008. Our net interestmargin decreased 40 basis points to 5.3% in 2009 due to the negative effects of deflation over margins.
Interest income decreased by 41.4% to Ch$1,207.8 billion, reflecting a 43.5% decline in the average rate of interest earned on interest earning assets, offsetin part by a 3.7% increase in average interest earning assets. As
51

Table of Contents
discussed in further detail below, the decline in the average rate of interest earned resulted from steep declines in market rates of interest and the effect ofdeflation on our UF-denominated assets, both resulting from the overall recessionary environment of 2009.
Net fees and commission income grew by 4.5% to Ch$254,130 million in the year ended December 31, 2009 compared to the same period of 2008. Thegrowth in fee income was mainly driven by fees from credit, debit and ATM cards, which increased by 18.0%, reflecting increased usage of these credit cards.Fees from collections increased by 11.0% in the year ended December 31, 2009 compared to the same 2008 period. The fees from the collection of insuranceincreased 28.4% in 2009 compared to 2008 and was also a contributor to the overall increase in fee income. This growth in fee income was partially offset bythe 17.2% decrease in fees from checking accounts and lines of credit, which includes the maintenance fee for checking accounts and lines of credit and feescharged for the unauthorized overdraft of lines of c redit. This decrease was mainly due to a 68.5% decrease in fees from unauthorized overdrafts of credit lines,which fees were prohibited by the Superintendency of Banks beginning in May 2009.
Results of financial transactions, net, which is the sum of trading activities, mark-to-market adjustments and foreign exchange transactions, totaledCh$167,128 million in 2009, an increase of 93.4% compared to 2008. The net result from mark-to-market and trading was Ch$3,887 million in 2009, a decreaseof 98.6% compared to 2008. This lower result was mainly due to the appreciation of the Chilean peso and its effect on the mark-to-market of foreign currencyderivatives, which produced a loss of Ch$102,825 million, compared to a gain of Ch$178,883 million in the same period in 2008. These results were offset inpart by the mark-to-market of and the realized gains from our available-for-sale fixed income portfolio. These results produced a gain of Ch$47,335 million in2009 compared to a gain of Ch$3,807 million in 2008. In the first half of 2009, as a result of decreases in interest rates, we recognized gains from sales of ourfixed income portfolio, which is mainly comprised of Central Bank bonds.
These results were offset by the gain from conversion to pesos of assets and liabilities denominated in foreign currencies and hedge-accounted derivativesrecorded as a gain in the foreign exchange transactions line item. Foreign exchange profit (loss), net totaled a net gain of Ch$163,241 million in 2009 comparedto a loss of Ch$187,042 million in 2008. The appreciation of the Chilean peso in 2009 compared to a depreciation in 2008 explains this difference in results,which was largely offset by the mark-to-market of foreign exchange derivatives in net gains from trading and our mark-to-market as described above.
Other operating income totaled a gain of Ch$25,866 million in 2009, a 137.4% increase from Ch$10,896 million in 2008. The gains from the sale of Bankproperty, plant and equipment increased 510.7% to Ch$7,622 million. This result includes a one-time gain of Ch$7,072 million from the sale of a building inDecember 2009. Income from the reversal of provisions for non-specific contingencies increased to Ch$14,793 million in 2009 compared to 2008 (See Note36(a) of the Audited Consolidated Financial Statements). The Bank reversed in the second half of 2009 provisions for non-specific contingencies recognized atthe beginning of 2009 and previous periods, as the Bank assigned specific credit provisions to loans in the provision for loan losses as a result of recalibration ofits credit models.
Provisions for loan losses totaled Ch$333,847 million for the one-year period ended December 31, 2009, an increase of 15.9% compared to thecorresponding period in 2008. Gross provision expense increased by 50.1% to Ch$77,290 million in 2009 compared to the corresponding period in 2008. Thisincrease was mainly due to the recalibration of our consumer credit scoring model, which resulted in approximately Ch$35,000 million in additional provisionsof which Ch$32,000 million related to loans to individuals and Ch$3,000 million to the commercial loan book. Charge-offs in 2009 increased 7.8% compared to2008, totaling Ch$295,831 million. This was mainly due to a 46.1% increase in charge-offs in the commercial loan portfolio in 2009 compared to 2008 whichresulted from the economic downturn that advers ely affected asset quality in various sectors of the economy. Recoveries on loans previously charged offincreased by 3.6% from 2008.
Despite the rise in provision expense, operating income, net of provisions, increased 2.5% in 2009 compared to 2008 and totaled Ch$971,772 million.
52

Table of Contents
Operating expenses in 2009 decreased by 4.3% compared to 2008. The efficiency ratio improved from 37.6% in 2008 to 34.0% in 2009. Personnel salariesand expenses decreased by 9.0%, mainly due to a 5.3% reduction in average headcount, an 82.7% reduction in severance payments and other cost savingmeasures. Administrative expenses increased 2.3% in 2009 compared to 2008, mainly due to higher rent expenses for branch and ATM locations. Depreciationand amortization expense decreased by 2.1%, mainly due to lower depreciation expense of real estate as the Bank spent less on improvements and remodeling,and lower depreciation of intangibles as three important computer systems were fully depreciated in 2008.
Other operating expenses were Ch$36,662 million in 2009, a 1.0% increase compared to 2008, principally due to a 92.8% increase in expenses related torepossessed assets, which was a result of an increase in provisions for repossessed assets in line with the general economic downturn.
Net operating results, which are operating income net of provisions and operating expense, increased by 9.4% in 2009, compared to the correspondingperiod in 2008.
These operating results were offset by a 48.8% increase in income tax expense. The effective tax rate for 2009 was 16.9%, compared to 12.4% in thecorresponding period in 2008, due to the change in our taxable income base. Our taxable income base changed as a result of the adoption of the new accountingstandards, which eliminated price level restatement which in prior periods generated tax deductible losses. The statutory tax rate in Chile has not changed andcontinues to be 17% on income before taxes.
53
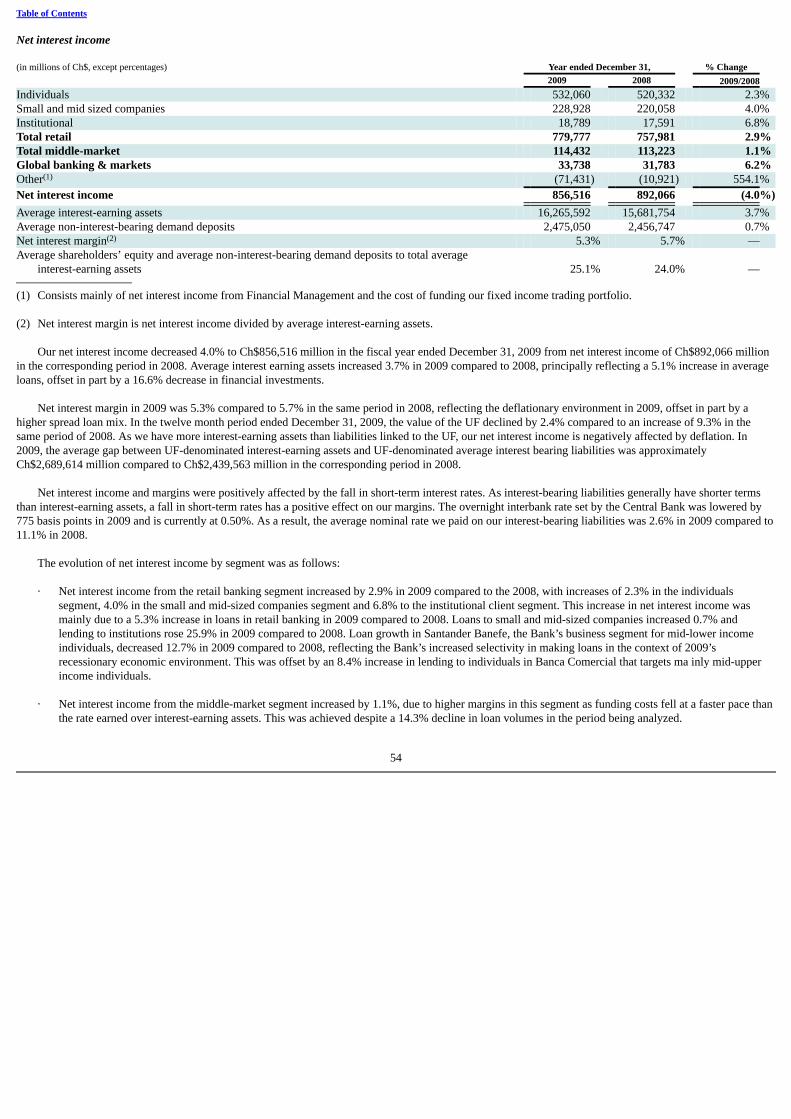
Table of Contents Net interest income (in millions of Ch$, except percentages) Year ended December 31, % Change 2009 2008 2009/2008 Individuals 532,060 520,332 2.3%Small and mid sized companies 228,928 220,058 4.0%Institutional 18,789 17,591 6.8%Total retail 779,777 757,981 2.9%Total middle-market 114,432 113,223 1.1%Global banking & markets 33,738 31,783 6.2%Other(1) (71,431) (10,921) 554.1%Net interest income 856,516 892,066 (4.0%)Average interest-earning assets 16,265,592 15,681,754 3.7%Average non-interest-bearing demand deposits 2,475,050 2,456,747 0.7%Net interest margin(2) 5.3% 5.7% — Average shareholders’ equity and average non-interest-bearing demand deposits to total average
interest-earning assets 25.1% 24.0% —
(1) Consists mainly of net interest income from Financial Management and the cost of funding our fixed income trading portfolio. (2) Net interest margin is net interest income divided by average interest-earning assets.
Our net interest income decreased 4.0% to Ch$856,516 million in the fiscal year ended December 31, 2009 from net interest income of Ch$892,066 millionin the corresponding period in 2008. Average interest earning assets increased 3.7% in 2009 compared to 2008, principally reflecting a 5.1% increase in averageloans, offset in part by a 16.6% decrease in financial investments.
Net interest margin in 2009 was 5.3% compared to 5.7% in the same period in 2008, reflecting the deflationary environment in 2009, offset in part by ahigher spread loan mix. In the twelve month period ended December 31, 2009, the value of the UF declined by 2.4% compared to an increase of 9.3% in thesame period of 2008. As we have more interest-earning assets than liabilities linked to the UF, our net interest income is negatively affected by deflation. In2009, the average gap between UF-denominated interest-earning assets and UF-denominated average interest bearing liabilities was approximatelyCh$2,689,614 million compared to Ch$2,439,563 million in the corresponding period in 2008.
Net interest income and margins were positively affected by the fall in short-term interest rates. As interest-bearing liabilities generally have shorter termsthan interest-earning assets, a fall in short-term rates has a positive effect on our margins. The overnight interbank rate set by the Central Bank was lowered by775 basis points in 2009 and is currently at 0.50%. As a result, the average nominal rate we paid on our interest-bearing liabilities was 2.6% in 2009 compared to11.1% in 2008.
The evolution of net interest income by segment was as follows: · Net interest income from the retail banking segment increased by 2.9% in 2009 compared to the 2008, with increases of 2.3% in the individuals
segment, 4.0% in the small and mid-sized companies segment and 6.8% to the institutional client segment. This increase in net interest income wasmainly due to a 5.3% increase in loans in retail banking in 2009 compared to 2008. Loans to small and mid-sized companies increased 0.7% andlending to institutions rose 25.9% in 2009 compared to 2008. Loan growth in Santander Banefe, the Bank’s business segment for mid-lower incomeindividuals, decreased 12.7% in 2009 compared to 2008, reflecting the Bank’s increased selectivity in making loans in the context of 2009’srecessionary economic environment. This was offset by an 8.4% increase in lending to individuals in Banca Comercial that targets ma inly mid-upperincome individuals.
· Net interest income from the middle-market segment increased by 1.1%, due to higher margins in this segment as funding costs fell at a faster pace than
the rate earned over interest-earning assets. This was achieved despite a 14.3% decline in loan volumes in the period being analyzed.
54

Table of Contents · Net interest income from the global banking and markets segment increased by 6.2%. This was achieved despite a 46.2% decline in loan volumes in the
period as this segment’s margins were positively impacted by the lower interest rate environment as funding costs declined more than lending rates. · The 554.1% increase in the loss in other net interest income principally resulted from the impact of the deflationary environment on our UF
asset/liability gap, which is managed by the Financial Management division.
The following table shows our balances of loans and accounts receivables from customers and interbank loans by segment at the dates indicated. As of December 31, % Change
Loans by product 2009 2008 2009/2008 (in millions of Ch$) Individuals 7,287,925 6,859,547 6.2%Small and mid-sized companies 2,485,505 2,468,820 0.7%Institutional 282,933 224,776 25.9%Total retail 10,056,363 9,553,143 5.3%Total middle-market 2,471,162 2,882,943 (14.3%)Global banking & markets 1,194,706 2,221,144 (46.2%)Other 29,045 23,858 21.7%
Total loans(1) 13,751,276 14,681,088 (6.3%)
(1) Includes interbank loans.
Fee and commission income
The following table sets forth certain components of our income from services (net of fees paid to third parties directly connected to providing thoseservices, principally fees relating to credit card processing and ATM network administration) in the years ended December 31, 2008 and 2009. Year ended December 31, % Change 2009 2008 2009/2008 (in millions of Ch$) Collections 65,782 59,237 11.0%Checking accounts and lines of credit 53,388 64,483 (17.2%)Credit, debit and ATM cards 51,670 43,772 18.0%Asset management 30,766 28,220 9.0%Letters of credit 24,558 17,092 43.7%Insurance brokerage 16,307 15,284 6.7%Custody and brokerage services 6,532 6,538 (0.1%)Office banking 2,552 1,944 31.3%Other fees 2,575 6,559 (60.7%)
Total fees and commission income, net 254,130 243,129 4.5%
Net fees and commission income grew by 4.5% to Ch$254,130 million in the year ended December 31, 2009 compared to the same period of 2008.
Fees from collections increased by 11.0% in the year ended December 31, 2009 compared to the same 2008 period. The fees from the collection ofbrokerage premiums on in-force credit insurance increased 28.4% in 2009 compared to 2008 and was the principal driver of this fee item.
Fees from checking accounts and lines of credit, which includes the maintenance fee for checking accounts and lines of credit and fees charged for theunauthorized overdraft of lines of credit, decreased 17.2% in 2009 compared to 2008. This decrease was principally due to a 68.5% decrease in fees fromunauthorized overdrafts of credit lines, which fees were prohibited by the Superintendency of Banks beginning in May 2009.
55

Table of Contents
Fees from credit, debit and ATM cards increased by 18.0%, reflecting increased usage of our credit cards, the total number of which remained substantiallyconstant. As of December 2009, the Bank, with 33.1% of all bank credit cards in Chile, generated 38.2% of all monetary purchases in Chile. Billing was up22.9% in real terms in 2009 compared to 8.1% for the rest of the market, excluding Santander.
Fees from our asset management business increased 9.0% in 2009 compared to 2008. Total funds under management increased 55.9% in the period beinganalyzed and totaled Ch$3,427,829 million (US$6.8 billion). The recovery of the local and global equity markets in 2009 resulted in an increase in funds undermanagement. The Bank’s commercial teams have also proactively funneled customer deposits to mutual funds, which is a more profitable product for the Bank.
Fees were also driven by a 43.7% increase in fees from letters of credit and other contingent operations. This was mainly due to higher income from stand-by letters of credit from our foreign trade finance business and correspondent banking resulting from a differential pricing strategy, based on segmenting theclient base more thoroughly.
Insurance brokerage fees increased by 6.7%. This was mainly due to greater business volumes in our insurance brokerage subsidiary and higher sale ofinsurance products through our website.
Custody and brokerage fees decreased 0.1% in 2009 compared to 2008. This was primarily due to the lower stock brokerage fees, especially in the firstquarter of 2009 when equity market activity generally decreased due to perceived adverse market conditions in 2009.
Fees from office banking increased 31.3%. This was mainly due to increase on-line banking activities on behalf of middle-market and corporate clients.
Other fee income decreased by 60.7%. This was due in part to lower fees from the issuance of cashier’s checks and other services on behalf of companieswhich are now done more efficiently through automated processes but at lower prices.
The following table sets forth, for the periods indicated our fee income from our business segments. Year ended December 31, % Change 2009 2008 2009/2008 (in millions of Ch$) Individuals 171,433 160,286 7.0%Small and mid-sized companies 41,917 39,931 5.0%Institutional 1,962 1,789 9.7%Total retail 215,312 202,006 6.6%Total middle-market (Companies) 20,567 16,846 22.1%Global banking and markets 18,747 14,786 26.8%Other (496) 9,491 –%
Total fees and commission income, net 254,130 243,129 4.5%
Retail banking fees increased by 6.6% in 2009 compared to 2008 mainly as a result of the increase in fees from credit and debit cards, asset management andinsurance brokerage. This was partially offset by lower fees from checking accounts and lines of credit.
Fees in the middle market segment increased by 22.1% mainly as a result from the rise in fees from letters of credit and contingent operations and officebanking fees. The fees from the global banking and markets segment increased by 26.8% mainly as a result of an increase in fees from letters of credit,investment banking, advisory services and office banking.
56

Table of Contents
Financial transactions, net
The following table sets forth information regarding our income (expenses) from financial transactions in the year-ended December 31, 2008 and 2009. Year ended December 31, % Change 2009 2008 2009/2008 (in millions of Ch$) Net income from financial operations 3,887 273,477 (98.6%)Foreign exchange profit (loss), net 163,241 (187,042) –%
Total financial transactions, net 167,128 86,435 93.4%
The net gains from financial transactions, which is the sum of trading activities, mark-to-market adjustments and foreign exchange transactions totaledCh$167,128 million for 2009, an increase of 93.4% compared to the corresponding period in 2008. These results include the results of our TreasuryDepartment’s trading business and financial transactions with customers as well the results of our Financial Management division.
The net income from financial operations was Ch$3,887 million in 2009, a decrease of 98.6% compared to 2008. This lower result was mainly due to theappreciation of the Chilean peso and its effect on the mark-to-market of foreign currency derivatives, which was a loss of Ch$102,825 million, compared to again of Ch$178,883 million in the same period in 2008. These lower results were also due to lower interest income from our investments classified as trading.This was mainly due to the deflation in the period, which lowered the interest earned on these assets. These results were offset in part by the mark-to-market andthe realized gains from our available-for-sale fixed income portfolio. These results totaled a gain of Ch$47,335 million in 2009 compared to a gain of Ch$3,807million in 2008. In the last quarter of 200 8, we increased our domestic bond portfolio as a result of the strong inflow of deposits and the high interest rateenvironment. In the first half of 2009, as interest rates decreased we recognized gains from our fixed income portfolio. This portfolio is mainly comprised ofCentral Bank bonds. Year ended December 31, % Change 2009 2008 2009/2008 (in millions of Ch$) Derivatives classified as trading (102,825) 178,883 –%Trading investments 49,220 77,222 (36.3%)Sale of loans 9,231 15,017 (38.5%)Available-for-sale instruments sales 47,335 3,807 1143.4%Other results 926 (1,452) (163.8%)
Net income from financial operations 3,887 273,477 (98.6%)
These results were offset by the conversion gain of assets and liabilities denominated in foreign currencies and hedge-accounted derivatives recorded as again in the foreign exchange transactions line item. The derivatives included in this line item are mainly cross-currency swaps that hedge interest rate risk ofbonds issued abroad. Foreign exchange profit (loss), net totaled a net gain of Ch$163,241 million in 2009 compared to a loss of Ch$187,042 million in 2008. Theappreciation of the Chilean peso in 2009 compared to a depreciation in 2008 explains this difference in results and which was largely offset by the mark-to-market of foreign exchange derivatives in net gains from trading and mark-to-market as described above. Year ended December 31, % Change 2009 2008 2009/2008 (in millions of Ch$) Foreign exchange transactions 401,695 (402,927) –%Hedge-accounting derivatives (266,221) 243,979 –%Translation gains and losses over assets and liabilities indexed to foreign currencies 27,767 (28,094) –%
Net results from foreign exchange profit (loss) 163,241 (187,042) –%
57

Table of Contents
Excluding derivatives that qualify for hedge accounting, the conversion and mark-to-market of foreign currency derivatives are for the most part recognizedas a gain or loss in the net results from mark-to-market and trading and not as foreign exchange transactions. This distorts the results from mark-to-market andtrading and foreign exchange transactions. In order to more easily compare the results from financial transactions, net, we present the following table thatseparates the results by line of business. Year ended December 31, % Change 2009 2008 2009/2008 (In million of Chilean pesos) Santander Global Connect and market-making 89,847 89,659 0.2%Proprietary trading 14,360 4,311 233.1%Sale of loans and charged-off loans 9,231 15,017 (38.5%)Financial Management (ALCO) and other results 53,690 (22,552) –%
Total financial transactions, net 167,128 86,435 93.4%
The results from Santander Global Connect (SGC) and market-making mainly include the results from the sale of derivatives, foreign exchange and fixedincome instruments to our client base. Santander Global Connect is a specialized platform designed to facilitate the sale of derivatives to a broad range ofcompanies in all segments and through the branch network. In 2009, the results from SGC and market-making increased by 0.2% to Ch$89,847 million.
The results from proprietary trading totaled a gain of Ch$14,360 million in 2009 compared to a gain of Ch$4,311 million in 2008. The sharp reduction inrates, especially in the first half of 2009, had a positive effect on our proprietary trading positions compared to the surge in inflation and rates in 2008.
The results from the Financial Management Division and other results totaled a gain of Ch$53,690 million in 2009 compared to a loss of Ch$22,552 millionin 2008. The Financial Management Division manages the structural interest rate risk, the structural position in inflation-indexed assets and liabilities,shareholders’ equity and liquidity. The aim of the Financial Management Division is to inject stability and recurrence into the net interest income of commercialactivities and to ensure that we comply with internal and regulatory limits regarding liquidity, regulatory capital, reserve requirements and market risk. The gainrecognized by the Financial Management Division was mainly due to the sale of available-for-sale fixed income instruments as rates fell, especially in the firstquarter of 2009 in order to o ffset the negative impact of deflation on net interest margins.
Other operating income Year ended December 31, % Change 2009 2008 2009/2008 (In million of Chilean pesos) Gain on sales of assets received in lieu of payment 29 1,518 (98.1%)Recovery of charged-off of assets received in lieu of payment -- -- Income from assets received in lieu of payment 29 1,518 (98.1%)Net results from sale of investment in other companies 1,859 4,348 (57.2%)Operational leases 1,123 1,304 (13.9%)Gain on sale of Bank premises and equipment 7,622 1,248 510.7%Recovery of provisions for non-specific contingencies 14,793 1,246 1087.2%Other 440 1,232 (64.3%)Sub-total other income 23,978 5,030 376.7%Total other operating income 25,866 10,896 137.4%
Other operating income totaled a gain of Ch$25,866 million in 2009, an 137.4% increase from Ch$10,896 million in 2008. In 2009, income fromrepossessed assets totaled Ch$29 million, a 98.1% decline compared to the corresponding period in 2008, mainly due to the economic downturn, which led to usholding on to repossessed assets for longer periods. Income from the sale of investments in other companies decreased by 57.2% mainly as a result of aCh$1,847 million gain from the sale of shares in Visa Inc. and MasterCard in the first half of 2009,
58

Table of Contents compared to a Ch$974 million one-time gain from the sale of shares in the Santiago Stock Exchange and a Ch$3,368 million one-time gain from the sale ofshares in Visa Inc. in the first half of 2008.
The gains from the sale of Bank premises and equipment increased 510.7% to Ch$7,622 million. This result includes a one-time gain of Ch$7,072 millionfrom the sale of a building in December 2009.
Finally, gains from the recovery of provisions for non-specific contingencies increased 1,087.2% to Ch$14,793 million. This figure includes the reversalduring 2009 of non-specific contingencies, recognized at the beginning of 2009 and previous periods, as the Bank assigned specific credit provisions to loans,which were reflected under provision for loan losses, as a result of recalibration of its credit models (See Provision Expense and Note 36(a) to our AuditedConsolidated Financial Statements.
Provision for loan losses
The following table sets forth, for the periods indicated, certain information relating to our provision expenses. Year ended December 31, % Change 2009 2008 2009/2008 (in millions of Ch$) Gross provision expenses(1) (77,290) (51,505) 50.1%Charge-offs (295,831) (274,372) 7.8%Recoveries of loans previously charged-off 39,274 37,894 3.6%Provision expenses, net (333,847) (287,983) 15.9%Period-end loans(2) 13,751,276 14,681,088 (6.3%)Past due loans(3) 193,250 160,824 20.2%Non-performing loans(4) 409,067 383,458 6.7%Substandard loans(5) 1,485,737 870,259 70.7%Loan loss allowance(6) 349,527 274,240 27.5%Non-performing loans / period-end loans(4) 2.97% 2.61% Past due loans / period-end loans 1.41% 1.10% Expected loan loss ratio(7) 2.54% 1.87% Coverage ratio non-performing loans(8) 85.44% 71.52% Coverage ratio past due loans(9) 180.87% 170.52%
(1) Net of the reversal of allowances on loans charged off during the period. (2) Includes Ch$95,534 million in 2008 and Ch$23,412 million in 2009 in interbank loans. (3) Past-due loans all are installments and lines of credit that are over 90 days overdue. (4) Non-performing loans include the aggregate unpaid principal and accrued but unpaid interest on all loans with at least one installment over 90 days
overdue. December 31, 2008 non-performing loans amount is as reported on January 1, 2009. (5) Substandard loans prior to December 2009 include: (i) all non-performing loans, (ii) all renegotiated consumer loans, and (iii) all commercial loans that are
at risk of default. As of December 31, 2009, substandard loans include: (i) all loans to a single client that are evaluated on a group basis, includingperforming loans, that have a loan classified as non-performing, (ii) all renegotiated consumer loans and (iii) all commercial loans at risk of default. SeeNote 10(a) of the Consolidated Financial Statements. As a result of this change in definition substandard loans as of December 31, 2009 are not comparableto December 31, 2008 figures.
(6) Includes Ch$35 million in 2008 and Ch$42 million in 2009 in loan loss allowances for interbank loans. (7) Loan loss allowance divided by total loans. (8) Loan loss allowance divided by non-performing loans. (9) Loan loss allowance divided by past due loans.
Net provision expense for loan losses totaled Ch$287,983 million for the year ended December 31, 2009, an increase of 15.9% compared to 2008.
59

Table of Contents
Gross provision expense increased by 50.1% to Ch$77,290 million in 2009 compared to the corresponding period in 2008. This rise was mainly due to therecalibration of our consumer credit scoring model. All consumer loans are now assigned a provision at the moment a loan is granted that depends on the riskprofile of the client. In addition, the historical time period used for statistically determining the risk level of consumer loans was shortened in the first half of2009 from 21 months to 18 months for non-renegotiated loans and 12 months for renegotiated loans. This recalibration was done in order to increase theweighting of the time period in which the economic downturn has been affecting the risk levels of the consumer loan book. The Bank also made someadjustments to its commercial loan portfolio cred it scoring models in 2009. In total these changes resulted in approximately Ch$35,000 million in additionalprovisions in 2009 of which Ch$32,000 million were with respect to loans to individuals and Ch$3,000 million the commercial loan book. The rise in grossprovisions was also due to an increase in risk of the commercial loan book, especially in the salmon sector. The following table shows provision expense by typeof loan: Gross provision expense by loan product Year ended December 31, % Change 2009 2008 2009/2008 (in millions of Ch$) Consumer loans (19,030) (12,207) 55.9%Residential mortgage loans (3,903) (3,044) 28.2%Commercial loans (53,042) (35,812) 48.1%Contingent loans (off-balance sheet) (1,308) (407) 221.4%Interbank loans (7) (35) 80.0%
Total gross provisions (77,290) (51,505) 50.1%
Charge-offs increased 8.1% in 2009 compared to 2008, totaling Ch$296,526 million. This was mainly due to a 48.2% increase in charge-offs in thecommercial loan portfolio in 2009 compared to 2008 as a result of the economic downturn that hurt asset quality in various sectors of the economy. Charge-offsin the consumer loan portfolio increased 1.1%. The following table shows charge-offs by type of loan. Charge-offs by loan product Year ended December 31, % Change
2009 2008 2009/2008 (in millions of Ch$) Consumer loans (239,005) (236,405) 1.1%Residential mortgage loans (8,708) (5,032) 73.1%Commercial loans (48,118) (32,935) 46.1%
Total charge-offs (295,831) (274,372) 7.8%
Recoveries on loans previously charged off increased by 3.6% in from to 2008. This was mainly due to increased collection efforts by our commercialteams, whose compensation was revised in 2009 to provide greater incentives to increase recoveries. The increased participation by our commercial teams in therecovery process and our efforts toward controlling initial non-performance has had a positive effect on the levels of loan loss recoveries in the period. Recovery of loans previously charged-off Year ended December 31, % Change
2009 2008 2009/2008 (in millions of Ch$) Consumer loans 28,268 26,718 5.8%Residential mortgage loans 2,560 1,932 32.5%Commercial loans 8,446 9,244 (8.6%)
Total recoveries 39,274 37,894 3.6%
60

Table of Contents
The following table sets forth, for the periods indicated our provision expense broken down by business segment. Year ended December 31, % Change 2009 2008 2009/2008 (in millions of Ch$) Individuals (230,503) (221,715) 4.0%Small and mid sized companies (SMEs) (76,075) (53,669) 41.7%Institutional (327) (290) 12.8%Total retail (306,905) (275,674) 11.3%Total middle-market (Companies) (24,333) (16,188) 50.3%Global banking & markets (2,511) (759) 230.8%Other (98) 4,638 (102.1%)
Total provisions, net (333,847) (287,983) 15.9%
By business segment, the 15.9% increase in provision was provision expense was mainly due to the 41.7% increase in net provision expense among SMEs,
the middle market and global banking and markets. This rise was due to an increase in risk of the commercial loan book as a result of the economic downturnand higher provisions in the salmon sector, which are mainly middle market clients.
Net provision expense among individuals only increased 4.0% in 2009 compared to 2008. During 2009, we also sought to reduce exposure to the riskiestconsumer loans. Loan growth in Santander Banefe, the Bank’s business segment for mid-lower income individuals, decreased 12.7% in 2009 compared to 2008.This was offset by an 8.4% increase in lending to individuals in Banca Comercial that encompasses mainly the less riskier mid-upper income individuals. Wealso modified our collection procedures for short-term non-performing consumer loans (< 90 days and before being charged-off) by placing commercial teams asthe main responsible for performing this task instead of the collections area. This was done by increasing the weighting of recoveries on variable incentives forcommercial teams and im proving IT systems so commercial teams could receive more quickly alerts regarding their client base.
Asset quality indicators deteriorated in 2009 as a result of the economic recession, but with a more favorable evolution in the second half of the year. Theexpected loss ratio, loan loss allowances over total loans, which measures how much we expect to lose on our loan book, according to our internal models andthe Superintendency of Banks guidelines, reached 2.54% as of December 31, 2009 compared to 1.87% as of December 31, 2008. The ratio of past due loans as apercentage of total loans reached 1.41% as of December 31, 2009 compared to 1.10% as of December 31, 2008. Total non-performing loans, a new measure ofasset quality introduced in 2009, which includes not only the past due installments, but also the full balance of any loan with one or more installments more than90 days overdue, reached 2.97% as of December 31, 2009 compared to 2.61% as of December 31, 2008.
We believe that our loan loss allowances are currently adequate for all known and expected losses. In 2010 our required loan loss allowances will beimpacted by the effects of the recent earthquake on asset quality, in addition to the normal evolution of our business. On February 27, 2010, areas of Chile wereaffected by an earthquake. These areas should be negatively affected economically and therefore asset quality indicators should deteriorate in these areas. TheBank’s loan exposure to the areas most affected (Regions VI-VIII) is approximately Ch$1,658,845 million or 11.8% of the Bank’s loan portfolio as of February28, 2010. We are currently unable to estimate the extent of the earthquake’s impact on asset quality because not enough time has passed sinc e the earthquake,although the impact could be material. See “Risk Factors— The recent earthquake in Chile is likely to adversely affect the quality of our loan portfolio insegments of the Chilean economy that have been negatively affected and, as a result, is likely to negatively affect, as a result, is likely to negatively.”
61

Table of Contents
Operating expenses
The following table sets forth information regarding our operating expenses in the year ended December 31, 2008 and 2009. Year ended December 31, % Change 2009 2008 2009/2008 (in millions of Ch$) Personnel salaries and expenses (224,484) (246,775) (9.0%)Administrative expenses (136,712) (133,682) 2.3%Depreciation and amortization (46,623) (47,627) (2.1%)Impairment (75) (84) (10.7%)Other operating expenses (36,662) (36,298) 1.0%Total operating expenses (444,556) (464,466) (4.3%)Efficiency ratio (1) 34.0% 37.6%
(1) The efficiency ratio is the ratio of total operating expenses to total operating income. Total operating income consists of net interest income, fee income, andother operating income.
Operating expenses in 2009 decreased by 4.3% compared to 2008. The efficiency ratio improved from 37.6% in 2008 to 34.0% in 2009. The 9.0% decrease
in personnel salaries and expenses was mainly due to the 5.3% reduction in average headcount, an 82.7% reduction in severance payments and other cost savingmeasures.
Administrative expenses increased 2.3% in 2009 compared to 2008, mainly due to higher rent expenses for branch and ATM locations.
The impact on administrative expenses from the earthquake, net of insurance proceeds, recognized in 2010 is expected to be US$6 million.
Depreciation and amortization expense decreased by 2.1%, mainly due to lower depreciation expense of real estate as we spent less on improvements andremodeling and lower depreciation of intangibles as three important computer systems completed their depreciation schedule in 2008.
The following table sets forth, for the periods indicated our personnel, administrative and depreciation expenses broken down by business segment. Year ended December 31, % Change 2009 2008 2009/2008 (in millions of Ch$) Individuals (268,934) (281,532) (4.5%)Small and mid-sized companies (58,741) (61,663) (4.7%)Institutional (6,799) (7,189) (5.4%)Total retail (334,474) (350,384) (4.5%)Total middle-market (Companies) (30,628) (32,692) (6.3%)Global banking and markets (29,485) (31,184) (5.4%)Other (13,307) (13,908) (4.3%)
Total personnel, administrative, depreciation and impairment expense (407,894) (428,168) (4.7%)
By business segment, the 4.7% decrease in personnel, administrative and depreciation expenses was mainly due to cost cutting and increases in productivity
among all business segments.
62

Table of Contents Year ended December 31, % Change
Other operating expenses 2009 2008 2009/2008 (in millions of Ch$) Repossessed asset expenses (6,128) (3,178) 92.8%Credit card expenses (5,902) (7,286) (19.0%)Customer service expenses (8,807) (9,366) (6.0%)Other expenses (15,825) (16,468) (3.9%)
Total (36,662) (36,298) 1.0%
Other operating expenses were Ch$36,662 million in 2009, a 1.0% increase compared to 2008. Other operating expenses include provisions and expenses
related to repossessed assets, expenses related to our credit card business, customer service expenses mainly related to our call-center and other expenses such asnon-credit charge-offs, the cost of insurance policies (mainly life insurance) over products, tax paid on interest of foreign debt issued by us. Other operatingexpenses also include provisions for contingencies that may be non-specific credit or other impairments such as tax and legal contingencies. The rise in otherexpenses was mainly due to a 92.8% rise in expenses related to repossessed assets, which was a results of an increase in provisions for repossessed assets in linewith the economic downturn and high er expenses to maintain repossessed assets.
Income tax Year ended December 31, % Change 2009 2008 2009/2008 (in millions of Ch$) Income before tax 525,534 480,709 9.3%Income tax (88,924) (59,742) 48.8%Effective tax rate(1) 16.9% 12.4%
(1) The effective tax is the income tax divided by net income before tax.
Our income tax expense increased by 48.0% in 2009 compared to 2008. As a consequence of the adoption of new accounting standards, our taxable incomebase changed, mainly as a result of the elimination of price level restatement. In a positive inflationary environment, we previously recognized a tax deductibleloss from price level restatement in our income statement. In 2008, we recognized in our historical income statement a Ch$78,027 million loss from price levelrestatement. Historical and non-restated income before taxes in 2008 totaled Ch$394,745 million. The effective tax rate paid on non-restated historical incomebefore taxes was 16.1% in 2008 compared to 16.9% in 2009. The statutory tax rate in Chile has not changed and is 17% on income before taxes. Going forwardand in line with the Chilean govern ment’s proposal for financing the reconstruction of the areas of Chile affected by the earthquake the statutory corporate taxrate will rise to 20% in 2011 to gradually return to 17% by 2013. Year ended December 31, % Change
2009
2008(historical
non-restated) 2009/2008
(in millions of Ch$) Income before tax 525,534 394,745 33.1%Income tax (88,924) (63,728) 39.5%Effective tax rate(1) 16.9% 16.1%
(1) The effective tax is the income tax divided by net income before tax.
63
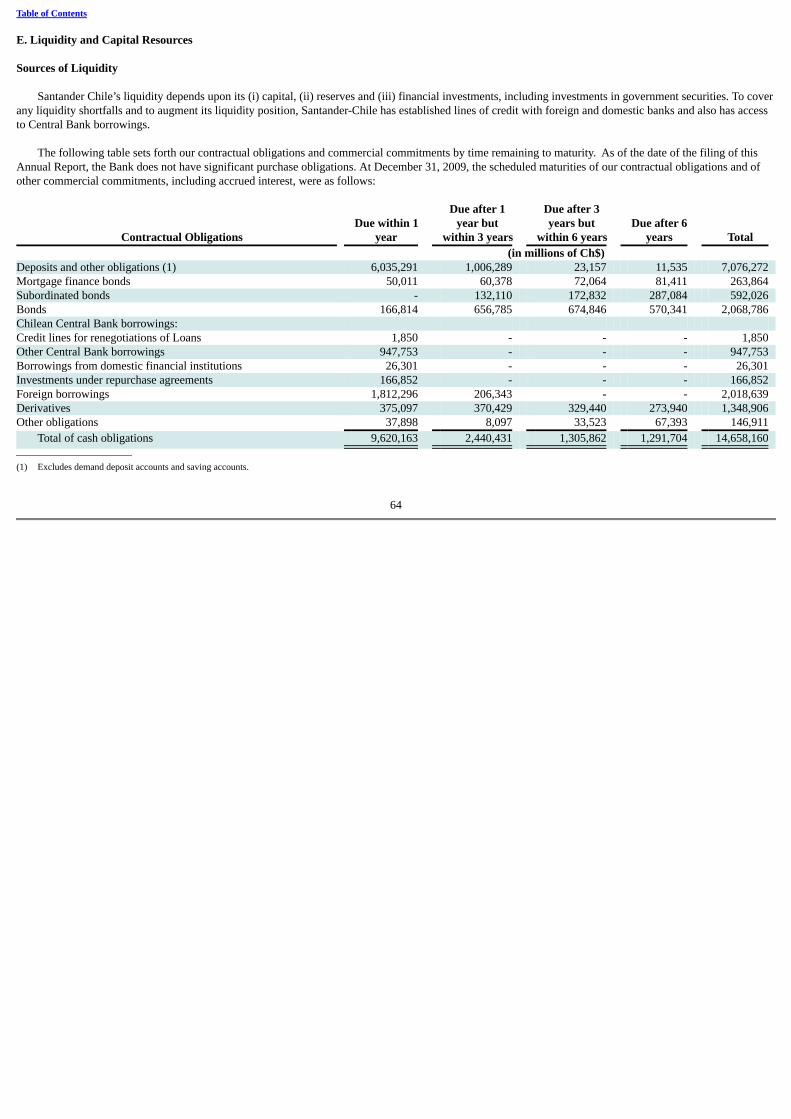
Table of Contents E. Liquidity and Capital Resources Sources of Liquidity
Santander Chile’s liquidity depends upon its (i) capital, (ii) reserves and (iii) financial investments, including investments in government securities. To coverany liquidity shortfalls and to augment its liquidity position, Santander-Chile has established lines of credit with foreign and domestic banks and also has accessto Central Bank borrowings.
The following table sets forth our contractual obligations and commercial commitments by time remaining to maturity. As of the date of the filing of thisAnnual Report, the Bank does not have significant purchase obligations. At December 31, 2009, the scheduled maturities of our contractual obligations and ofother commercial commitments, including accrued interest, were as follows:
Contractual Obligations
Due within 1year
Due after 1year but
within 3 years
Due after 3years but
within 6 years Due after 6
years Total (in millions of Ch$) Deposits and other obligations (1) 6,035,291 1,006,289 23,157 11,535 7,076,272 Mortgage finance bonds 50,011 60,378 72,064 81,411 263,864 Subordinated bonds - 132,110 172,832 287,084 592,026 Bonds 166,814 656,785 674,846 570,341 2,068,786 Chilean Central Bank borrowings: Credit lines for renegotiations of Loans 1,850 - - - 1,850 Other Central Bank borrowings 947,753 - - - 947,753 Borrowings from domestic financial institutions 26,301 - - - 26,301 Investments under repurchase agreements 166,852 - - - 166,852 Foreign borrowings 1,812,296 206,343 - - 2,018,639 Derivatives 375,097 370,429 329,440 273,940 1,348,906 Other obligations 37,898 8,097 33,523 67,393 146,911
Total of cash obligations 9,620,163 2,440,431 1,305,862 1,291,704 14,658,160
(1) Excludes demand deposit accounts and saving accounts.
64

Table of Contents
Operational Leases
Certain bank premises and equipment are leased under various operating leases. Future minimum rental commitments as of December 31, 2009, under non-cancelable leases are as follows:
As of December 31,
2009 (in millions of Ch$) Due within 1 year 12,161 Due after 1 year but within 2 years 11,201 Due after 2 years but within 3 years 9,139 Due after 3 years but within 4 years 7,685 Due after 4 years but within 5 years 6,478 Due after 5 years 22,240
Total 68,904
Other Commercial Commitments
As of December 31, 2009, the scheduled maturities of other commercial commitments, including accrued interest, were as follows:
Other Commercial Commitments
Due within 1year
Due after 1year but
within 3 years
Due after 3years but
within 6 years Due after 6
years Totals (in millions of Ch$) Letters of credit issued 148,521 7,435 - - 155,956 Letters of credit confirmed 33,239 2,417 162 - 35,818 Available credit lines 4,615,787 - - - 4,615,787 Guarantees 455,583 161,314 37,952 931 655,780 Other commercial commitments 153,482 15,980 469 - 169,931
Total other commercial commitments 5,406,612 187,146 38,583 931 5,633,272
Risk-Weighted Assets and Regulatory Capital
We currently have regulatory capital in excess of the minimum requirement under the current Chilean regulations. According to the General Banking Law, abank is required to have regulatory capital of at least 8% of its risk weighted assets, net of required loan loss allowances, and paid-in capital and reserves (i.e., thebasic capital, as defined above) of at least 3% of its total assets, net of required loan loss allowances. For these purposes, the regulatory capital of a bank is thesum of (1) the bank’s basic capital, (2) subordinated bonds issued by the bank valued at their placement price for an amount up to 50% of its basic capital;provided that the value of the bonds is required to be decreased by 20% for each year that elapses during the period com mencing six years prior to theirmaturity, and (3) its voluntary allowances for loan losses, for an amount of up to 1.25% of its risk weighted assets. Santander Chile does not have goodwill, but ifit did, this value would be required to be deducted from regulatory capital. When calculating risk weighted assets, the Bank also includes off-balance sheetcontingent loans. The merger of Old Santander-Chile and Santiago required a special regulatory pre-approval of the Superintendency of Banks, which wasgranted on May 16, 2002. The resolution granting this pre-approval imposed a regulatory capital to risk weighted assets ratio of 12% for the merged bank. Thisrequirement was reduced to 11% by the Superintendency of Banks effective January 1, 2005. For purposes of weighing the risk of a bank’s assets, the GeneralBanking Law considers five different categories of assets, based on the nature of the issuer, the availability of funds, and the nature of the assets and theexistence of collateral securing such assets.
The following table sets forth our consolidated and risk-weighted assets and regulatory capital as of December 31, 2008 and 2009.
65

Table of Contents Consolidated assets Risk-weighted assets 2009 2008 2009 2008 (Ch$ million) Asset Balance (Net of allowances)
Cash and deposits in bank 2,043,458 855,411 - - Unsettled transactions 468,134 335,405 191,287 58,580 Trading investments 798,539 1,166,426 41,918 97,594 Investments under resale agreements 14,020 - 14,020 - Financial derivative contracts 1,391,886 1,459,901 837,692 844,892 Interbank loans 23,370 95,499 4,674 19,100 Loans and accounts receivables from customers 13,378,379 14,311,349 11,717,337 12,721,633 Available for sale investments 1,830,090 1,580,240 154,089 167,995 Investments in other companies 7,417 7,277 7,417 7,277 Intangibles assets 77,260 68,232 77,260 68,232 Property, plant and equipment 184,122 200,389 184,122 200,389 Current taxes 4,541 18,715 454 1,872 Deferred taxes 95,229 88,825 9,523 8,883 Other assets 452,559 508,655 269,313 382,452
Off-balance sheet assets Contingent loans 1,160,118 1,240,690 693,009 735,126
Total 21,929,122 21,937,014 14,202,115 15,314,025 Ratio 2009 2008 2009 2008 (Ch$ million) % % Basic capital 1,658,316 1,489,689 7.56(1) 6.79(1)
Regulatory capital 2,214,092 2,104,225 15.59(2) 13.74(2)
(1) As a percentage of total assets. (2) As a percentage of risk weighted assets (BIS ratio). Financial Investments
The following table sets forth our investment in Chilean government and corporate securities and certain other financial investments at the dates indicated.Financial investments that have a secondary market are carried at market value. All other financial investments are carried at acquisition cost, plus accruedinterest and indexation readjustments, as applicable. Interest income from the trading portfolio is no longer included as interest income, but as income fromtrading and mark-to-market of securities.
66

Table of Contents a) Trading As of December 31, 2009 2008 (in millions of Ch$) Chilean Central Bank and Government Securities
Chilean Central Bank bonds 667,703 786,263 Chilean Central Bank notes 63,868 218,355 Other Chilean Central Bank and government securities 29,806 71,739
Subtotal 761,377 1,076,357 Other Chilean Securities Time deposits in Chilean financial institutions - - Mortgage bonds of Chilean financial institutions 11 2,787 Chilean financial institutions bonds - 3,030 Chilean corporate bonds - 24,832 Other Chilean securities - -
Subtotal 11 30,649 Foreign Financial Securities Other foreign financial instruments - - Subtotal - - Investments in mutual funds Funds managed by related entities 37,151 59,420
Subtotal 37,151 59,420
Total 798,539 1,166,426
67

Table of Contents
b) Available for sale As of December 31, 2009 2008 (in millions of Ch$) Chilean Central Bank and Government Securities
Chilean Central Bank bonds 1,063,879 690,123 Chilean Central Bank notes 264,011 49,204 Other Chilean Central Bank and government securities 212,362 93,128
Subtotal 1,540,252 832,455 Other Chilean Securities
Time deposits in Chilean financial institutions 41,407 1,305 Mortgage bonds of Chilean financial institutions 236,847 284,033 Chilean corporate bonds 11,584 13,522
Subtotal 289,838 298,860 Others Financial Securities
Central Bank and Government Foreign Securities - - Other Foreign financial securities(1) - 448,925
Subtotal - 448,925
Total 1,830,090 1,580,240
(1) Corresponds to overnight dollar deposits in the U.S. c) Held-to-maturity
No financial investments were classified as held-to-maturity as of December 31, 2008 and 2009.
68

Table of Contents
The following table sets forth an analysis of our investments as of December 31, 2009, by remaining maturity and the weighted average nominal rates ofsuch investments.
Within one
year
WeightedaverageNominal
Rate
After oneyear but
within fiveyears
WeightedaverageNominal
Rate
After fiveyears butwithin ten
years
WeightedaverageNominal
Rate After ten
years
WeightedaverageNominal
Rate Total
WeightedaverageNominal
Rate (in millions of Ch$ , except rates) Held for Trading Central Bank and Government
Securities Central Bank bonds 639,870 1.5% 25,850 2.2% 1,983 3.2% – – 667,703 1.5%Central Bank notes 26,551 3.4% 32,599 2.4% 1,250 3.0% 3,468 2.8% 63,868 2.8%Other Chilean Central Bank and
Treasury securities – –% 12,813 2.8% 16,993 3.5% – – 29,806 3.2%Subtotal 666,421 71,262 20,226 3,468 761,377
Other Chilean Securities Mortgage finance bonds – –% – –% – –% 11 4.0% 11 4.0%
Chilean financial institutionsbonds – –% – –% – –% – –% – –%
Chilean corporate bonds – –% – –% – –% – –% – –%Subtotal – – – 11 11
Investment in mutual funds Mutual funds administered by related
parties 37,151 0.1% – – – 37,151 0.1%Subtotal 37,151 – – – 37,151 Total 703,572 71,262 20,226 3,479 798,539
69

Within one
year
WeightedaverageNominal
Rate
After oneyear but
within fiveyears
WeightedaverageNominal
Rate
After fiveyears butwithin ten
years
WeightedaverageNominal
Rate After ten
years
WeightedaverageNominal
Rate Total
WeightedaverageNominal
Rate (in millions of Ch$, except percentages ) Available-for-sale Investments Central Bank and Government
Securities Central Bank Bonds 310,326 0.8% 537,921 2.9% 205,813 4.1% 9,819 3.1% 1,063,879 2.5%Central Bank notes 198,877 0.1% 63,533 0.2% 1,601 1.8% – –% 264,011 0.1%Others securities 10,838 1.5% 5,800 2.8% 177,653 4.9% 18,071 3.2% 212,362 4.5%
Subtotal 520,041 607,254 385,067 27,890 1,540,252 Other Chilean Securities
Deposits in Chilean FinancialInstitutions 41,407 0.1% – –% – –% – –% 41,407 0.1%
Mortgage Finance Bonds 28 5.4% 2,125 3.6% 26,073 3.8% 208,621 3.9% 236,847 3.9%Chilean Corporate Bonds – –% 11,584 4.9% – –% – –% 11,584 4.9%
Subtotal 41,435 –% 13,709 –% 26,073 –% 208,621 –% 289,838 –%Total 561,476 –% 620,963 –% 411,140 –% 236,511 –% 1,830,090 –%
Credit Risk Ratings
The Bank also has credit ratings from three international agencies.
Moody’s Rating
Long-term foreign currency bank deposits Aa3Senior bonds Aa3Subordinated debt A1Bank Deposits in Local Currency Aa3Bank financial strength B-Short-term deposits P-1Outlook Stable
Standard & Poor’s Rating
Long-term Foreign Issuer Credit A+Long-term Local Issuer Credit A+Short-term Foreign Issuer Credit A-1Short-term Local Issuer Credit A-1Outlook Stable
Fitch Rating
Foreign Currency Long-term Debt A+Local Currency Long-term Debt A+Foreign Currency Short-term Debt F1Local Currency Short-term Debt F1Individual rating BOutlook Stable
On June 15, 2009, Moody’s downgraded the credit risk ratings of 25 Spanish banks, but maintained the rating of our parent company, but with negative
outlook. Any adverse revisions to our parent company’s ratings and/or Chile’s credit ratings for domestic and international debt by international rating agenciesmay adversely affect our ratings. In 2010 Fitch ratings performed a similar downgrade of Spanish banks. Our ratings may also be negatively affected by aworsening of our financial condition, especially in terms of asset quality indicators.
70

Table of Contents
On June 16, 2010, Moody’s upgraded the Bank’s foreign currency rating to Aa3 in line with a similar action to Chile’s sovereign rating. Working Capital
As a bank, we satisfy our working capital needs through general funding, the majority of which derives from deposits and other borrowings from the public.(See “Item 5: E. Liquidity and Capital Resources—Deposits and Other Borrowings”). In our opinion, our working capital is sufficient for our present needs. Liquidity Management
Liquidity management seeks to ensure that, even under adverse conditions, we have access to the funds necessary to cover client needs, maturing liabilitiesand capital requirements. Liquidity risk arises in the general funding for our financing, trading and investment activities. It includes the risk of unexpectedincreases in the cost of funding the portfolio of assets at appropriate maturities and rates, the risk of being unable to liquidate a position in a timely manner at areasonable price and the risk that we will be required to repay liabilities earlier than anticipated.
Our general policy is to maintain liquidity adequate to ensure our ability to honor withdrawals of deposits, make repayments of other liabilities at maturity,extend loans and meet our own working capital needs. Our minimum amount of liquidity is determined by the statutory reserve requirements of the CentralBank. Deposits are subject to a statutory reserve requirement of 9% for demand deposits and 3.6% for Chilean peso, UF-denominated and foreign currencydenominated time deposits with a term of less than a year. (See “Item 4: D. Regulation and Supervision”). The Central Bank has statutory authority to increasethese percentages to up to 40% for demand deposits and up to 20% for time deposits. In addition, a 100% special reserve (reserva técnica) applies to demanddeposits, deposits in checking accounts, other demand deposits received or obligations payable on sight and incurred in the ordinary course of business, otherthan deposits unconditionally payable immediately. This special reserve requirement applies to the amount by which the total of such deposits exceeds 2.5 timesthe amount of a bank’s regulatory capital. Interbank loans are deemed to have a maturity of more than 30 days, even if payable within the following 10 days.
The Central Bank also requires us to comply with the following liquidity limits: · Our total liabilities with maturities of less than 30 days cannot exceed our total assets with maturities of less than 30 days by an amount greater than our
capital. This limit must be calculated in local currency and foreign currencies together as one gap. · Our total liabilities with maturities of less than 90 days cannot exceed our total assets with maturities of less than 90 days by more than twice of our
capital. This limit must be calculated in local currency and foreign currencies together as one gap.
We have set other liquidity limits and ratios that minimize liquidity risk. See “Item 11: Quantitative and Qualitative Disclosure About Market Risk.”
71

Table of Contents Cash Flow
The tables below set forth our main sources of cash. The subsidiaries are not an important source of cash flow for us and therefore have no impact on ourability to meet our cash obligations. No legal or economic restrictions exist on the ability of subsidiaries to transfer funds to us in the form of loans or cashdividends as long as these subsidiaries abide by the regulations of the Ley de Sociedad Anónimas regarding loans to related parties and minimum dividendpayments. Please see our Consolidated Statements of Cash Flows in our Audited Consolidated Financial Statements for a detailed breakdown of the Bank’s cashflow. Millions of Ch$ Year ended December 31, 2009 2008 Net cash provided by operating activities 1,323,587 (10,324)
Cash provided by operating activities totaled Ch$1,323,587 million in 2009 as a result of higher business activity, bond issuances and the decrease of ourloan book. This was partially offset by the decrease in deposits. The Ch$(10,324) million in cash consumed by operating activities in 2008 was mainly due to anincrease in the Bank’s loan book offset in part by the rise in deposits. Millions of Ch$ Year ended December 31, 2009 2008 Net cash provided by investment activities (28,129) (45,339)
Net cash used in investing activities in 2009 totaled Ch$28,129 million. The largest consumption of cash involved the purchase of fixed and intangible assetsoffset in part by the sale of fixed assets. In 2008, the consumption of cash for investing totaled Ch$45,339 million for the same reasons as in 2009. Millions of Ch$ Year ended December 31, 2009 2008 Net cash provided by financing activities (172,065) (173,608)
In 2009, the net cash used by financing activities totaled Ch$172,065 million and the main consumption the redemption of bonds and dividends paid. In2008 the consumption of cash by financing activities was due to similar reasons.
72

Table of Contents Deposits and Other Borrowings
The following table sets forth our average daily balance of liabilities for the years ended December 31, 2008 and 2009, in each case together with the relatedaverage nominal interest rates paid thereon.
(millions of Ch$, except percentages) 2009 2008
AverageBalance
% of TotalAverage
Liabilities
AverageNominal
Rate AverageBalance
% of TotalAverage
Liabilities
AverageNominal
Rate Savings accounts 100,294 0.5% (1.0%) 100,520 0.5% 8.5%Time deposits 8,355,446 41.8% 2.8% 8,343,001 45.1% 9.8%Central Bank borrowings 297,346 1.5% 0.9% 58,546 0.3% 8.6%Repurchase agreements 486,000 2.4% 2.9% 376,365 2.0% 10.6%Mortgage finance bonds 301,501 1.5% 2.8% 372,493 2.0% 15.0%Other interest bearing liabilities 3,909,793 19.6% 2.5% 3,373,806 18.3% 14.3%Subtotal interest bearing liabilities 13,450,380 67.3% 2.6% 12,624,731 68.2% 11.1%Non-interest bearing liabilities Non-interest bearing deposits 2,475,050 12.4% 2,456,747 13.3% Derivatives 1,387,026 6.9% 1,332,232 7.2% Other non-interest bearing liabilities 1,079,516 5.4% 769,286 4.2% Shareholders’ equity 1,599,938 8.0% 1,299,098 7.1% Subtotal non-interest bearing liabilities 6,541,530 32.7% 5,857,363 31.8%
Total liabilities 19,991,910 100.0% 18,482,094 100.0%
Our most important source of funding is our time deposits. Average time deposits represented 41.8% of our average total liabilities and shareholders’ equity
in 2009. Our current funding strategy is to continue to utilize all sources of funding in accordance with their costs, their availability and our general asset andliability management strategy. Special emphasis is being placed on lengthening the maturities of time deposits with institutional clients and increasing in generalour deposits from retail customers. We also intend to continue to broaden our customer deposit base and to emphasize core deposit funding. We have alsofollowed the strategy in 2009 of increasing senior and subordinated bonds to increase the duration of liabilities and fund the gro wth of the mortgage portfolio.We believe that broadening our deposit base by increasing the number of account holders has created a more stable funding source. Composition of Deposits
The following table sets forth the composition of our deposits and similar commitments at December 31, 2008 and 2009. 2009 2008 (in millions of Ch$) Demand deposits and other demand obligations Current accounts 2,776,607 2,268,991 Other deposits and demand accounts 303,495 206,347 Other demand obligations 453,432 472,824 Subtotals 3,533,534 2,948,162 Time deposits and other time deposits Time deposits 4,219,392 9,476,024 Time saving accounts 98,985 102,951 Other time deposits 2,856,880 177,291 Subtotals 7,175,257 9,756,266 Total deposits and other commitments 10,708,791 12,704,428
73

Table of Contents Maturity of Deposits
The following table sets forth information regarding the currency and maturity of our deposits as of December 31, 2009, expressed in percentages of ourtotal deposits in each currency category. UF-denominated deposits are similar to peso-denominated deposits in all respects, except that the principal is readjustedperiodically based on variations in the Chilean consumer price index.
Ch$ UF Foreign
Currencies Total Demand deposits 0.1% - - 0.0%Savings accounts 0.0% 3.7% - 1.4%Time deposits: Maturing within 3 months 75.9% 24.2% 77.8% 57.0%Maturing after 3 but within 6 months 10.8% 12.0% 13.4% 11.6%Maturing after 6 but within 12 months 7.9% 28.2% 8.8% 15.5%Maturing after 12 months 5.3% 31.9% 0.0% 14.5%
Total time deposits 99.9% 96.3% 100.0% 98.6%Total deposits 100.0% 100.0% 100.0% 100.0%
The following table sets forth information regarding the maturity of our outstanding time deposits in excess of US$100,000 as of December 31, 2009.
Ch$ UF Foreign
Currencies Total (in millions of Ch$) Time deposits:
Maturing within 3 months 2,338,964 644,901 618,582 3,602,447 Maturing after 3 but within 6 months 399,730 342,275 120,692 862,697 Maturing after 6 but within 12 months 258,880 743,318 79,976 1,082,174 Maturing after 12 months 159,056 746,733 68 905,857
Total time deposits 3,156,630 2,477,227 819,318 6,453,175
Short-term Borrowings
The principal categories of our short-term borrowings are amounts borrowed under foreign trade lines of credit, domestic interbank loans, Central Bankborrowings and repurchase agreements. The table below presents the amounts outstanding at each year-end indicated and the weighted-average nominal interestrate for each such year by type of short-term borrowing. 2009 2008
Balance
Weighted-AverageNominalInterest
Rate Balance
Weighted-AverageNominalInterest
Rate in millions of Ch$, except percentages Balances under repurchase agreements 166,852 0.2% 291,940 6.3%Central Bank borrowings 947,753 0.5% 269,430 8.5%Domestic interbank borrowings 26,301 0.4% 5,003 8.1%Borrowings under foreign trade credit lines 1,812,296 0.7% 1,107,997 1.9%
Total short-term borrowings 2,953,202 0.6% 1,674,370 3.7%
74

Table of Contents
The following table shows the average balance and the average nominal rate for each short-term borrowing category for the years indicated.
2009 2008
Average Balance Average Nominal
Interest Rate AverageBalance
AverageNominal
Interest Rate (in millions of Ch$, except percentages) Investment under repurchase agreements 486,000 2.9% 376,365 9.9%Central Bank borrowings 297,346 0.9% 58,546 8.5%Domestic interbank borrowings 81,767 1.7% 43,341 8.1%Borrowings under foreign trade credit lines 1,433,710 1.9% 1,276,543 3.9%
Total short-term borrowings 2,298,823 2.0% 1,754,795 5.4%
The following table presents the maximum month-end balances of our principal sources of short-term borrowings during the years indicated.
In millions of Ch$
Maximum 2009
Month-EndBalance
Maximum 2008
Month-EndBalance
Investment under repurchase agreements 1,165,241 425,463 Central Bank borrowings 2,711 2,675 Domestic interbank borrowings 256,717 154,101 Borrowings under foreign trade credit lines 2,014,913 1,751,620
Total short-term borrowings 3,439,582 2,333,859
75
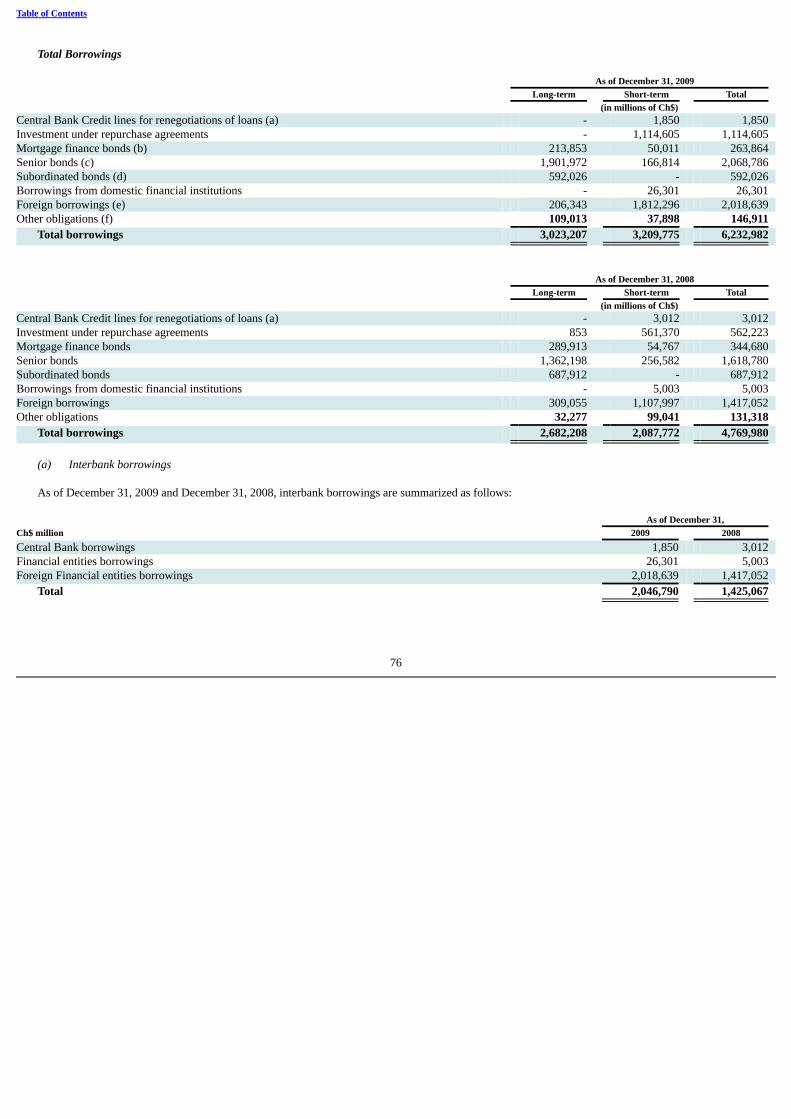
Table of Contents
Total Borrowings
As of December 31, 2009 Long-term Short-term Total (in millions of Ch$) Central Bank Credit lines for renegotiations of loans (a) - 1,850 1,850 Investment under repurchase agreements - 1,114,605 1,114,605 Mortgage finance bonds (b) 213,853 50,011 263,864 Senior bonds (c) 1,901,972 166,814 2,068,786 Subordinated bonds (d) 592,026 - 592,026 Borrowings from domestic financial institutions - 26,301 26,301 Foreign borrowings (e) 206,343 1,812,296 2,018,639 Other obligations (f) 109,013 37,898 146,911
Total borrowings 3,023,207 3,209,775 6,232,982
As of December 31, 2008 Long-term Short-term Total (in millions of Ch$) Central Bank Credit lines for renegotiations of loans (a) - 3,012 3,012 Investment under repurchase agreements 853 561,370 562,223 Mortgage finance bonds 289,913 54,767 344,680 Senior bonds 1,362,198 256,582 1,618,780 Subordinated bonds 687,912 - 687,912 Borrowings from domestic financial institutions - 5,003 5,003 Foreign borrowings 309,055 1,107,997 1,417,052 Other obligations 32,277 99,041 131,318
Total borrowings 2,682,208 2,087,772 4,769,980
(a) Interbank borrowings
As of December 31, 2009 and December 31, 2008, interbank borrowings are summarized as follows: As of December 31, Ch$ million 2009 2008 Central Bank borrowings 1,850 3,012 Financial entities borrowings 26,301 5,003 Foreign Financial entities borrowings 2,018,639 1,417,052
Total 2,046,790 1,425,067
76

Table of Contents
Credit lines for renegotiations of loans Central Bank borrowings include credit lines for the renegotiations of loans and other Central Bank borrowings. These credit lines were provided by the CentralBank for the renegotiations of loans due to the need to refinance debts as a result of the economic recession and crisis of the banking system in the early 1980s.The lines for the renegotiations, which are considered long-term, are related with mortgage loans linked to the UF index and bore a real annual interest rate of3% as of December 31, 2008 and 2009. The maturities of the outstanding amounts due under these credit lines, which are considered long-term, are as follows:
As of December
31, 2009
(in millions of
Ch$) Due within 1 year 1,850
Total 1,850
(b) Mortgage finance bonds
These bonds are used to finance the granting of mortgage loans. The outstanding principal amounts of the bonds are amortized on a quarterly basis. Therange of maturities of these bonds is between five and twenty years. The bonds are linked to the UF index and bear a real weighted-average annual interest rateof 4.6% and 4.7% as of December 31, 2008 and 2009, respectively. The following table sets forth the remaining maturities of our mortgage finance bonds atDecember 31, 2009.
As of December
31, 2009
(in millions of
Ch$) Due within 1 year 50,011 Due after 1 year but within 2 years 31,804 Due after 2 years but within 3 years 28,574 Due after 3 years but within 4 years 23,277 Due after 4 years but within 5 years 27,350 Due after 5 years 102,848
Total mortgage finance bonds 263,864
(c) Senior Bonds
The following table sets forth, at the dates indicated, our issued bonds. The bonds are denominated principally in UFs or U.S. dollars, and are principallyused to fund the Bank’s mortgage portfolio. As of December 31, 2009 2008 (in millions of Ch$) Santander bonds denominated in UF 1,660,877 1,362,198 Santander bonds denominated in US$ 407,909 256,582
Total bonds 2,068,786 1,618,780
77

Table of Contents
The maturities of these bonds are as follows:
As of December31, 2009
(in millions ofCh$)
Due within 1 year 166,814 Due after 1 year but within 2 years 218,339 Due after 2 years but within 3 years 438,446 Due after 3 years but within 4 years 378,064 Due after 4 years but within 5 years 171,647 Due after 5 years 695,476
Total bonds 2,068,786
In 2009 the Bank also issued senior bonds for UF 16,289,000 and USD 800,000.000.
Bonds Series
Amount
Term
Issue Rate
Issue Date
Maturity Date
F1 UF 3,000,000 8 years 3.50% per annum simple 5/2/2008 5/2/2016
F2 UF 2,379,000 9 years 4.20% per annum simple 9/1/2008 9/1/2017
F3 UF 3,000,000 5 years 4.50% per annum simple 2/1/2009 2/1/2014
F4 UF 3,000,000 4 years 4.50% per annum simple 2/1/2009 2/1/2013
F5 UF 3,000,000 4.5 years 2.50% per annum simple 5/1/2009 11/1/2013
F6 UF 3,000,000(*) 5 years 3.50% per annum simple 9/1/2009 9/1/2014
F7 UF 3,000,000(**) 4.5 years 3.30% per annum simple 11/1/2009 5/1/2014
Total UF 20,379,000
144 A USD 500,000,000 3 years 2.88% per annum simple 11/13/2009 11/13/2012
144 A USD 300,000,000 3 years 2.88% per annum simple 11/13/2009 11/13/2012
Total USD 800,000,000
(*) On September 1, 2009 a line of bank bonds totaling UF 3,000,000 corresponding to Series F6 with a 5-year term was registered in the SBIF’s Registry ofSecurities. The F6 bond has an unplaced face value of UF 1,090,000 as of December 31, 2009.
(**) On November 1, 2009 a line of bonds totaling UF 3,000,000 corresponding to Series F7 with a 4.5-year term was registered in the Superintendency of
Banks and Financial Institutions’ registry of securities. No placements of this bond have been made in the current fiscal year.
(d) Subordinated bonds
The following table sets forth, at the dates indicated, the balances of our subordinated bonds. The following table sets forth, at the dates indicated, our issuedsubordinated bonds. The bonds are denominated principally in UFs or U.S. dollars, and are principally used to fund the Bank’s mortgage portfolio and can beconsidered in the Bank’s regulatory capital. As of December 31, 2009 2008 (in millions of Ch$) Subordinated bonds denominated in US$ 278,087 364,410 Subordinated bonds linked to the UF 313,939 323,502
Total subordinated bonds 592,026 687,912
78

Table of Contents
The maturities of these bonds, which are considered long-term, are as follows.
As of December
31, 2009
(in millions of
Ch$) Due within 1 year - Due after 1 year but within 2 years 12,899 Due after 2 years but within 3 years 119,211 Due after 3 years but within 4 years - Due after 4 years but within 5 years 158,876 Due after 5 years 301,040
Total subordinated bonds 592,026
In 2009, the Bank issued subordinated bonds in the local market for UF 300,000 (Ch$6,283 million), as follows:
Subordinated bonds
Series
Amount
Term
Issue rate
Issue date
Maturity date
G2 (*) UF 300,000 30 years 4.8% per annum simple 9/1/2008 3/1/2038
Total UF 300,000
(*) As of December 31, 2009 there are unplaced Series G2 bonds with a U.F. face value 1,950,000.
(e) Foreign borrowings
These are short-term and long-term borrowings from foreign banks used to fund our foreign trade business. The maturities of these borrowings are asfollows.
As of December
31, 2009
(in millions of
Ch$) Due within 1 year 1,812,296 Due after 1 year but within 2 years 206,343
Total foreign borrowings 2,018,639
The foreign borrowings are denominated principally in U.S. dollars, and are principally used to fund the Bank’s foreign trade loans, and bear an annualaverage interest rate of 3.9% and 1.4% at December 31, 2008 and 2009, respectively.
(f) Other obligations
Other obligations are summarized as follows:
As of December
31, 2009
(in millions of
Ch$) Due after 1 year but within 2 years 4,583 Due after 2 years but within 3 years 3,515 Due after 3 years but within 4 years 3,556 Due after 4 years but within 5 years 27,868 Due after 5 years 69,491
Total long term obligations 109,013 Amounts due to credit card operators 31,045 Other obligations, due in less than 1 year 6,853
Total short-term obligations 37,898 Total other obligations 146,911
79
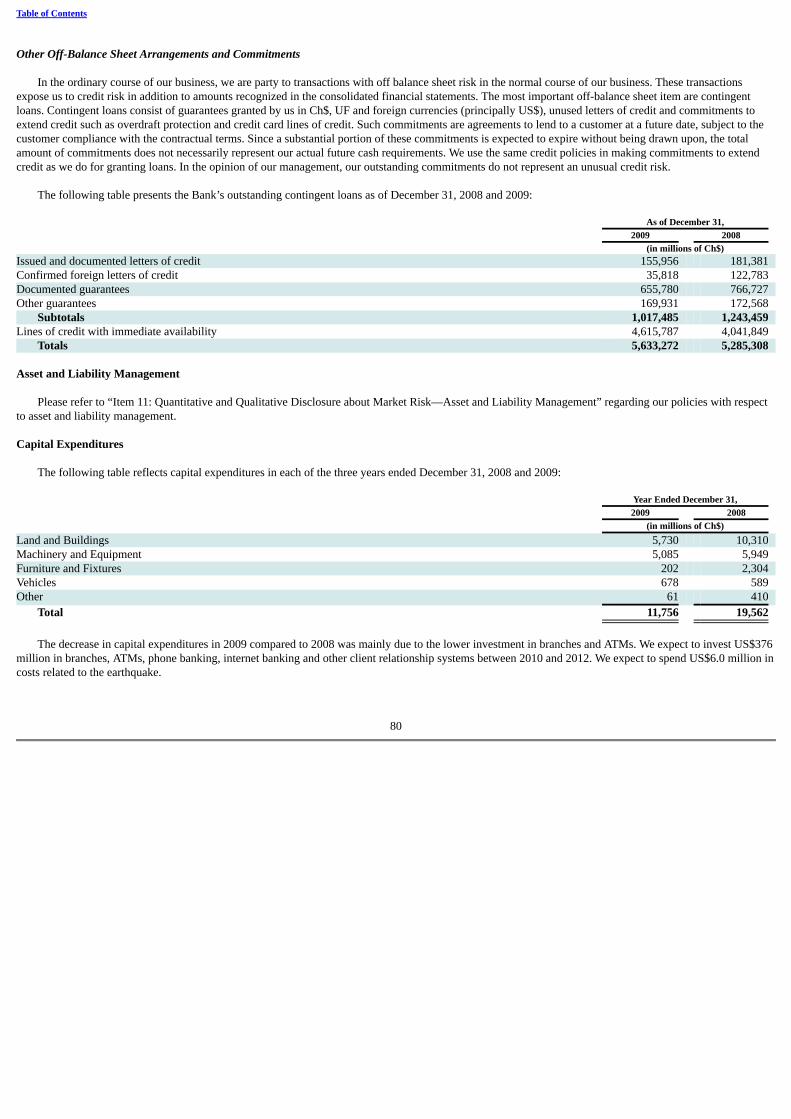
Table of Contents
Other Off-Balance Sheet Arrangements and Commitments
In the ordinary course of our business, we are party to transactions with off balance sheet risk in the normal course of our business. These transactionsexpose us to credit risk in addition to amounts recognized in the consolidated financial statements. The most important off-balance sheet item are contingentloans. Contingent loans consist of guarantees granted by us in Ch$, UF and foreign currencies (principally US$), unused letters of credit and commitments toextend credit such as overdraft protection and credit card lines of credit. Such commitments are agreements to lend to a customer at a future date, subject to thecustomer compliance with the contractual terms. Since a substantial portion of these commitments is expected to expire without being drawn upon, the totalamount of commitments does not necessarily represent our actual future cash requirements. We use the same credit policies in making commitments to extendcredit as we do for granting loans. In the opinion of our management, our outstanding commitments do not represent an unusual credit risk.
The following table presents the Bank’s outstanding contingent loans as of December 31, 2008 and 2009: As of December 31, 2009 2008 (in millions of Ch$) Issued and documented letters of credit 155,956 181,381 Confirmed foreign letters of credit 35,818 122,783 Documented guarantees 655,780 766,727 Other guarantees 169,931 172,568
Subtotals 1,017,485 1,243,459 Lines of credit with immediate availability 4,615,787 4,041,849
Totals 5,633,272 5,285,308
Asset and Liability Management
Please refer to “Item 11: Quantitative and Qualitative Disclosure about Market Risk—Asset and Liability Management” regarding our policies with respectto asset and liability management. Capital Expenditures
The following table reflects capital expenditures in each of the three years ended December 31, 2008 and 2009: Year Ended December 31, 2009 2008 (in millions of Ch$) Land and Buildings 5,730 10,310 Machinery and Equipment 5,085 5,949 Furniture and Fixtures 202 2,304 Vehicles 678 589 Other 61 410
Total 11,756 19,562
The decrease in capital expenditures in 2009 compared to 2008 was mainly due to the lower investment in branches and ATMs. We expect to invest US$376million in branches, ATMs, phone banking, internet banking and other client relationship systems between 2010 and 2012. We expect to spend US$6.0 million incosts related to the earthquake.
80

Table of Contents F. Selected Statistical Information
The following information is included for analytical purposes and should be read in conjunction with our Audited Consolidated Financial Statements as wellas the discussion in the section entitled “Management’s Discussion and Analysis of our Financial Condition and Results of Operations.” The UF is linked to, andis adjusted daily to, reflect changes in the previous month’s Chilean consumer price index. See “Management’s Discussion and Analysis of Financial Conditionand Results of Operations—Impact of Inflation. The following tables show, by currency of denomination, average balances and, where applicable, interestamounts and real rates for our assets and liabilities for the years ended December 31, 2008 and 2009. Average Balance Sheets, Income Earned from Interest-Earning Assets and Interest Paid on Interest-Bearing Liabilities
The average balances for interest-earning assets and interest-bearing liabilities, including interest and readjustments received and paid, have been calculatedon the basis of daily balances for us on an unconsolidated basis. Such average balances are presented in Chilean pesos, UFs and in foreign currencies (principallyU.S. dollars). Figures from our subsidiaries have been calculated on the basis of monthly balances. The average balances of our subsidiaries, except SantanderS.A. Agente de Valores, have not been categorized by currency. As such it is not possible to calculate average balances by currency for such subsidiaries on thebasis of daily, weekly or monthly balances.
The nominal interest rate has been calculated by dividing the amount of interest and principal readjustment due to changes in the UF index (gain or loss)during the period by the related average balance, both amounts expressed in constant pesos. The nominal rates calculated for each period have been convertedinto real rates using the following formulas:
Where:
Rp = real average rate for peso-denominated assets and liabilities (in Ch$ and UF) for the period;
Rd = real average rate for foreign currency-denominated assets and liabilities for the period;
Np = nominal average rate for peso-denominated assets and liabilities for the period;
Nd = nominal average rate for foreign currency-denominated assets and liabilities for the period;
D = devaluation rate of the Chilean peso to the U.S. dollar for the period; and
I = inflation rate in Chile for the period (based on the variation of the Chilean Consumer Price Index). The real interest rate can be negative for a portfolio of peso-denominated loans when the inflation rate for the period is higher than the average nominal rate
of the loan portfolio for the same period. A similar effect could occur for a portfolio of foreign currency denominated loans when the inflation rate for the periodis higher than the sum of the devaluation rate for the period and the corresponding average nominal rate of the portfolio.
81

Table of Contents
The formula for the average real rate for foreign currency denominated assets and liabilities (Rd) reflects a gain or loss in purchasing power caused by the
difference between the devaluation rate of the Chilean peso and the inflation rate in Chile during the period. The following example illustrates the calculation ofthe real interest rate for a dollar-denominated asset bearing a nominal annual interest rate of 10.0% (Nd = 0.10), assuming a 5.0% annual devaluation rate (D =0.05) and a 12.0% annual inflation rate (I = 0.12):
In the example, since the inflation rate was higher than the devaluation rate, the real rate is lower than the nominal rate in dollars. If, for example, the annual
devaluation rate were 15.0%, using the same numbers, the real rate in Chilean pesos would be 12.9%, which is higher than the nominal rate in U.S. dollars.Using the same numbers, if the annual inflation rate were greater than 15.5%, the real rate would be negative.
Foreign exchange gains or losses on foreign currency-denominated assets and liabilities are not included in interest income or expense. Similarly, interest onthe available for sale investment portfolio does not include trading or mark-to-market gains or losses on these investments. Interest is not recognized on non-performing loans. Non-performing loans that are overdue for 90 days or less have been included in each of the various categories of loans, and therefore affectthe various averages. Non-performing loans consist of loans as to which either principal or interest is overdue (i.e., non-accrual loans) and restructured loansearning no interest.
Included in interbank deposits are checking accounts maintained in the Central Bank and foreign banks. Such assets have a distorting effect on the averageinterest rate earned on total interest-earning assets because currently balances maintained in Chilean peso amounts do not earn interest, and the only balancesheld in a foreign currency that earn interest are those maintained in U.S. dollars, but those only earn interest on the amounts that are legally required to be heldfor liquidity purposes. Additionally, this account includes interest earned by overnight investments. Consequently, the average interest earned on such assets iscomparatively low. We maintain these deposits in these accounts to comply with statutory requirements and to facilitate international business, rather than to earnincome.
The following tables show, by currency of denomination, average balances and, where applicable, interest amounts and real rates for our assets and liabilitiesfor the years ended December 31, 2008 and 2009.
82

Table of Contents Year ended December 31, 2009 2008
AverageBalance
InterestEarned
AverageReal Rate
AverageNominal Rate
AverageBalance
InterestEarned
AverageReal Rate
AverageNominal Rate
(in millions of Ch$, except for rate data) ASSETS INTEREST-EARNING ASSETS Deposits in Central Bank Ch$ 207,738 2,652 3.9% 1.3% 114,052 9,515 (0.5%) 8.3%UF – – –% –% – – –% –%Foreign currencies – – –% –% – – –% –%
Subtotal 207,738 2,652 3.9% 1.3% 114,052 9,515 (0.5%) 8.3%Financial investments Ch$ 939,455 32,782 6.2% 3.5% 851,635 80,356 0.5% 9.4%UF 547,220 4,507 3.5% 0.8% 614,704 51,794 (0.4%) 8.4%Foreign currencies 486,051 5,840 (17.8%) 1.2% 900,291 5,888 19.1% 0.7%
Subtotal 1,972,726 43,129 (0.5%) 2.2% 2,366,630 138,038 7.3% 5.8%Commercial Loans Ch$ 3,624,473 375,026 13.2% 10.4% 3,232,299 456,590 4.8% 14.1%UF 2,822,742 111,952 6.7% 4.0% 3,015,409 410,113 4.3% 13.6%Foreign currencies 1,053,718 53,074 (14.7%) 5.0% 1,076,102 60,080 24.9% 5.6%
Subtotal 7,500,933 540,052 6.9% 7.2% 7,323,810 926,783 7.6% 12.7%Consumer loans Ch$ 2,018,473 501,981 28.1% 24.9% 1,835,824 449,591 14.3% 24.5%UF 115,640 6,320 8.2% 5.5% 113,148 18,161 6.6% 16.1%Foreign currencies 8,161 1 (18.8%) –% 8,161 – 18.3% –%
Subtotal 2,142,274 508,302 26.9% 23.7% 1,957,133 467,752 13.9% 23.9%Mortgage loans Ch$ 6,028 535 11.7% 8.9% 14,359 1,310 0.2% 9.1%UF 3,946,434 101,804 5.3% 2.6% 3,637,661 510,362 4.7% 14.0%Foreign currencies – – –% –% – – –% –%
Subtotal 3,952,462 102,339 5.3% 2.6% 3,652,020 511,672 4.7% 14.0%Interbank Loans Ch$ 19,532 262 4.0% 1.3% 16,838 1,077 (2.3%) 6.4%UF – – –% –% 56 – (8.2%) –%Foreign currencies 2,521 – (18.8%) –% 5,618 196 22.4% 3.5%
Subtotal 22,053 262 1.4% 1.2% 22,512 1,273 3.8% 5.7%Investments under agreements to
resell Ch$ 261,288 10,680 6.8% 4.1% 21,148 1,610 (1.2%) 7.6%UF 852 31 6.4% 3.6% – – –% –%Foreign currencies 198 6 (16.4%) 3.0% – – –% –%
Subtotal 262,338 10,717 6.8% 4.1% 21,148 1,610 (1.2%) 7.6%Threshold Ch$ – – –% –% – – –% –%UF – – –% –% – – –% –%Foreign currencies 205,068 325 (18.7%) 0.2% 224,449 4,703 20.8% 2.1%
Subtotal 205,068 325 (18.7%) 0.2% 224,449 4,703 20.8% 2.1%Total interest-earning assets (1) Ch$ 7,076,987 923,918 16.0% 13.1% 6,086,155 1,000,049 6.9% 16.4%UF 7,432,888 224,614 5.7% 3.0% 7,380,978 990,430 4.2% 13.4%Foreign currencies 1,755,717 59,246 (16.1%) 3.4% 2,214,621 70,867 22.1% 3.2%
Subtotal 16,265,592 1,207,778 7.8% 7.4% 15,681,754 2,061,346 7.8% 13.1%
83

Table of Contents
Year ended December 31, 2009 2008
AverageBalance
InterestEarned
AverageReal Rate
AverageNominal
Rate AverageBalance
InterestEarned
AverageReal Rate
AverageNominal
Rate (in millions of Ch$, except for rate data) NON-INTEREST-EARNING
ASSETS Cash Ch$ 398,396 – – – 275,180 – – – UF – – – – – – – – Foreign currencies 14,482 – – – 19,432 – – –
Subtotal 412,878 – – – 294,612 – – – Reserves for loan losses – – – Ch$ (315,361) – – – (248,172) – – – UF – – – – – – – – Foreign currencies – – – – – – – –
Subtotal (315,361) – – – (248,172) – – – Fixed Assets – – – Ch$ 215,789 – – – 257,548 – – – UF – – – – – – – – Foreign currencies – – – – – – – –
Subtotal 215,789 – – – 257,548 – – – Derivatives – – – Ch$ 1,708,712 – – – 1,861,855 – – – UF (184,072) – – – (1,507,963) – – – Foreign currencies (7,390) – – – 1,064,876 – – –
Subtotal 1,517,250 – – – 1,418,768 – – – Financial investments trading (1) – – – Ch$ 233,977 – – – 125,073 – – – UF 726,009 – – – 308,302 – – – Foreign currencies 45,029 – – – 28,367 – – –
Subtotal 1,005,015 – – – 461,742 – – – Other assets – – – Ch$ 688,310 – – – 184,142 – – – UF 42,584 – – – 66,754 – – – Foreign currencies 159,853 – – – 364,946 – – –
Subtotal 890,747 – – – 615,842 – – – Total non-interest earning assets – – – Ch$ 2,929,823 – – – 2,455,626 – – – UF 584,521 – – – (1,132,907) – – – Foreign currencies 211,974 – – – 1,477,621 – – –
Total 3,726,318 – – – 2,800,340 – – – TOTAL ASSETS Ch$ 10,006,810 923,918 – – 8,541,781 1,000,049 – – UF 8,017,409 224,614 – – 6,248,071 990,430 – – Foreign currencies 1,967,691 59,246 – – 3,692,242 70,867 – –
Total 19,991,910 1,207,778 – – 18,482,094 2,061,346 – –
84

Table of Contents
Year ended December 31, 2009 2008
Average Balance
Interest Paid
Average Real
RateAverage Nominal
Rate Average Balance Interest Paid
Average RealRate
Average NominalRate
(in millions of Ch$, except for rate data)LIABILITIES AND SHAREHOLDERS'
EQUITY
INTEREST-BEARING LIABILITIES Savings accounts Ch$ 777 11 4.1% 1.5% 739 13 (6.5%) 1.8%UF 99,517 (1,039) 1.6% (1.0%) 99,781 8,516 (0.3%) 8.5%Foreign currencies - - - - - - - -
Subtotal 100,294 (1,028) 1.6% (1.0%) 100,520 8,529 (0.3%) 8.5%Time deposits Ch$ 4,442,195 183,641 6.9% 4.1% 3,879,461 291,134 (1.3%) 7.5%UF 2,490,859 19,618 3.4% 0.8% 2,958,841 368,973 3.3% 12.5%Foreign currencies 1,422,392 26,614 (17.3%) 1.9% 1,504,699 55,842 (4.8%) 3.7%
Subtotal 8,355,446 229,873 1.7% 2.8% 8,343,001 715,949 (0.3%) 9.8%Central Bank borrowings Ch$ 295,319 2,561 3.5% 0.9% 55,300 4,570 (0.6%) 8.3%UF 2,027 (11) 2.1% (0.5%) 3,246 386 2.8% 11.9%Foreign currencies - - - - - - - -
Subtotal 297,346 2,550 3.5% 0.9% 58,546 4,956 (0.4%) 8.6%Repurchase agreements Ch$ 461,168 13,454 5.6% 2.9% 311,307 34,487 2.0% 11.1%UF 23,915 429 4.5% 1.8% 9,080 940 1.3% 10.4%Foreign currencies 917 1 (18.7%) 0.1% 55,978 1,925 (5.0%) 3.4%
Subtotal 486,000 13,884 5.5% 2.9% 376,365 37,352 0.9% 10.6%Mortgage finance bonds Ch$ - - - - - - - -UF 301,501 8,391 5.5% 2.8% 372,493 55,713 5.6% 15.0%Foreign currencies - - - - - - - -
Subtotal 301,501 8,391 5.5% 2.8% 372,493 55,713 5.6% 15.0%Other interest-bearing liabilities Ch$ 141,415 8,173 8.6% 5.8% 99,390 10,697 (1.7%) 10.8%UF 1,825,455 40,171 4.9% 2.2% 1,497,974 260,230 7.8% 17.4%Foreign currencies 1,942,923 49,248 (16.6%) 2.5% 1,776,442 75,854 (4.2%) 4.3%
Subtotal 3,909,793 97,592 (5.7%) 2.5% 3,373,806 346,781 1.3% 14.3%Total interest-bearing liabilities Ch$ 5,340,874 207,840 6.6% 3.9% 4,346,197 340,901 (1.0%) 7.8%UF 4,743,274 67,559 4.1% 1.4% 4,941,415 694,758 4.7% 14.1%Foreign currencies 3,366,232 75,863 (17.0%) 2.3% 3,337,119 133,621 (4.5%) 4.0%
Total 13,450,380 351,262 (0.2%) 2.6% 12,624,731 1,169,280 0.3% 11.1%
85

Table of Contents Year ended December 31, 2009 2008
AverageBalance Interest Paid
Average RealRate
AverageNominal Rate
AverageBalance Interest Paid
Average RealRate
AverageNominal Rate
(in millions of Ch$ except for rate data) NON-INTEREST-BEARING
LIABILITIES Non-interest-bearing demand
deposits Ch$ 2,458,860 - - - 2,455,741 - - - UF 13,039 - - - 25 - - - Foreign currencies 3,151 - - - 981 - - - Subtotal 2,475,050 - - - 2,456,747 - - -
Derivatives Ch$ 1,059,863 - - - 1,027,615 - - - UF 193,392 - - - 168,985 - - - Foreign currencies 133,771 - - - 135,632 - - - Subtotal 1,387,026 - - - 1,332,232 - - -
Other non-interest-bearing liabilities Ch$ 512,216 - - - 423,539 - - - UF 287,124 - - - 244,874 - - - Foreign currencies 280,176 - - - 100,873 - - - Subtotal 1,079,516 - - - 769,286 - - -
Shareholders` Equity Ch$ 1,599,938 - - - 1,299,098 - - - UF - - - - - - - - Foreign currencies - - - - - - - - Subtotal 1,599,938 - - - 1,299,098 - - -
Total non-interest-bearing liabilitiesand shareholders’ equity Ch$ 5,630,877 - - - 5,205,993 - - - UF 493,555 - - - 413,884 - - - Foreign currencies 417,098 - - - 237,486 - - - Total 6,541,530 - - - 5,857,363 - - -
TOTAL LIABILITIES ANDSHAREHOLDERS’ EQUITY Ch$ 10,971,751 207,840 - - 9,552,190 340,901 - - UF 5,236,829 67,559 - - 5,355,299 694,758 - - Foreign currencies 3,783,330 75,863 - - 3,574,605 133,621 - - Total 19,991,910 351,262 - - 18,482,094 1,169,280 - -
Changes in Net Interest Revenue and Interest Expense: Volume and Rate Analysis
The following table allocates, by currency of denomination, changes in our interest revenue and interest expense between changes in the average volume ofinterest-earning assets and interest-bearing liabilities and changes in their respective nominal interest rates for 2008 compared to 2007 and 2009 compared to2008. Volume and rate variances have been calculated based on movements in average balances over the period and changes in nominal interest rates on averageinterest-earning assets and average interest-bearing liabilities.
86

Table of Contents Increase (Decrease) from 2008 to 2009 Due to Changes in
Volume Rate Rate andVolume
Net Changefrom 2008 to
2009 ASSETS Interest-earning assets Deposits in Central Bank Ch $ 7,745 (8,019) (6,589) (6,863) UF – – – – Foreign currency – – – – Total 7,745 (8,019) (6,589) (6,863)Financial investments Ch $ 8,230 (50,596) (5,208) (47,574) UF (5,673) (46,741) 5,127 (47,287) Foreign currency (2,793) 4,711 (1,966) (48) Total (236) (92,626) (2,047) (94,909)Commercial loans Ch $ 54,608 (121,432) (14,740) (81,564) UF (26,253) (290,379) 18,471 (298,161) Foreign currency (1,161) (5,980) 135 (7,006) Total 27,194 (417,791) 3,866 (386,731)Consumer loans Ch $ 44,382 7,283 725 52,390 UF 401 (11,978) (264) (11,841) Foreign currency – 1 – 1 Total 44,783 (4,694) 461 40,550 Mortgage loans Ch $ (762) (30) 17 (775) UF 43,220 (416,573) (35,205) (408,558) Foreign currency – – – – Total 42,458 (416,603) (35,188) (409,333)Interbank loans Ch $ 174 (853) (136) (815) UF – – – – Foreign currency (108) (196) 108 (196) Total 66 (1,049) (28) (1,011)Investments Under Agreements to Resell Ch $ 18,227 (744) (8,413) 9,070 UF – – 31 31 Foreign currency – – 6 6 Total 18,227 (744) (8,376) 9,107 Threshold Ch $ – – – – UF – – – – Foreign currency (409) (4,335) 366 (4,378) Total (409) (4,335) 366 (4,378)Total interest-earning assets Ch $ 132,604 (174,391) (34,344) (76,131) UF 11,695 (765,671) (11,840) (765,816) Foreign currency (4,471) (5,799) (1,351) (11,621) Total 139,828 (945,861) (47,535) (853,568)
87

Table of Contents Increase (Decrease) from 2008 to 2009
Volume Rate Rate and Volume Net Change from
2008 to 2009 LIABILITIES Interest-bearing liabilities Savings accounts
Ch$ 1 (2) (1) (2)UF (23) (9,556) 24 (9,555)
Foreign currencies – – – – Subtotal (22) (9,558) 23 (9,557)
Time deposits Ch$ 42,473 (130,967) (18,999) (107,493)UF (58,434) (345,739) 54,818 (349,355)
Foreign currencies (3,100) (27,585) 1,457 (29,228)Subtotal (19,061) (504,291) 37,276 (486,076)
Central Bank borrowings Ch$ 19,885 (4,097) (17,797) (2,009)UF (145) (403) 151 (397)
Foreign currencies – – – – Subtotal 19,740 (4,500) (17,646) (2,406)
Repurchase agreements Ch$ 16,680 (25,457) (12,256) (21,033)UF 1,544 (780) (1,275) (511)
Foreign currencies (1,880) (1,855) 1,811 (1,924)Subtotal 16,344 (28,092) (11,720) (23,468)
Mortgage finance bonds Ch$ – – – – UF (10,630) (45,368) 8,676 (47,322)
Foreign currencies – – – – Subtotal (10,630) (45,368) 8,676 (47,322)
Other interest-bearing liabilities Ch$ 4,542 (4,967) (2,099) (2,524)UF 57,055 (227,400) (49,714) (220,059)
Foreign currencies 7,360 (31,056) (2,910) (26,606)Subtotal 68,957 (263,423) (54,723) (249,189)
Total interest-bearing liabilities Ch$ 83,581 (165,490) (51,152) (133,061)UF (10,633) (629,246) 12,680 (627,199)
Foreign currencies 2,380 (60,496) 358 (57,758)Total 75,328 (855,232) (38,114) (818,018)
88

Table of Contents
Interest-Earning Assets: Net Interest Margin
The following table analyzes, by currency of denomination, the levels of average interest-earning assets and net interest earned by Santander-Chile, andillustrates the comparative margins obtained, for each of the years indicated in the table. 2009 2008 (in millions of Ch$) Total average interest-earning assets Ch$ 7,076,987 6,086,155 UF 7,432,888 7,380,978 Foreign currencies 1,755,717 2,214,621 Total 16,265,592 15,681,754 Net interest earned (1) Ch$ 716,078 659,148 UF 157,055 295,672 Foreign currencies (16,617) (62,754)Total 856,516 892,066 Net interest margin (2) Ch$ 10.1% 10.8%UF 2.1% 4.0%Foreign currencies (0.9%) (2.8%)Total 5.3% 5.7%
(1) Net interest earned is defined as interest revenue earned less interest expense incurred. (2) Net interest margin is defined as net interest earned divided by total average interest-earning assets. Return on Equity and Assets; Dividend Payout
The following table presents certain information and selected financial ratios for Santander-Chile for the years indicated. Ch$ million 2009 2008 Net income 436,610 420,967 Average total assets 19,991,910 18,482,094 Average equity 1,599,938 1,299,098 Net income as a percentage of:
Average total assets 2.2% 2.3%Average equity 27.3% 32.4%
Average equity as a percentage of: Average total assets 8.0% 7.0%
The following table presents dividends declared and paid by us in nominal terms in the following years:
Year
DividendCh$ mn (1)
Per shareCh$/share (2)
Per ADRCh$/ADR (3)
% overearnings (4)
% overearnings (5)
2009 213,295 1.13 1,176.00 65 52 2010 258,751 1.37 1,426.63 60 60
(1) Millions of nominal pesos. (2) Calculated on the basis of 188,446 million shares. (3) Calculated on the basis of 1,039 shares per ADS. (4) Calculated by dividing dividend paid in the year by net income attributable to shareholders for the previous year as required by local regulations. (5) Calculated by dividing dividend paid in the year by net income attributable to shareholders for the previous year under IFRS.
89

Table of Contents Loan Portfolio
The following table analyzes our loans by product type. Except where otherwise specified, all loan amounts stated below are before deduction for loan lossallowances. Total loans reflect our loan portfolio, including principal amounts of past due loan and substandard loans. Any collateral provided generally consistsof a mortgage on real estate, a pledge of marketable securities, a letter of credit or cash. The existence and amount of collateral generally vary from loan to loan. As of December 31, 2009 2008 (Ch$ million) Commercial Loans: Commercial loans 5,489,595 5,475,455 Foreign trade loans(1) 636,328 1,459,184 Loans with mortgage guarantee 92,911 121,400 Factoring operations 130,272 323,136 Leasing contracts 964,698 965,094 Other loans and accounts receivables from customers 10,958 11,591
Subtotal 7,324,762 8,355,860 Mortgage loans: Draft loans 175,592 228,722 Mortgage finance bonds 199,139 197,305 Other mortgage mutual loans 3,784,322 3,554,529 Leasing contracts - - Other loans and accounts receivables from customers - -
Subtotal 4,159,053 3,980,556 Consumer loans: Installment consumer loans 1,378,044 1,347,142 Credit card loans 586,937 582,593 Consumer leasing contracts 3,835 4,865 Other consumer loans 275,233 314,538
Subtotal 2,244,049 2,249,138 Subtotal Loans to customers 13,727,864 14,585,554 Interbank loans 23,412 95,534
Total 13,751,276 14,681,088
(1) The decline in foreign trade loans is due to lower trade volume as a result of the global economic slowdown and a focus on higher yielding loans.
The loan categories are as follows:
Commercial loans
Commercial loans are long-term and short-term loans, including checking overdraft lines for companies granted in Chilean pesos, inflation linked, US$linked or denominated in US$. The interest on these loans is fixed or variable and is used primarily to finance working capital or investments. Generalcommercial loans also includes factoring operations.
Foreign trade loans are fixed rate, short-term loans made in foreign currencies (principally U.S.$) to finance imports and exports.
90

Table of Contents
Mortgage loans financed with mortgage bonds mainly include mortgage loans (fixed and variable rate) that are inflation-indexed long-term loans withmonthly payments of principal and interest secured by a real property mortgage. These are financed by issuing mortgage bonds.
Factoring operations mainly include short-term loans to companies with a fixed monthly nominal rate backed by a company invoice.
Leasing contracts are agreements for the financial leasing of capital equipment and other property.
Other outstanding loans include other loans and accounts payable.
Residential mortgage loans
Draft loans mainly include mortgage loans (fixed and variable rate) that are inflation-indexed long-term loans with monthly payments of principal andinterest secured by a real property mortgage. These loans can be endorsed to a third party. These are financed by our general borrowings.
Residential mortgage loans backed by mortgage bonds are inflation-indexed, fixed or variable rate, long-term loans with monthly payments of principal andinterest secured by a real property mortgage that are financed with mortgage finance bonds. At the time of approval, these types of mortgage loans cannot bemore than 75% of the lower of the purchase price or the appraised value of the mortgaged property or such loan will be classified as a commercial loan.Mortgage bonds are our general obligations, and we are liable for all principal and accrued interest on such bonds. In addition, if the issuer of a mortgage financebond becomes insolvent, the General Banking Law’s liquidation procedures provide that these types of mortgage loans with their correspondin g mortgage bondsshall be auctioned as a unit and the acquirer must continue paying the mortgage finance bonds under the same conditions as the original issuer.
Other mortgage mutual loans mainly include mortgage loans (fixed and variable rate) that are inflation-indexed long-term loans with monthly payments ofprincipal and interest secured by a real property mortgage. These are financed by our general borrowings.
Consumer loans
Installment consumer loans are loans to individuals, granted in Chilean pesos, generally on a fixed rate nominal basis, to finance the purchase of consumergoods or to pay for services.
Consumer loans through lines of credit are checking overdraft lines to individuals, granted in Chilean pesos, generally on a fixed rate nominal basis andlinked to an individual’s checking account.
Credit card loans include credit card balances subject to nominal fixed rate interest charges.
Consumer leasing contracts are agreements for the financial leasing of automobiles and other property to individuals.
Non-client loans
Interbank loans are fixed rate, short-term loans to financial institutions that operate in Chile.
91

Table of Contents Maturity and Interest Rate Sensitivity of Loans
The following table sets forth an analysis by type and time remaining to maturity of our loans at December 31, 2009.
Due in 1 year
or less
Due after 1year through 5
years Due after 5
years
Total balanceat December
31, 2009 (in millions of Ch$) General commercial loans 2,414,031 1,954,832 1,120,732 5,489,595 Foreign trade loans 510,427 99,550 26,351 636,328 Leasing contracts 255,535 456,909 252,254 964,698 Other outstanding loans 146,796 87,345 – 234,141 Subtotal commercial loans 3,326,789 2,598,636 1,399,337 7,324,762 Residential loans backed by mortgage bonds 36,904 77,193 61,495 175,592 Other residential mortgage loans 250,723 732,598 3,000,140 3,983,461 Subtotal residential mortgage loans 287,627 809,791 3,061,635 4,159,053 Consumer loans 1,262,996 894,390 86,663 2,244,049 Subtotal 4,877,412 4,302,817 4,547,635 13,727,864 Interbank loans 23,412 – – 23,412 Total loans 4,900,824 4,302,817 4,547,635 13,751,276
The following tables present the interest rate sensitivity of outstanding loans due after one year at December 31, 2009. (See also Item 5: D. OperatingResults—Interest Rates.)
As of December
31, 2009
(in millions of
Ch$) Variable Rate Ch$ 689,171 UF 1,576,384 Foreign currencies 23,764
Subtotal 2,289,319 Fixed Rate Ch$ 3,143,448 UF 2,979,859 Foreign currencies 437,826
Subtotal 6,561,133 Total 8,850,452
92

Table of Contents Loans by Economic Activity
The following table sets forth, at the dates indicated, an analysis of our client loan portfolio based on the borrower’s principal economic activity andgeographic distribution. Loans to individuals for business purposes are allocated to their economic activity.
Domestic loans (*) as of
December 31, Foreign loans as of
December 31, Total loans as of
December 31, % of total loans as of
December 31, (in millions of Ch$)
2009 2008 2009 2008 2009 2008 2009%
2008%
Commercial loans Manufacturing 640,395 937,305 – – 640,395 937,305 4.66 6.39 Mining 67,057 323,269 – – 67,057 323,269 0.49 2.20 Electricity, gas and water 144,386 207,542 – – 144,386 207,542 1.05 1.41 Agriculture and livestock 610,909 647,897 – – 610,909 647,897 4.44 4.41 Forestry 71,085 88,554 – – 71,085 88,554 0.52 0.60 Fishing 127,025 170,934 – – 127,025 170,934 0.92 1.16 Transport 362,508 423,856 – – 362,508 423,856 2.64 2.89 Communications 164,077 192,750 – – 164,077 192,750 1.19 1.31 Construction 817,293 887,391 – – 817,293 887,391 5.94 6.04 Commerce 1,650,903 2,219,987 23,409 95,534 1,674,312 2,315,521 12.18 15.78 Services 288,256 395,840 – – 288,256 395,840 2.10 2.70 Other 2,380,871 1,860,535 – – 2,380,871 1,860,535 17.31 12.68
Subtotals 7,324,765 8,355,860 23,409 95,534 7,348,174 8,451,394 53.44 57.57 Mortgage loans 4,159,053 3,980,556 – – 4,159,053 3,980,556 30.24 27.11 Consumer loans 2,244,049 2,249,138 – – 2,244,049 2,249,138 16.32 15.32
Totals 13,727,867 14,585,554 23,409 95,534 13,751,276 14,681,088 100.00 100.00
(*) As of March 31, 2010, foreign country loans, including foreign interbank deposits classified as financial investments totaled Ch$35,763 million,representing 0.18% of our total assets. Classification of Loan Portfolio
Credit Review Process
The Risk Division, our credit analysis and risk management group, is largely independent of our Commercial Division. Risk evaluation teams interactregularly with our clients. For larger transactions, risk teams in our headquarters work directly with clients when evaluating credit risks and preparing creditapplications. Various credit approval committees, all of which include Risk Division and Commercial Division personnel, must verify that the appropriatequalitative and quantitative parameters are met by each applicant. Each committee’s powers are defined by our Board of Directors.
In addition, Banco Santander Spain is involved in the credit approval process of our largest loans and borrowers. If a single borrower or an economic groupowes us an aggregate amount in excess of US$40 million, any additional loan to such borrower or member of such group must be reported to Banco SantanderSpain.
Credit Approval
The Risk Division, our credit analysis and risk management group, is largely independent of our Commercial Division. Risk evaluation teams interactregularly with our clients. For larger transactions, risk teams in our headquarters work directly with clients when evaluating credit risks and preparing creditapplications. Various credit approval committees, all of which include Risk Division and Commercial Division personnel, must verify that the
93

Table of Contents
appropriate qualitative and quantitative parameters are met by each applicant. Each committee’s powers are defined by our Board of Directors.
In addition, Banco Santander Spain is involved in the credit approval process of our largest loans and borrowers. If a single borrower or an economic groupowes us an aggregate amount in excess of US$40 million, any additional loan to such borrower or member of such group must be reported to Banco SantanderSpain.
The following table lists our committees from which credit approval is required depending on total risk exposure for loans evaluated on an individual basis:
Approved By
Maximumapproval in
Thousands of US$ Executive Credit Committee >20,000 Loan Credit Committee 20,000 Business Segment Committee 8,000-10,000
Large Companies 10,000 Real estate sector 10,000 Medium-sized companies 8,000
Regional Committee 5,000 Branch committee 300
Companies 300 Mortgage 120 Persons 30
The Executive Credit Committee is comprised of the Chairman of the Board, three additional Board members, the Corporate Legal Counsel, the CEO, theManager of Global Banking, the Corporate Director of Risk and two senior members of the Credit Risk department who present the loans being reviewed. Thiscommittee reviews the loan positions reviewed by the Senior Credit Committee above US$10 million and approves those loan positions greater than US$20million. In addition, any loan position above US$40 million must also be reviewed by Banco Santander Spain’s credit committee.
The Loan Credit Committee is comprised of the CEO, the Manager of the Wholesale segment, the Manager of the Medium-sized companies segment,General Counsel, the Corporate Director of Credit Risk and the Manager of Credit Admissions. The Loan Credit Committee reviews and will either approve ordeny transactions in the range of US$8 million to US$20 million that have been previously approved by one of the Business Segment Committees: (i) LargeCompanies, (ii) Medium-sized Companies and (iii) Real Estate. The Regional Committees have a maximum approval of up to US$5 million. The RegionalCommittees oversee the branch networks outside of Santiago. At the branch level, the maximum approval is US$300,000 for companies, US$30,000 forindividuals and US$120,000 for mortgages. For the lower level committees, credit granting aut hority varies according to the seniority and experience of thecommittee members, and the values indicated represent upper limits. All committees include at least two bank officers from the commercial and credit areas.
We also have a department designated to monitor the quality of the loan portfolio on a continuous basis. The purpose of this special supervision is tomaintain constant scrutiny of the portions of the portfolio that represent the greatest risk and to anticipate any deterioration. Based on this ongoing review of theloan portfolio, we believe that we are able to detect problem loans and make a decision on a client’s status. This includes measures such as reducing orextinguishing a loan, or requiring better collateral from the client. The control systems require that these loans be reviewed at least three times per year for thoseclients in the lowest category of credit watch.
Credit Approval: Corporate
In preparing a credit proposal for a corporate client, Santander-Chile’s personnel verify such parameters as debt servicing capacity (including, usually,projected cash flows), the company’s financial history and projections for the economic sector in which it operates. The Risk Division is closely involved in thisprocess, and prepares the credit application for the client. All proposals contain an analysis of the client’s strengths and weaknesses, a rating and arecommendation. Credit limits are determined not on the basis of outstanding balances of individual clients, but on the direct and indirect credit risk of entirefinancial groups. For example, a corporation will be evaluated together with its subsidiaries and affiliates.
94

Table of Contents
Credit Approval: Retail Banking
Retail loans are evaluated and approved by the Risk for Individuals, Micro businesses and Small Businesses Division. The majority of loans to individualsare approved by the Standardized Risk Area. The credit evaluation process is based on an evaluation system known as Garra for Banco Santander and Sysevafor Santander Banefe, both processes are decentralized, automated and are based on a scoring system which incorporates our Credit Risk Policies.
The credit evaluation process is based on the gathering of information to determine a client’s financial stability, payment capacity and commercial nature.The following parameters are used to evaluate an applicant’s credit risk: (i) income, (ii) length of current employment, (iii) indebtedness, (iv) credit reports and(v) background information, which is accessed by means of internal and external databases. Operations which cannot be approved by Garra or Syseva are sent tothe Approval Center, a centralized area that carries out yearly analyses and renewals of credit lines and credit cards and evaluates higher risk credits.
The following table lists our approval limits for loans evaluated using standardized statistical models:
Bank excluding Banefe
Non-mortgage loans
Approved By
Non-MortgageLoans
Up to Ch$ million Corporate Manager of Standardized Risk 300 Manager Approval Center 150 Segment Risk Manager 100 Risk Manager 80 Senior Analyst 40 Junior Analyst 10
Mortgage loans
Approved by: Mortgage Loans
Up to UF Corporate Manager of Standardized Risk 20,000 Admissions Manager 14,000 Segment Risk Manager 9,000 Risk Manager 9,000 Senior Analyst 5,000 Junior Analyst 3,000
Santander Banefe
Non-mortgage loans
Approved By
Non-MortgageLoans
Up to Ch$ million Corporate Manager of Standardized Risk 300 Manager Approval Center 150 Segment Risk Manager 20 Risk Manager 15 Risk Analyst 6
95

Table of Contents
Mortgage loans
Approved By Mortgage Loans
Up to UF Corporate Manager of Standardized Risk 20,000 Admissions Manager 14,000 Segment Risk Manager 4,000 Risk Manager 2,500 Risk Analyst 1,500
Classification of Loan Portfolio
Loans are divided into: (i) consumer loans (including loans granted to individuals for the purpose of financing the acquisition of consumer goods or paymentof services); (ii) residential mortgage loans (including loans granted to individuals for the acquisition, construction or repair of residential real estate, in whichthe value of the property covers at least 100% of the amount of the loan); and (iii) commercial loans (includes all loans other than consumer loans and residentialmortgage loans). The models and methods used to classify our loan portfolio and establish credit loss allowances must follow the following guiding principles,which have been established by the Superintendency of Banks and approved by our Board of Directors.
Allowances for large commercial loans
For large commercial loans, leasing and factoring, the Bank assigns a risk category level to each borrower and its respective loans. The Bank considers thefollowing risk factors: industry or sector of the borrower, owners or managers of the borrower, borrower’s financial situation, its payment capacity and paymentbehavior. The Bank assigns one of the following risk categories to each loan and borrower: i. Classifications A1, A2 and A3 correspond to borrowers with no apparent credit risk. ii. Classification B corresponds to borrowers with some credit risk but no apparent deterioration of payment capacity. iii. Classifications C1, C2, C3, C4, D1 and D2 correspond to borrowers whose loans have deteriorated.
For loans classified as A1, A2, A3 and B, the Bank assigns a specific provision level on an individual basis to each borrower and, therefore, the amount ofloan loss allowance is determined on a case-by-case basis. The amount of allowances for the remaining classifications is set by the Superintendency of Banks asdescribed below. All commercial loans for companies, including leasing and factoring, have been individually rated. In determining provisions, we make adistinction between normal debtors and deteriorated debtors.
Debtor Classes
Two debtor classes have been determined based on debtors’ credit behavior in order to calculate loan loss allowance:
· Normal Debtors, which are classified as A1, A2, A3 or B, are current on their payment obligations and show no sign of deterioration in their creditquality.
· Deteriorated Debtors, which are classified as C1, C2, C3, C3, C4, D1 or D2, includes loans with us have been charged off or administered by our
Recovery Unit, or classified as Precontenciosos (PRECO or Deteriorated).
96

Table of Contents
Expected Loan Loss = Loan Loss Allowance
The expected loss is obtained by multiplying all risk factors defined in the following equation:
EL = PNP x EXP x SEV
EL = Expected LossPNP = Probability of Non-PerformingEXP = ExposureSEV = Severity
EL = Expected Loss. The expected loss is how much could be lost in the event a debtor does not perform the obligations under the loan.
PNP = Probability of Non-Performing. This variable, expressed as a percentage, indicates the probability that a debtor will default next year. This percentageis associated with the internal rating that we give to each debtor, which is determined by analyzing such parameters as debt servicing capacity (including, usually,projected cash flows), the company’s financial history, the solvency and capacity of shareholders and management, and projections for the economic sector inwhich it operates. The internal rating can be different from ratings obtained from external third parties.
EXP = Exposure. This corresponds to the value of commercial loans without discounting the value of guarantees or collateral.
SEV = Severity. This is the effective loss rate for debtors in the same segment, which is determined statistically based on the historical effective losses forthe Bank for each segment.
Determination of loan loss allowance according to Borrower Class
Normal Debtors
· The loan loss allowance for each debtor is calculated based on the Expected Loss equation (EL = PNP * EXP * SEV).
· A risk category is assigned to each debtor based on the PNP summarized in the following table:
PNP result
Classification
Loan loss allowance
External Classification> AA- A1 Determined by aPNP ≤ 1% A2 model1% < PNP ≤ 4% A3 on anPNP > 4% B individual basis
Deteriorated Debtors
For loans classified in Categories C1, C2, C3, C4, D1 and D2, the Bank must have the following levels of allowance, which are required by the provisioningmodel of the Bank:
Classification
Estimated loss
Allowance(1)C1 Up to 3% 2%C2 More than 3% up to 19% 10%C3 More than 19% up to 29% 25%C4 More than 29% up to 49% 40%D1 More than 49% up to 79% 65%D2 More than 79% 90%
(1) Represents percentages of the aggregate amount of principal and accrued but unpaid interest of the loan.
97

Table of Contents
New Guidelines of Provisioning Levels for Contingent Loans in 2010
Commencing in January 2010, all Chilean banks will be required by the SBIF to include in the calculation of expected loss and reserve levels, a percentageof off-balance sheet contingent loans. This includes, among others, lines of credit approved but not disbursed, unused credit card lines, stand-by letters of creditand other operations guaranteed by the Bank. As a result, a greater percentage of these assets will be included in the calculation of risk weighted assets. Theimpact of this change was Ch$52,662 million charged against equity as of March 31, 2010. This provision only applies to locally filed financial statements.
Off-balance sheet contingent operations Percentage of total debt outstanding to be included in new riskweightings
Guarantees 50%-100%Lines of credit and unused credit card balances 50%
Stand-by letters of credit 20%
Allowances for consumer loans
Consumers are assigned an allowance level on and based on credit risk profiles, utilizing a more automated statistical model and considering suchborrower’s credit history, including any defaults on obligations to other creditors, as well as the overdue periods on loans from us. We differentiate between oldand new clients when determining a client’s risk profile for consumer loans and those that have gone through some type of renegotiation in the past in thefinancial system. All loans are assigned a provision at the moment a loan is granted depending on the risk profile of the client. We are continuously improvingand recalibrating our credit scoring and provisioning models and this may change the minimum provision standards for the various client p rofiles as depicted inthis document. The following table sets forth the required allowances for consumer loans in 2009. Allowance Level(1) Not renegotiated Renegotiated
Loan type Risk Profile New Clients Old Clients New Clients Old Clients Consumer Profile 1 30.5% 21.0% 31.4% 38.4% Profile 2 21.7% 17.7% 21.2% 26.4% Profile 3 14.9% 9.7% 6.1% 22.1% Profile 4 12.3% 6.2% 8.90% Profile 5 8.9% 2.9% 2.10% Profile 6 5.7% 1.4% - - Profile 7 2.7% 0.6% - -
(1) Percentage of total outstanding.
Allowances for residential mortgage loans
Residential mortgage loans are assigned an allowance level based on credit risk profiles, utilizing a more automated and sophisticated statistical model andconsidering such borrower’s credit history, including any defaults on obligations to other creditors, as well as the overdue periods on the loans borrowed from us.Once the rating of the client is determined, the allowance for mortgage loans is calculated using a risk category and related allowance to loan ratio, which isdirectly related to the overdue periods. The following table sets forth the allowance to loan ratios on loans based on overdue time. The ratios represent thepercentage of required allowance amount to the aggregate amount of the principal and accrued but unpaid interest on the loan.
Loan type Overdue days 1-30 31-60 61-120 121-180 181-360 361- 720 >720 Mortgage Profile 1 0.3% 0.5% 1.2% 2.4% 6.8% 14.1% 28.3% Profile 2 1.5% 1.6% 2.5% 4.4% 6.8% 14.1% 28.3%
98

Table of Contents
Allowances for group evaluations on small and mid-sized commercial loans
· Allowances based on group evaluations are permitted for a large number of borrowers whose individual loan amounts are relatively insignificant. These
models are intended to be used primarily to analyze commercial loans to individuals and small companies.
· Levels of required reserves are to be determined by the Bank, according to the estimated loss that may result from the loans, by classifying the loanportfolio using one or both of the following models:
i. A model based on the characteristics of the borrowers and their outstanding loans—borrowers and their loans with similar characteristics will be
placed into groups and each group will be assigned a risk level. ii. A model based on the behavior of a group of loans—loans with analogous past payment histories and similar characteristics will be placed into
groups and each group will be assigned a risk level.
Additional reserves
Banks are permitted to establish allowances above the limits described above only to cover specific risks that have been authorized by their Board ofDirectors. Voluntary reserves that cover no specific risk are no longer permitted.
Analysis of Santander Chile’s Loan Classification
The following tables provide statistical data regarding the classification of our loans at December 31, 2008 and 2009. As of December 31, 2009
Category Commercial Loans Consumer Loans Residential
Mortgage Loans Total Loans Percentage
Evaluated Loans A – 1,895,241 – 1,895,241 13.8%A1 – – – – – A2 3,187,959 – 3,808,195 6,996,154 50.9%A3 2,998,956 – 223,928 3,222,884 23.5%B 601,080 165,181 10,481 776,742 5.5%B- – 69,150 – 69,150 0.5%C – 74,735 3,636 78,371 0.6%C1 224,732 – 18,101 242,833 1.8%C2 97,885 – 8,640 106,525 0.8%C3 60,679 – 2,012 62,691 0.4%C4 56,985 – 27,294 84,279 0.6%D – 39,742 – 39,742 0.3%D1 80,574 – 42,438 123,012 0.9%D2 39,324 – 14,328 53,652 0.4%
Totals 7,348,174 2,244,049 4,159,053 13,751,276 100.0% As of December 31, 2008
Category Commercial Loans Consumer Loans Residential
Mortgage Loans Total Loans Percentage
Evaluated Loans A – 1,811,060 3,562,617 5,373,677 36.7%A1 – – – – –%A2 6,463,445 – – 6,463,445 44.0%A3 1,351,054 – – 1,351,054 9.2%B 208,954 203,375 199,087 611,416 4.2%B- – 75,281 79,930 155,211 1.1%C – 94,507 64,972 159,479 1.1%C1 220,434 – – 220,434 1.5%C2 26,738 – – 26,738 0.2%C3 34,296 – – 34,296 0.2%C4 36,100 – – 36,100 0.2%D – 64,915 73,950 138,865 0.9%D1 48,711 – – 48,711 0.3%D2 61,662 – – 61,662 0.4%
Total loans 8,451,394 2,249,138 3,980,556 14,681,088 100.0%
99
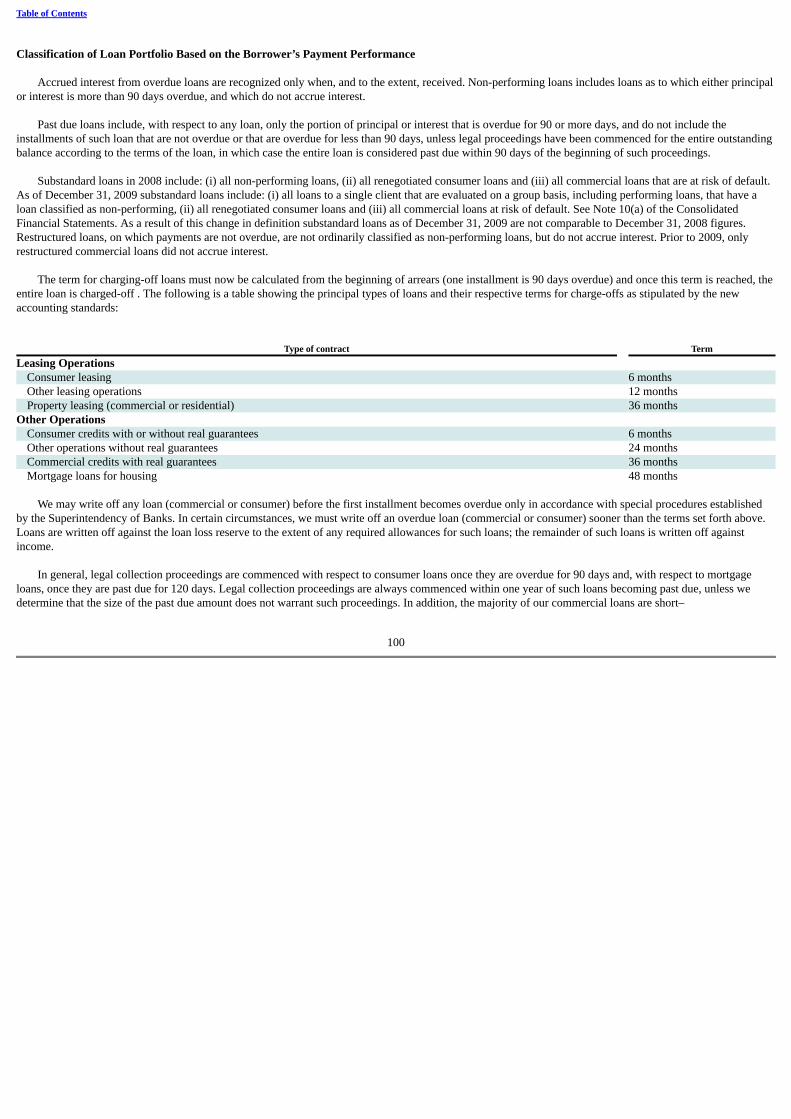
Table of Contents
Classification of Loan Portfolio Based on the Borrower’s Payment Performance
Accrued interest from overdue loans are recognized only when, and to the extent, received. Non-performing loans includes loans as to which either principalor interest is more than 90 days overdue, and which do not accrue interest.
Past due loans include, with respect to any loan, only the portion of principal or interest that is overdue for 90 or more days, and do not include theinstallments of such loan that are not overdue or that are overdue for less than 90 days, unless legal proceedings have been commenced for the entire outstandingbalance according to the terms of the loan, in which case the entire loan is considered past due within 90 days of the beginning of such proceedings.
Substandard loans in 2008 include: (i) all non-performing loans, (ii) all renegotiated consumer loans and (iii) all commercial loans that are at risk of default.As of December 31, 2009 substandard loans include: (i) all loans to a single client that are evaluated on a group basis, including performing loans, that have aloan classified as non-performing, (ii) all renegotiated consumer loans and (iii) all commercial loans at risk of default. See Note 10(a) of the ConsolidatedFinancial Statements. As a result of this change in definition substandard loans as of December 31, 2009 are not comparable to December 31, 2008 figures.Restructured loans, on which payments are not overdue, are not ordinarily classified as non-performing loans, but do not accrue interest. Prior to 2009, onlyrestructured commercial loans did not accrue interest.
The term for charging-off loans must now be calculated from the beginning of arrears (one installment is 90 days overdue) and once this term is reached, theentire loan is charged-off . The following is a table showing the principal types of loans and their respective terms for charge-offs as stipulated by the newaccounting standards:
Type of contract
TermLeasing Operations
Consumer leasing 6 monthsOther leasing operations 12 monthsProperty leasing (commercial or residential) 36 months
Other Operations Consumer credits with or without real guarantees 6 monthsOther operations without real guarantees 24 monthsCommercial credits with real guarantees 36 monthsMortgage loans for housing 48 months
We may write off any loan (commercial or consumer) before the first installment becomes overdue only in accordance with special procedures establishedby the Superintendency of Banks. In certain circumstances, we must write off an overdue loan (commercial or consumer) sooner than the terms set forth above.Loans are written off against the loan loss reserve to the extent of any required allowances for such loans; the remainder of such loans is written off againstincome.
In general, legal collection proceedings are commenced with respect to consumer loans once they are overdue for 90 days and, with respect to mortgageloans, once they are past due for 120 days. Legal collection proceedings are always commenced within one year of such loans becoming past due, unless wedetermine that the size of the past due amount does not warrant such proceedings. In addition, the majority of our commercial loans are short–
100

Table of Contents
term, with single payments at maturity. Past due loans are required to be covered by individual loan loss reserves equivalent to 100.0% of any unsecured portionthereof.
The following table sets forth a loan aging schedule at the end of 2008 and 2009. Amounts shown as overdue and past due include only installments that areoverdue or past due and not the aggregate principal amount of such loans.
101

Table of Contents
As of December 31, 2009 2008 (in millions of Ch$, except percentages) Overdue for 1-29 days(1) 36,264 50,029 Overdue for 30-89 days(1) 22,846 41,022 Overdue for 90 days or more (Past due loans) (2) 193,250 160,824 Non-performing loans(3) 409,067 383,458 Substandard loans(4) 1,485,737 870,259 Total loans 13,751,276 14,681,088 Overdue loans expressed as a percentage of total loans 1.84% 1.72%Past due loans expressed as a percentage of total loans 1.41% 1.10%Non-performing loans as a percentage of total loans 2.97% 2.61%Substandard loans as a percentage of total loans 10.80% 5.93%
(1) Includes only the overdue portion. Does not include the aggregate principal amount of such loans. (2) All installments and lines of credit more than 90 days overdue. Does not include the aggregate principal amount of such loans. (3) Non-performing loans are all loans with at least one installment over 90 days overdue and includes the aggregate principal amount of such loans. (4) Substandard loans prior to December 2009 include: (i) all non-performing loans, (ii) all renegotiated consumer loans and (iii) all commercial loans that are at
risk of default. As of December 31, 2009, substandard loans include: (i) all loans to a single client that are evaluated on a group basis, including performingloans, that have a loan classified as non-performing, (ii) all renegotiated consumer loans and (iii) all commercial loans with some risk of default. See Note10(a) of the Consolidated Financial Statements. As a result of this change in definition substandard loans as of December 31, 2009 are not comparable toDecember 31, 2008 figures.
(5) Includes reserves for interbank loans. (6) Includes interbank loans.
We suspend the accrual of interest and readjustments on all overdue loans. The amount of interest that would have been recorded on overdue loans if theyhad been accruing interest was Ch$20,320 million and Ch$21,899 million for the years ended December 31, 2008 and 2009, respectively. Accrued interest andUF indexation adjustments from overdue loans are recognized only when, and to the extent, received.
Loans included in the previous table which have been restructured and that bear no interest are as follows. As of December 31, 2009 2008 (Ch$ million) Ch$ 276,703 17,631 Foreign currency 45,030 2,556 UF 78,973 32,941 Total 400,706 53,128
The amount of interest that would have been recorded on these loans for the years ended December 31, 2008 and 2009, if these loans had been earning amarket interest rate was Ch$7,461 million and Ch$47,888 million, respectively. The increase in foregone interest is mainly due to a regulatory change in 2009which prohibited banks from recognizing interest on restructured consumer loans. We do not accrue interest on restructured loans.
102
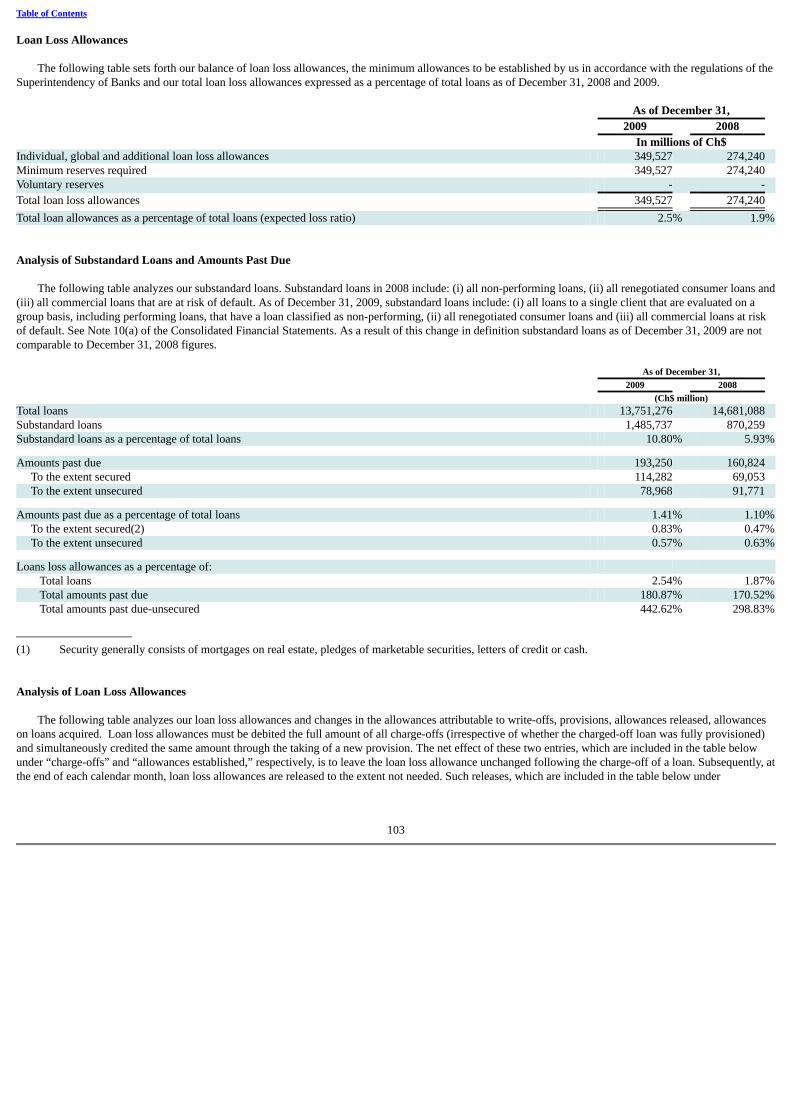
Table of Contents Loan Loss Allowances
The following table sets forth our balance of loan loss allowances, the minimum allowances to be established by us in accordance with the regulations of theSuperintendency of Banks and our total loan loss allowances expressed as a percentage of total loans as of December 31, 2008 and 2009. As of December 31, 2009 2008 In millions of Ch$ Individual, global and additional loan loss allowances 349,527 274,240 Minimum reserves required 349,527 274,240 Voluntary reserves - - Total loan loss allowances 349,527 274,240 Total loan allowances as a percentage of total loans (expected loss ratio) 2.5% 1.9%
Analysis of Substandard Loans and Amounts Past Due
The following table analyzes our substandard loans. Substandard loans in 2008 include: (i) all non-performing loans, (ii) all renegotiated consumer loans and(iii) all commercial loans that are at risk of default. As of December 31, 2009, substandard loans include: (i) all loans to a single client that are evaluated on agroup basis, including performing loans, that have a loan classified as non-performing, (ii) all renegotiated consumer loans and (iii) all commercial loans at riskof default. See Note 10(a) of the Consolidated Financial Statements. As a result of this change in definition substandard loans as of December 31, 2009 are notcomparable to December 31, 2008 figures. As of December 31, 2009 2008 (Ch$ million) Total loans 13,751,276 14,681,088 Substandard loans 1,485,737 870,259 Substandard loans as a percentage of total loans 10.80% 5.93% Amounts past due 193,250 160,824 To the extent secured 114,282 69,053 To the extent unsecured 78,968 91,771 Amounts past due as a percentage of total loans 1.41% 1.10% To the extent secured(2) 0.83% 0.47% To the extent unsecured 0.57% 0.63% Loans loss allowances as a percentage of: Total loans 2.54% 1.87% Total amounts past due 180.87% 170.52% Total amounts past due-unsecured 442.62% 298.83%
(1) Security generally consists of mortgages on real estate, pledges of marketable securities, letters of credit or cash. Analysis of Loan Loss Allowances
The following table analyzes our loan loss allowances and changes in the allowances attributable to write-offs, provisions, allowances released, allowanceson loans acquired. Loan loss allowances must be debited the full amount of all charge-offs (irrespective of whether the charged-off loan was fully provisioned)and simultaneously credited the same amount through the taking of a new provision. The net effect of these two entries, which are included in the table belowunder “charge-offs” and “allowances established,” respectively, is to leave the loan loss allowance unchanged following the charge-off of a loan. Subsequently, atthe end of each calendar month, loan loss allowances are released to the extent not needed. Such releases, which are included in the table below under
103

Table of Contents
“allowances released,” therefore include any amounts relating to provisions originally made in respect of loans that have been charged off. Year Ended December 31, 2009 2008 (in millions of Ch$, except percentages) Loan loss allowances at beginning of the year 274,240 230,404 Release of allowances upon charge-offs (1) (295,831) (274,372)Allowances established (2) 398,416 326,121 Allowances released (3) (27,298) (7,913)Loan loss allowances at end of year 349,527 274,240 Ratio of charge-offs to total loans 2.0% 2.0%Loan loss allowances at end of period as a percentage of total loans 2.5% 1.9%
(1) Reflects release of loan loss allowance equal to the entire amount of loans charged off, including any portion of such loans with respect to which noallowance had been established prior to the charge-off.
(2) Includes, in addition to provisions made in respect of increased risk of loss during the period, provisions made to replace allowances released upon charge-
off of loans. See Note (1) to this table. (3) Represents the amount of loan loss allowances released during the year as a consequence of reduction in the level of risk existing in the loan portfolio,
including as a result of improvement in the credit risk classification of borrowers and the charge-off of loans.
The following table shows charge-offs by Santander-Chile by type of loan. Year Ended December 31, 2009 2008 (in millions of Ch$) Commercial loans 48,118 32,935 Consumer loans 239,005 236,405 Residential mortgage loans 8,708 5,032 Total 295,831 274,372
The following table shows recoveries by Santander-Chile by type of loan. Year Ended December 31, 2009 2008 (in millions of Ch$) Commercial loans 8,446 9,244 Consumer loans 28,268 26,718 Residential mortgage loans 2,560 1,932 Total 39,274 37,894
Based on information available regarding our borrowers, we believe that our loan loss allowances are sufficient to cover known potential losses and lossesinherent in a loan portfolio of the size and nature of our loan portfolio.
104

Table of Contents Allocation of the Loan Loss Allowances
The following tables set forth, at December 31 of each of the two years, the proportions of our required minimum loan loss allowances that wereattributable to our commercial, consumer and residential mortgage loans, and the amount of voluntary allowances (which are not allocated to any particularcategory) at each such date. As of December 31, 2009 As of December 31, 2008
Allowanceamount (1)
Allowanceamount as a
percentage ofloans incategory
Allowanceamount as a
percentage oftotal loans
Allowanceamount as a
percentage oftotal allocatedallowances (2)
Allowanceamount (1)
Allowanceamount as a
percentage ofloans incategory
Allowanceamount as a
percentage oftotal loans
Allowanceamount as a
percentage oftotal allocatedallowances (2)
Commercial loans 158,600 2.49% 1.15% 46.42% 107,656 1.46% 0.73% 40.22%Consumer loans 166,503 4.00% 1.21% 48.74% 147,446 3.70% 1.00% 55.07%Residential mortgage loans 16,534 0.74% 0.12% 4.84% 12,630 0.56% 0.09% 4.71%Total allocated allowances 341,637 2.68% 2.48% 100.00% 267,732 1.97% 1.82% 100.00%Leasing 7,848 0.81% 0.06% 6,473 0.67% 0.04% Interbank loans 42 0.18% -% 35 0.04% -% Total allowances 349,527 2.54% 2.54% 274,240 1.87% 1.87%
105

Table of Contents ITEM 6. DIRECTORS, SENIOR MANAGEMENT AND EMPLOYEES A. Directors and Senior Management Directors
We are managed by our Board of Directors, which, in accordance with our by-laws, consists of 11 directors and two alternates who are elected at annualordinary shareholders’ meetings. Except as noted below, the current members of the Board of Directors were elected by the shareholders in the ordinaryshareholders’ meeting held on April 22, 2008. Members of the Board of Directors are elected for three-year terms. Except as noted below, the term of each of thecurrent board members expires in April of 2011. Cumulative voting is permitted for the election of directors. The Board of Directors may appoint replacementsto fill any vacancies that occur during periods between elections. If any member of the Board of Directors resigns before his or her term has ended, and no otheralternate director is available to take the position at the next annual ordinary shareholders’ meeting a new replacing member will be elected. Our executiveofficers are appointed by the Board of Directors and hold office at its discretion. Scheduled meetings of the Board of Directors are held monthly. Extraordinarymeetings can be held when called in one of three ways: by the Chairman of the Board of Directors, by three directors with the consent of the Chairman of theBoard of Directors or by the majority of directors. None of the members of our Board of Directors has a service contract which entitles any Director to anybenefits upon termination of employment with Santander-Chile.
Our current directors are as follows: Directors Position Committees Term Expires
Mauricio Larraín Garcés Chairman and Director Asset and Liability CommitteeExecutive Credit CommitteeMarket CommitteeMarketing and Communications CommitteeUniversity Committee
April 2011
Jesús Zabalza Lotina First Vice Chairman and Director — April 2011
Oscar Von Chrismar Carvajal Second Vice Chairman andDirector
Asset and Liability CommitteeExecutive Credit CommitteeMarket CommitteeStrategy CommitteeTechnology Committee
April 2011
Carlos Olivos Marchant Director Audit CommitteeExecutive Credit Committee
April 2011
Víctor Arbulú Crousillat Director Audit Committee April 2011
Marco Colodro Hadjes Director Asset and Liability CommitteeExecutive Credit CommitteeMarket Committee
April 2011
Lucía Santa Cruz Sutil (1) Director Audit CommitteeUniversity Committee
April 2011
Roberto Méndez Torres Director Executive Credit CommitteeMarketing and Communications CommitteeUniversity Committee
April 2011
Vittorio Corbo Lioi Director Asset and Liability CommitteeMarket Committee
April 2011
Roberto Zahler Mayanz (1) Director Asset and Liability CommitteeMarket Committee
April 2011
Claudia Bobadilla Ferrer Director Technology CommitteeAnalysis and Resolution Committee
April 2011
Juan Manuel Hoyos Martínez de Irujo Alternate Director Strategy Committee April 2011
Raimundo Monge Zegers Alternate Director Asset and Liability CommitteeStrategy Committee
April 2011
(1) In May 2010 Lucía Santa Cruz resigned from the Audit Committee and was replaced by Roberto Zahler, an independent Board member.
106

Table of Contents
Mauricio Larraín Garcés is our Chairman. He is a member of the Asset and Liability Committee, the Executive Credit Committee, the Market Committee,the Marketing and Communications Committee and the University Committee. He is also President of Santander Chile Holding S.A. and Universia Chile S.A.He is a Director of the Asociación de Bancos e Instituciones Financieras de Chile and the Santiago Stock Exchange. He is also a member of the Council of PazCiudadana and was a former President of ICARE. Mr. Larraín began working at Santander-Chile in 1989. Previously, he was Intendente (Director) of theSuperintendency of Banks, Manager of External Debt at the Banco Central de Chile and a Senior Finance Specialist at the World Bank in Washington. He holdsdegrees in Law from Universidad Católica de Chile and from Harvard University.
Jesús María Zabalza Lotina became a Director and Vice-Chairman of the Board on October 28, 2008. He currently is a Director of Grupo Santander’s LatinAmerica Division and a Board member of Banco Santander Puerto Rico and President of the Board of Banco Santander Colombia. Mr. Jesús Zabalza is a patronof the Fundación Padre Garralda. Previously, Mr. Zabalza was Director of Retail Banking in Madrid of Banco BBVA. He was also on the Board of e-La Caixa,Telefónica Factoring S.A, Adeslas y Terra. Mr. Zabalza holds a degree in Industrial Engineering from the University of Bilbao.
Oscar von Chrismar Carvajal became Executive Vice-Chairman of the Board on January 1, 2010 after having served as the chief executive officer ofSantander-Chile since August 2003. Mr. Von Chrismar is a member of the Asset and Liability Committee, Executive Credit Committee, Market Committee,Strategy Committee and the Technology Committee. Prior to assuming the chief executive officer post, he was the Manager of Global Banking. Prior to themerger, he was the former chief executive officer of Old Santander-Chile since September 1997, after being General Manager of Banco Santander-Peru sinceSeptember 1995. Mr. von Chrismar is also Alternate Director of Universia Chile S.A. Prior to that, Mr. von Chrismar was the manager of the Finance Divisi onof Santander-Chile, a position that he had held since joining Santander-Chile in 1990. Mr. von Chrismar holds an Engineering degree from the Universidad deSantiago de Chile.
Carlos Olivos Marchant is Director since 2007 and has been a Board member since the merger was consummated in 2002. He is Chairman of the AuditCommittee and a member of the Executive Credit Committee. He was Chairman of the Board of Santiago since 1987 until the date of the merger, and he wasChairman of that board between May 1999 until the merger. He is a partner in the law firm Guerrero, Olivos, Novoa y Errazuriz. From 1981 to 1983, Mr. Olivosserved as General Counsel of the Central Bank of Chile, and from 1984 to 1986, he served as Chairman of the Board of Directors of Banco Osorno. Mr. Olivosholds a law degree from the Universidad de Chile and a Masters of Jurisprudence from New York University School of Law.
Vittorio Corbo Lioi is one of Chile’s leading economists. In 2003, Mr. Corbo was named President of Chile’s Central Bank. Following the end of his tenurethere, Mr. Corbo has been named to various boards and is currently a Senior Investigator at the Centro de Estudio Públicos (CEP), a local think tank. Previously,Mr. Corbo between 1991 and 1995 was an economic advisor to the Bank and a member of the Board of Santander Chile between 1995 and 2003. Mr. Corbo is amember of the Asset and Liability Committee and the Market Committee. Mr. Corbo has a Business Administration Degree from the Universidad de Chile and aPh.D. in Economics from MIT.
Víctor Arbulú Crousillat became a Director on May 6, 1999. He is a member of the Audit Committee and has been designated as a Financial Expert. He wasa Managing Director of JPMorgan, member of its European management committee and Chief Executive Officer for Spain and Portugal from 1988 until 1998.He has worked for JPMorgan for over 25 years in various positions in Europe, North America and Latin America. Mr. Arbulú also worked for the Inter-American Development Bank. He is also Director of Aurum S.A. Mr. Arbulú holds a degree in Engineering and a Masters of Business Administration.
Marco Colodro Hadjes became a Director on April 19, 2005. Mr. Colodro is a member of the Asset and Liability Committee, Executive Credit Committeeand Market Committee. Mr. Colodro was President of the Board of Telefónica Chile and a Director of Codelco. He is a former chairman of TVN (nationaltelevision network) and former vice chairman of Banco del Estado (state bank). He was also owner of Agencia de Valores Alfa S.A. Prior to that, he was ForeignTrade Director at the Central Bank of Chile. Mr. Colodro holds a degree in Economics from the Universidad de Chile, and has done post-graduate studies at theUniversity of Paris.
107

Table of Contents
Lucía Santa Cruz Sutil became a Director on August 19, 2003. Ms. Santa Cruz was a member of the Bank’s Audit Committee until May 2010 and theUniversity Committee. Ms. Santa Cruz holds a degree in History and a Masters Degree in Philosophy from Oxford University. She is the Dean of the College ofLiberal Arts of the Universidad Adolfo Ibañez. Ms. Santa Cruz is also a Director of Universia Chile S.A. She is also on the Board of Compañía de SegurosGenerales y de Vida La Chilena Consolidada and Fundación Minera Escondida. She is also on the Advisory Board of Nestle Chile and the FundaciónEducacional Santa Teresa de Avila. She is also a member of the Self-Regulation Committee for Insurance Companies in Chile.
Roberto Méndez Torres is a former member of the Board of Old Santander-Chile, to which he was appointed in 1996. He is a member of the ExecutiveCredit Committee, the Marketing and Communication Committee and the University Committee. He is a professor of Economics at Universidad Católica deChile. He has been Advisor to Grupo Santander-Chile since 1989. Mr. Méndez is President and Director of Adimark Chile Gfk and on the Board of the Chileanand German Chamber of Commerce. He is also Vice-Chairman of Universia S.A. He graduated with a degree in Business from Universidad Católica de Chile,and holds an MBA and a Ph.D. from the Graduate School of Business at Stanford University.
Roberto Zahler Mayanz became a Director on August 31, 1999. He is a member of the Audit Committee since May 2010, the Asset and Liability Committeeand the Market Committee. Currently, he is President of Zahler & Co, a consulting firm. He is also Director of Air Liquide-Chile and member of the CLAAF orthe Latin American Committee for Financial Affairs. He was formerly President of the Board of Siemens Chile. He was also a visiting professor at the IMF’sResearch Department. Between 1991 and 1996, he was President of the Central Bank of Chile and Vice-President from 1989 to 1991. He also serves as aconsultant for the World Bank, the IDB, the IMF and the International Bank of Settlements. Mr. Zahler has also provided technical assistance to various Cent ralBanks and Finance Ministries in most countries of Latin America, Indonesia and Kosovo. Mr. Zahler holds a degree in Business Administration from theUniversidad de Chile and a Masters in Economics from the University of Chicago.
Claudia Bobadilla Ferrer was elected to the Board in April 2006. She is a member of the Technology Committee and the Analysis and ResolutionCommittee. She is CEO of Fundación País Digital, a member of the Executive Committee of Innovation and Technology of ICARE, council member ofEndeavor Chile and Executive Director of the Chile-Japón Siglo XXI Committee. She was also founder and President of Comunidad Mujer, an organizationdedicated to increasing women’s participation in the workforce. She is a member of the council of Fundación Chilena del Pacífico, Proyecto AstronómicoALMA and Movimiento Educación 2020. She was previously Director of Legal Affairs at Terra Networks Chile S.A. She is a lawyer from the Universidad Diego Portales.
Juan Manuel Hoyos Martínez de Irujo was the Managing Director of McKinsey & Company in Spain from 1997 to 2003 where he was also President of theClient Committee of McKinsey’s Board. He began his career at McKinsey where he was named partner in 1984 and Director in 1991. Currently, he is in chargeof partner development worldwide and continues to serve on the Board. His consulting career has been focused in the areas of strategy and organization ofcorporations, especially in the telecommunications, banking and metallurgy sectors. He has worked with companies in Spain, the United States, Latin America,the United Kingdom, Portugal and Africa. He is currently a member of the Strate gy Committee of the Bank. He received an economics degree from theUniversidad Complutense de Madrid and holds an MBA in Finance and Accounting from Columbia University.
Raimundo Monge Zegers became an Alternate Director on April 29, 2003. He is currently a member of the Strategy Committee of the Bank. He isCorporate Director of Strategic and Financial Planning for Grupo Santander-Chile and is CEO of Santander-Chile Holding S.A. and Santander Inversiones Ltda.He is also President of Santander S.A. Sociedad Securitizadora and Santander Factoring S.A. He is a Director of Aurum S.A., Santander Asset ManagementChile S.A. and Bansa Santander S.A. Mr. Monge has a degree in business from the Universidad Católica de Chile and an MBA from the University of California,Los Angeles.
108

Table of Contents Senior Management
Our senior managers are as follows: Senior Manager Position Date AppointedClaudio Melandri Chief Executive Officer January 1, 2010Gabriel Montoya Corporate Financial Controller April 1, 2009José Manuel Manzano Corporate Director of Risk July 1, 2007Javier Montero Corporate Director of Internal Audit May 1, 2010Alejandra Mehech Corporate Director Human Resources May 1, 2010Joaquín Quirante Global Banking and Markets March 11, 2008Francisco Murillo Manager Retail Banking May 1, 2010Felipe Contreras Chief Accounting Officer October 1, 2008Juan Fernández Administration and Operations July 18, 2002Emiliano Muratore Manager Financial Management April 8, 2008Juan Pedro Santa María General Counsel July 30, 2009
Claudio Melandri became the Chief Executive Officer of Santander-Chile in January 2010 after being our Retail Banking Manager since February 21, 2008.He started his career at Santander-Chile in 1990 becoming a regional branch manager and manager of Santander-Chile’s branch network. He was also a Vice-President at Banco Santander Venezuela from 2005 to 2007. In 2007, he was appointed Corporate Director of Human Resources of Banco Santander-Chile. He isalso on the Board of Santander Seguros de Vida S.A., Santander Asset Management S.A. Administradora General de Fondos and Santander Seguros GeneralesS.A. Mr. Melandrí has a Business Degree from the Universidad Tecnológica Metropolitana in Chile.
Gabriel Montoya B. was appointed Financial Controller of Santander Chile in April 2009 and has been working for Santander Spain and its affiliates since1997. Between 2005-2009, Mr. Montoya was Director of the MIS America Project and was responsible for implementing management information systems inChile, Mexico, Puerto Rico, Argentina and Brazil. Previous to that Mr. Montoya was Financial Controller of Santander Puerto Rico, Head of Financial Controlfor the Americas Division of Santander and various other management positions in Santander Colombia. He is a Director of Santander Consumer Chile S.A. Mr.Montoya has a Business Administration Degree from Universidad del Rosario and an Executive Administration Diploma from the Universidad de los Andes, both in Colombia.
José Manuel Manzano became Corporate Director of Risk in July 2007. Prior to that he was Corporate Director of Human Resources for Santander-Chilesince October 31, 2002. Previously, he served as Manager of Human Resources for Old Santander-Chile since 1999. He was also General Manager of SantanderFund Management and Managing Director of Bancassurance. He is also a Director of Santander Chile Holding and Santander S.A. Sociedad Securitizadora. Mr.Manzano holds an MBA and a degree in Business from Universidad Católica de Chile.
Javier Montero is the Corporate Director of Internal Auditing, a position he has held since May 1, 2010. Prior to that he was Manager of Internal Auditing inthe Financial Risk Department at Banco Santander Chile since 2006. Mr. Montero has worked for Grupo Santander since 2000 in the Internal Auditing Divisionof Grupo Santander. Mr. Montero has a Business Degree and an Auditing degree from Universidad San Pablo in Madrid.
Francisco Murillo was appointed Manager of Retail Banking of Santander-Chile on May 1, 2010. Prior to that, he held the position of Corporate Director ofHuman Resources for Santander-Chile since February 21, 2008. Mr. Murillo has worked in Grupo Santander Chile since 1993. Previously he served as CorporateDirector of Santander Asset Management and President of Bansander AFP. He was also the former CEO and Chief Investment Officer of Bansander AFP. Mr.Murillo is President of Santander Asset Management S.A. Administradora de General de Fondos, President of Santander Seguros de Vida S.A., President ofSantander Seguros Generales S.A., Director of Santander Chile Holding, Director of Aurum S.A., Director of Santander Asset Management Chile S.A., Directorof Santan der Consumer Chile S.A., Director of Santander Factoring, CEO of Teatinos Siglo XXI Inversiones Ltda and CEO of Aurum S.A. Mr. Murillo has aBusiness Degree from the Universidad Adolfo Ibañez.
Alejandra Mehech was appointed Corporate Director of Human Resources for Santander-Chile on May 1, 2010. Prior to that, Mrs. Mehech served asmanager of Human Resources for the Global Businesses area and for top executives, position she held since December 2007. She has also served as manager ofHuman Resources of the
109

Table of Contents
Asset Management Division of Grupo Santander in Chile. Mrs. Mehech has worked in Grupo Santander since 1994 and holds a Business Degree and a degree inSociology, both from Universidad Católica de Chile.
Joaquin Quirante was appointed the Manager of Global Banking and Markets, that includes wholesale banking and treasury services, on March 11, 2008.Mr. Quirante began working for Santander in 2004 and was the Global Manager of Debt Capital Markets. Previous to working at Santander, Mr. Quiranteworked for 9 years at Bank of America where he also led the Debt Capital Markets Group for Southern Europe. He also was a vice-president of Risk for theBank of America in the UK and worked in the International Division of Argentaria. He is on the Board of Santander S.A. Corredores de Bolsa. Mr. Quirante isan economist from the Universidad Complutense de Madrid and has a MBA from IESE.
Juan Carlos Chómali became Manager of the Santander Banefe Division of Santander-Chile in Month, 2010. Prior to that he was Manager of RetailBanking of Santander-Chile, position he held since January 2010 and after being our Corporate Director of Customers and Quality. Prior to that he wasCommercial Manager of Bansander AFP, Manager of E-Business of Grupo Santander, General Manager of Santander Multimedios, Manager of Remote Bankingat Banco Santander. Mr. Chómali is also Director of Universia Chile S.A., Director of Aquanima Chile S.A., Santander Asset Management S.A. AdministradoraGeneral de Fondos, Santander Seguros de Vida S.A. and Director of Santander Seguros Generales S.A. Mr. Chómali has a degree in business from theUniversidad Cató ;lica de Chile and a certificate in Marketing from the University of California, Los Angeles.
Felipe Contreras F. was named Chief Accounting Officer of Santander Chile in October 2008. He has worked for 14 years in the Bank’s AccountingDepartment, most recently as Manager of the Consolidation and Reporting Departments, overseeing the Bank’s Chilean, U.S. and Spanish GAAP reportingrequirements. He recently was in charge of the Bank’s recent transition to International Financial Reporting Standards. Mr. Contreras is a Public Accountantfrom the University of Santiago and is currently a candidate to a Masters in Advanced Finance from the Universidad Adolfo Ibáñez.
Juan Fernández is our manager of Administration and Operations. He is the former Manager of Administration and Cost Control of Old Santander-Chile, aposition he held from April 1999 until August 2002, when the merger with Santiago was consummated. Mr. Fernández is also Director of Santander ChileHolding S.A., Aquanima Chile S.A., Santander Factoring S.A., Isban Chile S.A., Bansa Santander S.A., Santander Consumer Chile S.A., Multinegocios S.A. andSantander S.A. Corredores de Bolsa. Previously Mr. Fernández served as Manager for Accounting and Administration of Old Santander-Chile since January1993. Prior to that, Mr. Fernández held positions at Banchile Agencia de Valores y Subsidiar ias, and at JPMorgan in Santiago and Madrid.
Emiliano Muratore was appointed Manager of Financial Management in April 2008. Mr. Muratore entered Santander Group in 1999 in Santander Argentina.From 2002 to 2006 he worked in Financial Management in Santander Spain. He is on the Board of Santander S.A. Agente de Valores. Mr. Muratore has aBusiness Degree from the Universidad Católica Argentina and a Masters in Finance from the Universidad de San Andrés in Buenos Aires.
Juan Pedro Santa María is our General Counsel, a position he has held since July 30, 2009 after being General Counsel of Grupo Santander Chile. He isalso a Director of Santander Chile Holding S.A., Santander Factoring S.A., Bansa Santander S.A., Aquanima Chile S.A., Director of Aurum S.A. and Director ofSantander Asset Management Chile S.A. Mr. Santa María, a lawyer, previously worked at Banco O’Higgins and Banco Santiago. He has been Chairman of theLaw Committee at the Asociación de Bancos e Instituciones Financieras de Chile for the last twenty years. He has a degree in Law from the PontificiaUniversidad Católica de Chile. B. Compensation
For the year ended December 31, 2009, the aggregate amount of compensation paid by us to all of our directors was Ch$645 million, including attendancefees and monthly stipends. For the year ended December 31, 2009, the aggregate amount of compensation paid by us to all of our executive officers and ourmanagement members was Ch$28,663 million (US$56.5 million). At our annual shareholder meeting held on April 27, 2010, shareholders approved a monthlystipend per director of UF 230 (US$9,496), UF 460 (US$18,992) for the Chairman of the Board and UF 345 (US$14,244) for the Vice-Chairman of the Board.This amount will be increased by UF 30 per month (US$1,239) if a Board member is named to one or more committees of the Board. For the President of acommittee the additional amount will be UF 60 (US$2,477) and UF 45 (US$1,8 58) for the Vice-President of a committee.
110

Table of Contents
Shareholders also approved the Audit Committee 2010 budget and the remuneration for its members. The remuneration is a 33% additional compensation overthe monthly stipend received by a regular board member, or UF 77 (US$3,179), totaling a monthly stipend of UF 307 (US$12,675). This remuneration is in linewith the new Chilean corporate governance law. In addition, we pay certain directors professional service fees for the consulting services that they rendered to usin their fields of expertise. For the year ended December 31, 2009, payments to our directors for consulting fees totaled Ch$526 million (US$1.0 million).
Santander Spain has set up remuneration systems tied to the performance of the stock market price of the shares of Santander Spain based on theachievement of two targets: appreciation of its share price and growth in earnings per share, in both cases based on a sample of comparable banks.
In this regard, certain high-level executives of Santander Chile participate in this global incentive-retention program implemented by Santander Spain. Thisconsisted of giving to qualifying executives a fixed number of options on shares of Santander, if the following parameters were met: (i) share price growth in thetop 10 compared to 30 other global banks, (ii) earnings per share growth in the top 10 compared to 30 other global banks, (iii) that Banco Santander Chileachieved its commercial and financial budget targets in the last two years and (iv) that the executive achieved his personal targets in the last two years, andremained employed with the Bank until the end of the incentive program. This program has no dilutive effect for Santander Chile minority shareholders.
The fair value of each option granted is calculated at the grant date. In order to value the incentive-retention plan, two valuation reports were performed bytwo multinational investment banks. These valuation specialists used the Black-Scholes equity option pricing model considering the following parameters: theexpected life of the options, interest rates, volatility, exercise price, market price and dividends of Santander Spain shares and the shares of comparable banks.The fair value of the options granted was calculated as the average value resulting from the two valuations.
Number of
Shares
Euros
ExercisePrice
Employee
Group
Number
ofPersons
Date ofCommencement
of ExercisePeriod
Date ofExpiry of
Exercise Period
Plans in force on January 1, 2005
Rights granted (Plan I06) 4,284,700 9.09 (**) Managers 123 1/15/2008 1/15/2009
Options exercised - - -
Options cancelled or not exercised (267,700) - - (6) 1/15/2008 1/15/2009
Plans in force on December 31, 2005 4,017,000 9.09
Options exercised - - -
Options cancelled, net (Plan I06) (166,600) 9.09 Managers (5) 1/15/2008 1/15/2009
Plans in force on December 31, 2006 3,850,400 9.09
Rights granted (Plan I09) 270,823 - Managers 159 6/23/2007 7/31/2009
Rights granted (Plan I09) 12,844 - Other non-managerialpositions 23 6/23/2007 7/31/2009
Rights granted (Plan I10) 402,865 - Managers 159 6/23/2007 7/31/2010
Rights granted (Plan I10) 18,564 - Other non-managerialpositions 23 6/23/2007 7/31/2010
Options cancelled, net (Plan I06) (184,900) 9.09 Managers
Plans in force on December 31, 2007 4,370,596 -
Rights granted (Plan I09) 134,985 - Managers 159 6/23/2007 7/31/2009
Rights granted (Plan I09) 6,401 Other non-managerialpositions 22 6/23/2007 7/31/2009
Rights granted (Plan I10) 133,874 - Managers 159 6/23/2007 7/31/2010
Rights granted (Plan I10) 6,169 - Other non-managerialpositions 22 6/23/2007 7/31/2010
Options cancelled, net (Plan I06) (565,650) - - 4/15/2008 1/15/2009
Options exercised, net (Plan I06) (3,099,850) - Managers 90
111

Table of Contents
Number of
Shares
Euros
ExercisePrice
Employee
Group
Number
ofPersons
Date ofCommencement
of ExercisePeriod
Date ofExpiry of
Exercise Period
Plans in force on December 31, 2008 986,525
Rights granted (Plan I09) 269,472 - Managers 159 6/23/2007 7/31/2009
Rights granted (Plan I09) 12,780 - Other non-managerialpositions 22 6/23/2007 7/31/2009
Rights granted (Plan I10) 400,842 - Managers 159 6/23/2007 7/31/2010
Rights granted (Plan I10) 18,470 - Other non-managerialpositions 22 6/23/2007 7/31/2010
Rights granted (Plan I11) 443,098 - Managers 161 7/31/2008 7/31/2011
Rights granted (Plan I11) 32,927 - Other non-managerialpositions 53 7/31/2008 7/31/2011
Rights granted (Plan I12) 458,850 - Managers 176 7/31/2009 7/31/2012
Rights granted (Plan I12) 63,305 - Other non-managerialpositions 95 7/31/2009 7/31/2012
Rights granted (Plan I09) (675,280) - Managers 159
Rights granted (Plan I09) (32,025) - Other non-managerialpositions 22
Plans in force on December 31, 2009 1,978,964
Of which:
Plan I10 980,784
Plan I11 476,025
Plan I12 522,155
(**)The exercise price of the options under Plan I06 is €9.09 per share, which is the weighted average of the daily average market price of the Bank shares on the continuous market in the first 15trading days of January 2005. This was the criterion established in the resolution approving Plan I06 adopted at the Annual General Meeting of Santander Spain held on June 18, 2005. Long-term incentive policy
During 2007, Santander Spain’s Board of Directors approved a long-term incentive policy for the period 2008-2010 aimed at Group Santander’s executivedirectors and certain executive personnel in Spain and other Santander Group companies. Certain high-level executives of Santander Chile participate in thisglobal Performance Share Plan implemented by Santander Spain.
As of December 31, 2008 approximately 90 of the Bank’s executives enrolled in Plan PI06 exercised 3,099,850 options on Banco Santander S.A. shares (theParent Company located in Spain) at a price of €9,09. Performance Share Plan
This multi-annual incentive plan is payable in shares of Santander Spain. The beneficiaries of the plan are the executive directors and other members ofsenior management, together with any other Group executives determined by the Board of Directors of Santander Spain or, when delegated by it, the ExecutiveCommittee.
This plan will involve successive three-year cycles of share deliveries to the beneficiaries, so that each year one cycle will begin and, from 2009 onwards,another cycle will also end. The aim is to establish an adequate sequence between the end of the incentive program linked to the previous plan and the successivecycles of this plan. Thus, the first two cycles commenced in July 2007, the first cycle having duration of two years (PI09) and the second cycle having a standardthree-year term (PI10). In June 2008 and 2009, the third and fourth three-year cycles were approved by Santander Spain (PI11 and PI12, respectively). Thesenew three-year cycle plans began to impact the Consolidated Income Statement of 2009.
For each cycle, a maximum number of shares of Santander Spain is established for each beneficiary who remains in the Bank’s employ for the duration ofthe plan. The targets, which, if met, will determine the number of shares to be delivered, are defined by comparing the Santander Group’s performance with thatof a benchmark group of financial institutions and are linked to two parameters, namely Total Shareholder Return (TSR) and growth in Earnings per Share(EPS). These parameters each have a 50% weighting in determining the percentage of shares to be delivered. In addition, the executives of Santander Chile mustalso meet their local commercial and earnings
112

Table of Contents
goals in order to receive this benefit, and the Bank must also reach other commercial and earnings targets set by Santander Spain.
The ultimate number of shares to be delivered will be determined in each of the cycles by the degree of achievement of the targets on the third anniversaryof commencement of each cycle (with the exception of the first cycle, for which the second anniversary will be considered), and the shares will be deliveredwithin a maximum period of seven months from the end of the cycle. This number will range from the maximum percentage of shares, if Grupo Santander, foreach of the measures considered (TSR and EPS growth), ranks within the third quartile of the Benchmark Group, including the 75th percentile, to 30% of themaximum number of shares if it is placed at the median (50th percentile). If Grupo Santander ranks below the median, all assignments of shares will be renderednull and void.
Plan PI09 ended in 2009 and rights over 707,305 shares were exercised by 181 Bank executives. In addition, Plan PI10 commenced during that fiscal year;rights over 419,312 shares were granted to 181 executives, yielding a cumulative total of 980,784 shares to be distributed to 181 executives. Plan PI11 allocated476,025 rights over shares, and Plan PI12 allocated 522,155 rights over shares, to 214 and 271 executives, respectively. At December 31, 2009, the Bankrecorded a cost for the period of Ch$2,371 million (US$4.677 million) corresponding to the fair value of plan PI09 (which ended on July 31, 2009), Plan I10,Plan I11 and Plan I12 for the equity instruments distributed. This amount is charged to income on the specific period in which the beneficiaries provide theirservices to the Bank.
At December 31, 2009 the fair value of the Share Plans based on the achievement of the stated objectives was calculated as follows:
· It was assumed that the beneficiaries will not leave the Group’s employ during the term of each plan.
· The fair value of 50% relating to the Bank’s relative TSR (Total Shareholder Return) position was determined by an independent expert based on theuse of the Monte Carlo valuation model which carried out 10,000 simulations to determine the TSR of each of the companies in the Benchmark Group,taking into account the aforementioned variables. The results (each of which represents the delivery of a number of shares) are classified in descendingorder by calculating the weighted average and discounting this amount at the risk-free interest rate.
PI09 PI10 PI11 PI12
Expected volatility(*) 16.25% 15.67% 19.31% 42.36%
Annual dividend yield based on historical 3.23% 3.24% 3.47% 4.88%
Risk-free interest rate [return on TreasuryBonds (zero coupon)] over the life of theplan
4.473% 4.497% 4.83% 2.04%
(*) Determined on the basis of historical volatility over the period (two or three years)
The application of the simulation model resulted in percentage values of 42.7% for PI09, 42.3% for PI10 (second cycle), 44,9% for PI11 (third cycle) and55.4% for PI12 (fourth cycle), which are applied to 50% of the value of the shares granted, in order to determine the book value of the TSR-based portion of theincentive. Since this valuation relates to a market condition, it cannot be adjusted after the grant date.
In view of the high correlation between TSR and EPS (Earning per Share), it was considered reasonable to conclude that, in a high percentage of cases, theTSR value is also valid for EPS. Therefore, it was determined that the fair value of the portion of the plans linked to the Bank’s relative EPS position, i.e. of theremaining 50% of the shares granted, was the same as that of the 50% corresponding to the TSR. Since this valuation refers to a non-market condition, thenumber of shares expected to vest shall be reviewed and adjusted on a yearly basis.
113

Table of Contents Post employment benefits
During the second half of 2009, the Bank granted an additional benefit to its principal executives, consisting of a pension plan whose purpose is to endowthem with funds for a better supplementary pension upon their retirement. In practical terms, the Bank will match the voluntary contributions made by thebeneficiaries for their future pensions with an equivalent contribution. The executives will be entitled to receive this benefit only when they fulfill the followinglinked conditions: i) retire from the Bank (or from any other Santander Group company) and be 60 years of age or older and; ii) the reason for termination oftheir employment may not be any of the legal grounds for dismissal attributable to the executive in question. During the period, the Bank made a contribution of$4,726 million, and a current contri bution of $267 million. For more information, see “Note 37—g Post employment benefits” on our Audited ConsolidatedFinancial Statements. C. Board Practices Audit Committee
Board member Position in CommitteeCarlos Olivos ChairmanVíctor Arbulú Crousillat Vice Chairman and Financial ExpertRoberto Zahler* Member
*Replaced Lucia Santa Cruz who resigned in May 2010
The Audit Committee (Comité de Directores y Auditoría) is comprised of three members of the Board of Directors. The General Secretary is the Committee
Secretary. The Chief Executive Officer, General Auditor and other persons from the Bank can be invited to the meetings if necessary and are present on specificmatters. This Committee’s primary responsibility is to support the Board of Directors in the continuous improvement of our system of internal controls, whichincludes reviewing the work of both the external auditors and the Internal Audit Department. The committee is also responsible for analyzing observations madeby regulatory e ntities of the Chilean financial system about us and for recommending measures to be taken by our management in response. This committee alsoperforms functions of a remuneration committee as established in Chilean Law, and reviews annually the salary and bonus programs for the executive officers ofthe Bank. The external auditors are recommended by this committee to our Board of Directors and appointed by our shareholders at the annual shareholders’meeting.
This committee is also responsible for:
· Presenting to the Board of Directors a list of candidates for the selection of an external auditor.
· Presenting to the board or directors a list of candidates for the selection of rating agencies.
· Overseeing and analyzing the results of the external audit and the internal reviews.
· Coordinating the activities of internal auditing with the external auditors’ review.
· Analyzing the interim and year-end financial statements and reporting the results to the Board of Directors.
· Analyzing the external auditors’ reports and their content, procedures and scope.
· Analyzing the rating agencies’ reports and their content, procedures and scope.
· Obtaining information regarding the effectiveness and reliability of the internal control systems and procedures.
· Analyzing the information systems performance, and its sufficiency, reliability and use in connection with decision-making processes.
114

Table of Contents
· Obtaining information regarding compliance with the company’s policies regarding the due observance of laws, regulations and internal rules to whichthe company is subject.
· Obtaining information and resolving conflict of interest matters and investigating suspicious and fraudulent activities.
· Analyzing the reports of the inspection visits, instructions and presentations of the Superintendency of Banks.
· Obtaining information, analyzing and verifying the company’s compliance with the annual audit program prepared by the internal audit department.
· Informing the Board of Directors of accounting changes and their effects.
· Examining on an annual basis the compensation plans of high level executives and managers.
Asset and Liability Committee
Board member Position in CommitteeMauricio Larraín ChairmanOscar von Chrismar MemberMarco Colodro MemberVittorio Corbo MemberRoberto Zahler Member
The Comité de Activos y Pasivos or the Asset and Liability Committee (the “ALCO”), following guidelines set by the Board of Directors and Santander
Spains’s Global Risk Department, is responsible for establishing Santander-Chile’s policies, procedures and limits with respect to market risks and monitoringthe overall performance in light of the risks assumed. The ALCO constantly monitors whether these policies are adhered to. Santander-Chile’s Market Risk andControl Department and the Financial Management Division perform the day-to-day risk management functions required for the trading and non-tradingactivities of Santander-Chile.
The Asset and Liabilities Management Committee includes the Chairman of the Board and four additional members of the Board, the Chief ExecutiveOfficer, the Manager of the Financial Management Division, the Manager of Market Risk, the Manager of the Treasury Division, the Financial Controller andother senior members of management. Senior members of Santander-Chile’s Finance Division have a formal meeting each month with the Asset and LiabilitiesManagement Committee and outside consultants. Market Committee
Board member Position in CommitteeMauricio Larraín ChairmanOscar von Chrismar MemberRoberto Zahler MemberMarco Colodro MemberVittorio Corbo Member
The Comité de Mercados or the Market Committee is responsible for establishing Santander-Chile’s policies, procedures and limits with respect to its
trading portfolio, market risks and monitoring the overall performance in light of the risks assumed. The ALCO constantly monitors whether these policies arefulfilled. Santander-Chile’s Market Risk and Control Department carry out the day-to-day risk management functions required for the trading and non-tradingactivities of Santander-Chile.
The Market Committee includes the Chairman of the Board, four additional members of the Board, the Chief Executive Officer, the Manager of GlobalBanking and Markets, the Manager of the Treasury Division, the Manager
115

Table of Contents
of Proprietary Trading, the Manager of the Financial Management Division, the Manager of Market Risk, the Financial Controller and other senior members ofmanagement. Executive Credit Committee
Board member Position in CommitteeMauricio Larraín ChairmanOscar von Chrismar MemberCarlos Olivos MemberRoberto Méndez MemberMarco Colodro Member
The Executive Credit Committee is comprised of the Chairman of the Board, three additional Board members, the Corporate Legal Counsel, the CEO, the
Manager of Global Banking, the Corporate Director of Risk, the Manager of Corporate Banking, the Manager of Middle Market and two senior members of theCredit Risk department that present the loans being reviewed for approval. This committee confirms the loan positions reviewed by the Senior Loan Committee,with approval rights up to the maximum exposure permitted by the General Banking Law. Marketing and Communications Committee
Board member Position in CommitteeMauricio Larraín ChairmanRoberto Méndez Member
The Marketing and Communications Committee is comprised of the Chairman of the Board and an additional Board member, the CEO, the Manager of
Retail Banking, the Manager of Santander Banefe, the Manager of Human Resources, the Manager of Corporate Communications, the Manager of Marketingand other senior managers of the Bank. This committee reviews and confirms all matters related to products, corporate image and communications. Technology Committee
Board member Position in CommitteeClaudia Bobadilla MemberOscar von Chrismar Carvajal Member
The Technology Committee reviews all matters related to analyzing technological developments that improve efficiency and client service. This
committee oversees the Annual Technology Plan, which includes the automation of key processes, telecommunication innovations, information security, marketintelligence and new technological trends. University Committee
Board member Position in CommitteeMauricio Larraín Member
Lucía Santa Cruz MemberRoberto Méndez Member
The University Committee reviews the Bank’s support for higher education and integrates this with the growth of the Institutional business segment and
retail banking for college graduates.
116

Table of Contents Strategy Committee
Board member Position in CommitteeOscar von Chrismar Carvajal MemberRaimundo Monge MemberJuan Hoyos Member
The Strategy Committee is in charge of the Bank’s strategic planning process and follow-up.
D. Employees
As of December 31, 2009, on a consolidated basis we had 11,118 employees, 8,411 of whom were bank employees, 350 of whom were employees of oursubsidiaries and 2,357 were employees of Special Purpose Entities. Prior to December 31, 2009, we did not consolidate these Special Purpose Entities or includethese employees in our headcount disclosures. We have traditionally enjoyed good relations with our employees and their unions. Of the total headcount of theBank and his subsidiaries, 4,822 or 54.7% were unionized. In May 2010, a new collective bargaining agreement was signed, which will become effective onJanuary 1, 2011 and that will expire on December 31, 2014, but this may be negotiated ahead of schedule with the consent of management and the union. Wegenerally apply the terms of our collective bargainin g agreement to unionized and non-unionized employees. The following chart summarizes the number ofemployees employed by the bank.
Employees 2009 Executives 636 Professionals 4,414 Administrative 6,068 Total 11,118
E. Share Ownership
No director or executive officer owns more than 1% of the shares of Santander-Chile. As of December 31, 2009, the following directors and executives heldshares in Santander-Chile:
Directors Shares
Mauricio Larraín Garcés 568Carlos Olivos Marchant 1,960,822Senior Managers
Juan Fernández 35,536
Santander-Chile currently does not have any arrangements for involving employees in its capital and there is no systematic arrangement for grant of options
or shares or securities of Banco Santander-Chile to them. However, our parent company gave each employee 100 shares in Banco Santander Spain stock in 2007.This program had no costs for Santander-Chile.
117

Table of Contents ITEM 7. MAJOR SHAREHOLDERS AND RELATED PARTY TRANSACTIONS A. Major Shareholders
As of December 31, 2009, Santander-Chile’s largest shareholders were the following: Shareholder Number of Shares Percentage Teatinos Siglo XXI Inversiones Ltda.* 78,108,391,607 41.45%Santander Chile Holding S.A. 66,822,519,695 35.46%
* Formerly known as Teatinos Siglo XXI S.A.
Banco Santander Spain controls Santander-Chile through its holdings in Teatinos Siglo XXI Inversiones Ltda. and Santander-Chile Holding, which arecontrolled subsidiaries of Banco Santander Spain. As of December 31, 2009, Banco Santander Spain directly or indirectly owned or controlled 99.5% ofSantander-Chile Holding and directly or indirectly owned or controlled 100% of Teatinos Siglo XXI Inversiones Ltda. This gives Banco Santander Spain controlover 76.91% of the shares of the Bank, and actual participation, when excluding minority shareholders, of 76.74% at December 31, 2009.
Banco Santander Spain is in a position to cause the election of a majority of the members of Santander-Chile’s Board of Directors, to determine its dividendand other policies and to determine substantially all matters to be decided by a vote of shareholders. Banco Santander Spain holds ordinary shares to which nospecial voting rights are attached. Each share represents one vote and there are no shareholders with different voting rights.
The number of outstanding shares of Santander-Chile (of which there is only one class, being ordinary shares) at December 31, 2009, was 188,446,126,794shares, without par value. Santander-Chile’s shares are listed for trading on the Chilean Stock Exchanges and on the NYSE in connection with the registration ofADRs. The market capitalization of Santander-Chile at the same date was Ch$5,792,834 million (US$11,749 million), representing 188,446,126,794 shares ofcommon stock. At December 31, 2009, Santander-Chile had 12,797 holders registered in Chile, including JP Morgan as Depositary (the “Depositary”) ofSantander-Chile’s American Depositary Share Program. As of December 31, 2009, there were a total of 33 ADR holders on record. Since some of these ADRsare held by nominees, the number of recor d holders may not be representative of the number of beneficial holders.
Other than the information disclosed in this section, there are no arrangements to the knowledge of Santander-Chile, which can result in a change of controlof Santander-Chile. B. Related Party Transactions
The Chilean Companies Law requires that our transactions with related parties be on a market basis, that is, on similar terms to those customarily prevailingin the market. We are required to compare the terms of any such transaction to those prevailing in the market at the date the transaction is to be entered into.Directors of companies that violate this provision are liable for losses resulting from such violations.
In addition, under the Chilean Companies Law, a company may not enter into a transaction with related parties unless (i) such transaction has received theprior approval of the company’s Board of Directors and (ii) the terms of such transaction are consistent with the terms of transactions of a similar type prevailingin the market. If it is not possible to make this determination, the board may appoint two independent evaluators. The evaluators’ final conclusions must be madeavailable to shareholders and directors for a period of 20 business days, during which shareholders representing 5% or more of the issued voting shares mayrequest the board to call a shareholders’ meeting to resolve the matter, with the agreement of two thirds of the issued voting shares required for approval. Forpurposes of t his regulation, the law considers the amount of a proposed transaction to be material if (1) it exceeds 1% of the company’s net worth (provided thatit also exceeds 20,000UF) or (2) it exceeds 20,000 UF.
All resolutions approving such transactions must be reported to the company’s shareholders at the next annual shareholders’ meeting. Violations of thisprovision may result in administrative or civil liability to the corporation, the shareholders and/or third parties who suffer losses as a result of such violation.
118

Table of Contents Loans granted to related parties
In addition to subsidiaries and associated entities, the Bank’s “related parties” include the “key personnel” of the Bank’s executive staff (members of theBank’s Board and the Managers of Banco Santander Chile and its subsidiaries, together with their close relatives), as well as the entities over which the keypersonnel could exert significant influence or control.
The Bank also considers the companies that are part of the Santander Group worldwide as related parties, given that all of them have a common parent, i.e.,Banco Santander S.A. (located in Spain).
The table below shows loans and receivables and contingent loans with related parties. For more information, see “Note 37—Transactions with RelatedParties” in our Audited Consolidated Financial Statements appearing elsewhere in this Annual Report: As of December 31, 2009 As of December 31, 2008
Companies of
the Group Associatedcompanies Key personnel Other
Companies ofthe Group
Associatedcompanies Key personnel Other
(in millions of
Ch$) (in millions of
Ch$) LOANS AND RECEIVABLES Commercial loans 11,331 914 2,840 108,372 54,996 51 2,417 110,074 Mortgage loans - - 12,754 - - - 11,517 - Consumer loans - - 1,744 - - - 911 -
Loans and receivables 11,331 914 17,338 108,372 54,996 51 14,845 110,074 Provision for loan losses (13) (1) (11) (298) (114) - (8) (34)
Net loans 11,318 913 17,327 108,074 54,882 51 14,837 110,040 Guarantees 4,552 - 45,550 596 62,040 - 13,867 602 Contingent loans Personal guarantees - - 15,900 - - - - - Letters of credit 1,868 - - - 1,582 - - - Performance bonds 134,644 - - 259 51,237 - - 25
Contingent loans 136,512 - - 259 52,819 - - 25 Provision for contingent loans (21) - - (4) - - -
Net contingent loans 136,491 - - 259 52,815 - - 25
The largest related party loan was rendered by the Bank to Santander Asset Management S.A. Administradora General de Fondos for Ch$25,890 million(US$40 million). The loan is in Chilean nominal pesos at a rate of 0.15% per month and will be due in May 2011.
Under the Chilean General Banking Law, Chilean banks are subject to certain lending limits, including the following:
· a bank may not extend to any person or legal entity (or group of related entities), directly or indirectly, unsecured loans in an amount that exceeds 5.0%of the bank’s regulatory capital, or secured loans in an amount that exceeds 25.0% of its regulatory capital. In the case of foreign export trade finance,this 5.0% ceiling is raised to: 10.0% for unsecured financing, 30.0% for secured financing. This ceiling is raised to 15.0% for loans granted to financepublic works under the concessions system contemplated in the Decree with Force of Law 164 of 1991, of the Ministry of Public Works, provided thateither the loan is secured on the concession, or the loan is granted as part of a loan syndication;
· a bank may not grant loans bearing more favorable terms than those generally offered by banks in the same community to any entity (or group of related
entities) that is directly or indirectly related to its owners or management;
· a bank may not extend loans to another bank in an aggregate amount exceeding 30.0% of its regulatory capital;
· a bank may not directly or indirectly grant a loan, the purpose of which is to allow the borrower to acquire shares in the lending bank;
119

Table of Contents
· a bank may not lend, directly or indirectly, to a Director or any other person who has the power to act on behalf of the bank, or to certain related parties;and
· a bank may not grant loans to individuals or legal entities involved in the ownership or management of the bank, whether directly or indirectly
(including holders of 1.0% or more of its shares), on more favorable terms than those generally offered to non-related parties. Loans may not beextended to senior executives and to companies in which such individuals have a participation of 5.0% or more of the equity or net earnings in suchcompanies. The aggregate amount of loans to related parties may not exceed a bank’s regulatory capital.
We are not aware of any loans to any related parties exceeding the above lending limits.
The table below shows assets and liabilities with related parties:
As of December 31, 2009 As of December 31, 2008
Companies of
the Group Associatedcompanies Key personnel Other
Companies ofthe Group
Associatedcompanies Key personnel Other
(in millions of Ch$) (in millions of Ch$) Assets Trading investments - - - - - - - - Investments under resale agreements - - - - - - - - Financial derivatives contracts 405,411 - - - 293,649 - - - Available for sale investments - - - - - - - - Other assets 117,060 - - - 15,422 - - - Liabilities Demand deposits and other demandobligations 1,503 6,238 502 925 6,827 4,963 1,442 5,761 Investments under repurchaseagreements - - - - 40,345 - - - Deposits and other time liabilities 411,295 - 1,126 21,652 387,477 - 2,918 3,057 Financial derivatives contracts 245,574 - - - 358,747 - - - Issued debt instruments 89,258 - - - 186,098 - - - Other financial liabilities 55,156 - - - 8,967 - - - Other liabilities 310 - - - 2,710 - - -
120

Table of Contents Other transactions with related parties
During the years ended December 31, 2008 and 2009, the Bank had the following significant income (expenses) from services provided to (by) relatedparties: As of December 31, 2009 As of December 31, 2008
Companies of
the Group Associatedcompanies Key personnel Other
Companies ofthe Group
Associatedcompanies Key personnel Other
(in millions of Ch$) (in millions of Ch$) Income (expense) recorded Income and expenses from interest andadjustments (23,344) 42 308 (769) 1,070 - 67 (11)Income and expenses from fees andservices 56,822 71 79 50 47,984 - 11 5 Net income from financial and foreignexchange transactions (*) 129,046 - 2 (13,634) (210,308) - - 97 Other operating revenues and expenses (4,294) - - - (3,995) - - - Key personnel compensation andexpenses - - (28,663) - - - (29,820) - Administrative and other expenses (13,107) (16,666) - - (12,656) (28,016) - - Totals 145,123 (16,553) (28,274) (14,353) (177,905) (28,016) (29,742) 91
* Reflects derivative contracts that hedge Group positions in Chile.
Only transactions with related parties equal to or greater than UF 5,000 are included individually in the table above. Transactions with related parties
between UF 1,000 and up to UF 5,000 are included in other transactions with related parties. All transactions were conducted at arms length. C. Interests of Experts and Counsel
Not applicable.
121

Table of Contents ITEM 8. FINANCIAL INFORMATION A. Consolidated Statements and Other Financial Information Financial Information
See Item 18. Legal Proceedings
Upon the recommendation of our legal advisors, we estimate that our aggregate liability, if all legal proceedings were determined adversely to us, couldresult in significant losses not estimated by us. As of December 31, 2009, we have set aside Ch$830 million (US$1.6 million) as provisions for these legalactions. These provisions are presented under the Contingency allowances item in our financial statements. Dividends and dividend policy
See “Item 3: A. Selected Financial Data—Dividends.” B. Significant Changes
None.
122
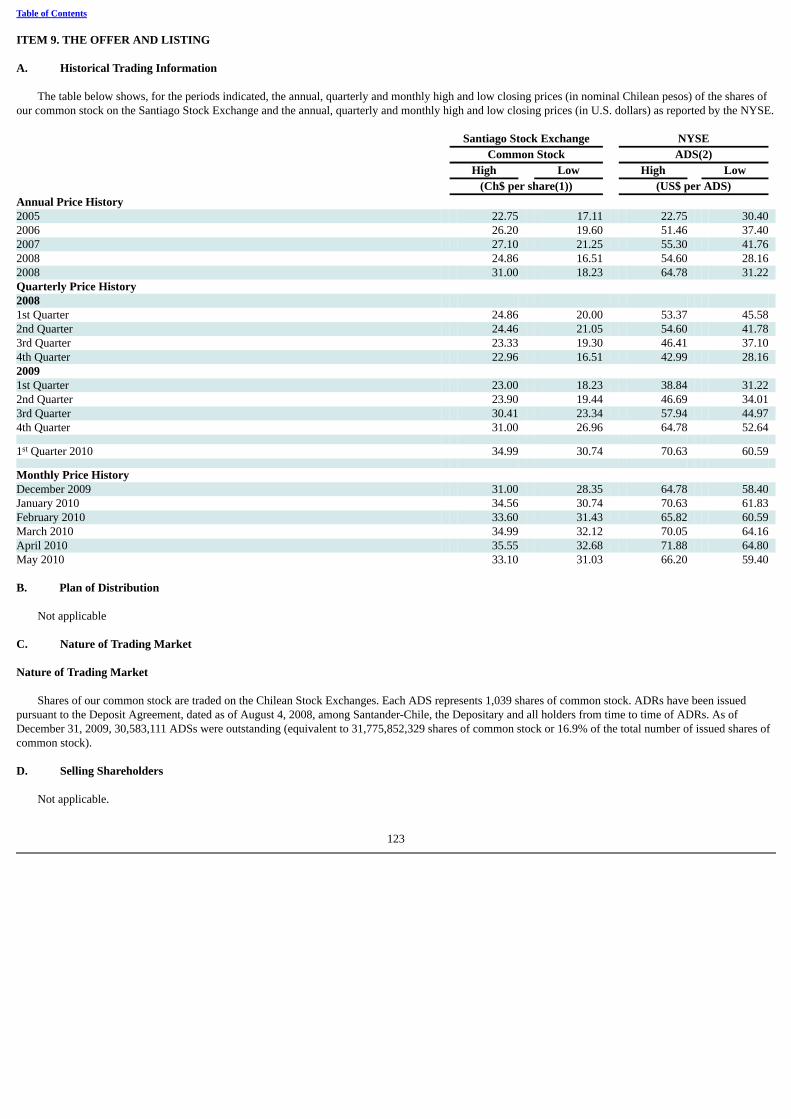
Table of Contents ITEM 9. THE OFFER AND LISTING A. Historical Trading Information
The table below shows, for the periods indicated, the annual, quarterly and monthly high and low closing prices (in nominal Chilean pesos) of the shares ofour common stock on the Santiago Stock Exchange and the annual, quarterly and monthly high and low closing prices (in U.S. dollars) as reported by the NYSE. Santiago Stock Exchange NYSE Common Stock ADS(2) High Low High Low (Ch$ per share(1)) (US$ per ADS) Annual Price History 2005 22.75 17.11 22.75 30.40 2006 26.20 19.60 51.46 37.40 2007 27.10 21.25 55.30 41.76 2008 24.86 16.51 54.60 28.16 2008 31.00 18.23 64.78 31.22 Quarterly Price History 2008 1st Quarter 24.86 20.00 53.37 45.58 2nd Quarter 24.46 21.05 54.60 41.78 3rd Quarter 23.33 19.30 46.41 37.10 4th Quarter 22.96 16.51 42.99 28.16 2009 1st Quarter 23.00 18.23 38.84 31.22 2nd Quarter 23.90 19.44 46.69 34.01 3rd Quarter 30.41 23.34 57.94 44.97 4th Quarter 31.00 26.96 64.78 52.64 1st Quarter 2010 34.99 30.74 70.63 60.59 Monthly Price History December 2009 31.00 28.35 64.78 58.40 January 2010 34.56 30.74 70.63 61.83 February 2010 33.60 31.43 65.82 60.59 March 2010 34.99 32.12 70.05 64.16 April 2010 35.55 32.68 71.88 64.80 May 2010 33.10 31.03 66.20 59.40 B. Plan of Distribution
Not applicable C. Nature of Trading Market Nature of Trading Market
Shares of our common stock are traded on the Chilean Stock Exchanges. Each ADS represents 1,039 shares of common stock. ADRs have been issuedpursuant to the Deposit Agreement, dated as of August 4, 2008, among Santander-Chile, the Depositary and all holders from time to time of ADRs. As ofDecember 31, 2009, 30,583,111 ADSs were outstanding (equivalent to 31,775,852,329 shares of common stock or 16.9% of the total number of issued shares ofcommon stock). D. Selling Shareholders
Not applicable.
123

Table of Contents E. Dilution
Not applicable. F. Expenses of the Issue
Not applicable. ITEM 10. ADDITIONAL INFORMATION A. Share Capital
Not applicable. B. Memorandum and Articles of Association
The legal predecessor of Santander-Chile was Banco Santiago (Santiago). Santiago was incorporated by public deed dated September 7, 1977 granted at theNotary Office of Alfredo Astaburuaga Gálvez. Santiago received its permission to incorporate and function as a bank by Resolution No. 118 of theSuperintendency of Banks on October 27, 1977. The Bank’s by-laws were approved by Resolution No. 103 of the Superintendency of Banks on September 22,1977. In January 1997, Santiago merged with Banco O’Higgins’ with Santiago as the surviving entity. In 1999, Santiago became a controlled subsidiary ofBanco Santander Spain.
On May 24, 2007, we have changed our by-laws insofar as our official name shall be Banco Santander-Chile (formerly: Banco Santander Chile) and that theBank may also use the following names: Banco Santander Santiago, Santander Santiago, Banco Santander, or Santander (formerly only: Banco SantanderSantiago and Santander Santiago.)
Shareholder rights in a Chilean bank that is also an open stock (public) corporation are governed by (1) the corporation’s estatutos, which effectively servethe purpose of both the articles or certificate of incorporation and the by-laws of a company incorporated in the United States, (2) the General Banking Law and(3) to the extent not inconsistent with the General Banking Law, by the provisions of Chilean Companies Law applicable to open stock corporations, except forcertain provisions that are expressly excluded. Article 137 of the Chilean Companies Law provides that all provisions of the Chilean Companies Law takeprecedence over any contrary provision in a corporation’s estatutos. Both t he Chilean Companies Law and our estatutos provide that legal actions byshareholders against us (or our officers or directors) to enforce their rights as shareholders or by one shareholder against another in their capacity as such are tobe brought in Chile in arbitration proceedings, notwithstanding the plaintiff’s right to submit the action to the ordinary courts of Chile.
The Chilean securities markets are principally regulated by the Superintendency of Securities and Insurance under the Chilean Securities Market Law andthe Chilean Companies Law. In the case of banks, compliance with these laws is supervised by the Superintendency of Banks. These two laws provide fordisclosure requirements, restrictions on insider trading and price manipulation and protection of minority investors. The Chilean Securities Market Law sets forthrequirements relating to public offerings, stock exchanges and brokers, and outlines disclosure requirements for companies that issue publicly offered securities.The Chilean Companies Law sets forth the rules and requirements for establishing open stock corporations while eliminating government supervision of closed(closely-held) corporations. Open stock (publi c) corporations are those with 500 or more shareholders, or companies in which 100 or more shareholders own atleast 10.0% of the subscribed capital (excluding those whose individual holdings exceed 10.0%), and all other companies that are registered in the SecuritiesRegistry of the Superintendency of Securities and Insurance.
Santander-Chile is a bank providing a broad range of commercial and retail banking services, as well as a variety of financial services. Our objects andpurposes can be found in Article 4 of our estatutos.
124

Table of Contents Board of Directors
The Board of Directors has 11 regular members and 2 alternate members, elected by shareholder vote at General Shareholders’ Meetings. The directors maybe either shareholders or non-shareholders of the Company. There is no age limit for directors.
A director remains in office for three years and may be reelected indefinitely. If for any reason, the General Shareholders’ Meeting where the newlyappointments of directors are to be made is not held, the duties of those serving as such shall be extended until their replacements are designated, in which case,the Board of Director shall convene a Meeting at the earliest possible time in order to effect the appointments.
The directors are entitled to compensation for the performance of their duties. The amount of their compensation is determined annually by the GeneralShareholders’ Meeting. In addition, payments in the form of wages, fees, travel accounts, expense accounts, dues as representatives of the Board of Directors andother cash payments, payments in kind or royalties of any sort whatsoever, may be paid to certain directors for the performance of specific duties or tasks inaddition to their functions as directors imposed upon them specifically by the General Shareholders’ Meeting. Any special compensation is authorized orapproved at the General Shareholders’ Meeting, and for that purpose, a detailed and separate entry shall be made in the Annual Report, which shall expresslyindicate the complete name of e ach of the directors receiving special compensation.
Without prejudice to any other incapacity or incompatibility established by law, the following may not be directors: (a) those persons who have beensentenced or are being tried, either as principals or accessories, for crimes punishable with a penalty of temporary or permanent suspension from or incapacity tohold public office; (b) those persons who have been declared bankrupt and have not been rehabilitated; (c) members of the House of Representatives and theSenate; (d) directors or employees of any other financial institution; employees appointed by the President of the Republic and employees or officers of (i) theState, (ii) any public service, public institution, semi-public institution, autonomous entity or state-controlled company (any such entity a “Public Entity”) or (iii)any enterprise, corpor ation or public or private entity in which the State or a Public Entity has a majority interest, has made capital contributions, or isrepresented or participating, provided that persons holding positions in teaching activities in any of the above entities may be directors; and (f) the Bank’semployees, which shall not prevent a director from holding on a temporary basis and for a term not to exceed ninety days the position of General Manager. ChiefExecutive Officers may not be elected as directors.
For purposes of the appointment of directors, each shareholder shall have the right to one vote per share for purposes of appointing a single person, or todistribute his votes in between candidates as he may deem convenient, and the persons obtaining the largest number of votes in the same and single process shallbe awarded positions, until all positions have been filled. The election of the regular and alternate board members shall be carried out separately. For purposes ofthe casting of the vote, the Chairman and the Secretary, together with any other persons that may have been previously designated by the Meeting to sign theminutes thereof, shall issue a certificate giving evidence of the oral votes of shareholders attending, following the order of the list of attendance being taken.
Each shareholder shall be entitled, however, to cast his vote by means of a ballot signed by him, stating whether he signs for his own account or as arepresentative. This entitlement notwithstanding, in order to expedite the voting process, the Chairman of the Bank or the Superintendency, as the case may be, isentitled to order that the vote be taken alternatively or by oral vote or by means of ballots. At the time of polling, the Chairman may instruct that the votes beread aloud, in order for those in attendance to count for themselves the number of votes issued and verify the outcome of the voting process.
The Secretary tabulates the votes and the Chairman announces those who have obtained the largest majorities until all the director positions have been filled.The Secretary places the documents evidencing the outcome of the count, duly signed by the persons charged with the duty of verifying the number of votesissued, together with the ballots delivered by the shareholders who did not vote orally, in an envelope which shall be closed and sealed with the corporate sealand shall remain deposited with the Bank for a least two years.
Every appointment of directors, or any changes in the appointment of directors, shall be transcribed into a public deed before a notary public, published in anewspaper of Santiago and notified to the Superintendency of Banks and Financial Institutions, by means of the filing of a copy of the respective public deed.Likewise, the
125

Table of Contents
appointments of General Manager, Manager and Deputy Managers shall be communicated and transcribed into a public deed.
If a director ceases to be able to perform his or her duties, whether by reason of conflict of interest, limitation, legal incapacity or bankruptcy, impossibility,resignation or any other legal cause, the vacancy shall be filled as follows: (a) the positions of regular directors shall be filled by an alternate director; and (b) thepositions of alternate directors vacated upon the application of (a) above, and the positions of regular directors if a regular director’s position can not be filledpursuant to clause (a) because both alternate members have already become regular members, shall be filled by the Board of Directors on its first meeting afterthe vacancy occurs. Board members appointed pursuant to clause (b) will remain in the position until the next General Shareholders’ Meeting, where the appointment may be ratified, in which case, the replacement director will remain in his or her position until the expiration of the term of the director he or she replaced.
The alternate directors may temporarily replace regular directors in case of their absence or temporary inability to attend a board meeting, or in a definitivemanner in case of vacancy. The alternate board members are always entitled to attend and speak at board meetings. They will be entitled to vote at such meetingsonly when a regular member is absent and such alternate member acts as the absent member’s replacement.
During the first meeting following the General Shareholders’ Meeting, the Board of Directors shall elect in separate votes from among its members, aChairman, a First Vice Chairman and a Second Vice Chairman. In the event of a tie, the appointment shall be decided by lottery.
The Board of Directors meet in ordinary sessions at least once a month, held on pre-set dates and times determined by the Board. Extraordinary meetings areheld whenever called by the Chairman, whether at his own will or upon the request of three or more directors, so long as the Chairman determines in advancethat the meeting is justified, except if the request is made by the absolute majority of the directors in office, in which case the meeting shall be held without suchprior determination. The extraordinary meetings may only address those matters specifically included in the agenda for the extraordinary meeting, except that, ifthe meeting is attended by all the directors in office, they may agree otherwise by a unanimous vote. Extraordinary meetings shall be called by means of a writteninstrument signed by the C hairman or the Secretary or his alternate and delivered to each of the directors at least three days prior to the date set for the meeting.
The quorum for the Board of Directors’ Meeting is six of its members. Resolutions shall be adopted by the affirmative vote of the absolute majority of theattending directors. In the event of a tie, the person acting as the Chairman of the meeting shall cast a deciding vote.
Directors having a vested interest in a negotiation, act, contract or transaction that is not related to the bank business, either as principal or as representativeof another person, shall communicate such fact to the other directors. If the respective resolutions are approved by the Board, it shall be in accordance to theprevailing fair market conditions and director’s interest must be disclosed at the next General Shareholders’ Meeting.
The discussions and resolutions of the Board of Directors shall be recorded in a special book of minutes maintained by the Secretary. The relevant minutesshall be signed by the directors attending the meeting and by the Secretary, or his alternate. If a director determines that the minutes for a meeting are inaccurateor incomplete, he is entitled to record an objection before actually signing the minutes. The resolutions adopted may be carried out prior to the approval of theminutes at a subsequent meeting. In the event of death, refusal or incapacity for any reason of any of the directors attending to sign the minutes, suchcircumstance shall be recorded at the end of the minutes stating the reason for the impediment.
The directors are personally liable for all of the acts they effect in the performance of their duties. Any director who wishes to disclaim responsibility for anyact or resolution of the Board of Directors must to record his opposition in the minutes, and the Chairman must report the opposition at the following GeneralShareholders’ Meeting.
The Board will represent the Bank in and out of court and, for the performance of the Bank’s business, a circumstance that will not be necessary to provebefore third parties, it will be empowered with all the authorities and powers of administration that the law or the by-laws do not set as exclusive to the GeneralShareholders’ Meeting, without being necessary to grant any special power of attorney, even for those acts that the law requires to
126
Table of Contents
do so. This provision is notwithstanding the judicial representation of the Bank that is part of the General Manager’s authorities. The Board may delegate part ofits authority to the General Manager, to the Managers, Deputy Managers or Attorneys of the Bank, a Director, a Commission of Directors, and for specificallydetermined purposes, in other persons. Meetings and Voting Rights
An ordinary annual meeting of shareholders is held within the first four months of each year. The ordinary annual meeting of shareholders is the corporatebody that approves the annual financial statements, approves all dividends in accordance with the dividend policy determined by our Board of Directors, electsthe Board of Directors and approves any other matter that does not require an extraordinary shareholders’ meeting. The last ordinary annual meeting of ourshareholders was held on April 27, 2010. Extraordinary meetings may be called by our Board of Directors when deemed appropriate, and ordinary orextraordinary meetings must be called by our Board of Directors when requested by shareholders representing at least 10.0% of the issued voting shares or by theSuperintendency of Banks. Notice to convene the ordinary annual meeting or an extraordinary meeting is given by means of three notices which must bepublished in a newspaper of our corporate domicile (currently Santiago) or in the Official Gazette in a prescribed manner, and the first notice must be publishednot less than 15 days nor more than 20 days in advance of the scheduled meeting. Notice must also be mailed 15 days in advance to each shareholder and givento the Superintendency of Banks and the Chilean Stock Exchanges. Currently, we publish our official notices in the El Mercurio newspaper of Santiago.
The quorum for a shareholders’ meeting is established by the presence, in person or by proxy, of shareholders representing at least an absolute majority ofthe issued shares. If a quorum is not present at the first meeting, the meeting can be reconvened (in accordance with the procedures described in the previousparagraph) and, upon the meeting being reconvened, shareholders present at the reconvened meeting are deemed to constitute a quorum regardless of thepercentage of the shares represented. The shareholders’ meetings pass resolutions by the affirmative vote of an absolute majority of those voting shares presentor represented at the meeting. The vote required at any shareholders’ meeting to approve any of the following actions, however, is a two-thirds majority of theissued shares:
· a change in corporate form, spin-off or merger;
· an amendment of the term of existence, if any, and the early dissolution of the bank;
· a change in corporate domicile;
· a decrease of corporate capital previously approved by the Superintendency of Banks, provided it is not reduced below the legal minimum capital;
· a decrease in the number of directors previously approved by the Superintendency of Banks;
· the approval of contributions and appraisal of properties other than cash, in those cases where it is permitted by the General Banking Act;
· the amendment of authority of the general shareholders’ meeting or the restriction of the authority of the Board of Directors;
· the transfer of 50.0% or more of the corporate assets, regardless of whether it includes liabilities, or the implementation or amendment of any businessplan that contemplates the transfer of 50.0% or more of the corporate assets;
· a change in the manner of distribution of profits established in the by-laws;
· any non-cash distribution in respect of the shares;
127
Table of Contents
· the repurchase of shares of stock in the Bank; or
· the approval of material related-party transactions when requested by shareholders representing at least 5.0% of the issued and outstanding shares withright to vote if they determine that the terms and conditions of those transactions are not favorable to the interests of the bank or if two independentassessments of those transactions requested by the Board materially differ from each other.
Shareholders may accumulate their votes for the election of directors and cast all of their votes in favor of one person.
In general, Chilean law does not require a Chilean open stock corporation to provide the level and type of information that U.S. securities laws require a
reporting company to provide to its shareholders in connection with a solicitation of proxies. However, shareholders are entitled to examine the books of thebank within the 15-day period before the ordinary annual meeting. Under Chilean law, a notice of a shareholders’ meeting listing matters to be addressed at themeeting must be mailed not fewer than 15 days prior to the date of such meeting, and, in cases of an ordinary annual meeting, shareholders holding a prescribedminimum investment must be sent an Annual Report of the bank’s activities which includes audited financial statements. Shareholders who do not fall into thiscategory but who request it must also be sent a copy of the bank’s Annual Report. In addition to these requirements, we regularly provide, and managementcurrently intends to continue to provide, together with the notice of shareholders’ meeting, a proposal for the final annual dividend.
The Chilean Corporations Law provides that whenever shareholders representing 10.0% or more of the issued voting shares so request, a Chilean company’sAnnual Report must include, in addition to the materials provided by the Board of Directors to shareholders, such shareholders’ comments and proposals inrelation to the company’s affairs. Similarly, the Chilean Corporations Law provides that whenever the Board of Directors of an open stock corporation convenesan ordinary shareholders’ meeting and solicits proxies for that meeting, or distributes information supporting its decisions, or other similar material, it isobligated to include as an annex to its Annual Report any pertinent comments and proposals that may have been made by shareholders owning 10.0% or more ofthe company’s voting shares who have requested that such comments and proposals be so included.
Only shareholders registered as such with us on the fifth business day prior to the date of a meeting are entitled to attend and vote their shares. A shareholdermay appoint another individual (who need not be a shareholder) as his proxy to attend and vote on his behalf. Every shareholder entitled to attend and vote at ashareholders’ meeting has one vote for every share subscribed. Each share represents one vote and there are no special classes of shares with different rights. Ourby-laws do not include any condition that is more significant than required by law to change the right of shareholders. Capitalization
Under Chilean law, the shareholders of a company, acting at an extraordinary shareholders’ meeting, have the power to authorize an increase in suchcompany’s capital. When an investor subscribes for issued shares, the shares are registered in such investor’s name, even if not paid for, and the investor istreated as a shareholder for all purposes except with regard to receipt of dividends and the return of capital, provided that the shareholders may, by amending theby-laws, also grant the right to receive dividends or distributions of capital. The investor becomes eligible to receive dividends and returns of capital once it haspaid for the shares (if it has paid for only a portion of such shares, it is entitled to reserve a corresponding pro-rata portion of the dividends declared and/orreturns of c apital with respect to such shares unless the company’s by-laws provide otherwise). If an investor does not pay for shares for which it has subscribedon or prior to the date agreed upon for payment, the company is entitled under Chilean law to auction the shares on the stock exchange and collect the difference,if any, between the subscription price and the auction proceeds. However, until such shares are sold at auction, the subscriber continues to exercise all the rightsof a shareholder (except the right to receive dividends and return of capital).
Article 22 of the Chilean Corporations Law states that the purchaser of shares of a company implicitly accepts its by-laws and any agreements adopted atshareholders’ meetings.
128

Table of Contents Approval of Financial Statements
Our Board of Directors is required to submit our audited financial statements to the shareholders annually for their approval. The approval or rejection ofsuch financial statements is entirely within our shareholders’ discretion. If our shareholders reject our financial statements, our Board of Directors must submitnew financial statements not later than 60 days from the date of such rejection. If our shareholders reject our new financial statements, our entire Board ofDirectors is deemed removed from office and a new Board of Directors is elected at the same meeting. Directors who individually approved such rejectedfinancial statements are disqualified for re-election for the ensuing period. Registrations and Transfers
We act as our own registrar and transfer agent, as is customary among Chilean companies. In the case of jointly owned shares, an attorney-in-fact must beappointed to represent the joint owners in dealings with us. Dividend, Liquidation and Appraisal Rights
Under the Chilean Corporations Law, Chilean companies are generally required to distribute at least 30.0% of their earnings as dividends.
In the event of any loss of capital, no dividends can be distributed so long as such loss is not recovered. Also, no dividends of a bank above the legalminimum can be distributed if doing so would result in the bank exceeding its ratio of risk-weighted assets to regulatory capital or total assets.
Dividends that are declared but not paid by the date set for payment at the time of declaration are adjusted from the date set for payment to the date suchdividends are actually paid, and they accrue interest.
We may declare a dividend in cash or in shares. When a share dividend is declared above the legal minimum (which minimum must be paid in cash), ourshareholders must be given the option to elect to receive cash. Our ADS holders may, in the absence of an effective registration statement under the SecuritiesAct or an available exemption from the registration requirement thereunder, effectively be required to receive a dividend in cash. See “Item 10: B. Memorandumand Articles of Incorporation—Preemptive Rights and Increases of Share Capital.” A dividend entitlement lapses after 5 years and the funds go to the ChileanTreasury.
In the event of our liquidation, the holders of fully paid shares would participate equally and pro rata, in proportion to the number of paid-in shares held bythem, in the assets available after payment of all creditors. The holders of fully paid shares would not be required to contribute additional capital to the Bank inthe event of our liquidation.
In accordance with the General Banking Law, our shareholders do not have appraisal rights. Ownership Restrictions
Under Article 12 of the Chilean Securities Market Law and the regulations of the Superintendency of Banks, shareholders of open stock corporations arerequired to report the following to the Superintendency of Securities and Insurance and the Chilean Stock Exchanges:
· any direct or indirect acquisition or sale of shares that results in the holder’s acquiring or disposing, directly or indirectly, 10.0% or more of an openstock corporation’s share capital; and
· any direct or indirect acquisition or sale of shares or options to buy or sell shares, in any amount, if made by a holder of 10.0% or more of an open stock
corporation’s capital or if made by a director, liquidator, main officer, general manager or manager of such corporation.
In addition, majority shareholders must include in their report whether their purpose is to acquire control of the company or if they are making a financialinvestment. A beneficial owner of ADSs representing 10.0% or more of our share capital will be subject to these reporting requirements under Chilean law.
129

Table of Contents Under Article 54 of the Chilean Securities Market Law and the regulations of the Superintendency of Securities and Insurance, persons or entities intending
to acquire control, directly or indirectly, of an open stock corporation, regardless of the acquisition vehicle or procedure, and including acquisitions made throughdirect subscriptions or private transactions, are also required to inform the public of such acquisition at least 10 business days before the date on which thetransaction is to be completed, but in any case, as soon as negotiations regarding the change of control begin (i.e., when information and documents concerningthe target are delivered to the potential acquiror) through a filing with the Superintendency of Securities and Insurance, the stoc k exchanges and the companiescontrolled by and that control the target and through a notice published in two Chilean newspapers, which notice must disclose, among other information, theperson or entity purchasing or selling and the price and conditions of any negotiations.
Prior to such publication, a written communication to such effect must be sent to the target corporation, to the controlling corporation, to the corporationscontrolled by the target corporation, to the Superintendency of Securities and Insurance, and to the Chilean stock exchanges on which the securities are listed.
In addition to the foregoing, Article 54A of the Chilean Securities Market Law requires that within two business days of the completion of the transactionspursuant to which a person has acquired control of a publicly traded company, a notice shall be published in the same newspapers in which the notice referred toabove was published and notices shall be sent to the same persons mentioned in the preceding paragraphs.
The provisions of the aforementioned articles do not apply whenever the acquisition is being made through a tender or exchange offer.
Title XXV of the Chilean Securities Market Law on tender offers and the regulations of the Superintendency of Securities and Insurance provide that thefollowing transactions must be carried out through a tender offer:
· an offer which allows a person to take control of a publicly traded company, unless (i) the shares are being sold by a controlling shareholder of suchcompany at a price in cash which is not substantially higher than the market price and the shares of such company are actively traded on a stockexchange and (ii) those shares are acquired (a) through a capital increase, (b) as a consequence of a merger, (c) by inheritance or (d) through a forcedsale; and
· an offer for a controlling percentage of the shares of a listed company if such person intends to take control of the parent company (whether listed or
not) of such listed company, to the extent that the listed company represents 75.0% or more of the consolidated net worth of the parent company.
In addition, Article 69bis of the Companies Law requires that whenever a controlling shareholder acquires two thirds of the voting shares of a listedcompany, such controlling shareholder must offer to purchase the remaining shares from the minority shareholders in a tender offer.
Article 200 of the Chilean Securities Market Law prohibits any shareholder that has taken control of a publicly traded company to acquire, for a period of 12months from the date of the transaction in which it gained control of the publicly traded company, a number of shares equal to or greater than 3.0% of theoutstanding issued shares of the target without making a tender offer at a price per share not lower than the price paid at the time of taking control. Should theacquisition from the other shareholders of the company be made on a stock exchange and on a pro rata basis, the controlling shareholder may purchase a higherpercentage of shares, if so permitted by the regulations of the stock exchange.
Title XV of the Chilean Securities Market Law sets forth the basis to determine what constitutes a controlling power, a direct holding and a related party.The Chilean Securities Market Law defines control as the power of a person or group of persons acting (either directly or through other entities or persons)pursuant to a joint action agreement, to direct the majority of the votes at the shareholders’ meetings of the corporation, to elect the majority of members of itsBoard of Directors, or to influence the management of the corporation significantly. Significant influence is deemed to exist in respect of the person or group ofpersons with an agreement to act jointly that holds, directly or indirectly, at least 25.0% of the voting share capital, unless:
· another person or group of persons acting pursuant to joint action agreement, directly or indirectly, controls a stake equal to or greater than thepercentage controlled by such person or group of persons;
130
Table of Contents
· the person or group does not control, directly or indirectly, more than 40.0% of the voting share capital and the percentage controlled is lower than thesum of the shares held by other shareholders holding more than 5.0% of the share capital (either directly or pursuant to a joint action agreement); or
· in cases where the Superintendency of Securities and Insurance has ruled otherwise, based on the distribution or atomization of the overall shareholding.
According to the Chilean Securities Market Law, a joint action agreement is an agreement among two or more parties which, directly or indirectly, own
shares in a corporation at the same time and whereby they agree to participate with the same interest in the management of the corporation or in taking control ofthe same. The law presumes that such an agreement exists between:
· a principal and its agents;
· spouses and relatives within certain degrees of kinship;
· entities within the same business group; and
· an entity and its controller or any of the members of the controller.
Likewise, the Superintendency of Securities and Insurance may determine that a joint action agreement exists between two or more entities considering,among other things, the number of companies in which they participate and the frequency with which they vote identically in the election of directors,appointment of managers and other resolutions passed at extraordinary shareholders’ meetings.
According to Article 96 of the Chilean Securities Market Law, a business group is a group of entities with such ties in their ownership, management or creditliabilities that it may be assumed that the economic and financial action of such members is directed by, or subordinated to, the joint interests of the group, or thatthere are common credit risks in the credits granted to, or in the acquisition of securities issued by, them. According to the Chilean Securities Market Law, thefollowing entities are part of the same business group:
· a company and its controller;
· all the companies with a common controller together with that controller;
· all the entities that the Superintendency of Securities and Insurance declares to be part of the business group due to one or more of the followingreasons:
· a substantial part of the assets of the company is involved in the business group, whether as investments in securities, equity rights, loans or guaranties;
· the company has a significant level of indebtedness and the business group has a material participation as a lender or guarantor;
· any member of a group of controlling entities of a company mentioned in the first two bullets above and there are grounds to include it in the business
group; or
· the company is controlled by a member of a group of controlling entities and there are grounds to include it in the business group.
Article 36 of the General Banking Law states that as a matter of public policy, no person or company may acquire, directly or indirectly, more than 10.0% ofthe shares of a bank without the prior authorization of the Superintendency of Banks, which may not be unreasonably withheld. The prohibition would also applyto beneficial owners of ADSs. In the absence of such authorization, any person or group of persons acting in concert would not be permitted to exercise votingrights with respect to the shares or ADSs acquired. In determining whether or not to issue such an authorization, the Superintendency of Banks considers anumber of factors enumerated in the General Banking Law, including the financial stability of the purchasing party.
131

Table of Contents According to Article 35bis of the General Banking Law, the prior authorization of the Superintendency of Banks is required for:
· the merger of two or more banks;
· the acquisition of all or a substantial portion of a banks’ assets and liabilities by another bank;
· the control by the same person, or controlling group, of two or more banks; or
· a substantial increase in the existing control of a bank by a controlling shareholder of that bank.
This prior authorization is only required when the acquiring bank or the resulting group of banks would own a significant market share in loans, defined by
the Superintendency of Banks to be more than 15.0% of all loans in the Chilean banking system. The intended purchase, merger or expansion may be denied bythe Superintendency of Banks; or, if the acquiring bank or resulting group would own a market share in loans determined to be more than 20.0% of all loans inthe Chilean banking system, the purchase, merger, or expansion may be conditioned on one or more of the following:
· the bank or banks maintaining regulatory capital higher than 8.0% and up to 14.0% of risk-weighted assets;
· the technical reserve established in Article 65 of the General Banking Law being applicable when deposits exceed one and a half times the resultingbank’s paid-in capital and reserves; or
· the margin for interbank loans be reduced to 20.0% of the resulting bank’s regulatory capital.
If the acquiring bank or resulting group would own a market share in loans determined by the Superintendency of Banks to be more than 15% but less than
20%, the authorization will be conditioned on the bank or banks maintaining a regulatory capital not lower than 10% of their risks weighted assets for the periodspecified by the Superintendency of Banks, which may not be less than one year. The calculation of the risk weighted assets is based on a five category riskclassification system applied to a bank’s assets that is based on the Basel Committee recommendations.
According to the General Banking Law, a bank may not grant loans to related parties on terms more favorable than those generally offered to non-relatedparties. Article 84 No. 2 of the General Banking Law and the regulations issued by the Superintendency of Banks creates the presumption that natural personswho are holders of shares and who beneficially own more than 1.0% of the shares are related to the bank and imposes certain restrictions on the amounts andterms of loans made by banks to related parties. This presumption would also apply to beneficial owners of ADSs representing more than 1.0% of the shares.Finally, according to the regulations of the Superintendency of Banks, Chilean banks that issue ADSs are required to inform the Superintendency of Banks if anyperson, directly or indirectly, acquires ADSs repr esenting 5.0% or more of the total amount of shares of capital stock issued by such bank.
Article 16bis of the General Banking Law provides that the individuals or legal entities that, individually or with other people, directly control a bank andwho individually own more than 10.0% of its shares must send to the Superintendency of Banks reliable information on their financial situation in the form andin the opportunity set forth in Resolution No. 3,156 of the Superintendency of Banks.
There are no limitations for non-resident or foreign shareholders to hold or exercise voting rights on the securities. Preemptive Rights and Increases of Share Capital
The Chilean Corporations Law provides that whenever a Chilean company issues new shares for cash, it must offer its existing shareholders the right topurchase a number of shares sufficient to maintain their existing ownership percentages in the company. Pursuant to this requirement, preemptive rights inconnection with any future issue of shares will be offered by us to the Depositary as the registered owner of the shares underlying the ADSs. However, theDepositary will not be able to make such preemptive rights available to holders of ADSs unless a registration statement under the Securities Act is effective withrespect to the underlying shares or an exemption from the registration requirements thereunder is available.
132

Table of Contents We intend to evaluate, at the time of any preemptive rights offering, the practicality under Chilean law and Central Bank regulations in effect at the time of
making such rights available to our ADS holders, as well as the costs and potential liabilities associated with registration of such rights and the related shares ofcommon stock under the Securities Act, and the indirect benefits to us of thereby enabling the exercise by all or certain holders of ADSs of their preemptiverights and any other factors we consider appropriate at the time, and then to make a decision as to whether to file such registration statement. We cannot assureyou that any registration statement would be filed. If we do not file a registration statement and no exemption from the registration requirements under theSecurities Act is available, the Depositary will sell such holders’ preemptive rights and distribute the proceeds thereof if a premium can be recognized over thecost of such sale. In the event that the Depositary is not able, or determines that it is not feasible, to sell such rights at a premium over the cost of any such sale,all or certain holders of ADSs may receive no value for such rights. Non-U.S. holders of ADSs may be able to exercise their preemptive rights regardless ofwhether a registration statement is filed. The inability of all or certain holders of ADSs to exercise preemptive rights in respect of shares of common stockunderlying such ADSs could result in such holders not maintaining their percentage ownership of the common stock following such preemptive rights offeringunless such holder made additional market purchases of ADSs or shares of common stock.
Under Chilean law, preemptive rights are exercisable or freely transferable by shareholders during a period that cannot be less than 30 days following thegrant of such rights. During such period, and for an additional 30-day period thereafter, a Chilean corporation is not permitted to offer any unsubscribed sharesfor sale to third parties on terms which are more favorable than those offered to its shareholders. At the end of such additional 30-day period, a Chilean openstock corporation is authorized to sell unsubscribed shares to third parties on any terms, provided they are sold on a Chilean stock exchange. Unsubscribed sharesthat are not sold on a Chilean stock exchange can be sold to third parties only on terms no more favorable for the purchaser than those offered to shareholders. C. Material Contracts
On December 3, 2007, we entered into a long-term contract with Produban for the operation of certain of our systems, providing us with information dataprocessing, technology services and hardware infrastructure to run our core transactional systems. On April 4, 2008, the Superintendency of Bank authorized thetransfer of the Bank’s data processing center from IBM Chile to Produban, a subsidiary of Banco Santander, S.A. located in Madrid, Spain. This contract alsoincludes an improvement in transactional capacities, services and back-up requirement compared to previous services. We agreed to pay Produbanapproximately €55 million (US$77 million) in the next five years. In 2009, we paid Produban Ch$8,924 million (US$18 million).
On December 30, 2009, Banco Santander Chile sold the building located at calle Bandera N°201 to “IM Trust Administradora General de Fondos para elFondo de Inversión Privado Inmobiliario Bandera” a private real estate investment fund. The total payment for this transaction amounted to $11,102 million. Thebuilding’s book value at the time of the sale was Ch$4,030 million, yielding an income of Ch$7,072 million from the sale, included in Other operating income inthe Consolidated Income Statement.
D. Exchange Controls
The Central Bank is responsible for, among other things, monetary policies and exchange controls in Chile. Appropriate registration of a foreign investmentin Chile grants the investor access to the Formal Exchange Market. See “Item 3: A. Selected Financial Data—Exchange Rates.” Foreign investments can beregistered with the Foreign Investment Committee under Decree Law No. 600 or can be registered with the Central Bank under the Central Bank Act. TheCentral Bank Act is an organic constitutional law requiring a “special majority” vote of the Chilean Congress to be amended. Since April 18, 2001, all exchangecontrols in Chile have been eliminated.
Previously, Chilean law mandated that holders of shares of Chilean companies that were not residents of Chile register as foreign investors under one of theforeign investment regimes contemplated by Chilean law in order to receive dividends, sale proceeds or other amounts with respect to their shares remittedoutside Chile through the Formal Exchange Market. Under the Foreign Investment Contract (as defined herein), the Depositary, on behalf of ADS holders, isgranted access to the Formal Exchange Market to convert cash dividends from Chilean pesos to U.S. dollars and to pay such U.S. dollars to ADS holders outsideChile, net of taxes, and no separate registration by ADR holders is required. As of April 19, 2001, the Central Bank deregulated the Exchange Market,eliminating the need to obtain approval from the Central Bank in order to remit dividends, but at the same time eliminating the possibility of guaranteeing accessto the Formal Exchange Market. It is important to point out that this does not
133

Table of Contents
affect the current Foreign Investment Contract, which was signed prior to April 19, 2001, and still permits access to the Formal Exchange Market based on theprior approval of the Central Bank. Therefore the holders of ADRs of Santander-Chile are still subject to the Foreign Investment Contract, including its clausesreferring to the prior exchange rules including the now extinct Chapter XXVI of the Compedium. E. Taxation
The following discussion summarizes certain material Chilean tax and United States federal income tax consequences to beneficial owners arising from theownership and disposition of our common stock and ADSs. The summary does not purport to be a comprehensive description of all potential Chilean tax andUnited States federal income tax considerations that may be relevant to a decision to own or dispose of our common stock and ADSs and is not intended as taxadvice to any particular investor. This summary does not describe any tax consequences arising under the laws of any state, locality or other taxing jurisdictionother than Chile and the United States. There is currently no income tax treaty between the United States and Chile. However, the U.S. government and thegovernment of Chile signed on February 4, 2010 the Proposed 2010 Income Tax Treaty between the United States of America and the Republic of Chile (the“Proposed U.S.-Chile Treaty”), which is now subject to ratification by the U.S. Senate. If the Proposed U.S.-Chile Treaty becomes effective, U.S. investorsshould consult their tax advisers as to the applicability of the treaty in their particular circumstances. Material Tax Consequences of Owning Shares of Our Common Stock or ADSs
Chilean Taxation
The following is a summary of certain Chilean tax consequences of the ownership and disposition of shares of our common stock or of ADSs evidenced byADRs by Foreign Holders (as defined herein). The summary does not purport to be a comprehensive description of all of the tax considerations that may berelevant to a decision to own or dispose of shares of our common stock or ADSs and does not purport to deal with the tax consequences applicable to allcategories of investors, some of whom may be subject to special rules. Holders of shares of our common stock or ADSs are advised to consult their own taxadvisers concerning the Chilean and other tax consequences of the ownership and disposition of shares of our common stock or of ADSs evidenced by ADRs.
The description of Chilean tax laws set forth below is based on Chilean laws in force as of the date of this Annual Report and is subject to any changes insuch laws occurring after the date of this Annual Report. These changes can be made on a retroactive basis.
For purposes of this summary, the term “Foreign Holder” means either (1) in the case of an individual, a person who is not resident or domiciled in Chile; or(2) in the case of a legal entity, a legal entity that is not domiciled in Chile, unless the shares of our common stock or ADSs are assigned to a branch or apermanent establishment of such entity in Chile. For purposes of Chilean taxation, (a) an individual holder is resident in Chile if he or she has resided in Chilefor more than six months in one calendar year, or a total of more than six months in two consecutive fiscal years and (b) an individual is domiciled in Chile if heor she resides in Chile with the actual or presumptive intent of staying in Chile.
Taxation of Dividends
Cash dividends paid by us with respect to shares of our common stock held by a Foreign Holder, including shares represented by ADSs, will be subject to a35% Chilean withholding tax, which is withheld and paid over by us (the “Withholding Tax”). If we have paid corporate income tax (the “First Category Tax”)on the income from which the dividend is paid, a credit for the First Category Tax effectively reduces the rate of Withholding Tax. When a credit is available, theWithholding Tax is computed by applying the 35% rate to the pre-tax amount needed to fund the dividend and then subtracting from the tentative withholdingtax so determined the amount of First Category Tax actually paid on the pre-tax income. For purposes of determining the rate at which First Category Tax waspaid, dividends are treated as paid from our oldest retained earnings.
The effective rate of Withholding Tax to be imposed on dividends paid by us will vary depending upon the amount of First Category Tax paid by us on theearnings underlying the dividends. The effective rate for the First Category Tax attributed to earnings generated during the fiscal year 2004 and onwards is17.0%. Full applicability of the First Category Tax credit at the 17.0% rate results in an effective Withholding Tax rate of 21.7 %.
134

Table of Contents
Consequently, the Withholding Tax rate with respect to dividends fluctuates between 21.7% and 35.0%, depending on whether or not we are subject to the FirstCategory Tax.
The example below illustrates the effective Chilean Withholding Tax burden on a cash dividend received by a Foreign Holder, assuming a Withholding Taxrate of 35%, an effective First Category Tax rate of 17% and a distribution of all of the net proceeds available after payment of the First Category Tax. Taxable income US$ 100 First Category Tax (17% of US$100) (17)Net proceeds available 83 Dividend payment 83 Withholding Tax (35% of the sum of the dividend (US$83) and the available First Category Tax credit (US$17)) (35)First Category Tax credit 17 Payable Withholding Tax (18)Net dividend received 65(83-18)
Effective dividend withholding tax rate 21.7%(18/83)
Dividend distributions made in kind would be subject to the same Chilean tax rules as cash dividends. Stock dividends are not subject to Chilean taxation.
The distributions of preemptive rights relating to shares of common stock will not be subject to Chilean taxation.
If the Proposed U.S.-Chile Treaty becomes effective, it would among other things reduce the current rate of withholding on dividends paid to U.S. investorswho are eligible for the benefits of such treaty. If the Proposed U.S.-Chile Treaty becomes effective, U.S. investors should consult their tax advisers as to theapplicability of the treaty in their particular circumstances.
Taxation of Capital Gains
Gain realized on the sale, exchange or other disposition by a Foreign Holder of ADSs will not be subject to Chilean taxation, provided that such dispositionoccurs outside Chile or that it is performed under the rules of Title XXIV of the Chilean Securities Market Law, as amended by Law No. 19,601, dated January18, 1999. The deposit and withdrawal of shares of common stock in exchange for ADSs will not be subject to any Chilean taxes.
Gain recognized on a sale or exchange of shares of common stock (as distinguished from sales or exchanges of ADSs representing such shares of commonstock) by a Foreign Holder will be subject to both an income tax on capital gains, which is assessed at the same rate as the First Category Tax (currently imposedat a rate of 17%) and the Chilean withholding tax (the former being creditable against the latter) if (1) the Foreign Holder has held such shares of common stockfor less than one year since exchanging ADSs for the shares of common stock, (2) the Foreign Holder acquired and disposed of the shares of common stock inthe ordinary course of its business or as a regular trader of stock or (3) the sale is made to a company in which the Foreign Holder holds an interest. In certainother cases, gain on the di sposition of shares of common stock will be subject only to the tax on capital gains (currently imposed at a rate of 17%). The sale ofshares of common stock by a Foreign Holder to an individual or entity resident or domiciled in Chile is subject to a provisional withholding. Such a provisionalwithholding will be equal to (i) 5% of the amount, without any deduction, paid to,credited to, put at the disposal of, or corresponding to, the Foreign Holder if thetransaction is subject to the First Category Tax as sole tax, unless the gain subject to taxation can be determined, in which case the withholding is equal to 17%on the gain, or (ii) 20% of the amount, without any deduction, paid to, credited to, put at the disposal of, or corresponding to, the Foreign Holder if thetransaction is subject to the First Category Tax and the Chilean withholding tax, with a credit of the First Category Tax already paid. For income tax purposes,the capital gain shall be the difference between the sales price and the acquisit ion cost of the stock. The tax basis of shares of common stock received inexchange for ADSs will be the acquisition value of such shares. The valuation procedure set forth in the deposit agreement, which values shares of commonstock that are being exchanged at the highest price at which they trade on the Santiago Stock Exchange on the date of the exchange, generally will determine theacquisition value for this purpose. Consequently, the conversion of ADSs into shares of common stock and sale of such shares of common stock for the valueestablished under the deposit agreement will not generate a capital gain subject to taxation in Chile.
135

Table of Contents In the case where the sale of the shares is made on a day that is different than the date on which the exchange is recorded, capital gains subject to taxation in
Chile may be generated. On October 1, 1999, the Chilean Internal Revenue Service issued Ruling No. 3708 whereby it allowed Chilean issuers of ADSs toamend the deposit agreements to which they are parties in order to include a clause that states that, in the case that the exchanged shares are sold by the ADSs’holder on a Chilean Stock Exchange, either on the same day in which the exchange is recorded in the shareholders’ registry of the issuer or within the two priorbusiness days to such date, the acquisition price of such exchanged shares shall be the price registered in the invoice issued by the stock broker that participatedin the sale transa ction. Consequently, because we have included this clause in the form of ADRs attached to the deposit agreement, the capital gain that may begenerated if the shares received in exchange for ADSs were sold within two days prior to the date on which the exchange is recorded will not be subject totaxation.
The distribution and exercise of preemptive rights relating to the shares of common stock will not be subject to Chilean taxation. Cash amounts received inexchange for the shares or assignment of preemptive rights relating to the shares will be subject to both the First Category Tax and the Chilean withholding tax(the former being creditable against the latter to the extent described above).
In certain cases and provided certain requirements are met, capital gains realized on the sale of actively traded stock of Chilean public companies may beexempt from Chilean income taxes. Our stock is currently considered an actively traded stock in the Santiago Stock Exchange, and Foreign Holders of the stockmay qualify for an income tax exemption. Foreign Holders are urged to consult with their own tax advisers to determine whether an exemption applies to them.
If the Proposed U.S.-Chile Treaty becomes effective, it may further restrict the amount of Chilean tax, if any, imposed on gains derived from the sale orexchange of shares of common stock by U.S. residents eligible for the benefits of the treaty. If the Proposed U.S.-Chile Treaty becomes effective, U.S. investorsshould consult their tax advisers as to the applicability of the treaty in their particular circumstances.
Other Chilean Taxes
No Chilean inheritance, gift or succession taxes apply to the transfer or disposition of the ADSs by a Foreign Holder, but such taxes generally will apply tothe transfer at death or by gift of shares of our common stock by a Foreign Holder. No Chilean stamp, issue, registration or similar taxes or duties apply toForeign Holders of shares or ADSs.
Withholding Tax Certificates
Upon request, we will provide to foreign holders appropriate documentation evidencing the payment of Chilean withholding taxes. For further information,the investor should contact: Robert Moreno, [email protected].
Dividends payable to holders of ADSs are net of foreign currency conversion expenses of the Depositary and will be subject to the Chilean withholding taxcurrently at the rate of 35% (subject to credits in certain cases as described above).
U.S. Federal Income Tax Considerations
The following is a discussion of material U.S. federal income tax consequences of owning and disposing of shares of our common stock or ADSs to U.S.holders described below, but it does not purport to be a comprehensive description of all of the tax considerations that may be relevant to a particular person’sdecision to hold such securities. The discussion applies only if you hold shares of our common stock or ADSs as capital assets for tax purposes and it does notaddress special classes of holders, such as: · certain financial institutions; · insurance companies; · dealers and traders in securities who use a mark-to-market method of tax accounting; · persons holding shares or ADSs as part of a hedge, “straddle,” conversion transaction, or integrated transaction;
136

Table of Contents · persons whose functional currency for U.S. federal income tax purposes is not the U.S. dollar; · partnerships or other entities classified as partnerships for U.S. federal income tax purposes; · persons liable for the alternative minimum tax; · tax-exempt entities, including “individual retirement accounts” or “Roth IRAs”; · persons holding shares of our common stock or ADSs that own or are deemed to own ten percent or more of our voting stock; and · persons who acquired shares of our common stock or ADSs pursuant to the exercise of any employee stock option plan or otherwise as
compensation.
If an entity that is classified as a partnership for U.S. federal income tax purposes holds shares of our common stock or ADSs, the U.S. federal income taxtreatment of a partner will generally depend on the status of the partner and upon the activities of the partnership. Partnerships holding shares of our commonstock or ADSs and partners in such partnerships should consult their tax advisers as to the particular U.S. federal income tax consequences of holding anddisposing of the shares of our common stock or ADSs.
As used herein, a “U.S. holder” is a beneficial owner of shares of our common stock or ADSs that is for U.S. federal tax purposes: · a citizen or resident of the United States; · a corporation, or other entity taxable as a corporation, created or organized in or under the laws of the United States or any political subdivision
thereof; or · an estate or trust the income of which is subject to U.S. federal income taxation regardless of its source.
This discussion is based on the Internal Revenue Code of 1986, as amended (the “Code”), administrative pronouncements, judicial decisions and final,temporary and proposed Treasury regulations, all as of the date hereof. These laws are subject to change, possibly on a retroactive basis. It is also based in parton representations by the Depositary and assumes that each obligation under the Deposit Agreement and any related agreement will be performed in accordancewith its terms. Please consult your own tax advisers concerning the U.S. federal, state, local and foreign tax consequences of owning and disposing of shares orADSs in your particular circumstances.
In general, if you own ADSs, you will be treated as the owner of the underlying shares represented by those ADSs for U.S. federal income tax purposes.Accordingly, no gain or loss will be recognized if you exchange ADSs for the underlying shares represented by those ADSs.
The U.S. Treasury has expressed concerns that parties to whom American depositary shares are released prior to delivery of shares to the Depositary (“pre-release”) or intermediaries in the chain of ownership between U.S. holders of American depositary shares and the issuer of the security underlying the Americandepositary shares may be taking actions that are inconsistent with the claiming of foreign tax credits for holders of American depositary shares. These actionswould also be inconsistent with the claiming of the reduced rates of tax, described below, applicable to dividends received by certain non-corporate holders.Accordingly, the creditability of Chilean taxes and the availability of the reduced rates for dividends received by certain non-corporate holders, each describedbelow, could be affected by future actions that may be taken by such parties or intermediaries.
This discussion assumes that we are not, and will not become, a passive foreign investment company, as described below.
137
Table of Contents Taxation of Distributions
Distributions paid on shares of our common stock or ADSs, other than certain pro rata distributions of common shares or rights, will be treated as dividendsto the extent paid out of our current or accumulated earnings and profits (as determined under U.S. federal income tax principles). Because we do not maintaincalculations of our earnings and profits under U.S. federal income tax principles, it is expected that distributions generally will be reported to U.S. holders asdividends. Subject to applicable limitations and the discussion above regarding concerns expressed by the U.S. Treasury, under current law, certain dividendspaid by “qualified foreign corporations” to certain non-corporate U.S. holders in taxable years beginning before January 1, 2011, will be taxable at reduced rates,up to a maximum r ate of 15%. A foreign corporation is treated as a qualified foreign corporation with respect to dividends paid on stock that is readily tradableon a securities market in the United States, such as the NYSE where our ADSs are traded. You should consult your own tax advisers to determine whether thefavorable rates may apply to dividends you receive and whether you are subject to any special rules that limit your ability to be taxed at the favorable rates. Theamount of the dividend will include any amounts withheld by us or our paying agent in respect of Chilean taxes at the effective rate as described above under “— Chilean Taxation.” The amount of the dividend will be treated as foreign-source dividend income to you and will not be eligible for the dividends receiveddeduction generally allowed to U.S. corporations under the Code.
Dividends will be included in your income on the date of your (or in the case of ADSs, the Depositary’s) receipt of the dividend. The amount of anydividend income paid in Chilean pesos will be the U.S. dollar amount calculated by reference to the exchange rate in effect on the date of receipt regardless ofwhether the payment is in fact converted into U.S. dollars. If the dividend is converted into U.S. dollars on the date of receipt, you should not be required torecognize foreign currency gain or loss in respect of the dividend income. You may have foreign currency gain or loss if the dividend is converted into U.S.dollars after the date of its receipt.
Subject to applicable limitations that may vary depending upon your circumstances and the discussion above regarding concerns expressed by the U.S.Treasury, Chilean taxes withheld from cash dividends on shares of our common stock or ADSs, reduced in respect of any First Category Tax, as described aboveunder “—Chilean Taxation,” generally will be creditable against your U.S. federal income tax liability. If, however, the Proposed U.S.-Chile Treaty becomeseffective, any Chilean income taxes withheld from dividends on shares or ADSs in excess of the rate provided by the treaty will not be creditable by a U.S.holder who is eligible for the benefits of the treaty. The rules governing foreign tax credits are complex and you should consult your own tax advisers todetermine whether you are subject to any special rules that limit your ability to make effective use of foreign tax credits. Instead of claiming a credit, you may, atyour election, deduct such Chilean taxes in computing your taxable income, subject to generally applicable limitations under U.S. law.
Sale or Other Disposition of Shares or ADSs
For U.S. federal income tax purposes, gain or loss you realize on the sale or other disposition of shares of our common stock or ADSs generally will becapital gain or loss, and will be long-term capital gain or loss if you held the shares of our common stock or ADSs for more than one year. The amount of yourgain or loss will be equal to the difference between your tax basis in the shares of our common stock or ADSs disposed of and the amount realized on thedisposition in each case as determined in U.S. dollars. If a Chilean tax is withheld on the sale or disposition of the shares of our common stock or ADSs, youramount realized will include the gross amount of the proceeds of such sale or disposition before deduction of the Chilean tax. See “—Chilean Taxation—Taxation of Capital Gains” for a description of when a disposition may be subject to taxation by Chile. Such gain or loss generally will be U.S.-source gain or loss forforeign tax credit purposes. If the Proposed U.S.-Chile Treaty becomes effective, however, a U.S. holder who is eligible for the benefits of the treaty may electto treat disposition gain that is subject to Chilean tax as foreign source gain and claim a credit in respect of the tax. You should consult your tax advisers as towhether the Chilean tax on gains may be creditable against your U.S. federal income tax on foreign-source income from other sources.
Passive Foreign Investment Company Rules
Based on proposed Treasury regulations (“Proposed Regulations”), which are proposed to be effective for taxable years beginning after December 31, 1994,we believe that we were not a “Passive Foreign Investment Company” (“PFIC”) for U.S. federal income tax purposes for the year ended December 31,2009. However, since
138
Table of Contents
the Proposed Regulations may not be finalized in their current form and since PFIC status depends upon the composition of a company’s income and assets andthe market value of its assets (including, among others, less than 25 percent owned equity investments) from time to time, there can be no assurance that we willnot be a PFIC for any taxable year. If we were a PFIC for any taxable year during which you held an ADS or a share, certain adverse tax consequences couldapply to you.
If we were a PFIC for any taxable year during which you held shares of our common stock or ADSs, gain recognized by you on a sale or other disposition(including certain pledges) of a share of our common stock or an ADS would generally be allocated ratably over your holding period for the share of ourcommon stock or ADS. The amounts allocated to the taxable year of the sale or other disposition and to any year before we became a PFIC would be taxed asordinary income. The amount allocated to each other taxable year would be subject to tax at the highest rate in effect for individuals or corporations, asappropriate, for that taxable year, and an interest charge would be imposed on the amount allocated to that taxable year. Similar rules would apply to anydistribution in respect of shares of our common stock or ADSs t hat exceeds 125% of the average of the annual distributions on shares of our common stock orADSs received by you during the preceding three years or your holding period, whichever is shorter. Certain elections (including a mark-to-market election) maybe available that would result in alternative treatments of the shares of our common stock or ADSs. In addition, if we were a PFIC in a taxable year in which wepay a dividend or the prior taxable year, the 15% dividend rate discussed above with respect to dividends paid to non-corporate shareholders would not apply. Information Reporting and Backup Withholding
Payment of dividends and sales proceeds that are made within the United States or through certain U.S.-related financial intermediaries generally are subjectto information reporting and may be subject to backup withholding unless (i) you are a corporation or other exempt recipient or (ii), in the case of backupwithholding, you provide a correct taxpayer identification number and certify that you are not subject to backup withholding.
The amount of any backup withholding from a payment to you will be allowed as a credit against your U.S. federal income tax liability and may entitle youto a refund, provided that the required information is timely furnished to the Internal Revenue Service.
F. Dividends and Paying Agents
Not applicable. G. Statement by Experts
Not applicable. H. Documents on Display
The documents concerning Santander-Chile which are referred to in this Annual Report may be inspected at our offices at Bandera 140 Santiago, Chile. Weare, and Santiago and Old Santander-Chile were, subject to the information reporting requirements of the Exchange Act, except that, as a foreign issuer, we arenot subject to the proxy rules or the short-swing profit and disclosure rules of the Exchange Act. In accordance with these statutory requirements, we file orfurnish reports and other information with the SEC. Reports and other information filed or furnished by us with the SEC may be inspected and copied at thepublic reference facilities maintained by the SEC at Room 1024, 450 Fifth Street, N.W., Washington, D.C. 20549 and at the SEC’s Regional Office atNorthwestern Atrium Center, 500 West Madison Street , Suite 1400, Chicago, Illinois 60611-2511. Copies of such material may be obtained by mail from thePublic Reference Section of the SEC, 450 Fifth Street, N.W., Washington, D.C. 20549, at prescribed rates. You may obtain information on the operation of thePublic Reference Section by calling the SEC at 1-800-732-0330. The SEC maintains a website on the Internet at http://www.sec.gov that contains reports andinformation statements and other information regarding us. The reports and information statements and other information about us can be downloaded from theSEC’s website and can also be inspected and copied at the offices of the NYSE, Inc., 20 Broad Street, New York, New York 10005.
139

Table of Contents I. Subsidiary Information
Not applicable. ITEM 11. QUANTITATIVE AND QUALITATIVE DISCLOSURES ABOUT MARKET RISK Introduction
This section describes the market risks that we are exposed to, the tools and methodology used to control these risks, the portfolios over which these marketrisk methods were applied and quantitative disclosure that demonstrate the level of exposure to market risk that we are assuming. This section also discloses thederivative instruments that we use to hedge exposures and offer to our clients.
The principal types of risk inherent in Santander-Chile’s business are market, liquidity, operational and credit risks. The effectiveness with which we are ableto manage the balance between risk and reward is a significant factor in our ability to generate long term, stable earnings growth. Toward that end, our seniormanagement places great emphasis on risk management. Market Risk
Market risk is the risk of losses due to unexpected changes in interest rates, foreign exchange rates, inflation rates and other rates or prices. We are exposedto market risk mainly as a result of the following activities:
· trading in financial instruments, which exposes us to interest rate and foreign exchange rate risk;
· engaging in banking activities, which subjects us to interest rate risk, since a change in interest rates affected gross interest income, gross interestexpense and customer behavior;
· engaging in banking activities, which exposes us to inflation rate risk, since a change in expected inflation affects gross interest income, gross interest
expense and customer behavior;
· trading in the local equity market, which subjects us to potential losses caused by fluctuations of the stock market; and
· investing in assets whose returns or accounts are denominated in currencies other than the Chilean peso, which subjects us to foreign exchange riskbetween the Chilean peso and such other currencies.
Market Risk Exposure Categories
Our policy with respect to asset and liability management is to capitalize on our competitive advantages in treasury operations, maximizing our net interestincome and return on assets and equity with a view to interest rate, liquidity and foreign exchange risks, while remaining within the limits provided by Chileanbanking regulations. Subject to these constraints, we constantly have mismatched positions with respect to interest rates, inflation-linked assets and liabilities andforeign currencies.
Our asset and liability management policies are developed by the Asset and Liability Committee (the “ALCO”) following guidelines and limits establishedby our Board of Directors, Banco Santander Spain’s Global Risk Department and our Market Risk and Control Department. The ALCO is composed of theChairman of the Board, four additional members of the Board, the Chief Executive Officer, the Manager of the Financial Management Division, the Manager ofMarket Risk, the Manager of the Treasury Division, the Financial Controller and other senior members of management. Senior members of Santander Chile’sFinance Division meet monthly on a formal basis with the ALCO and outside consultants. Following guidelines set by Santander Spain, the ALCO is responsiblefor developing financial strategies and polic ies regarding our asset and liability structure together with our Financial Management Division. The aim of theFinancial Management Division is to inject stability and recurrence into the net interest income of commercial activities and to ensure that we comply withinternal and regulatory limits regarding liquidity, regulatory capital, reserve requirements and market risk. Our Market Risk and Control Department carries outthe day-to-day measurements of the risks taken by the ALCO.
140

Table of Contents The Market Committee is responsible for establishing our policies, strategies, procedures and limits with respect to our trading portfolio in line with the
policies of Santander Spain. The composition of the Market Committee includes the Chairman of the Board, three additional members of the Board, the ChiefExecutive Officer, the Manager of Global Banking and Markets, the Manager of the Treasury Division, the Manager of Proprietary Trading, the Manager of theFinancial Management Division, the Manager of Market Risk, the Financial Controller and other senior members of management. Impact of Inflation
Our assets and liabilities are denominated in Chilean pesos, Unidades de Fomento (UF) and foreign currencies. The Bank no longer performs inflationaccounting and has eliminated price level restatement in line with IFRS, but inflation impacts our results of operations as some loan and deposit products arecontracted in UF. The UF is revalued in monthly cycles. Each day in the period beginning on the tenth day of the current month through the ninth day of thesucceeding month, the nominal peso value of the UF is indexed up (or down in the event of deflation) in order to reflect a proportionate amount of the change inthe Chilean Consumer Price Index during the prior calendar month. One UF equaled Ch$21,452.57 at December 31, 2008 and Ch$20,942.88 at December 31,2009. High levels of inflation in Chile could a dversely affect the Chilean economy and have an adverse effect on our business, financial condition and results ofoperations. Negative inflation rates also negatively impact our results. In 2009, CPI deflation reached 1.6% compared to a rise of 7.1% and 7.8% in 2008 and2007, respectively. There can be no assurance that Chilean inflation will not change significantly from the current level. Although we currently benefit frommoderate levels of inflation, due to the current structure of our assets and liabilities (i.e., a significant portion of our loans are indexed to the inflation rate, butthere are no corresponding features in deposits or other funding sources that would increase the size of our funding base), there can be no assurance that ourbusiness, financial condition and result of operations in the future will not be adversely affected by changing levels of inflation. In summary:
· UF-denominated assets and liabilities. In 2009, UF inflation was -2.4% compared to +9.3% in 2008. The effect of any changes in the nominal pesovalue of our UF-denominated interest earning assets and interest bearing liabilities is reflected in our results of operations as an increase (or decrease, inthe event of deflation) in interest income and expense, respectively. Our net interest income will be positively affected by an inflationary environment tothe extent that our average UF-denominated interest earning assets exceed our average UF-denominated interest bearing liabilities. Our net interestincome will be negatively affected in a deflationary environment if our average UF-denominated interest earning assets exceed our average UF-denominated interest bearing liabilities. Our net interest income will be negatively affected by inflation in any period in which our average UF-denominated interest bearing liabilities exceed our average UF-denominated interest earning assets. Our average UF-denominated interest earning assetsexceeded our average UF-denominated interest bearing liabilities by Ch$2,689,614 million in 2009 compared to Ch$2,439,563 million in 2008. See“Selected Statistical Information at and for the Years Ended December 31, 2009 and 2008―Average Balance Sheets, Income Earned from Interest-Earning Assets And Interest Paid on Interest Bearing Liabilities.” In general, the Bank has more UF-denominated financial assets than UF-denominatedfinancial liabilities. In the year ended December 31, 2009, the interest gained on interest earning assets denominated in UF decreased 77.3% comparedto 2008 as a result of the deflation rates in 2009 compared to 2008. The interest paid on these liabilities decreased by 90.3% during this period.
· Inflation and interest rate hedge. A key component of our asset and liability policy is the management of interest rate risk. The Bank’s assets generally
have a longer maturity than our liabilities. As the Bank’s mortgage portfolio grows, the maturity gap tends to rise as these loans, which are contracted inUF, have a longer maturity than the average maturity of our funding base. As most of our long term financial instruments and mortgage loans arecontracted in UF and most of our deposits are in nominal pesos, the rise in mortgage lending increases the Bank’s exposure to inflation and to interestrate risk. The size of this gap is limited by internal and regulatory guidelines in order to avoid excessive potential losses due to strong shifts in interestrates. In order to keep this duration gap below regulatory limits the Bank issues long term bonds denominated in UF or interest rate swaps. The financialcost of the bonds and the efficient part of these hedges is recorded as net interest income. In 2009, the gain from the swaps taken in order to hedgemainly for inflation and interest rate risk totaled Ch$24,988 million compared to a financial cost of Ch$53,956 million in 2008. The gain in 2009compared to a negative result in 2008 was a direct result of the deflation rate in 2009.
141

Table of Contents As of December 31, % Change
Inflation sensitive income 2009 2008 2009/2008 (In million of Chilean pesos) Interest gained on UF assets(1) 224,614 990,430 (77.3%)Interest paid on UF liabilities(1) (67,559) (694,758) (90.3%)Hedging results 24,988 (53,956) (146.3%)Net gain 182,043 241,716 (24.7%)
(1) Excludes results from hedging
· Peso-denominated assets and liabilities. Interest rates prevailing in Chile during any period primarily reflect the inflation rate during the period and theexpectations of future inflation. The sensitivity of our peso-denominated interest earning assets and interest bearing liabilities to changes to suchprevailing rates varies. (See “Item 5: C. Operating Results—Interest Rates”). We maintain a substantial amount of non interest bearing peso-denominated demand deposits. Because such deposits are not sensitive to inflation, any decline in the rate of inflation would adversely affect our netinterest margin on inflation indexed assets funded with such deposits, and any increase in the rate of inflation would increase the net interest margin onsuch assets. The ratio of the avera ge of such demand deposits to average interest-earning assets was 15.66% and 15.12% for the years ended December31, 2008 and 2009, respectively.
Interest Rate Sensitivity
Interest rates earned and paid on our assets and liabilities reflect, to a certain degree, inflation, expectations regarding inflation, changes in short term interestrates set by the Central Bank and movements in long term real rates. The Central Bank manages short term interest rates based on its objectives of balancing lowinflation and economic growth. Because our liabilities generally reprice sooner than our assets, changes in the rate of inflation or short term rates in the economyare reflected in the rates of interest paid by us on our liabilities before such changes are reflected in the rates of interest earned by us on our assets. Therefore,when short term interest rates fall, our net interest margin is positively impacted, but when short term rates increase, our interest margin is negatively affected.Our n et interest margin also tends to be adversely affected in the short term by a decrease in inflation rates since generally our UF-denominated assets exceedour UF-denominated liabilities. An increase in long term rates has a positive effect on our net interest margin, because our interest earning assets generally havelonger terms than our interest bearing liabilities. In addition, because our peso-denominated liabilities have relatively short repricing periods, they are generallymore responsive to changes in inflation or short term rates than our UF-denominated liabilities. As a result, during periods when current inflation or expectedinflation exceeds the previous period’s inflation, customers often switch funds from UF-denominated deposits to peso-denominated deposits, which generallybear higher interest rates, thereby adversely affecting our net interest margin.
142

Table of Contents As of December 31, 2009, the breakdown of maturities of assets and liabilities is as follows:
As of December 31, Up to 30 days 31-60 days 61-90 days 91-180 days 181-365 days 1-3 years Over 3 years Total (in millions of Ch$) Interest-earning assets: Interbank loans 23,412 - - - - - - 23,412 Investments under resale agreements 14,020 - - - - - - 14,020 Financial investments 136,665 85,399 37,199 189,423 816,362 404,743 958,838 2,628,629 Commercial loans 1,005,151 376,918 395,649 791,896 757,175 1,688,107 2,309,866 7,324,762 Mortgage loans 107,294 15,720 16,871 48,454 99,288 404,839 3,466,587 4,159,053 Consumer loans 834,145 41,634 50,630 120,641 215,946 626,226 354,827 2,244,049 Total Interest-earning assets 2,120,687 519,671 500,349 1,150,414 1,888,771 3,123,915 7,090,118 16,393,925 Interest-bearing liabilities: Deposits 5,971,783 915,675 834,731 840,175 1,105,446 1,036,470 4,511 10,708,791 Investments under agreements torepurchase 191,118 104,677 212,510 606,091 209 - - 1,114,605 Interbank borrowings 72,786 144,838 205,808 607,865 809,150 206,343 - 2,046,790 Issued debt instruments 21,758 1,169 167,843 8,632 17,423 843,196 1,864,655 2,924,676 Other financial liabilities 33,606 390 214 1,379 2,309 8,098 100,915 146,911 Total interest-bearing liabilities 6,291,051 1,166,749 1,421,106 2,064,142 1,934,537 2,094,107 1,970,081 16,941,773 Asset/liability gap (4,170,364) (647,078) (920,757) (913,728) (45,766) 1,029,808 5,120,037 (547,848)
Cumulative gap (4,170,364) (4,817,442) (5,738,199) (6,651,927) (6,697,693) (5,667,885) (547,848)
Foreign Exchange Fluctuations
The Chilean government’s economic policies and any future changes in the value of the Chilean peso against the U.S. dollar could adversely affect ourfinancial condition and results of operations. The Chilean peso has been subject to significant devaluation in the past and may be subject to significantfluctuations in the future. In 2009, the Chilean peso in relation to the U.S. dollar appreciated 19.5% compared to a 26.9% depreciation in 2008. (See “Item 3: A.Selected Financial Data—Exchange Rates”). A significant portion of our assets and liabilities are denominated in foreign currencies, principally the U.S. dollar,and we historically have maintained and may continue to maintain material gaps between the balances of such assets and liabilities. Because such assets andliabilities, as well a s interest earned or paid on such assets and liabilities, and gains and losses realized upon the sale of such assets, are translated to Chileanpesos in preparing our financial statements, our reported income is affected by changes in the value of the Chilean peso relative to foreign currencies (principallythe U.S. dollar). The translation gain or loss over assets and liabilities (including derivatives defined as for hedging purposes) is included as foreign exchangetransactions in the income statement. The translation and mark–to–market of foreign currency derivatives held for trading is recognized as a gain or loss in thenet results from mark–to–market and trading.
The composition of our assets, liabilities and equity at December 31, 2009, by currency are as follows:
143

Table of Contents
As of December 31, 2009
Ch$ UF Foreign
Currency Total Percentage (in millons of Ch$, except for percentages) Assets Cash and deposits in banks 1,353,731 - 689,727 2,043,458 9.8%Other assets: Less than one year 4,701,888 1,516,655 693,788 6,912,331 33.3%From one to three years 2,149,050 1,282,589 41,426 3,473,065 16.7%More than three years 2,201,005 5,542,574 126,962 7,870,541 37.9%Property, plant and equipment and other 590,396 1,724 230,887 823,007 4.0%Allowance for loan losses (349,527) - - (349,527) (1.7)% Total 10,646,543 8,343,542 1,782,790 20,772,875 100.0% Percentage of total assets 51.3% 40.1% 8.6% 100.0% Liabilities and sholder´s equity Non interest bearing deposits 2,890,689 295,781 347,064 3,533,534 17.0%Other liabilities: Less than one year 4,872,588 2,169,639 2,952,395 9,994,622 48.1%From one to three years 552,998 1,010,921 876,981 2,440,900 11.7%More than three years 699,019 1,898,078 - 2,597,097 12.5%Allowance, taxes and others 365,113 18,279 133,427 516,819 2.5%Shareholders' equity 1,258,346 - - 1,258,346 6.1%2009 net income 431,557 - - 431,557 2.1% Total 11,070,310 5,392,698 4,309,867 20,772,875 100.0% Percentage of Liabilities and Shareholders’ equity 53.3% 26.0% 20.7% 100.0%
Liquidity risk management
The Financial Management Division receives information from all the business units on the liquidity profile of their financial assets and liabilities, as well asbreakdowns of other projected cash flows stemming from future businesses. On the basis of that information, Financial Management maintains a portfolio ofliquid short–term assets, comprised mainly of liquid investments, loans and advances to other banks, to make sure the Bank has sufficient liquidity. The businessunits’ liquidity needs are met through short–term transfers from Financial Management to cover any short–term fluctuations and long–term financing to addressall the structural liquidity requirements.
The Bank monitors its liquidity position every day, determining the future flows of its outlays and revenues. In addition, stress tests are performed at theclose of each month, for which a variety of scenarios encompassing both normal market conditions and conditions of market fluctuation are used. The liquiditypolicy and procedures are subject to review and approval by the Bank’s Board. Periodic reports are generated by the Market Risk Department, providing abreakdown of the liquidity position of the Bank and its subsidiaries, including any exceptions and the corrective measures adopted, which are regularly submittedto the ALCO for review.
144

Table of Contents The Bank relies on customer (retail) and institutional deposits, obligations to banks, debt instruments, and time deposits as its main sources of funding.
Although most obligations to banks, debt instruments and time deposits mature in over a year, customer (retail) and institutional deposits tend to have shortermaturities and a large proportion of them are payable within 90 days. The short–term nature of these deposits increases the Bank’s liquidity risk, and hence, theBank actively manages this risk by continual supervision of the market trends and price management.
The Bank must comply with regulatory limits imposed by the SBIF and the Central Bank that are the following:
· The sum of the liabilities with a maturity of less than 30 days may not exceed the sum of the assets with a maturity of less than 30 days by more than anamount greater than our capital. This limit must be calculated in local currency and foreign currencies together as one gap. At December 31, 2009 thepercentage of (x) our liabilities with a maturity of less than 30 days in excess of our assets with a maturity of less than 30 days to (ii) our capital andreserves was 20%.
· The sum of the liabilities in foreign currency with a maturity of less than 30 days may not exceed the sum of the assets in foreign currency with a
maturity of less than 30 days by more than an amount greater than our capital. At December 31, 2009 the percentage of (x) our liabilities with a maturityof less than 30 days in foreign currency in excess of our assets in foreign currency with a maturity of less than 30 days to (ii) our capital and reserveswas 6%.
· The sum of the liabilities with a maturity of less than 90 days may not exceed the sum of the assets with a maturity of less than 90 days by more than 2
times our capital. This limit must be calculated in local currency and foreign currencies together as one gap. At December 31, 2009 the percentage of(x) our liabilities with a maturity of less than 90 days in excess of our assets with a maturity of less than 90 days to (ii) our capital and reserves was64%.
Market risk management
The Bank’s internal management of market risk is based chiefly on the procedures and standards of Santander Spain, which are in turn based on analysis ofmanagement in three principal components:
· trading portfolio;
· local financial management portfolio;
· foreign financial management portfolio.
The trading portfolio is comprised chiefly of investments valued at fair market value and free of any restriction on their immediate sale, which are oftenbought and sold by the Bank with the intention of selling them in the short term to benefit from short–term price fluctuations. The financial managementportfolios include all the financial investments not considered to be part of trading portfolio.
The ALCO has the overall responsibility for market risk. The Bank’s risk/finance department is responsible for formulating detailed management policiesand applying them in the Bank’s operations, in conformity with the guidelines adopted by the ALCO and the Banco Santander de España Global RiskDepartment.
The department’s functions in related to trading portfolio imply the following:(i) apply the “Value at Risk” (VaR) techniques to measure the interest rate risk,(ii) adjust the trading portfolios to the market and measure the daily profit and loss from the commercial activities, (iii) compare the real VaR with the establishedlimits, (iv) establish procedures to prevent losses in excess of predetermined limits and (v) furnish information on the trading activities to the ALCO, othermembers of the Bank’s management and the Santander – Spain Global Risk Department.
145

Table of Contents The department’s functions in relation to the financial management portfolios imply the following: (i) perform sensitivity simulations (as is explained below)
to measure interest rate risk for the activities in local currency and the potential loss forecast by these simulations and (ii) provide daily reports thereon to theALCO, other members of the Bank’s management, and the Santander – Spain Global Risk Department. Market risk – management of trading portfolio
The Bank applies VaR methodologies to measure the market risk of its trading portfolio. The Bank has a consolidated commercial position comprised offixed–income investments, foreign currency trading, and a minimal position in stock investments. This portfolio is comprised mostly of Central Bank of Chilebonds, mortgage bonds and locally issued, low–risk corporate bonds. At the end of the year, the trading portfolio included no stock portfolio investments.
For the Bank, the VaR estimate is made under the historical simulation methodology, which consists of observing the behavior of the profits and losses thatwould have occurred in the current portfolio if the market conditions for a given historical period had been in force, in order to infer the maximum loss on thebasis of that information, with as given degree of confidence. The methodology has the advantage of precisely reflecting the historical distribution of the marketvariables and not requiring any assumptions regarding the distribution of specific probabilities. All the VaR measures are intended to determine the distributionfunction for a change in the value of a given portfolio, and once that distribution is known, to calculate the percentile related to the necessary degree ofconfidence, which will be equal to the value at risk by virtue of those parameters. As calculated by the Bank, the VaR is an estimate of the maximum expectedloss of market value for a given portfolio over a 1–day horizon, with a 99.00% confidence level. It is the maximum 1–day loss that the Bank could expect toexperience in a given portfolio, with a 99.00% confidence level. In other words, it is the loss that the Bank would expect to experience only 1.0% of the time.The VaR provides a single estimate of market risk which is not comparable from one market risk to another. Returns are calculated through the use of a 2–yeartime window or at least 520 data points obtained since the last reference date for calculation of the VaR going backward in time.
The Bank uses the VaR estimates to provide a warning when the statistically expected losses in its trading portfolio would exceed prudent levels, and hence,there are certain predetermined limits. Limitations of the VaR model
When applying a calculation methodology, no assumptions are made regarding the probability distribution of the changes in the risk factors; the historicallyobserved changes are used for the risk factors on which each position in the portfolio will be valued.
It is necessary to define a valuation function fj(xi) for each instrument j, preferably the same one used to calculate the market value and income of the dailyposition. This valuation function will be applied in each scenario to generate simulated prices for all the instruments in each scenario.
In addition, the VaR methodology is subject to the following limitations:
· Changes in market rates and prices may not be independent and identically distributed random variables, and may not have a normal distribution; Inparticular, the assumption of normal distribution may underestimate the probability of extreme market movements;
· The historical data used by the Bank may not provide the best estimate of the joint distribution of changes in the risk factors in the future, and any
modification of the data may be inadequate; In particular, the use of historical data may fail to capture the risk of potential extreme and adverse marketfluctuations, regardless of the time period used;
· A 1–day time horizon may not fully capture the market risk positions which cannot be liquidated or covered in a single day; It would not be possible to
liquidate or cover all the positions in a single day;
· The VaR is calculated at the close of business, but trading positions may change substantially in the course of the trading day;
146
Table of Contents
· The use of a 99% degree of confidence does not take account of, or make any statement about, the losses that could occur outside of that degree ofconfidence; and
· A model such as the VaR does not capture all the complex effects of the risk factors over the value of the positions or portfolios, and accordingly, it
could underestimate potential losses.
At no time in 2009 and 2008 did the Bank exceed the VaR limits in regard to the 3 components which comprise the trading portfolio: fixed–incomeinvestments, variable–income investments and foreign currency investments. The high, low, and average levels for each component and each year were asfollows:
Consolidated 2009 2008 (in millions of $US) VaR: High 9.79 11.6 Low 4.24 3.7 Average 5.98 6.6 Fixed–income investments: High 9.14 9.5 Low 4.22 3.3 Average 5.87 6 Variable–income investments: High 1.65 1.4 Low 0.04 0.2 Average 0.17 0.5 Foreign currency investments High 7.02 4.0 Low 0.66 0.6 Average 2.31 2.5
Market risk – local and foreign financial management
The Bank’s financial management portfolio includes most of the Bank’s non–trading assets and liabilities, including the credit/loan portfolio. For theseportfolios, investment and financing decisions are strongly influenced by the Bank’s commercial strategies.
The Bank uses a sensitivity analysis to measure the market risk of local and foreign currency (not included in the trading portfolio). The Bank performs asimulation of scenarios, which will be calculated as the difference between the present value of the flows in the chosen scenario (a curve with a parallelmovement of 100 bp in all its segments) and their value in the base scenario (current market). All the inflation–indexed local currency (UF) positions areadjusted by a sensitivity factor of 0.57, which represents a 57 basis point change in the rate curve for the real rates and a 100 basis point change for the nominalrates. The same scenario is performed for the net foreign currency positions and the interest rates in US dollars. The Bank has also established limits in regard tothe maximum loss which these interest rate movements could impose on the capital and net financial income budgeted for the year. Limitations of the sensitivity models
The most important assumption is the use of a 100 basis point change in the yield curve (57 basis points for the real rates). The Bank uses a 100 basis pointchange because sudden changes of that magnitude are considered realistic. The Santander Spain Global Risk Department has established comparable limits bycountry, to be able to compare, monitor and consolidate the market risk by country in a realistic and orderly way. In addition, the sensitivity simulationmethodology should be interpreted with consideration for the following limitations:
147

Table of Contents
· The simulation of scenarios assumes that the volumes remain in the Bank’s Consolidated General Balance Sheet and are always renewed at maturity,thereby omitting the fact that certain credit risk and prepayment considerations may affect the maturity of certain positions.
· This model assumes an identical change along the entire length of the yield curve and takes no account of the different movements for different
maturities.
· The model takes no account of the sensitivity of volumes which results from interest rate changes.
· The limits to losses of budgeted financial income are calculated on the basis of the financial income foreseen for the year, which may not be actuallyearned, meaning that the real percentage of financial income at risk may be higher than the expected one.
Market Risk – Financial management portfolio – December 31, 2009 and 2008 2009 2008
Effect on net
interest income Effect on equity Effect on net
interest income Effect on equity Financial management portfolio – local currency (in millions of $Ch$) Loss limit 37,264 127,000 24,000 86,400 High 17,711 123,834 16,720 85,837 Low 1,504 95,791 3,138 60,251 Average 6,404 107,239 10,807 72,622 Financial management portfolio – foreign currency (in millions of $US) Loss limit 46.0 74.0 36.0 54.0 High 18.4 17.3 31.2 9.4 Low 1.2 1.5 1.8 0.2 Average 6.9 11.4 15.1 4.2 Financial management portfolio – consolidated (in millions of $Ch$) Loss limit 37,264 127,000 24,000 86,400 High 17,724 123,836 16,720 86,051 Low 1,939 96,280 3,138 60,252 Average 8,188 107,495 10,707 72,683
Market risk –Regulatory method
The following table illustrates our market risk exposure according to the Chilean regulatory method, as of December 31, 2009. This report is sent to theSuperintendency of Banks on a quarterly basis. Our maximum exposure to long-term interest rate fluctuations is set at 35% of regulatory capital and is approvedby the board of directors.
148

Table of Contents
Regulatory Market Risk As of December
31, 2009 (Ch$ million) Market risk of trading portfolio (EMR) Interest rate risk of trading portfolio 58,925 Foreign currency risk of trading portfolio 1,483 Risk from interest rate options 47,151 Risk from foreign currency options 48 Total market risk of trading portfolio 107,607 10% x Risk-weighted assets 1,409,874 Subtotal 1,517,481 Limit = Regulatory Capital 2,177,899 Available margin 660,418 Non-trading portfolio market risk Short-term interest rate risk 45,696 Inflation risk 27,157 Long-term interest rate risk 337,549 Total market risk of non-trading portfolio 410,402 Regulatory limit of exposure to short-term interest rate and inflation risk Short-term exposure to interest rate risk 45,696 Exposure to inflation risk 27,157 Limit: 20% of (net interest income + net fee income sensitive to interest rates) 170,449 Available margin 97,596 Regulatory limit of exposure to long-term interest rate risk Long-term exposure to interest rate risk 337,549 35% of regulatory capital 762,265 Available margin 424,716
Volume Limits
We have also developed volume limits, which place a cap on the actual size of the different portfolios being monitored.
Fixed Income: Volume Equivalent. This system is considered to be an additional limit to the size of our consolidated fixed income trading portfolio. Thismeasure seeks to conform the different instruments in our fixed income trading portfolio and convert the portfolio into a single instrument with a duration of oneyear. Santander-Chile limits the size of this volume equivalent portfolio. The equivalent volume is calculated by the Market Risk and Control Department andlimits are set by the ALCO with respect to the size of the volume equivalent portfolio.
Net Foreign Currency Trading Position: Maximum Net Position. We also set an absolute limit on the size of Santander-Chile’s consolidated net foreigncurrency trading position. At December 31, 2009, this was equal to US$200 million. The limit on the size of the net foreign currency position is determined bythe ALCO and is calculated and monitored by the Market Risk and Control Department.
149

Table of Contents Derivative activities
At December 31, 2008 and 2009, derivatives are valued at market price on the balance sheet and the net unrealized gain (loss) on derivatives is classified asa separate line item on the income statement. In prior periods, the notional amounts were carried off the balance sheet. Banks must mark to market derivatives. Aderivative financial instrument held for trading purposes must be marked to market and the unrealized gain or loss recognized in the income statement. TheSuperintendency of Banks recognizes three kinds of hedge accounting: (i) cash flow hedges, (ii) fair value hedges and (iii) hedging of foreign investments.
· When a cash flow hedge exists, the fair value movements on the part of the hedging instrument that is effective are recognized in equity. Any ineffectiveportion of the fair value movement on the hedging instrument is recognized in the income statement.
· When a fair value hedge exists, the fair value movements on the hedging instrument and the corresponding fair value movements on the hedged item are
recognized in the income statement. Hedged items in the balance sheet are presented at their market value since 2006.
· When a hedge of foreign investment exposure exists (i.e. investment in a foreign branch), the fair value movements on the part of the hedginginstrument that is effective are recognized in equity. Any ineffective portion of the fair value movement on the hedging instrument is recognized in theincome statement.
We classify some of our derivative financial instruments as being held for trading, due to the guidelines from the Superintendency of Banks. However,
substantially all of our derivatives are not actually used for speculative purposes or trading. We use derivatives to hedge our exposure to foreign exchange,interest rate and inflation risks. We had the following derivative financial instruments portfolio as of December 31, 2009 and December 31, 2008:
150

Table of Contents As of December 31, 2009 Notional amounts Fair Value
Within 3 months
After 3 monthsbut within one
year After one year Assets Liabilities (Ch$ million)
Fair value hedge derivative instruments Currency forwards – – – – – Interest rate swaps – 86,963 580,132 2,446 3,794 Cross currency swaps – 26,079 583,035 16,972 805 Call currency options – – – – – Call interest rate options – – – – – Put currency options – – – – – Put interest rate options – – – – – Interest rate future – – – – – Other Derivatives – – – – – Subtotal – 113,042 1,163,167 19,418 4,599 Cash Flow hedge derivative instruments Currency forwards – – – – – Interest rate swaps – – – – – Cross currency swaps 51,993 582,830 73,551 4,741 52,301 Call currency options – – – – – Call interest rate options – – – – – Put currency options – – – – – Put interest rate options – – – – – Interest rate future – – – – – Other Derivatives – – – – – Subtotal 51,993 582,830 73,551 4,741 52,301 Derivative instruments for trading Currency forwards 6,533,147 4,195,874 587,541 199,665 184,112 Interest rate swaps 2,418,161 4,240,574 9,618,573 243,965 330,975 Cross currency swaps 887,942 1,594,972 9,880,693 922,498 772,959 Call currency options 34,341 22,107 – 203 43 Call interest rate options 122 5,189 39,900 281 595 Put currency options 33,198 15,487 – 3,083 3,232 Put interest rate options – – – – – Interest rate future – – – – – Other Derivatives 29,320 – – 24 90 Subtotal 9,936,231 10,074,203 20,126,707 1,369,719 1,292,006 Total 9,988,224 10,770,075 21,363,425 1,393,878 1,348,906
151

Table of Contents As of December 31, 2008 Notional amounts Fair Value
Within 3 months
After 3 monthsbut within one
year After one year Assets Liabilities (Ch$ million)
Fair value hedge derivative instruments Currency forwards – – – – – Interest rate swaps – – 45,849 1,234 1,332 Cross currency swaps – – 359,100 106,335 – Call currency options – – – – – Call interest rate options – – – – – Put currency options – – – – – Put interest rate options – – – – – Interest rate future – – – – – Other Derivatives – – – – – Subtotal – – 404,949 107,569 1,332 Cash Flow hedge derivative instruments Currency forwards – – – – – Interest rate swaps – – – – – Cross currency swaps 51,300 573,598 128,250 73,036 151 Call currency options – – – – – Call interest rate options – – – – – Put currency options – – – – – Put interest rate options – – – – – Interest rate future – – – – – Other Derivatives – – – – – Subtotal 51,300 573,598 128,250 73,036 151 Derivative instruments for trading Currency forwards 5,643,973 2,983,543 438,347 600,199 302,479 Interest rate swaps 3,865,373 4,635,536 9,922,492 239,867 362,813 Cross currency swaps 619,041 1,634,073 9,281,020 803,199 780,614 Call currency options 225,936 157,871 1,347 21,901 18,126 Call interest rate options – 128,250 – – 45 Put currency options 195,792 138,795 1,347 657 4,164 Put interest rate options – 64,125 – – – Interest rate future – – – – – Other Derivatives 15,016 – – 81 – Subtotal 10,565,131 9,742,193 19,644,553 1,665,904 1,468,241 Total 10,616,431 10,315,791 20,177,752 1,846,509 1,469,724
152

Table of Contents Other Subsidiaries
For VaR measurements and scenario simulations, our consolidated trading and consolidated non-trading portfolios do not consolidate the asset liabilitystructure of the following subsidiaries:
· Santander S.A. Corredores de Bolsa
· Santander Asset Management S.A. Administradora General de Fondos
· Santander S.A. Sociedad Securitizadora
· Santander Corredores de Seguros Ltda.
· Santander Servicios de Recaudación y Pagos Ltda.
The balance sheets of these subsidiaries are mainly comprised of non sensitive assets and liabilities, fixed assets and capital and in total only represent 1.6%of our total consolidated assets.
ITEM 12. DESCRIPTION OF SECURITIES OTHER THAN EQUITY SECURITIES A. Debt Securities
Not applicable. B. Warrants and Right
Not applicable. C. Other Securities
Not applicable. D. American Depositary Shares
Our Depositary is JPMorgan Chase Bank, N.A., with its principal executive office located at 270 Park Avenue, New York, NY 10017-2070.
Each ADS represents the right to receive 1,039 shares of Common Stock without par value.
153

Table of Contents
· Fees charged to investors as outlined in the deposit agreement are the following:
Category of Service Depositary Actions Associated Fee
(a) Deposit or substituting theunderlying shares
Each person to whom ADSs are issued against deposits of shares, includingdeposits in respect of share distributions, rights and other distributions. 1Each person surrendering ADRs for the withdrawal of deposited securities.
$5.00 for each 100 ADSs (or portionthereof) delivered or surrendered.
(b) Receiving or distributingdividends
Distribution of dividends. $0.01 per ADS.
(c) Selling or Exercising Rights Distribution or sale of securities, the fee being in an amount equal to the fee forthe execution and delivery of ADSs which would have been charged as a resultof the deposit of such securities.
$5.00 for each 100 ADSs (or portionthereof).
(d) Withdrawing an underlyingsecurity
Acceptance of ADRs surrendered for withdrawal ofdeposited securities.
$5.00 for each 100 ADSs (or portionthereof) evidenced by the ADRssurrendered.
(d) Expenses of the Depositary Expenses incurred on behalf of holders in connection with: i) Stock transfer or other taxes and other governmental charges.ii) Cable, telex and facsimile transmission and delivery.iii) Expenses of the Depositary in connection with the conversion of foreigncurrency into US dollars (which are paid out of such foreign currency).iv) Such fees and expenses as are incurred by the Depositary (including withoutlimitation expenses incurred on behalf of holders in connection with compliancewith foreign exchange control regulations or any law or regulation relating toforeign investment) in delivery of deposited securities or otherwise inconnection with the Depositary’s or its Custodian’s compliance with applicablelaw, rule or regulation.
Expenses payable at the solediscretion of the depositary.
1 The Depositary may sell (by public or private sale) sufficient securities and property received in respect of such share distributions, rights and otherdistributions prior to such deposit to cover such charge.
Direct and Indirect Payments
The Depositary, has agreed to reimburse certain of our reasonable expenses related to our ADR program and incurred by us in connection with the program.Under certain circumstances, including termination of the program, we are required to repay to the Depositary amounts reimbursed in prior periods.
The reimbursements include direct payments (legal and accounting fees incurred in connection with preparation of Form 20-F and ongoing SEC complianceand listing requirements, listing fees, investor relations expenses, advertising and public relations expenses and fees payable to service providers for thedistribution of hard copy materials to beneficial ADR holders in the Depositary Trust Company, such as information related to shareholders’ meetings andrelated voting instruction cards); and indirect payments (third-party expenses paid directly and fees waived).
In 2009, the Depositary made direct payments and reimbursements to us in the amount of US$164,490 for expenses related to investor relations.
154

Table of Contents
PART II ITEM 13. DEFAULTS, DIVIDEND ARREARAGES AND DELINQUENCIES
Not applicable. ITEM 14. MATERIAL MODIFICATIONS TO THE RIGHTS OF SECURITY HOLDERS AND USE OF PROCEEDS
Not applicable. ITEM 15. CONTROLS AND PROCEDURES Conclusion Regarding the Effectiveness of Disclosure Controls and Procedures
As of December 31, 2009, the Bank, under the supervision and with the participation of the Bank’s management, including the President, Chief ExecutiveOfficer and Chief Financial Officer, performed an evaluation of the effectiveness of the design and operation of our disclosure controls and procedures (asdefined in Rule 13a-15(f) under the Exchange Act). There are, as described below, inherent limitations to the effectiveness of any control system, includingdisclosure controls and procedures. Accordingly, even effective disclosure controls and procedures can provide only reasonable assurance of achieving theircontrol objectives.
Based on such evaluation, the Bank’s President, Chief Executive Officer and Chief Financial Officer concluded that the Bank’s disclosure controls andprocedures were effective in ensuring that information relating to the Bank, including its consolidated subsidiaries, required to be disclosed in the reports it filesunder the Exchange Act is (1) recorded, processed, summarized and reported within the time periods specified in the SEC’s rules and forms, and (2) accumulatedand communicated to the management, including principal financial officers as appropriate to allow timely decisions regarding required disclosure. Management’s Report on Internal Control Over Financial Reporting
The Bank’s management is responsible for establishing and maintaining adequate internal control over financial reporting as defined in Rule 13a-15(f) underthe Exchange Act. The Bank’s internal control over financial reporting is a process designed to provide reasonable assurance regarding the reliability of financialreporting and the preparation of financial statements for external purposes in accordance with IFRS-IASB and includes those policies and procedures that:
· Pertain to the maintenance of records that, in reasonable detail, accurately and fairly reflect the transactions and dispositions of the assets of the Bank;
· Provide reasonable assurance that transactions are recorded as necessary to permit preparation of financial statements in accordance with IFRS-IASB,and that our receipts and expenditures are being made only in accordance with authorizations of the Bank’s management and directors; and
· Provide reasonable assurance regarding prevention or timely detection of unauthorized acquisition, use or disposition of our assets that could have a
material effect on the financial statements.
Because of its inherent limitations, internal control over financial reporting, no matter how well designed may not prevent or detect misstatements, due to thepossibility that a control can be circumvented or overridden or that misstatements due to error or fraud may occur that are not detected. Also, projections of anyevaluation of effectiveness to future periods are subject to the risk that controls may become inadequate because of changes in conditions, or that the degree ofcompliance with the policies or procedures may deteriorate.
Under the supervision and with the participation of the Bank’s management, including the Chief Executive Officer and Chief Financial Officer, weconducted an evaluation of the effectiveness of our internal control over financial reporting based on the criteria established in Internal Control—IntegratedFramework issued by the Committee of Sponsoring Organizations of the Treadway Commission (“COSO”) in the Enterprise-Wide Risk Management –Integrated Framework.
155

Table of Contents Based on this assessment, our management concluded that, as of December 31, 2009, our internal control over financial reporting was effective based on
those criteria.
Our internal control over financial reporting as of December 31, 2009, has been audited by an independent registered public accounting firm, as stated intheir report which follows below. Changes in Internal Control Over Financial Reporting
There has been no change in the Bank’s internal control over financial reporting (as defined in Rule 13a-15(f) under the Exchange Act) that occurred duringthe period covered by this Annual Report that has materially affected, or is reasonably likely to materially affect, internal control over financial reporting.
156

Table of Contents REPORT OF INDEPENDENT REGISTERED PUBLIC ACCOUNTING FIRM
To the Board of Directors and Shareholders of Banco Santander Chile
We have audited the internal control over financial reporting of Banco Santander Chile and subsidiaries (the “Bank”) as of December 31, 2009, based on criteriaestablished in Internal Control-Integrated Framework issued by the Committee of Sponsoring Organizations of the Treadway Commission. The Bank’smanagement is responsible for maintaining effective internal control over financial reporting and for its assessment of the effectiveness of internal control overfinancial reporting included in the accompanying Management’s Report on Internal Control Over Financial Reporting. Our responsibility is to express anopinion on the Bank’s internal control over fin ancial reporting based on our audit.
We conducted our audit in accordance with the standards of the Public Company Accounting Oversight Board (United States of America). Those standardsrequire that we plan and perform the audit to obtain reasonable assurance about whether effective internal control over financial reporting was maintained in allmaterial respects. Our audit included obtaining an understanding of internal control over financial reporting, assessing the risk that a material weakness exist,testing and evaluating the design and operating effectiveness of internal control based on the assessed risk, and performing such other procedures as weconsidered necessary in the circumstances. We believe that our audit provides a reasonable basis for our opinion.
A company’s internal control over financial reporting is a process designed by, or under the supervision of, the bank’s principal executive and principal financialofficers, or persons performing similar functions, and effected by the bank’s board of directors, management, and other personnel to provide reasonableassurance regarding the reliability of financial reporting and the preparation of financial statements for external purposes in accordance with generally acceptedaccounting principles. A company’s internal control over financial reporting includes those policies and procedures that (1) pertain to the maintenance of recordsthat, in reasonable detail, accurately and fairly reflect the transactions and dispositions of the assets of the bank; (2) provide reasonable assurance th attransactions are recorded as necessary to permit preparation of financial statements in accordance with generally accepted accounting principles, and that receiptsand expenditures of the bank are being made only in accordance with authorizations of management and directors of the bank; and (3) provide reasonableassurance regarding prevention or timely detection of unauthorized acquisition, use, or disposition of the bank’s assets that could have a material effect on thefinancial statements.
Because of the inherent limitations of internal control over financial reporting, including the possibility of collusion or improper management override ofcontrols, material misstatements due to error or fraud may not be prevented or detected on a timely basis. Also, projections of any evaluation of the effectivenessof the internal control over financial reporting to future periods are subject to the risk that the controls may become inadequate because of changes in conditions,or that the degree of compliance with the policies or procedures may deteriorate.
In our opinion, the Bank maintained, in all material respects, effective internal control over financial reporting as of December 31, 2009, based on the criteriaestablished in Internal Control-Integrated Framework issued by the Committee of Sponsoring Organizations of the Treadway Commission.
We have also audited, in accordance with the standards of the Public Company Accounting Oversight Board (United States of America), the consolidatedfinancial statements as of and for the year ended December 31, 2009 and our report dated June 21, 2010 expressed an unqualified opinion on those consolidatedfinancial statements and included two explanatory paragraphs: one paragraph explains that as it is indicated in Note 2 to the consolidated financial statements,the Bank adopted the International Financial Reporting Standards in 2009, being its transition date on January 1, 2008 and the date of adoption on January 1,2009. The consolidated financial statements for 2008 and the consolidated opening statements of financial position have been reformulated for comparativepurposes. The second paragraph indicates that our audit also comprehended the translation of Chilean peso amounts into U.S. dollar amounts and we are notaware of any modifications that should be made for such translation to be in conformity with the basis stated in Note 1 e. and such U.S. dollar amounts arepresented solely for the convenience of readers in the United States of America.
/s/DeloitteSantiago, ChileJune 21, 2010
157

Table of Contents ITEM 16. [RESERVED] ITEM 16A. AUDIT COMMITTEE FINANCIAL EXPERT
Our Board of Directors has determined that one of the members of our Audit Committee, Víctor Arbulú Crousillat, meets the requirements of an “auditcommittee financial expert” in accordance with SEC rules and regulations, in that he has an understanding of IFRS-IASB and financial statements, the ability toassess the general application of IFRS-IASB in connection with the accounting for estimates, accruals and reserves, experience analyzing and evaluatingfinancial statements that present a breadth and level of complexity of accounting issues that are generally comparable to the breadth and complexity of issues thatcan reasonably be expected to be raised by our consolidated financial statements, an understanding of internal controls over financial reporting, and anunderstanding of audit committe e functions. All three members of our Audit Committee have experience overseeing and assessing the performance ofSantander-Chile and its consolidated subsidiaries and our external auditors with respect to the preparation, auditing and evaluation of our consolidated financialstatements.
All three members of our Audit Committee are considered to be independent according to applicable NYSE criteria. Víctor Arbulú Crousillat is relying onthe exemption provided by Rule 10A-3(b)(1)(iv)(B), which allows an otherwise independent director to serve on both the audit committee of the issuer and theBoard of Directors of an affiliate. ITEM 16B. CODE OF ETHICS
The Bank has adopted a code of ethics that is applicable to all of the Bank’s employees and a copy is included as an exhibit hereto. We will provide to anyperson without charge, upon request, a copy of our code of ethics. Please email [email protected] to request a copy. Our code of ethics is available on ourwebsite, which does not form part of this annual report on Form 20-F, at www.santander.cl under the heading “Informatción Corporativa”. ITEM 16C. PRINCIPAL ACCOUNTANT FEES AND SERVICES
Amounts paid to the auditors for statutory audit and other services were as follows:
2009 2008 (in millions of Ch$) Audit Services - Statutory audit 534 530 - Audit-related regulatory reporting 93 42 Tax Fees - Compliance – – - Advisory Services 99 93 All Other Services 192 74 Total 918 739
Statutory audit: Consists of fees billed for professional services rendered in connection with the audit of our consolidated financial statements that are
provided by Deloitte Auditores y Consultores Limitada in 2007 and 2008 in connection with statutory and regulatory filings or engagements, and attest services.
Audit-related regulatory reporting: Consists of fees billed for assurance and related services that were specifically related to the performance of the auditand review of our filings under the Securities Act.
Auditors are pre-approved by the Audit Committee. The selection of external auditors is subject to approval by shareholders at the Annual Shareholders’Meeting. All proposed payments have been presented to our Audit Committee, which has determined that they are reasonable and consistent with internalpolicies.
158

Table of Contents ITEM 16D. EXEMPTIONS FROM THE LISTING STANDARDS FOR AUDIT COMMITTEES
Not applicable. ITEM 16E. PURCHASES OF EQUITY SECURITIES BY THE ISSUER AND AFFILIATED PURCHASERS
In 2009, neither Santander-Chile nor any of its affiliates purchased any of Santander-Chile’s equity securities. ITEM 16F. CHANGE IN REGISTRANT’S CERTIFYING ACCOUNTANT
Not applicable. ITEM 16G. CORPORATE GOVERNANCE Summary Comparison of Corporate Governance Standards and NYSE Listed Company Standards
Our corporate governance standards, dictated by Chilean corporate law, differ from the standards followed by U.S. companies under the New York StockExchange (NYSE) listing standards in a number of ways. Consequently, you will not have the same protections afforded to shareholders of companies that aresubject to all NYSE corporate governance requirements. The following is a non-exhaustive summary of a few key differences:
· Whether a company’s executive officers may serve as its directors – the NYSE standards do not prohibit a U.S. company’s executive officer from alsoserving as a director, whereas our corporate governance standards prohibits this.
· Whether the shareholders must be given an opportunity to vote on equity-compensation plans – the NYSE standards require that shareholders be
allowed to vote on all equity compensation plans of a U.S. company, whereas our corporate governance standards only require that shareholders beallowed to vote on director compensation.
· The adoption and disclosure of corporate governance guidelines – the NYSE standards require all U.S. companies listed on the NYSE to adopt the
NYSE corporate governance guidelines, whereas we follow the corporate governance guidelines established under Chilean law.
As more than 50% of our voting power is held by another company, Banco Santander Spain, S.A., we would be permitted to elect for certain exemptionsunder NYSE corporate governance standards if we were a U.S. company. Specifically, as a U.S. company, we could elect to be exempted from the requirements(i) that we have a majority of independent directors (as defined by the NYSE), (ii) that we have a nominating/corporate governance committee meeting certainconditions, and (iii) that we have a compensation committee meeting certain requirements. Because we would not be required to follow these standards if wewere a U.S. company, we have not summarized the differences, if any, between these provisions and our own corporate governance procedures. Summary of Corporate Governance Standards
Santander-Chile has adopted diverse measures to promote good corporate governance. Among the measures adopted are:
· Board of Directors mainly composed of professionals not related to Banco Santander Spain, our parent company.
· Active participation of Directors in main committees of the Bank.
· All personnel must subscribe to a code of ethics and good conduct. Those who interact directly with the capital markets must also subscribe to anadditional code of conduct.
159

Table of Contents
· Segregation of functions in order to assure adequate management of risks. Commercial areas separated from back office areas. Risk managementindependent of commercial areas. Main credit decisions taken in committees.
· Internal Auditing Area clearly independent from the Administration.
· The Bank also has an Internal Compliance Division that oversees the fulfillment of the Bank’s codes of conduct.
Santander-Chile has a commitment to transparency. This includes:
· Equal treatment for all shareholders: one share equals to one vote.
· Monthly publication of the Bank’s results by the Superintendency of Banks.
· Quarterly report of a detailed analysis of Bank results published by us at least 30 days after the close of each interim quarter and 40 days after close of
the full year.
· Quarterly conference call open to the public.
· All information relevant to the public available immediately on the web page www.santander.cl.
· Ample and periodic coverage of the Bank by international and local stock analysts.
· The Bank has five credit risk ratings by five independent rating agencies, domestic and international.
160
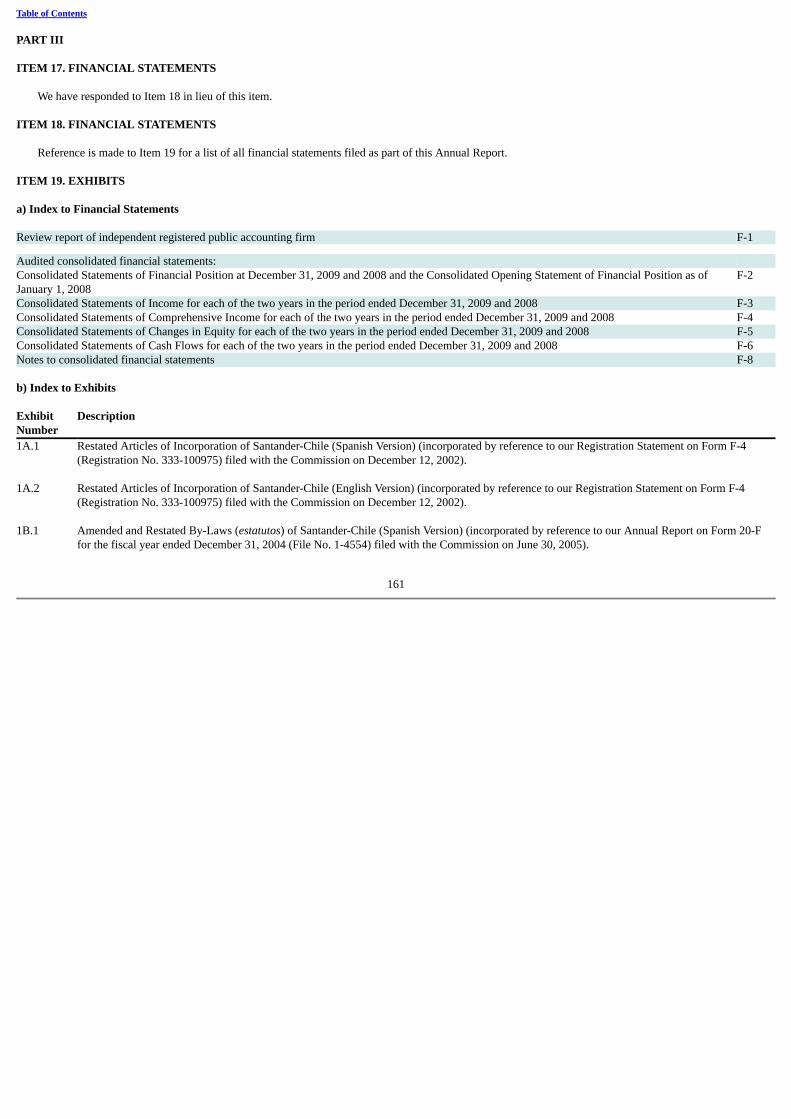
Table of Contents PART III ITEM 17. FINANCIAL STATEMENTS
We have responded to Item 18 in lieu of this item. ITEM 18. FINANCIAL STATEMENTS
Reference is made to Item 19 for a list of all financial statements filed as part of this Annual Report. ITEM 19. EXHIBITS a) Index to Financial Statements Review report of independent registered public accounting firm F-1 Audited consolidated financial statements:
Consolidated Statements of Financial Position at December 31, 2009 and 2008 and the Consolidated Opening Statement of Financial Position as ofJanuary 1, 2008
F-2
Consolidated Statements of Income for each of the two years in the period ended December 31, 2009 and 2008 F-3Consolidated Statements of Comprehensive Income for each of the two years in the period ended December 31, 2009 and 2008 F-4Consolidated Statements of Changes in Equity for each of the two years in the period ended December 31, 2009 and 2008 F-5Consolidated Statements of Cash Flows for each of the two years in the period ended December 31, 2009 and 2008 F-6Notes to consolidated financial statements F-8 b) Index to Exhibits
ExhibitNumber
Description
1A.1 Restated Articles of Incorporation of Santander-Chile (Spanish Version) (incorporated by reference to our Registration Statement on Form F-4(Registration No. 333-100975) filed with the Commission on December 12, 2002).
1A.2 Restated Articles of Incorporation of Santander-Chile (English Version) (incorporated by reference to our Registration Statement on Form F-4
(Registration No. 333-100975) filed with the Commission on December 12, 2002). 1B.1 Amended and Restated By-Laws (estatutos) of Santander-Chile (Spanish Version) (incorporated by reference to our Annual Report on Form 20-F
for the fiscal year ended December 31, 2004 (File No. 1-4554) filed with the Commission on June 30, 2005).
161

Table of Contents 1B.2 Amended and Restated By-Laws (estatutos) of Santander-Chile (English Version) (incorporated by reference to our Annual Report on Form 20-F
for the fiscal year ended December 31, 2004 (File No. 1-4554) filed with the Commission on June 30, 2005). 2A.1 Form of Amended and Restated Deposit Agreement, dated August 4, 2008, among Banco Santander-Chile, JPMorgan Chase Bank, N.A. (as
depositary) and Holders of American Depositary Receipts (incorporated by reference to our Registration Statement on Form F-6 (Registration No.333-152664) filed with the Commission on July 31, 2008).
2A.2 Form of Foreign Investment Contract among Banco Santiago, JPMorgan Chase Bank, N.A. and the Central Bank of Chile relating to the foreign
exchange treatment of an investment in ADSs (accompanied by an English translation) (incorporated by reference to our Registration Statement onForm F-1 (Registration No. 333-7676) filed with the Commission on October 23, 1997).
2A.3 Copy of the Central Bank Chapter XXVI Regulations Related to the Acquisition of Shares in Chilean Corporations and the Issuance of Instrument
on Foreign Stock Exchanges or under Other Terms and Conditions of Issue (accompanied by an English translation) (incorporated by reference toOld Santander-Chile’s Annual Report for the fiscal year ended December 31, 1996 (File No. 1-13448) filed with the Commission on June 30, 1997).
2B.1 Agreement for the Issuance of Bonds dated November 26, 1996 between Old Santander-Chile and Banco Security (accompanied by an English
translation) (incorporated by reference to Old Santander-Chile’s Annual Report for the fiscal year ended December 31, 1996 (File No. 1-13448)filed with the Commission on June 30, 1997).
2B.2 Indenture dated December 9, 2004 between Santander-Chile and Deutsche Bank Trust Company Americas, as trustee, providing for issuance of
securities in series (incorporated by reference to Banco Santiago’s Annual Report on Form 20-F for the fiscal year ended December 31, 2005 (FileNo. 1-4554) filed with the Commission on April 12, 2006).
2B.3 Indenture dated March 16, 2001, as amended on May 30, 2003, October 22, 2004, May 3, 2005, and September 20, 2005 between Santander-Chile
and Banco de Chile, as trustee, relating to issuance of UF14 million senior notes (copy to be furnished upon request). 4A.1 Automatic Teller Machines Participation Agreement dated October 1, 1988 between Banco Espanol-Chile (predecessor to Old Santander-Chile) and
REDBANC (accompanied by an English translation) (incorporated by reference to Old Santander-Chile’s Annual Report for the fiscal year endedDecember 31, 1996 (File No. 1-13448) filed with the Commission on June 30, 1997).
4A.2 Outsourcing agreement between Banco Santiago and IBM de Chile S.A.C. dated June 30, 2000 (including English summary) (incorporated by
reference to Banco Santiago’s Annual Report on Form 20-F for the fiscal year ended December 31, 2000 (File No. 1-4554) filed with theCommission on June 28, 2001).
4A.3 Systems and Technology Service and Consulting Agreement between Santander-Chile and Altec dated December 30, 2003 (English translation)
(incorporated by reference to our Annual Report on Form 20-F for the fiscal year ended December 31, 2003 (File No. 1-14554) filed with theCommission on June 29, 2004).
4A.4 Purchase-Sale Contract between Santander-Chile and Empresas Almacenes París dated December 6, 2004 (English translation) (incorporated by
reference to our Annual Report on Form 20-F for the fiscal year ended December 31, 2005 (File No. 1-14554) filed with the Commission on June12, 2006).
162
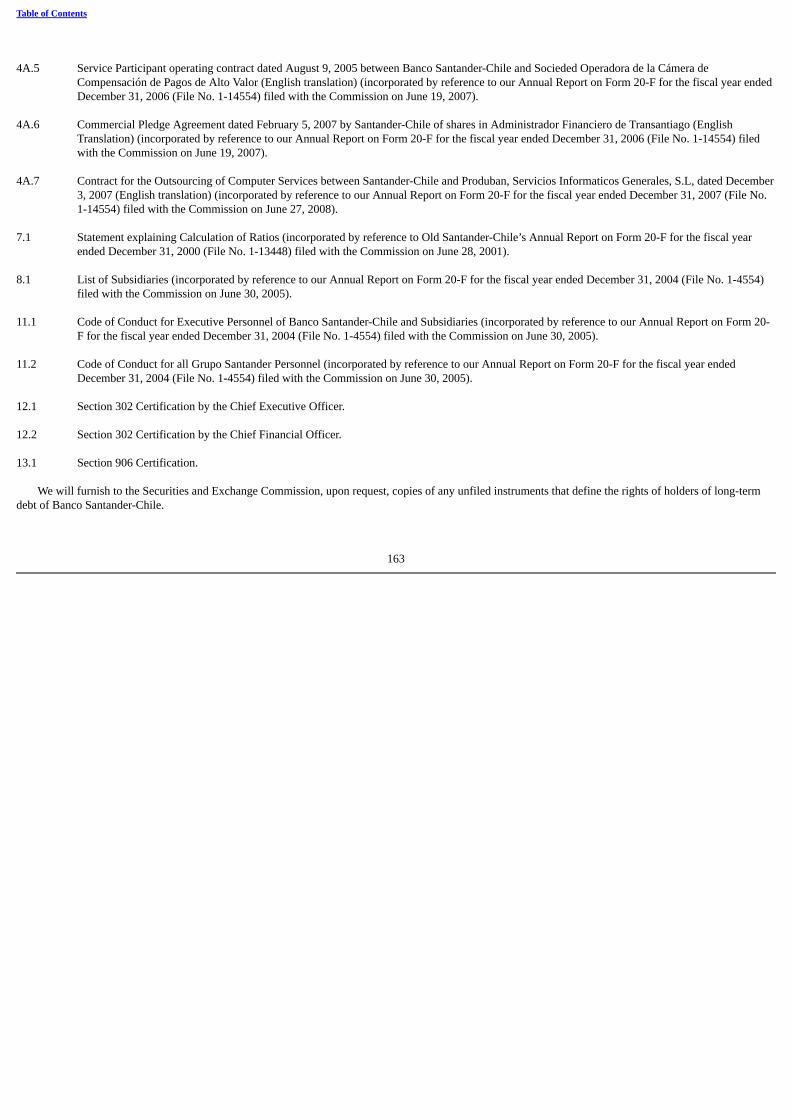
Table of Contents 4A.5 Service Participant operating contract dated August 9, 2005 between Banco Santander-Chile and Socieded Operadora de la Cámera de
Compensación de Pagos de Alto Valor (English translation) (incorporated by reference to our Annual Report on Form 20-F for the fiscal year endedDecember 31, 2006 (File No. 1-14554) filed with the Commission on June 19, 2007).
4A.6 Commercial Pledge Agreement dated February 5, 2007 by Santander-Chile of shares in Administrador Financiero de Transantiago (English
Translation) (incorporated by reference to our Annual Report on Form 20-F for the fiscal year ended December 31, 2006 (File No. 1-14554) filedwith the Commission on June 19, 2007).
4A.7 Contract for the Outsourcing of Computer Services between Santander-Chile and Produban, Servicios Informaticos Generales, S.L, dated December
3, 2007 (English translation) (incorporated by reference to our Annual Report on Form 20-F for the fiscal year ended December 31, 2007 (File No.1-14554) filed with the Commission on June 27, 2008).
7.1 Statement explaining Calculation of Ratios (incorporated by reference to Old Santander-Chile’s Annual Report on Form 20-F for the fiscal year
ended December 31, 2000 (File No. 1-13448) filed with the Commission on June 28, 2001). 8.1 List of Subsidiaries (incorporated by reference to our Annual Report on Form 20-F for the fiscal year ended December 31, 2004 (File No. 1-4554)
filed with the Commission on June 30, 2005). 11.1 Code of Conduct for Executive Personnel of Banco Santander-Chile and Subsidiaries (incorporated by reference to our Annual Report on Form 20-
F for the fiscal year ended December 31, 2004 (File No. 1-4554) filed with the Commission on June 30, 2005). 11.2 Code of Conduct for all Grupo Santander Personnel (incorporated by reference to our Annual Report on Form 20-F for the fiscal year ended
December 31, 2004 (File No. 1-4554) filed with the Commission on June 30, 2005). 12.1 Section 302 Certification by the Chief Executive Officer. 12.2 Section 302 Certification by the Chief Financial Officer. 13.1 Section 906 Certification.
We will furnish to the Securities and Exchange Commission, upon request, copies of any unfiled instruments that define the rights of holders of long-termdebt of Banco Santander-Chile.
163

Table of Contents
SIGNATURES
The registrant hereby certifies that it meets all of the requirements for filing on Form 20-F and that it has duly caused and authorized the undersigned to signthis Annual Report on its behalf.
BANCO SANTANDER-CHILE By: /s/ Juan Pedro Santa María Name: Juan Pedro Santa María Title: General Counsel
Date: June 30, 2010

Table of Contents
BANCO SANTANDER CHILE AND
SUBSIDIARIES Consolidated Financial StatementsFor the period ended as of December 31, 2009 and 2008and as of January 1, 2008.
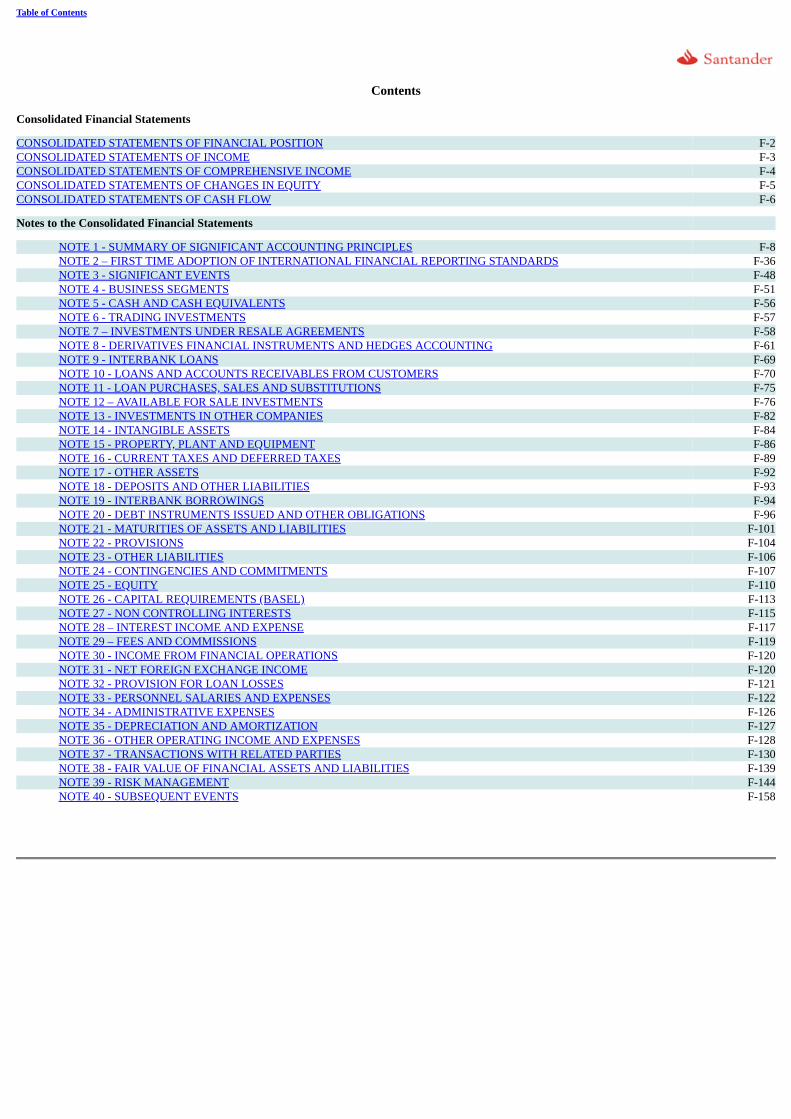
Table of Contents
Contents
Consolidated Financial Statements CONSOLIDATED STATEMENTS OF FINANCIAL POSITION F-2CONSOLIDATED STATEMENTS OF INCOME F-3CONSOLIDATED STATEMENTS OF COMPREHENSIVE INCOME F-4CONSOLIDATED STATEMENTS OF CHANGES IN EQUITY F-5CONSOLIDATED STATEMENTS OF CASH FLOW F-6 Notes to the Consolidated Financial Statements
NOTE 1 - SUMMARY OF SIGNIFICANT ACCOUNTING PRINCIPLES F-8NOTE 2 – FIRST TIME ADOPTION OF INTERNATIONAL FINANCIAL REPORTING STANDARDS F-36NOTE 3 - SIGNIFICANT EVENTS F-48NOTE 4 - BUSINESS SEGMENTS F-51NOTE 5 - CASH AND CASH EQUIVALENTS F-56NOTE 6 - TRADING INVESTMENTS F-57NOTE 7 – INVESTMENTS UNDER RESALE AGREEMENTS F-58NOTE 8 - DERIVATIVES FINANCIAL INSTRUMENTS AND HEDGES ACCOUNTING F-61NOTE 9 - INTERBANK LOANS F-69NOTE 10 - LOANS AND ACCOUNTS RECEIVABLES FROM CUSTOMERS F-70NOTE 11 - LOAN PURCHASES, SALES AND SUBSTITUTIONS F-75NOTE 12 – AVAILABLE FOR SALE INVESTMENTS F-76NOTE 13 - INVESTMENTS IN OTHER COMPANIES F-82NOTE 14 - INTANGIBLE ASSETS F-84NOTE 15 - PROPERTY, PLANT AND EQUIPMENT F-86NOTE 16 - CURRENT TAXES AND DEFERRED TAXES F-89NOTE 17 - OTHER ASSETS F-92NOTE 18 - DEPOSITS AND OTHER LIABILITIES F-93NOTE 19 - INTERBANK BORROWINGS F-94NOTE 20 - DEBT INSTRUMENTS ISSUED AND OTHER OBLIGATIONS F-96NOTE 21 - MATURITIES OF ASSETS AND LIABILITIES F-101NOTE 22 - PROVISIONS F-104NOTE 23 - OTHER LIABILITIES F-106NOTE 24 - CONTINGENCIES AND COMMITMENTS F-107NOTE 25 - EQUITY F-110NOTE 26 - CAPITAL REQUIREMENTS (BASEL) F-113NOTE 27 - NON CONTROLLING INTERESTS F-115NOTE 28 – INTEREST INCOME AND EXPENSE F-117NOTE 29 – FEES AND COMMISSIONS F-119NOTE 30 - INCOME FROM FINANCIAL OPERATIONS F-120NOTE 31 - NET FOREIGN EXCHANGE INCOME F-120NOTE 32 - PROVISION FOR LOAN LOSSES F-121NOTE 33 - PERSONNEL SALARIES AND EXPENSES F-122NOTE 34 - ADMINISTRATIVE EXPENSES F-126NOTE 35 - DEPRECIATION AND AMORTIZATION F-127NOTE 36 - OTHER OPERATING INCOME AND EXPENSES F-128NOTE 37 - TRANSACTIONS WITH RELATED PARTIES F-130NOTE 38 - FAIR VALUE OF FINANCIAL ASSETS AND LIABILITIES F-139NOTE 39 - RISK MANAGEMENT F-144NOTE 40 - SUBSEQUENT EVENTS F-158

Table of Contents
REPORT OF INDEPENDENT REGISTERED PUBLIC ACCOUNTING FIRM
To the Board of Directors and Shareholders ofBanco Santander Chile
We have audited the accompanying consolidated statements of financial position of Banco Santander Chile and Subsidiaries as of December 31, 2009, 2008 andthe consolidated statements of financial position as of January 1, 2008, and the corresponding consolidated statements of income, comprehensive income,changes in equity, and cash flows for the years ending December 31, 2009 and 2008. The preparations of these financial statements are the responsibility of theManagement of Banco Santander Chile. Our responsibility is to express an opinion on these financial statements based on our audits.
We conducted our audits in accordance with the standards of the Public Company Accounting Oversight Board (United States of America). Those standardsrequire that we plan and perform the audit to obtain reasonable assurance about whether the financial statements are free of material misstatement. An auditincludes examining, on a test basis, evidence supporting the amounts and disclosures in the financial statements. An audit also includes assessing the accountingprinciples used and significant estimates made by management, as well as evaluating the overall financial statement presentation. We believe that our auditsprovide a reasonable basis for our opinion.
In our opinion, the consolidated financial statements referred to above present fairly, in all material respects, the financial position of Banco Santander Chile andSubsidiaries as of December 31, 2009 and 2008 and as of January 1, 2008, the results of their operations, the comprehensive income, and the changes in equityand cash flows for the years ending December 31, 2009 and 2008, in accordance with International Financial Reporting Standards (IFRS) as issued by theInternational Accounting Standards Board (“IASB”).
As is indicated in Note 2 to the consolidated financial statements, the Bank adopted the International Financial Reporting Standards in 2009, being its transitiondate on January 1, 2008 and the date of adoption on January 1, 2009. The consolidated financial statements for 2008 and the consolidated opening statements offinancial position have been reformulated for comparative purposes.
Our audit also comprehended the translation of Chilean peso amounts into U.S. dollar amounts and we are not aware of any modifications that should be madefor such translation to be in conformity with the basis stated in Note 1e. Such U.S. dollar amounts are presented solely for the convenience of readers in theUnited States of America.
We have also audited, in accordance with the standards of the Public Company Accounting Oversight Board (United States of America), the Company's internalcontrol over financial reporting as of December 31, 2009, based on the criteria established in Internal Control—Integrated Framework issued by the Committeeof Sponsoring Organizations of the Treadway Commission and our report dated June 21, 2010 expressed an unqualified opinion on the effectiveness of theCompany's internal control over financial reporting.
/s/DeloitteSantiago, ChileJune 21, 2010
F-1
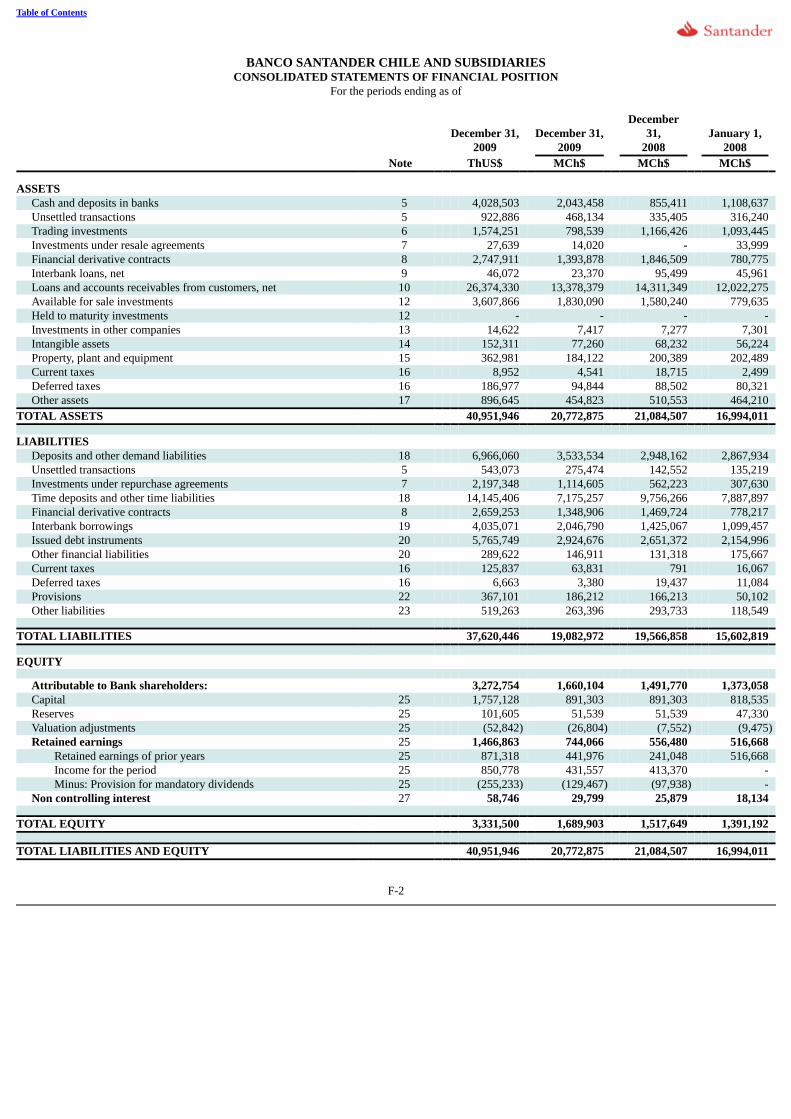
Table of Contents
BANCO SANTANDER CHILE AND SUBSIDIARIESCONSOLIDATED STATEMENTS OF FINANCIAL POSITION
For the periods ending as of
December 31,
2009 December 31,
2009
December31,
2008 January 1,
2008 Note ThUS$ MCh$ MCh$ MCh$ ASSETS
Cash and deposits in banks 5 4,028,503 2,043,458 855,411 1,108,637 Unsettled transactions 5 922,886 468,134 335,405 316,240 Trading investments 6 1,574,251 798,539 1,166,426 1,093,445 Investments under resale agreements 7 27,639 14,020 - 33,999 Financial derivative contracts 8 2,747,911 1,393,878 1,846,509 780,775 Interbank loans, net 9 46,072 23,370 95,499 45,961 Loans and accounts receivables from customers, net 10 26,374,330 13,378,379 14,311,349 12,022,275 Available for sale investments 12 3,607,866 1,830,090 1,580,240 779,635 Held to maturity investments 12 - - - - Investments in other companies 13 14,622 7,417 7,277 7,301 Intangible assets 14 152,311 77,260 68,232 56,224 Property, plant and equipment 15 362,981 184,122 200,389 202,489 Current taxes 16 8,952 4,541 18,715 2,499 Deferred taxes 16 186,977 94,844 88,502 80,321 Other assets 17 896,645 454,823 510,553 464,210
TOTAL ASSETS 40,951,946 20,772,875 21,084,507 16,994,011 LIABILITIES
Deposits and other demand liabilities 18 6,966,060 3,533,534 2,948,162 2,867,934 Unsettled transactions 5 543,073 275,474 142,552 135,219 Investments under repurchase agreements 7 2,197,348 1,114,605 562,223 307,630 Time deposits and other time liabilities 18 14,145,406 7,175,257 9,756,266 7,887,897 Financial derivative contracts 8 2,659,253 1,348,906 1,469,724 778,217 Interbank borrowings 19 4,035,071 2,046,790 1,425,067 1,099,457 Issued debt instruments 20 5,765,749 2,924,676 2,651,372 2,154,996 Other financial liabilities 20 289,622 146,911 131,318 175,667 Current taxes 16 125,837 63,831 791 16,067 Deferred taxes 16 6,663 3,380 19,437 11,084 Provisions 22 367,101 186,212 166,213 50,102 Other liabilities 23 519,263 263,396 293,733 118,549
TOTAL LIABILITIES 37,620,446 19,082,972 19,566,858 15,602,819 EQUITY
Attributable to Bank shareholders: 3,272,754 1,660,104 1,491,770 1,373,058 Capital 25 1,757,128 891,303 891,303 818,535 Reserves 25 101,605 51,539 51,539 47,330 Valuation adjustments 25 (52,842) (26,804) (7,552) (9,475)Retained earnings 25 1,466,863 744,066 556,480 516,668
Retained earnings of prior years 25 871,318 441,976 241,048 516,668 Income for the period 25 850,778 431,557 413,370 - Minus: Provision for mandatory dividends 25 (255,233) (129,467) (97,938) -
Non controlling interest 27 58,746 29,799 25,879 18,134 TOTAL EQUITY 3,331,500 1,689,903 1,517,649 1,391,192 TOTAL LIABILITIES AND EQUITY 40,951,946 20,772,875 21,084,507 16,994,011
F-2

Table of Contents
BANCO SANTANDER CHILE AND SUBSIDIARIES
CONSOLIDATED STATEMENTS OF INCOMEFor the periods ending as of
December 31, December 31, 2009 2009 2008 Note ThUS$ MCh$ MCh$ OPERATING INCOME Interest income 28 2,381,031 1,207,778 2,061,346 Interest expense 28 (692,483) (351,262) (1,169,280)
Net interest income 1,688,548 856,516 892,066 Fee and commission income 29 622,819 315,925 295,969 Fee and commission expense 29 (121,824) (61,795) (52,840)
Net fee and commission income 500,995 254,130 243,129 Net income from financial operations (net trading income) 30 7,663 3,887 273,477 Foreign exchange profit (loss), net 31 321,816 163,241 (187,042)Other operating income 36 50,993 25,866 10,896
Total operating income 2,570,015 1,303,640 1,232,526 Provision for loan losses 32 (658,151) (333,847) (287,983) NET OPERATING PROFIT 1,911,864 969,793 944,543 Personnel salaries and expenses 33 (442,551) (224,484) (246,775)Administrative expenses 34 (269,516) (136,712) (133,682)Depreciation and amortization 35 (91,913) (46,623) (47,627)Impairment 15 (148) (75) (84)Other operating expenses 36 (72,276) (36,662) (36,298)
TOTAL OPERATING EXPENSES (876,404) (444,556) (464,466) OPERATING INCOME 1,035,460 525,237 480,077 Income from investments in other companies 13 586 297 632
Income before tax 1,036,046 525,534 480,709 Income tax expense 16 (175,306) (88,924) (59,742) CONSOLIDATED INCOME FOR THE PERIOD 860,740 436,610 420,967 Attributable to:
Bank shareholders (Equity holders of the Bank) 850,778 431,557 413,370 Non controlling interest 27 9,962 5,053 7,597
Earnings per share attributable to Bank shareholders: (expressed in Chilean pesos and US dollars)
Basic earning 25 0.00452 2.290 2.194 Diluted earning 25 0.00452 2.290 2.194
F-3

Table of Contents
BANCO SANTANDER CHILE AND SUBSIDIARIES
CONSOLIDATED STATEMENTS OF COMPREHENSIVE INCOMEFor the periods ending as of
December 31, December 31, 2009 2009 2008 NOTE ThUS$ MCh$ MCh$ CONSOLIDATED INCOME FOR THE PERIOD 860,740 436,610 420,967 OTHER COMPREHENSIVE INCOME
Available for sale investments 12 (18,305) (9,285) (14,471)Cash flow hedge 8 (27,669) (14,035) 16,740
Other comprehensive income before income tax (45,974) (23,320) 2,269
Income tax related to other comprehensive income 16 7,815 3,964 (385)
Total other comprehensive income (38,159) (19,356) 1,884
CONSOLIDATED COMPREHENSIVE INCOME FOR THE YEAR 822,581 417,254 422,851
Attributable to: Bank shareholders 812,824 412,305 415,293 Non controlling interest 27 9,757 4,949 7,558
F-4

Table of Contents
BANCO SANTANDER CHILE AND SUBSIDIARIES
CONSOLIDATED STATEMENTS OF CHANGES IN EQUITYFor the periods ending as of December 31, 2009 and 2008 (in millions of pesos)
RESERVES VALUATION ACCOUNTS RETAINED EARNINGS
Capital
Reservesand
otherretainedearnings
Merger ofcompanies
undercommoncontrol
Availablefor sale
investments Cash flowcoverage
Incometax
Retainedearnings
fromprioryears
Incomefor thePeriod
Provisionfor
mandatorydividend
Totalattributable
toshareholders
Noncontrolling
interest TOTAL
EQUITY
Equity as ofDecember 31,2007 818,535 49,372 (2,042) (5,548) (5,867) 1,940 273,005 308,647 - 1,438,042 20,047 1,458,089
Distribution of incomefrom previous period - - - - - 308,647 (308,647) - - - -
Subtotals 818,535 49,372 (2,042) (5,548) (5,867) 1,940 581,652 - - 1,438,042 20,047 1,458,089 Effect of first application of
IFRS - - - - - - (64,984) - - (64,984) (1,913) (66,897)Equity as of January
1, 2008 818,535 49,372 (2,042) (5,548) (5,867) 1,940 516,668 - - 1,373,058 18,134 1,391,192 Adjustment pursuant to
Circular No.3443,mandatory dividend2008 - - - - - - - - (92,594) (92,594) - (92,594)
Dividends distributions /Withdrawals made - - - - - - (200,619) - 92,594 (108,025) (33) (108,058)
2008 price-levelrestatement restitution(*) 72,768 2,415 (182) (75,001) - - -
Other changes in equity - 1,976 - - - - - - - 1,976 220 2,196 Provision for mandatory
dividends - - - - - - - - (97,938) (97,938) - (97,938)Subtotals 72,768 4,391 (182) - - - (275,620) - (97,938) (296,581) 187 (296,394)
Other comprehensiveincome - - - (14,424) 16,740 (393) - - - 1,923 (39) 1,884
Income for the period - - - - - - - 413,370 - 413,370 7,597 420,967 Subtotals - - - (14,424) 16,740 (393) - 413,370 - 415,293 7,558 422,851
Equity as of December31, 2008 891,303 53,763 (2,224) (19,972) 10,873 1,547 241,048 413,370 (97,938) 1,491,770 25,879 1,517,649
Equity as of December
31, 2008 891,303 53,763 (2,224) (19,972) 10,873 1,547 241,048 413,370 (97,938) 1,491,770 25,879 1,517,649 Distribution of income
from previous period - - - - - - 413,370 (413,370) - - - - Equity as of January 1,
2009 891,303 53,763 (2,224) (19,972) 10,873 1,547 654,418 - (97,938) 1,491,170 25,879 1,517,649 Increase or decrease of
capital and reserves - - - - - - - - - - 5,600 5,600 Dividends distributions /
Withdrawals made - - - - - - (213,295) - 97,938 (115,357) (5,258) (120,615)Other changes in equity - - - - - 853 - - 853 (1,371) (518)Provision for mandatory
dividends 2008 - - - - - - - - (129,467) (129,467) - (129,467)Subtotals - - - - - - (212,442) - (31,529) (243,971) (1,029) (245,000)
Other comprehensiveincome - - - (9,160) (14,035) 3,943 - - - (19,252) (104) (19,356)
Income for the period - - - - - - - 431,557 - 431,557 5,053 436,610 Subtotals - - - (9,160) (14,035) 3,943 - 431,557 - 412,305 4,949 417,254 Equity as of
December 31,2009 891,303 53,763 (2,224) (29,132) (3,162) 5,490 441,976 431,557 (129,467) 1,660,104 29,799 1,689,903
(*) For further details, see Note 2 f) iii. “First time adoption of International Financial Reporting Standards”.
F-5

Table of Contents
BANCO SANTANDER CHILE AND SUBSIDIARIESCONSOLIDATED STATEMENTS OF CASH FLOW
For the periods ending
December 31, December 31, 2009 2009 2008 NOTE ThUS$ MCh$ MCh$ A - CASH FLOWS FROM OPERATING ACTIVITIES:
CONSOLIDATED INCOME BEFORE TAX 1,036,046 525,534 480,709 Debits (credits) to income that do not represent cash flows (1,476,533) (748,971) (770,158)Depreciation and amortization 35 91,913 46,623 47,627 Impairment of property, plant and equipment 15 148 75 84 Provision for loan losses 32 735,576 373,121 325,877 Mark to market of trading investments (58,997) (29,926) (1,121)Net gain on investments in other companies 13 (586) (297) (632)Net gain on sale of assets received in lieu of payment 36 (57) (29) (1,518)Net gain on sale of investments in other companies 36 (3,665) (1,859) (4,348)Net gain on sale of property, plant and equipment 36 (14,979) (7,598) (719)Net interest income 28 (1,688,548) (856,516) (892,066)Net fee and commission income 29 (500,995) (254,130) (243,129)Changes in assets and liabilities due to deferred taxes 16 (36,343) (18,435) (213)Increase/decrease in operating assets and liabilities 3,049,826 1,547,024 279,125 Decrease (increase) of loans and accounts receivable from customers 1,283,578 651,095 (1,947,234)Decrease (increase) of financial investments 141,031 71,538 (909,242)Decrease (increase) due to resale agreements (26,965) (13,678) 39,512 Decrease (increase) of interbank loans 142,196 72,129 (49,561)Decrease of assets received or awarded in lieu of payment 14,706 7,459 (8,165)Increase of debits in checking accounts 998,634 506,557 108,470 Increase (decrease) of time deposits and other time liabilities (4,361,508) (2,212,375) 1,547,972 Increase of obligations with domestic banks 54,017 27,400 1,786 Increase (decrease) of other demand liabilities or time obligations 230,484 116,913 (57,278)Increase of obligations with foreign banks 1,177,311 597,191 321,580 Decrease of obligations with Central Bank of Chile (1,199) (608) (959)Increase of repurchase agreements 1,093,782 554,821 280,412 Decrease of other short-term liabilities (18,752) (9,512) (58,173)Net increase of other assets and liabilities (212,826) (107,956) (200,039)Issuance of letters of credit 8,883 4,506 - Redemption of letters of credit (206,957) (104,979) (161,664)Senior bond issuances 1,477,378 749,400 303,722 Redemption of senior bonds and payments of interest (505,668) (256,500) (24,771)Subordinated bond issuances 11,856 6,014 145,421 Redemption of subordinated bonds and interest payments (273,451) (138,708) (12,728)Interest received 3,113,755 1,579,452 1,604,287 Interest paid (1,417,790) (719,174) (828,248)Dividends received from investments in other companies 13 1,642 833 638 Fees and commissions received 29 622,819 315,925 295,969 Fees and commissions paid 29 (121,824) (61,795) (52,840)Income tax paid 16 (175,306) (88,924) (59,742)Net cash from (used in) operating activities 2,609,339 1,323,587 (10,324)
F-6

Table of Contents
BANCO SANTANDER CHILE AND SUBSIDIARIESCONSOLIDATED STATEMENTS OF CASH FLOW
For the periods ending
December 31, December 31, 2009 2009 2008 NOTE ThUS$ MCh$ MCh$ B - CASH FLOWS FROM INVESTMENT ACTIVITIES:
Purchases of property, plant and equipment 15 (23,176) (11,756) (19,562)Sales of property, plant and equipment 34,322 17,410 12,014 Purchases of investments in other companies 13 (63) (32) - Sales of investments in other companies 13 412 209 386 Purchases of intangible assets 14 (66,949) (33,960) (38,177)Net cash used in investment activities (55,454) (28,129) (45,339)
C - CASH FLOW FROM FINANCING ACTIVITIES: From shareholders’ financing activities (339,886) (172,407) (173,575)
Increase of other obligations 80,607 40,888 27,044 Dividends paid 25 (420,493) (213,295) (200,619)
From non controlling interest financing activities 674 342 (33)Increases of capital 11,040 5,600 - Dividends and/or withdrawals paid (10,366) (5,258) (33)Net cash used in financing activities (339,212) (172,065) (173,608)
D – NET INCREASE (DECREASE) IN CASH AND CASH EQUIVALENTSDURING THE PERIOD 2,214,673 1,123,393 (229,271) E – EFFECTS OF FOREIGN EXCHANGE RATE VARIATIONS ON CASH ANDCASH EQUIVALENTS 127,080 64,461 (12,123) F - INITIAL BALANCE OF CASH AND CASH EQUIVALENTS 2,066,563 1,048,264 1,289,658
FINAL BALANCE OF CASH AND CASH EQUIVALENTS 5 4,408,316 2,236,118 1,048,264
F-7

Table of ContentsBANCO SANTANDER CHILE AND SUBSIDIARIES
NOTES TO THE CONSOLIDATED FINANCIAL STATEMENTSAS OF DECEMBER 31, 2009, 2008 AND JANUARY 1, 2008
NOTE 1 - SUMMARY OF SIGNIFICANT ACCOUNTING PRINCIPLES:
Corporate Information Banco Santander Chile (formerly Banco Santiago) is a corporation (sociedad anónima bancaria) organized under the laws of the Republic of Chile, that providesa broad range of general banking services to its customers, from individuals to major corporations. Banco Santander Chile and its affiliates (collectively referredto herein as the “Bank” or “Banco Santander Chile”) offer commercial and consumer banking services, and provide other services, including factoring,collection, leasing, securities and insurance brokerage, mutual and investment fund management, and investment banking. A Special Meeting of Shareholders of Banco Santiago was held on July 18, 2002, the minutes of which were notarized as a public deed on July 19, 2002 at theNotarial Office of Santiago before Notary Nancy de la Fuente Hernández, and it was agreed to merge Banco Santander Chile with Banco Santiago by mergingthe former into the latter, which acquired the former’s assets and liabilities. It was likewise agreed to dissolve Banco Santander Chile in advance and change thename of Banco Santiago to Banco Santander Chile. This change was authorized by Resolution No.79 of the Superintendency of Banks and Financial Institutions,adopted on July 26, 2002, published in the Official Journal on August 1, 2002 and registered on page 19,992 under number 16,346 for the year 2002 in theRegistry of Commerce of the Curator of Real Estate of Sa ntiago.
In addition to the amendments to the bylaws discussed above, the bylaws have been amended on multiple occasions, the last time at the Special ShareholdersMeeting of April 24, 2007, the minutes of which were notarized as a public deed on May 24, 2007 at the Notarial Office of Nancy de la Fuente Hernández. Thisamendment was approved pursuant to Resolution No.61 of June 6, 2007 of the Superintendency of Banks and Financial Institutions. An extract thereof and theresolution were published in the Official Journal of June 23, 2007 and registered in the Registry of Commerce for 2007 on page 24,064 under number 17,563 ofthe aforementioned Curator.
By means of this last amendment, Banco Santander Chile, pursuant to its bylaws and as approved by the Superintendency of Banks and Financial Institutions,may also use the names Banco Santander Santiago or Santander Santiago or Banco Santander or Santander.
a) Basis of preparation
These Consolidated Financial Statements have been prepared in accordance with the international financial reporting standards (IFRS) issued by the InternationalAccounting Standards Board (IASB).
The securities exchange regulator (“SVS”) announced in 2004 that all public companies will required to present full International Financial Reporting Standards(IFRS) financial statements beginning in 2009. The convergence from Chilean GAAP to IFRS will follow a gradual adoption plan which will take place over atleast a three-year period from 2009 to 2011, beginning with financial institutions in 2009. Full convergence is the intended goal of the transition to IFRS.However, due to the gradual approach to the adoption of the IFRS and because not all regulators require full IFRS, different accounting frameworks will coexistfor a period of time.
Chilean banks are subject to the regulatory supervision of the Superintendency of Banks and Financial Institutions (“SBIF”) under the provisions of the GeneralBanking Act (“Act”) of 1997. The Act establishes that in accordance with legal regulations, Chilean Banks must abide by the accounting standards stipulated bythe SBIF.
In the framework of the strategic plan, the SBIF, by means of Circular No. 3,410 (2007) and Circular No. 3,443 (2008) announced the “Compendium ofAccounting Standards”, which contains the new accounting standards and reporting formats for the financial industry required to be adopted by bankinginstitutions effective January 1, 2009. Banks are required to apply the new accounting and reporting to the current period financial statements (2009) and toretrospectively apply the new standard to January 1, 2008 and include an opening balance sheet for the reporting period ended December 31, 2008.
F-8

Table of ContentsBANCO SANTANDER CHILE AND SUBSIDIARIES
NOTES TO THE CONSOLIDATED FINANCIAL STATEMENTSAS OF DECEMBER 31, 2009, 2008 AND JANUARY 1, 2008
NOTE 1 – SUMMARY OF SIGNIFICANT ACCOUNTING POLICIES, continued:
Although banks are required to apply IFRS as of January 1, 2009, certain exceptions introduced by the regulator prevent the banks from achieving fullconvergence. In those situations which are not addressed by the guidance issued by the SBIF, institutions must follow the generally accepted accountingprinciples issued by the Association of Chilean Accountants which coincide with IFRS as issued by the International Accounting Standard Board (IASB).
Therefore, in order to comply with requirements of the Securities and Exchange Commission (SEC), the Bank has prepared its financial statements under IFRSas issued by the International Accounting Standard Board (IASB).
Santander’s transition date is January 1, 2008. The Bank prepared its opening balance under these standards as of such date. Consequently, the date of adoptionof the new standards by the Bank and its subsidiaries is January 1, 2009.
Note 2 to the financial statements, “First time adoption of International Financial Reporting Standards” submits a reconciliation between the balances of theConsolidated Statement of Financial Position at the opening and closing of the year ending as of December 31, 2008 and the corresponding ConsolidatedStatement of Income, Consolidated Statement of Comprehensive Income and Consolidated Statement of Cash Flows generated during such year and that,therefore, they are shown in the Bank’s financial statements as corresponding to fiscal year 2008; reason why the figures included in the attached financialstatements for the year 2008, differ from those reported in the previous fiscal year.
The Notes to the financial statements contain additional information to that submitted in the Consolidated Statement of Financial Position, ConsolidatedStatement of Income, Consolidated Statement of Comprehensive Income, Consolidated Statement of Changes in Equity and Consolidated Statement of CashFlows. These statements provide a narrative description of such statements in a clear, reliable and comparable manner.
The financial statements for the period ending as of December 31, 2009 were the first prepared according to the International Financial Reporting Standardsissued by IASB. This legislation incorporates the following important aspects:
- Significant changes in accounting policies, valuation criteria, and forms of presentation of financial statements.- A significant increase in the information included in the notes to the financial statements.
For purposes of these financial statements we use certain terms and conventions. References to “US$”, “U.S. dollars” and “dollars” are to United States dollars,references to “Chilean pesos,” “pesos” or “Ch$” are to Chilean pesos and references to “UF” are to Unidades de Fomento. The UF is an inflation-indexedChilean monetary unit with a value in Chilean pesos that changes daily to reflect changes in the official Consumer Price Index (“CPI”) of the Instituto Nacionalde Estadísticas (the Chilean National Institute of Statistics) for the previous month.
The UF is revalued in monthly cycles. Each day in the period beginning on the tenth day of the current month through the ninth day of the succeeding month, thenominal peso value of the UF is indexed up (or down in the event of deflation) in order to reflect a proportionate amount of the change in the Chilean ConsumerPrice Index during the prior calendar month. One UF equaled Ch$21,452.57 as of December 31, 2008 and Ch$20,942.88 as of December 31, 2009. In 2009, UFinflation was -2.4% compared to +9.3% in 2008. The effect of any changes in the nominal peso value of our U F-denominated interest earning assets and interestbearing liabilities is reflected in our results of operations as an increase (or decrease, in the event of deflation) in interest income and expense, respectively. The main accounting policies adopted in preparing these financial statements are described below.
b) Basis of consolidation for the Consolidated Financial Statements
The Consolidated Financial Statements include the preparation of separate (individual) financial statements of the Bank and the companies that participate in theconsolidation of December 31, 2009 and 2008 and January 1, 2008, and include the adjustments and reclassifications needed to make the accounting policies andvaluation criteria applied by the IFRS.
F-9

Table of ContentsBANCO SANTANDER CHILE AND SUBSIDIARIES
NOTES TO THE CONSOLIDATED FINANCIAL STATEMENTSAS OF DECEMBER 31, 2009, 2008 AND JANUARY 1, 2008
NOTE 1 – SUMMARY OF SIGNIFICANT ACCOUNTING POLICIES, continued:
Subsidiaries
“Subsidiaries” are defined as entities over which the Bank has the ability to exercise control, which is generally but not exclusively reflected by the direct orindirect ownership of at least 50% of the investee’s voting rights, or even if this percentage is lower or zero when the Bank is granted control pursuant toagreements with the investee’s shareholders. Control is understood as the power to significantly influence the investee’s financial and operating policies, so as toprofit from its activities.
The financial statements of the Subsidiaries are consolidated with those of the Bank through the global integration method (line by line). Accordingly, all thebalances and transactions between the consolidated companies are eliminated through the consolidation process.
In addition, third parties’ shares in the Consolidated Bank’s equity are presented as “Non controlling interests” in the Consolidated Statement of FinancialPosition. Their shares in the year’s income are presented under “Non controlling interests” in the Consolidated Statement of Income.
The following companies are considered “Affiliates associate entities” in which the Bank holds equity and accounts for it through the equity method:
Percentage Share As of December 31, As of December 31, As of January 1, 2009 2008 2008
Direct
% Indirect
% Total
% Direct
% Indirect
% Total
% Direct
% Indirect
% Total
% Santander Corredora de Seguros Limitada(formerly Santander Leasing S.A.) (*) 99.75 0.01 99.76 99.75 0.01 99.76 99.50 - 99.50 Santander S.A. Corredores de Bolsa 50.59 0.41 51.00 50.59 0.41 51.00 50.59 0.41 51.00 Santander Asset Management S.A.Administradora General de Fondos 99.96 0.02 99.98 99.96 0.02 99.98 99.96 0.02 99.98 Santander S.A. Agente de Valores 99.03 - 99.03 99.03 - 99.03 99.03 - 99.03 Santander S.A. Sociedad Securitizadora 99.64 - 99.64 99.64 - 99.64 99.64 - 99.64 Santander Servicios de Recaudación y PagosLimitada 99.90 0.10 100.00 99.90 0.10 100.00 99.90 0.10 100.00 Santander Corredora de Seguros Limitada(*) - - - - - - 99.99 - 99.99
(*)This Company was merged pursuant to Articles 9 and 10 of Law 18,045 and the dispositions IFRS 3 “Business Combinations”, at a Special Shareholders’Meeting of the Subsidiary Santander Corredora de Seguros S.A. held on October 1, 2008, at which the merger by absorption of the Subsidiary SantanderCorredora de Seguros Limitada by Santander Corredores de Seguros S.A. (formerly Santander Leasing S.A.) was approved. During 2008, Santander LeasingS.A. changed its corporate name to Santander Corredora de Seguros S.A. due to its subsequent merger with Santander Corredora de Seguros Limitada; itthereafter changed its corporate name again, ultimately becoming Santander Corredora de Seguros Limitada.
Affiliates entities
Associated entities are those entities over which the Bank may exercise significant influence but not control or joint control, usually because it holds 20% ormore of the entity’s voting power. Investments in associated entities are accounted for pursuant to the “equity method.”
The following companies are considered “Affiliates entities” in which the Bank accounts for its participation pursuant to the equity method:
Percentage of Interest
As ofDecember
31,
As ofDecember
31, As of
January 1, 2009 2008 2008 Redbank S.A. 33.42% 33.42% 33.42%Transbank S.A. 32.71% 32.71% 32.71%Centro de Compensación Automatizado 33.33% 33.33% 33.33%Sociedad Interbancaria de Depósito de Valores S.A. 29.28% 29.28% 29.28%Cámara Compensación de Alto Valor S.A. 11.52% 11.52% 11.52%Administrador Financiero del Transantiago S.A. 20.00% 20.00% 20.00%Sociedad Nexus S.A. 12.90% 12.90% 12.90%
F-10

Table of ContentsBANCO SANTANDER CHILE AND SUBSIDIARIES
NOTES TO THE CONSOLIDATED FINANCIAL STATEMENTSAS OF DECEMBER 31, 2009, 2008 AND JANUARY 1, 2008
NOTE 1 – SUMMARY OF SIGNIFICANT ACCOUNTING POLICIES, continued:
Special Purpose Entities
According to IFRS, the Bank must continuously analyze its perimeter of consolidation. The key criteria for such analysis is the degree of control held by theBank over a given entity, not the percentage of holding in such entity’s equity.
In particular, as set forth by International Accounting Standard 27 “Consolidated and Separate Financial Statements” (IAS 27) and by the StandardInterpretations Committee 12 “Consolidation — Special Purpose Entities” (SIC 12), issued by the IASB, the Bank must determine the existence of SpecialPurpose Entities (SPEs), which must be included in its perimeter of consolidation. The following are the main characteristics for SPEs that should be included inthe perimeter of consolidation:
· The SPEs’ activities have essentially been conducted on behalf of the company that presents the consolidated financial statements and in response to itsspecific business needs.
· The necessary decision making authority is held to obtain most of the benefits from these entities’ activities, as well as the rights to obtain most of thebenefits or other advantages from such entities.
· The entity essentially retains most of the risks inherent to the ownership or residuals of the SPEs or its assets, for the purpose of obtaining the benefitsfrom its activities.
This assessment is based on methods and procedures which consider the risks and profits retained by the Bank, for which all the relevant factors, including theguarantees furnished or the losses associated with collection of the related assets retained by the Bank, are taken into account. As a consequence of thisassessment, the Bank concluded that it exercised control over the following entities:
- Santander Gestión de Recaudación y Cobranza Limitada.- Multinegocios S.A.- Servicios Administrativos y Financieros Limitada.- Fiscalex Limitada.- Multiservicios de Negocios Limitada.- Bansa Santander S.A.
When the initial assessment was performed, Multimedios S.A. was considered into the perimeter of consolidation of the Bank because of its mainly source ofrevenues came from transactions with the Bank and, as a result, the Bank exercised control over it. At the beginning of 2009, this company changed its line ofbusiness and as a result its income no longer depended mainly on transactions with the Bank. Consequently, it was determined that the Bank no longer exercisedcontrol over it and therefore should be excluded from the perimeter of consolidation since March 2009.
Investments in other companies
Entities in which the Bank has no control or significant influence are presented in this category. These holdings are shown at purchase value (historical cost).
c) Non controlling interests
Non controlling interest represents the portion of earnings and losses and net assets which the Bank does not own, either directly or indirectly. It is presentedseparately in the Consolidated Statement of Income, and separately from shareholders equity in the Consolidated Statement of Financial Position.
In the case of Special Purpose Entities (SPEs), 100% of their Income and Equity is presented in non controlling interest, since the Bank only has control but notactual ownership thereof.
F-11

Table of Contents
BANCO SANTANDER CHILE AND SUBSIDIARIESNOTES TO THE CONSOLIDATED FINANCIAL STATEMENTS
AS OF DECEMBER 31, 2009, 2008 AND JANUARY 1, 2008
NOTE 1 – SUMMARY OF SIGNIFICANT ACCOUNTING POLICIES, continued:
d) Operating segments
The Bank discloses separate information for each operating segment that:
i. has been identified;ii. exceeds the quantitative thresholds stipulated for a segment.
Operating segments with similar economic characteristics often have a similar long-term financial performance. Two or more segments can be combined only ifaggregation is consistent with the basic principles of the International Financial Reporting Standards (IFRS) 8 and the segments have similar economiccharacteristics and are similar in each of the following respects:
i. the nature of the products and services; ii. the nature of the production processes; iii. the type or category of customers that use their products and services; iv. the methods used to distribute their products or services; and v. if applicable, the nature of the regulatory framework, for example, banking, insurance, or utilities.
The Bank reports separately on each operating segment that exceeds any of the following quantitative thresholds:
i. Its reported income, from both external customers and intersegment sales or transfers, is 10% or more of the combined internal and external income ofall the operating segments.
ii. The absolute value of its reported profit or loss is 10% or more, in absolute terms, of the greater of: (i) the combined reported profit of all the operatingsegments that did not report a loss; (ii) the combined reported loss of all the operating segments that reported a loss.
iii. Its assets represent 10% or more of the combined assets of all the operating segments.
F-12

Table of Contents
BANCO SANTANDER CHILE AND SUBSIDIARIESNOTES TO THE CONSOLIDATED FINANCIAL STATEMENTS
AS OF DECEMBER 31, 2009, 2008 AND JANUARY 1, 2008
NOTE 1 – SUMMARY OF SIGNIFICANT ACCOUNTING POLICIES, continued:
Operating segments that do not reach any of the quantitative thresholds may be treated as segments to be reported, in which case the information must bedisclosed separately if management believes it could be useful for the users of the financial statements.
Information on other business activities of the operating segments not separately reported is combined and disclosed in the “Other segments” category.
According to the information presented, the Bank’s segments were determined under the following definitions:
Operating segments: An operating segment is a component of an entity:
i. that engages in business activities from which it may earn revenues and incur expenses (including revenues and expenses from transactions withother components of the same entity);
ii. whose operating results are regularly reviewed by the entity’s chief executive officer to make decisions about resources allocated to the segment andassess its performance; and
iii. for which separate financial information is available.
e) Functional and presentation currency
According to International Accounting Standard No.21 (IAS 21), the Chilean peso, which is the currency of the primary economic environment in which theBank operates and the currency which influences its structure of costs and revenues, has been defined as the functional and presentation currency.
Accordingly, all the balances and transactions denominated in currencies other than the Chilean Peso are treated as “foreign currency.”
For presentation purposes we had translated million Chilean pesos (MCh$) into thousand US dollars (ThUS$) using the rate as indicated below, for theConsolidated Statement of Financial Position, Consolidated Statement of Income, Consolidated Statement of Comprehensive Income and for the ConsolidatedStatement of Cash Flow for the period ended as of December 31, 2009.
f) Foreign currency transactions
According to IAS 29 “Financial Reporting in Hyperinflationary Economies,” a price-level restatement is applicable only when the entity’s functional currency isa currency corresponding to a hyperinflationary economy (an economy with 100% inflation during a 3-year period). Since the Chilean economy does not fulfillthis requirement, it is not necessary for the Bank to use price-level restatement.
Furthermore, the Bank grants loans and accepts deposits in amounts denominated in foreign currencies, mainly the U.S. dollar. Assets and liabilities denominatedin foreign currencies and only held by the Bank are translated to Chilean pesos based on the market rate published by Reuters at 1:30 p.m. on the last businessday of every month; the rate used was Ch$507.25 per US$1 as of December 31, 2009 (Ch$641.25 per US$1 as of December 31, 2008 and Ch$497.78 per US$1as of January 1, 2008). The Subsidiaries record their foreign currency positions at the exchange rate reported by the Central Bank of Chile at the close ofoperations on the last business day of the month, amounting to Ch$507.10 per US$1 as of December 31, 2009 (Ch$636.45 per US$1 as of December 31, 2008and Ch$496.89 per US$1 as of January 1, 2008).
Since the use of these exchange rates does not create significant differences, these criteria have been kept in the consolidated financial statements.
The amounts of net foreign exchange profits and losses includes recognition of the effects that exchange rate variations have on assets and liabilitiesdenominated in foreign currencies and the profits and losses on foreign exchange spot and forward transactions undertaken by the Bank.
F-13

Table of ContentsBANCO SANTANDER CHILE AND SUBSIDIARIES
NOTES TO THE CONSOLIDATED FINANCIAL STATEMENTSAS OF DECEMBER 31, 2009, 2008 AND JANUARY 1, 2008
NOTE 1 – SUMMARY OF SIGNIFICANT ACCOUNTING POLICIES, continued:
g) Definitions and classification of financial instruments
i. Definitions
A “financial instrument” is any contract that gives rise to a financial asset of one entity, and simultaneously to a financial liability or equity instrument of anotherentity.
A “capital instrument” or “net equity instrument” is a legal transaction that evidences a residual interest in the assets of the entity which issues it after deductionof all its liabilities.
A “financial derivative” is a financial instrument whose value changes in response to the changes in an observable market variable (such as an interest rate, aforeign exchange rate, a financial instrument price, or a market index, including credit ratings), whose initial investment is very small compared with otherfinancial instruments having a similar response to changes in market factors, and which is generally settled at a future date.
“Hybrid financial instruments” are contracts that simultaneously include a non-derivative host contract together with a financial derivative, known as anembedded derivative, which is not separately transferable and has the effect that some of the cash flows of the hybrid contract vary in a way similar to a stand-alone derivative.
ii. Classification of financial assets for measurement purposes
The financial assets are initially classified into the various categories used for management and measurement purposes.
Financial assets are included for measurement purposes in one of the following categories:
- Portfolio of trading investments (at fair value with the changes recorded in the Consolidated Statement of Income): this category includes the financialassets acquired for the purpose of generating a profit in the short term from fluctuations in their prices. This category includes the portfolio of tradinginvestments and financial derivative contracts not designated as hedging instruments.
- Available-for-sale investment instrument portfolio: debt instruments not classified as “held-to-maturity investments,” “Credit investments (loans andaccounts receivable from customers or interbank loans)” or “Financial assets at fair value through profit or loss.” Available for sale investments areinitially recorded at cost, which includes transactional costs. Available-for-sale instruments are subsequently valued at their fair value, or based onappraisals made with the use of internal models when appropriate. Unrealized profits or losses stemming from changes of fair value are recorded as a debitor credit to equity accounts (“Valuation accounts”). When these investments are divested or become impaired, the adjustments to accumulated fair value inequity are transferred to the Consolidated Statement of Income under “Net income from financial operations.&# 8221;
- Held-to-maturity instrument portfolio: this category includes debt securities traded on an active market, with a fixed maturity, and with fixed ordeterminable payments, for which the Bank has both the intent and a proven ability to hold to maturity. Held to maturity investments are recorded at theircost plus interest earned, minus provisions for impairment established when their recorded value exceeds the estimated recoverable value.
F-14

Table of ContentsBANCO SANTANDER CHILE AND SUBSIDIARIES
NOTES TO THE CONSOLIDATED FINANCIAL STATEMENTSAS OF DECEMBER 31, 2009, 2008 AND JANUARY 1, 2008
NOTE 1 – SUMMARY OF SIGNIFICANT ACCOUNTING POLICIES, continued:
- Credit investments (loans and accounts receivable from customers or interbank loans): this category includes financing granted to third parties, based ontheir nature, regardless of the type of borrower and the form of financing. Includes loans and accounts receivable from customers, interbank loans, andfinancial lease transactions in which the consolidated entities act as lessors.
iii. Classification of financial assets for presentation purposes
Financial assets are classified by their nature into the following line items in the consolidated financial statements:
- Cash and deposits in banks: Cash balances, checking accounts and on-demand deposits with the Central Bank of Chile and other domestic and foreignfinancial institutions. Amounts placed in overnight transactions will continue to be reported in this line item and in the lines or items to which theycorrespond. If there is no special item for these transactions, they will be included with the related account as indicated above.
- Unsettled transactions: This item includes the values of swap instruments and balances of executed transactions which contractually defer the payment ofpurchase-sale transactions or the delivery of the foreign currency acquired.
- Trading investments: This item includes financial instruments intended to be traded and investments in mutual funds which must be adjusted to their fairvalue in the same way as instruments acquired for trading.
- Financial derivative contracts: Financial derivative contracts with positive fair values are presented in this item. It includes both independent contracts aswell as derivatives that should and can be separated from a host contract, whether they are for trading or hedging, as shown in Note 8 to the ConsolidatedFinancial Statements.
- Trading derivatives: Includes the fair value of derivatives which do not qualify for hedge accounting, including embedded derivatives separated fromhybrid financial instruments.
- Hedging derivatives: Includes the fair value of derivatives designated as hedging instruments in hedge accounting, including the embedded derivativesseparated from the hybrid financial instruments designated as hedging instruments in hedge accounting.
- Interbank loans: This item includes the balances of transactions with domestic and foreign banks, including the Central Bank of Chile, other than thosereflected in the preceding items.
- Loans and accounts receivable from customers: These loans are non-derivative financial assets for which fixed or determined amounts are charged, that arenot listed on an active market and which the Bank does not intend to sell immediately or in the short term. When the Bank is the lessor in a lease, and itsubstantially transfers the risks and benefits incidental to the leased asset, the transaction is presented in loans.
- Investment instruments: These are classified into two categories: held-to-maturity investments and available-for-sale instruments. The held-to-maturityinvestment category includes only those instruments for which the Bank has the ability and intent to hold them until their maturity. Other available for saleinvestments are treated as available for sale.
F-15

Table of Contents
BANCO SANTANDER CHILE AND SUBSIDIARIESNOTES TO THE CONSOLIDATED FINANCIAL STATEMENTS
AS OF DECEMBER 31, 2009, 2008 AND JANUARY 1, 2008
NOTE 1 – SUMMARY OF SIGNIFICANT ACCOUNTING POLICIES, continued:
Classification of financial liabilities for measurement purposes
Financial liabilities are initially classified into the various categories used for management and measurement purposes.
Financial liabilities are classified for measurement purposes into one of the following categories:
- Financial liabilities held for trading (at fair value through profit or loss): Financial liabilities issued to generate a short-term profit from fluctuations in theirprices, financial derivatives not deemed to qualify for hedge accounting and financial liabilities arising from definitive sales of financial assets purchasedunder resale agreements or borrowed (“short positions”).
- Financial liabilities at amortized cost: financial liabilities, regardless of their type and maturity, not included in any of the aforementioned categories whicharise from the borrowing activities of financial institutions, whatever their form and maturity.
Classification of financial liabilities for presentation purposes
Financial liabilities are classified by their nature into the following line items in the consolidated financial statements:
- Demand deposits and other demand obligations. This item includes all on-demand obligations except for term savings accounts, which are not consideredon-demand instruments in view of their special characteristics. Obligations whose payment may be required during the period are deemed to be on-demandobligations; i.e., operations which become callable the day after the closing date are not treated as on-demand obligations.
- Unsettled transactions: This item includes the balances of asset purchases that are not settled on the same day and for sales of foreign currencies notdelivered.
- Investments under repurchase agreements: This item includes the balances of sales of financial instruments under securities repurchase and loan agreements.
- Time deposits and other liabilities: This item shows the balances of deposit transactions in which a term at the end of which they become callable has beenstipulated.
- Financial derivative contracts: This item includes financial derivative contracts with negative fair values, whether they are for trading or for account hedgingpurposes, as set forth in Note 8.
- Trading derivatives: Includes the fair value of the financial derivatives which do not qualify for hedge accounting, including embedded derivativesseparated from hybrid financial instruments.
- Hedging derivatives: Includes the fair value of the derivatives designated as hedge accounting instruments, including embedded derivatives separatedfrom hybrid financial instruments and designated as hedge accounting instruments.
- Interbank borrowings: This item includes obligations due to other domestic banks, foreign banks, or the Central Bank of Chile, which were not classified inany of the previous categories.
- Debt instruments issued: This encompasses three items. They are obligations under letters of credit, subordinated bonds, and senior bonds.
- Other financial obligations: This item includes credit obligations to persons distinct from other domestic banks, foreign banks, or the Central Bank of Chile,for financing purposes or operations in the regular course of business.
F-16

Table of Contents
BANCO SANTANDER CHILE AND SUBSIDIARIESNOTES TO THE CONSOLIDATED FINANCIAL STATEMENTS
AS OF DECEMBER 31, 2009, 2008 AND JANUARY 1, 2008
NOTE 1 – SUMMARY OF SIGNIFICANT ACCOUNTING POLICIES, continued:
h) Valuation of financial assets and liabilities and recognition of fair value changes
In general, financial assets and liabilities are initially recorded at fair value which, in the absence of evidence to the contrary, is deemed to be the transactionprice. Financial instruments not measured at fair value based on profit or loss are adjusted by actual transaction costs. Thereafter, and at the end of eachaccounting period, they are valued pursuant to the following criteria:
i. Valuation of financial assets
Financial assets are valued according to their fair value, gross of any transaction costs that may be incurred for their sale, except for loans and accountsreceivable.
The “fair value” of a financial instrument on a given date is the amount for which it could be bought or sold on that date by two knowledgeable, willing parties inan arm’s length transaction, acting prudently. The most objective and common reference for the fair value of a financial instrument is the price that would be paidon an active, transparent, and deep market (“quoted price” or “market price”).
If there is no market price for a given financial instrument, its fair value is estimated based on the price established in recent transactions involving similarinstruments and, in the absence thereof, of valuation techniques commonly used by the international financial community, considering the specific features of theinstrument to be valued, and particularly, the various types of risk associated with it.
All derivatives are recorded in the Consolidated Statements of Financial Position at the fair value from their trade date. If their fair value is positive, they arerecorded as an asset, and if their fair value is negative, they are recorded as a liability. The fair value of the trade date is deemed, in the absence of evidence to thecontrary, to be the transaction price. The changes in the fair value of derivatives from the trade date are recorded in “Net income from financial operations” in theConsolidated Statement of Income. Specifically, the fair value of financial derivatives included in the portfolios of financial assets or liabilities held for trading is deemed to be their daily quotedprice and if, for exceptional reasons, the quoted price cannot be determined on a given date, these financial derivatives are measured using methods similar tothose used to measure over the counter (OTC) derivatives. The fair value of OTC derivatives is the sum of the future cash flows resulting from the instrument, discounted to present value at the date of valuation (“presentvalue” or “theoretical close”) using valuation techniques commonly used by the financial markets: “net present value” (NPV), option pricing models amongother methods.
“Loans and accounts receivable from customers” and “Held-to-maturity instrument portfolio” are measured at amortized cost using the “effective interestmethod.” “Amortized cost” is the acquisition cost of a financial asset or liability, plus or minus, as appropriate, by repayments of principal and the cumulativeamortization (recorded in the income statement) of the difference between the initial cost and the maturity amount. For financial assets, amortized cost alsoincludes any reductions for impairment or uncollectibility. For loans and accounts receivable hedged by fair value hedges, the changes in their fair value relatedto the risk or risks being hedged are recorded.
The “effective interest rate” is the discount rate that exactly matches the initial amount of a financial instrument to all its estimated cash flows over its remaininglife. For fixed-rate financial instruments, the effective interest rate coincides with the contractual interest rate established on the acquisition date plus, whereapplicable, the fees and transaction costs that, because of their nature, are a part of the financial return. For floating-rate financial instruments, the effectiveinterest rate coincides with the rate of return prevailing until the next benchmark interest reset date.
Equity instruments whose fair value cannot be determined in a sufficiently objective manner and financial derivatives that have those instruments as theirunderlying assets and are settled by delivery of those instruments are measured at acquisition cost, adjusted, where appropriate, by any related impairment loss.
F-17

Table of ContentsBANCO SANTANDER CHILE AND SUBSIDIARIES
NOTES TO THE CONSOLIDATED FINANCIAL STATEMENTSAS OF DECEMBER 31, 2009, 2008 AND JANUARY 1, 2008
NOTE 1 – SUMMARY OF SIGNIFICANT ACCOUNTING POLICIES, continued: The amounts at which the financial assets are recorded represent, in all material respects, the Bank’s maximum exposure to credit risk at each reporting date. TheBank has also received collateral and other credit enhancements to mitigate its exposure to credit risk, which consist mainly of mortgage guarantees, equityinstruments and personal securities, assets leased out under leasing and rental agreements, assets acquired under repurchase agreements, securities loans andderivatives.
ii. Valuation of financial liabilities
In general, financial liabilities are measured at amortized cost, as defined above, except for those included under financial liabilities designated as hedged items(or hedging instruments) in fair value hedges, which are measured at fair value.
iii. Valuation techniques
Financial instruments at fair value, determined on the basis of quotations in active markets, include government debt securities, private sector debt securities,shares, short positions, and fixed-income securities issued.
In cases where quotations cannot be observed, Management makes its best estimate of the price that the market would set using its own internal models. In mostcases, these models use data based on observable market parameters as significant inputs and, in very specific cases, they use significant inputs not observable inmarket data. Various techniques are employed to make these estimates, including the extrapolation of observable market data and extrapolation techniques.
The best evidence of the fair value of a financial instrument on initial recognition is the transaction price, unless the value of the instrument can be obtained fromother market transactions performed with the same or similar instruments or can be measured by using a valuation technique in which the variables used includeonly observable market date, mainly interest rates.
The main techniques used as of December 31, 2009 and 2008 by the Bank’s internal models to determine the fair value of the financial instruments are asfollows:
i. In the valuation of financial instruments permitting static hedging (mainly “forwards” and “swaps”), the “present value” method is used. Estimatedfuture cash flows are discounted using the interest rate curves of the related currencies. The interest rate curves are generally observable market data.
ii. In the valuation of financial instruments requiring dynamic hedging (mainly structured options and other structured instruments), the Black-Scholesmodel is normally used. Where appropriate, observable market inputs are used to obtain factors such as the bid-offer spread, exchange rates, volatility,correlation indexes and market liquidity.
iii. In the valuation of certain financial instruments exposed to interest rate risk, such as interest rate futures, caps and floors, the present value method(futures) and the Black-Scholes model (plain vanilla options) are used. The main inputs used in these models are observable market data, including therelated interest rate curves, volatilities, correlations and exchange rates.
The fair value of the financial instruments arising from the aforementioned internal models considers contractual terms and observable market data, whichinclude interest rates, credit risk, exchange rates, the quoted market price of raw materials and shares, volatility and prepayments, among other things. Thevaluation models are not significantly subjective, since these methodologies can be adjusted and evaluated, as appropriate, through the internal calculation of fairvalue and the subsequent comparison with the related actively traded price.
F-18

Table of Contents
BANCO SANTANDER CHILE AND SUBSIDIARIESNOTES TO THE CONSOLIDATED FINANCIAL STATEMENTS
AS OF DECEMBER 31, 2009, 2008 AND JANUARY 1, 2008
NOTE 1 – SUMMARY OF SIGNIFICANT ACCOUNTING POLICIES, continued:
iv. Recording results
As a general rule, changes in the carrying amount of financial assets and liabilities are recorded in the Consolidated Statement of Income, distinguishing betweenthose arising from the accrual of interest, which are recorded under interest income or interest expense as appropriate, and those arising for other reasons. Finallythey are recorded at their net amount under “Net income from financial operations”.
In the case of trading investments, the fair value adjustments, interest income, indexation adjustments, such as realized profits/losses from trading, are includedin the Consolidated Statement of Income under “Net income from financial operations.”
Adjustments due to changes in fair value from:
- “Available-for-sale instruments” are recorded as part of the Bank’s consolidated net equity (Other comprehensive income) until they are removed from theConsolidated Statements of Financial Position in which they originated, at which time they are recorded in the Consolidated Statement of Income.
- Items debited or credited to “Valuation adjustments” remain in the Bank’s consolidated net equity until the related assets are removed, whereupon they arecharged to the Consolidated Statement of Income.
v. Hedging transactions
The consolidated entities use financial derivatives for the following purposes: i) to sell to customers who request these instruments in the management of their market and credit risks, ii) to use these derivatives in the management of the risks of the Bank entities’ own positions and assets and liabilities (“hedging derivatives”), and iii) to obtain profits from changes in the price of these derivatives (“trading derivatives”).
All financial derivatives that do not qualify for hedge accounting are accounted for as “trading derivatives.”
A derivative qualifies for hedge accounting if all the following conditions are met:
1. The derivative hedges one of the following three types of exposure: a. Changes in the value of assets and liabilities due to fluctuations, among others, in the interest rate and/or exchange rate to which the position or
balance to be hedged is subject (“fair value hedge”); b. Changes in the estimated cash flows arising from financial assets and liabilities, commitments and highly probable forecasted transactions (“cash flow
hedge”); c. The net investment in a foreign operation (“hedge of a net investment in a foreign operation”).
2. It is effective in offsetting exposure inherent in the hedged item or position throughout the expected term of the hedge, which means that: a. At the date of arrangement the hedge is expected, under normal conditions, to be highly effective (“prospective effectiveness”). b. There is sufficient evidence that the hedge was actually effective during the life of the hedged item or position (“retrospective effectiveness”).
3. There must be adequate documentation evidencing the specific designation of the financial derivative to hedge certain balances or transactions and how thiseffective hedge was expected to be achieved and measured, provided that this is consistent with the Bank’s management of own risks.
F-19

Table of Contents
BANCO SANTANDER CHILE AND SUBSIDIARIESNOTES TO THE CONSOLIDATED FINANCIAL STATEMENTS
AS OF DECEMBER 31, 2009, 2008 AND JANUARY 1, 2008
NOTE 1 – SUMMARY OF SIGNIFICANT ACCOUNTING POLICIES, continued:
The changes in the value of financial instruments qualifying for hedge accounting are recorded as follows:
a. In fair value hedges, the profits or losses arising on both the hedging instruments and the hedged items (attributable to the type of risk being hedged) arerecorded directly in the Consolidated Statement of Income.
In fair value hedges of interest rate risk on a portfolio of financial instruments, the profits or losses that arise in measuring the hedging instruments arerecorded directly in the Consolidated Statement of Income, whereas the profits or losses due to changes in the fair value of the hedged amount (attributableto the hedged risk) are recorded in the Consolidated Statement of Income with an offset to “Net income from financial operations”.
b. In cash flow hedges, the effective portion of the change in value of the hedging instrument is recorded temporarily in Other comprehensive income under“Cash flow hedge” until the forecasted transaction occurs, thereafter being recorded in the Consolidated Statement of Income, unless the forecastedtransaction results in the recognition of non-financial assets or liabilities, in which case it is included in the cost of the non-financial asset or liability. Theineffective portion of the change in value of hedging derivatives is recorded directly in the Consolidated Statement of Income.
c. The differences in valuation of the hedging instrument corresponding to the ineffective portion of the cash flow hedging transactions are recorded directly inthe Consolidated Statement of Income under “Income from financial operations”.
If a derivative designated as a hedge no longer meets the requirements described above due to expiration, ineffectiveness or for any other reason, the derivative isclassified as a “trading derivative.” When “fair value hedge accounting” is discontinued, the adjustments previously recorded on the hedged item are attributed toincome using the effective interest rate method, recalculated at the date the hedge is discontinued. The adjustments are fully amortized at maturity.
When cash flow hedges are discontinued, any cumulative profit or loss of the hedging instrument recorded in Other comprehensive income under “Valuationadjustments” (from the period when the hedge was effective) remains recorded in equity until the hedged transaction occurs, at which time it is recorded in theConsolidated Statement of Income, unless the transaction is no longer expected to occur, in which case any cumulative profit or loss is recorded immediately inthe Consolidated Statement of Income.
vi. Derivatives embedded in hybrid financial instruments
Derivatives embedded in other financial instruments or in other host contracts are accounted for separately as derivatives if their risks and characteristics are notclosely related to those of the host contracts, provided that the host contracts are not classified as “Other financial assets (liabilities) at fair value through profit orloss” or as “Portfolio of trading investments.”
vii. Offsetting of financial instruments
Financial asset and liability balances are offset, i.e., reported in the Consolidated Statements of Financial Position at their net amount, only if the subsidiariescurrently have a legally enforceable right to offset the recorded amounts and intend either to settle them on a net basis or to realize the asset and settle theliability simultaneously.
viii. Removal of financial assets and liabilities from accounts
The accounting treatment of transfers of financial assets depends on the extent and the manner in which the risks and rewards associated with the transferredassets are transferred to third parties:
i. If the Bank transfers substantially all the risks and rewards to third parties, as in the case of unconditional sales of financial assets, sales under repurchaseagreements at fair value at the date of repurchase, sales of financial assets with a purchased call option or written put option deeply out of the money,utilization of assets in which the assignor does not retain subordinated debt nor grants any credit enhancement to the new holders, and other similar cases,the transferred financial asset is removed from the Consolidated < /font>Statements of Financial Position and any rights or obligations retained or createdin the transfer are simultaneously recorded.
F-20

Table of Contents
BANCO SANTANDER CHILE AND SUBSIDIARIESNOTES TO THE CONSOLIDATED FINANCIAL STATEMENTS
AS OF DECEMBER 31, 2009, 2008 AND JANUARY 1, 2008
NOTE 1 – SUMMARY OF SIGNIFICANT ACCOUNTING POLICIES, continued:
ii. If the Bank retains substantially all the risks and rewards associated with the transferred financial asset, as in the case of sales of financial assets underrepurchase agreements to repurchase at a fixed price or at the sale price plus interest, securities lending agreements under which the borrower undertakesto return the same or similar assets, and other similar cases, the transferred financial asset is not removed from the Consolidated Statements of FinancialPosition and con tinues to be measured by the same criteria as those used before the transfer. However, the following items are recorded:
1. An associated financial liability for an amount equal to the consideration received; this liability is subsequently measured at amortized cost.
2. Both the income from the transferred (but not removed) financial asset as well as any expenses incurred on the new financial liability.
iii. If the Bank neither transfers nor substantially retains all the risks and rewards associated with the transferred financial asset — as in the case of sales offinancial assets with a purchased call option or written put option that is not deeply in or out of the money, securitization of assets in which the transferorretains a subordinated debt or other type of credit enhancement for a portion of the transferred asset, and other similar cases — the following distinction ismade:
1. If the transferor does not retain control of the transferred financial asset, the asset is removed from the Consolidated Statements of Financial Positionand any rights or obligations retained or created in the transfer are recorded.
2. If the transferor retains control of the financial asset transferred, it continues to be recorded in the Consolidated Statements of Financial Position foran amount equal to its exposure to changes in value and a financial liability associated with the transferred financial asset is recorded. The netcarrying amount of the transferred asset and the associated liability is the amortized cost of the rights and obligations retained, if the transferred assetis measured at amortized cost, or the fair value of the rights and obligations retained, if the transferred asset is measured at fair value.
Accordingly, financial assets are only removed from the Consolidated Statements of Financial Position when the rights over the cash flows they generate haveterminated or when all the inherent risks and rewards have been substantially transferred to third parties. Similarly, financial liabilities are only removed from theConsolidated Statements of Financial Position when the obligations they generate have been terminated or when they are acquired with the intent to either cancelor resell them.
i) Recognizing income and expenses
The most significant criteria used by the Bank to recognize its revenues and expenses are summarized as follows:
i. Interest revenue, interest expense and similar items
Interest revenue and expense are recorded on an accrual basis using the effective interest method. Dividends received from other companies are recorded asrevenue when the consolidated entities’ right to receive them arises.
However, when a given operation or transaction is past due by 90 days or more, when it originated from a refinancing or renegotiation, or when the Bankbelieves that the debtor poses a high risk of default, the interest and adjustments pertaining to these transactions are not recorded directly in the ConsolidatedStatement of Income unless they have been actually received.
As interest and adjustments are generally referred to as “suspended” and are recorded in memorandum accounts which are part of the Consolidated Statements ofFinancial Position and are reported as part of the complementary information thereto (Note 28). This interest is recognized as income, when collected, as areversal of the related impairment losses.
Dividends received from companies classified as “Investments in other companies” are recorded as income when the right to receive them arises.
F-21

Table of Contents
BANCO SANTANDER CHILE AND SUBSIDIARIESNOTES TO THE CONSOLIDATED FINANCIAL STATEMENTS
AS OF DECEMBER 31, 2009, 2008 AND JANUARY 1, 2008
NOTE 1 – SUMMARY OF SIGNIFICANT ACCOUNTING POLICIES, continued:
ii.Commissions, fees, and similar items
Fee and commission income and expenses are recognized in the Consolidated Statement of Income using criteria that vary according to their nature. The maincriteria are:
- Fee and commission income and expenses relating to financial assets and financial liabilities measured at fair value through profit or loss are recognizedwhen paid.
- Those arising from transactions or services that are performed over a period of time are recognized over the life of these transactions or services.- Those relating to services provided in a single act are recognized when the single act is carried out.
iii. Non-finance income and expenses
These are recorded for accounting purposes on an accrual basis.
iv. Loan arrangement fees
Loan arrangement fees, mainly loan origination and application fees, are accrued and recorded in the Consolidated Statement of Income over the term of theloan.
j) Impairment
i. Financial assets:
A financial asset is evaluated on each financial statement filing date to determine whether objective evidence of impairment exists.
A financial asset or group of financial assets will be impaired if, and only if, objective evidence of impairment exists as a result of one or more events thatoccurred after initial recognition of the asset (“event causing the loss”), and this event or events causing the loss have an impact on the estimated future cashflows of a financial asset or group of financial assets that can be reliably estimated. It might not be possible to identify a single event that was the individualcause of the impairment.
An impairment loss relating to financial assets recorded at amortized cost is calculated as the difference between the recorded amount of the asset and the presentvalue of estimated cash flows, discounted at the effective interest rate.
An impairment loss relating to a financial asset available for sale is calculated based on its fair value.
Individually significant financial assets are individually tested to determine their impairment. The remaining financial assets are evaluated collectively in groupsthat share similar credit risk characteristics.
All impairment losses are recorded in income. Any cumulative loss relating to a financial asset available for sale previously recorded in equity is transferred toincome.
The reversal of an impairment loss occurs only if it can be objectively related to an event occurring after the initial impairment loss was recorded. In the case offinancial assets recorded at amortized cost and for the financial assets available for sale that are securities for sale, the reversal is recorded in income. In the caseof financial assets that are variable-rate securities, the reversal is directly recorded in equity.
F-22

Table of Contents
BANCO SANTANDER CHILE AND SUBSIDIARIESNOTES TO THE CONSOLIDATED FINANCIAL STATEMENTS
AS OF DECEMBER 31, 2009, 2008 AND JANUARY 1, 2008
NOTE 1 – SUMMARY OF SIGNIFICANT ACCOUNTING POLICIES, continued:
ii. Non-financial assets:
The Bank’s non-financial assets, excluding investment properties, are reviewed at each closing date to determine whether they show signs of impairment (i.e. itscarrying amount exceeds its recoverable amount). If such evidence exists, the amount to be recovered from the assets is then estimated.
In connection with other assets, impairment losses recorded in prior periods are assessed at each filing date in search of any indication that the loss has decreasedor disappeared and should be reversed. An impairment loss is reversed to the extent that it is not in excess of the cumulative impairment loss that has beenrecorded.
k) Property, plant and equipment
This category includes the amount of buildings, land, furniture, vehicles, computer hardware and other fixtures owned by the consolidated entities or acquiredunder finance leases. Assets are classified according to their use as follows:
i. Property, plant and equipment for own use
Property, plant and equipment for own use (including, among other things, tangible assets received by the consolidated entities in full or partial satisfaction offinancial assets representing accounts receivable from third parties which are intended to be held for continuing own use and tangible assets acquired underfinance leases) are presented at acquisition cost less the related accumulated depreciation and, if applicable, estimated losses resulting from comparing the netcarrying amount of each item with the related recoverable amount, which is calculated as the value in use of each asset.
For these purposes, the acquisition cost of awarded assets is equivalent to the net amount of the financial assets surrendered in exchange for its award.
Depreciation is calculated using the straight line method over the acquisition cost of assets minus their residual value, assuming that the land on which buildingsand other structures sit has an indefinite life and, therefore, is not subject to amortization.
The Bank must apply the following useful lives for the tangible assets that comprise its assets:
ITEM Useful Life
(Months) Land -Paintings and works of art -Assets retired for disposal -Carpets and curtains 36Computers and hardware 36Vehicles 36Computational systems and software 36ATM’s 60Machines and equipment in general 60Office furniture 60Telephone and communication systems 60Security systems 60Rights over telephone lines 60Air conditioning systems 84Installations in general 120Security systems (acquisitions since October 2002) 120Buildings 1,200
F-23

Table of ContentsBANCO SANTANDER CHILE AND SUBSIDIARIES
NOTES TO THE CONSOLIDATED FINANCIAL STATEMENTSAS OF DECEMBER 31, 2009, 2008 AND JANUARY 1, 2008
NOTE 1 – SUMMARY OF SIGNIFICANT ACCOUNTING POLICIES, continued:
The consolidated entities assess at the reporting date whether there is any indication that the carrying amount of any of their tangible assets’ exceeds itsrecoverable amount; if this is the case, the carrying amount of the asset is reduced to its recoverable amount and future amortization charges are adjusted inproportion to the revised carrying amount and to the new remaining useful life, if the useful life needs to be re-estimated.
Similarly, if there is an indication of a recovery in the value of a tangible asset, the consolidated entities record the reversal of the impairment loss recorded inprior periods and adjust the future amortization charges accordingly. In no circumstance may the reversal of an impairment loss on an asset increase its carryingvalue above the one it would have had if no impairment losses had been recorded in prior years.
The estimated useful lives of the items of property, plant and equipment held for own use are reviewed at least at the end of the reporting period to detectsignificant changes therein. If changes are detected, the useful lives of the assets are adjusted by correcting the amortization charge to be recorded in theConsolidated Statement of Income in future years on the basis of the new useful lives.
Maintenance expenses relating to tangible assets (property, plant and equipment) held for own use are recorded as an expense in the period in which they areincurred.
ii. Assets leased out under an operating lease
The criteria used to record the acquisition cost of assets leased out under operating leases, to calculate their depreciation and their respective estimated usefullives, and to record the impairment losses thereof, are consistent with those described in relation to property, plant and equipment held for own use.
l) Leasing
i. Finance leases
Finance leases are leases that substantially transfer all the risks and rewards incidental to ownership of the leased asset to the lessee.
When the consolidated entities act as the lessor of an asset, the sum of the present value of the lease payments receivable from the lessee plus the guaranteedresidual value, which is generally the exercise price of the lessee’s purchase option at the end of the lease term, is recorded as loans to third parties and istherefore included under “Loans and accounts receivable from customers” in the Consolidated Statements of Financial Position.
When the consolidated entities act as lessees, they show the cost of the leased assets in the Consolidated Statements of Financial Position based on the nature ofthe leased asset, and simultaneously record a liability for the same amount (which is the lower of the fair value of the leased asset and the sum of the presentvalue of the lease payments payable to the lessor plus, if appropriate, the exercise of the purchase option). The depreciation policy for these assets is consistentwith that for property, plant and equipment for own use.
In both cases, the finance revenues and finance expenses arising from these contracts is credited and debited, respectively, to “Interest income” and “Interestexpense” in the Consolidated Statement of Income so as to achieve a constant rate of return over the lease term.
F-24

Table of ContentsBANCO SANTANDER CHILE AND SUBSIDIARIES
NOTES TO THE CONSOLIDATED FINANCIAL STATEMENTSAS OF DECEMBER 31, 2009, 2008 AND JANUARY 1, 2008
NOTE 1 – SUMMARY OF SIGNIFICANT ACCOUNTING POLICIES, continued:
ii. Operating leases
In operating leases, ownership of the leased asset and substantially all the risks and rewards incidental thereto remain with the lessor.
When the consolidated entities act as the lessor, they present the acquisition cost of the leased assets under “PP&E” (property, plant and equipment). Thedepreciation policy for these assets is consistent with that for similar items of tangible assets (property, plant and equipment) held for own use and revenues fromoperating leases is recorded on a straight line basis under “Other operating income” in the Consolidated Statement of Income.
When the consolidated entities act as the lessees, the lease expenses, including any incentives granted by the lessor, are charged on a straight line basis to“Administrative and other expenses” in their Consolidated Statement of Income.
iii.Sale and leaseback transactions
For sale at fair value and operating leasebacks, the profit or loss generated is recorded at the time of sale. In the case of finance leasebacks, the profit or lossgenerated is amortized over the lease term.
m) Factored receivables
Factored receivables are valued at the amount disbursed by the Bank in exchange for invoices or other commercial instruments representing the credit which thetransferor assigns to the Bank. The price difference between the amounts disbursed and the actual face value of the credits is recorded as interest income in theConsolidated Statement of Income through the effective interest method over the financing period.
When the assignment of these instruments involves no liability for the assignor, the Bank assumes the risks of insolvency of the parties responsible for payment.
n) Intangible assets
Intangible assets are identified as non-monetary assets (separately identifiable from other assets) without physical substance which arise as a result of a legaltransaction (contractual terms) or are developed internally by the consolidated entities. They are assets whose cost can be estimated reliably and from which theconsolidated entities have control and consider it probable that future economic benefits will be generated.
Intangible assets are recorded initially at acquisition or production cost and are subsequently measured at cost less any accumulated amortization and anyaccumulated impairment losses.
Internally developed computer software
Internally developed computer software is recorded as an intangible asset if, among other requirements (basically the Bank’s ability to use or sell it), it can beidentified and its ability to generate future economic benefits can be demonstrated.
Expenditure on research activities is recorded as an expense in the year in which it is incurred and cannot be subsequently capitalized.
The estimate of useful life for software is 3 years.
F-25

Table of ContentsBANCO SANTANDER CHILE AND SUBSIDIARIES
NOTES TO THE CONSOLIDATED FINANCIAL STATEMENTSAS OF DECEMBER 31, 2009, 2008 AND JANUARY 1, 2008
NOTE 1 – SUMMARY OF SIGNIFICANT ACCOUNTING POLICIES, continued:
o) Cash and cash equivalents
For the preparation of the cash flow statement, the indirect method was used, beginning with the Bank’s consolidated pre-tax income and incorporating non-cashtransactions, as well as income and expenses associated with cash flows, which are classified as investment or financing activities.
For the preparation of the cash flow statement, the following items are considered: i. Cash flows: Inflows and outflows of cash and cash equivalents, such as deposits with the Central Bank of Chile, deposits in domestic banks, and
deposits in foreign banks. ii. Operational activities: Normal activities performed by banks and other activities that cannot be classified as investing or financing activities. iii. Investing activities: The acquisition, sale, or disposal by other means of long-term assets and other investments not included in cash and cash
equivalents. iv. Financing activities: Activities that result in changes in the size and composition of net assets and liabilities that are not part of operational activities or
investments.
p) Allowances for loan losses
The Bank records allowances for probable loan losses in accordance with its internal models. These models for rating and evaluating credit risk were approvedby the Bank’s Board of Directors.
According to the methodology developed by the Bank, loans are divided into three categories:
i. Consumer loans, ii. Mortgage loans, and iii. Commercial loans.
The specialization of the Santander Bank’s risk function is based on the type of customer and, accordingly, a distinction is made between individualizedcustomers that is individually evaluated and standardized customers, evaluated in groups in the risk management process.
The internal risk models used to calculate the allowances are described as follows:
Allowances for individual evaluations on commercial loans
For large commercial loans, leasing and factoring, the Bank assigns a risk category level to each borrower and his respective loans. The Bank considers thefollowing risk factors within the analysis: industry or sector of the borrower, owners or managers of the borrower, their financial situation, their paymentcapacity and payment behavior. The Bank assigns one of the following risk categories to each loan and borrower: i. Classifications A1, A2 and A3, correspond to borrowers with no apparent credit risk. ii. Classifications B, correspond to borrowers with some credit risk but no apparent deterioration of payment capacity. iii. Classifications C1, C2, C3, C4, D1 and D2 correspond to borrowers whose loans have deteriorated.
For loans classified as A1, A2, A3 and B, the Bank assigns a specific level of risk to each borrower and, therefore, amount of loan loss allowance is determinedon a case by case basis. All commercial loans for Companies, including leasing and factoring, have since been rated using a model for evaluating and calculatingprovisions on an individual basis. Since a debtor’s behavior varies over time, in order to determine the provisions, it is necessary to make a distinction betweennormal debtors and deteriorated debtors.
F-26

Table of ContentsBANCO SANTANDER CHILE AND SUBSIDIARIES
NOTES TO THE CONSOLIDATED FINANCIAL STATEMENTSAS OF DECEMBER 31, 2009, 2008 AND JANUARY 1, 2008
NOTE 1 – SUMMARY OF SIGNIFICANT ACCOUNTING POLICIES, continued:
For loans classified in Categories C1, C2, C3, C4, D1, and D2, the Bank must maintain the following levels of reserves:
Classification Estimated range of loss Allowance
C1 Up to 3% 2%C2 More than 3% and up to 19% 10%C3 More than 19% and up to 29% 25%C4 More than 29% and up to 49% 40%D1 More than 49% and up to 79% 65%D2 More than 79% 90%
Borrowers with insufficient payment capacity in foreseeable circumstances are classified under these categories. The categories listed above relate to aclassification based on the level of expected loss of commercial loans and leasing transactions of the customer’s business as a whole, quantified according to themethodology used by the Bank.
For purposes of determining allowances amount, the percentage associated with the estimated loss rate is applied to the total credit.
Allowances for group evaluations
Banco Santander Chile uses group analysis for determining the provisioning levels for certain types of loans. These models are intended to be used primarily toanalyze loans to individuals (including consumer loans, lines of credit, mortgage loans and commercial loans to individuals) and commercial loans, primarily tosmall and some mid-sized companies. Provisions are determined using these models to determine a historical loss rate by segment and risk profile of each groupof clients.The provisioning models for consumer loans segments these loans in four groups, each with its own model:
· New clients, not renegotiated · Old clients, not renegotiated · New clients, renegotiated · Old clients, renegotiated
Each consumer model is segmented by risk profile which is based on a scorecard statistical model that establishes a relation through regressions between variousvariables, such as payment behavior in the Bank, payment behavior outside the Bank, various socio-demographic data, among others, and a response variablethat determines a client’s risk level, which in this case is 90 days non-performance. Once the scorecards have been determined, risk profiles are established thatare statistically significant with similar expected loss levels or charge-off vintage.
The expected loss rates for consumer loans are defined by the “Vintage of Net Charge-Offs” (charge-offs net of recoveries). This methodology establishes theperiod in which the expected loss is maximized. Once this period is obtained its is applied to each risk profile of each model to obtain the net charge-off levelassociated with this period.
For group evaluation of commercial loans the industry or sector of the borrower, owners or managers of the borrower, the borrower’s financial situation, itspayment capacity and payment behavior are used as the main variables for determining the risk profile. For group evaluation of mortgage loans we consider theborrower’s credit history, including any defaults on obligations to other creditors, as well as the overdue periods on the loans borrowed from us. The expectedloss rates are then determined using historical averages and other statistical estimates depending on the segment and loan product.
F-27

Table of ContentsBANCO SANTANDER CHILE AND SUBSIDIARIES
NOTES TO THE CONSOLIDATED FINANCIAL STATEMENTSAS OF DECEMBER 31, 2009, 2008 AND JANUARY 1, 2008
NOTE 1 – SUMMARY OF SIGNIFICANT ACCOUNTING POLICIES, continued:
q) Provisions, contingent assets and contingent liabilities
Provisions are liabilities in which uncertainty exists as to their amount or maturity. Provisions are recorded in the Consolidated Statements of Financial Positionwhen the following requirements are simultaneously met:
i. It is a present liability as a result of past events; and ii. As of the date of the financial statements it is likely that the Bank will have to expend resources to settle these obligations and the amount of these
resources can be reliably measured.
Contingent assets or contingent liabilities are any possible rights or possible obligations arising from past events whose existence will be confirmed only if oneor more uncertain future events that are not under the Bank’s control occur.
The following are classified as contingent in the complementary information:
i. Guarantees and bonds: Guarantees, bonds, and standby letters of credit. In addition, guarantees of payment from buyers in factored receivables.
ii. Confirmed foreign letters of credits: Letters of credit confirmed by the Bank.
iii. Documentary letters of credit: Includes documentary letters of credit issued by the Bank, which have not yet been negotiated.
iv. Documented guarantees: Guarantees with promissory notes.
v. Interbank guarantees: Guarantees issued.
vi. Unrestricted credit lines: The unused amount of credit lines that allow customers to draw without prior approval by the Bank (for example, using creditcards or overdrafts in checking accounts).
vii. Other credit commitments: Amounts not yet lent under committed loans, which must be disbursed at an agreed future date when events contractuallyagreed upon with the customer occur, such as in the case of lines of credit linked to the progress of a construction or similar projects.
viii. Other contingent credits: Includes any other kind of commitment by the Bank which may exist and give rise to lending when certain future events occur.In general, this includes unusual transactions such as pledges made to secure the payment of loans among third parties or derivative contracts made bythird parties that may result in a payment obligation and are not covered by deposits.
The consolidated annual accounts reflect all significant provisions for which it is estimated that the probability of having to meet the obligation is more likelythan not.
Provisions (which are quantified using the best available information on the consequences of the event and are re-estimated at each accounting close) are used toaddress the specific liabilities for which they were originally recorded. Partial or total reversals are recorded when such liabilities cease to exist or decrease.
Provisions are classified according to the liabilities they cover as follows:
- Provisions for personnel salaries and expenses. - Provisions for mandatory dividends. - Provisions for contingent credit risks. - Provisions for contingencies.
F-28

Table of ContentsBANCO SANTANDER CHILE AND SUBSIDIARIES
NOTES TO THE CONSOLIDATED FINANCIAL STATEMENTSAS OF DECEMBER 31, 2009, 2008 AND JANUARY 1, 2008
NOTE 1 – SUMMARY OF SIGNIFICANT ACCOUNTING POLICIES, continued:
r) Deferred income taxes and other deferred taxes
The Bank records, when appropriate, deferred tax assets and liabilities for the estimated future tax effects attributable to differences between the carrying amountof assets and liabilities and their tax bases. The measurement of deferred tax assets and liabilities is based on the tax rate, according to the applicable tax laws,using the tax rate that applies to the period when the deferred asset and liability is settled. The future effects of changes in tax legislation or tax rates arerecorded in deferred taxes beginning on the date on which the law approving such changes is published.
As of December 31, 2009 and 2008, the bank has recognized deferred tax assets; as management has determined that it is probable that taxable profits will beavailable against which the temporary differences of tax losses can be utilized at the end of each reporting period.
The effects of deferred taxes because of temporary differences between the tax basis and the carrying amount balances are recorded on an accrual basis,according to IAS 12.
s) Use of estimates
The preparation of the financial statements requires Management to make estimates and assumptions that affect the application of the accounting policies and thereported amounts of assets, liabilities, revenues and expenses. Actual results may diverge from these estimates.
In certain cases, generally accepted accounting principles require that assets or liabilities be recorded or disclosed at their fair values. The fair value is the amountat which an asset could be bought or sold, or in the case of a liability, could be incurred or settled, in a current transaction between willing parties instead of aforced settlement or sale. Where available, quoted market prices in active markets have been used as the basis for measurement. Where quoted market prices inactive markets are not available, the Bank has estimated such values based on the best information available, including the use of modeling and other valuationtechniques.
The Bank has established allowances to cover possible losses in accordance with regulations issued by the Superintendency of Banks and Financial Institutions.These regulations require that, to estimate the allowances, they must be regularly evaluated taking into consideration factors such as changes in the nature andvolume of the loan portfolio, trends in forecasted portfolio quality, credit quality and economic conditions that may adversely affect the borrowers’ ability to pay.Increases in the allowances for loan losses are reflected as “Provisions for loan losses” in the Consolidated Statement of Income. Loans are charged-off whenmanagement determines that a loan or a portion thereof is uncollectible. Charge-offs are recorded as a reduc tion of the provisions for loan losses.
The relevant estimates and assumptions are regularly reviewed by the Bank’s Management to quantify certain assets, liabilities, revenues, expenses, andcommitments. Revised accounting estimates are recorded in the period in which the estimate is revised and in any affected future period.
These estimates, made on the basis of the best available information, chiefly refer to:
- Losses for impairment of certain assets (Notes 09, 10, 22, and 12) - The useful lives of tangible and intangible assets (Notes 14, 15, and 35) - The fair value of assets and liabilities (Notes 06, 08, 12, and 38) - Commitments and contingencies (Note 24) - Current and deferred taxes (Note 16)
F-29

Table of ContentsBANCO SANTANDER CHILE AND SUBSIDIARIES
NOTES TO THE CONSOLIDATED FINANCIAL STATEMENTSAS OF DECEMBER 31, 2009, 2008 AND JANUARY 1, 2008
NOTE 1 – SUMMARY OF SIGNIFICANT ACCOUNTING POLICIES, continued:
t) Non-current assets held for sale
Non-current assets (or a group which includes assets and liabilities for disposal) expected to be recovered mainly through sales rather than through continueduse, are classified as held for sale. Immediately prior to this classification, assets (or elements of a disposable group) are re-measured in accordance with theBank’s policies. The assets (or disposal group) are measured at the lower of book value or fair value minus cost of sale.
Any impairment loss on disposal is first allocated to goodwill and then to the remaining assets and liabilities on a pro rata basis, except when no losses have beenrecorded in financial assets, deferred assets, employee benefit plan assets, and investment property, which are still evaluated according to the Bank’s accountingpolicies. Impairment losses on the initial classification of held-for-sale assets and profits and losses from the revaluation are recorded in income. Profits are notrecorded if they outweigh any cumulative loss.
As of December 31, 2009 and 2008, the Bank has not classified any non-current assets as held for sale.
Assets received or awarded in lieu of payment
Assets received or awarded in lieu of payment of loans and accounts receivable from customers are recorded, in the case of assets received in lieu of payment, atthe price agreed by the parties, or otherwise, when the parties do not reach an agreement, at the amount at which the Bank is awarded those assets at a judicialauction.
These assets are subsequently valued at the lower of initially recorded value or net realizable value, which corresponds to their fair value (liquidity valuedetermined through an independent appraisal) minus the cost of sales associated therewith.
According to the studies conducted by the Bank, as of December 31, 2009 the average cost of sale (the cost of maintaining and divesting the asset) was estimatedat 5.9% of the appraisal value; as of December 31, 2008 that average value was 6.5%, and as of January 1, 2008 it was 5.8%.
u) Earnings per share
Basic earnings per share are determined by dividing the net income attributable to the Bank shareholders in a period by the weighted average number of sharesoutstanding during the period.
Diluted earnings per share are determined in the same way as Basic Earnings, but the weighted average number of outstanding shares is adjusted to take intoaccount the potential diluting effect of stock options, warrants, and convertible debt.
As of December 31, 2009 and 2008 the Bank did not have instruments that generated diluting effects on shareholders’ equity.
F-30

Table of ContentsBANCO SANTANDER CHILE AND SUBSIDIARIES
NOTES TO THE CONSOLIDATED FINANCIAL STATEMENTSAS OF DECEMBER 31, 2009, 2008 AND JANUARY 1, 2008
NOTE 1 – SUMMARY OF SIGNIFICANT ACCOUNTING POLICIES, continued:
v) Temporary acquisition (assignment) of assets
Purchases (sales) of financial assets under non-optional resale (repurchase) agreements at a fixed price (“repos”) are recorded in the Consolidated Statements ofFinancial Position financial assignments (receipts) based on the nature of the debtor (creditor) under “Deposits in the Central Bank of Chile,” “Deposits infinancial institutions” or “Loans and accounts receivable from customers” (“Central Bank of Chile deposits,” “Deposits from financial institutions” or “Customerdeposits”).
Differences between the purchase and sale prices are recorded as financial interest over the term of the contract.
w) Assets under management and investment funds managed by the Bank
The assets managed by the different companies that are within the Bank’s perimeter of consolidation (Santander Asset Management S.A., AdministradoraGeneral de Fondos and Santander S.A. Sociedad Securitizadora), which are the property of third parties are not included in the Consolidated Statements ofFinancial Position. The relevant management fees are included in “Fee and commission income” in the Consolidated Statement of Income.
x) Provision for mandatory dividends
As of December 31, 2009 and 2008 the Bank recorded a provision for mandatory dividends. This provision is made pursuant to Article 79 of the CorporationsAct, which is in accordance with the Bank’s internal policy, pursuant to which at least 30% of net income for the period is distributed, except in the case of acontrary resolution adopted at the respective shareholders’ meeting by unanimous vote of the outstanding shares. This provision is recorded, as a deducting item,under the “Retained earnings – Provisions for mandatory dividends” line of the Consolidated Statement of Financial Position.
y) Personnel benefits
i. Defined benefit plans:
The Bank records under the “Provisions” line in the Consolidated Statements of Financial Position (or in assets under “Other assets,” depending on the sign ofthe difference) the present value of its post-employment defined benefit obligations, net of the fair value of the “plan assets” and of the unrecorded accumulatednet actuarial profits and/or losses, revealed in the valuation of these commitments which are deferred by virtue of the treatment of the so-called “fluctuationband,” and of the “Cost for past services”, the recognition of which is deferred in time as explained below.
“Plan assets” are deemed to be those with which the obligations will be settled and which meet the following requirements:
- They are not the property of the consolidated entities, but that of legally separate third parties that are not related to the Bank.
- They are available only to pay or fund post-employment benefits and cannot return to the consolidated entities except when the assets remaining in the planare sufficient to fulfill all the obligations of the plan or the entity in relation to the benefits due current or past employees or to reimburse employee benefitspreviously paid by the Bank.
If the Bank can demand that the insurance companies pay a part or all of the disbursement required to settle a defined benefit obligation, it being practicallycertain that said insurer will reimburse any or all of the disbursements required to pay off that obligation, but the insurance policy does not fulfill therequirements to be a plan asset, the Bank records its right to reimbursement in assets of the Consolidated Statements of Financial Position under “Other assets,”which is treated as a plan asset in all other respects.
These benefits plans, which are registered according to IAS 19 “Employee benefits”, are not significant for the financial statements.
F-31

Table of ContentsBANCO SANTANDER CHILE AND SUBSIDIARIES
NOTES TO THE CONSOLIDATED FINANCIAL STATEMENTSAS OF DECEMBER 31, 2009, 2008 AND JANUARY 1, 2008
NOTE 1 – SUMMARY OF SIGNIFICANT ACCOUNTING POLICIES, continued:
Actuarial profits and losses are deemed to be those arising from the differences between previous actuarial assumptions and changes in actual fact, and changesin the actuarial assumptions used. For the plans, the Bank applies the “fluctuation band” criterion, whereby it records the amount determined by dividing by fivethe higher of the net value of the accumulated actuarial profits and/or losses not recorded at the beginning of each period and exceeding 10% of the current valueof the obligations or 10% of the fair value of the assets at the beginning of the period in the Consolidated Statement of Income.
“Cost of past services” — which is originated by changes made to existing post-retirement benefits or the introduction of new benefits — is recorded in theConsolidated Statement of Income on a straight line basis over the period beginning on the date on which the new commitments arose to the date on which theemployee has an irrevocable right to receive the new benefits.
Post-employment benefits are recorded in the Consolidated Statement of Income as follows:
- The cost of services for the current period (understood as the increase in the current value of the obligations arising as a consequence of the servicesprovided by the employees during the period) under the “Personnel expenses” item.
- The interest expense (understood as the increase in current value of the obligations as a consequence of the passage of time which occurs during the period).When the obligations are shown in liabilities in the Consolidated Statements of Financial Position net of the plan assets, the cost of the liabilities which arerecorded in the Consolidated Statement of Income reflects exclusively the obligations recorded in liabilities.
- The expected return on assets allocated to hedge the commitments and the profits and losses in their value, minus any cost arising from their managementand the taxes to which they are subject.
- Amortization of the actuarial profits and losses in the application of the “fluctuation band” treatment and in the unrecorded past cost of services. Theactuarial gains and losses calculated using the corridor approach and the unrecognized past service cost, are registered under “Personnel salaries andexpenses” in the consolidated statement of income.
ii. Seniority compensation:
Seniority compensation for years of employment are recorded only when they actually occur or upon the availability of a formal and detailed plan in which thefundamental modifications to be made are identified, provided that such plan has already started to be implemented or its principal features have been publiclyannounced, or objective facts about its execution are known.
iii. Share-based compensation:
The allocation of equity instruments to executives of the Bank and its Subsidiaries as a form of compensation for their services, when those instruments areprovided at the end of a specific period of employment, is recorded as an expense in the Consolidated Statement of Income under the “Personnel expenses” item,as the relevant executives provide their services over the course of the period.
These benefits do not generate diluting effects, since they are based on shares of Banco Santander S.A. (the parent company of Banco Santander Chile,headquartered in Spain).
F-32

Table of ContentsBANCO SANTANDER CHILE AND SUBSIDIARIES
NOTES TO THE CONSOLIDATED FINANCIAL STATEMENTSAS OF DECEMBER 31, 2009, 2008 AND JANUARY 1, 2008
NOTE 1 – SUMMARY OF SIGNIFICANT ACCOUNTING POLICIES, continued:
z) Consolidated Statement of Changes in Equity
The Consolidated Statement of Changes in Equity presents all the changes occurring in net equity, including those produced by changes in accounting criteriaand the correction of errors. Accordingly, this statement provides a reconciliation of book value at the beginning and end of the period for all items inconsolidated net equity, grouping the changes into the following items based on their nature: i. Adjustments for changes in accounting criteria and the correction of errors: includes the changes in consolidated net equity arising as a consequence of
the retroactive restatement of the financial statement balances as a consequence of changes in the accounting criteria or in the correction of errors.
ii. Revenues and expenses recorded in the period: reflects, in aggregate form, all the items recorded in the Consolidated Statement of Income indicatedabove.
aa) Consolidated Statement of Comprehensive Income
This represents the income and expenses generated by the Bank as a result of its business activity in the period, separately disclosing the income and expensesrecorded in the Consolidated Statement of Income for the period and the other income and expenses recorded directly in consolidated equity.
Accordingly, this statement presents:
i. Consolidated income for the period. ii. The net amount of the income and expenses temporarily recorded in consolidated equity under valuation adjustments. iii. The net amount of income and expenses permanently recorded in consolidated equity. iv. The income tax incurred from the items indicated in b) and c), above, except for valuation adjustments arising from investments in associated or multi-group
companies accounted by using the equity method, which are presented net. v. Total consolidated income and expenses recorded, calculated as the sum of the above items, presenting separately the amount attributable to the Bank
shareholders and the amounts relating to minority interests.
F-33

Table of ContentsBANCO SANTANDER CHILE AND SUBSIDIARIES
NOTES TO THE CONSOLIDATED FINANCIAL STATEMENTSAS OF DECEMBER 31, 2009, 2008 AND JANUARY 1, 2008
NOTE 1 – SUMMARY OF SIGNIFICANT ACCOUNTING POLICIES, continued:
ab) New accounting pronouncements
As of the date of issuance of these consolidated financial statements, the following accounting pronouncements have been issued by the IASB, although theirapplication is not mandatory.
Revision of IFRS 3, Business Combinations and Amendment to IAS 27, Consolidated and Separate Financial Statements (obligatory for yearsbeginning on or after July 1, 2009): introduce significant changes in several matters relating to accounting for business combinations. These changes includemost notably the following: acquisition costs must be expensed, rather than recognized as an increase in the cost of the business combination; in step acquisitionsthe acquirer must remeasure at fair value the investment held prior to the date that control is obtained; and there is an option to measure at fair value the non-controlling interests of the acquire, as opposed to the single current treatment of measuring them as th e proportionate share of the fair value of the net assetsacquired. Since the standard will be applied prospectively, and is applicable from January 1, 2010, in general the directors do not expect it to have a significanteffect on the business combinations performed.
Amendment to IAS 39, Eligible Hedged Items (obligatory for years beginning on or after July 1, 2009): this amendment establishes that inflation may onlybe designated as a hedged item if it is a contractually specified portion of the cash flows to be hedged. Only the intrinsic value and not the time value of apurchased option may be used as a hedging instrument.
Amendment to IAS 32, Classification of Rights Issues (obligatory for years beginning on or after February 1, 2010): this amendment relates to theclassification of foreign currency denominated rights issues (rights, options or warrants). Pursuant to this amendment, when these rights are to acquire a fixednumber of shares in exchange for a fixed amount, they are equity instruments, irrespective of the currency in which that fixed amount is denominated andprovided that other requirements of the standard are fulfilled.
IFRIC 12, Service Concession Arrangements (obligatory following its adoption for years beginning on or after April 1, 2009): owing to the nature of thisinterpretation, its application does not affect the consolidated financial statements.
IFRIC 17, Distributions of Non-cash Assets to Owners (obligatory for years beginning on or after July 1, 2009): this interpretation addresses theaccounting treatment of the distribution of non-cash assets to owners (dividends payable), although its scope does not include distributions of assets within agroup or between entities under common control. The interpretation requires an entity to measure such liabilities at the fair value of the asset to be distributedand to recognize any difference between the carrying amount of the dividend payable and the carrying amount of the asset distributed in profit or loss.
IFRIC 18, Transfers of Assets from Customers (obligatory for years beginning on or after July 1, 2009): this interpretation clarifies the requirements foragreements in which an entity receives from customers items of property, plant or equipment (or cash to construct such items) that must be used to connect thosecustomers to a network (e.g. electricity, gas or water supply).
At the date of preparation of these consolidated financial statements, the following standards and interpretations had not yet been adopted by the EuropeanUnion:
Revision of IAS 24, Related Party Disclosures: the revised IAS 24 addresses related party disclosures in financial statements. There are two new basic features.Firstly, it provides a partial exemption from certain disclosure requirements when the transactions are between State-controlled entities or government-relatedentities (or equivalent government institution) and, secondly, it simplifies the definition of a related party, clarifying its intended meaning and eliminatinginconsistencies from the definition.
Amendments to IFRIC 14, Prepayments of a Minimum Funding Requirement: these amendments remedy the fact that in some circumstances entities couldnot recognize certain voluntary prepayments as assets.
F-34

Table of ContentsBANCO SANTANDER CHILE AND SUBSIDIARIES
NOTES TO THE CONSOLIDATED FINANCIAL STATEMENTSAS OF DECEMBER 31, 2009, 2008 AND JANUARY 1, 2008
NOTE 1 – SUMMARY OF SIGNIFICANT ACCOUNTING POLICIES, continued:
IFRIC 19, Extinguishing Financial Liabilities with Equity Instruments: this interpretation addresses the accounting by a debtor when all or part of afinancial liability is extinguished through the issue of equity instruments to the creditor. The interpretation does not apply to transactions in situations where thecounterparties in question are shareholders or related parties, acting in their capacity as such, or where extinguishing the financial liability by issuing equityinstruments is in accordance with the original terms of the financial liability. In this case, the equity instruments issued are measured at fair value at the date theliability is extinguished and any difference between this value and the carrying amount of the liability is recognized in profit or loss.
F-35

Table of ContentsBANCO SANTANDER CHILE AND SUBSIDIARIES
NOTES TO THE CONSOLIDATED FINANCIAL STATEMENTSAS OF DECEMBER 31, 2009, 2008 AND JANUARY 1, 2008
NOTE 2 – FIRST TIME ADOPTION OF INTERNATIONAL FINANCIAL REPORTING STANDARDS:
Prior to 2008, the Group issued its consolidated financial statements in accordance with Generally Accepted Accounting Principles in Chile (hereinafter“Chilean GAAP”). Beginning in 2009, the Group issues its consolidated financial statements in accordance with International Financial Reporting Standards(hereinafter “IFRS”).
The figures included in these consolidated financial statements for the 2008 period have been reconciled in order to present them using the same principles andcriteria applied in 2009.
As a result of the application of these new accounting regulations, the Bank adopted a plan for the transition to the IFRS that includes, among other things, ananalysis of the differences in accounting criteria, the selection of the accounting criteria to be applied in the cases in which alternative treatments are permitted,and the evaluation of the changes of procedure and information systems.
Below is a detail and explanation of the principal impacts of the “First Time Adoption of IFRS” on the Consolidated Statements of Financial Position and theConsolidated Statement of Income.
F-36

Table of Contents
BANCO SANTANDER CHILE AND SUBSIDIARIES
NOTES TO THE CONSOLIDATED FINANCIAL STATEMENTSAS OF DECEMBER 31, 2009, 2008 AND JANUARY 1, 2008
NOTE 2 – FIRST TIME ADOPTION OF INTERNATIONAL FINANCIAL REPORTING STANDARDS. continued:
a) Reconciliation of Equity under Chilean GAAP to Equity under IFRS
The principal adjustments in Equity arising from the application of the IFRS are: Total Equity
As ofJanuary 1,
2008
As ofDecember31, 2008
Explanation
(*) MCh$ MCh$ Equity before changes in standards 1,458,089 1,602,610 Adjustments:
Perimeter of consolidation i (1,689) 1,664 Associated entities ii 506 719 Price-level restatement iii - (30,493)Property, plant and equipment and intangible assets iv (64,494) (58,613)Assets received in lieu of payment v 2,999 2,489 Charge-offs of loans vi (2,205) (4,235)Deferred taxes vii 10,751 14,884 Other adjustments viii (12,765) (11,376)
Subtotals (66,897) (84,961) Equity according to IFRS 1,391,192 1,517,649
(*) A detailed explanation of the nature of the principal adjustments is given in letter f).
b) Reconciliation of Consolidated Income under Chilean GAAP to Consolidated Income under IFRS
The principal adjustments in Consolidated Income arising from the application of IFRS are the following:
Consolidated
Income Explanation 2008 (*) MCh$ Income before changes in standards 331,017 Adjustments:
Perimeter of consolidation i 3,353 Associated entities ii 213 Price-level restatement iii 78,027 Property, plant and equipment and intangible assets iv 5,881 Assets given or awarded lieu of payment v 2,742 Charge-offs of loans vi (2,030)Deferred taxes vii 4,281 Other adjustments viii 1,389
Subtotals 93,856 Income according to IFRS 424,873
(*) A detailed explanation of the nature of the principal adjustments is given in letter f).
As discussed above, these adjustments are generated by the adoption of IFRS; accordingly, they do not reflect recognition of errors in prior periods pursuant toIAS 8.
F-37

Table of ContentsBANCO SANTANDER CHILE AND SUBSIDIARIES
NOTES TO THE CONSOLIDATED FINANCIAL STATEMENTSAS OF DECEMBER 31, 2009, 2008 AND JANUARY 1, 2008
NOTE 2 – FIRST TIME ADOPTION OF INTERNATIONAL FINANCIAL REPORTING STANDARDS. continued:
c) Opening Consolidated Statements of Financial Position under IFRS
As discussed above, the IFRS were applied retroactively as of January 1, 2008, to prepare the corresponding opening balance sheet under these new accountingstandards.
Below is a presentation of the reconciliation of balances for the Statement of Financial Position, for which the following definitions apply:
Closing balances:These are the balances shown in the consolidated financial statements of the Bank and its Subsidiaries as of January 1, 2008, which were prepared in accordancewith the previously applicable accounting criteria and principles.
Adjustments:Changes arising mainly from the valuation criteria and accounting policies modified by the new set of standards. Changes in the perimeter of consolidationprescribed by the new Compendium of Accounting Standards are included in this item.
Opening Balances:These are the balances reflecting the adjustments’ effect on the closing consolidated financial statements.
F-38

Table of ContentsBANCO SANTANDER CHILE AND SUBSIDIARIES
NOTES TO THE CONSOLIDATED FINANCIAL STATEMENTSAS OF DECEMBER 31, 2009, 2008 AND JANUARY 1, 2008
NOTE 2 – FIRST TIME ADOPTION OF INTERNATIONAL FINANCIAL REPORTING STANDARDS. continued:
Reconciliation of Consolidated Statement of Financial Position under Chilean GAAP to Consolidated Statement of Financial Position under IFRS as of January1, 2008:
As of January 1, 2008
ClosingBalances
underCHGAAP
Adjustments(*)
OpeningBalances
under IFRS MCh$ MCh$ MCh$ ASSETS
Cash and deposits in banks 1,108,444 193 1,108,637 Unsettled transactions 316,240 - 316,240 Trading investments 1,090,004 3,441 1,093,445 Investments under resale agreements 33,999 - 33,999 Financial derivative contracts 780,775 - 780,775 Interbank loans 45,961 - 45,961 Loans and accounts receivable from customers 12,028,053 (5,778) 12,022,275 Available for sale investments 779,635 - 779,635 Investments in other companies 6,795 506 7,301 Intangible assets 56,187 37 56,224 Property, plant and equipment 245,619 (43,130) 202,489 Current taxes 1,933 566 2,499 Deferred taxes 61,260 19,061 80,321 Other assets 474,091 (9,881) 464,210
TOTAL ASSETS 17,028,996 (34,985) 16,994,011 LIABILITIES
Demand deposits and other demand liabilities 2,868,769 (835) 2,867,934 Unsettled transactions 135,219 - 135,219 Investments under repurchase agreements 308,651 (1,021) 307,630 Deposits and other time deposits 7,887,897 - 7,887,897 Financial derivative contracts 778,217 - 778,217 Interbank borrowings 1,099,443 14 1,099,457 Issued debt instruments 2,154,996 - 2,154,996 Other financial liabilities 147,868 27,799 175,667 Current taxes 15,897 170 16,067 Deferred taxes 10,877 207 11,084 Provisions 46,376 3,726 50,102 Other liabilities 116,697 1,852 118,549
TOTAL LIABILITIES 15,570,907 31,912 15,602,819 EQUITY
Attributable to Bank shareholders: 1,438,042 (64,984) 1,373,058 Capital 818,535 - 818,535 Reserves 47,330 - 47,330 Valuation accounts (9,475) - (9,475)Retained earnings 581,652 (64,984) 516,668
Retained earnings from prior periods 581,652 (64,984) 516,668 Income for the period - - - Minus: Provision for minimum dividends - - -
Non controlling interest 20,047 (1,913) 18,134 TOTAL EQUITY 1,458,089 (66,897) 1,391,192 TOTAL LIABILITIES AND EQUITY 17,028,996 (34,985) 16,994,011 (*) A detailed explanation of the nature of the principal adjustments is given in letter f).
F-39

Table of ContentsBANCO SANTANDER CHILE AND SUBSIDIARIES
NOTES TO THE CONSOLIDATED FINANCIAL STATEMENTSAS OF DECEMBER 31, 2009, 2008 AND JANUARY 1, 2008
NOTE 2 – FIRST TIME ADOPTION OF INTERNATIONAL FINANCIAL REPORTING STANDARDS. continued:
d) Reconciliation of Consolidated Statement of Financial Position under Chilean GAAP to Consolidated Statement of Financial Position under IFRS as ofDecember 31, 2008:
As of December 31, 2008
ChileanGAAP
Adjustment(*) IFRS
MCh$ MCh$ MCh$ ASSETS Cash and deposits in banks 854,838 573 855,411 Unsettled transactions 335,405 - 335,405 Trading investments 1,161,631 4,795 1,166,426 Investments under resale agreements - - - Financial derivative contracts 1,846,509 - 1,846,509 Interbank loans 95,499 - 95,499 Loans and accounts receivable from customers 14,319,370 (8,021) 14,311,349 Available for sale investments 1,580,240 - 1,580,240 Investments in other companies 6,990 287 7,277 Intangible assets 73,089 (4,857) 68,232 Property, plant and equipment 260,105 (59,716) 200,389 Current taxes 18,289 426 18,715 Deferred taxes 64,821 23,681 88,502 Other assets 520,348 (9,795) 510,553 TOTAL ASSETS 21,137,134 (52,627) 21,084,507 LIABILITIES Deposits and other demand liabilities 2,949,757 (1,595) 2,948,162 Unsettled transactions 142,552 - 142,552 Investments under repurchase agreements 563,234 (1,011) 562,223 Deposits and other time deposits 9,756,266 - 9,756,266 Financial derivatives contracts 1,469,724 - 1,469,724 Interbank borrowings 1,425,065 2 1,425,067 Issued debt instruments 2,651,372 - 2,651,372 Other financial obligations 103,278 28,040 131,318 Current taxes 163 628 791 Deferred taxes 18,766 671 19,437 Provisions 162,165 4,048 166,213 Other liabilities 292,182 1,551 293,733 TOTAL LIABILITIES 19,534,524 32,334 19,566,858 EQUITY Attributable to Bank shareholders: 1,578,045 (86,275) 1,491,770 Capital 891,303 - 891,303 Reserves 51,539 - 51,539 Valuation accounts (7,552) - (7,552)Retained earnings 642,755 (86,275) 556,480
Retained earnings from prior periods 413,053 (172,005) 241,048 Income for the period 328,146 85,224 413,370 Minus: Provision for minimum dividends (98,444) 506 (97,938)
Non controlling interest 24,565 1,314 25,879 TOTAL EQUITY 1,602,610 (84,961) 1,517,649 TOTAL LIABILITIES AND EQUITY 21,137,134 (52,627) 21,084,507 (*) A detailed explanation of the nature of the principal adjustments is given in letter f).
F-40

Table of ContentsBANCO SANTANDER CHILE AND SUBSIDIARIES
NOTES TO THE CONSOLIDATED FINANCIAL STATEMENTSAS OF DECEMBER 31, 2009, 2008 AND JANUARY 1, 2008
NOTE 2 – FIRST TIME ADOPTION OF INTERNATIONAL FINANCIAL REPORTING STANDARDS. continued:
d) Reconciliation of Consolidated Statement of Income and Consolidated Statement of Comprehensive Income under Chilean GAAP to ConsolidatedStatement of Income and Consolidated Statement of Comprehensive Income under IFRS as of December 31, 2008:
As of December 31, 2008
ChileanGAAP
Adjustment(*) IFRS
MCh$ MCh$ MCh$ OPERATING INCOME Interest income 2,061,112 234 2,061,346 Interest expense (1,164,071) (5,209) (1,169,280)Net interest income 897,041 (4,975) 892,066 Fee and commission income 276,433 19,536 295,969 Fee and commission expense (52,840) - (52,840)Net fee and commission income 223,593 19,536 243,129 Net income from financial operations 273,084 393 273,477 Currency exchange profit (loss), net (187,042) - (187,042)Other operating revenue 16,512 (5,616) 10,896 Total operating income 1,223,188 9,338 1,232,526 Provision for loan losses (285,953) (2,030) (287,983) NET OPERATING PROFIT 937,235 7,308 944,543 Personnel salaries and expenses (209,134) (37,641) (246,775)Administrative expenses (161,977) 28,295 (133,682)Depreciation and amortization (51,944) 4,317 (47,627)Impairment - (84) (84)Other operating expenses (42,259) 5,961 (36,298)TOTAL OPERATING EXPENSES (465,314) 848 (464,466) OPERATING INCOME 471,921 8,156 480,077 Income from investments in other companies 851 (219) 632 Price-level restatement (78,027) 78,027 - Income before tax 394,745 85,964 480,709 Income tax expense (63,728) 3,986 (59,742) CONSOLIDATED INCOMEFOR THE PERIOD 331,017 89,950 420,967 Attributable to:
Bank shareholders 328,146 85,224 413,370 Non controlling interest 2,871 4,726 7,597
(expressed in pesos)
Basic earnings 1.741 0.453 2.194 Diluted earnings 1.741 0.453 2.194
(*) A detailed explanation of the nature of the principal adjustments is given in letter f).
F-41

Table of ContentsBANCO SANTANDER CHILE AND SUBSIDIARIES
NOTES TO THE CONSOLIDATED FINANCIAL STATEMENTSAS OF DECEMBER 31, 2009, 2008 AND JANUARY 1, 2008
NOTE 2 – FIRST TIME ADOPTION OF INTERNATIONAL FINANCIAL REPORTING STANDARDS. continued: As of December 31, 2008
ChileanGAAP
Adjustment(*) IFRS
MCh$ MCh$ MCh$ CONSOLIDATED INCOME FOR THE PERIOD 331,017 89,950 420,967 OTHER COMPREHENSIVE INCOME Available for sale investments (14,471) - (14,471)Cash flow hedge 16,740 - 16,740 Other comprehensive income before income tax 2,269 - 2,269 Income tax related to other comprehensive income (385) - (385) Total other comprehensive income 1,884 - 1,884 CONSOLIDATED COMPREHENSIVE INCOME FOR THE YEAR 332,901 89,950 422,851 Attributable to:
Bank shareholders 330,069 85,224 415,293 Non controlling interest 2,832 4,726 7,558
(*) A detailed explanation of the nature of the principal adjustments is given in letter f).
F-42

Table of ContentsBANCO SANTANDER CHILE AND SUBSIDIARIES
NOTES TO THE CONSOLIDATED FINANCIAL STATEMENTSAS OF DECEMBER 31, 2009, 2008 AND JANUARY 1, 2008
NOTE 2 – FIRST TIME ADOPTION OF INTERNATIONAL FINANCIAL REPORTING STANDARDS. continued:
e) Reconciliation of Consolidated Statement of Cash Flow under Chilean GAAP to Consolidated Statement of Cash Flow under IFRS as of December 31,2008:
As of December 31, 2008
ChileanGAAP
Adjustment(*) IFRS
MCh$ MCh$ MCh$ A - CASH FLOWS FROM OPERATING ACTIVITIES:
CONSOLIDATED INCOME BEFORE TAX 394,745 85,964 480,709 Debits (credits) to income that do not represent cash flows (831,975) 61,817 (770,158)
Depreciation and amortization 51,944 (4,317) 47,627 Impairment of property, plant and equipment 84 - 84 Provision for loan losses 323,848 2,029 325,877 Mark to market of trading investments (1,121) - (1,121)Net Gain on investments in other companies (851) 219 (632)Net Gain on sale of assets received in lieu of payment (8,481) 6,963 (1,518)Net Gain on sale of investments in other companies (4,348) - (4,348)Net Gain on sale of property, plant and equipment 139 (858) (719)Write-off of assets received in lieu of payment 5,410 (5,410) - Net interest income (897,041) 4,975 (892,066)Net fee and commission income (223,593) (19,536) (243,129)Price-level restatement (78,097) 78,097 - Changes in assets and liabilities due to deferred taxes 132 (345) (213)Increase/decrease in operating assets and liabilities 411,501 (132,376) 279,125 Decrease (increase) of loans and accounts receivable from customers (1,949,477) 2,243 (1,947,234)Decrease (increase) of financial investments (907,888) (1,354) (909,242)Decrease (increase) due to resale agreements 39,512 - 39,512 Decrease (increase) of interbank loans (49,561) - (49,561)Decrease of assets received in lieu of payment (10,195) 2,030 (8,165)Increase of debits in checking accounts 109,230 (760) 108,470 Increase (decrease) of time deposits and other time liabilities 1,547,972 - 1,547,972 Increase of obligations with domestic banks 1,786 - 1,786 Increase (decrease) of other demand liabilities or time obligations (57,518) 240 (57,278)Increase of obligations with foreign banks 321,580 - 321,580 Decrease of obligations with the Central Bank of Chile (959) - (959)Increase of repurchase agreements 280,402 10 280,412 Decrease of other short-term liabilities (58,173) - (58,173)Net increase of other assets and liabilities (46,707) (153,332) (200,039)Redemption of letters of credit (161,664) - (161,664)Senior bond issuances 303,722 - 303,722 Redemption of senior bonds and interest payments (24,771) - (24,771)Subordinated bond issuances 145,421 - 145,421 Redemption of subordinated bonds and interest payment (12,728) - (12,728)Interest received 1,604,053 234 1,604,287 Interest paid (823,039) (5,209) (828,248)Dividends received from investments in other companies 638 - 638 Fees and commissions received 276,433 19,536 295,969 Fees and commissions paid (52,840) - (52,840)Income tax period (63,728) 3,986 (59,742)Net cash used in operating activities (25,729) 15,405 (10,324)
F-43

Table of ContentsBANCO SANTANDER CHILE AND SUBSIDIARIES
NOTES TO THE CONSOLIDATED FINANCIAL STATEMENTSAS OF DECEMBER 31, 2009, 2008 AND JANUARY 1, 2008
NOTE 2 – FIRST TIME ADOPTION OF INTERNATIONAL FINANCIAL REPORTING STANDARDS. continued:
As of December 31, 2008
ChileanGAAP
Adjustment(*) IFRS
MCh$ MCh$ MCh$ B - CASH FLOWS FROM INVESTMENT ACTIVITIES:
Purchases of property, plant and equipment (18,672) (890) (19,562)Sales of property, plant and equipment 10,866 1,148 12,014 Sales of investments in other companies 386 - 386 Purchases of intangible assets (38,177) - (38,177)Net cash used in investment activities (45,597) 258 (45,339)
C - CASH FLOW FROM FINANCING ACTIVITIES:
From shareholders’ financing activities (173,575) - (173,575)Increase in other obligations 27,044 - 27,044 Dividends paid (200,619) - (200,619)From minority shareholder financing activities - (33) (33)Dividends and/or withdrawals paid - (33) (33)Net cash used in financing activities (173,575) (33) (176,608)
D – NET DECREASE IN CASH AND CASH EQUIVALENTS DURING THE PERIOD (244,901) 15,630 (229,271)
EFFECT OF INFLATION ON CASH AND CASH EQUIVALENTS 3,126 (3,126) - E – EFFECTS OF FOREIGN EXCHANGE RATE VARIATIONS ON CASH AND CASHEQUIVALENTS - (12,123) (12,123) F - INITIAL BALANCE OF CASH AND CASH EQUIVALENTS 1,289,466 192 1,289,658
FINAL BALANCE OF CASH AND CASH EQUIVALENTS 1,047,691 573 1,048,264
In the Reconciliation of the Consolidated Statement of Cash Flow under Chilean GAAP to Consolidated Statement of Cash Flow under IFRS as of December 31,2008, changes arises from adjustments to other financial statements and the incorporation of companies as indicated below in letter f), “Perimeter ofconsolidation”. There is no change in the “Cash and cash equivalents” definition.
f) Description of principal adjustments
i. Perimeter of consolidation
Pursuant to the standards in force until December 31, 2007, Chapter 11-6 “Equity in Domestic Companies” of the Updated Compilation of Standards (ChileanGAAP), the Bank included its subsidiaries and affiliates entities within its perimeter of consolidation.
The companies belonging to the first category were consolidated through global consolidation (line to line), as follows:
Company % of Equity Held Direct Indirect Total Santander Corredora de Seguros Limitada 99.75 0.01 99.76 Santander S.A. Corredores de Bolsa 50.59 0.41 51.00 Santander Asset Management S.A. Administradora General de Fondos 99.96 0.02 99.98 Santander S.A. Agente de Valores 99.03 - 99.03 Santander S.A. Sociedad Securitizadora 99.64 - 99.64 Santander Servicios de Recaudación y Pagos Limitada 99.90 0.10 100.00
F-44

Table of ContentsBANCO SANTANDER CHILE AND SUBSIDIARIES
NOTES TO THE CONSOLIDATED FINANCIAL STATEMENTSAS OF DECEMBER 31, 2009, 2008 AND JANUARY 1, 2008
NOTE 2 – FIRST TIME ADOPTION OF INTERNATIONAL FINANCIAL REPORTING STANDARDS. continued:
The affiliates entities accounted for in accordance with the equity method of accounting (VPP or VP, abbreviations in Spanish) are as follows: Company % Holding Redbanc S.A. 33.42 Transbank S.A. 32.71 Automated Clearing House 33.33 Sociedad Interbancaria de Depósito de Valores S.A. 29.29 Cámara Compensación de Alto Valor S.A. 11.52 Administrador Financiero del Transantiago S.A. 20.00 Sociedad Nexus S.A. 12.90
With the application of IFRS, the Bank analyzed and redefined its perimeter of consolidation, since the fundamental criteria to be applied now is the Bank’sdegree of control over a given entity, not the percentage of equity that the Bank holds.
As a result of this analysis, the following was determined:
1. The method of consolidation used until December 31, 2008 will continue to be used for the subsidiaries and affiliates entities. This is because it wasconcluded that the Bank controls the first category of companies and exercises significant influence on the second.
2. Pursuant to the provisions of IAS 27 “Consolidated and Separate Financial Statements” and SIC 12 “Consolidation — Special Purpose Entities”, the Bankhas evaluated the existence of Special Purpose Entities (SPE), which must be included within the perimeter of consolidation, with the following principalcharacteristics:
- The SPE’s activities have essentially been conducted on behalf of the company that presents the consolidated financial statements, and in response toits specific business needs.
- The necessary decision making authority is held to obtain most of the benefits or other advantages from these entities. - The entity essentially retains most of the risks inherent to the ownership or residuals of the SPE, or its assets, for the purpose of obtaining the benefits
from its activities.
As a result of this evaluation, it was concluded that the Bank exercised control over a certain number of entities, which were incorporated into its perimeter ofconsolidation. These entities are:
- Santander Gestión de Recaudación y Cobranza Limitada.- Multinegocios S.A.- Servicios Administrativos y Financieros Limitada.- Servicios de Cobranzas Fiscalex Limitada.- Multiservicios de Negocios Limitada.- Bansa Santander S.A.- Santander Multimedios S.A.
In early 2009, Santander Multimedios S.A. changed its line of business, and as a result its income no longer depended mainly on transactions with the Bank.Consequently, it was determined that the Bank no longer exercised control over it, and it should be excluded from the perimeter of consolidation beginning inMarch 2009.
ii. Affiliates Entities
The particular effects generated by the adoption of the IFRS on each of the different Associated entities are reflected in this item, in each case considering theproportional effect generated by these effects/adjustments on the Bank’s equity, based on the percentage of these companies’ equity that is held by the Bank.
F-45

Table of ContentsBANCO SANTANDER CHILE AND SUBSIDIARIES
NOTES TO THE CONSOLIDATED FINANCIAL STATEMENTSAS OF DECEMBER 31, 2009, 2008 AND JANUARY 1, 2008
NOTE 2 – FIRST TIME ADOPTION OF INTERNATIONAL FINANCIAL REPORTING STANDARDS. continued:
iii. Price-level restatement
Pursuant to previous accounting standards, the consolidated financial statements had been prepared applying price-level restatement in order to reflect the effectsof the changes in the Chilean peso’s purchasing power during each period.
Pursuant to the International Financial Reporting Standards, mainly IAS 29 “Financial Information in Hyperinflationary Economies,” price-level restatement willonly be applied when an entity’s functional currency corresponds to a hyperinflationary economy (defined as an economy experiencing 100 percentage points ofinflation in a 3 year period). The Bank’s functional currency is the Chilean peso.
Since the Chilean economy does not meet the aforementioned requirements, the Bank was required to eliminate the price-level restatement as of January 1, 2008.Pursuant to the provisions of exemption paragraph 22 IFRS 1, the price-level restatement applied until December 31, 2007 was not reversed. The price-levelrestatement for the paid-in capital and reserves as of December 31, 2008, was not reversed.
iv. Property, plant and equipment and intangible assets
The main effects of the recalculation of depreciations and amortizations of intangible assets (software and information technology developments) and property,plant and equipment as a result of the elimination of the price-level restatement (as described in point iii) and the determination of the cost of property, plant andequipment on January 01, 2008 are included.
In accordance with IFRS 1 a first-time adopter may elect to use a previous GAAP revaluation of an item of property, plant and equipment at, or before, the dateof transition to IFRSs as deemed cost at the date of the revaluation, if the revaluation was, at the date of the revaluation, broadly comparable to: (i) fair value; or(ii) cost or depreciated cost in accordance with IFRSs. The Bank has elected to revalued certain items of property, plant and equipment at its fair value and usedthat fair value as its deemed cost, for the remaining items of property, plant and equipment it has used the depreciated cost under previous GAAP as its deemedcost.
v. Assets received in lieu of payment
Previously, assets received in payment (ARP) were valued at cost (the price agreed upon with the debtor for the transfer in payment or the value determined at ajudicial auction, as the case may be, after price-level restatement), minus a provision for individual valuation based on an independent appraisal.
The most important change in the valuation of ARP in the IFRS (in addition to the elimination of the price-level restatement as described in item iii) is that,when making the provision for initial valuation, it is necessary to take into account its net realizable value, i.e., its fair value (independent appraisal), minus thenecessary costs of maintaining and divesting it.
According to studies performed by the Bank, an average cost of sale (the cost of maintaining and divesting the good) estimated at 5.8% of the appraised valuewas determined as of January 1, 2008; such cost rose to 6.5% as of December 31, 2008.
The effects generated by the application of the cost of sale described above are presented in this item.
F-46

Table of ContentsBANCO SANTANDER CHILE AND SUBSIDIARIES
NOTES TO THE CONSOLIDATED FINANCIAL STATEMENTSAS OF DECEMBER 31, 2009, 2008 AND JANUARY 1, 2008
NOTE 2 – FIRST TIME ADOPTION OF INTERNATIONAL FINANCIAL REPORTING STANDARDS. continued:
vi. Charge-off of loans
Under previous GAAP the term for charging off (impairment loss of loans) past-due and late installments on credits and accounts receivable was calculated fromthe time of their classification in the past-due portfolio, which represented transactions in arrears for payment of principal and interest by ninety days or more.This method was realized previously quota by quota.
Under IAS 39 “Financial Instruments: Recognition and Measurement” an impairment loss of financial asset or group of financial assets is recognized if, and onlyif , objective evidence of impairment as a result of one or more events that occurred after initial recognition of the asset (a loss event), and that loss (or events)has an impact on the estimated future cash flows of a financial asset or group of financial assets that can be reliably estimated. It may not be possible to identify asingle event that caused the impairment. According to this definition the impairment is determined for each loan considering its total amount and no longer quotaby quota as under previous GAAP.
An Impairment relating to loan recorded at amortized cost is calculated as the difference between the recorded asset’s carrying amount and the present value ofestimated future cash flows, discounted at the effective interest rate. Individually significant financial assets are individually tested to determine their impairment. All impairments are recorded in the Consolidated StatementIncome.
The Bank has classified the effects arising from the application of IFRS for charge-offs of loans and accounts receivable, as well as the associated effect causedin the allowances established for each transaction (when 100% of the transaction was charged-off, the related allowances were released).
vii. Deferred taxes
This item includes the tax effects (deferred taxes) generated by temporary differences resulting from the adjustments previously described, whether they applydirectly to equity or to the income.
viii. Other adjustments
This item refers to the collateral effect generated by the incorporation of new entities into the perimeter of consolidation, such as the increases in expenditurepreviously accrued and recognized in the financial statements.
g) First-time Application of International Financial Reporting Standards (IFRS)
Transition of the consolidated financial statements of the Bank to IFRS has been carried out through the application of IFRS 1: First-time adoption ofInternational Financial Reporting Standards, applying the exemption provided by this standard. The Bank has applied the following exemptions as permitted by IFRS 1:
i. Business Combinations
The Bank has applied the exemption provided under IFRS 1 for business combinations, and, therefore, did not apply IFRS 3, Business Combinationsretrospectively to those business combinations that occurred prior to the transition date of January 1, 2008.
ii. Value or revaluations as deemed cost
The Bank elected to measure certain items of property, plant and equipment at the date of transition at their fair value and use that fair value as their deemed costat that date. Likewise, they decided to measure the other items of property, plant and equipment at their price-level restated cost as of January 1, 2008.
F-47

Table of ContentsBANCO SANTANDER CHILE AND SUBSIDIARIES
NOTES TO THE CONSOLIDATED FINANCIAL STATEMENTSAS OF DECEMBER 31, 2009, 2008 AND JANUARY 1, 2008
NOTE 3 - SIGNIFICANT EVENTS:
As of December 31, 2009, the following significant events have occurred and had an impact on the Bank’s operations or the financial statements:
a) The Board
A Shareholders’ Meeting of Banco Santander Chile was held on April 28, 2009, chaired by Mr. Mauricio Larraín Garcés (Chairman), and attended by JesúsMaría Zabalza Lotina (First Vice President), Carlos Olivos Marchant (Second Vice President), Víctor Arbulú Crousillat, Claudia Bobadilla Ferrer, MarcoColodro Hadjes, Juan Manuel Hoyos Martínez de Irujo, Roberto Méndez Torres, Vittorio Corbo Lioi, Lucía Santa Cruz Sutil, Roberto Zahler Mayanz(Directors), Raimundo Monge Zegers (Alternate Director), and Jesús María Zabalza Lotina (Alternate Director).
The Chairman, Mr. Mauricio Larraín Garcés, informed the Board that Mr. Gonzalo Romero Astaburuaga had submitted his irrevocable resignation from thepositions of general counsel and Secretary of the Board on June 30, 2009. The Chairman proposed the appointment of Mr. Juan Pedro Santa María Pérez asgeneral counsel; he is a distinguished attorney and General Counsel of Grupo Santander, having acted as its general counsel since July 1, 2009.
At a Special Board Meeting held on December 22, 2009 in response to the resignation as principal Director Juan Manuel Hoyos Martínez de Irujo, the Boardappointed Mr. Oscar von Chrismar Carvajal to replace him as principal Director; he will temporarily continue serving as the Bank’s General Manager untilDecember 31, 2009. Commencing on January 1, 2010, Mr. Oscar von Chrismar Carvajal will be Second Vice President of the Board, and Mr. Carlos OlivosMarchant will resign as Second Vice President but will continue acting as a Director.
In addition, Claudio Melandri Hinojosa was appointed as the Bank’s General Manager beginning on January 1, 2010. Furthermore, Mr. Juan Manuel HoyosMartínez was appointed as Alternate Director of the Bank, filling a vacant position.
b) Issuance of bonds
In 2009, the Bank placed senior bonds in the amount of UF 18,000,000 and USD 800,000,000, in addition to |subordinated bonds totaling UF 300,000, as setforth:
Current bonds:
Series Amount Term Issue Rate Date ofIssue Maturity Date
F1 UF 3,000,000 8 years 3.50% per annum simple 5/2/2008 5/2/2016F2 UF 3,000,000 9 years 4.20% per annum simple 9/1/2008 9/1/2017F3 UF 3,000,000 5 years 4.50% per annum simple 2/1/2009 2/1/2014F4 UF 3,000,000 4 years 4.50% per annum simple 2/1/2009 2/1/2013F5 UF 3,000,000 4.5 years 2.50% per annum simple 5/1/2009 11/1/2013F6 UF 3,000,000 (1) 5 years 3.50% per annum simple 9/1/2009 9/1/2014F7 UF 3,000,000 (2) 4.5 years 3.30% per annum simple 11/1/2009 5/1/2014
Total UF 18,000,000
144 A USD 500,000,000 3 years 2.875% per annum simple 11/13/2009 11/13/2012144 A USD 300,000,000 3 years 2.875% per annum simple 11/13/2009 11/13/2012Total USD 800,000,000
F-48
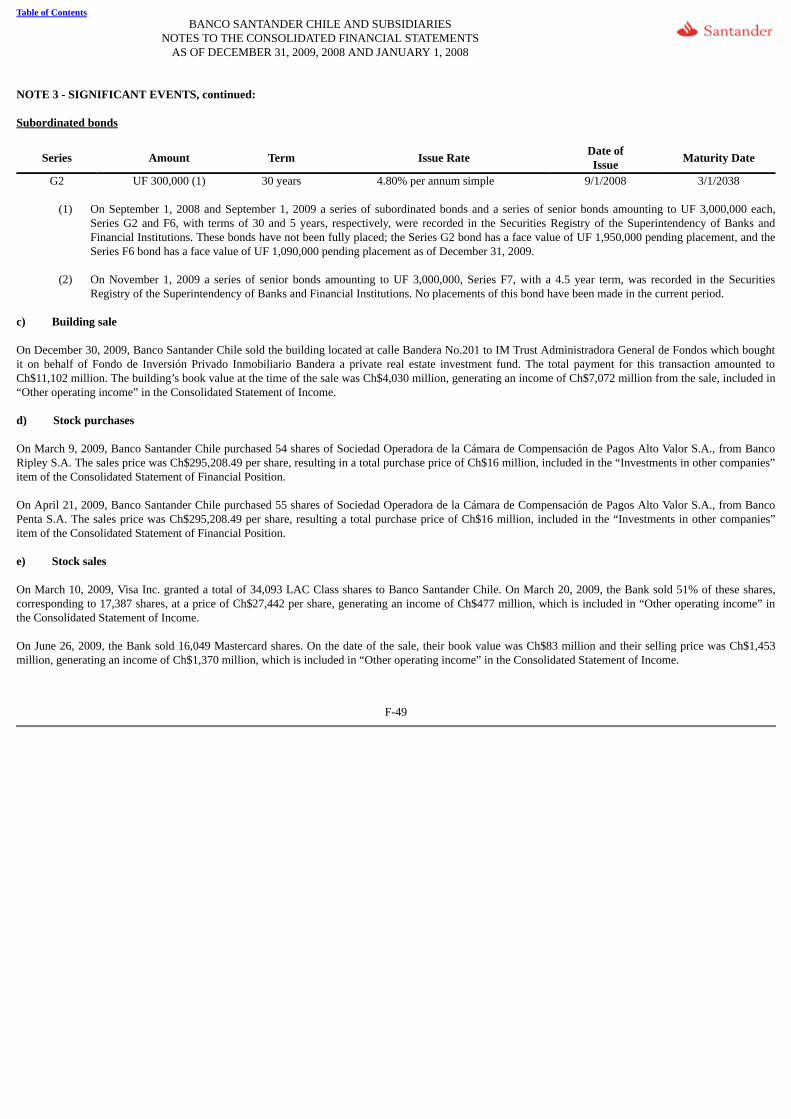
Table of ContentsBANCO SANTANDER CHILE AND SUBSIDIARIES
NOTES TO THE CONSOLIDATED FINANCIAL STATEMENTSAS OF DECEMBER 31, 2009, 2008 AND JANUARY 1, 2008
NOTE 3 - SIGNIFICANT EVENTS, continued:
Subordinated bonds
Series Amount Term Issue Rate Date ofIssue Maturity Date
G2 UF 300,000 (1) 30 years 4.80% per annum simple 9/1/2008 3/1/2038 (1) On September 1, 2008 and September 1, 2009 a series of subordinated bonds and a series of senior bonds amounting to UF 3,000,000 each,
Series G2 and F6, with terms of 30 and 5 years, respectively, were recorded in the Securities Registry of the Superintendency of Banks andFinancial Institutions. These bonds have not been fully placed; the Series G2 bond has a face value of UF 1,950,000 pending placement, and theSeries F6 bond has a face value of UF 1,090,000 pending placement as of December 31, 2009.
(2) On November 1, 2009 a series of senior bonds amounting to UF 3,000,000, Series F7, with a 4.5 year term, was recorded in the SecuritiesRegistry of the Superintendency of Banks and Financial Institutions. No placements of this bond have been made in the current period.
c) Building sale
On December 30, 2009, Banco Santander Chile sold the building located at calle Bandera No.201 to IM Trust Administradora General de Fondos which boughtit on behalf of Fondo de Inversión Privado Inmobiliario Bandera a private real estate investment fund. The total payment for this transaction amounted toCh$11,102 million. The building’s book value at the time of the sale was Ch$4,030 million, generating an income of Ch$7,072 million from the sale, included in“Other operating income” in the Consolidated Statement of Income.
d) Stock purchases
On March 9, 2009, Banco Santander Chile purchased 54 shares of Sociedad Operadora de la Cámara de Compensación de Pagos Alto Valor S.A., from BancoRipley S.A. The sales price was Ch$295,208.49 per share, resulting in a total purchase price of Ch$16 million, included in the “Investments in other companies”item of the Consolidated Statement of Financial Position.
On April 21, 2009, Banco Santander Chile purchased 55 shares of Sociedad Operadora de la Cámara de Compensación de Pagos Alto Valor S.A., from BancoPenta S.A. The sales price was Ch$295,208.49 per share, resulting a total purchase price of Ch$16 million, included in the “Investments in other companies”item of the Consolidated Statement of Financial Position.
e) Stock sales
On March 10, 2009, Visa Inc. granted a total of 34,093 LAC Class shares to Banco Santander Chile. On March 20, 2009, the Bank sold 51% of these shares,corresponding to 17,387 shares, at a price of Ch$27,442 per share, generating an income of Ch$477 million, which is included in “Other operating income” inthe Consolidated Statement of Income.
On June 26, 2009, the Bank sold 16,049 Mastercard shares. On the date of the sale, their book value was Ch$83 million and their selling price was Ch$1,453million, generating an income of Ch$1,370 million, which is included in “Other operating income” in the Consolidated Statement of Income.
F-49

Table of ContentsBANCO SANTANDER CHILE AND SUBSIDIARIES
NOTES TO THE CONSOLIDATED FINANCIAL STATEMENTSAS OF DECEMBER 31, 2009, 2008 AND JANUARY 1, 2008
NOTE 3 - SIGNIFICANT EVENTS, continued:
f) Stock purchases between related companies
On July 31, 2009, Santander Chile Holding S.A. purchased 99.96% and 99.99% of the shares of Multinegocios S.A. and Servicios de Cobranzas FiscalexLimitada, respectively. The total purchase price was Ch$52 million and Ch$7 million, respectively.
On July 31, 2009, Santander Inversiones Limitada purchased 2 shares, equivalent to 0.04% of Multinegocios S.A. shares and 0.01% of the Servicios deCobranzas Fiscalex Limitada equity. The total purchase price was Ch$20,959 and Ch$699, respectively.
On July 31, 2009, Teatinos Siglo XXI Inversiones Limitada purchased 90% of the equity of the Multiservicios de Negocios Limitada. The total purchase pricewas Ch$14 million. It also purchased 90% of the equity of the company Servicios Administrativos y Financieros Limitada. The total purchase price was Ch$14million.
On July 31, 2009, Aurum S.A. purchased 10% of the equity of the Multiservicios de Negocios Limitada. The total purchase price was Ch$2 million. It alsopurchased 10% of the equity of Servicios Administrativos y Financieros Limitada. The total purchase price was Ch$2 million.
g) Sale of assets received in lieu of payment
On December 30, 2009, Banco Santander Chile sold 201 real estate properties received in lieu of payment to IM Trust Administradora General de Fondos onbehalf of Fondo de Inversión Privado Inmobiliario Bandera a private real estate investment fund, for Ch$5,852 million, whose book value at the time of thetransaction amounted to Ch$5,723 million, generating an income of Ch$130 million, included in the “Other operating income” item of the ConsolidatedStatement of Income.
h) Loans sold
In 2009, the Bank sold part of its charged-off loan portfolio. The transfer of rights was made in November 2009, for a total of Ch$8,689 million, which wasrecorded entirely as gain from sale of charged-off portfolio. This gain is included in the “Net income from financial operations” item of the ConsolidatedStatement of Income.
In addition, in 2009, it sold Ch$15,389 million of current loans, which generated a gain from sale of portfolio of approximately Ch$542 million. This gain isincluded in the “Net income from financial operations” item of the Consolidated Statement of Income.
F-50

Table of ContentsBANCO SANTANDER CHILE AND SUBSIDIARIES
NOTES TO THE CONSOLIDATED FINANCIAL STATEMENTSAS OF DECEMBER 31, 2009, 2008 AND JANUARY 1, 2008
NOTE 4 - BUSINESS SEGMENTS:
The Bank manages and measures the performance of its operations by business segment. The information included in this note is not necessarily comparable tothat of other financial institutions, since it is based on the internal information system for management by segment which has been adopted by the Bank.However, the valuation and classification of each segment’s assets, liabilities, and income is consistent with the accounting criteria indicated in Note 1 d) of theconsolidated financial statements.
Inter-segment transactions are conducted under normal arm’s length commercial terms and conditions. Each segment’s assets, liabilities, and income includeitems directly attributable to the segment to which they can be allocated on a reasonable basis.
The Bank is comprised of the following business segments:
Individuals
a. Santander BanefeServes individuals with monthly incomes of Ch$150,000 to Ch$400,000 pesos, who receive services through Santander Banefe. This segment givescustomers a variety of services, including consumer loans, credit cards, auto loans, mortgage loans, debit cards, savings products, mutual funds, andinsurance.
b. Commercial bankingServes individuals with monthly incomes exceeding Ch$400,000 pesos. This segment gives customers a variety of services, including consumer loans, creditcards, auto loans, commercial loans, foreign trade, mortgage loans, debit cards, checking accounts, savings products, mutual funds, stock brokerage, andinsurance.
Small and mid-sized companies (PYMEs)
Serves small companies with annual sales of less than Ch$1,200 million. This segment gives customers a variety of products, including commercial loans,government-guaranteed loans, leasing, factoring, foreign trade, credit cards, mortgage loans, checking accounts, savings products, mutual funds, and insurance.
Institutional
Serves institutions such as universities, government agencies, and municipal and regional governments. This segment provides a variety of products, includingcommercial loans, leasing, factoring, foreign trade, credit cards, mortgage loans, checking accounts, transactional services, treasury services, savings products,mutual funds, and insurance.
Companies
The Companies segment is composed of Commercial Banking and Company Banking, where sub-segments of medium-sized companies (Companies), real estatecompanies (Real Estate) and large corporations are found:
a. CompaniesServes companies with annual sales exceeding Ch$1,200 million and up to Ch$10,000 million. This segment provides a wide variety of products, includingcommercial loans, leasing, factoring, foreign trade, credit cards, mortgage loans, checking accounts, transactional services, treasury services, financialconsulting, savings products, mutual funds, and insurance.
F-51

Table of ContentsBANCO SANTANDER CHILE AND SUBSIDIARIES
NOTES TO THE CONSOLIDATED FINANCIAL STATEMENTSAS OF DECEMBER 31, 2009, 2008 AND JANUARY 1, 2008
NOTE 4 - BUSINESS SEGMENTS, continued:
b. Real estateThis segment also includes all the companies engaged in the real estate industry. These clients are offered not only the traditional banking services but alsospecialized services to finance projects, chiefly residential, with the aim of expanding sales of mortgage loans.
It brings together all the real estate companies that carry out projects to sell properties to third parties and all the builders with annual sales exceedingCh$800 million, with no ceiling.
c. Large corporationsThe sub-segment of companies whose annual sales exceed Ch$10,000 million. This segment provides a wide variety of products, including commercialloans, leasing, factoring, foreign trade, credit cards, mortgage loans, checking accounts, transactional services, treasury services, financial consulting,investment banking, saving products, mutual funds, and insurance.
Global Banking and Markets The Global Banking and Markets segment is comprised of: a. Corporate
Foreign multinational corporations or Chilean corporations whose sales exceed Ch$10,000 million. This segment provides a wide variety of products,including commercial loans, leasing, factoring, foreign trade, credit cards, mortgage loans, checking accounts, transactional services, treasury services,financial consulting, investment banking, savings products, mutual funds, and insurance.
b. Treasury
The Treasury Division provides sophisticated financial products, mainly to companies in the Wholesale Banking area and the Companies segment. Theseinclude products such as short-term financing and fund raising, brokerage services, derivatives, securitization, and other tailor-made products. The Treasuryarea also handles intermediation of positions and manages the owned investment portfolio.
Corporate Activities (“Other”) This segment includes Financial Management, which performs global foreign exchange structural position management functions, those involving the parentcompany’s structural interest risk, and those having to do with liquidity risk. The latter, through issuances and utilizations. Also managed are the Bank’s ownfunds, the provision of capital allocated to each unit, and the financing cost of the investments that are made. The foregoing usually results in a negativecontribution to income.
In addition, this segment encompasses all the intra-segment income and all the activities not assigned to a given segment or product with customers.
F-52

Table of ContentsBANCO SANTANDER CHILE AND SUBSIDIARIES
NOTES TO THE CONSOLIDATED FINANCIAL STATEMENTSAS OF DECEMBER 31, 2009, 2008 AND JANUARY 1, 2008
NOTE 4 - BUSINESS SEGMENTS, continued:
The segments’ accounting policies are the same as those described in the summary of accounting policies, and are customized to meet the needs of the Bank’smanagement. The Bank earns most of its income in the form of interest income, fee and commission income and income from financial operations. The highestdecision making authority in each segment is based only on interest income, fee and commission income and provision for expenses to assess the segments’performance and thereby be able to make decisions regarding the resources to be allocated to each one.
To achieve the strategic objectives adopted by the top management and adapt to changing market conditions, the Bank makes changes in its organization fromtime to time, which in turn have a greater or lesser impact on how it is managed or administered.
Hence, this disclosure furnishes information on how the Bank is managed as of December 31, 2009. The information for the previous year (2008) has beenprepared on the basis of the criteria in force at the closing date for these financial statements, to achieve a proper comparability of figures.
The following tables show the Bank’s income by business segment for the years ending December 31, 2008 and 2009, as well as the balances for loans andaccounts receivable from customers as of December 31, 2009 and 2008 and as of January 1, 2008:
F-53

Table of ContentsBANCO SANTANDER CHILE AND SUBSIDIARIES
NOTES TO THE CONSOLIDATED FINANCIAL STATEMENTSAS OF DECEMBER 31, 2009, 2008 AND JANUARY 1, 2008
NOTE 4 - BUSINESS SEGMENTS, continued:
As of December 31, 2009
Loans andaccounts
receivablefrom
customers (1) Net interest
income
Net fee andcommission
income ROF (2) Provision for
loan losses Support
expenses (3)
Segment’snet
contribution MCh$ MCh$ MCh$ MCh$ MCh$ MCh$ MCh$ Segments Individuals 7,287,925 532,060 171,433 19,027 (230,503) (268,934) 223,083 Santander Banefe 609,808 115,840 29,452 5,078 (82,588) (54,913) 12,869 Commercial Banking 6,678,117 416,220 141,981 13,949 (147,915) (214,021) 210,214 Small and mid-sized companies(PYMEs) 2,485,505 228,928 41,917 11,037 (76,075) (58,741) 147,066 Institutional 282,933 18,789 1,962 664 (327) (6,799) 14,289 Total Retail 10,056,363 779,777 215,312 30,728 (306,905) (334,474) 384,438 Companies 2,471,162 114,432 20,567 16,181 (24,333) (30,628) 96,219 Companies 1,051,875 53,407 9,813 7,248 (8,618) (15,989) 45,861 Real estate 982,938 17,792 2,338 148 2,041 (4,280) 18,039 Large Corporations 436,349 43,233 8,416 8,785 (17,756) (10,359) 32,319 Global Banking and Markets 1,194,706 33,738 18,747 64,557 (2,511) (29,485) 85,046 Corporate 1,194,706 54,728 19,387 5 (2,511) (14,803) 56,806 Treasury - (20,990) (640) 64,552 - (14,682) 28,240 Other 29,045 (71,431) (496) 55,662 (98) (13,307) (29,670) Totals 13,751,276 856,516 254,130 167,128 (333,847) (407,894) 536,033
Other operating income 25,866 Other operating expenses (36,662)Income from investments in other companies 297 Income tax expense (88,924)
Consolidated income for the period 436,610 (1) Corresponds to Loans and accounts receivable from customers, net (Ch$ 13,378,379 million) plus interbank loans, net (Ch$23,370 million), before deductionof their allowances for loan losses (Ch$ 349,485 million and Ch$ 42 million, respectively), which were restituted for presentation purposes in this table.(2) Results from financial operations. Corresponds to the sum of Net income from financial operations (Ch$ 3,887 million) and foreign exchange profit (loss),net (Ch$ 163,241 million).(3) Corresponds to the sum of Personnel salaries and expenses (Ch$ 224,484 million), administrative expenses (Ch$ 136,712 million),,depreciation andamortization (Ch$ 46,623 million) and impairment (Ch$ 75 million).
F-54

Table of ContentsBANCO SANTANDER CHILE AND SUBSIDIARIES
NOTES TO THE CONSOLIDATED FINANCIAL STATEMENTSAS OF DECEMBER 31, 2009, 2008 AND JANUARY 1, 2008
NOTE 4 - BUSINESS SEGMENTS, continued:
As of December 31, 2008
As ofJanuary 1,
2008
Loans andaccounts
receivablefrom
customers (1) Net interest
income
Net fee andcommission
income ROF (2)
Provisionfor loanlosses
Supportexpenses
(3)
Segment’snet
contribution
Loans andaccounts
receivablefrom
customers(4)
MCh$ MCh$ MCh$ MCh$ MCh$ MCh$ MCh$ MCh$ Segments Individuals 6,859,547 520,332 160,286 19,460 (221,715) (281,532) 196,831 5,870,141 Santander Banefe 698,268 137,299 28,292 6,208 (84,295) (58,842) 28,662 663,721 Commercial Banking 6,161,279 383,033 131,994 13,252 (137,420) (222,690) 168,169 5,206,420 Small and mid-sizedcompanies (PYMEs) 2,468,820 220,058 39,931 9,452 (53,669) (61,663) 154,109 2,128,785 Institutional 224,776 17,591 1,789 765 (290) (7,189) 12,666 209,937 Total Retail 9,553,143 757,981 202,006 29,677 (275,674) (350,384) 363,606 8,208,863 Companies 2,882,943 113,223 16,846 14,740 (16,188) (32,692) 95,929 2,491,306 Companies 1,124,918 50,592 8,339 6,666 (8,556) (17,095) 39,946 990,170 Real estate 1,235,465 19,244 1,712 256 (597) (4,561) 16,054 517,922 Large Corporations 522,560 43,387 6,795 7,818 (7,035) (11,036) 39,929 983,214 Global banking and markets 2,221,144 31,783 14,786 60,332 (759) (31,184) 74,958 1,521,699 Corporate 2,221,144 52,352 14,555 - (759) (15,567) 50,581 1,521,699 Treasury - (20,569) 231 60,332 - (15,617) 24,377 - Other 23,858 (10,921) 9,491 (18,314) 4,638 (13,908) (29,014) 76,772 Totals 14,681,088 892,066 243,129 86,435 (287,983) (428,168) 505,479 12,298,640
Other operating income 10,896 Other operating expenses (36,298)Income from investments in other companies 632 Income tax expense (59,742)Consolidated income for the period 420,967
(1) Corresponds to Loans and accounts receivable from customers, net (Ch$ 14,311,349 million) plus interbank loans, net (Ch$95,499 million), before deductionof their allowances for loan losses (Ch$ 274,205 million and Ch$ 35 million, respectively), which were restituted for presentation purposes in this table.(2) Results from financial operations. Corresponds to the sum of Net income from financial operations (Ch$ 273,477 million) and foreign exchange profit (loss),net (Ch$ (187,042) million).(3) Corresponds to the sum of Personnel salaries and expenses (Ch$ 246,775 million), administrative expenses (Ch$ 133,682 million), depreciation andamortization (Ch$ 47,627 million) and impairment (Ch$ 84 million).(4) Corresponds to Loans and accounts receivable from customers, net (Ch$ 12,022,275 million) plus interbank loans, net (Ch$45,961 million), before deductionof their allowances for loan losses (Ch$ 230,404 million and for interbank loans no allowance was established as of January 1, 2008), which were restituted forpresentation purposes in this table.
F-55

Table of ContentsBANCO SANTANDER CHILE AND SUBSIDIARIES
NOTES TO THE CONSOLIDATED FINANCIAL STATEMENTSAS OF DECEMBER 31, 2009, 2008 AND JANUARY 1, 2008
NOTE 5 - CASH AND CASH EQUIVALENTS:
a) The detail of the balances included under cash and cash equivalents is as follows:
As of December 31, As of
January 1, 2009 2008 2008 MCh$ MCh$ MCh$ Cash and bank deposits
Cash 418,987 337,509 299,329 Deposits in the Central Bank of Chile 988,978 189,183 48,011 Deposits in domestic banks 255 874 783 Deposits in foreign banks 635,238 327,845 760,514
Subtotals - Cash and bank deposits 2,043,458 855,411 1,108,637
Unsettled transactions, net 192,660 192,853 181,021 Total cash and cash equivalents 2,236,118 1,048,264 1,289,658 The level of funds in cash and at the Central Bank of Chile, which are included in the “Deposits in the Central Bank of Chile” line, reflects regulations governingthe reserves that the Bank must maintain on average in monthly periods.
b) Unsettled Transactions
Unsettled transactions are transactions in which only settlement remains pending, which will increase or decrease funds in the Central Bank of Chile or in foreignbanks, normally within the next 24 to 48 business hours from the end of each period. These transactions are presented according to the following detail:
As of December 31, As of
January 1, 2009 2008 2008 MCh$ MCh$ MCh$ Assets
Documents held by other banks (documents to be exchanged) 206,454 214,929 183,190 Funds receivable 261,680 120,476 133,050
Subtotals 468,134 335,405 316,240 Liabilities
Funds payable 275,474 142,552 135,219 Subtotals 275,474 142,552 135,219
Unsettled transactions, net 192,660 192,853 181,021
F-56
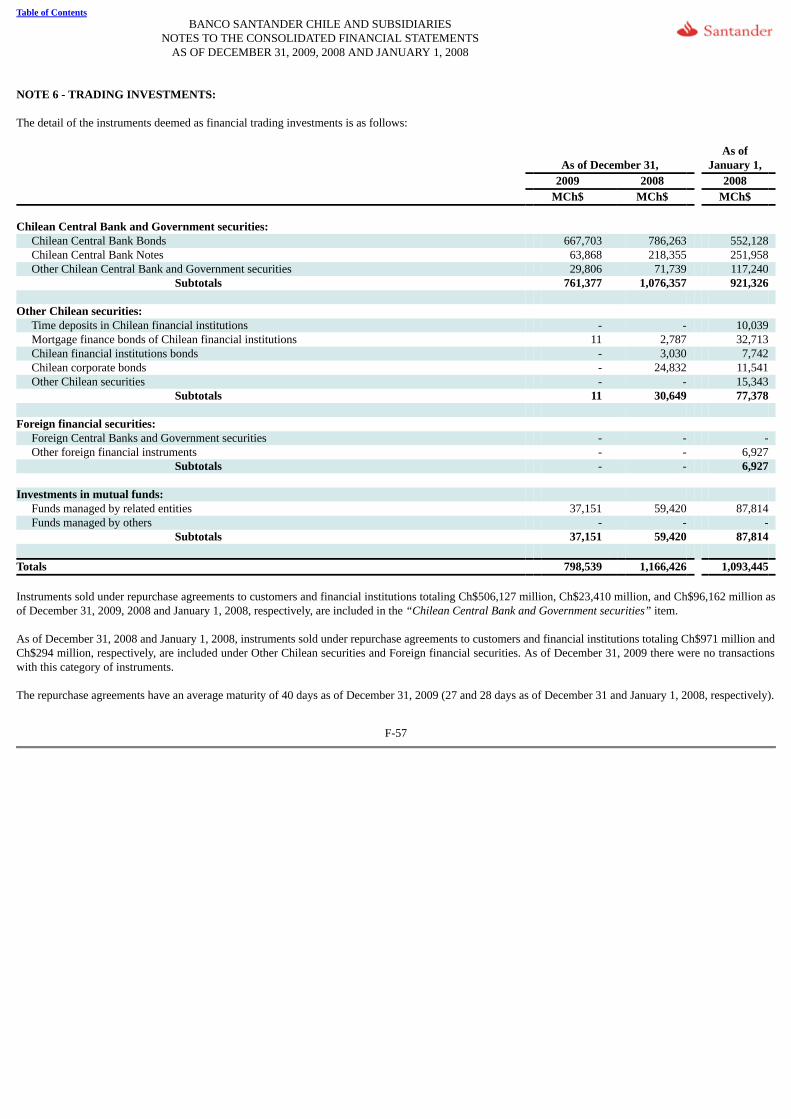
Table of ContentsBANCO SANTANDER CHILE AND SUBSIDIARIES
NOTES TO THE CONSOLIDATED FINANCIAL STATEMENTSAS OF DECEMBER 31, 2009, 2008 AND JANUARY 1, 2008
NOTE 6 - TRADING INVESTMENTS:
The detail of the instruments deemed as financial trading investments is as follows:
As of December 31, As of
January 1, 2009 2008 2008 MCh$ MCh$ MCh$ Chilean Central Bank and Government securities:
Chilean Central Bank Bonds 667,703 786,263 552,128 Chilean Central Bank Notes 63,868 218,355 251,958 Other Chilean Central Bank and Government securities 29,806 71,739 117,240
Subtotals 761,377 1,076,357 921,326 Other Chilean securities:
Time deposits in Chilean financial institutions - - 10,039 Mortgage finance bonds of Chilean financial institutions 11 2,787 32,713 Chilean financial institutions bonds - 3,030 7,742 Chilean corporate bonds - 24,832 11,541 Other Chilean securities - - 15,343
Subtotals 11 30,649 77,378 Foreign financial securities:
Foreign Central Banks and Government securities - - - Other foreign financial instruments - - 6,927
Subtotals - - 6,927 Investments in mutual funds:
Funds managed by related entities 37,151 59,420 87,814 Funds managed by others - - -
Subtotals 37,151 59,420 87,814 Totals 798,539 1,166,426 1,093,445
Instruments sold under repurchase agreements to customers and financial institutions totaling Ch$506,127 million, Ch$23,410 million, and Ch$96,162 million asof December 31, 2009, 2008 and January 1, 2008, respectively, are included in the “Chilean Central Bank and Government securities” item.
As of December 31, 2008 and January 1, 2008, instruments sold under repurchase agreements to customers and financial institutions totaling Ch$971 million andCh$294 million, respectively, are included under Other Chilean securities and Foreign financial securities. As of December 31, 2009 there were no transactionswith this category of instruments.
The repurchase agreements have an average maturity of 40 days as of December 31, 2009 (27 and 28 days as of December 31 and January 1, 2008, respectively).
F-57

Table of ContentsBANCO SANTANDER CHILE AND SUBSIDIARIES
NOTES TO THE CONSOLIDATED FINANCIAL STATEMENTSAS OF DECEMBER 31, 2009, 2008 AND JANUARY 1, 2008
NOTE 7 – INVESTMENTS UNDER RESALE AGREEMENTS:
a) Rights arising from resale agreements
The Bank purchases financial instruments agreeing to resell them at a future date. As of December 31, 2009, 2008 and January 1, 2008 the instruments acquiredunder resale agreements are as follows:
As of December 31, As of January 1, 2009 2008 2008
From 1day andless than3 months
Morethanthree
monthsand lessthan one
year
Morethan
one year Total
From 1day andless than3 months
Morethanthree
monthsand lessthan one
year
Morethan
one year Total
From 1day andless than3 months
Morethanthree
monthsand lessthan one
year
Morethan
one year Total MCh$ MCh$ MCh$ MCh$ MCh$ MCh$ MCh$ MCh$ MCh$ MCh$ MCh$ MCh$ Chilean Central Bank andGovernment securities:
Chilean Central Bank Bonds 14,020 - - 14,020 - - - - 15,533 - - 15,533 Chilean Central Bank Notes - - - - - - - - 9,695 - - 9,695 Other Chilean GovernmentCentral Bank instruments - - - - - - - - 1,349 - - 1,349
Subtotals 14,020 - - 14,020 - - - - 26,577 - - 26,577 Other Chilean securities:
Time deposits in Chileanfinancial institutions - - - - - - - - 770 - - 770 Mortgage finance bonds ofChilean financial institutions - - - - - - - - 6,652 - - 6,652 Chilean financial institutionsbonds - - - - - - - - - - - - Chilean corporate bonds - - - - - - - - - - - - Other instruments issued inChile - - - - - - - - - - - -
Subtotals 7,422 7,422 Foreign financial securities:
Foreign Central Banks andGovernment securities - - - - - - - - - - - - Other foreign financialinstruments - - - - - - - - - - - -
Subtotals - - - - - - - - - - - - Investments in mutual funds:
Funds managed by relatedentities - - - - - - - - - - - - Funds managed by others - - - - - - - - - - - -
Subtotals - - - - - - - - - - - - Totals 14,020 - - 14,020 - - - - 33,999 - - 33,999
Pursuant to the current SBIF standards, the Bank does not record instruments acquired under repurchase agreements as its own portfolio.
F-58

Table of ContentsBANCO SANTANDER CHILE AND SUBSIDIARIES
NOTES TO THE CONSOLIDATED FINANCIAL STATEMENTSAS OF DECEMBER 31, 2009, 2008 AND JANUARY 1, 2008
NOTE 7 - INVESTMENTS UNDER RESALE AGREEMENTS, continued:
b) Obligations arising from repurchase agreements
The Bank raises funds by selling financial instruments and committing itself to buy them back at future dates, plus interest at a predetermined rate. As ofDecember 31, 2009, 2008 and January 1, 2008, the instruments sold under repurchase agreements are as follows:
As of December 31, As of January 1, 2009 2008 2008
From 1day andless than3 months
Morethanthree
monthsand lessthan one
year
Morethan
one year Total
From 1day andless than3 months
Morethanthree
monthsand lessthan one
year
Morethan
one year Total
From 1day andless than3 months
Morethanthree
monthsand lessthan one
year
Morethan
one year Total MCh$ MCh$ MCh$ MCh$ MCh$ MCh$ MCh$ MCh$ MCh$ MCh$ MCh$ MCh$ Chilean Central Bank andGovernment securities:
Chilean Central Bank Bonds 313,588 451,765 - 765,353 402,760 - - 402,760 191,437 2,940 - 194,377 Chilean Central Bank Notes 100,072 45,224 - 145,296 12,901 86 91 13,078 86,903 3,501 - 90,404 Other Chilean GovernmentCentral Bank instruments 21 - - 21 54 - - 54 5,604 - - 5,604
Subtotals 413,681 496,989 910,670 415,715 86 91 415,892 283,944 6,441 290,385 Other Chilean securities:
Time deposits in Chileanfinancial institutions 94,485 242 - 94,727 133,313 10,432 175 143,920 4,498 7,947 - 12,445 Mortgage finance bonds ofChilean financial institutions 139 109,069 - 109,208 1,816 - 587 2,403 4,507 - - 4,507 Chilean financial institutionsbonds - - - - - 8 - 8 293 - - 293 Chilean corporate bonds - - - - - - - - - - - - Other instruments issued inChile - - - - - - - - - - - -
Subtotals 94,624 109,311 - 203,935 135,129 10,440 762 146,331 9,298 7,947 - 17,245 Foreign financial securities:
Foreign Central Banks andGovernment securities - - - - - - - - - - - - Other foreign financialinstruments - - - - - - - - - - - -
Subtotals Investments in mutual funds:
Funds managed by relatedentities - - - - - - - - - - - - Funds managed by others - - - - - - - - - - - -
Subtotals - - - - - - - - - - - - Totals 508,305 606,300 - 1,114,605 550,844 10,526 853 562,223 293,242 14,388 - 307,630
F-59

Table of ContentsBANCO SANTANDER CHILE AND SUBSIDIARIES
NOTES TO THE CONSOLIDATED FINANCIAL STATEMENTSAS OF DECEMBER 31, 2009, 2008 AND JANUARY 1, 2008
NOTE 7 - INVESTMENTS UNDER RESALE AGREEMENTS, continued:
As of December 31, 2009, 2008 and January 1, 2008, the detail of instruments sold under repurchase agreements, by type of portfolio, is as follows:
As of December 31, As of January 1, 2009 2008 2008
Availablefor Saleportfolio
TradingPortfolio
TotalInstruments
withagreement
Availablefor Saleportfolio
TradingPortfolio
TotalInstruments
withagreement
Availablefor Saleportfolio
TradingPortfolio
TotalInstruments
withagreement
MCh$ MCh$ MCh$ MCh$ MCh$ MCh$ MCh$ MCh$ MCh$ Chilean Central Bank and Government securities:
Chilean Central Bank Bonds 277,209 506,127 783,336 403,416 11,601 415,017 112,839 62,928 175,767 Chilean Central Bank Notes 152,173 - 152,173 - 11,809 11,809 44,775 33,234 78,009 Other Chilean Government Central Bank instruments 21 - 21 54 - 54 5,604 - 5,604
Subtotals 429,403 506,127 935,530 403,470 23,410 426,880 163,218 96,162 259,380 Other Chilean securities:
Time deposits in Chilean financial institutions 102,974 - 102,974 97,351 44,671 142,022 - 16,857 16,857 Mortgage finance bonds of Chilean financialinstitutions 163,114 - 163,114 1,204 1,206 2,410 - 4,534 4,534 Chilean financial institutions bonds - - - - - - - 294 294 Chilean corporate bonds - - - - - - - - - Other instruments issued in Chile - - - - - - - - -
Subtotals 266,088 - 266,088 98,555 45,877 144,432 - 21,685 21,685 Foreign financial securities:
Foreign Central Banks and Government securities - - - - - - - - - Other foreign financial instruments - - - - - - - - -
Investments in mutual funds:
Funds managed by related entities - - - - - - - - - Funds managed by others - - - - - - - - -
Subtotals - - - - - - - - - Totals 695,491 506,127 1,201,618 502,025 69,287 571,312 163,218 117,847 281,065
F-60

Table of ContentsBANCO SANTANDER CHILE AND SUBSIDIARIES
NOTES TO THE CONSOLIDATED FINANCIAL STATEMENTSAS OF DECEMBER 31, 2009, 2008 AND JANUARY 1, 2008
NOTE 8 - DERIVATIVES FINANCIAL INSTRUMENTS AND HEDGES ACCOUNTING:
a) As of December 31, 2009 and 2008, and as of January 1, 2008, the Bank holds the following portfolio of derivative instruments:
As of December 31, 2009 Notional amount Fair value
Up to 3months
More than 3months toone year
More thanone year Assets Liabilities
MCh$ MCh$ MCh$ MCh$ MCh$ Hedging derivatives at fair value Currency forwards - - - - - Interest rate swaps - 86,963 580,132 2,446 3,794 Cross currency swaps - 26,079 583,035 16,972 805 Call currency options - - - - - Call interest rate options - - - - - Put currency options - - - - - Put interest rate options - - - - - Interest rate futures - - - - - Other derivatives - - - - -
Subtotals - 113,042 1,163,167 19,418 4,599 Cash flow hedging derivatives Currency forwards - - - - - Interest rate swaps - - - - - Cross currency swaps 51,993 582,830 73,551 4,741 52,301 Call currency options - - - - - Call interest rate options - - - - - Put currency options - - - - - Put interest rate options - - - - - Interest rate futures - - - - - Other derivatives - - - - -
Subtotals 51,993 582,830 73,551 4,741 52,301 Trading derivatives Currency forwards 6,533,147 4,195,874 587,541 199,665 184,112 Interest rate swaps 2,418,161 4,240,574 9,618,573 243,965 330,975 Cross currency swaps 887,942 1,594,972 9,880,693 922,498 772,959 Call currency options 34,341 22,107 - 203 43 Call interest rate options 122 5,189 39,900 281 595 Put currency options 33,198 15,487 - 3,083 3,232 Put interest rate options - - - - - Interest rate futures - - - - - Other derivatives 29,320 - - 24 90
Subtotals 9,936,231 10,074,203 20,126,707 1,369,719 1,292,006 Totals 9,988,224 10,770,075 21,363,425 1,393,878 1,348,906
F-61

Table of ContentsBANCO SANTANDER CHILE AND SUBSIDIARIES
NOTES TO THE CONSOLIDATED FINANCIAL STATEMENTSAS OF DECEMBER 31, 2009, 2008 AND JANUARY 1, 2008
NOTE 8 - DERIVATIVES FINANCIAL INSTRUMENTS AND HEDGES ACCOUNTING, continued: As of December 31, 2008 Notional amount Fair value
Up to 3months
More than 3months toone year
More thanone year Assets Liabilities
MCh$ MCh$ MCh$ MCh$ MCh$ Hedging derivatives at fair value Currency forwards - - - - - Interest rate swaps - - 45,849 1,234 1,332 Cross currency swaps - - 359,100 106,335 - Call currency options - - - - - Call interest rate options - - - - - Put currency options - - - - - Put interest rate options - - - - - Interest rate futures - - - - - Other derivatives - - - - -
Subtotals - - 404,949 107,569 1,332 Cash flow hedging derivatives Currency forwards - - - - - Interest rate swaps - - - - - Cross currency swaps 51,300 573,598 128,250 73,036 151 Call currency options - - - - - Call interest rate options - - - - - Put currency options - - - - - Put interest rate options - - - - - Interest rate futures - - - - - Other derivatives - - - - -
Subtotals 51,300 573,598 128,250 73,036 151 Derivatives for trading Currency forwards 5,643,973 2,983,543 438,347 600,199 302,479 Interest rate swaps 3,865,373 4,635,536 9,922,492 239,867 362,813 Cross currency swaps 619,041 1,634,073 9,281,020 803,199 780,614 Call currency options 225,936 157,871 1,347 21,901 18,126 Call interest rate options - 128,250 - - 45 Put currency options 195,792 138,795 1,347 657 4,164 Put interest rate options - 64,125 - - - Interest rate futures - - - - - Other derivatives 15,016 - - 81 -
Subtotals 10,565,131 9,742,193 19,644,553 1,665,904 1,468,241 Totals 10,616,431 10,315,791 20,177,752 1,846,509 1,469,724
F-62

Table of ContentsBANCO SANTANDER CHILE AND SUBSIDIARIES
NOTES TO THE CONSOLIDATED FINANCIAL STATEMENTSAS OF DECEMBER 31, 2009, 2008 AND JANUARY 1, 2008
NOTE 8 - DERIVATIVES FINANCIAL INSTRUMENTS AND HEDGES ACCOUNTING, continued:
As of January 1, 2008 Notional amount Fair value
Up to 3months
More than 3months toone year
More thanone year Assets Liabilities
MCh$ MCh$ MCh$ MCh$ MCh$ Hedging derivatives at fair value Currency forwards - - - - - Interest rate swaps - - 121,209 3,891 502 Cross currency swaps - - 278,757 - 9,246 Call currency options - - - - - Call interest rate options - - - - - Put currency options - - - - - Put interest rate options - - - - - Interest rate futures - - - - - Other derivatives - - - - -
Subtotals - - 399,966 3,891 9,748 Cash flow hedging derivatives Currency forwards - - - - - Interest rate swaps - - - - - Cross currency swaps - - 472,891 - 55,171 Call currency options - - - - - Call interest rate options - - - - - Put currency options - - - - - Put interest rate options - - - - - Interest rate futures - - - - - Other derivatives - - - - -
Subtotals - - 472,891 - 55,171 Trading derivatives Currency forwards 5,776,546 3,938,733 785,841 111,681 159,969 Interest rate swaps 1,935,239 3,254,410 8,759,290 86,515 159,146 Cross currency swaps 133,688 460,902 6,557,457 576,515 392,337 Call currency options 64,751 29,708 644 262 292 Call interest rate options - - 74,667 1 - Put currency options 159,781 36,532 - 1,501 1,172 Put interest rate options - - 75,667 - 9 Interest rate futures - - - - - Other derivatives 196,371 2,943 - 409 373
Subtotals 8,266,376 7,723,228 16,253,566 776,884 713,298 Totals 8,266,376 7,723,228 17,126,423 780,775 778,217
F-63

Table of ContentsBANCO SANTANDER CHILE AND SUBSIDIARIES
NOTES TO THE CONSOLIDATED FINANCIAL STATEMENTSAS OF DECEMBER 31, 2009, 2008 AND JANUARY 1, 2008
NOTE 8 - DERIVATIVES FINANCIAL INSTRUMENTS AND HEDGES ACCOUNTING, continued:
b) Hedge Accounting
Fair value hedges:
The Bank uses cross-currency swaps, interest rate swaps, and call money swaps to hedge its exposure to changes in the fair value of the hedged elementsattributable to interest rates. The aforementioned hedge instruments change the effective cost of long-term issuances from a fixed interest rate to a variableinterest rate, decreasing the duration and modifying the sensitivity to the shortest segments of the curve.
Below is a detail of the hedged elements and hedge instruments under fair value hedges as of December 31, 2009 and 2008, and as of January 1, 2008, classifiedby term to maturity:
As of December 31, 2009
Within 1
year Between 1
and 3 years Between 3
and 6 years Over 6 years MCh$ MCh$ MCh$ MCh$ Hedged element Chilean Central Bank Bonds in Pesos (BCP) - - 10,320 37,173 Chilean Central Bank Bonds in UF (BCU) - 83,113 57,911 31,588 Corporate bonds - - 10,906 - Senior bonds - 405,800 - - Subordinated bonds - 111,595 152,175 - Short-term loans - - 25,000 22,191 Interbank loans - 131,885 - - Time deposits 113,042 4,640 - - Mortgage bonds - - - 78,870 Totals 113,042 737,033 256,312 169,822 Hedge instrument Cross currency swap 26,079 214,998 220,406 147,631 Interest rate swap 71,963 517,395 10,906 - Call money swap 15,000 4,640 25,000 22,191 Totals 113,042 737,033 256,312 169,822 As of December 31, 2008
Within 1
year Between 1
and 3 years Between 3
and 6 years Over 6 years MCh$ MCh$ MCh$ MCh$ Hedged element Senior bonds - - 13,787 - Subordinated bonds - 166,725 224,437 - Totals - 166,725 238,224 - Hedge instrument Cross currency swap - 166,725 192,375 - Interest rate swap - - 45,849 - Totals - 166,725 238,224 -
F-64

Table of ContentsBANCO SANTANDER CHILE AND SUBSIDIARIES
NOTES TO THE CONSOLIDATED FINANCIAL STATEMENTSAS OF DECEMBER 31, 2009, 2008 AND JANUARY 1, 2008
NOTE 8 - DERIVATIVES FINANCIAL INSTRUMENTS AND HEDGES ACCOUNTING, continued:
As of January 1, 2008
Within 1
year Between 1
and 3 years Between 3
and 6 years Over 6 years MCh$ MCh$ MCh$ MCh$ Hedged element Corporate bonds - - 10,702 - Subordinated bonds - - 110,507 149,334 Interbank loans - - 129,423 - Totals - - 250,632 149,334 Hedge instrument Cross currency swap - - 129,423 149,334 Interest rate swap - - 121,209 - Totals - - 250,632 149,334
Cash flow hedges:
The Bank uses cross currency swaps to hedge the risk from variability of cash flows attributable to changes in the interest rates of bonds and interbank loans at avariable rate. The cash flows of the cross currency swaps equal the cash flows of the hedged items, which modify uncertain cash flows to known cash flowsderived from a fixed interest rate.
Below is the nominal amount of the hedged items as of December 31, 2009 and 2008, and as of January 1, 2008, and the period when the cash flows will begenerated:
As of December 31, 2009
Within 1
year Between 1
and 3 years Between 3
and 6 years Over 6 years MCh$ MCh$ MCh$ MCh$ Hedged element Bonds - - - - Interbank loans 634,823 73,551 - - Totals 634,823 73,551 - - Hedge instrument Cross currency swap 634,823 73,551 - - Totals 634,823 73,551 - -
F-65

Table of ContentsBANCO SANTANDER CHILE AND SUBSIDIARIES
NOTES TO THE CONSOLIDATED FINANCIAL STATEMENTSAS OF DECEMBER 31, 2009, 2008 AND JANUARY 1, 2008
NOTE 8 - DERIVATIVES FINANCIAL INSTRUMENTS AND HEDGES ACCOUNTING, continued:
As of December 31, 2008
Within 1
year Between 1
and 3 years Between 3
and 6 years Over 6 years MCh$ MCh$ MCh$ MCh$ Hedged element FRN bonds 256,500 - - - Interbank loans 368,398 128,250 - - Totals 624,898 128,250 - - Hedge instrument Cross currency swap 624,898 128,250 - - Totals 624,898 128,250 - -
As of January 1, 2008
Within 1
year Between 1
and 3 years Between 3
and 6 years Over 6 years MCh$ MCh$ MCh$ MCh$ Hedged element FRN bonds - 199,112 - - Interbank loans - 273,779 - - Totals - 472,891 - - Hedge instrument Cross currency swap - 472,891 - - Totals - 472,891 - -
F-66

Table of ContentsBANCO SANTANDER CHILE AND SUBSIDIARIES
NOTES TO THE CONSOLIDATED FINANCIAL STATEMENTSAS OF DECEMBER 31, 2009, 2008 AND JANUARY 1, 2008
NOTE 8 - DERIVATIVES FINANCIAL INSTRUMENTS AND HEDGES ACCOUNTING, continued:
Below is an estimate of the periods in which the flows are expected to be produced:
As of December 31, 2009
Within 1
Between 1and 3
Between 3and 6 Over 6
year years years years MCh$ MCh$ MCh$ MCh$ Hedged element Inflows - - - - Outflows (7,570) (1,487) - - Net flows (7,570) (1,487) - - Hedge instrument Inflows 7,570 1,487 - - Outflows (2,570) (938) - - Net flows 5,000 549 - -
As of December 31, 2008
Within 1
Between 1and 3
Between 3and 6 Over 6
year years years years MCh$ MCh$ MCh$ MCh$ Hedged element Inflows - - - - Outflows (13,212) (645) - - Net flows (13,212) (645) - - Hedge instrument Inflows 13,212 645 - - Outflows (13,464) (1,155) - - Net flows (252) (510) - -
As of January 1, 2008
Within 1
year Between 1
and 3 years Between 3
and 6 years Over 6 years MCh$ MCh$ MCh$ MCh$ Hedged element Inflows - - - - Outflows - (37,403) - - Net flows - (37,403) - - Hedge instrument Inflows - 37,403 - - Outflows - (28,173) - - Net flows - 9,230 - -
F-67

Table of ContentsBANCO SANTANDER CHILE AND SUBSIDIARIES
NOTES TO THE CONSOLIDATED FINANCIAL STATEMENTSAS OF DECEMBER 31, 2009, 2008 AND JANUARY 1, 2008
NOTE 8 - DERIVATIVES FINANCIAL INSTRUMENTS AND HEDGES ACCOUNTING, continued:
c) The income generated by cash flow hedges whose effect was recorded in the Consolidated Statement of Changes in Equity as of December 31, 2009 and2008 is shown below:
As of December 31, 2009 2008 MCh$ MCh$ Senior bond - 3,163 Loan (3,162) 7,710 Net flows (3,162) 10,873
Since the variable flows for both the hedged element and the hedging element mirror each other, the hedges are 100% efficient, which means that thevariations of value attributable to rate components are netted out.
In the 2009 and 2008 period the Bank does not record expected future transactions in its cash flow hedge accounting portfolio.
d) Below is a presentation of income generated by cash flow derivatives whose effect was transferred from other comprehensive income to income for theperiod:
As of December 31, 2009 2008 MCh$ MCh$ Senior bond - - Loan (66) - Net income from cash flow hedges (66) -
e) Net investment hedges for foreign businesses:
As of December 31, 2009 and 2008, the Bank does not present foreign net investment hedges in its hedge accounting portfolio.
F-68

Table of ContentsBANCO SANTANDER CHILE AND SUBSIDIARIES
NOTES TO THE CONSOLIDATED FINANCIAL STATEMENTSAS OF DECEMBER 31, 2009, 2008 AND JANUARY 1, 2008
NOTE 9 - INTERBANK LOANS:
a) At December 31, 2009, 2008 and January 1, 2008, the balances in the “Interbank loans” item are as follows:
As of December 31, As of
January 1, 2009 2008 2008 MCh$ MCh$ MCh$ Domestic banks
Loans and advances to banks 3 - 45,961 Deposits in the Central Bank of Chile - - - Nontransferable Chilean Central Bank Bonds - - - Other Central Bank of Chile loans - - - Interbank loans - - - Overdrafts in checking accounts - - - Nontransferable domestic bank loans - - - Other domestic bank loans - - - Allowances and impairment for domestic bank loans - - -
Foreign banks
Loans to foreign banks 23,409 95,534 - Overdrafts in current accounts - - - Nontransferable foreign bank deposits - - - Other foreign bank loans - - - Allowances and impairment for foreign bank loans (42) (35) -
- Totals 23,370 95,499 45,961
b) The amount in each period for allowances and impairment of interbank loans, which are included in the “Provisions for loan losses” item of theConsolidated Statement of Income, is shown below:
As of December 31,
2009 2008
Domestic
banks Foreignbanks Total
Domesticbanks
Foreignbanks Total
MCh$ MCh$ MCh$ MCh$ MCh$ MCh$ As of January 1 - 35 35 - - - Charge-offs - - - - - - Allowances established - 7 7 - 35 35 Allowances released - - - - - - Totals - 42 42 - 35 35
F-69

Table of ContentsBANCO SANTANDER CHILE AND SUBSIDIARIES
NOTES TO THE CONSOLIDATED FINANCIAL STATEMENTSAS OF DECEMBER 31, 2009, 2008 AND JANUARY 1, 2008
NOTE 10 - LOANS AND ACCOUNTS RECEIVABLES FROM CUSTOMERS:
a) Loans and accounts receivables from customers
As of December 31, 2009, 2008 and January 1, 2008, the composition of the loan portfolio is as follows:
Assets before allowances Allowances established
As of December 31, 2009 Normalportfolio
Substandardloans (*) Total
Individualallowances
Groupallowances Total Net assets
MCh$ MCh$ MCh$ MCh$ MCh$ MCh$ MCh$ Commercial loans Commercial loans 4,832,638 656,957 5,489,595 45,857 78,418 124,275 5,365,320 Foreign trade loans 531,487 104,841 636,328 21,732 1,295 23,027 613,301 General purpose mortgage loans 69,060 23,851 92,911 623 2,947 3,570 89,341 Factoring transactions 126,106 4,166 130,272 1,642 744 2,386 127,886 Leasing transactions 890,107 74,591 964,698 6,531 1,308 7,839 956,859 Other loans and accounts receivablesfrom customers 1,026 9,932 10,958 1,912 3,430 5,342 5,616
Subtotals 6,450,424 874,338 7,324,762 78,297 88,142 166,439 7,158,323 Mortgage loans Loans with mortgage finance bonds 169,827 5,765 175,592 - 576 576 175,016 Mortgage mutual loans 139,890 59,249 199,139 - 9,040 9,040 190,099 Other mortgage mutual loans 3,717,188 67,134 3,784,322 - 6,918 6,918 3,777,404 Leasing transactions - - - - - - -
Subtotals 4,026,905 132,148 4,159,053 - 16,534 16,534 4,142,519 Consumer loans Installment consumer loans 945,924 432,120 1,378,044 - 130,532 130,532 1,247,512 Credit card balances 564,685 22,252 586,937 - 24,433 24,433 562,504 Consumer leasing contracts 3,447 388 3,835 - 9 9 3,826 Other consumer loans 250,742 24,491 275,233 - 11,538 11,538 263,695
Subtotals 1,764,798 479,251 2,244,049 - 166,512 166,512 2,077,537 Totals 12,242,127 1,485,737 13,727,864 78,297 271,188 349,485 13,378,379
(*) Since December 1, 2009, under this concept is included a 100% of the loans or accounts receivables from customers of a debtor subject to groupevaluation when any of their loans are overdue for 90 days or more.
F-70

Table of Contents
BANCO SANTANDER CHILE AND SUBSIDIARIESNOTES TO THE CONSOLIDATED FINANCIAL STATEMENTS
AS OF DECEMBER 31, 2009, 2008 AND JANUARY 1, 2008 NOTE 10 - LOANS AND ACCOUNTS RECEIVABLES FROM CUSTOMERS, continued:
Assets before allowances Allowances established
Normalportfolio
Substandardloans* Total
Individualallowances
Groupallowances Total Net assets
As of December 31, 2008 MCh$ MCh$ MCh$ MCh$ MCh$ MCh$ MCh$ Commercial loans Commercial loans 5,206,239 269,216 5,475,455 31,880 52,417 84,297 5,391,158 Foreign trade loans 1,381,928 77,256 1,459,184 11,287 1,301 12,588 1,446,596 General purpose mortgage loans 105,871 15,529 121,400 1,017 2,557 3,574 117,826 Factoring transactions 318,676 4,460 323,136 1,309 546 1,855 321,281 Leasing transactions 932,200 32,894 965,094 5,830 643 6,473 958,621 Other loans and accounts receivablesfrom customers 3,730 7,861 11,591 2,768 2,574 5,342 6,249
Subtotals 7,948,644 407,216 8,355,860 54,091 60,038 114,129 8,241,731 Mortgage loans Loans with mortgage finance bonds 221,017 7,705 228,722 - 968 968 227,754 Mortgage mutual loans 165,813 31,492 197,305 - 4,400 4,400 192,905 Other mortgage mutual loans 3,472,866 81,663 3,554,529 - 7,262 7,262 3,547,267 Leasing transactions - - - - - - -
Subtotals 3,859,696 120,860 3,980,556 - 12,630 12,630 3,967,926 Consumer loans Installment consumer loans 1,036,068 311,074 1,347,142 - 106,313 106,313 1,240,829 Credit card balances 562,297 20,296 582,593 - 28,162 28,162 554,431 Consumer leasing contacts 4,807 58 4,865 - - - 4,865 Other consumer loans 303,783 10,755 314,538 - 12,971 12,971 301,567
Subtotals 1,906,955 342,183 2,249,138 - 147,446 147,446 2,101,692 Totals 13,715,295 870,259 14,585,554 54,091 220,114 274,205 14,311,349
(*) As of December 31, 2008, under this concept was included only the loans or accounts receivables from customers with an overdue of 90 days or more. Thisdiffers from the criterion applied in 2009, which considers 100% of the loans or accounts receivables from customers of a debtor, this is, for any loan granted tothe same debtor irrespective of the kind of loan granted.
F-71

Table of ContentsBANCO SANTANDER CHILE AND SUBSIDIARIES
NOTES TO THE CONSOLIDATED FINANCIAL STATEMENTSAS OF DECEMBER 31, 2009, 2008 AND JANUARY 1, 2008
NOTE 10 - LOANS AND ACCOUNTS RECEIVABLES FROM CUSTOMERS, continued:
Assets before allowances Allowances established
Normalportfolio
Substandardloans Total
Individualallowances
Groupallowances Total Net assets
As of January 1, 2008 MCh$ MCh$ MCh$ MCh$ MCh$ MCh$ MCh$ Commercial loans Commercial loans 4,480,505 245,404 4,725,909 25,546 43,295 68,841 4,657,068 Foreign trade loans 800,872 13,607 814,479 2,696 841 3,537 810,942 General purpose mortgage loans 136,016 13,137 149,153 523 2,266 2,789 146,364 Factoring transactions 261,468 5,177 266,645 710 939 1,649 264,996 Leasing transactions 848,044 26,899 874,943 4,284 1,405 5,689 869,254 Other loans and accounts receivablesfrom customers 3,220 4,135 7,355 1,345 1,663 3,008 4,347
Subtotals 6,530,125 308,359 6,838,484 35,104 50,409 85,513 6,752,971 Mortgage loans Loans with mortgage finance bonds 267,082 3,764 270,846 - 1,389 1,389 269,457 Mortgage mutual loans 9,616 200,080 209,696 - 3,364 3,364 206,332 Other mortgage mutual loans 2,815,468 48,405 2,863,873 - 4,570 4,570 2,859,303 Leasing transactions - - - - - - -
Subtotals 3,092,166 252,249 3,344,415 - 9,323 9,323 3,335,092 Consumer Loans Installment consumer loans 983,554 263,547 1,247,101 - 97,482 97,482 1,149,619 Credit card balances 513,813 11,517 525,330 - 25,471 25,471 499,859 Consumer leasing contacts 4,575 120 4,695 - - - 4,695 Other consumer loans 279,971 12,683 292,654 - 12,615 12,615 280,039
Subtotals 1,781,913 287,867 2,069,780 - 135,568 135,568 1,934,212 Totals 11,404,204 848,475 12,252,679 35,104 195,300 230,404 12,022,275
F-72

Table of ContentsBANCO SANTANDER CHILE AND SUBSIDIARIES
NOTES TO THE CONSOLIDATED FINANCIAL STATEMENTSAS OF DECEMBER 31, 2009, 2008 AND JANUARY 1, 2008
NOTE 10 - LOANS AND ACCOUNTS RECEIVABLES FROM CUSTOMERS, continued:
b) Portfolio characteristics:
As of December 31, 2009, 2008 and January 1, 2008, the portfolio before allowances has the following detail by customer’s economic activity:
Domestic loans (*) Foreign loans Total loans Distribution percentage
As of December 31, As of
January 1, As of December 31,
As ofJanuary
1, As of December 31, As of
January 1, As of December 31,
As ofJanuary
1, 2009 2008 2008 2009 2008 2008 2009 2008 2008 2009 2008 2008 MCh$ MCh$ MCh$ MCh$ MCh$ MCh$ MCh$ MCh$ MCh$ % % % Commercial loans Manufacturing 640,395 937,305 717,824 - - - 640,395 937,305 717,824 4.66 6.39 5.84 Mining 67,057 323,269 51,570 - - - 67,057 323,269 51,570 0.49 2.21 0.42 Electricity, gas and water 144,386 207,542 195,992 - - - 144,386 207,542 195,992 1.05 1.41 1.59 Agriculture and livestock 610,909 647,897 483,522 - - - 610,909 647,897 483,522 4.44 4.40 3.93 Forest 71,085 88,554 66,841 - - - 71,085 88,554 66,841 0.52 0.60 0.54 Fishing 127,025 170,934 109,739 - - - 127,025 170,934 109,739 0.93 1.16 0.89 Transport 362,508 423,856 303,561 - - - 362,508 423,856 303,561 2.64 2.89 2.47 Communications 164,077 192,750 176,299 - - - 164,077 192,750 176,299 1.20 1.31 1.43 Construction 817,293 887,391 779,106 - - - 817,293 887,391 779,106 5.95 6.04 6.33 Commerce (**) 1,650,903 2,219,987 1,638,178 23,409 95,534 - 1,674,312 2,315,521 1,638,178 12.03 15.78 13.32 Services 288,256 395,840 348,282 - - - 288,256 395,840 348,282 2.10 2.70 2.83 Other 2,380,871 1,860,535 2,013,531 - - - 2,380,871 1,860,535 2,013,531 17.34 12.68 16.38
Subtotals 7,324,765 8,355,860 6,884,445 23,409 95,534 - 7,348,174 8,451,394 6,884,445 53.35 57.57 55.97 Mortgage loans 4,159,053 3,980,556 3,344,415 - - - 4,159,053 3,980,556 3,344,415 30.30 27.11 27.20 Consumer loans 2,244,049 2,249,138 2,069,780 - - - 2,244,049 2,249,138 2,069,780 16.35 15.32 16.83 Totals 13,727,867 14,585,554 12,298,640 23,409 95,534 - 13,751,276 14,681,088 12,298,640 100 100 100
(*) Includes domestic loans and accounts receivables from customers and interbank loans (Note 9).(**) Includes loans to domestic financial institutions amounting to Ch$3 million as of December 31, 2009 (Ch$45,961 million as of January 1, 2008).
As of December 31, 2008 there were no such loans.
F-73

Table of ContentsBANCO SANTANDER CHILE AND SUBSIDIARIES
NOTES TO THE CONSOLIDATED FINANCIAL STATEMENTSAS OF DECEMBER 31, 2009, 2008 AND JANUARY 1, 2008
NOTE 10 - LOANS AND ACCOUNTS RECEIVABLES FROM CUSTOMERS, continued:
c) Allowances
The allowance activities in the 2009 and 2008 periods are as follows:
As of December 31, 2009 2008
Individualallowances
Groupallowances Total
Individualallowances
Groupallowances Total
MCh$ MCh$ MCh$ MCh$ MCh$ MCh$ Balances as of January 1, 54,091 220,114 274,205 35,104 195,300 230,404
Portfolio charge offs: - - - - - - Commercial loans (4,898) (43,220) (48,118) (3,796) (29,139) (32,935)Mortgage loans - (8,708) (8,708) - (5,032) (5,032)Consumer loans - (239,005) (239,005) - (236,405) (236,405)
Total charge offs loans (4,898) (290,933) (295,831) (3,796) (270,576) (274,372) Allowances established 34,739 363,670 398,409 25,508 300,578 326,086 Allowances released (5,635) (21,663) (27,298) (2,725) (5,188) (7,913) Totals 78,297 271,188 349,485 54,091 220,114 274,205
In addition to these loan loss allowances, there are allowances to mitigate country risk for foreign operations, which are recorded as liabilities under the item“Provisions”.
Contingent loan loss allowances are recorded as liabilities under the item “Provisions”. (For further details see Note 22).
F-74

Table of ContentsBANCO SANTANDER CHILE AND SUBSIDIARIES
NOTES TO THE CONSOLIDATED FINANCIAL STATEMENTSAS OF DECEMBER 31, 2009, 2008 AND JANUARY 1, 2008
NOTE 11 - LOAN PURCHASES, SALES AND SUBSTITUTIONS:
In 2009 the following loan trading operations were conducted:
As of December 31, 2009 Book value Sale value Allowances Effect on income MCh$ MCh$ MCh$ MCh$
Loans item (1) - 8,689 - 8,689 (2) 14,847 15,389 - 542
(1) In 2009 the Bank sold part of its loan portfolio that had been charged off. The transfer of rights was made in November 2009, for a total of Ch$8,689million, which was recorded as income from sale of charged-off portfolio in its entirety.
(2) In addition, current portfolio totaling Ch$15,389 million was sold in 2009, generating an income from portfolio sale of approximately Ch$542 million.
In 2008 the following loan trading operations were conducted:
As of December 31, 2008 Book value Sale value Allowances Effect on income MCh$ MCh$ MCh$ MCh$
Loans item (1) - 5,811 - 5,811 (2) - 7,611 1,611 6,000 (3) 22,257 23,237 - 980 (4) - - - 2,226
(1) In 2008 the Bank sold part of its loan portfolio that had been charged off: The transfer of rights was made in February 2008, for a total of Ch$5,811million, which was recorded as income from sale of charged-off portfolio.
(2) Transfer of Rights in August 2008, which represented at total of Ch$7,611 million for the portfolio sale, Ch$6,000 million of which was recorded asincome and the remaining Ch$1,611 million remained available in a special account for potential price adjustments that might occur in the future, inaccordance with the procedure established in the contract.
(3) In addition, through the Leasing Bank Division, on August 20, 2008 a current transaction was sold for a total of Ch$23,237 million, generating anincome from portfolio sale of approximately Ch$980 million.
(4) In 2007 the Bank sold part of the charged-off loan portfolio in a Transfer of Rights conducted on March 9, 2007, for a total price of approximatelyCh$39,603 million, of which Ch$9,901 million remained in a special account for potential future price adjustments, pursuant to the procedureestablished in the loan assignment contract (escrow deposit). In March 2007 approximately Ch$4,094 million of the loans that were cancelled betweenthe cut-off date for the loans to be assigned (September 30, 2006) and the date on which this assignment was formalized (March 9, 2007) was refunded.Hence, the net amount recorded as charged-off portfolio recoveries for this operation was Ch$25,608 million.
Finally, on December 14, 2007, by means of a public instrument, the rights transfer and escrow deposit contract were amended and concluded.According to this last amendment, the Bank would receive Ch$2,424 million (Ch$2,226 million at historic value) in 2008 from the aforementionedprice adjustment, which actually happened during the first quarter of 2008.
F-75

Table of ContentsBANCO SANTANDER CHILE AND SUBSIDIARIES
NOTES TO THE CONSOLIDATED FINANCIAL STATEMENTSAS OF DECEMBER 31, 2009, 2008 AND JANUARY 1, 2008
NOTE 12 – AVAILABLE FOR SALE INVESTMENTS:
As of December 31, 2009 and 2008, the detail of available for sale investments is as follows:
As of December 31, As of
January 1, 2009 2008 2008 MCh$ MCh$ MCh$ Chilean Central Bank and Government securities Chilean Central Bank Bonds 1,063,879 690,123 282,561 Chilean Central Bank Notes 264,011 49,204 54,305 Other Chilean Central Bank and Government securities 212,362 93,128 109,194
Subtotals 1,540,252 832,455 446,060 Other Chilean securities Time deposits in Chilean financial institutions 41,407 1,305 - Mortgage finance bonds of Chilean financial institutions 236,847 284,033 273,010 Chilean financial institutions bonds - - - Chilean corporate bonds 11,584 13,522 10,638 Other Chilean securities - - -
Subtotals 289,838 298,860 283,648 Foreign financial securities Foreign Central Banks and government securities - - - Other foreign financial securities - 448,925 49,927
Subtotals - 448,925 49,927
Totals 1,830,090 1,580,240 779,635
Chilean Central Bank and Government securities include instruments sold to customers and financial institutions under agreements to repurchase in the amountof Ch$403,295 million and Ch$58,859 million as of December 31, 2009, 2008 and January 1, 2008, respectively.
As of December 31, 2009 available for sale investments included unrealized net losses of Ch$29,304 million, recorded as a “Valuation adjustment in equity,”distributed between Ch$29,132 million attributable to Bank shareholders and Ch$172 million attributable to minority interest.
As of December 31, 2008 available for sale investments included unrealized net losses of Ch$20,019 million, recorded as a “Valuation adjustment” in Equity,distributed between Ch$19,972 million attributable to Bank shareholders and Ch$47 million attributable to minority interest.
As of January 1, 2008 available for sale investments included unrealized net losses of Ch$5,548 million, recorded as a “Valuation adjustment” in Equity,attributable solely to Bank shareholders.
F-76

Table of ContentsBANCO SANTANDER CHILE AND SUBSIDIARIES
NOTES TO THE CONSOLIDATED FINANCIAL STATEMENTSAS OF DECEMBER 31, 2009, 2008 AND JANUARY 1, 2008
NOTE 12 - AVAILABLE FOR SALE INVESTMENTS, continued:
Realized profits and losses are calculated as the proceeds from sales less the cost (specific identification method) of the investments identified as for sale. Inaddition, any unrealized profit or loss previously recorded in equity for these investments is reversed when recorded in the income statements.
Gross profits and losses realized on the sale of available for sale investments as of December 31, 2009 and 2008 are as follows:
As of December 31, 2009 2008 MCh$ MCh$ Proceeds from sale of available for sale investments generating realized profits 5,577,210 697,089 Realized profits 56,977 2,765 Proceeds from sale of available for sale investments generating realized losses 1,830,765 774,658 Realized losses 5,060 1,897
The Bank reviewed the unrealized instruments with losses as of December 31, 2009, 2008 and January 1, 2008 and concluded that there was no impairment otherthan temporary impairment. This review consisted of evaluating the economic reasons for any declines, the credit ratings of the securities’ issuers and the Bank’sintention and ability to hold the securities until the unrealized loss is recovered. Based on this analysis, the Bank believes that there were no other than temporaryimpairments in its investment portfolio, since most of the decline in fair value of these securities was caused by market conditions which the Bank considers tobe temporary. Most of the instruments that have unrealized losses as of December 31, 2009, 2008 and January 1, 2008 were in a continuous unrealized lossposition for less than one year.
The realized value and fair value of the available for sale investments as of December 31, 2009, 2008 and January 1, 2008 are as follows:
As of December 31, 2009
Cost
Grossunrealized
profits
Grossunrealized
losses Fairvalue
MCh$ MCh$ MCh$ MCh$ Chilean Central Bank and Government securities Chilean Central Bank Bonds 1,077,227 200 (13,548) 1,063,879 Chilean Central Bank Notes 264,866 31 (886) 264,011 Other Chilean Central Bank and Government securities 220,609 19 (8,266) 212,362
Subtotals 1,562,702 250 (22,700) 1,540,252 Other Chilean securities Time deposits in Chilean financial institutions 41,388 19 - 41,407 Mortgage finance bonds of Chilean financial institutions 244,097 80 (7,330) 236,847 Chilean financial institutions bonds - - - - Chilean corporate bonds 11,207 377 - 11,584 Other Chilean securities - - - -
Subtotals 296,692 476 (7,330) 289,838 Foreign financial securities Foreign Central Banks and government securities - - - - Other foreign financial securities - - - -
Subtotals - - - - Totals 1,859,394 726 (30,030) 1,830,090
F-77

Table of ContentsBANCO SANTANDER CHILE AND SUBSIDIARIES
NOTES TO THE CONSOLIDATED FINANCIAL STATEMENTSAS OF DECEMBER 31, 2009, 2008 AND JANUARY 1, 2008
NOTE 12 - AVAILABLE FOR SALE INVESTMENTS, continued:
As of December 31, 2008
Cost
Grossunrealized
profits
Grossunrealized
losses Fair value MCh$ MCh$ MCh$ MCh$ Chilean Central Bank and Government securities Chilean Central Bank Bonds 684,176 13,536 (7,589) 690,123 Chilean Central Bank Notes 50,349 - (1,145) 49,204 Other Chilean Central Bank and Government securities 94,318 676 (1,866) 93,128
Subtotals 828,843 14,212 (10,600) 832,455 Other Chilean securities Time deposits in Chilean financial institutions 3,092 - (1,787) 1,305 Mortgage finance bonds of Chilean financial institutions 305,552 23 (21,542) 284,033 Chilean financial institutions bonds - - - - Chilean corporate bonds 13,847 - (325) 13,522 Other Chilean securities
Subtotals 322,491 23 (23,654) 298,860 Foreign financial securities Foreign Central Banks and government securities - - - - Other foreign financial securities 448,925 - - 448,925
Subtotals 448,925 - - 448,925 Totals 1,600,259 14,235 (34,254) 1,580,240
As of January 1, 2008
Cost
Grossunrealized
profits
Grossunrealized
losses Fair value MCh$ MCh$ MCh$ MCh$ Chilean Central Bank and Government securities Chilean Central Bank Bonds 282,995 175 (609) 282,561 Chilean Central Bank Notes 54,358 15 (68) 54,305 Other Chilean Central Bank and Government securities 109,993 264 (1,063) 109,194
Subtotals 447,346 454 (1,740) 446,060 Other Chilean securities Time deposits in Chilean financial institutions - - - - Mortgage finance bonds of Chilean financial institutions 277,155 542 (4,687) 273,010 Chilean financial institutions bonds - - - - Chilean corporate bonds 10,755 - (117) 10,638 Other Chilean securities - - - -
Subtotals 287,910 542 (4,804) 283,648 Foreign financial securities Foreign Central Banks and government securities - - - - Other foreign financial securities 49,927 - - 49,927
Subtotals 49,927 - - 49,927 Totals 785,183 996 (6,544) 779,635
F-78

Table of ContentsBANCO SANTANDER CHILE AND SUBSIDIARIES
NOTES TO THE CONSOLIDATED FINANCIAL STATEMENTSAS OF DECEMBER 31, 2009, 2008 AND JANUARY 1, 2008
NOTE 12 - AVAILABLE FOR SALE INVESTMENTS, continued:
The following tables show the available for sale investments in an unrealized profit (loss) position as of December 31, 2009 and 2008 and January 1, 2008.
As of December 31, 2009:
Less than 12 months More than 12 months Total
Amortized
cost Fair value Unrealized
profit Unrealized
loss Amortized
cost Fairvalue
Unrealizedprofit
Unrealizedloss
Amortizedcost Fair value
Unrealizedprofit
Unrealizedloss
MCh$ MCh$ MCh$ MCh$ MCh$ MCh$ MCh$ MCh$ MCh$ MCh$ MCh$ MCh$ Chilean Central Bankand Governmentsecurities Chilean Central BankBonds 1,077,227 1,063,879 200 (13,548) - - - - 1,077,227 1,063,879 200 (13,548)Chilean Central BankNotes 264,866 264,011 31 (886) - - - - 264,866 264,011 31 (886)Other Chilean CentralBank and Governmentsecurities 220,609 212,362 19 (8,266) - - - - 220,609 212,362 19 (8,266)
Subtotals 1,562,702 1,540,252 250 (22,700) - - - - 1,562,702 1,540,252 250 (22,700) Other Chileansecurities Time deposits inChilean financialinstitutions 41,388 41,407 19 - - - - - 41,388 41,407 19 - Mortgage finance bondsof Chilean financialinstitutions 244,097 236,847 80 (7,330) - - - - 244,097 236,847 80 (7,330)Chilean financialinstitutions bonds - - - - - - - - - - - - Chilean corporate bonds 11,207 11,584 377 - - - - - 11,207 11,584 377 - Other Chilean securities - - - - - - - - - - - -
Subtotals 296,692 289,838 476 (7,330) - - - - 296,692 289,838 476 (7,330) Foreign financialsecurities Foreign Central Banksand governmentsecurities - - - - - - - - - - - - Other foreign financialsecurities - - - - - - - - - - - -
Subtotals - - - - - - - - - - - -
Totals 1,859,394 1,830,090 726 (30,030) - - - - 1,859,394 1,830,090 726 (30,030)
F-79
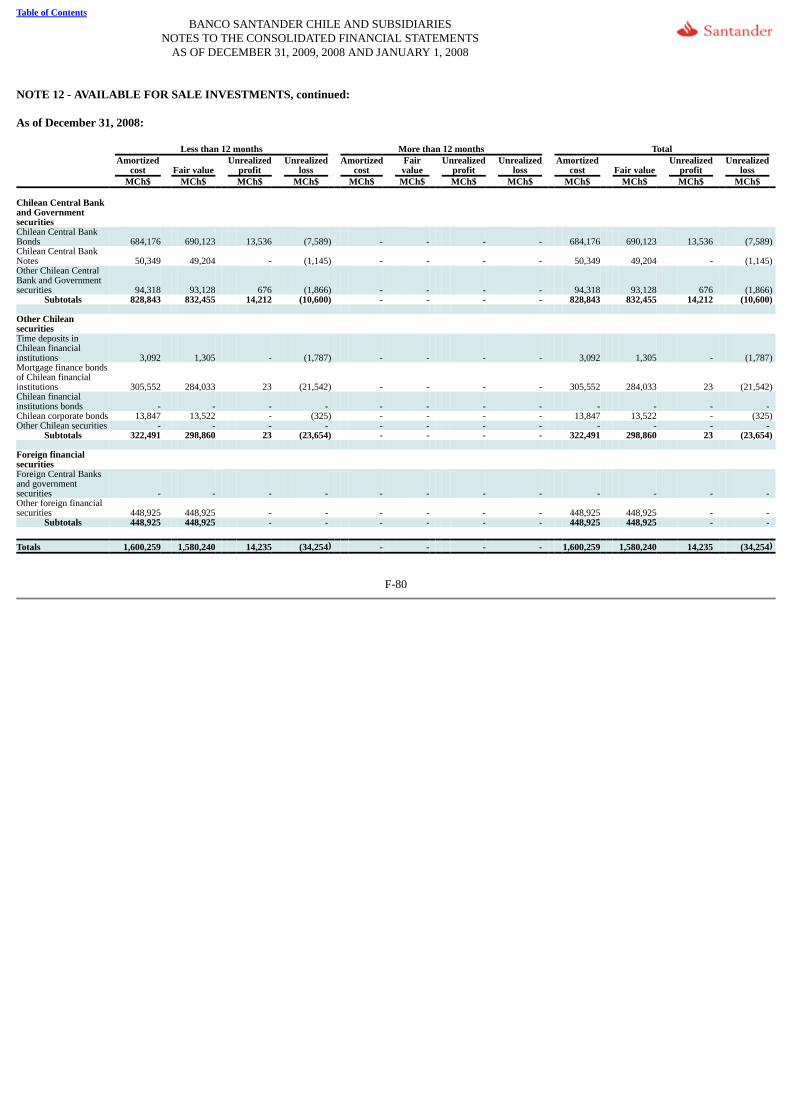
Table of ContentsBANCO SANTANDER CHILE AND SUBSIDIARIES
NOTES TO THE CONSOLIDATED FINANCIAL STATEMENTSAS OF DECEMBER 31, 2009, 2008 AND JANUARY 1, 2008
NOTE 12 - AVAILABLE FOR SALE INVESTMENTS, continued:
As of December 31, 2008:
Less than 12 months More than 12 months Total
Amortized
cost Fair value Unrealized
profit Unrealized
loss Amortized
cost Fairvalue
Unrealizedprofit
Unrealizedloss
Amortizedcost Fair value
Unrealizedprofit
Unrealizedloss
MCh$ MCh$ MCh$ MCh$ MCh$ MCh$ MCh$ MCh$ MCh$ MCh$ MCh$ MCh$ Chilean Central Bankand Governmentsecurities Chilean Central BankBonds 684,176 690,123 13,536 (7,589) - - - - 684,176 690,123 13,536 (7,589)Chilean Central BankNotes 50,349 49,204 - (1,145) - - - - 50,349 49,204 - (1,145)Other Chilean CentralBank and Governmentsecurities 94,318 93,128 676 (1,866) - - - - 94,318 93,128 676 (1,866)
Subtotals 828,843 832,455 14,212 (10,600) - - - - 828,843 832,455 14,212 (10,600) Other Chileansecurities Time deposits inChilean financialinstitutions 3,092 1,305 - (1,787) - - - - 3,092 1,305 - (1,787)Mortgage finance bondsof Chilean financialinstitutions 305,552 284,033 23 (21,542) - - - - 305,552 284,033 23 (21,542)Chilean financialinstitutions bonds - - - - - - - - - - - - Chilean corporate bonds 13,847 13,522 - (325) - - - - 13,847 13,522 - (325)Other Chilean securities - - - - - - - - - - - -
Subtotals 322,491 298,860 23 (23,654) - - - - 322,491 298,860 23 (23,654) Foreign financialsecurities Foreign Central Banksand governmentsecurities - - - - - - - - - - - - Other foreign financialsecurities 448,925 448,925 - - - - - - 448,925 448,925 - -
Subtotals 448,925 448,925 - - - - - - 448,925 448,925 - -
Totals 1,600,259 1,580,240 14,235 (34,254) - - - - 1,600,259 1,580,240 14,235 (34,254)
F-80

Table of ContentsBANCO SANTANDER CHILE AND SUBSIDIARIES
NOTES TO THE CONSOLIDATED FINANCIAL STATEMENTSAS OF DECEMBER 31, 2009, 2008 AND JANUARY 1, 2008
NOTE 12 - AVAILABLE FOR SALE INVESTMENTS, continued:
As of January 1, 2008:
Less than 12 months More than 12 months Total
Amortized
cost Fairvalue
Unrealizedprofit
Unrealizedloss
Amortizedcost
Fairvalue
Unrealizedprofit
Unrealizedloss
Amortizedcost
Fairvalue
Unrealizedprofit
Unrealizedloss
MCh$ MCh$ MCh$ MCh$ MCh$ MCh$ MCh$ MCh$ MCh$ MCh$ MCh$ MCh$ Chilean Central Bank andGovernment securities Chilean Central BankBonds 282,995 282,561 175 (609) - - - - 282,995 282,561 175 (609)Chilean Central Bank Notes 54,358 54,305 15 (68) - - - - 54,358 54,305 15 (68)Other Chilean Central Bankand Government securities 109,993 109,194 264 (1,063) - - - - 109,993 109,194 264 (1,063)
Subtotals 447,346 446,060 454 (1,740) - - - - 447,346 446,060 454 (1,740) Other Chilean securities Time deposits in Chileanfinancial institutions - - - - - - - - - - - - Mortgage finance bonds ofChilean financialinstitutions 277,155 273,010 542 (4,687) - - - - 277,155 273,010 542 (4,687)Chilean financialinstitutions bonds - - - - - - - - - - - - Chilean corporate bonds 10,755 10,638 - (117) - - - - 10,755 10,638 - (117)Other Chilean securities - - - - - - - - - - - -
Subtotals 287,910 283,648 542 (4,804) - - - - 287,910 283,648 542 (4,804) Foreign financialsecurities Foreign Central Banks andgovernment securities - - - - - - - - - - - - Other foreign financialsecurities 49,927 49,927 - - - - - - 49,927 49,927 - -
Subtotals 49,927 49,927 - - - - - - 49,927 49,927 - -
Totals 785,183 779,635 996 (6,544) - - - - 785,183 779,635 996 (6,544)
F-81

Table of ContentsBANCO SANTANDER CHILE AND SUBSIDIARIES
NOTES TO THE CONSOLIDATED FINANCIAL STATEMENTSAS OF DECEMBER 31, 2009, 2008 AND JANUARY 1, 2008
NOTE 13 - INVESTMENTS IN OTHER COMPANIES:
a) The Consolidated Statements of Financial Position reflects investments in other companies amounting to Ch$7,417 million as of December 31, 2009,Ch$7,277 million as of December 31, 2008 and Ch$7,301 million as of January 1, 2008, as shown in the following table:
Investment
Ownership interest Carrying value Participation in
Income
As of December 31,
As ofJanuary
1, As of December 31,
As ofJanuary
1, As of December 31, 2009 2008 2008 2009 2008 2008 2009 2008 % % % MCh$ MCh$ MCh$ MCh$ MCh$ Companies Centro de Compensación Automatizado 33.33 33.33 33.33 304 300 275 18 44 Redbank S.A. 33.43 33.43 33.43 1,756 1,680 1,410 191 145 Transbank S.A. 32.71 32.71 32.71 2,292 2,256 2,112 317 403 Sociedad Interbancaria de Depósito deValores S.A. 29.28 29.28 29.28 415 380 346 93 19 Sociedad Nexus S.A. 12.90 12.90 12.90 921 932 903 94 147 Administrador Financiero del TransantiagoS.A.(1) (11) 20.00 20.00 20.00 583 536 813 (614) (308)Cámara Compensación de Alto Valor S.A.(3) (5) 12.65 11.52 11.52 422 390 369 66 97
Subtotals 6,693 6,474 6,228 165 547 Shares or rights in other companies (*) (*) (*) Bolsas de Comercio (8) (9) - - - 358 358 664 69 85 Other (2) (4) (6) (7) (10) - - - 366 445 409 63 -
Totals - - - 7,417 7,277 7,301 297 632
(*) These investments in shares are maintained by the Bank and its subsidiaries because they are required to obtain the right to operate according to its lineof business. The ownership interest in these companies is lesser than 1%.
(1) On November 30, 2009, by means of a letter addressed to the Superintendence of Securities and Insurance, Administrador Financiero del TransantiagoS.A. reported that, in accordance with the implementation of the IFRS standards, it had modified its equity as of December 31, 2009 to record UF210,750 (Ch$ 4,414 million as of December 31, 2009) of accumulated income which it had previously held in deferred liabilities. Banco SantanderChile recorded that higher value of investment against accumulated income in the amount of Ch$853 million.
(2) On June 26, 2009 Banco Santander Chile sold all of its Mastercard shares, totaling 16,049 shares with a value of Ch$1,453 million, generating aCh$1,370 million profit from the sale, which is presented in the “Non-operating income” item of the Consolidated Statement of Income.
(3) On April 21, 2009 Banco Penta sold and transferred to Banco Santander Chile 55 shares in the Cámara Compensación de Alto Valor S.A. at a total priceof Ch$16 million.
(4) On March 10, 2009 Visa Inc. transferred to Banco Santander Chile a total of 34,093 LAC class shares. On March 20, 2009, 51% of these shares weresold, totalling 17,387 shares, at a price of Ch$27,442 per share, generating an income of Ch$477 million, which is included in Other operating incomein the Consolidated Statement of Income.
(5) On March 9, 2009 Banco Ripley sold and transferred to Banco Santander Chile 54 shares in the Cámara Compensación de Alto Valor S.A. for a totalprice of Ch$16 million.
(6) On August 18, 2008, 36 SWIFT shares were sold. At the time of the sale their book value was Ch$45 million and their sale price was Ch$51 million,generating a Ch$6 million gain on the sale.
F-82

Table of ContentsBANCO SANTANDER CHILE AND SUBSIDIARIES
NOTES TO THE CONSOLIDATED FINANCIAL STATEMENTSAS OF DECEMBER 31, 2009, 2008 AND JANUARY 1, 2008
NOTE 13 - INVESTMENTS IN OTHER COMPANIES, continued:
(7) On March 12, 2008 Visa Inc. transferred to Banco Santander Chile a total of 312,379 Class C, Series 1, shares valued at Ch$1 in local currency. OnMarch 28, 2008, 56.19% of the total number of shares, numbering 175,512 shares, was sold at a price of Ch$19,190 per share, generating a Ch$3,368million gain on the sale.
(8) On January 14, 2008 the Santander S.A. Corredores de Bolsa subsidiary sold one share in the Bolsa de Comercio de Santiago. Its book value at the timeof the sale was Ch$341 million and its sale price was Ch$1,315 million, generating a Ch$974 million gain on the sale.
(9) In August 2007, Santander S.A. Corredores de Bolsa sold one share in the Bolsa de Comercio de Santiago. The sale price was Ch$1,215 million and theprofit generated was Ch$826 million.
(10) In November 2007, 17,000 shares in the Mastercard company were sold, generating a Ch$1,439 million profit, which is shown in the non-operatingitem of the Consolidated Statement of Income.
(11) On December 21, 2007, it was decided by a Special Shareholders Meeting of the Administradora Financiero del Transantiago S.A. company tocapitalize the commercial credit account which was granted by its shareholders, for a total of Ch$11,107 million. Banco Santander Chile owns 20% ofthat company, and accordingly, its contribution was Ch$2,221 million.
During 2009, the Bank received Ch$833 million (Ch$638 million in 2008) as dividends from its related companies.
b) Activity with respect to investments in other companies during 2009 and 2008 is as follows:
As of December 31, 2009 2008 MCh$ MCh$
Initial book value 7,277 7,301 Acquisition of equity 32 - Sale of equity (209) (386)Participation in income 297 632 Dividends received (833) (638)Other equity adjustments 853 368
Totals 7,417 7,277 c) Investments in other companies has not undergone any impairment in 2009 and 2008.
F-83

Table of ContentsBANCO SANTANDER CHILE AND SUBSIDIARIES
NOTES TO THE CONSOLIDATED FINANCIAL STATEMENTSAS OF DECEMBER 31, 2009, 2008 AND JANUARY 1, 2008
NOTE 14 - INTANGIBLE ASSETS:
a) Intangible assets as of December 31, 2009, 2008 and January 1, 2008 is as follows:
2009
Useful life
(years)
Remainingamortization
(years)
Openingbalance as ofJanuary 1,
2009 Gross
balance Accumulatedamortization Net balance
MCh$ MCh$ MCh$ MCh$ Licenses 3 1.8 1,732 4,422 (2,878) 1,544 Softwares (acquired) 3 2 66,500 123,939 (48,223) 75,716
Totals 68,232 128,361 (51,101) 77,260
2008
Useful life
(years)
Remainingamortization
(years)
Openingbalance as ofJanuary 1,
2008 Gross
balance Accumulatedamortization Net balance
MCh$ MCh$ MCh$ MCh$ Licenses 3 1.6 2,420 3,194 (1,462) 1,732 Software development (acquired) 3 2 53,804 91,207 (24,707) 66,500
Totals 56,224 94,401 (26,169) 68,232
b) The activity in intangible assets during 2009 and 2008 is as follows:
b.1) Gross balance
Licenses
Softwaredevelopment
(acquired) Total MCh$ MCh$ MCh$ Gross balances 2009 Opening balances as of January 1, 2009 3,194 91,207 94,401 Acquisitions 1,228 32,732 33,960 Other - - -
Balances as of December 31, 2009 4,422 123,939 128,361 Gross balances 2008 Opening balances as of January 1, 2008 (*) 2,420 53,804 56,224 Acquisitions 774 37,403 38,177 Other - - -
Balance as of December 31, 2008 3,194 91,207 94,401
(*) On January 1, 2008, intangible assets were recorded at their amortized cost value, net of accumulated amortization.
F-84

Table of ContentsBANCO SANTANDER CHILE AND SUBSIDIARIES
NOTES TO THE CONSOLIDATED FINANCIAL STATEMENTSAS OF DECEMBER 31, 2009, 2008 AND JANUARY 1, 2008
NOTE 14 - INTANGIBLE ASSETS, continued:
b.2) Accumulated amortization
Accumulated amortization Licenses Softwares(acquired) Total
MCh$ MCh$ MCh$ Opening balances as of January 1, 2009 (1,462) (24,707) (26,169)Amortization for the period (1,416) (23,516) (24,932)Other changes in book value in the period - - - Balances as of December 31, 2009 (2,878) (48,223) (51,101) Opening balances as of January 1, 2008 (*) - - - Amortization for the period (1,462) (24,707) (26,169)Other changes in book value in the period - - - Balances as of December 31, 2008 (1,462) (24,707) (26,169)
(*) On January 1, 2008, intangible assets were recorded at their amortized cost value, net of accumulated amortization.
F-85

Table of ContentsBANCO SANTANDER CHILE AND SUBSIDIARIES
NOTES TO THE CONSOLIDATED FINANCIAL STATEMENTSAS OF DECEMBER 31, 2009, 2008 AND JANUARY 1, 2008
NOTE 15 - PROPERTY, PLANT AND EQUIPMENT:
a) Property, plant and equipment as of December 31, 2009, 2008 and January 1, 2008 is as follows:
2009
Openingbalance as ofJanuary 1,
2009 Gross
balance Accumulateddepreciation Net balance
MCh$ MCh$ MCh$ MCh$ Land and buildings 170,197 180,868 (18,946) 161,922 Equipment 15,597 27,993 (14,602) 13,391 Ceded under operating leases 4,092 727 (38) 689 Other 10,503 17,513 (9,393) 8,120 Totals 200,389 227,101 (42,979) 184,122
2008
Openingbalance as ofJanuary 1,
2008 Gross
balance Accumulateddepreciation Net balance
MCh$ MCh$ MCh$ MCh$ Land and buildings 169,409 178,502 (8,305) 170,197 Equipment 17,135 22,990 (7,393) 15,597 Ceded under operating leases 4,161 4,161 (69) 4,092 Other 11,784 16,150 (5,647) 10,503 Totals 202,489 221,803 (21,414) 200,389
F-86

Table of ContentsBANCO SANTANDER CHILE AND SUBSIDIARIES
NOTES TO THE CONSOLIDATED FINANCIAL STATEMENTSAS OF DECEMBER 31, 2009, 2008 AND JANUARY 1, 2008
NOTE 15 - PROPERTY, PLANT AND EQUIPMENT, continued:
b) The activity in property, plant and equipment during the 2009 and 2008 periods is as follows:
b.1) Gross balance
2009 Land andbuildings Equipment
Ceded underoperating
leases Other Total Cost MCh$ MCh$ MCh$ MCh$ MCh$
Opening balances as of January 1, 2009 178,502 22,990 4,161 16,150 221,803 Additions 5,730 5,085 - 941 11,756 Disposals (iii) (2,637) (7) (4,161) (19) (6,824)Impairment due to damage (i) - (75) - - (75)Transfers (727) - 727 441 441 Other - - - - - Balances as of December 31, 2009 180,868 27,993 727 17,513 227,101
2008 Land andbuildings Equipment
Ceded underoperating
leases Other Total Cost MCh$ MCh$ MCh$ MCh$ MCh$
Opening balances as of January 1, 2008 (ii) 169,409 17,135 4,161 11,784 202,489 Additions 10,310 5,949 - 3,303 19,562 Disposals (1,217) (10) - (48) (1,275)Impairment due to damages - (84) - - (84)Transfers - - - - - Other - - - 1,111 1,111 Balances as of December 31, 2008 178,502 22,990 4,161 16,150 221,803
(i) During 2009 the Bank recorded impairment due to damage to property, plant and equipment totaling Ch$75 million. The indemnification paymentreceived from the insurance company for this damage is shown in “Other revenues” in the Consolidated Statement of Income.
(ii) As of January 1, 2008 the Bank determined the cost attributed to its property, plant and equipment choosing the lower of each asset’s historical cost(including its respective price-level restatements up to December 31, 2007) and its fair value based on an appraisal thereof by an independent third-partyappraiser. That is why the property, plant and equipment as of January 1, 2008 are recorded at their amortized cost value, net of accumulateddepreciation.
(iii) On December 30, 2009 the Bank sold a building it had received in payment, located at calle Bandera No.201, to IM Trust Administradora General deFondos for Fondo de Inversión Privado Inmobiliario Bandera, a private real estate investment fund, as is disclosed in Note 3, subsection c.
F-87

Table of ContentsBANCO SANTANDER CHILE AND SUBSIDIARIES
NOTES TO THE CONSOLIDATED FINANCIAL STATEMENTSAS OF DECEMBER 31, 2009, 2008 AND JANUARY 1, 2008
NOTE 15 - PROPERTY, PLANT AND EQUIPMENT, continued:
b.2) Accumulated depreciation
2009 Land and
constructions Equipment
Ceded underoperating
leases Other Total Cost MCh$ MCh$ MCh$ MCh$ MCh$
Opening balances as of January 1, 2009 (8,305) (7,393) (69) (5,647) (21,414)Depreciation charges in the period (10,705) (7,209) (31) (3,746) (21,691)Sales and disposals in the period (iii) 64 - 62 - 126 Discontinued operations - - - - - Balances as of December 31, 2009 (18,946) (14,602) (38) (9,393) (42,979)
2008 Land and
constructions Equipment
Ceded underoperating
leases Other Total Cost MCh$ MCh$ MCh$ MCh$ MCh$
Opening balances as of January 1, 2008 - - - - - Depreciation charges in the period (8,349) (7,393) (69) (5,647) (21,458)Sales and disposals in the period 44 - - - 44 Discontinued operations - - - - - Balances as of December 31, 2008 (8,305) (7,393) (69) (5,647) (21,414)
c) As of December 31, 2009 and 2008, the Bank has operating leases which cannot be unilaterally rescinded. The information on future payments is brokendown as follows:
Up to 1 year From 1 to 5
years More than 5
years Total As of December 31, 2009 (iii) - - 2,463 2,463 As of December 31, 2008 - - 21,999 21,999 d) As of December 31, 2009 and 2008, the Bank has no financial leases which cannot be unilaterally rescinded.
F-88

Table of ContentsBANCO SANTANDER CHILE AND SUBSIDIARIES
NOTES TO THE CONSOLIDATED FINANCIAL STATEMENTSAS OF DECEMBER 31, 2009, 2008 AND JANUARY 1, 2008
NOTE 16 - CURRENT TAXES AND DEFERRED TAXES:
a) Current Taxes
At the end of each year the bank recognizes a Provision for Income Tax, which is determined based on the currently applicable tax legislation and reflectedliabilities of Ch$59,290 million for 2009 (a Ch$17,924 million asset as of December 31, 2008 and a Ch$13,568 million liability as of January 1, 2008). Thisprovision is recorded net of taxes recoverable, as shown as follows:
As of December 31, As of
January 1, 2009 2008 2008 MCh$ MCh$ MCh$ Summary of current tax liabilities (assets) Current taxes (assets) (4,541) (18,715) (2,499)Current taxes (liabilities) 63,831 791 16,067 Total tax payable (recoverable) 59,290 (17,924) 13,568 (Assets) liabilities current taxes detail (net) Income tax, tax rate 17% 106,882 66,318 66,568 Minus: Provisional monthly payments (PPM) (41,061) (75,962) (61,226)PPM from accrued losses, Article No.31, part 3 - - (13)Credit for training expenses (1,148) (1,262) (315)Other (5,383) (7,018) 8,554 Total tax payable (recoverable) 59,290 (17,924) 13,568
b) Effect on income
The effect of tax expense on income during the periods from January 1 to December 31, 2009 and 2008 is comprised of the following items:
As of December 31, 2009 2008 MCh$ MCh$ Income tax expenses Current tax 106,882 66,318 Credits (debits) for deferred taxes Origination and reversal of temporary differences (18,154) (641)Prior years tax benefit - (3,367)
Subtotals 88,728 62,310 Tax for rejected expenses Article No.21 196 221 Other - (2,789) Net charges to income for income tax 88,924 59,742
Years open for review by tax authorities
As of December 31, 2009 and 2008, the Bank has, in addition to the two years mentioned below, 2005, 2006 and 2007 open for review in relation to the maintaxes applicable to it. The other consolidated entities have the corresponding years open for review, pursuant to their respective tax regulations. Because of the possible different interpretations which can be made of the tax regulations, the outcome of the tax audits of the years reviewed and of the openyears might give rise to contingent tax liabilities which cannot be objectively quantified. However, the Bank’s tax advisers consider that the possibility of suchcontingent liabilities becoming actual liabilities is remote, and that in any event the tax charge which arises there from tax audits would not materially affect theconsolidated financial statements of the Bank.
F-89

Table of ContentsBANCO SANTANDER CHILE AND SUBSIDIARIES
NOTES TO THE CONSOLIDATED FINANCIAL STATEMENTSAS OF DECEMBER 31, 2009, 2008 AND JANUARY 1, 2008
NOTE 16 - CURRENT TAXES AND DEFERRED TAXES, continued:
c) Effective tax rate reconciliation
The reconciliation between the income tax rate and the effective rate applied in determining tax expenses as of December 31, 2009 and 2008, is as follows:
As of December 31, 2009 2008
Tax rate Amount Tax rate Amount % MCh$ % MCh$ Income before tax 17.00 89,341 17.00 81,721 Permanent differences (0.06) (304) (4.61) (22,151)Additions or deductions (0.05) (250) - - Unique tax (rejected expenses) 0.04 188 0.05 221 Other (0.01) (51) (0.01) (49)
Effective rates and expenses for income tax 16.92 88,924 12.43 59,742
The variation between the tax expenses in 2009 and 2008 was caused by the recognition of Ch$115,763 million for a price-level restatement of equity for taxpurposes as an expense in 2008, leading to a Ch$19,680 million decrease in tax expense. This effect did not exist in 2009, because there was no price-levelrestatement for tax purposes due to the negative CPI variation.
d) Effect of deferred taxes on equity
Below is a summary of the separate effect of deferred tax on Equity, showing the asset and liability balances, during the periods between January 1, 2008 andDecember 31, 2009 and 2008, which consists of the following items:
As of December 31, As of
January 1, 2009 2008 2008 MCh$ MCh$ MCh$ Deferred tax assets
Available for sale investments 4,982 3,403 943 Cash flow hedge 537 - 997
Total deferred tax assets affecting equity 5,519 3,403 1,940 Deferred tax liabilities
Cash flow hedge - (1,848) - Total deferred tax liabilities affecting equity - (1,848) - Net deferred tax balances in equity 5,519 1,555 1,940 Deferred taxes in equity attributable to Bank shareholders 5,490 1,547 1,940 Deferred tax in equity attributable to minority interest 29 8
F-90

Table of ContentsBANCO SANTANDER CHILE AND SUBSIDIARIES
NOTES TO THE CONSOLIDATED FINANCIAL STATEMENTSAS OF DECEMBER 31, 2009, 2008 AND JANUARY 1, 2008
NOTE 16 - CURRENT TAXES AND DEFERRED TAXES, continued:
e) Effect of deferred taxes on income
In 2009 and 2008 and on January 1, 2008, the Bank has recorded deferred tax effects in its financial statements.
Below are the effects of deferred taxes on assets, liabilities, and income assigned as a result of timing differences:
As of December 31, As of
January 1, 2009 2008 2008 MCh$ MCh$ MCh$ Deferred tax assets Interest 2,012 615 4,511 Extraordinary charge-off 8,804 9,076 5,958 Assets received in lieu of payment 210 433 337 Exchange rate adjustments 35 1,926 806 Valuation of Property, plant and equipment 7,472 10,306 17,642 Allowance for loan losses 43,420 31,583 28,133 Provision for expenses 6,556 11,385 3,275 Derivatives 17 2,111 34 Leased assets 19,241 3,374 8,268 Affiliates’ tax losses 51 3,920 3,881 Other 1,507 10,370 5,536
Total deferred tax assets 89,325 85,099 78,381 Deferred tax liabilities Valuation of investments (2,512) (147) (4,050) Depreciation (78) (13,748) (4,584) Prepaid expenses (519) (2,439) (1,837) Other (271) (1,255) (613)
Total deferred tax liabilities (3,380) (17,589) (11,084)
f) Summary of deferred tax assets and liabilities
Below is a summary of the deferred tax assets and liabilities, indicating their effect on both equity and income:
As of December 31, As of
January 1, 2009 2008 2008 MCh$ MCh$ MCh$ Deferred tax assets Affecting equity 5,519 3,403 1,940 Affecting income 89,325 85,099 78,381
Total deferred tax assets 94,844 88,502 80,321 Deferred tax liabilities Affecting equity - (1,848) - Affecting income (3,380) (17,589) (11,084)
Total deferred tax liabilities (3,380) (19,437) (11,084)
F-91

Table of ContentsBANCO SANTANDER CHILE AND SUBSIDIARIES
NOTES TO THE CONSOLIDATED FINANCIAL STATEMENTSAS OF DECEMBER 31, 2009, 2008 AND JANUARY 1, 2008
NOTE 17 - OTHER ASSETS:
The Other assets item’s composition is as follows:
As of December 31, As of
January 1, 2009 2008 2008 MCh$ MCh$ MCh$ Assets for leasing (*) 52,070 101,952 59,574 Assets received in lieu of payment (**)
Received in lieu of payment 13,146 7,407 4,993 Awarded in judicial sale 2,179 13,807 9,158 Provision for assets received in lieu of payment (908) (1,649) (2,360)
Subtotals 14,417 19,565 11,791 Other assets
Guarantee deposits 229,083 157,862 189,539 VAT credit 7,180 7,104 7,157 Income tax recoverable 15,261 10,811 7,348 Prepaid expenses 8,960 11,635 12,364 Assets recovered from leasing for sale 985 1,326 3,843 Pension plan assets (Note 37) 4,893 - - Accounts and notes receivable 53,196 84,906 43,071 Notes receivable through brokerage and simultaneous transactions 60,622 74,875 84,009 Higher value paid on purchase of mortgage finance bonds issued by Bank 561 847 1,300 Other assets 7,595 39,670 44,214
Subtotals 388,336 389,036 392,845
Totals 454,823 510,553 464,210
(*) Assets available to be granted under the financial leasing agreements.
(**) The assets received in lieu of payment are assets received as payment of customers’ past-due debts. The assets acquired must at no time exceed, in theaggregate, 20% of the Bank’s effective equity. These assets represent 0.52% (0.84% as of December 31, 2008 and 0.49% as of January 1, 2008) of theBank’s effective equity.
The assets awarded at judicial sale are assets that have been acquired as payment of debts previously owed towards the Bank. The assets awarded atjudicial sales are not subject to the aforementioned margin. These properties are assets available for sale. For most assets, the sale is expected to becompleted within one year from the date on which the asset was received or acquired. If the asset in question is not sold within the year, it must bewritten off.
In addition, a provision is recorded for the difference between the initial award value plus its additions and its estimated realization value (appraisal)when the first is higher.
F-92

Table of ContentsBANCO SANTANDER CHILE AND SUBSIDIARIES
NOTES TO THE CONSOLIDATED FINANCIAL STATEMENTSAS OF DECEMBER 31, 2009, 2008 AND JANUARY 1, 2008
NOTE 18 - DEPOSITS AND OTHER LIABILITIES:
As of December 31, 2009, 2008 and January 1, 2008, the composition of Deposits and other liabilities is as follows:
As of December 31, As of
January 1, 2009 2008 2008 MCh$ MCh$ MCh$ Deposits and other demand liabilities
Checking accounts 2,776,607 2,268,991 2,123,221 Other deposits and demand accounts 303,495 206,347 281,993 Other demand liabilities 453,432 472,824 462,720
Totals 3,533,534 2,948,162 2,867,934 Time deposits and other time liabilities
Time deposits 4,219,392 9,476,024 7,651,725 Time savings accounts 98,985 102,951 97,155 Other time liabilities 2,856,880 177,291 139,017
Totals 7,175,257 9,756,266 7,887,897
F-93

Table of ContentsBANCO SANTANDER CHILE AND SUBSIDIARIES
NOTES TO THE CONSOLIDATED FINANCIAL STATEMENTSAS OF DECEMBER 31, 2009, 2008 AND JANUARY 1, 2008
NOTE 19 - INTERBANK BORROWINGS:
At December 31, 2009 and 2008 financial statements and as of January 1, 2009, interbank borrowings are as follows:
As of December 31, As of
January 1, 2009 2008 2008 MCh$ MCh$ MCh$ Loans from financial institutions and the Central Bank of Chile
Other obligations to the Central Bank of Chile 1,850 3,012 3,972 Subtotals 1,850 3,012 3,972
Loans from domestic financial institutions The Royal Bank of Scotland 1,500 - - The Bank of Tokyo Mitsubishi 4,800 5,003 - Banco de Crédito e Inversiones 20,001 - -
Subtotals 26,301 5,003 - Loans from foreign financial institutions
Banco Santander – Hong Kong 457,610 - - Wachovia Bank N.A. Miami 211,480 204,826 121,008 Standard Chartered Bank, New York 193,176 9,620 44,864 Banco Santander – Madrid 190,539 - 19,581 Bayerische Landesbank 183,329 232,631 217,244 Bank of America 131,784 76,559 59,734 Citibank N.A. New York 91,994 41,231 24,889 Banco Santander – Montevideo 75,155 - - Bank of Montreal – Toronto 68,681 - 44,824 J.P. Morgan Chase Bank N.A. New York 63,501 45,412 - The Toronto Dominion Bank – Toronto 55,935 12,859 49,829 Commerzbank A.G.-Frankfurt 55,831 - - Landesbank Baden-Wuerttemberg 50,802 195,357 102,699 Intesa San Paolo SPA U.S.A. 45,833 35,328 32,397 Banesto New York 35,536 16,057 - Sumitomo Mitsui Banking Corporation 35,636 29,191 - Banco Latinoamericano de Comercio 30,533 - - Commercebank N.A. – Miami 15,286 - - Deutsche Bank A.G. New York 13,971 32,134 - Dresdner Bank A.C. - 70,730 - Bank of Montreal - 64,474 - Caja de Madrid - 48,284 32,558 HSBC Bank USA London - 32,409 - ABN Amro Bank N.V. Amsterdam - 25,798 49,778 ING Bank N.V. Amsterdam - 23,783 14,999 Santander Overseas Bank - 19,776 3,851 Unicrédito Italiano New York - 19,574 12,445 The Bank of New York Mellon - 19,269 - Standard Chartered Bank, Hong Kong - 16,253 - Toronto Dominion Bank Singapur - 17,645 - American Express Bank, Ltd (USA) - 12,898 16,925 Raiffeisen Zentralbank Oesterr - 12,852 - BNP Paribas, Panamá Branch - 12,844 - Toronto Dominion Bank - 12,835 - Credit Suisse, Zurich - 9,731 - BHF-Bank Aktiengesellscjatft - 9,684 - WGZ Bank A.G. Westdeutsche Genos - 7,707 5,995 National Westminster Bank PLC - - 49,984 The Chase Manhattan Bank – New York - - 39,325 Dresdner Bank A.G. – Frankfurt - - 34,997 HSBC Holding - - 24,889 The Bank of New York - - 19,911 National City Bank Cleveland - - 14,933 Banco Español de Crédito - - 9,956 Other 12,027 49,301 47,870
Subtotals 2,018,639 1,417,052 1,095,485
Totals 2,046,790 1,425,067 1,099,457
F-94

Table of ContentsBANCO SANTANDER CHILE AND SUBSIDIARIES
NOTES TO THE CONSOLIDATED FINANCIAL STATEMENTSAS OF DECEMBER 31, 2009, 2008 AND JANUARY 1, 2008
NOTE 19 - INTERBANK BORROWINGS, continued:
a) Obligations to the Central Bank of Chile
Debts to the Central Bank of Chile include credit lines for the renegotiation of loans and other Central Bank borrowings. These credit lines were provided by theCentral Bank of Chile for the renegotiation of loans due to the need to refinance debt as a result of the economic recession and crisis of the banking system in theearly 1980s. The lines of credit for the renegotiations, which are considered long-term, are related to mortgage loans linked to the UF index and bore a realannual interest rate of 3% as of December 31, 2009, 2008 and January 1, 2008.
The outstanding amounts owed to the Central Bank of Chile under these credit lines are as follows:
As of December 31, As of
January 1, 2009 2008 2008 MCh$ MCh$ MCh$ Totals Line of credit for renegotiation of obligations to the Central Bank of Chile 1,850 3,012 3,972
b) Loans from domestic financial institutions
These obligations’ maturities are as follows:
As of December 31, As of
January 1, 2009 2008 2008 MCh$ MCh$ MCh$ Due within 1 year 26,301 5,003 - Due after 1 year but within 2 years - - - Due after 2 years but within 3 years - - - Due after 3 years but within 4 years - - - Due after 5 years - - - Totals loans from domestic financial institutions 26,301 5,003 -
c) Foreign obligations
These obligations’ maturities are as follows:
As of December 31, As of
January 1, 2009 2008 2008 MCh$ MCh$ MCh$ Due within 1 year 1,812,296 1,107,997 608,889 Due after 1 year but within 2 years 206,343 143,555 241,588 Due after 2 years but within 3 years - 165,500 115,430 Due after 3 years but within 4 years - - 129,578 Due after 5 years - - -
Totals loans from foreign financial institutions 2,018,639 1,417,052 1,095,485
The foreign obligations are generally issued in U.S. dollars and are mainly used to fund foreign commercial loans of the Bank; they have average per annuminterest rates of 1.4% and 3.9% as of December 31, 2009 and 2008, respectively, and of 1.3% as of January 1, 2008.
F-95

Table of ContentsBANCO SANTANDER CHILE AND SUBSIDIARIES
NOTES TO THE CONSOLIDATED FINANCIAL STATEMENTSAS OF DECEMBER 31, 2009, 2008 AND JANUARY 1, 2008
NOTE 20 - DEBT INSTRUMENTS ISSUED AND OTHER OBLIGATIONS:
As of December 31, 2009, 2008 and January 1, 2008, the composition of this item is as follows:
As of December 31, As of
January 1, 2009 2008 2008 MCh$ MCh$ MCh$ Other financial obligations Obligations to the public sector 90,144 62,259 38,371 Other domestic obligations 55,015 55,903 61,884 Foreign obligations 1,752 13,156 75,412
Subtotals 146,911 131,318 175,667 Debt instruments issued Mortgage finance bonds 263,864 344,680 434,275 Senior bonds 2,068,786 1,618,780 1,225,007 Subordinated bonds 592,026 687,912 495,714
Subtotals 2,924,676 2,651,372 2,154,996
Totals 3,071,587 2,782,690 2,330,663 The debts classified as short term are either demand obligations or will mature in one year or less. All other debts are classified as long term. The Bank’s debts,both short and long-term, are summarized below:
As of December 31, 2009 Long term Short term Total MCh$ MCh$ MCh$ Mortgage finance bonds 213,853 50,011 263,864 Senior bonds 1,901,972 166,814 2,068,786 Subordinated bonds 592,026 - 592,026 Debt instruments issued 2,707,851 216,825 2,924,676 Other financial obligations 109,013 37,898 146,911
Totals 2,816,864 254,723 3,071,587
F-96

Table of ContentsBANCO SANTANDER CHILE AND SUBSIDIARIES
NOTES TO THE CONSOLIDATED FINANCIAL STATEMENTSAS OF DECEMBER 31, 2009, 2008 AND JANUARY 1, 2008
NOTE 20 - DEBT INSTRUMENTS ISSUED AND OTHER OBLIGATIONS, continued:
As of December 31, 2008 Long term Short term Total MCh$ MCh$ MCh$ Mortgage finance bonds 289,913 54,767 344,680 Senior bonds 1,362,198 256,582 1,618,780 Subordinated bonds 687,912 - 687,912 Debt instruments issued 2,340,023 311,349 2,651,372 Other financial obligations 32,277 99,041 131,318
Totals 2,372,300 410,390 2,782,690
As of January 1, 2008 Long term Short term Total MCh$ MCh$ MCh$ Mortgage finance bonds 376,847 57,428 434,275 Senior bonds 1,225,007 - 1,225,007 Subordinated bonds 495,714 - 495,714 Debt instruments issued 2,097,568 57,428 2,154,996 Other financial obligations 33,749 141,918 175,667
Totals 2,131,317 199,346 2,330,663
a) Mortgage finance bonds
These bonds are used to finance mortgage loans. The outstanding principal of the bonds are amortized on a quarterly basis. The range of maturities of thesebonds is between five and twenty years. The bonds are linked to the UF index and bear a weighted-average annual interest rate of 4.7% as of December 2009 and4.6% as of December 2008.
As of December 31, As of
January 1, 2009 2008 2008 MCh$ MCh$ MCh$ Due within 1 year 50,011 54,767 57,428 Due after 1 year but within 2 years 31,804 41,211 47,461 Due after 2 years but within 3 years 28,574 37,635 45,331 Due after 3 years but within 4 years 23,277 31,284 41,456 Due after 4 years but within 5 years 27,350 33,655 36,951 Due after 5 years 102,848 146,128 205,648
Mortgage finance bonds totals 263,864 344,680 434,275
F-97

Table of ContentsBANCO SANTANDER CHILE AND SUBSIDIARIES
NOTES TO THE CONSOLIDATED FINANCIAL STATEMENTSAS OF DECEMBER 31, 2009, 2008 AND JANUARY 1, 2008
NOTE 20 - DEBT INSTRUMENTS ISSUED AND OTHER OBLIGATIONS, continued:
b) Senior Bonds
The following table shows, at the indicated dates, our senior bonds issued.
As of December 31, As of
January 1, 2009 2008 2008 MCh$ MCh$ MCh$ Santander Bonds denominated in UF 1,660,877 1,362,198 1,025,758 Santander Bonds denominated in US $ 407,909 256,582 199,249
Senior bonds totals 2,068,786 1,618,780 1,225,007
In 2009 the Bank places bonds for UF 16,289,000 and USD 800,000.000.
Bonds
Series Amount Term Issue Rate Issue Date Maturity Date
F1 UF 3,000,000 8 years 3.50% per annum simple 5/2/2008 5/2/2016F2 UF 2,379,000 9 years 4.20% per annum simple 9/1/2008 9/1/2017F3 UF 3,000,000 5 years 4.50% per annum simple 2/1/2009 2/1/2014F4 UF 3,000,000 4 years 4.50% per annum simple 2/1/2009 2/1/2013F5 UF 3,000,000 4.5 years 2.50% per annum simple 5/1/2009 11/1/2013F6 UF 3,000,000 (*) 5 years 3.50% per annum simple 9/1/2009 9/1/2014F7 UF 3,000,000 (**) 4.5 years 3.30% per annum simple 11/1/2009 5/1/2014
Total UF 20,379,000
144 A USD 500,000,000 3 years 2.88% per annum simple 11/13/2009 11/13/2012144 A USD 300,000,000 3 years 2.88% per annum simple 11/13/2009 11/13/2012Total USD 800,000,000
In 2008 the Bank placed bonds on the local market totaling UF 12,621,000 (Ch$264,320 million as of December 31, 2009). The detail of these bonds is asfollows:
Bonds Series Amount Term Issue rate Placement date Maturity date
Y UF 4,000,000 6 years 3.50% per annum simple 1/17/2008 12/3/2013Y1 UF 3,000,000 5 years 3.50% per annum simple 4/28/2008 2/1/2013Y2 UF 3,000,000 25 years Non-interest bearing 5/9/2008 2/1/2033Y3 UF 2,000,000 10 years 3.80% per annum simple 6/4/2008 2/1/2018F2 UF 621,000 9 years 4.20% per annum simple 12/16/2008 9/1/2017
Total UF 12,621,000
(*) On September 1, 2009 a line of senior bonds totaling UF 3,000,000 corresponding to F6 series with a 5-year term was registered in the SBIF’s Registryof Securities. The F6 series bond has an unplaced face value of UF 1,090,000 as of December 31, 2009.
(**) On November 1, 2009 a line of senior bonds totaling UF 3,000,000 corresponding to F7 series with a 4.5 year term was registered in theSuperintendency of Banks and Financial Institutions’ registry of securities. No placements of this bond have been made in the current period.
F-98

Table of ContentsBANCO SANTANDER CHILE AND SUBSIDIARIES
NOTES TO THE CONSOLIDATED FINANCIAL STATEMENTSAS OF DECEMBER 31, 2009, 2008 AND JANUARY 1, 2008
NOTE 20 - DEBT INSTRUMENTS ISSUED AND OTHER OBLIGATIONS, continued:
These bonds mature as follows:
As of December 31, As of
January 1, 2009 2008 2008 MCh$ MCh$ MCh$ Due within 1 year 166,814 256,582 - Due after 1 year but within 2 years 218,339 170,358 199,249 Due after 2 years but within 3 years 438,446 226,910 137,872 Due after 3 years but within 4 years 378,064 8,805 209,543 Due after 4 years but within 5 years 171,647 259,768 9,390 Due after 5 years 695,476 696,357 668,953
Senior bonds totals 2,068,786 1,618,780 1,225,007
c) Subordinated bonds
The following table shows, at the indicated dates, the balances of our subordinated bonds.
As of December 31, As of
January 1, 2009 2008 2008 MCh$ MCh$ MCh$ Subordinated bonds denominated in US $ 278,087 364,410 263,676 Subordinated bonds denominated in UF 313,939 323,502 232,038
Subordinated bonds totals 592,026 687,912 495,714
In 2009 the Bank placed subordinated bonds on the local market for UF 300,000, which is broken down as follows:
Subordinated bonds Series Amount Term Issue rate Issue date Maturity date
G2 (*) UF 300,000 30 years 4.8% per annum simple 9/1/2008 3/1/2038
Total UF 300,000
During the year the Bank issued subordinated bonds totaling UF 3,750,000 of G1 and G2 series (Ch$80,447 million as of December 31, 2008) with 25 and 30year maturities, respectively.
Subordinated bonds Series Amount Term Issue rate Placement date Maturity date
G1 UF 3,000,000 25 years 3.90% per annum simple 7/25/2008 5/2/2033
G2 (*) UF 750,000 30 years 4.80% per annum simple 12/26/2008 3/1/2038Total UF 3,750,000
(*) As of December 31, 2009 there are unplaced G2 series bonds with a U.F. face value 1,950,000.
F-99

Table of ContentsBANCO SANTANDER CHILE AND SUBSIDIARIES
NOTES TO THE CONSOLIDATED FINANCIAL STATEMENTSAS OF DECEMBER 31, 2009, 2008 AND JANUARY 1, 2008
NOTE 20 - DEBT INSTRUMENTS ISSUED AND OTHER OBLIGATIONS, continued:
The maturities of these bonds, considered long term, is as follows:
As of December 31, As of
January 1, 2009 2008 2008 MCh$ MCh$ MCh$ Due within 1 year - - - Due after 1 year but within 2 years 12,899 - - Due after 2 years but within 3 years 119,211 19,420 - Due after 3 years but within 4 years - 141,187 17,349 Due after 4 years but within 5 years 158,876 - 116,330 Due after 5 years 301,040 527,305 362,035
Subordinated bonds totals 592,026 687,912 495,714
d) Other financial obligations
The composition of other financial obligations, by maturity, is detailed below:
As of December 31, As of
January 1, 2009 2008 2008 MCh$ MCh$ MCh$ Long-term obligations: Due after 1 year but within 2 years 4,583 2,772 3,304 Due after 2 years but within 3 years 3,515 2,502 2,727 Due after 3 years but within 4 years 3,556 1,835 2,539 Due after 4 years but within 5 years 27,868 1,626 1,977 Due after 5 years 69,491 23,542 23,201
Long-term financial obligations subtotals 109,013 32,277 33,748 Short-term obligations: Amounts due to credit card operators 31,045 41,018 23,497 Acceptance of letters of credit - - 75,134 Other long-term financial obligations, short-term portion 6,853 58,023 43,288
Short-term financial obligations subtotals 37,898 99,041 141,919
Other financial obligations totals 146,911 131,318 175,667
F-100

Table of Contents
BANCO SANTANDER CHILE AND SUBSIDIARIES
NOTES TO THE CONSOLIDATED FINANCIAL STATEMENTSAS OF DECEMBER 31, 2009, 2008 AND JANUARY 1, 2008
NOTE 21 - MATURITIES OF ASSETS AND LIABILITIES:
As of December 31, 2009 and 2008, the detail of maturities of assets and liabilities is as follows:
Demand Up to 1month
Between 1and 3
months
Between 3and 12months
Subtotal upto 1 year
Between 1and 5 years
More than5 years
Subtotalafter 1 year
Total
As of December 31, 2009 MCh$ MCh$ MCh$ MCh$ MCh$ MCh$ MCh$ MCh$ MCh$ Assets Cash and depositsin banks 2,043,458 - - - 2,043,458 - - - 2,043,458 Unsettled transactions 468,134 - - - 468,134 - - - 468,134 Trading investments 37,151 521 2,541 663,359 703,572 71,262 23,705 94,967 798,539 Investments under resale agreements - 14,020 - - 14,020 - - - 14,020 Financial derivative contracts - 54,140 73,784 166,202 294,126 732,143 367,609 1,099,752 1,393,878 Interbank loans - 23,370 - - 23,370 - - - 23,370 Loans and accounts receivable from customers (*) 353,799 1,050,056 897,422 2,033,400 4,334,677 4,277,025 4,573,427 8,850,452 13,185,129 Available for sale investments 5,132 93,861 120,057 342,426 561,476 620,963 647,651 1,268,614 1,830,090 Held to maturityinvestments - - - - - - - - - Total assets 2,907,674 1,235,968 1,093,804 3,205,387 8,442,833 5,701,393 5,612,392 11,313,785 19,756,618 Liabilities Deposits and other demand liabilities 3,533,534 - - - 3,533,534 - - - 3,533,534 Unsettled transactions 275,474 - - - 275,474 - - - 275,474 Investments under repurchase agreements - 191,118 317,187 606,300 1,114,605 - - - 1,114,605 Time deposits and other time liabilities (**) 1,235 2,338,029 1,750,407 1,945,620 6,035,291 1,029,446 11,535 1,040,981 7,076,272 Financial derivative contracts - 81,601 77,426 216,070 375,097 668,674 305,135 973,809 1,348,906 Interbank borrowings 3,726 69,060 350,645 1,417,016 1,840,447 206,343 - 206,343 2,046,790 Issued debt instruments 3,450 18,308 169,012 26,055 216,825 1,608,489 1,099,362 2,707,851 2,924,676 Other financial obligations 32,443 1,163 604 3,688 37,898 39,522 69,491 109,013 146,911 Total liabilities 3,849,862 2,699,279 2,665,281 4,214,749 13,429,171 3,552,474 1,485,523 5,037,997 18,467,168
(*) Excludes amounts already matured. (**) Excludes time savings accounts.
F-101
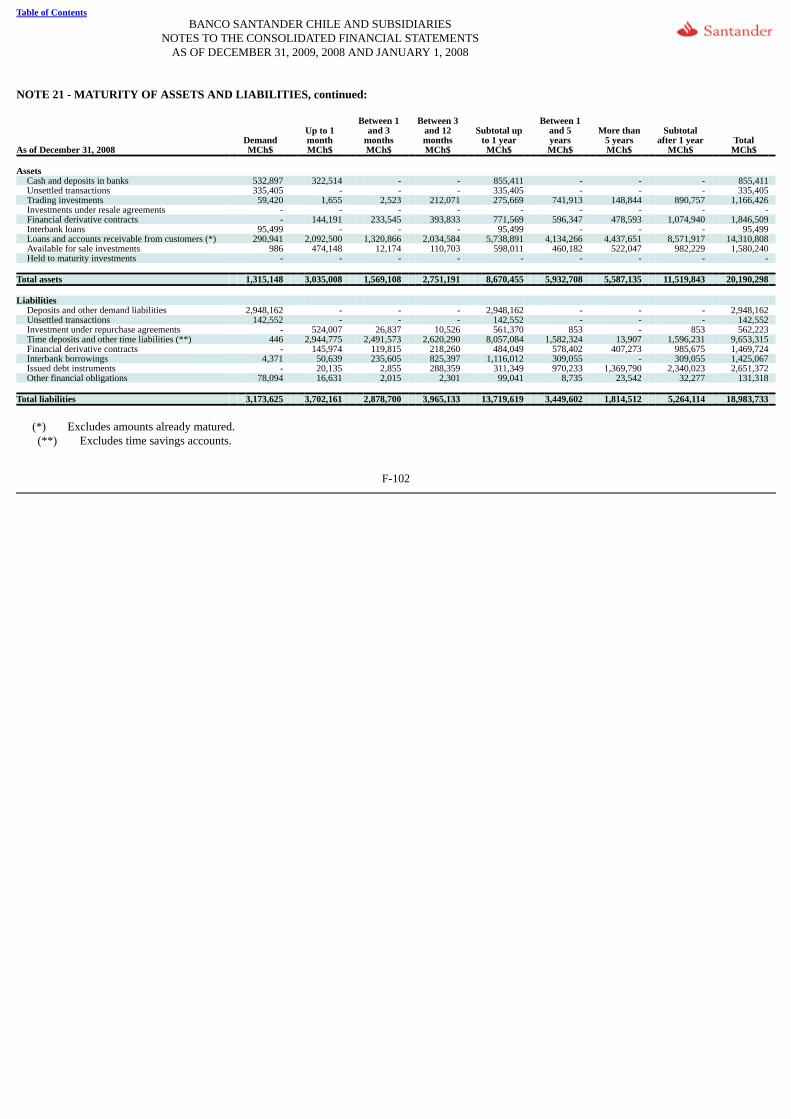
Table of ContentsBANCO SANTANDER CHILE AND SUBSIDIARIES
NOTES TO THE CONSOLIDATED FINANCIAL STATEMENTSAS OF DECEMBER 31, 2009, 2008 AND JANUARY 1, 2008
NOTE 21 - MATURITY OF ASSETS AND LIABILITIES, continued:
Demand Up to 1month
Between 1and 3
months
Between 3and 12months
Subtotal upto 1 year
Between 1and 5years
More than5 years
Subtotalafter 1 year Total
As of December 31, 2008 MCh$ MCh$ MCh$ MCh$ MCh$ MCh$ MCh$ MCh$ MCh$ Assets
Cash and deposits in banks 532,897 322,514 - - 855,411 - - - 855,411 Unsettled transactions 335,405 - - - 335,405 - - - 335,405 Trading investments 59,420 1,655 2,523 212,071 275,669 741,913 148,844 890,757 1,166,426 Investments under resale agreements - - - - - - - - - Financial derivative contracts - 144,191 233,545 393,833 771,569 596,347 478,593 1,074,940 1,846,509 Interbank loans 95,499 - - - 95,499 - - - 95,499 Loans and accounts receivable from customers (*) 290,941 2,092,500 1,320,866 2,034,584 5,738,891 4,134,266 4,437,651 8,571,917 14,310,808 Available for sale investments 986 474,148 12,174 110,703 598,011 460,182 522,047 982,229 1,580,240 Held to maturity investments - - - - - - - - -
Total assets 1,315,148 3,035,008 1,569,108 2,751,191 8,670,455 5,932,708 5,587,135 11,519,843 20,190,298 Liabilities
Deposits and other demand liabilities 2,948,162 - - - 2,948,162 - - - 2,948,162 Unsettled transactions 142,552 - - - 142,552 - - - 142,552 Investment under repurchase agreements - 524,007 26,837 10,526 561,370 853 - 853 562,223 Time deposits and other time liabilities (**) 446 2,944,775 2,491,573 2,620,290 8,057,084 1,582,324 13,907 1,596,231 9,653,315 Financial derivative contracts - 145,974 119,815 218,260 484,049 578,402 407,273 985,675 1,469,724 Interbank borrowings 4,371 50,639 235,605 825,397 1,116,012 309,055 - 309,055 1,425,067 Issued debt instruments - 20,135 2,855 288,359 311,349 970,233 1,369,790 2,340,023 2,651,372 Other financial obligations 78,094 16,631 2,015 2,301 99,041 8,735 23,542 32,277 131,318
Total liabilities 3,173,625 3,702,161 2,878,700 3,965,133 13,719,619 3,449,602 1,814,512 5,264,114 18,983,733
(*) Excludes amounts already matured. (**) Excludes time savings accounts.
F-102

Table of ContentsBANCO SANTANDER CHILE AND SUBSIDIARIES
NOTES TO THE CONSOLIDATED FINANCIAL STATEMENTSAS OF DECEMBER 31, 2009, 2008 AND JANUARY 1, 2008
NOTE 21 - MATURITY OF ASSETS AND LIABILITIES, continued:
As of January 1, 2008 Demand Up to 1month
Between 1and 3
months
Between 3and 12months
Subtotal upto 1 year
Between 1and 5years
More than5 years
Subtotalafter 1year Total
MCh$ MCh$ MCh$ MCh$ MCh$ MCh$ MCh$ MCh$ MCh$ Assets
Cash and deposits in banks 1,108,637 - - - 1,108,637 - - - 1,108,637 Unsettled transactions 316,240 - - - 316,240 - - - 316,240 Trading investments - 145,170 7,087 113,274 265,531 431,615 396,299 827,914 1,093,445 Investments under resale agreements - 33,999 - - 33,999 - - - 33,999 Financial derivative contracts - 36,907 37,049 92,043 165,999 259,690 355,086 614,776 780,775 Interbank loans - 45,961 - - 45,961 - - - 45,961 Loans and accounts receivable from customers (*) 490,610 1,732,281 778,159 1,742,638 4,743,688 3,639,248 3,522,685 7,161,933 11,905,621 Available for sale investments 138 60,296 14,202 71,916 146,552 183,136 449,947 633,083 779,635 Held to maturity investments - - - - - - - - -
Total assets 1,915,625 2,054,614 836,497 2,019,871 6,826,607 4,513,689 4,724,017 9,237,706 16,064,313 Liabilities
Deposits and other demand liabilities 2,867,934 - - - 2,867,934 - - - 2,867,934 Unsettled transactions 135,219 - - - 135,219 - - - 135,219 Investment under repurchase agreements - 307,630 - - 307,630 - - - 307,630 Time deposits and other time liabilities (**) - 2,272,828 1,763,080 2,213,515 6,249,423 1,531,142 10,177 1,541,319 7,790,742 Financial derivative contracts - 44,426 38,435 84,599 167,460 303,887 306,870 610,757 778,217 Interbank borrowings 962 10,301 5,359 596,239 612,861 486,596 - 486,596 1,099,457 Issued debt instruments 4,885 16,666 3,331 32,546 57,428 860,932 1,236,636 2,097,568 2,154,996 Other financial obligations 49,166 65,728 21,394 5,630 141,918 10,548 23,201 33,749 175,667
Total liabilities 3,058,166 2,717,579 1,831,599 2,932,529 10,539,873 3,193,105 1,576,884 4,769,989 15,309,862
(*) Excludes amounts already matured. (**) Excludes time savings accounts.
F-103

Table of ContentsBANCO SANTANDER CHILE AND SUBSIDIARIES
NOTES TO THE CONSOLIDATED FINANCIAL STATEMENTSAS OF DECEMBER 31, 2009, 2008 AND JANUARY 1, 2008
NOTE 22 - PROVISIONS:
a) As of December 31, 2009, 2008 and January 1, 2008, the composition of the allowances item is as shown below:
As of December 31, As of
January 1, 2009 2008 2008 MCh$ MCh$ MCh$ Provisions for personnel salaries and expenses 31,208 38,235 30,535 Provision for mandatory dividends (*) 129,467 97,938 - Allowance for contingent loans 4,077 2,769 2,362 Provisions for contingencies 21,460 27,271 17,205 Allowance for country risks - - - Totals 186,212 166,213 50,102
b) Below is the activity in provisions during the 2009 and 2008 periods:
Provisions for
Personnelsalaries and
expenses Allowances for
contingent loans Contingencies Mandatorydividends Total
MCh$ MCh$ MCh$ MCh$ MCh$ Opening balances as of January 1, 2009 38,235 2,769 27,271 97,938 166,213 Provisions established 26,882 1,380 1,088 129,467 158,817 Used provisions (31,934) - (586) (97,938) (130,458)Release of provisions (1,975) (72) (14,793) - (16,840)Reclassifications - - 7,283 - 7,283 Other - - 1,197 - 1,197 Balances as of December 31, 2009 31,208 4,077 21,460 129,467 186,212 Opening balances as of January 1, 2008 30,535 2,362 17,205 - 50,102 Provisions established 44,076 2,808 1,075 190,532 238,491 Used provisions (36,119) - (3,282) (92,594) (131,995)Release of provisions (898) (2,401) (1,246) - (4,545)Other 641 - 13,519 - 14,160 Balances as of December 31, 2008 38,235 2,769 27,271 97,938 166,213
F-104

Table of ContentsBANCO SANTANDER CHILE AND SUBSIDIARIES
NOTES TO THE CONSOLIDATED FINANCIAL STATEMENTSAS OF DECEMBER 31, 2009, 2008 AND JANUARY 1, 2008
NOTE 22 - PROVISIONS, continued:
c) Provision for personnel salaries and expenses:
As of December 31, 2009 2008 MCh$ MCh$ Provision for seniority compensation 312 4,030 Provision for stock-based personnel benefits 1,076 673 Provision for performance bonds 14,025 18,005 Provision for vacations 14,053 14,723 Provision for other personnel benefits 1,742 804 Totals 31,208 38,235
d) Seniority compensation:
As of December 31, 2009 2008 MCh$ MCh$ Present value of obligations at beginning of the period 4,030 1,675 Increase in provisions 926 4,447 Payments made (4,240) (2,092)Prepayments - - Used provisions (404) - Other - - Totals 312 4,030
e) Movements in provision for performance bonds:
As of December 31, 2009 2008 MCh$ MCh$ Opening balances as of January 1, 2008 18,005 15,202 Provisions established 14,897 18,903 Applications of provisions (18,059) (15,202)Used provisions (818) (898)Other - - Totals 14,025 18,005
f) Movements in provision for personnel vacation:
As of December 31, 2009 2008 MCh$ MCh$ Opening balances as of January 1, 2008 14,723 12,725 Provisions established 6,730 16,868 Used provisions (7,320) (15,484)Releases of provisions (80) - Other - 614 Totals 14,053 14,723
F-105

Table of ContentsBANCO SANTANDER CHILE AND SUBSIDIARIES
NOTES TO THE CONSOLIDATED FINANCIAL STATEMENTSAS OF DECEMBER 31, 2009, 2008 AND JANUARY 1, 2008
NOTE 23 - OTHER LIABILITIES:
This item’s composition is as follows:
As of December 31, As of
January 1, 2009 2008 2008 MCh$ MCh$ MCh$ Accounts and notes payable 79,491 74,302 75,961 Unearned income 2,081 4,669 6,437 Guarantees received (threshold) 148,308 177,017 15,188 Notes payable through brokerage and simultaneous transactions 14,802 11,192 11,697 Other liabilities 18,714 26,553 9,266 Totals 263,396 293,733 118,549
F-106

Table of ContentsBANCO SANTANDER CHILE AND SUBSIDIARIES
NOTES TO THE CONSOLIDATED FINANCIAL STATEMENTSAS OF DECEMBER 31, 2009, 2008 AND JANUARY 1, 2008
NOTE 24 - CONTINGENCIES AND COMMITMENTS:
a) Lawsuits and legal procedures
On the date of these financial statements’ issuance, the Bank and its affiliates were subject to certain legal actions in the normal course of their business. As ofDecember 31, 2009 the Bank and its affiliates maintained provisions for these legal actions, totaling Ch$830 million (Ch$1,394 million as of December 31, 2008and Ch$1,566 million as of January 1, 2008), which are part of the “Provisions for contingencies” item.
b) Contingent loans
The following table shows the Bank’s contractual obligations to issue loans.
As of December 31, As of
January 1, 2009 2008 2008 MCh$ MCh$ MCh$
Letters of credit issued 155,956 181,381 181,034 Foreign letters of credit confirmed 35,818 122,783 145,016 Guarantees 655,780 766,727 627,642 Pledges and other commercial commitments 169,931 172,568 236,661
Subtotals 1,017,485 1,243,459 1,190,353 Available credit lines 4,615,787 4,041,849 3,338,221
Totals 5,633,272 5,285,308 4,528,574
F-107

Table of ContentsBANCO SANTANDER CHILE AND SUBSIDIARIES
NOTES TO THE CONSOLIDATED FINANCIAL STATEMENTSAS OF DECEMBER 31, 2009, 2008 AND JANUARY 1, 2008
NOTE 24 - CONTINGENCIES AND COMMITMENTS, continued:
c) Held securities:
The Bank holds securities in the normal course of its business as follows:
As of December 31, As of January
1, 2009 2008 2008 MCh$ MCh$ MCh$ Securities held in custody 238,490 463,161 128,549 Collections 179,547 432,786 283,908 Assets from third parties managed by the Bank andits affiliates held in custody 66 1,158 658 Issued securities held in custody 7,371,486 10,081,416 8,844,411 Totals 7,789,589 10,978,521 9,257,526
d) Guarantees
Banco Santander Chile has a comprehensive officer fidelity insurance policy, No.2340815, with the Chilena Consolidada de Seguros insurance company, for anamount of USD $5,000,000, which jointly covers both the Bank and its affiliates for the period from July 1, 2009 to June 30, 2010.
Santander Asset Management S.A. Administradora General de Fondos
In conformity with General Standard No.125, the company designated Banco Santander Chile as the representative of the beneficiaries of the guaranteesestablished by each of the managed funds, in compliance with Articles 226 and following of Law No.18,045.
In addition to these guarantees for creating mutual funds, there are other guarantees for a guaranteed return on certain mutual funds, totaling Ch$64,346 million,and time deposits totaling UF 20,385.18 million (Ch$ 426,924,379 million as of December 31, 2009) as a guaranty of Private Investment Funds (P.I.F.) as ofDecember 31, 2009.
Santander S.A. Agente de Valores
To ensure correct and full performance of all its obligations as an Agent, in conformity with the provisions of Articles No.30 and following of Law No.18,045 onthe Securities Market, the Company provided a guarantee in the amount of UF 4,000 (Ch$ 84 million as of December 31, 2009) through Insurance PolicyNo.209106829, taken out from the Compañía de Seguros de Crédito Continental S.A., which matures on December 19, 2010.
Santander S.A. Corredores de Bolsa
To ensure correct and full performance of all its obligations as a Stock Broker, in conformity with the provisions of Articles 30 and following of Law 18,045 onthe Securities Market, the Company has given fixed-income securities to the Bolsa de Comercio de Santiago for a current value of Ch$2,369 million as ofDecember 31, 2009 (Ch$1,791 million as of December 31, 2008).
In addition, the Company has provided guarantees to the Bolsa de Comercio de Santiago to cover simultaneous transactions with a current value of Ch$14,802million as of December 31, 2009 (Ch$10,934 million as of December 31, 2008).
F-108

Table of ContentsBANCO SANTANDER CHILE AND SUBSIDIARIES
NOTES TO THE CONSOLIDATED FINANCIAL STATEMENTSAS OF DECEMBER 31, 2009, 2008 AND JANUARY 1, 2008
NOTE 24 - CONTINGENCIES AND COMMITMENTS, continued:
Santander Corredora de Seguros Limitada
a) Insurance policies
In accordance with Circular No.1,160 of the Superintendency of Securities and Insurance, the Company has an insurance policy in connection with itsobligations as an intermediary in insurance contracts. The guarantee policy for insurance brokers No.4282537, which covers UF 500 (Ch$ 10 million as ofDecember 31, 2009), and professional liability policy No.4282542, which covers UF 60,000 (Ch$ 1,257 million as of December 31, 2009), were taken out fromthe Seguros Generales Consorcio Nacional de Seguros S.A. Each is in effect from April 16, 2009 to April 14, 2010.
b) Deferred customs duties
In conformity with legal procedures, the obligation to pay deferred customs duties on imports of leased goods is transferred to the lessees, which undertake tomake that payment both directly to the appropriate customs office and indirectly in the leases into which they enter into with the Company. Accordingly, if alessee fails to make a payment, the Chilean government would have the right to be paid from the proceeds of the imported good’s sale at auction, but that auctioncan be avoided if the Company pays the customs duties and then charges the lessee for them, as is stipulated in the contract.
Bansa Santander S.A.
On March 15, 2006 it was resolved at a special shareholders meeting of the Company, pursuant to Article 57 No.5 of Law No.18,046, to authorize the Companyto provide a bond in favor of Banco Santander Chile, to ensure fulfillment of all the obligations that might arise from the injunction against entering into legalacts and contracts over real properties at lot 18 of the Hijuela El Arco subdivision.
F-109

Table of ContentsBANCO SANTANDER CHILE AND SUBSIDIARIES
NOTES TO THE CONSOLIDATED FINANCIAL STATEMENTSAS OF DECEMBER 31, 2009, 2008 AND JANUARY 1, 2008
NOTE 25 - EQUITY:
a) Capital stock and preferred shares
As of December 31, 2009 and 2008 the Bank had 188,446,126,794 shares outstanding, all of which are subscribed for and paid in full. All shares are commonshares, with no par value or other preferences.
The activity with respect to shares during 2009 and 2008 was as follows:
Shares As of December 31, 2009 2008 Number Number Issued as of January 1 188,446,126,794 188,446,126,794 Paid-up shares issued - - Owed shares issued - - Stock options exercised - - Issued as of December 31, 188,446,126,794 188,446,126,794
As of December 31, 2009, 2008 and January 1, 2008, the Bank does not have any of its own shares in treasury, nor do any of the companies included in theperimeter of consolidation.
As of December 31, 2009 the shareholder composition was as follows:
Corporate Name or Shareholder’sName Shares ADRs (*) Totals
% ofEquity
Holding Teatinos Siglo XXI InversionesLimitada 78,108,391,607 - 78,108,391,607 41.45 Santander Chile Holding S.A. 66,822,519,695 - 66,822,519,695 35.46 J.P. Morgan Chase Bank - 31,775,852,329 31,775,852,329 16.86 Inversiones Antares S.A. 250,363,545 - 250,363,545 0.13 Antonio Hitschfeld Bollman 200,000,000 - 200,000,000 0.11 Banks and stock brokers on behalf ofthird parties 6,985,588,652 - 6,985,588,652 3.71 Other minority shareholders 4,303,410,966 - 4,303,410,966 2.28 Totals 188,446,126,794 100.00
F-110

Table of ContentsBANCO SANTANDER CHILE AND SUBSIDIARIES
NOTES TO THE CONSOLIDATED FINANCIAL STATEMENTSAS OF DECEMBER 31, 2009, 2008 AND JANUARY 1, 2008
NOTE 25 – EQUITY, continued:
As of December 31, 2008 the shareholder composition was as follows:
Corporate Name or Shareholder’s Name Shares ADRs (*) Totals % of Equity
Holding Teatinos Siglo XXI Inversiones Limitada 78,108,391,607 - 78,108,391,607 41.45 Santander Chile Holding S.A. 66,822,519,695 - 66,822,519,695 35.46 J.P. Morgan Chase Bank - 29,254,384,271 29,254,384,271 15.52 Inversiones Antares S.A. 415,363,545 - 415,363,545 0.22 Banks and stock brokers on behalf of third parties 9,075,663,584 - 9,075,663,584 4.82 Other minority shareholders 4,769,804,092 - 4,769,804,092 2.53 Totals 188,446,126,794 100.00
As of January 1, 2008 the shareholder composition was as follows:
Corporate Name or Shareholder’s Name Shares ADRs (*) Totals % of Equity
Holding Teatinos Siglo XXI Inversiones Limitada 78,108,391,607 - 78,108,391,607 41.45 Santander Chile Holding S.A. 66,822,519,695 - 66,822,519,695 35.46 The Bank of New York - 26,772,309,006 26,772,309,006 14.21 Inversiones Antares S.A. 425,363,545 - 425,363,545 0.23 Banks and stock brokers on behalf of third parties 11,164,190,056 - 11,164,190,056 5.92 Other minority shareholders 5,153,352,885 - 5,153,352,885 2.73 Totals 188,446,126,794 100.00
(*) American Depository Receipts (ADR) are certificates issued by a U.S. commercial bank to be traded on the U.S. securities markets. Banco Santander Spain controls Santander-Chile through its holdings in Teatinos Siglo XXI Inversiones Ltda. and Santander-Chile Holding, which arecontrolled subsidiaries of Banco Santander Spain. As of December 31, 2009, Banco Santander Spain directly or indirectly owned or controlled 99.5% ofSantander-Chile Holding and directly or indirectly owned or controlled 100% of Teatinos Siglo XXI S.A. This gives Banco Santander Spain control over 76.91%of the shares of the Bank, and actual participation, when excluding minority shareholders, of 76.74% at December 31, 2009.
F-111

Table of ContentsBANCO SANTANDER CHILE AND SUBSIDIARIES
NOTES TO THE CONSOLIDATED FINANCIAL STATEMENTSAS OF DECEMBER 31, 2009, 2008 AND JANUARY 1, 2008
NOTE 25 – EQUITY, continued:
b) Dividends
During the year ended December 31, 2009 and 2008, the following dividends were declared and paid by the Bank:
Distributed dividends
Totalattributable
toshareholders
Allocated toreserves or
retainedearnings
Allocated toDividends
Percentagedistributed
Number of
shares
Dividendper share(in pesos)
- Year 2007 (Shareholders Meeting April 2008) 308,647 108,028 200,619 65% 188,446,126,794 1.065 - Year 2008(Shareholders Meeting April 2009) 413,370 200,075 213,295 52% 188,446,126,794 1.132
c) As of December 31, diluted earnings and basic earnings were as follows:
As of December 31, 2009 2008 MCh$ MCh$ a) Basic earnings per share
Total attributable to shareholders 431,557 413,370 Weighted average number of outstanding shares 188,446,126,794 188,446,126,794 Dividend per share (in pesos) 2.290 2.194
b) Diluted dividends per share
Total attributable to shareholders 431,557 413,370 Weighted average number of outstanding shares 188,446,126,794 188,446,126,794 Assumed conversion of convertible debt - - Adjusted number of shares 188,446,126,794 188,446,126,794 Diluted earnings per share (in pesos) 2.290 2.194
As of December 31, 2008 and 2009, the Bank has no instruments with dilutive effects.
F-112

Table of ContentsBANCO SANTANDER CHILE AND SUBSIDIARIES
NOTES TO THE CONSOLIDATED FINANCIAL STATEMENTSAS OF DECEMBER 31, 2009, 2008 AND JANUARY 1, 2008
NOTE 26 - CAPITAL REQUIREMENTS (BASEL):
Pursuant to the General Law of Banks, the Bank must maintain a minimum ratio of effective equity to risk-weighted assets of 8% net of required allowances, anda minimum ratio of basic equity to consolidated total assets of 3%, net of required allowances. However, as a result of the Bank’s merger in 2002, theSuperintendency of Banks and Financial Institutions (SBIF) has determined that the Bank’s combined effective net equity cannot be lower than 11% of its risk-weighted assets. Effective net equity is defined for these purposes as basic equity (capital and reserves) plus subordinated bonds, up to a maximum of 50% ofbasic equity.
Assets are allocated to different risk categories, each of which is assigned a weighting percentage according to the amount of capital required to be held for eachtype of asset. For example, cash, deposits in banks and financial instruments issued by the Central Bank of Chile have a 0% risk weighting, meaning that it is notnecessary to hold equity to back these assets according to current regulations. Property, plant and equipment have a 100% risk weighting, meaning that aminimum capital equivalent to 11% of these assets must be held. All derivatives traded off the exchanges are also assigned a risk weighting, using a conversionfactor applied to their notional values, to determine the amount of their exposure to credit risk. Off-balance-sheet contingent credits are also included forweighting purposes, as “Credit equivalents. ” Consolidated assets Risk-weighted assets
As of December 31, As of
January 1, As of December 31, 2009 2008 2008 2009 2008 2008 MCh$ MCh$ MCh$ MCh$ MCh$ MCh$ Balance-sheet assets (net of allowances)
Cash and deposits in banks 2,043,458 855,411 1,108,637 - - - Unsettled transactions 468,134 335,405 316,240 191,287 58,580 73,437 Trading investments 798,539 1,166,426 1,093,445 41,918 97,594 164,600 Investments under resale agreements 14,020 - 33,999 14,020 - 33,999 Financial derivative contracts (*) 1,391,886 1,459,901 1,283,957 837,692 844,892 597,881 Interbank loans 23,370 95,499 45,961 4,674 19,100 9,192 Loans and accounts receivable from customers 13,378,379 14,311,349 12,022,275 11,717,337 12,721,633 10,814,912 Available for sale investments 1,830,090 1,580,240 779,635 154,089 167,995 67,769 Investments in other companies 7,417 7,277 7,301 7,417 7,277 7,301 Intangible assets 77,260 68,232 56,224 77,260 68,232 56,224 Property, plant and equipment 184,122 200,389 202,489 184,122 200,389 202,489 Current taxes 4,541 18,715 2,499 454 1,872 250 Deferred taxes 95,229 88,825 80,989 9,523 8,883 8,099 Other assets 452,559 508,655 460,282 269,313 382,452 464,282
Off-balance-sheet assets Contingent loans 1,160,118 1,240,690 1,190,363 693,009 735,126 714,218
Totals 21,929,122 21,937,014 18,684,296 14,202,115 15,314,025 13,210,653 (*) “Financial derivative contracts” are presented at their “Credit Equivalent Risk” value as established in Chapter 12-1 of the Recopilación Actualizada de
Normas – RAN – (updated compilation of rules) issued by the Superintendency of Banks and Financial Institutions.
These capital requirements (Basel) are referred to their local values, according to criteria regulated by the Superintendency of Banks, so that some of their valuesdo not match the amounts of full IFRS Consolidated Balance Sheet. These amounts correspond to the Other assets, deferred taxes and Shareholder’s Equity,which varied primarily on the back of the charge off of the asset received in lieu of payment.
To maintain a base of accounting information, the Bank has presented the ratio of basic capital and effective equity for the year 2008 in accordance with the newregulations established in Circular No.3,479 of the Superintendency of Banks, of August 18, 2009, which is in force as of September 30, 2009. The ratiodetermined under the standards in force prior to the changes would be 7.18% and 13.80% for the basic capital and effective equity limits, respectively, as shownin the following detail:
F-113

Table of ContentsBANCO SANTANDER CHILE AND SUBSIDIARIES
NOTES TO THE CONSOLIDATED FINANCIAL STATEMENTSAS OF DECEMBER 31, 2009, 2008 AND JANUARY 1, 2008
NOTE 26 – CAPITAL REQUIREMENTS (BASEL), continued:
The levels of Basic capital and Effective net equity at the close of each period are as follows:
Percentage
As of December 31, As of
January 1, As of December 31, As of
January 1, 2009 2008 2008 2009 2008 2008 MCh$ MCh$ MCh$ % % % Basic capital 1,658,316 1,489,689 1,129,395 7.56 6.79 6.04 Effective net equity 2,214,092 2,104,225 1,602,432 15.59 13.74 12.13
F-114
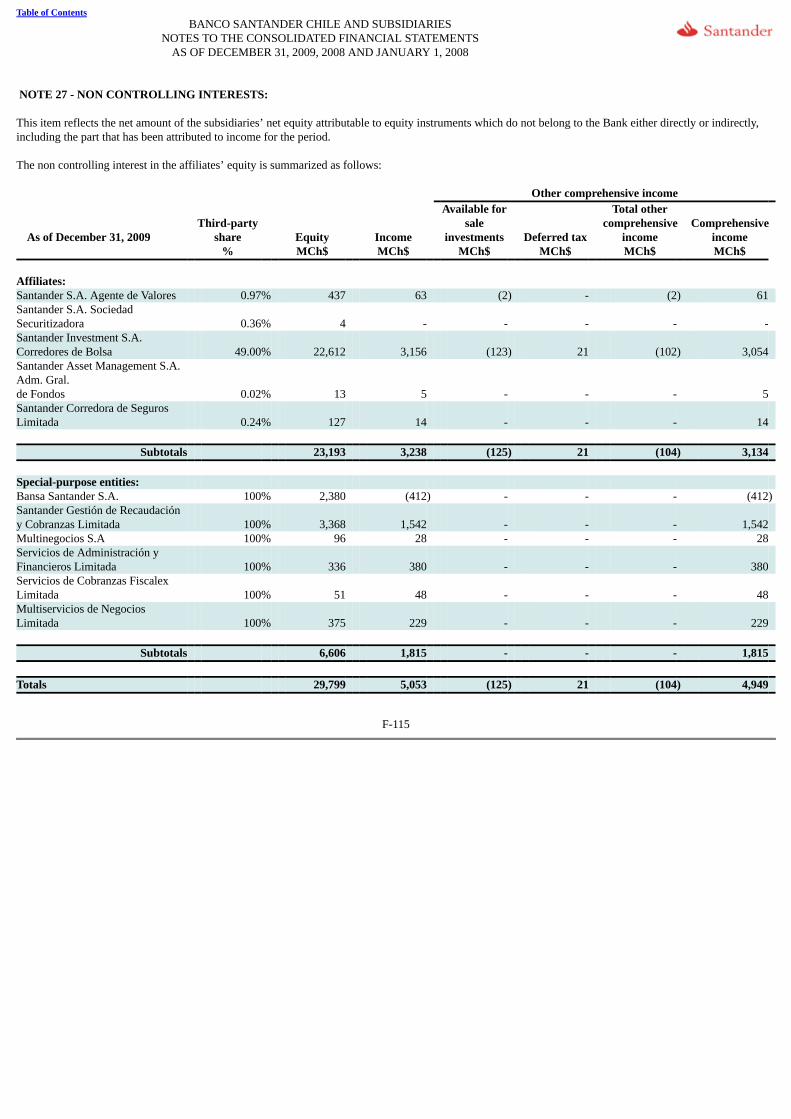
Table of ContentsBANCO SANTANDER CHILE AND SUBSIDIARIES
NOTES TO THE CONSOLIDATED FINANCIAL STATEMENTSAS OF DECEMBER 31, 2009, 2008 AND JANUARY 1, 2008
NOTE 27 - NON CONTROLLING INTERESTS:
This item reflects the net amount of the subsidiaries’ net equity attributable to equity instruments which do not belong to the Bank either directly or indirectly,including the part that has been attributed to income for the period.
The non controlling interest in the affiliates’ equity is summarized as follows:
Other comprehensive income
As of December 31, 2009 Third-party
share Equity Income
Available forsale
investments Deferred tax
Total othercomprehensive
income Comprehensive
income % MCh$ MCh$ MCh$ MCh$ MCh$ MCh$ Affiliates: Santander S.A. Agente de Valores 0.97% 437 63 (2) - (2) 61 Santander S.A. SociedadSecuritizadora 0.36% 4 - - - - - Santander Investment S.A.Corredores de Bolsa 49.00% 22,612 3,156 (123) 21 (102) 3,054 Santander Asset Management S.A.Adm. Gral.de Fondos 0.02% 13 5 - - - 5 Santander Corredora de SegurosLimitada 0.24% 127 14 - - - 14
Subtotals 23,193 3,238 (125) 21 (104) 3,134 Special-purpose entities: Bansa Santander S.A. 100% 2,380 (412) - - - (412)Santander Gestión de Recaudacióny Cobranzas Limitada 100% 3,368 1,542 - - - 1,542 Multinegocios S.A 100% 96 28 - - - 28 Servicios de Administración yFinancieros Limitada 100% 336 380 - - - 380 Servicios de Cobranzas FiscalexLimitada 100% 51 48 - - - 48 Multiservicios de NegociosLimitada 100% 375 229 - - - 229
Subtotals 6,606 1,815 - - - 1,815 Totals 29,799 5,053 (125) 21 (104) 4,949
F-115

Table of ContentsBANCO SANTANDER CHILE AND SUBSIDIARIES
NOTES TO THE CONSOLIDATED FINANCIAL STATEMENTSAS OF DECEMBER 31, 2009, 2008 AND JANUARY 1, 2008
NOTE 27 - NON CONTROLLING INTERESTS, continued:
Non controlling interests in equity and the affiliates’ income as of December 31, 2008 are as follows:
As of December 31, 2008 Other comprehensive income
Third-partyshare
Equity01.01.08
Equity31.12.08 Income
Availablefor sale
investments Deferred
tax
Total othercomprehensive
income Comprehensive
income % MCh$ MCh$ MCh$ MCh$ MCh$ MCh$ MCh$ Affiliates: Santander S.A. Agente de Valores 0.97% 1,374 1,473 210 (47) 8 (39) 171 Santander S.A. SociedadSecuritizadora 0.36% 4 4 - - - - - Santander Investment S.A. Corredoresde Bolsa 49.00% 18,271 22,706 4,229 - - - 4,229 Santander Asset Management S.A.Administradora General de Fondos 0.02% 18 18 5 - - - 5 Santander Corredora de SegurosLimitada (formerly Santander LeasingS.A.) 0.24% 154 179 19 - - - 19 Santander Corredora de SegurosLimitada 0.01% 3 - - - - - -
Subtotals 19,824 24,380 4,463 (47) 8 (39) 4,424 Special-purpose entities: Bansa Santander S.A. 100% (2,362) (3,027) (1,411) - - - (1,411)Gesbán Santander ServiciosProfesionales Contables Limitada.(1) 100% 533 211 139 - - - 139 Santander Gestión de Recaudación yCobranzas Limitada 100% (279) 3,864 4,211 - - - 4,211 Multinegocios S.A. 100% 103 92 16 - - - 16 Servicios Administración yFinancieros Limitada 100% 86 32 19 - - - 19 Servicios de Cobranzas FiscalexLimitada 100% 67 71 43 - - - 43 Multiservicios de Negocios Limitada 100% 162 256 117 - - - 117
Subtotals (1,690) 1,499 3,134 - - - 3,134 Totals 18,134 25,879 7,597 (47) 8 (39) 7,558
(1) On December 31, 2008 it was decided to modify the corporate purpose and transform the entity into a limited liability company operating under the name ofGesban Santander Servicios Profesionales Contables Limitada (formerly Santander Multimedios S.A.); its line of business was also changed, as a result ofwhich its income ceased to be largely dependent on operations conducted with the Bank.
As indicated above, it was determined that the Bank no longer controlled it, so it was excluded from the perimeter of consolidation as of March 2009.
F-116

Table of ContentsBANCO SANTANDER CHILE AND SUBSIDIARIES
NOTES TO THE CONSOLIDATED FINANCIAL STATEMENTSAS OF DECEMBER 31, 2009, 2008 AND JANUARY 1, 2008
NOTE 28 – INTEREST INCOME AND EXPENSE:
This item refers to interest earned in the period by all the financial assets whose return, whether implicitly or explicitly, is determined by applying the effectiveinterest rate method, regardless of the value at fair value, as well as the reclassifications of products as a consequence of hedge accounting.
a) On the financial statement closing date, the composition of income from interest and adjustments, not including income from hedge accounting, is asfollows:
As of December 31, 2009 2008
Interest Adjustments Prepaid
fees Total Interest Adjustments Prepaid
fees Total Items MCh$ MCh$ MCh$ MCh$ MCh$ MCh$ MCh$ MCh$ Repurchase agreements 16,903 3,603 - 20,506 3,691 - - 3,691 Interbank loans 262 - - 262 1,273 - - 1,273 Commercial loans 574,912 (65,137) 3,016 512,791 577,043 273,751 1,935 852,729 Mortgage loans 182,262 (88,801) 4,109 97,570 169,946 317,678 4,874 492,498 Consumer loans 506,896 (1,844) 3,249 508,301 548,570 9,704 2,282 560,556 Investment instruments 47,331 (20,646) - 26,685 55,631 59,895 - 115,526 Other interest income 3,102 1,897 - 4,999 32,619 7,750 - 40,369 Interest income 1,331,668 (170,928) 10,374 1,171,114 1,388,773 668,778 9,091 2,066,642
b) As indicated in section i) of Note 1, suspended interest are recorded in order accounts (off-balance-sheet accounts) until they are effectively received.
At the period end, the detail of income from suspended interest is as follows:
As of December 31, 2009 2008
Interest Adjustments Prepaid
fees Total Interest Adjustments Prepaid
fees Total Off balance sheet MCh$ MCh$ MCh$ MCh$ MCh$ MCh$ MCh$ MCh$ Commercial loans 21,224 3,933 - 25,157 11,188 14,748 - 25,936 Mortgage loans 5,570 2,726 - 8,296 1,728 1,678 - 3,406 Consumer loans 32,788 (671) - 32,117 18,168 7,538 - 25,706 Totals 59,582 5,988 - 65,570 31,084 23,964 - 55,048
F-117

Table of ContentsBANCO SANTANDER CHILE AND SUBSIDIARIES
NOTES TO THE CONSOLIDATED FINANCIAL STATEMENTSAS OF DECEMBER 31, 2009, 2008 AND JANUARY 1, 2008
NOTE 28 – INTEREST INCOME AND EXPENSE, continued:
c) At the end of the period the detail of expenses for interest and adjustments is as follows:
As of December 31, 2009 2008
Interest Adjustments Prepaid
fees Total Interest Adjustments Prepaid
fees Total Items MCh$ MCh$ MCh$ MCh$ MCh$ MCh$ MCh$ MCh$ Demand deposits (704) (167) - (871) (1,551) (67) - (1,618)Repurchase agreements (15,372) 572 - (14,800) (32,096) (903) - (32,999)Time deposits and liabilities (293,658) 65,909 - (227,749) (447,990) (286,493) - (734,483)Interbank borrowings (29,030) 64 - (28,966) (54,547) (280) - (54,827)Issued debt instruments (112,549) 49,801 - (62,748) (108,356) (169,986) - (278,342)Other financial obligations (3,834) 1,447 - (2,387) (2,429) (3,502) - (5,931)Other interest expenses (1,994) (71) - (2,065) (3,308) (9,112) - (12,420) - - - - Interest expenses totals (457,141) 117,555 - (339,586) (650,277) (470,343) - (1,120,620)
d) At the end of the period the summary of interest and expenses is as follows:
As of December 31, 2009 2008 Items MCh$ MCh$ Interest income 1,171,114 2,066,642 Interest expense (339,586) (1,120,620)
Interest income 831,528 946,022 Income from hedge accounting (net) 24,988 (53,956) Total net interest income 856,516 892,066
F-118

Table of ContentsBANCO SANTANDER CHILE AND SUBSIDIARIES
NOTES TO THE CONSOLIDATED FINANCIAL STATEMENTSAS OF DECEMBER 31, 2009, 2008 AND JANUARY 1, 2008
NOTE 29 – FEES AND COMMISSIONS:
This item includes the amount of fees earned and paid in the period, except for those which are an integral part of the financial instrument’s effective interestrate:
As of December 31, 2009 2008 MCh$ MCh$ Fees and commissions income Fees and commissions for lines of credit and overdrafts (*) 25,822 38,878 Fees and commissions for guarantees and letters of credit 24,558 17,092 Fees and commissions for card services 96,388 87,403 Fees and commissions for management of accounts 27,566 25,605 Fees and commissions for collections and payments 65,782 59,237 Fees and commissions for intermediation and management of securities 7,808 8,830 Fees and commissions for investments in mutual funds or others 30,766 28,220 Compensation for marketing of securities 16,307 15,284 Office banking 8,586 5,285 Other fees earned 12,342 10,135 Totals 315,925 295,969
As of December 31, 2009 2008 MCh$ MCh$ Fees and commissions expenses Compensation for card operation (44,718) (43,631)Fees and commissions for securities transactions (1,276) (2,292)Office banking (6,034) (3,341)Other fees (9,767) (3,576)Totals (61,795) (52,840) Net fees and commissions income 254,130 243,129
The fees earned through transactions with letters of credit are recorded in the Consolidated Statement of Income in the “Interest income” item.
(*) According to SBIF Circular 3,452, of November 25, 2008, amended by SBIF Circular 3,466 of February 4, 2009, fee charges on overdrafts for whichthere is no contractual provision were eliminated.
F-119

Table of ContentsBANCO SANTANDER CHILE AND SUBSIDIARIES
NOTES TO THE CONSOLIDATED FINANCIAL STATEMENTSAS OF DECEMBER 31, 2009, 2008 AND JANUARY 1, 2008
NOTE 30 - INCOME FROM FINANCIAL OPERATIONS:
This item includes the adjustments for changes in financial instruments, except for interest attributable to the application of the effective interest rate method foradjustments to asset values, as well as the income earned in purchases and sales of financial instruments.
As of December 31, 2009 and 2008, the detail of income from financial operations is as follows:
As of December 31, 2009 2008 MCh$ MCh$ Net income from financial operations
Derivatives classified as trading (102,825) 178,883 Trading investments 49,220 77,222 Decrease (increase) of loans and accounts receivable from customers
Current portfolio 542 980 Written-off portfolio 8,689 14,037
Available for sale investments 47,335 3,807 Other income from financial operations 926 (1,452)
Totals 3,887 273,477
NOTE 31 - NET FOREIGN EXCHANGE INCOME:
This item includes the income earned from foreign currency trading, the differences arise from converting monetary items in a foreign currency to the functionalcurrency and those generated by non-monetary assets in a foreign currency at the time of their divestiture.
As of December 31, 2009 and 2008, the detail of foreign exchange income is as follows:
As of December 31, 2009 2008 MCh$ MCh$ Currency exchange differences
Net profit (loss) from currency exchange differences 401,695 (402,927)Hedging derivatives (266,221) 243,979 Income from adjustable assets in foreign currency (10,138) 12,684 Income from adjustable liabilities in foreign currency 37,905 (40,778)
Totals 163,241 (187,042)
F-120

Table of ContentsBANCO SANTANDER CHILE AND SUBSIDIARIES
NOTES TO THE CONSOLIDATED FINANCIAL STATEMENTSAS OF DECEMBER 31, 2009, 2008 AND JANUARY 1, 2008
NOTE 32 - PROVISION FOR LOAN LOSSES:
The recorded activity in the 2009 and 2008 periods for provision for loan losses recorded on the income statement is as follows: Loans and accounts receivable from customers
As of December 31, 2009 Interbank
loans Commercial
loans Mortgage
loans Consumer
loans Contingent
credits Total MCh$ MCh$ MCh$ MCh$ MCh$ MCh$ Allowances and charge-offs - Individual evaluations (7) (34,739) - - (1,380) (36,126)- Group evaluations - (73,774) (14,061) (276,530) - (364,365)Total allowances and charge-offs (7) (108,513) (14,061) (276,530) (1,380) (400,491) Allowances released - Individual evaluations - 5,635 - - - 5,635 - Group evaluations - 1,718 1,450 18,495 72 21,735 Total released allowances - 7,353 1,450 18,495 72 27,370 Recovery of loans previously charged off - 8,446 2,560 28,268 - 39,274 Net charge to income (7) (92,714) (10,051) (229,767) (1,308) (333,847)
Loans and accounts receivable from customers
As of December 31, 2008
Contingentinterbank
loans Credits,
commercial Credits,
mortgage Loans,
consumer Credits,
contingent Total MCh$ MCh$ MCh$ MCh$ MCh$ MCh$ Allowances and charge-offs - Individual evaluations (35) (32,284) - - (2,759) (35,078)- Group evaluations - (41,235) (8,761) (251,068) (49) (301,113)Total allowances and charge-offs (35) (73,519) (8,761) (251,068) (2,808) (336,191) Allowances released - Individual evaluations - 2,725 - - 2,401 5,126 - Group evaluations - 2,046 685 2,457 - 5,188 Total released allowances - 4,771 685 2,457 2,401 10,314 Recovery of loans previously charged off - 9,244 1,932 26,718 - 37,894 Net charge to income (35) (59,504) (6,144) (221,893) (407) (287,983)
F-121

Table of ContentsBANCO SANTANDER CHILE AND SUBSIDIARIES
NOTES TO THE CONSOLIDATED FINANCIAL STATEMENTSAS OF DECEMBER 31, 2009, 2008 AND JANUARY 1, 2008
NOTE 33 - PERSONNEL SALARIES AND EXPENSES:
a) Composition of personnel salaries and expenses:
As of December 31, 2009 2008 MCh$ MCh$ Personnel salaries 152,695 161,801 Bonuses or gratifications 47,983 47,364 Stock-based benefits 2,371 1,352 Seniority compensation 3,075 17,844 Pension plans 100 - Training expenses 1,452 1,763 Day care and kindergarten 1,582 1,295 Health funds 2,519 2,492 Welfare fund 462 435 Other personnel expenses 12,245 12,429 Totals 224,484 246,775
b) Stock-based benefits
Banco Santander Chile and its Affiliates have designed variable-compensation plans for their employees, based on performance targets and objectives, theachievement of which are evaluated and paid on a quarterly and/or annual basis. There are also multi-year variable-compensation plans designed to retain andmotivate executives, whose compensation depends on the achievement of overall wide and individual targets over the course of a time period exceeding oneyear.
Long-term incentive policy
In 2007, the Parent Company’s Board of Directors approved a long-term incentive plan (PI06) consisting of granting stock-options on Bank’s shares for the2008-2010 period. This plan focuses on the Santander Group’s executive directors and certain executive employees in Spain and other Santander Groupcompanies.
As of December 31, 2008 approximately 90 of the Bank’s executives enrolled in Plan PI06 exercised 3,099,850 options over Banco Santander S.A. shares. (theParent Company located in Spain) at a price of €9,09.
Stock performance plan
This consists of a multi-year incentive plan with compensation in shares of the Parent Company. The plan’s beneficiaries are the Executive Directors, othermembers of Top Management and other Bank employees designated by the Parent Company’s Board of Directors or, by delegation from it, the ExecutiveCommittee. The shares are distributed if the following conditions are met:
i. The share price reaches the top 10 as compared to 30 other global banks. ii. Earnings per share reach the top 10 as compared to 30 other global banks. iii. The Bank has achieved its commercial and financial budget objectives in the last two years. iv. The executive has achieved his/her personal targets during the last two years and has continued to work at the Bank until the end of the program.
F-122

Table of ContentsBANCO SANTANDER CHILE AND SUBSIDIARIES
NOTES TO THE CONSOLIDATED FINANCIAL STATEMENTSAS OF DECEMBER 31, 2009, 2008 AND JANUARY 1, 2008
NOTE 33 - PERSONNEL SALARIES AND EXPENSES, continued:
This plan involves cycles of shares given to the beneficiaries. Each cycle has a three-year length, so a cycle will begin every year and, from 2009 onward,another cycle will simultaneously terminate. The objective is to establish an adequate sequence between the end of the incentive program linked to the previousplan (PI06) and the successive cycles of this plan. Accordingly, the first two cycles began in July 2007, the first cycle had a two-year length (PI09), and thesecond cycle has a standard three-year length (PI10). In June 2008 and 2009 the beginning of the third-cycle (PI11) and fourth-cycle (PI12) incentive plans wasapproved by the Parent Company. They will be linked to the fulfillment of the predetermined objectives. These new plans consisting of three-year cycles beganto impact the Consolidated Statement of Income in 200 9.
For each cycle and beneficiary who remains employed at the Bank throughout the plan’s term, the Parent determines a maximum number of shares that may begranted. The objectives to be fulfilled, which will determine the number of shares to be granted, were defined by comparing the Santander Group’s performancewith that of a reference group of financial institutions. These objectives are linked to two parameters: Total Shareholder Return (TSR) and Increase in Earningsper Share (EPS), each of which has a 50% weighting in the determination of the percentage of shares to be granted.
The final number of shares to be granted in each cycle is determined by the degree of fulfillment of the objectives on the third anniversary of each cycle (with theexception of the first cycle, for which the second anniversary is used), and the shares will be delivered within seven months from the date the cycle ends. TheTSR and the growth of EPS for Santander and the reference financial institutions will be calculated at that time, which will yield 50% of the percentage of sharesto be granted according to the following scale and based on the relative position of the Parent Company:
Santander’s position in the TSRRanking
Maximum percentage ofshares earned
Santander’s position in theEPS growth ranking
Shares earned as percentage ofmaximum
1st to 6th 50% 1st to 6th 50%
7th 43% 7th 43%8th 36% 8th 36%9th 29% 9th 29%10th 22% 10th 22%11th 15% 11th 15%
12th and more 0% 12th and more 0%
If Banco Santander, S.A. is within the first quartile (including the 25th percentile) for each of the measures considered (TSR and EPS growth), the maximumpercentage of shares will be earned; if it is at the median (including the 50th percentile), 30% of the maximum percentage of shares will be earned. If it is belowthe median, all the share distributions will be voided.
Plan PI09 ended in 2009 and over 707,305 shares were granted to 181 Bank’s executives. In addition, Plan PI10 commenced during that period; and over419,312 shares were granted to 181 executives, yielding a cumulative total of 980,784 shares to 181 executives. Plan PI11 granted 476,025 shares, and Plan PI12granted 522,155 shares, to 214 and 271 executives, respectively.
F-123

Table of ContentsBANCO SANTANDER CHILE AND SUBSIDIARIES
NOTES TO THE CONSOLIDATED FINANCIAL STATEMENTSAS OF DECEMBER 31, 2009, 2008 AND JANUARY 1, 2008
NOTE 33 - PERSONNEL SALARIES AND EXPENSES, continued:
As of December 31, 2009 the aforementioned objectives were achieved in their entirety, so the Bank recorded a cost for the period of Ch$2,371 million, whichcorresponds to the fair value of Plan I09 (which terminated on July 31, 2009), Plan I10, Plan I11, and Plan I12 for the shares granted; this sum was charged toincome in the specific period in which the beneficiaries provided their services to Banco Santander Chile. This program had no diluting effects on the minorityinterests. This fair value was calculated as described below: The fair value of the 50% which is linked to the TSR was determined by Santander Group on the basis of the Monte Carlo valuation model with 10,000simulations run to determine the TSR for each of the reference Group companies, considering the aforementioned variables. The results (each of whichrepresents the distribution of a number of shares) are classified in descending order through the calculation of the weighted average, and this amount isdiscounted at the risk-free interest rate. PI09 PI10 PI11 PI12 Expected volatility (*) 16.25% 15.67% 19.31% 42.36% Historical annual dividend return 3.23% 3.24% 3.47% 4.88% Risk-free interest rate 4.47% 4.49% 4.83% 2.04%
(*) Determined on the basis of the historical volatility over the course of the period (two or three years). The simulation model’s application yields a percentage value of 42.7% for PI09, 42.3% for PI10 and 44.9% for the second cycle for PI11, and finally, 55.4% forPI12, applied to 50% of the value of the granted shares to determine the carrying amount of the incentive’s TSR-based portion. Since this valuation is related to amarket condition, it cannot be adjusted after the date on which the shares are granted. In view of the high correlation between the TSR and EPS, it can reasonably be concluded that the TSR value is also valid for EPS in a high percentage of cases.Accordingly, it was determined that the fair value of the portion of the plans linked to the Bank’s relative EPS position, for example the remaining 50% of theshares granted, was the same as the 50% corresponding to TSR. Since this valuation does not refer to market conditions, the number of shares expected to begranted will be re-examined and adjusted on a per-annum basis.
F-124

Table of ContentsBANCO SANTANDER CHILE AND SUBSIDIARIES
NOTES TO THE CONSOLIDATED FINANCIAL STATEMENTSAS OF DECEMBER 31, 2009, 2008 AND JANUARY 1, 2008
NOTE 33 - PERSONNEL SALARIES AND EXPENSES, continued:
Below is a table which provides a detail of the foregoing:
Number of
shares Exercise
price Group of employees
Numberof
individuals
Date ofcommencement
of ExercisePeriod
Date ofterminationof Exercise
Period MCh$ € Plans in force on January 1, 2005 Options granted (Plan I06) 4,284,700 9.09(**) Managers 123 1/15/2008 1/15/2009 Options exercised - - - Options cancelled or not exercised (267,700) - - (6) 1/15/2008 1/15/2009 Plans in force on December 31, 2005 4,017,000 9.09 Options exercised - - - Options cancelled, net (Plan I06) (166,600) 9.09 Managers (5) 1/15/2008 1/15/2009 Plans in force on December 31, 2006 3,850,400 9.09 Options granted (Plan I09) 270,823 - Managers 159 6/23/2007 7/31/2009
Options granted (Plan I09) 12,844 - Other non-managerialpositions 23 6/23/2007 7/31/2009
Options granted (Plan I10) 402,865 - Managers 159 6/23/2007 7/31/2010
Options granted (Plan I10) 18,564 - Other non-managerialpositions 23 6/23/2007 7/31/2010
Options cancelled, net (Plan I06) (184,900) 9.09 Managers Plans in force on December 31, 2007 4,370,596 - Options granted (Plan I09) 134,985 - Managers 159 6/23/2007 7/31/2009
Options granted (Plan I09) 6,401 - Other non-managerialpositions 22 6/23/2007 7/31/2009
Options granted (Plan I10) 133,874 - Managers 159 6/23/2007 7/31/2010
Options granted (Plan I10) 6,169 - Other non-managerialpositions 22 6/23/2007 7/31/2010
Options cancelled, net (Plan I06) (565,650) - - - 4/15/2008 1/15/2009 Options exercised, net (Plan I06) (3,099,850) - Managers 90 Plans in force on December 31, 2008 986,525 Options granted (Plan I09) 269,472 - Managers 159 6/23/2007 7/31/2009
Options granted (Plan I09) 12,780 - Other non-managerialpositions 22 6/23/2007 7/31/2009
Options granted (Plan I10) 400,842 - Managers 159 6/23/2007 7/31/2010
Options granted (Plan I10) 18,470 - Other non-managerialpositions 22 6/23/2007 7/31/2010
Options granted (Plan I11) 443,098 - Managers 161 7/31/2008 7/31/2011
Options granted (Plan I11) 32,927 - Other non-managerialpositions 53 7/31/2008 7/31/2011
Options granted (Plan I12) 458,850 - Managers 176 7/31/2009 7/31/2012
Options granted (Plan I12) 63,305 - Other non-managerialpositions 95 7/31/2009 7/31/2012
Options granted (Plan I09) (675,280) - Managers 159
Options granted (Plan I09) (32,025) - Other non-managerialpositions 22
Plans in force on December 31, 2009 1,978,964 Plan I10 980,784 Plan I11 476,025 Plan I12 522,155 (**) The exercise price for the options under Plan I06 was 9.09 Euros per share, which is the weighted average of the average daily market price of the Bankshares over the continuous market for the first 15 trading days of January 2005. This was the criterion established in the resolution approving Plan I06, adoptedat the Annual General Meeting of the Parent Company on June 18, 2005. Such plan maintained a restriction on exercising the option 15 days prior to the 2008Financial Statement closing date, which explains why the options not exercised before December 15, 2008 were cancelled in their entirety.

F-125

Table of ContentsBANCO SANTANDER CHILE AND SUBSIDIARIES
NOTES TO THE CONSOLIDATED FINANCIAL STATEMENTSAS OF DECEMBER 31, 2009, 2008 AND JANUARY 1, 2008
NOTE 34 - ADMINISTRATIVE EXPENSES:
As of December 31, 2009 and 2008 the composition of this item is as follows:
As of December 31, 2009 2008 MCh$ MCh$ General administrative expenses Maintenance and repair of property, plant and equipment 10,260 10,455 Office lease 17,202 14,687 Equipment lease 228 192 Insurance payments 1,183 1,225 Office supplies 6,626 7,350 Information technology and communication expenses 19,789 22,620 Lighting, heating, and other utilities 6,204 5,576 Security and valuables transport services 10,136 10,116 Representation and personnel travel expenses 3,789 4,080 Judicial and notarial expenses 4,470 2,452 Fees for technical reports 5,665 5,155 Fees for professional services 631 725 Other general administrative expenses 3,012 2,943 Outsourced services Data processing 14,585 8,568 Other outsourcing 6,631 9,092 Other 2,767 5,194 Board expenses Compensation to Board members 645 628 Other Board expenses - - Marketing Expenses Publicity and advertising 13,847 14,615 Taxes, payroll taxes and contributions Real estate contributions 1,886 1,795 Patents 1,701 1,526 Other taxes 24 30 Contribution to SBIF 5,431 4,658 Totals 136,712 133,682
F-126

Table of ContentsBANCO SANTANDER CHILE AND SUBSIDIARIES
NOTES TO THE CONSOLIDATED FINANCIAL STATEMENTSAS OF DECEMBER 31, 2009, 2008 AND JANUARY 1, 2008
NOTE 35 - DEPRECIATION AND AMORTIZATION:
a) The values of depreciation and amortization charges during the 2009 and 2008 periods are detailed below:
As of December 31, 2009 2008 MCh$ MCh$ Depreciation and amortization
Depreciation of property, plant and equipment (21,691) (21,458)Amortization of intangible assets (24,932) (26,169)
Totals (46,623) (47,627)
b) The reconciliation between the book values as of January 1, 2008 and the balances as of December 31, 2009 and 2008 is as follows:
Accumulated depreciation and amortization 2009 2008(*)
Property,plant andequipment
Intangibleassets Total
Property,plant andequipment
Intangibleassets Total
MCh$ MCh$ MCh$ MCh$ MCh$ MCh$ Opening balances as of January 1 (*) (21,414) (26,169) (47,583) - - - Depreciation and amortization charges for the period (21,691) (24,932) (46,623) (21,458) (26,169) (47,627)Sales and disposals in the period 126 - 126 44 - 44 Balances as of December 31 (42,979) (51,101) (94,080) (21,414) (26,169) (47,583)
(*) As of January 1, 2008 both property, plant and equipment and intangible assets were shown net of their accumulated depreciation.
F-127
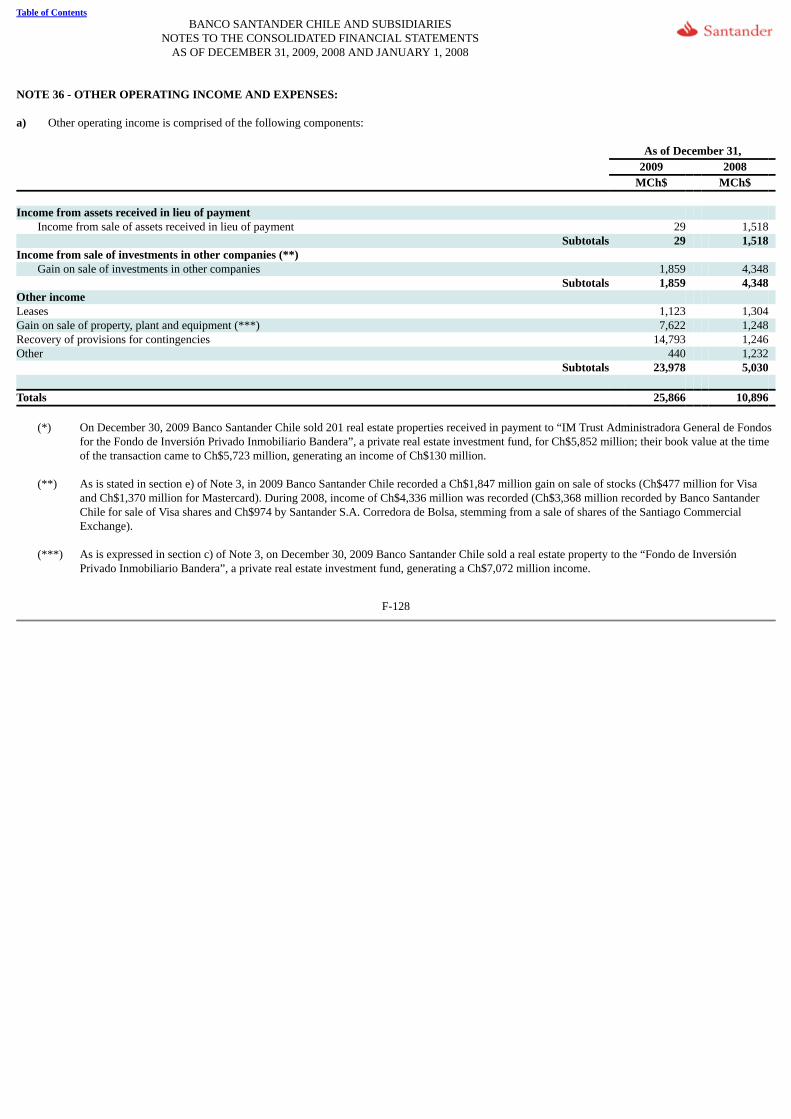
Table of ContentsBANCO SANTANDER CHILE AND SUBSIDIARIES
NOTES TO THE CONSOLIDATED FINANCIAL STATEMENTSAS OF DECEMBER 31, 2009, 2008 AND JANUARY 1, 2008
NOTE 36 - OTHER OPERATING INCOME AND EXPENSES:
a) Other operating income is comprised of the following components:
As of December 31, 2009 2008 MCh$ MCh$ Income from assets received in lieu of payment
Income from sale of assets received in lieu of payment 29 1,518 Subtotals 29 1,518
Income from sale of investments in other companies (**) Gain on sale of investments in other companies 1,859 4,348
Subtotals 1,859 4,348 Other income Leases 1,123 1,304 Gain on sale of property, plant and equipment (***) 7,622 1,248 Recovery of provisions for contingencies 14,793 1,246 Other 440 1,232
Subtotals 23,978 5,030 Totals 25,866 10,896
(*) On December 30, 2009 Banco Santander Chile sold 201 real estate properties received in payment to “IM Trust Administradora General de Fondosfor the Fondo de Inversión Privado Inmobiliario Bandera”, a private real estate investment fund, for Ch$5,852 million; their book value at the timeof the transaction came to Ch$5,723 million, generating an income of Ch$130 million.
(**) As is stated in section e) of Note 3, in 2009 Banco Santander Chile recorded a Ch$1,847 million gain on sale of stocks (Ch$477 million for Visaand Ch$1,370 million for Mastercard). During 2008, income of Ch$4,336 million was recorded (Ch$3,368 million recorded by Banco SantanderChile for sale of Visa shares and Ch$974 by Santander S.A. Corredora de Bolsa, stemming from a sale of shares of the Santiago CommercialExchange).
(***) As is expressed in section c) of Note 3, on December 30, 2009 Banco Santander Chile sold a real estate property to the “Fondo de InversiónPrivado Inmobiliario Bandera”, a private real estate investment fund, generating a Ch$7,072 million income.
F-128

Table of ContentsBANCO SANTANDER CHILE AND SUBSIDIARIES
NOTES TO THE CONSOLIDATED FINANCIAL STATEMENTSAS OF DECEMBER 31, 2009, 2008 AND JANUARY 1, 2008
NOTE 36 - OTHER OPERATING INCOME AND EXPENSES, continued:
b) Other operating expenses are comprised of the following components:
As of December 31, 2009 2008 MCh$ MCh$ Provisions and expenses for assets received in lieu of payment Provisions for assets received in lieu of payment 3,206 1,511 Expenses for maintenance of assets received in lieu of payment 2,922 1,667
Subtotals 6,128 3,178 Credit card expenses Credit card expenses 3,004 4,127 Credit card memberships 2,898 3,159
Subtotals 5,902 7,286 Customer services 8,807 9,366 Other expenses Operating charge-offs 3,106 3,791 Life insurance and general product insurance policies 4,553 4,777 Additional tax on expenses paid overseas 1,728 2,499 Expenses for mortgage credits 814 1,383 Losses on sale of property, plant and equipment 24 529 Expenses for foreign trade operations 306 211 Provisions for contingencies 1,088 1,075 Other 4,206 2,203
Subtotals 15,825 16,468
Totals 36,662 36,298
F-129

Table of ContentsBANCO SANTANDER CHILE AND SUBSIDIARIES
NOTES TO THE CONSOLIDATED FINANCIAL STATEMENTSAS OF DECEMBER 31, 2009, 2008 AND JANUARY 1, 2008
NOTE 37 - TRANSACTIONS WITH RELATED PARTIES:
In addition to Affiliates and associated entities, the Bank’s “related parties” include the “key personnel” of the Bank’s executive staff (members of the Bank’sBoard and the Managers of Banco Santander Chile and its Affiliates, together with their close relatives), as well as the entities over which the key personnelcould exercise significant influence or control.
The Bank also considers the companies that are part of the Santander Group worldwide as related parties, given that all of them have a common parent, i.e.,Banco Santander S.A. (located in Spain).
Article 89 of the Ley de Sociedades Anónimas (Public Companies Act), which is also applicable to banks, provides that any transaction with a related party mustbe made under equitable conditions similar to those that customarily prevail in the market.
Moreover, Article 84 of the Ley General de Bancos (General Banking Act) establishes limits for loans that can be granted to related parties and prohibits lendingto the Bank’s directors, managers, or representatives.
Transactions that the Bank enters into with related parties are specified below. To facilitate comprehension, we have divided the information into four categories:
Santander Group CompaniesThis category includes all the companies that are controlled by the Santander Group around the world, and hence, it also includes the companies over which theBank exercises any degree of control (Affiliates and special-purpose entities).
Associated companiesThis category includes the entities over which the Bank, in accordance with section b) of Note 1 to these Financial Statements, exercises a significant degree ofinfluence and which generally belong to the group of entities known as “business support companies.”
Key personnelThis category includes members of the Bank’s Board and the managers of Banco Santander Chile and its Affiliates, together with their close relatives.
OtherThis category encompasses the related parties that are not included in the groups identified above and which are, in general, entities over which the key personnelcould exercise significant influence or control.
The terms for transactions with related parties are equivalent to those which prevail in transactions made under market conditions or to which the correspondingconsiderations in kind have been attributed.
F-130

Table of Contents
BANCO SANTANDER CHILE AND SUBSIDIARIESNOTES TO THE CONSOLIDATED FINANCIAL STATEMENTS
AS OF DECEMBER 31, 2009, 2008 AND JANUARY 1, 2008 NOTE 37 - TRANSACTIONS WITH RELATED PARTIES, continued:
a) Loans to related parties:
Below are loans and receivables, and contingent loans, corresponding to related entities:
As of December 31, 2009 As of December 31, 2008 As of January 1, 2008
Companies of theGroup
Associatedcompanies
Keypersonnel Other
Companiesof theGroup
Associatedcompanies
Keypersonnel Other
Companiesof theGroup
Associatedcompanies
Keypersonnel Other
MCh$ MCh$ MCh$ MCh$ MCh$ MCh$ MCh$ MCh$ MCh$ MCh$ MCh$ MCh$ Loans and receivables Commercial loans 11,331 914 2,840 108,372 54,996 51 2,417 110,074 9,375 36 2,274 71,979 Mortgage loans - - 12,754 - - - 11,517 - - - 10,256 - Consumer loans - - 1,744 - - - 911 - - - 972 -
Loans and receivables 11,331 914 17,338 108,372 54,996 51 14,845 110,074 9,375 36 13,502 71,979 Provision for loan losses (13) (1) (11) (298) (114) - (8) (34) (5) - (4) (25)
Net loans 11,318 913 17,327 108,074 54,882 51 14,837 110,040 9,370 36 13,498 71,954 Guarantees 4,552 - 45,550 596 62,040 - 13,867 602 25,791 - 12,526 45,626 Contingent loans Personal guarantees - - 15,900 - - - - - - - - - Letters of credit 1,868 - - - 1,582 - - - 4,760 - - - Performance bonds 134,644 - - 259 51,237 - - 25 45,510 - - -
Contingent loans 136,512 - - 259 52,819 - - 25 50,270 - - - - Provision for contingent loans (21) - - (4) - - - (17) - - - - Net contingent loans 136,491 - - 259 52,815 - - 25 50,253 - - -
F-131

Table of Contents
BANCO SANTANDER CHILE AND SUBSIDIARIESNOTES TO THE CONSOLIDATED FINANCIAL STATEMENTS
AS OF DECEMBER 31, 2009, 2008 AND JANUARY 1, 2008 NOTE 37 - TRANSACTIONS WITH RELATED PARTIES, continued:
The activity of loans to related parties during the years 2009 and 2008 is shown below:
As of December 31, 2009 2008
Companiesof theGroup
Associatedcompanies
Keypersonnel Other
Companiesof theGroup
Associatedcompanies
Keypersonnel Other
MCh$ MCh$ MCh$ MCh$ MCh$ MCh$ MCh$ MCh$ Balance as of January 1 107,815 51 14,845 110,099 59,645 36 13,502 71,979 New loans 176,516 2,268 8,279 30,220 107,916 49 3,732 39,461 Payments (136,488) (1,405) (5,785) (31,688) (59,746) (34) (2,389) (1,341) Balances as of December 31 147,843 914 17,338 108,631 107,815 51 14,845 110,099
F-132

Table of Contents
BANCO SANTANDER CHILE AND SUBSIDIARIESNOTES TO THE CONSOLIDATED FINANCIAL STATEMENTS
AS OF DECEMBER 31, 2009, 2008 AND JANUARY 1, 2008 NOTE 37 - TRANSACTIONS WITH RELATED PARTIES, continued:
b) Assets and liabilities with related parties As of December 31, 2009 As of December 31, 2008 As of January 1, 2008
Companiesof theGroup
Associatedcompanies
Keypersonnel Other
Companiesof theGroup
Associatedcompanies
Keypersonnel Other
Companiesof theGroup
Associatedcompanies
Keypersonnel Other
MCh$ MCh$ MCh$ MCh$ MCh$ MCh$ MCh$ MCh$ MCh$ MCh$ MCh$ MCh$ Assets Trading investments - - - - - - - - 55,549 - - - Investments under resale agreements - - - - - - - - - - - - Financial derivatives contracts 405,411 - - - 293,649 - - - 235,056 - 2 187 Available for sale investments - - - - - - - - - - - - Other assets 117,060 - - - 15,422 - - - 17,732 65 60 13 Liabilities Demand deposits and other demandobligations 1,503 6,238 502 925 6,827 4,963 1,442 5,761 156,000 7,029 567 752 Investments under repurchaseagreements - - - - 40,345 - - - - - - - Deposits and other time liabilities 411,295 - 1,126 21,652 387,477 - 2,918 3,057 65,353 - 538 313 Financial derivatives contracts 245,574 - - - 358,747 - - - 52,553 - 2 150 Issued debt instruments 89,258 - - - 186,098 - - - 11,505 - - - Other financial liabilities 55,156 - - - 8,967 - - - 10,594 - - - Other liabilities 310 - - - 2,710 - - - 3,922 - - -
F-133

Table of Contents
BANCO SANTANDER CHILE AND SUBSIDIARIESNOTES TO THE CONSOLIDATED FINANCIAL STATEMENTS
AS OF DECEMBER 31, 2009, 2008 AND JANUARY 1, 2008 NOTE 37 - TRANSACTIONS WITH RELATED PARTIES, continued:
c) Income (expenses) recorded with related parties As of December 31, 2009 As of December 31, 2008
Companiesof theGroup
Associatedcompanies
Keypersonnel Other
Companiesof theGroup
Associatedcompanies
Keypersonnel Other
MCh$ MCh$ MCh$ MCh$ MCh$ MCh$ MCh$ MCh$ Income (expense) recorded Income and expenses from interest andadjustments (23,344) 42 308 (769) 1,070 - 67 (11)Income and expenses from fees and services 56,822 71 79 50 47,984 - 11 5 Net income from financial and foreignexchange transactions (*) 129,046 - 2 (13,634) (210,308) - - 97 Other operating revenues and expenses (4,294) - - - (3,995) - - - Key personnel compensation and expenses - - (28,663) - - - (29,820) - Administrative and other expenses (13,107) (16,666) - - (12,656) (28,016) - - Totals 145,123 (16,553) (28,274) (14,353) (177,905) (28,016) (29,742) 91
(*) Reflects derivative contracts that hedge Group positions in Chile.
d) Payments to Board members and key management personnel
The compensation received by the key management personnel, including Board members and all the executives holding Manager positions, shown in the“Personnel compensation and expenses” and/or “Administrative expenses” items of the Consolidated Statement of Income, corresponds to the followingcategories:
As of December 31, 2009 2008 MCh$ MCh$ Personnel compensation 13,531 14,156 Board members’ compensation 645 628 Bonuses or gratifications 10,318 10,143 Compensation in stock 1,676 1,248 Training expenses 49 40 Seniority compensation 1,759 2,982 Health funds 242 299 Other personnel expenses 343 324 Pension plan 100 - Totals 28,663 29,820
F-134
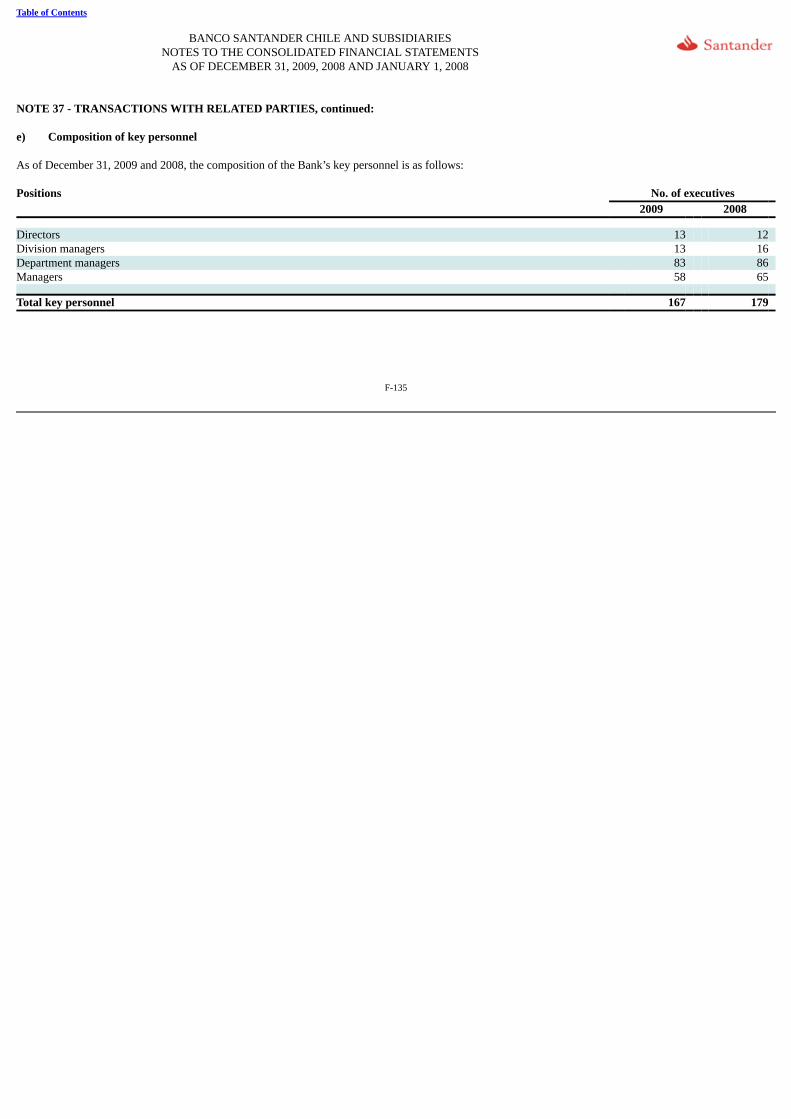
Table of Contents
BANCO SANTANDER CHILE AND SUBSIDIARIESNOTES TO THE CONSOLIDATED FINANCIAL STATEMENTS
AS OF DECEMBER 31, 2009, 2008 AND JANUARY 1, 2008 NOTE 37 - TRANSACTIONS WITH RELATED PARTIES, continued:
e) Composition of key personnel
As of December 31, 2009 and 2008, the composition of the Bank’s key personnel is as follows:
Positions No. of executives 2009 2008 Directors 13 12 Division managers 13 16 Department managers 83 86 Managers 58 65 Total key personnel 167 179
F-135

BANCO SANTANDER CHILE AND SUBSIDIARIES
NOTES TO THE CONSOLIDATED FINANCIAL STATEMENTSAS OF DECEMBER 31, 2009, 2008 AND JANUARY 1, 2008
NOTE 37 - TRANSACTIONS WITH RELATED PARTIES, continued:
f) Stock-based benefits
The following table details the activity in stock-based benefits paid to the key personnel of the Bank and its Affiliates. The detail for each of these benefit plansis described in section b) of Note 33.
Number of
shares Exercise
price Group ofemployees
Number ofindividuals
Date ofExercisePeriod
Date ofterminationof Exercise
Period MCh$ € Plans in force on January 1, 2005 Options granted (Plan I06) 4,284,700 9.09(**) Managers 123 1/15/2008 1/15/2009 Options exercised - - - Options cancelled or not exercised (267,700) - - (6) 1/15/2008 1/15/2009 Plans in force on December 31, 2005 4,017,000 9.09 Options exercised - - - Options cancelled, net (Plan I06) (166,600) 9.09 Managers (5) 1/15/2008 1/15/2009 Plans in force on December 31, 2006 3,850,400 9.09 Options granted (Plan I09) 270,823 - Managers 159 6/23/2007 7/31/2009 Options granted (Plan I10) 402,865 - Managers 159 6/23/2007 7/31/2010 Options cancelled, net (Plan I06) (184,900) 9.09 Managers Plans in force on December 31, 2007 4,339,188 Options granted (Plan I09) 134,985 - Managers 159 6/23/2007 7/31/2009 Options granted (Plan I10) 133,874 - Managers 159 6/23/2007 7/31/2010 Options cancelled, net (Plan I06) (565,650) - - 4/15/2008 1/15/2009 Options exercised, net (Plan I06) (3,099,850) - Managers 90 Plans in force on December 31, 2008 942,547 Options granted (Plan I09) 269,472 - Managers 159 6/23/2007 7/31/2009 Options granted (Plan I10) 400,842 - Managers 159 6/23/2007 7/31/2010 Options granted (Plan I11) 443,098 - Managers 161 7/31/2008 7/31/2011 Options granted (Plan I12) 458,850 - Managers 176 7/31/2009 7/31/2012 Options granted (Plan I09) (675,280) - Managers 159 Plans in force on December 31, 2009 1,839,529 Plan I10 937,581 Plan I11 443,098 Plan I12 458,850
F-136

Table of Contents
BANCO SANTANDER CHILE AND SUBSIDIARIESNOTES TO THE CONSOLIDATED FINANCIAL STATEMENTS
AS OF DECEMBER 31, 2009, 2008 AND JANUARY 1, 2008 NOTE 37 - TRANSACTIONS WITH RELATED PARTIES, continued:
g) Post-employment benefits
During the second half of 2009, the Bank granted an additional benefit to its principal executives, consisting of a pension plan whose purpose is to endow themwith funds for a better supplementary pension upon their retirement.
In practical terms, the Bank will match the voluntary contributions made by the beneficiaries for their future pensions with an equivalent contribution. Theexecutives will be entitled to receive this benefit only when they fulfill the following conditions:
i. Retire from the Bank (or from any other Santander Group company) and be 60 years of age or older; ii. The reason for termination of their employment may not be any of the legal grounds for dismissal attributable to the executive in question.
In other words, in the event the employment relationship between the executive and the company is terminated before the executive meets the aforementionedconditions, he will have no rights under this benefit plan.
In the event of the executive’s death or total or partial disability, he will be entitled to receive this benefit.
The Bank will make the contributions to this benefit plan on the basis of mixed collective insurance policies whose beneficiary is the Bank. The life insurancecompany with whom such policies are executed is not an entity linked or related to the Bank or any other Santander Group company.
During the second half of 2009, the Bank made a contribution of Ch$4,726 million, and a current contribution of Ch$267 million.
The assets related to the savings fund that are contributed by the Bank in the Insurance Company for defined benefit plans are presented net of associatedcommitments. The balance for this item at the close of the period is as follows:
Post-
employment plans 2009 MCh$ Plan assets 4,993 Commitments for defined-benefit plans For active personnel (100)Incurred by inactive personnel - Minus: - Unrealized actuarial (gain) losses - Balances at the period end 4,893
F-137

Table of Contents
BANCO SANTANDER CHILE AND SUBSIDIARIESNOTES TO THE CONSOLIDATED FINANCIAL STATEMENTS
AS OF DECEMBER 31, 2009, 2008 AND JANUARY 1, 2008 NOTE 37 - TRANSACTIONS WITH RELATED PARTIES, continued:
The period’s activity for post-employment benefits is as follows:
Post-employment
plans 2009 MCh$ a ) Fair value of plan assets Balance at beginning of period -Expected yield of insurance contracts -Employer contributions 4,993Actuarial (gain) losses -Premiums paid -Benefits paid -Other activity -Fair value of plan assets at end of period 4,993b ) Present value of obligations Current value of obligations at beginning of period -Net incorporation of Group companies -Service cost (100)Interest cost -Curtailment/settlement effect -Benefits paid -Past service cost -Actuarial (gain) losses -Other activity -Present value of obligations at end of period (100)Net balance at end of period 4,893
F-138

Table of Contents
BANCO SANTANDER CHILE AND SUBSIDIARIESNOTES TO THE CONSOLIDATED FINANCIAL STATEMENTS
AS OF DECEMBER 31, 2009, 2008 AND JANUARY 1, 2008 NOTE 38 - FAIR VALUE OF FINANCIAL ASSETS AND LIABILITIES:
Fair value is defined as the amount at which a financial instrument (asset or liability) could be delivered or settled, respectively, on that date between twoindependent knowledgeable parties who act freely and prudently; i.e., not in a forced or liquidation sale. The most objective and customary reference for the fairvalue of an asset or liability is the quoted price that would be paid for it on a transparent organized market (“estimated fair value”).
For financial instruments with no available market prices, fair values have been estimated by using recent transactions in analogous instruments, and in theabsence thereof, the present values or other valuation techniques based on mathematical valuation models sufficiently accepted by the international financialcommunity. In the use of these models, consideration is given to the specific particularities of the asset or liability to be valued, and especially to the differentkinds of risks associated with the asset or liability.
These techniques are inherently subjective and are significantly influenced by the assumptions used, including the discount rate, the estimates of future cashflows and prepayment expectations. Hence, the fair value estimated for an asset or liability may not coincide exactly with the price at which that asset or liabilitycould be delivered or settled on the date of its valuation, and may not be justified in comparison with independent markets.
Determination of fair value of financial instruments
Below is a comparison between the value at which the Bank’s financial assets and liabilities are recorded and their fair value as of December 31, 2009 and 2008:
As of December 31, As of January 1, 2009 2008 2008
Amountrecorded Fair value
Amountrecorded Fair value
Amountrecorded Fair value
MCh$ MCh$ MCh$ MCh$ MCh$ MCh$ Assets Cash and deposits in banks 2,043,458 2,043,458 855,411 855,411 1,108,637 1,108,637 Unsettled transactions 468,134 468,134 335,405 335,405 316,240 316,240 Trading investments 798,539 798,539 1,166,426 1,166,426 1,093,445 1,093,445 Investments under resale agreements 14,020 14,020 - - 33,999 33,999 Financial derivatives contracts 1,393,878 1,393,878 1,846,509 1,846,509 780,775 780,775 Loans and accounts receivable from customers andinterbank loans 13,401,749 15,075,810 14,406,848 16,183,644 12,068,236 13,478,112 Available for sale investments 1,830,090 1,830,090 1,580,240 1,580,240 779,635 779,635 Liabilities Deposits 12,755,581 12,446,748 14,129,495 14,007,109 11,855,288 10,551,438 Unsettled transactions 275,474 275,474 142,552 142,552 135,219 135,219 Investments under repurchase agreements 1,114,605 1,114,605 562,223 562,223 307,630 307,630 Financial derivatives contracts 1,348,906 1,348,906 1,469,724 1,469,724 778,217 778,217 Short and long term issued debt instruments 3,071,587 3,184,880 2,782,690 3,202,637 2,330,663 1,685,037
In addition, the fair value estimates presented above do not attempt to estimate the value of the Bank’s profits generated by its business activity, nor its futureactivities, and accordingly, they do not represent the Bank’s value as a going concern. Below is a detail of the methods used to estimate the financial instruments’fair value:
F-139

Table of Contents
BANCO SANTANDER CHILE AND SUBSIDIARIESNOTES TO THE CONSOLIDATED FINANCIAL STATEMENTS
AS OF DECEMBER 31, 2009, 2008 AND JANUARY 1, 2008 NOTE 38 - FAIR VALUE OF FINANCIAL ASSETS AND LIABILITIES, continued:
a) Cash and deposits in banks
The recorded value of cash and interbank loans approximates its estimated fair value in view of these instruments’ short-term nature.
b) Unsettled transactions, trading instruments, available for sale investment instruments, resale agreements, and securities loans
The estimated fair value of these financial instruments was determined through the use of market values or quotes by an available dealer, or the prices quoted onthe market for similar financial instruments. Investments maturing in less than one year are valued at their recorded value because they are — in view of theirshort terms — deemed to have a fair value that does not significantly diverge from their recorded value. For the fair value estimates of debt investments or debtsecurities included in these items, additional variables and inputs are considered to the extent applicable, including an estimate of prepayment rates and theissuers’ credit risk.
c) Loans and accounts receivable from customers and interbank loans
The fair values of commercial loans are estimates made by performing a cash flow discount analysis, using the interest rates that are currently offered for loanswith terms similar to those of borrowers having a similar credit quality. The fair values of unearned loans are estimated by using the cash flow discount analysisstemming from the settlement of the underlying securities, if any (or other sources of payment), at an estimated discount rate. For floating-rate loans whoseprices change frequently and are not subject to any significant change of credit risk, the estimated fair values are based on the recorded values. The fair valuesestimated for certain mortgage loans, credit cards, and other consumer loans are based on market values for similar loans, adjusted for differences in the loans’characteristic s.
d) Deposits
The disclosed fair value of deposits that do not accrue interest and savings accounts is the amount payable on the reporting date, and accordingly, it is equal tothe recorded amount. The fair value of time deposits is calculated by using a discounted cash flow calculation, which applies current interest rates being offeredat the time to a calendar of monthly maturities established for time deposits. The value of long-term relations with depositors does not take into consideration thedisclosed fair value estimate.
e) Short and long term issued debt instruments
The fair value of these financial instruments is calculated by using the cash flow discount analysis based on the current incremental lending rates for similartypes of loans having similar maturities.
f) Financial derivative contracts
The estimated fair value of currency forward contracts was calculated using the prices quoted on the market for financial instruments having similarcharacteristics.
F-140

Table of Contents
BANCO SANTANDER CHILE AND SUBSIDIARIESNOTES TO THE CONSOLIDATED FINANCIAL STATEMENTS
AS OF DECEMBER 31, 2009, 2008 AND JANUARY 1, 2008 NOTE 38 - FAIR VALUE OF FINANCIAL ASSETS AND LIABILITIES, continued:
The fair value of interest rate swaps represents the estimated amount that the Bank expects to receive or pay to rescind the contracts or agreements, bearing inmind the term structures of the interest rate curve, the underlying asset’s volatility and the counterparts’ credit risk.
If there are no quoted prices on the market (either direct or indirect) for any derivative instrument, the respective fair value estimates have been calculated byusing models and valuation techniques such as Black-Scholes, Hull, and Monte Carlo simulations, taking into consideration the relevant inputs/outputs such asvolatility of options, observable correlations between underlying assets, counterparts’ credit risk, implicit price volatility, the velocity with which the volatilityreverts to its average value, and the straight-line relationship (correlation) between the value of a market variable and its volatility, among others.
Measurement of fair value and hierarchy
IAS 39 provides a hierarchy of reasonable value which separates the inputs and/or valuation technique assumptions used to measure the fair value of financialinstruments. The hierarchy attributes the highest priority to unadjusted quoted prices on active markets, to identical (level 1) assets or liabilities, and a lowerpriority to measures which involve significant unobservable inputs or outputs (level 3 measurements). The three levels of the hierarchy of fair values are:
• Level 1: inputs/outputs with (unadjusted) quoted prices on active markets for identical assets and liabilities which the Bank can access on the date ofmeasurement.
• Level 2: inputs/outputs other than the quoted prices included in level 1 which are observable for assets or liabilities, either directly or indirectly. • Level 3: inputs/outputs which are not observable for the asset or the liability. The level of hierarchy at which a measurement is classified is based on the lowest level of input/output which is significant for the measurement as such of thefair value in its entirety.
The Bank has currently determined certain financial instruments as pertaining to level 3, because the calculation made at market value is based on informationfrom internal modeling and not observable on the market.The following financial instruments are classified as level 3:
Type of financial instrument Model used in valuation Description
Caps/Floors/Swaptions Black Normal Model for Cap/Floorsand Swaptions
There is no observable input of implicit volatility.
UF Options Black – Scholes There is no observable input of implicit volatility.
Cross currency swap with Window Hull-White Hybrid HW model for rates and Brownian motion for FX. There is noobservable input of implicit volatility.
Cross currency swaps with Metro deSantiago S.A.
Implicit Forward Rate Agreement(FRA)
Start Fwd unsupported by MUREX (platform) due to the UF fwd estimate.
Cross currency swap, Interest rateswap, Call money swap in TasaActiva Bancaria (Active Banks Rate)TAB
Sundry Validation obtained by using the interest curve and interpolating at flowmaturities, but TAB is not a directly observable variable and is not correlatedto any market input.
F-141

Table of Contents
BANCO SANTANDER CHILE AND SUBSIDIARIESNOTES TO THE CONSOLIDATED FINANCIAL STATEMENTS
AS OF DECEMBER 31, 2009, 2008 AND JANUARY 1, 2008 NOTE 38 - FAIR VALUE OF FINANCIAL ASSETS AND LIABILITIES, continued:
The following table presents the assets and liabilities that are measured at fair value on a recurrent basis, as of December 31, 2009, 2008 and January 1, 2008:
Measures of fair value December 31, 2009 Level 1 Level 2 Level 3
MCh$ MCh$ MCh$ MCh$ Assets Trading investments 798,539 798,539 - - Available for sale investments 1,830,090 1,830,090 - - Derivatives 1,393,878 - 1,181,660 212,218 Totals 4,022,507 2,628,629 1,181,660 212,218 Liabilities Derivatives 1,348,906 - 880,058 468,848 Totals 1,348,906 - 880,058 468,848
Measures of fair value December 31, 2008 Level 1 Level 2 Level 3
MCh$ MCh$ MCh$ MCh$ Assets Trading investments 1,166,426 1,166,426 - - Available for sale investments 1,580,240 1,580,240 - - Derivatives 1,846,509 - 1,765,205 81,304 Totals 4,593,175 2,746,666 1,765,205 81,304 Liabilities Derivatives 1,469,724 - 1,418,323 51,401 Totals 1,469,724 - 1,418,323 51,401
Measures of fair value January 1, 2008 Level 1 Level 2 Level 3
MCh$ MCh$ MCh$ MCh$ Assets Trading investments 1,093,445 1,093,445 - - Available for sale investments 779,635 779,635 - - Derivatives 780,775 - 716,458 64,317 Totals 2,653,855 1,873,080 716,458 64,317 Liabilities Derivatives 778,217 - 771,034 7,183 Totals 778,217 - 771,034 7,183
During years 2009, 2008 and 2007 there is no changes between levels as shown above.
F-142

Table of Contents
BANCO SANTANDER CHILE AND SUBSIDIARIESNOTES TO THE CONSOLIDATED FINANCIAL STATEMENTS
AS OF DECEMBER 31, 2009, 2008 AND JANUARY 1, 2008 NOTE 38 - FAIR VALUE OF FINANCIAL ASSETS AND LIABILITIES, continued:
The following table presents the Bank’s activity for assets and liabilities measured at fair value on a recurrent basis using unobserved significant entries (Level 3)as of December 31, 2009 and 2008:
Assets Liabilities MCh$ MCh$ As of January 1, 2008 64,317 (7,183) Total realized and unrealized profits (losses): Included in profit 16,987 (44,218)Included in comprehensive income - - Purchases, issuances, and placements (net) - - As of December 31, 2008 81,304 (51,401) Total profits or losses included in income for 2008 that are attributable to change in unrealized profits (losses) relatedto assets or liabilities as of December 31, 2008. 16,987 (44,218)
Assets Liabilities MCh$ MCh$ As of December 31, 2008 81,304 (51,401) Total realized and unrealized profits (losses): Included in profit 130,914 (417,447)Included in comprehensive income Purchases, issuances, and placements (net) As of December 31, 2009 212,218 (468,848) Total profits or losses included in income for 2009 that are attributable to change in unrealized profits (losses) relatedto assets or liabilities as of December 31, 2009. 130,914 (417,447)
The realized and unrealized profits (losses) included in income for 2009 and 2008, in the assets and liabilities valued at fair value on a recurrent basis throughunobservable significant entries (Level 3) are recorded in the Income Statement under the “Net profit from financial operations” item.
The potential effect as of December 31, 2009 and 2008 on the valuation of assets and liabilities valued at fair value on a recurrent basis through unobservablesignificant entries (level 3), generated by changes in the principal assumptions if other reasonably possible assumptions that are less or more favorable wereused, is not considered by the Bank to be significant.
F-143

Table of Contents
BANCO SANTANDER CHILE AND SUBSIDIARIESNOTES TO THE CONSOLIDATED FINANCIAL STATEMENTS
AS OF DECEMBER 31, 2009, 2008 AND JANUARY 1, 2008 NOTE 39 - RISK MANAGEMENT:
Introduction and general description
Through its activity with financial instruments, the Bank is exposed to several types of risk. The principal risks related to the financial instruments that areapplicable to the Bank are the following:
- Market risks: these arise from holding financial instruments whose value may be affected by fluctuations in market conditions, generally including thefollowing types of risk:
a. Foreign exchange risk: this arises as a consequence of exchange rate fluctuations among currencies. b. Interest rate risk: this arises as a consequence of fluctuations in market interest rates. c. Price risk: this arises as a consequence of changes in market prices, either due to factors specific to the instrument itself or due to factors that
affect all the instruments negotiated in the market. d. Inflation risk: this arises as a consequence of changes in Chile’s inflation rate, whose effect would be mainly applicable to financial
instruments denominated in UFs.
- Credit risk: this is the risk of one of the parties to a financial instrument failing to meet its contractual obligations for reasons of insolvency or inabilityof the individuals or legal entities in question, causing a financial loss on the other party.
- Liquidity risk: liquidity risk is the possibility that an entity may be unable to meet its payment commitments, or that in order to meet them, it may haveto raise funds on onerous terms or damage its image and reputation.
- Operating risk: this is a risk arising from human errors, system errors, fraud or external events which may damage the Bank’s reputation, may havelegal or regulatory implications, or cause financial losses.
This note includes information on the Bank’s exposure to these risks and on its objectives, policies, and processes involved in their measurement andmanagement.
Risk management structure
The Board is responsible for the establishment and monitoring of the Bank’s risk management structure, for which purpose it has an on-line corporategovernance system with the international recommendations and trends, adapted to Chilean regulatory conditions and able to apply the most advanced practices inthe markets in which the Bank operates. To optimize the performance of this function, the Board has established the Assets and Liabilities Committee(“ALCO”), whose principal task is to assist in carrying out its functions relating to oversight and management of the Bank’s risks. To complement the ALCO inthe risk management function, the Board also has three key committees: the Markets Committee (“CDM,” the acronym in Spanish) the Executive CreditCommittee (“CEC,” t he acronym in Spanish) and the Audit Committee (“CDA,” the acronym in Spanish). Each of these committees is composed of directorsand executive members of the Bank’s management.
The ALCO is responsible for formulating the Bank’s risk management policies according to guidelines of the Board, those of Santander Spain’s Global RiskDepartment, and the regulatory requirements adopted by the Chilean Superintendency of Banks and Financial Institutions (“SBIF”). These policies have beencreated mainly to identify and analyze the risks faced by the Bank, determine the risk limits and appropriate controls, and keep track of the risks and comply withthe limits. The Bank’s risk management policies and systems are regularly reviewed to reflect the changes in market conditions and in products or servicesoffered. Through training in and management of standards and procedures, the Bank seeks to develop a disciplined and constructive control environment inwhich all its emplo yees understand their functions and obligations.
F-144

Table of Contents
BANCO SANTANDER CHILE AND SUBSIDIARIESNOTES TO THE CONSOLIDATED FINANCIAL STATEMENTS
AS OF DECEMBER 31, 2009, 2008 AND JANUARY 1, 2008 NOTE 39 - RISK MANAGEMENT, continued:
To carry out its duties, the ALCO works directly with the Bank’s control and risk departments, whose joint objectives include the following:
- evaluate risks whose magnitude might threaten the Bank’s solvency or which might potentially pose significant risks to its operations or reputation; - ensure that the Bank is equipped with the means, systems, structures, and resources consistent with best practices, which enable the implementation of
the risk management strategy; - ensure the integration, control, and management of all the Bank’s risks; - apply homogeneous risk principles, policies and metrics throughout the Bank and its businesses; - develop and implement a risk management model at the bank, in order for risk exposure to be adequately integrated into the different decision making
processes; - identify risk concentrations and mitigation alternatives, monitor the macroeconomic and competitive environment, quantifying sensitivities and the
foreseeable impact of different scenarios on risk positioning; and - carry out the management of structural liquidity, interest rate and exchange rate risks, as well as those arising from the Bank’s own resource base.
To achieve the aforementioned objectives, the Bank (its management and the ALCO) performs a variety of activities relating to risk management, including thefollowing: calculate exposures to risk of different portfolios and/or investments, taking into consideration mitigating factors (guarantees, netting, collateral, etc.);calculate the probabilities of expected loss for each portfolio and/or investment; assign loss factors to the new transactions (rating and scoring); measure the riskvalues of the portfolios and/or investments based on different scenarios by means of historical simulations; specify limits for potential losses based on thedifferent risks incurred; determine the potential impact of the structural risks on the Bank’s Consolidated Statements of Income; set limits and alerts whichguarantee the Bank’s liquidity; and identify and quantify the operating risks by line of business, so as to facilitate their mitigation through corrective actions.
The CDA is mainly responsible for supervising compliance with the Bank’s risk management policies and procedures, and for reviewing the adaptation of therisk management framework to the risks faced by the Bank.
Credit risk
Credit risk is the risk of one of the parties to a financial instrument contract failing to meet its contractual obligations for reasons of insolvency or inability of theindividuals or legal entities in question, causing a financial loss to the other party. For credit risk management purposes, the Bank consolidates all the elementsand components of the exposure to credit risk (for example, individual arrears by creditor, the innate risk of a given line of business or industry and/orgeographic risk).
Mitigation of credit risk for loans and accounts receivable
The Board has delegated the duty of credit risk management to the ALCO and CEC, as well as to the Bank’s risk departments, whose roles are summarizedbelow:
- Formulation of credit policies, by consulting with the business units, meeting requirements of guarantees, credit evaluation, risk rating and submissionof reports, documentation and legal procedures in compliance with the regulatory, legal and internal requirements < /font>of the Bank.
F-145

Table of Contents
BANCO SANTANDER CHILE AND SUBSIDIARIESNOTES TO THE CONSOLIDATED FINANCIAL STATEMENTS
AS OF DECEMBER 31, 2009, 2008 AND JANUARY 1, 2008 NOTE 39 - RISK MANAGEMENT, continued:
- Establish structure for the authorization of approval and renewal of credit applications. The Bank structures credit risk levels by assigning concentrationlimits on such risk for individual borrowers, industry segments, and countries. The authorization limits a re assigned to the respective officers of thebusiness unit (commercial, consumer, PYME), in order to be permanently monitored by Management. In addition, these limits are periodicallyreviewed. The risk evaluation teams at the branch level regularly interact with customers, but for large-scale operations, the risk teams of the parent andeven the CEC work directly with the customers in the evaluation of credit risk and preparation of the loan applications. Even Banco Santander – Spainparticipates in the approval process of the most important loans, such as those made to customers or economic groups with amounts of debt that exceedsUS$40 million.
- Limit concentrations of exposure to customers or counterparts, in geographic areas or industries (for accounts receivable or loans), and by issuer, creditrating, and liquidity (for investments).
- Develop and maintain the Bank’s credit risk classifications, for the purpose of classifying risks according to the degree of exposure to financial loss thatis faced by the respective financial instruments, with the aim of focusing risk management specifically on the associated risks.
- Review and evaluate credit risk. Management’s risk divisions are largely independent of the Bank’s commercial division and evaluate all credit risks inexcess of the specified limits, prior to loan approvals for customers or prior to the acquisition of specific investments. Renewals and revisions of loansare subject to similar processes.
While preparing a loan application for a corporate customer, the Bank verifies multiple parameters such as ability to service debt (generally includingthe projected cash flows), the customer’s financial history, and/or projections for the economic sector or industry in which it operates. The risk divisionis closely involved in this process. All applications contain an analysis of the customer’s strengths and weaknesses, a rating, and a recommendation.Credit limits are not determined on the basis of the customers’ outstanding loan balances, but on the financial group’s direct and indirect credit risk. Forexample, a corporation would be evaluated jointly with its Affiliates and affiliates.
Consumer loans are evaluated and approved by their respective risk divisions (individual, PYME), and the evaluation process is based on an evaluationsystem known as Garra (Hook) (Banco Santander) and Syseva (Santander Banefe). Both of these processes are decentralized, automated, and based on ascoring system that includes the credit risk policies adopted by the Bank’s Board. The loan application process is based on a collection of information todetermine the customer’s financial condition and ability to pay. The parameters used to evaluate an applicant’s credit risk include several variables, suchas income level, duration of current employment, indebtedness and credit bureau reports.
- Provide advice, orientation and specialized knowledge to the business units in order to promote the Bank’s best practices in credit risk management.
Mitigation of credit risk of other financial assets (investments, derivatives, commitments)
As a part of the acquisition process of financial investments and financial instruments, the Bank examines the probability of uncollectibility from issuers orcounterparties, using internal and external evaluations, such as risk evaluators that are independent from the Bank. The Bank is also governed by a strict andconservative policy which ensures that the issuers of its investments and the counterparties in derivative transactions are highly reputable.
F-146

Table of Contents
BANCO SANTANDER CHILE AND SUBSIDIARIESNOTES TO THE CONSOLIDATED FINANCIAL STATEMENTS
AS OF DECEMBER 31, 2009, 2008 AND JANUARY 1, 2008 NOTE 39 - RISK MANAGEMENT, continued:
In addition, the Bank operates with a variety of instruments which imply credit risk, but are not reflected in the Consolidated Statement of Financial Position,such as: guarantees and bonds, documentary letters of credit, performance bonds, and commitments to grant loans.
The guarantees and bonds imply an irrevocable payment obligation. If a guaranteed customer fails to meet their obligations to third parties secured by the Bank,the Bank will make the relevant payments; hence, these transactions imply the same credit risk exposure as an ordinary loan.
Documentary letters of credit are commitments documented by the Bank on behalf of customers, which are secured by the shipped merchandise to which theyrelate, and hence, have a lower risk than direct indebtedness. Performance bonds are contingent commitments which become enforceable only if the customerfails to carry out the work agreed upon with a third party and secured by such performance bonds.
For commitments to grant loans, the Bank is potentially exposed to losses in an amount equivalent to the total unused amount of the commitment. However, theprobable amount of loss is smaller than the total unused amount of the commitment. The Bank monitors the maturities of lines of credit because long-termcommitments generally pose a higher credit risk than short-term commitments.
Maximum credit risk exposure
For financial assets recorded in the Consolidated Statement of Financial Position, the credit risk exposure is equal to their book value. For the financialguarantees granted, the maximum credit risk exposure is the maximum amount the Bank would have to pay if the guarantee were enforced.
Below is the distribution by financial asset of the Bank’s maximum exposure to credit risk as of December 31, 2009 and 2008, without deduction of collateral orcredit improvements received:
As of December 31, As of
January 1, 2009 2008 2008
Amount ofexposure
Amount ofexposure
Amount ofexposure
Note MCh$ MCh$ MCh$ Cash and deposits in banks 5 2,043,458 855,411 1,108,637 Unsettled transactions 5 468,134 335,405 316,240 Trading investments 6 798,539 1,166,426 1,093,445 Investments under resale agreements 7 14,020 - 33,999 Financial derivatives contracts 8 1,393,878 1,846,509 780,775 Loans and accounts receivable from customers 9 and 10 13,401,749 14,406,848 12,068,236 Available for sale investments 12 1,830,090 1,580,240 779,635 Off-balance commitments: Letters of credit issued 24 155,956 181,381 181,034 Confirmed foreign letters of credit 24 35,818 122,783 145,016 Guarantees 24 655,780 766,727 627,642 Available credit lines 24 4,615,787 4,041,849 - Guarantees 24 169,931 172,568 236,661 Totals 25,583,140 25,476,147 17,371,320
F-147

Table of Contents
BANCO SANTANDER CHILE AND SUBSIDIARIESNOTES TO THE CONSOLIDATED FINANCIAL STATEMENTS
AS OF DECEMBER 31, 2009, 2008 AND JANUARY 1, 2008 NOTE 39 - RISK MANAGEMENT, continued:
Credit quality is classified as described in the SBIF’s Compendium of Standards as of December 31, 2009 and 2008:
As of December 31, 2009
Commercial
loans Consumer
loans Mortgage
loans Total Category MCh$ MCh$ MCh$ MCh$ %
A - 1,895,241 - 1,895,241 13.8 A1 - - - - - A2 3,187,959 - 3,808,195 6,996,154 50.9 A3 2,998,956 - 223,928 3,222,884 23.5 B 601,080 165,181 10,481 776,742 5.5 B- - 69,150 - 69,150 0.5 C - 74,735 3,636 78,371 0.6 C1 224,732 - 18,101 242,833 1.8 C2 97,885 - 8,640 106,525 0.8 C3 60,679 - 2,012 62,691 0.4 C4 56,985 - 27,294 84,279 0.6 D - 39,742 - 39,742 0.3 D1 80,574 - 42,438 123,012 0.9 D2 39,324 - 14,328 53,652 0.4
Total 7,348,174 2,244,049 4,159,053 13,751,276 100.0
As of December 31, 2008
Commercial
loans Consumer
loans Mortgage
loans Total Category MCh$ MCh$ MCh$ MCh$ %
A - 1,811,060 3,562,617 5,373,677 36.7 A1 - - - - - A2 6,463,445 - - 6,463,445 44.0 A3 1,351,054 - - 1,351,054 9.2 B 208,954 203,375 199,087 611,416 4.2 B- - 75,281 79,930 155,211 1.1 C - 94,507 64,972 159,479 1.1 C1 220,434 - - 220,434 1.5 C2 26,738 - - 26,738 0.2 C3 34,296 - - 34,296 0.2 C4 36,100 - - 36,100 0.2 D - 64,915 73,950 138,865 0.9 D1 48,711 - - 48,711 0.3 D2 61,662 - - 61,662 0.4
Total 8,451,394 2,249,138 3,980,556 14,681,088 100.0
F-148

Table of Contents
BANCO SANTANDER CHILE AND SUBSIDIARIESNOTES TO THE CONSOLIDATED FINANCIAL STATEMENTS
AS OF DECEMBER 31, 2009, 2008 AND JANUARY 1, 2008 NOTE 39 - RISK MANAGEMENT, continued:
As of January 1, 2008
Commercial
loans Consumer
loans Mortgage
loans Total Category MCh$ MCh$ MCh$ MCh$ %
A - 1,746,587 - 1,746,587 14.3 A1 - - - - - A2 5,346,983 - 3,116,306 8,463,289 68.8 A3 1,237,799 - 147,644 1,385,443 11.3 B 74,068 154,328 23,697 252,093 2.0 B- - 66,905 - 66,905 0.5 C - 71,508 - 71,508 0.6 C1 88,171 - 12,200 100,371 0.8 C2 20,920 - 7,350 28,270 0.2 C3 18,518 - 2,773 21,291 0.2 C4 38,480 - 19,103 57,583 0.5 D - 30,452 - 30,452 0.2 D1 40,277 - 12,819 53,096 0.4 D2 19,229 - 2,523 21,752 0.2
Total 6,884,445 2,069,780 3,344,415 12,298,640 100.0
- The A categories pertain to borrowers that pose minimal credit risk.
- The B categories pertain to borrowers that pose a certain credit risk, having minimal inability to pay and a low vulnerability to defaulting on theirfinancial obligations. This category includes borrowers whose ability to pay depends on favorable business and economic conditions. It may includethose who have past-due contractual interests or principal payments but such impairment is not deemed inappropriate by the Bank, based on the level ofavailable security interest and/or the stage of collection of the amounts owed to the Bank.
- The C and D categories pertain to impaired loans for which the Bank determines that the borrower will not be able to raise all the principal and interestowed pursuant to the terms of the loan agreement.
See Note 32 for a detail of the Bank’s impaired loans and their respective allowances. See also Note 21 for a detail of the maturities of the Bank’s financialassets.
Impairment of other financial instruments
As of December 31, 2009 and 2008, the Bank had no significant impairment of its financial assets other than loans and accounts receivable.
Security interests and credit improvements
The maximum exposure to credit risk is reduced in some cases by security interests, credit improvements, and other actions which mitigate the Bank’s exposure.Based on the foregoing, the creation of security interests are a necessary but not a sufficient condition for granting a loan; accordingly, the Bank’s acceptance ofrisks requires the verification of other variables and parameters, such as the ability to pay or generate funds in order to mitigate the risk being taken on.
The procedures for management and valuation of security interests are reflected in the internal risk management policy. The basic principles for credit riskmanagement, which includes management of the security interests received in transactions with customers, are set forth in these policies. In this respect, the riskmanagement model includes a determination of the existence of appropriate and sufficient security interests that enable recovery of the loan if the borrower’scircumstances do not allow it to meet its obligations.
F-149

Table of Contents
BANCO SANTANDER CHILE AND SUBSIDIARIESNOTES TO THE CONSOLIDATED FINANCIAL STATEMENTS
AS OF DECEMBER 31, 2009, 2008 AND JANUARY 1, 2008 NOTE 39 - RISK MANAGEMENT, continued:
The procedures used for the valuation of security interests conform to best market practices, which provide for the use of appraisals for mortgage securities,market prices for stock securities, value of the interest for investment funds, etc. All collateral received must be properly documented and registered in theappropriate registry, and must be approved by the Bank’s legal divisions.
The Bank also has rating tools which allow it to rank the credit quality of transactions or customers. In order to analyze the manner in which this probabilityfluctuates, the Bank has historical databases which store internally generated information. The rating tools vary according to the segment to which the customerbeing analyzed belongs (commercial, consumer, PYME, etc.).
Below is the detail of security interests, collateral or credit improvements provided to the Bank as of December 31, 2009 and 2008.
2009 2008 MCh$ MCh$ Nonimpaired financial assets:
Properties/mortgages 6,778,005 6,268,670 Investments and other 322,435 330,244
Impaired financial assets: Properties/mortgages 517,495 703,702 Investments and other 26,422 17,982
Totals 7,644,357 7,320,598
Liquidity risk
Liquidity risk is the risk that the Bank may have difficulty meeting the obligations associated with its financial obligations.
Liquidity risk management
The Bank is continually exposed to demands for cash arising from multiple banking transactions such as payments from checking accounts, payments on timedeposits, payments of guarantees, disbursements for derivative transactions, etc. As is inherent in banking activity, the Bank does not hold enough cash to coverthe balance of these positions, since experience shows that only a minimal amount of these funds will be withdrawn, which amount can be foreseen with a highdegree of certainty.
The Bank’s approach to liquidity management is to make as certain as possible that it always has enough liquidity to meet its obligations when they mature,under both normal circumstances and conditions of stress, without incurring unacceptable losses or running the risk of damage to the Bank’s reputation. TheBoard sets limits at a minimum portion of maturing funds available to make these payments, and over a minimum level of interbank transactions and other loanfacilities which must be available to cover unexpected levels of demand, which is periodically reviewed. Moreover, the Bank must comply with regulatory limitsimposed by the SBIF for term asymmetries.
These limits affect the asymmetries of future flows of income and outlays on an individual basis. They are:
(i) asymmetries of up to 30 days for all currencies, up to the amount of basic capital; (ii) asymmetries of up to 30 days for foreign currencies, up to the amount of the basic capital; and (iii) asymmetries of up to 90 days for all currencies, twice the basic capital.
F-150

Table of Contents
BANCO SANTANDER CHILE AND SUBSIDIARIESNOTES TO THE CONSOLIDATED FINANCIAL STATEMENTS
AS OF DECEMBER 31, 2009, 2008 AND JANUARY 1, 2008 NOTE 39 - RISK MANAGEMENT, continued:
The treasury department receives information from all the business units on the liquidity profile of their financial assets and liabilities, as well as details of otherexpected cash flows stemming from future businesses. Based on that information, the treasury department maintains a portfolio of liquid short-term assets,comprised mainly of liquid investments, loans and advances to other banks, to make sure the Bank has sufficient liquidity. The business units’ liquidity needs aremet through short-term transfers from the treasury department to cover any short-term fluctuations and long-term financing to address all the structural liquidityrequirements.
The Bank monitors its liquidity position every day, determining the future flows of its outlays and revenues. In addition, stress tests are performed at the end ofeach month, for which a variety of scenarios encompassing both normal market conditions and conditions of market fluctuation are used. The liquidity policyand procedures are subject to review and approval by the Bank’s Board. Periodic reports are generated, providing a detail of the liquidity position of the Bankand its Affiliates, including any exceptions and the corrective measures adopted, which are regularly submitted to the ALCO for review.
The Bank relies on customer (retail) and institutional deposits, obligations to banks, debt instruments, and time deposits asits main sources of funding. Although most obligations to banks, debt instruments and time deposits have maturities of more than one year, customer (retail) andinstitutional deposits tend to have shorter maturities and a large proportion of them are payable within 90 days. The short-term nature of these deposits increasesthe Bank’s liquidity risk, and hence, the Bank actively manages this risk through continual supervision of the market trends and price management.
Exposure to liquidity risk
The key measure used by the bank to manage liquidity risk is the ratio of net liquid assets to customer deposits. For this purpose, the net liquid assets mustinclude cash, cash equivalents and debt securities for which there is an active and liquid market, minus bank deposits, fixed-income securities issued, loans andother commitments maturing within the next month. A similar but not identical measure is used to determine the bank’s compliance with the liquidity limitestablished by the SBIF. The ratios of net liquid assets to customer deposits at the repo rting dates were as follows:
As of December 31,
2009 2008 % %
30 days 7 29 90 days 57 40
F-151

Table of Contents
BANCO SANTANDER CHILE AND SUBSIDIARIESNOTES TO THE CONSOLIDATED FINANCIAL STATEMENTS
AS OF DECEMBER 31, 2009, 2008 AND JANUARY 1, 2008 NOTE 39 - RISK MANAGEMENT, continued:
The detail by contractual maturity of the Bank’s asset and liability balances as of December 31, 2009 and 2008, including consideration of off-balancecommitments:
As of December 31, 2009
DemandMCh$
Up to 1monthMCh$
Between 1and 3
months,MCh$
Between 3and 12monthsMCh$
Between 1and 5 years
MCh$ More than 5years, MCh$
TotalMCh$
Maturity of assets (Note 21) 2,907,674 1,235,968 1,093,804 3,205,387 5,701,393 5,612,392 19,756,618 Maturity of liabilities (Note 21) (3,849,862) (2,699,279) (2,665,281) (4,214,749) (3,552,474) (1,485,523) (18,467,168)Net maturity (942,188) (1,463,311) (1,571,477) (1,009,362) 2,148,919 4,126,869 1,289,450 Off-balance commitments: Guarantees and bonds - (23,412) (86,692) (43,378) (16,322) (127) (169,931)Confirmed foreign letters of credit - (8,851) (6,935) (17,453) (2,579) - (35,818)Letters of credit issued - (49,347) (82,488) (16,685) (7,435) - (155,955)Securities - (76,173) (92,409) (287,001) (193,458) (6,739) (655,780) Net maturity, includingcommitments (942,188) (1,621,094) (1,840,001) (1,373,879) 1,929,125 4,120,003 271,966
As of December 31, 2008
DemandMCh$
Up to 1monthMCh$
Between 1and 3
months,MCh$
Between 3and 12monthsMCh$
Between 1and 5 years
MCh$
More than 5yearsMCh$
TotalMCh$
Maturity of assets (Note 21) 1,315,148 3,035,008 1,569,108 2,751,191 5,932,708 5,587,135 20,190,298 Maturity of liabilities (Note 21) (3,173,625) (3,702,161) (2,878,700) (3,965,133) (3,449,602) (1,814,512) (18,983,733)Net maturity (1,858,477) (667,153) (1,309,592) (1,213,942) 2,483,106 3,772,623 1,206,565 Off-balance commitments: Guarantees and bonds - (65,081) (11,690) (67,090) (28,707) - (172,568)Confirmed foreign letters of credit - (20,254) (58,846) (43,286) (397) - (122,783)Letters of credit issued - (63,129) (95,513) (21,242) (1,497) - (181,381)Securities - (70,257) (87,779) (324,035) (284,656) - (766,727) Net maturity, includingcommitments (1,858,477) (885,874) (1,563,420) (1,669,595) 2,167,849 3,772,623 (36,894)
The above tables show the undiscounted cash flows of the Bank’s financial assets and liabilities based on their estimated maturities. The Bank’s expected cashflows from these instruments can diverge considerably from this analysis. For example, demand deposits are expected to remain stable or grow, while not all off-balance loan commitments that have been arranged are expected to be executed. In addition, the foregoing detail excludes disposable lines of credit, since theydo not have contractually defined maturities.
Market risk
Market risk arises as a consequence of activity in the markets, through financial instruments whose value can be affected by fluctuations in market conditions,reflected in changes in the different assets and financial risk factors. The risk can be mitigated through hedges using other products (assets/liabilities orderivatives), or by cancelling the open transaction/position. The purpose of market risk management is to manage and control exposure to market risk, keeping itwithin accepted parameters.
There are four major risk factors that affect market prices: interest rates, exchange rates, prices and inflation. In addition and for certain positions, it is necessaryto consider other risks as well, such as spread risk, base risk, commodity risk, volatility or correlation risk.
F-152

Table of Contents
BANCO SANTANDER CHILE AND SUBSIDIARIESNOTES TO THE CONSOLIDATED FINANCIAL STATEMENTS
AS OF DECEMBER 31, 2009, 2008 AND JANUARY 1, 2008 NOTE 39 - RISK MANAGEMENT, continued:
Market risk management
The Bank’s internal management to measure market risk is based mainly on the procedures and standards of Santander Spain, which are in turn based on analysisof management in three principal components:
- trading portfolio; - domestic financial management portfolio; - foreign financial management portfolio.
The trading portfolio is comprised mainly of investments valued at fair value and free of any restriction on their immediate sale, which are often bought and soldby the Bank with the intent of selling them in the short term in order to benefit from short-term price fluctuations. The financial management portfolios includeall the financial investments not considered a part of trading portfolio.
The ALCO has the overall responsibility for market risk. The Bank’s risk/finance department is responsible for formulating detailed management policies andapplying them to the Bank’s operations, in conformity with the guidelines adopted by the ALCO and the Global Risk Department of Banco Santander – Spain.
The department’s functions in connection with the trading portfolio include the following: (i) apply the “Value at Risk” (VaR) techniques to measure interest raterisk, (ii) adjust the trading portf olios to market and measure the daily income and loss from commercial activities, (iii) compare the real VaR with the establishedlimits, (iv) establish procedures to prevent losses in excess of predetermined limits, and (v) furnish information on the trading activities to the ALCO, othermembers of the Bank’s management and the Global Risk Department of Santander – Spain.
The department’s functions in connection with financial management portfolios include the following: (i) perform sensitivity simulations (as explained below) tomeasure interest rate risk for activities denominated in local currency and the potential loss forecasted by these simulations, and (ii) provide daily reports thereonto the ALCO, other members of the Bank’s management, and the Global Risk Department of Santander - Spain.
Market risk - trading portfolio
The Bank applies VaR methodologies to measure the market risk of its trading portfolio. The Bank has a consolidated commercial position comprised of fixed-income investments, foreign currency trading, and a minimal position in equity securities. This portfolio is comprised mostly of Chilean Central Bank Bonds,mortgage bonds and locally issued, low-risk corporate bonds. At the end of the year, the trading portfolio included no equity portfolio securities.
For the Bank, the VaR estimate is made under the historical simulation methodology, which consists of analyzing the behavior of the income and losses thatwould have occurred in the current portfolio if the market conditions for a given historical period had been applicable, in order to infer the maximum loss on thebasis of that information with a given < /font>level of confidence. The methodology has the advantage of precisely reflecting the historical distribution of themarket variables and not requiring any assumptions regarding the distribution of specific probabilities. All the VaR measures are intended to determine thedistribution function for a change in the value of a given portfolio, and once that distribution is known, to calculate the percentile related to the necessary level ofconfidence, which will be equal to the value at risk by virtue of those parameters. As calculated by the Bank, the VaR is an estimate of the maximum expectedloss of market value for a given portfolio over a 1-day horizon, with a 99.00% confidence level. It is the maximum 1-day loss that the Bank could expect toexperience in a given portfolio, with a 99.00% confidence l evel. In other words, it is the loss that the Bank would expect to experience only 1.0% of the time.The VaR provides a single estimate of market risk which is not comparable from one market risk to another. Returns are calculated through the use of a 2-yeartime window or at least 520 data points obtained since the last reference date for calculation of the VaR going backward in time.
F-153

Table of Contents
BANCO SANTANDER CHILE AND SUBSIDIARIESNOTES TO THE CONSOLIDATED FINANCIAL STATEMENTS
AS OF DECEMBER 31, 2009, 2008 AND JANUARY 1, 2008 NOTE 39 - RISK MANAGEMENT, continued:
The Bank uses the VaR estimates to provide a warning when the statistically expected losses in its trading portfolio would exceed prudent levels, and hence,there are certain predetermined limits.
Limitations of the VaR model
When applying a calculation methodology, no assumptions are made regarding the probability distribution of the changes in the risk factors; the historicallyobserved changes are used for the risk factors on which each position in the portfolio will be valued.
It is necessary to define a valuation function fj(xi) for each instrument j, preferably the same one used to calculate the market value and income of the dailyposition. This valuation function will be applied in each scenario to generate simulated prices for all the instruments in each scenario.
In addition, the VaR methodology should be interpreted taking into consideration the following limitations:
- Changes in market rates and prices may not be independent and identically distributed random variables, and may not have a normal distribution. Inparticular, the assumption of normal distribution may underestimate the probability of extreme market movements;
- The historical data used by the Bank may not provide the best estimate of the joint distribution of changes in the risk factors in the future, and anymodification of the data may be inadequate. In particular, the use of historical data may fail to capture the risk of potential extreme and adverse marketfluctuations, regardless of the time period used;
- A 1-day time horizon may not fully capture the market risk positions which cannot be liquidated or covered in a single day. It would not be possible toliquidate or cover all the positions in a single day;
- The VaR is calculated at the close of business, but trading positions may change substantially in the course of the trading day;
- The use of a 99% level of confidence does not take account of, or make any statement about, the losses that could occur outside of that degree ofconfidence; and
A model such as the VaR does not capture all the complex effects of the risk factors over the value of the positions or portfolios, and accordingly, it couldunderestimate potential losses.
F-154

Table of Contents
BANCO SANTANDER CHILE AND SUBSIDIARIESNOTES TO THE CONSOLIDATED FINANCIAL STATEMENTS
AS OF DECEMBER 31, 2009, 2008 AND JANUARY 1, 2008 NOTE 39 - RISK MANAGEMENT, continued:
At no time in 2009 and 2008 did the Bank exceed the VaR limits in connection with the three components which comprise the trading portfolio: fixed-incomeinvestments, variable-income investments and foreign currency investments. The high, low, and average levels for each component and for each year were asfollows:
Consolidated 2009%
2008%
VaR:
High 9.79 11.6 Low 4.24 3.7 Average 5.98 6.6
Fixed-income investments:
High 9.14 9.5 Low 4.22 3.3 Average 5.87 6
Variable-income investments:
High 1.65 1.4 Low 0.04 0.2 Average 0.17 0.5
Foreign currency investments
High 7.02 4.0 Low 0.66 0.6 Average 2.31 2.5
Market risk - local and foreign financial management
The Bank’s financial management portfolio includes most of the Bank’s non-trading assets and liabilities, including the credit/loan portfolio. For these portfolios,investment and financing decisions are strongly influenced by the Bank’s commercial strategies.
The Bank uses a sensitivity analysis to measure the market risk of local and foreign currency (not included in the trading portfolio). The Bank performs asimulation of scenarios, which is calculated as the difference between the present value of the cash flows in the chosen scenario (a curve with a parallelmovement of 100 bp in all its segments) and their value in the base scenario (current market). All the inflation-indexed local currency (UF) positions are adjustedby a sensitivity factor of 0.57, which represents a 57 basis point change in the rate curve for the real rates and a 100 basis point change for the nominal rates. Thesame scenario is performed for the net foreign currency positions and the interest rates in US dollars. The Bank has also established limits regarding themaximum loss which these interest rate movements may impose on the capital and net financial income budgeted for the year.
Limitations of the sensitivity models
The most important assumption is the use of a 100 basis point change in the yield curve (57 basis points for the real rates). The Bank uses a 100 basis pointchange because sudden changes of that magnitude are considered realistic. The Global Risk Department of Santander Spain has established comparable limits bycountry, to be able to compare, monitor and consolidate the market risk by country in a realistic and orderly way.
F-155

Table of Contents
BANCO SANTANDER CHILE AND SUBSIDIARIESNOTES TO THE CONSOLIDATED FINANCIAL STATEMENTS
AS OF DECEMBER 31, 2009, 2008 AND JANUARY 1, 2008 NOTE 39 - RISK MANAGEMENT, continued:
In addition, the sensitivity simulation methodology should be interpreted taking into consideration the following limitations:
- The simulation of scenarios assumes that the volumes remain in the Bank’s Consolidated Statements of Financial Position and are always renewed atmaturity, thereby omitting the fact that certain credit risk and prepayment considerations may affect the maturity of certain positions.
- This model assumes an identical change along the entire length of the yield curve and takes no account of the different movements for differentmaturities.
- The model takes no account of the sensitivity of volumes which results from interest rate changes.
- The limits to losses of budgeted financial income are calculated based on the financial income foreseen for the year, which may not be actually earned,meaning that the real percentage of financial income at risk may be higher than the expected one.
Market Risk – Financial management portfolio – December 31, 2009 and 2008
2009 2008
Effect onfinancialincome
Effect oncapital
Effect onfinancialincome
Effect oncapital
Financial management portfolio – local currency (MCh$)
Loss limit 37,264 127,000 24,000 86,400 High 17,711 123,834 16,720 85,837 Low 1,504 95,791 3,138 60,251 Average 6,404 107,239 10,807 72,622
Financial management portfolio – foreign currency (in millions of $US)
Loss limit 46,0 74,0 36,0 54,0 High 18,4 17,3 31,2 9,4 Low 1,2 1,5 1,8 0,2 Average 6,9 11,4 15,1 4,2
Financial management portfolio – consolidated (MCh$)
Loss limit 37,264 127,000 24,000 86,400 High 17,724 123,836 16,720 86,051 Low 1,939 96,280 3,138 60,252 Average 8,188 107,495 10,707 72,683
F-156

Table of Contents
BANCO SANTANDER CHILE AND SUBSIDIARIESNOTES TO THE CONSOLIDATED FINANCIAL STATEMENTS
AS OF DECEMBER 31, 2009, 2008 AND JANUARY 1, 2008 NOTE 39 - RISK MANAGEMENT, continued:
Operating risk
Operating risk is the risk of direct or indirect losses stemming from a wide variety of causes related to the Bank’s processes, personnel, technology andinfrastructure, as well as external factors other than credit, market, or liquidity, such as those related to legal or regulatory requirements. Operating risks arisefrom all the Bank’s operations.
The Bank’s objective is to manage operating risk in order to mitigate economic losses and damage to the Bank’s reputation through a flexible internal controlstructure.
The Bank’s management is mainly responsible for the development and application of controls to address operating risks. This responsibility is supported by theglobal development of the Bank’s operating risk management standards in the following areas:
- Requirements for adequate segregation of duties, including independent authorization of transactions - Requirements for reconciliation and supervision of transactions - Compliance with the applicable legal and regulatory requirements - Documentation of controls and procedures - Requirements for periodic evaluation of applicable operating risks and improvement of the controls and procedures to address the risks that are
identified - Requirements for disclosure of operating losses and the proposed corrective measures - Development of contingency plans - Training and professional development - Adoption of ethical business standards - Reduction or mitigation of risks, including acquisition of insurance policies if they are effective
Compliance with the Bank’s standards is supported by a program of periodic reviews conducted by the Bank’s internal audit unit, whose results are internallysubmitted to the management of the business unit that was examined and to the CDA.
Concentration of risk
The Bank operates mainly in Chile, so most of its financial instruments are concentrated in that country. See Note 10 of the financial statements for a detail of theconcentration of the Bank’s loans and accounts receivable by industry.
F-157

Table of Contents
BANCO SANTANDER CHILE AND SUBSIDIARIESNOTES TO THE CONSOLIDATED FINANCIAL STATEMENTS
AS OF DECEMBER 31, 2009, 2008 AND JANUARY 1, 2008 NOTE 40 - SUBSEQUENT EVENTS:
Between December 31, 2009 and the date on which these financial statements were issued, the following subsequent event occurred:
a) Bonds issuance:
In January 2010 the Bank issued senior bonds in the amount of UF 3,000,000 in Chile. They have the following detail:
Bonds Series Amount Term Issue rate Issue date Maturity date
F7 UF 3,000,000 (*) 4.5 years 3.30% per annum simple 11/1/2009 5/1/2014Total UF 3,000,000
(*) On November 1, 2009 a line of bonds comprising a single series titled F7 Series was registered in the securities registry of the Superintendency of Banks andFinancial Institutions, having a total value of UF 3,000,000 and divided into 1,500 bonds of 2,000 Development Units (UF) each, with a 4.5 year bullet and anissue rate of 3.30% per annum.
In April 2010 the Bank issued a floating rate senior bond in the amount of USD 500,000,000 in the United States. It has the following detail:
Bonds Series Amount Term Issue rate Issue date Maturity date144A USD 500,000,000 (**) 2 years LIBOR + 1.25% per annum 04/15/2010 04/20/2012Total USD 500,000,000
(**) Interest on the bonds will accrue at a floating rate per annum, reset quarterly, equal to the three-month U.S. Dollar London Interbank Offered Rate, orLIBOR, plus 1.25%. Interest on the bonds will be payable quarterly in arrears on each January 20, April 20, July 20 and October 20 each year, subject to the DayCount Convention, commencing on July 20, 2010.
b) On January 1, 2010 Mr. Claudio Melandri Hinojosa was appointed as the Bank’s General Manager. In addition, Mr. Juan Manuel Hoyos Martínez wasappointed as Alternate Bank Director, a position which had been vacant.
Commencing January 1, 2010 Mr. Oscar von Chrismar Carvajal will serve as Second Vice Chairman of the Board.
F-158

Table of Contents
BANCO SANTANDER CHILE AND SUBSIDIARIESNOTES TO THE CONSOLIDATED FINANCIAL STATEMENTS
AS OF DECEMBER 31, 2009, 2008 AND JANUARY 1, 2008 c) On February 27, 2010, an 8.8 magnitude earthquake struck central Chile. The earthquake epicenter was located 200 miles southwest of Santiago and 70 milesnorth of Concepción, Chile’s second largest city. Due to the severity of the earthquake and its devastating consequences, former President Michelle Bacheletdeclared a national “state of catastrophe” on February 28, 2010. Significant aftershocks followed the initial earthquake, including aftershocks of 6.2, 5.4 and 5.6magnitudes within an hour of the initial earthquake, aftershocks of 6.9, 6.7 and 6.0 magnitudes on March 11, 2010 and a 7.2 magnitude earthquake on March 13,2010. As a result of the earthquake, economic and banking activity in Chile could be affected in 2010, which could adversely affect our results of operations.
d) On March 25 and April 8, 2010, the Superintendency of Banks issued temporary regulations (applicable during March and April 2010) with the purpose ofprotecting the credit history of borrowers affected by the earthquake. Pursuant to these regulations, banks may report accounts in arrears as current to the extentsuch accounts were current as of February 27, 2010 and the bank determines that the borrower missed payments due to the recent earthquake. Additionally, thebank must either (i) be in the process of modifying the terms of the borrower’s loan, or (ii) have been unable to contact the borrower. In connection withmortgage loans in arrears, if the bank determines that a total loss is expected, the regulations allow the reporting of these mortgage loans to remain current untilinsurance proceeds are received. In connection with a partial loss on such loans, the bank must consider financing the borrower’s insurance deductible paymentson the same terms as the mortgage loan’s principal. In connection with restructurings of loans to borrowers from affected areas in March and April, theregulations allow banks not to report the modified loans as restructured for purposes of classification, allowances and interest accrual, provided that the loanswere current as of February 27, 2010, the date of the earthquake. Following the termination of these temporary regulations on April 30, 2010, the Bank willreclassify all accounts and loans affected by these regulations according to normal reporting regulations.
e) On April 30, 2010, Banco Santander Chile sold 5 branches to Inmobiliaria Descubrimiento S.A., the price sale was Ch$ 11,546 million, whose book value atthe time of the transaction amounted Ch$ 4,927 million, generating an income of Ch$ 6,619 million.
f) Between January 1, 2010 and the date on which these financial statements were issued (June 21, 2010), no other events have occurred which couldsignificantly affect their interpretation.
FELIPE CONTRERAS FAJARDOAccounting Manager
CLAUDIO MELANDRI HINOJOSAChief Executive Officer
F-159

Table of Contents

Exhibit 12.1
CHIEF EXECUTIVE OFFICER SECTION 302 CERTIFICATION
I, Claudio Melandri, certify that:
1. I have reviewed this annual report on Form 20-F of Banco Santander-Chile;
2. Based on my knowledge, this report does not contain any untrue statement of a material fact or omit to state a material fact necessary to make the statementsmade, in light of the circumstances under which such statements were made, not misleading with respect to the period covered by this report;
3. Based on my knowledge, the financial statements, and other financial information included in this report, fairly present in all material respects the financialcondition, results of operations and cash flows of the company as of, and for, the periods presented in this report;
4. The company’s other certifying officer(s) and I are responsible for establishing and maintaining disclosure controls and procedures (as defined in ExchangeAct Rules 13a-15(e) and 15d-15(e)) and internal control over financial reporting (as defined in Exchange Act Rules 13a-15(f) and 15d-15(f)) for thecompany and have:
a) Designed such disclosure controls and procedures, or caused such disclosure controls and procedures to be designed under our supervision, to ensurethat material information relating to the company, including its consolidated subsidiaries, is made known to us by others within those entities,particularly during the period in which this report is being prepared;
b) Designed such internal control over financial reporting, or caused such internal control over financial reporting to be designed under our supervision,to provide reasonable assurance regarding the reliability of financial reporting and the preparation of financial statements for external purposes inaccordance with generally accepted accounting principles;
c) Evaluated the effectiveness of the company’s disclosure controls and procedures and presented in this report our conclusions about the effectiveness ofthe disclosure controls and procedures, as of the end of the period covered by this report based on such evaluation; and
d) Disclosed in this report any change in the company’s internal control over financial reporting that occurred during the period covered by the annualreport that has materially affected, or is reasonably likely to materially affect, the company’s internal control over financial reporting; and
5. The company’s other certifying officer(s) and I have disclosed, based on our most recent evaluation of internal control over financial reporting, to thecompany’s auditors and the audit committee of the company’s board of directors (or persons performing the equivalent functions):
a) All significant deficiencies and material weaknesses in the design or operation of internal control over financial reporting which are reasonably likelyto adversely affect the company’s ability to record, process, summarize and report financial information; and
b) Any fraud, whether or not material, that involves management or other employees who have a significant role in the company’s internal control overfinancial reporting.
Date: June 30, 2010
/s/ Claudio Melandri Name: Claudio Melandri Title: Chief Executive Officer

Exhibit 12.2
CHIEF FINANCIAL OFFICER SECTION 302 CERTIFICATION
I, Gabriel Montoya, certify that:
1. I have reviewed this annual report on Form 20-F of Banco Santander-Chile;
2. Based on my knowledge, this report does not contain any untrue statement of a material fact or omit to state a material fact necessary to make the statementsmade, in light of the circumstances under which such statements were made, not misleading with respect to the period covered by this report;
3. Based on my knowledge, the financial statements, and other financial information included in this report, fairly present in all material respects the financialcondition, results of operations and cash flows of the company as of, and for, the periods presented in this report;
4. The company’s other certifying officer(s) and I are responsible for establishing and maintaining disclosure controls and procedures (as defined in ExchangeAct Rules 13a-15(e) and 15d-15(e)) and internal control over financial reporting (as defined in Exchange Act Rules 13a-15(f) and 15d-15(f)) for thecompany and have:
a) Designed such disclosure controls and procedures, or caused such disclosure controls and procedures to be designed under our supervision, to ensurethat material information relating to the company, including its consolidated subsidiaries, is made known to us by others within those entities,particularly during the period in which this report is being prepared;
b) Designed such internal control over financial reporting, or caused such internal control over financial reporting to be designed under our supervision,to provide reasonable assurance regarding the reliability of financial reporting and the preparation of financial statements for external purposes inaccordance with generally accepted accounting principles;
c) Evaluated the effectiveness of the company’s disclosure controls and procedures and presented in this report our conclusions about the effectiveness ofthe disclosure controls and procedures, as of the end of the period covered by this report based on such evaluation; and
d) Disclosed in this report any change in the company’s internal control over financial reporting that occurred during the period covered by the annualreport that has materially affected, or is reasonably likely to materially affect, the company’s internal control over financial reporting; and
5. The company’s other certifying officer(s) and I have disclosed, based on our most recent evaluation of internal control over financial reporting, to thecompany’s auditors and the audit committee of the company’s board of directors (or persons performing the equivalent functions):
a) All significant deficiencies and material weaknesses in the design or operation of internal control over financial reporting which are reasonably likelyto adversely affect the company’s ability to record, process, summarize and report financial information; and
b) Any fraud, whether or not material, that involves management or other employees who have a significant role in the company’s internal control overfinancial reporting.
Date: June 30, 2010
/s/ Gabriel Montoya Name: Gabriel Montoya Title: Chief Financial Officer

Exhibit 13.1
Section 906 Certification
The certification set forth below is being submitted in connection with the Annual Report on Form 20-F for the year ended December 31, 2009(the“Report”) for the purpose of complying with Rule 13a-14(b) or Rule 15d-14(b) of the Securities Exchange Act of 1934 (the “Exchange Act”) and Section1350 of Chapter 63 of Title 18 of the United States Code.
Claudio Melandri, the Chief Executive Officer and Gabriel Montoya, the Chief Financial Officer of Banco Santander-Chile, each certifies that, to the best ofhis knowledge:
1. the Report fully complies with the requirements of Section 13(a) or 15(d) of the Exchange Act; and
2. the information contained in the Report fairly presents, in all material respects, the financial condition and results of operations of BancoSantander-Chile.
Date: June 30, 2010
By: /s/ Claudio Melandri Name: Claudio Melandri Chief Executive Officer
By: /s/ Gabriel Montoya Name: Gabriel Montoya Chief Financial Officer