cranfield university andrew johnston the analysis of
TRANSCRIPT
CRANFIELD UNIVERSITY
ANDREW JOHNSTON
THE ANALYSIS OF LATENT FINGERMARK CHEMISTRY USING
FOURIER-TRANSFORM INFRARED SPECTROSCOPY
CRANFIELD DEFENCE AND SECURITY
PhD
Academic Year: 2017- 2018
Supervisor: Professor Keith Rogers
January 2018


CRANFIELD UNIVERSITY
CRANFIELD DEFENCE AND SECURITY
PhD Thesis
Academic Year 2017 - 2018
ANDREW JOHNSTON
THE ANALYSIS OF LATENT FINGERMARK CHEMISTRY USING
FOURIER-TRANSFORM INFRARED SPECTROSCOPY
Supervisor: Professor Keith Rogers
January 2018
© Cranfield University 2018. All rights reserved. No part of this
publication may be reproduced without the written permission of the
copyright owner.


i
ABSTRACT
Latent fingermarks are comprised of a complex mixture of organic and inorganic
components that exhibit broad chemical variability. Fingermarks are dynamic
compositions prone to degradation over time and in varying environmental
conditions. The complexity of latent fingermark chemistry has led to an
abundance of literature over a number of years utilising various analytical
techniques, which have endeavoured to provide a greater understanding of these
complex chemical systems. In particular, a key focus has been on fingermark
decomposition, and with recent advances in analytical instrumentation a more in-
depth understanding of the dynamics of fingermark chemistry has been achieved,
yet despite this, there remain significant gaps in the literature.
The work presented within this thesis looks at various aspects of latent fingermark
chemistry that aim to address these gaps. During this research, the capabilities
and limitations of Fourier-Transform Infrared (FTIR) spectromicroscopy were
compared to the more established analytical technique of gas chromatography-
mass spectrometry for the analysis of latent fingermarks. A novel approach to
analysing the changes in latent fingermark chemistry over time at various
moderate temperatures was demonstrated. An investigation into the
intermolecular interactions of lipid components within simplified analogue
‘fingermark’ solutions was conducted, and the implications of these interactions
for natural fingermark chemistry considered. Finally, the temporal degradation of
illicit substances in latent fingermarks using spectroscopic imaging was
investigated.
The results of this study, structured in the form of four research papers,
demonstrate the complexity of latent fingermark composition, variability, and
analysis. The use of FTIR spectromicroscopy to study in-situ, real-time changes
in fingermark chemistry subjected to varying temperatures showed that total
composition is affected by temperatures above 55oC, and oxidation mechanisms
take place almost immediately after deposition, even at room temperature. The
use of simplified analogue ‘fingermark’ solutions to study intermolecular

ii
interactions within natural fingermarks identified two key components, squalene
and cholesterol, that potentially affect downstream organic interactions post-
deposition. Finally, spectroscopic imaging successfully identified and spatially
mapped aged illicit substances present within latent fingermarks up to thirty days’
post-deposition. It was also possible to quantify the degradation of those illicit
compounds over time. Due to the different facets of this research, the results of
this thesis are expected to have an impact on a broad range of disciplines both
within academia and for more practical forensic applications.
Keywords
Latent fingermark, FTIR spectroscopy, degradation, oxidation, contaminants,
decomposition, aging, imaging, detection

iii
ACKNOWLEDGEMENTS
First and foremost, I would like to express my immense gratitude to my supervisor
Professor Keith Rogers. A step into the unknown for both of us, I am hugely
thankful for your guidance, advice and patience over the last 5 years, especially
given your feelings towards biochemists, it must be of some comfort to know you’ll
never need to hear the phrase “oxidation processes” ever again.
I would like to thank my thesis committee, Professor David Lane, and Dr Matthew
Healy for their guidance and suggestions throughout this project, and generally
keeping me on my toes.
I would also like to thank my support team Dr Charlene Greenwood and Dr Danae
Prokopiou, and not just because they threatened me if I didn’t. Your advice and
input, sometimes verging on abusive (Greenwood), has made this document far
stronger and more coherent, and I thank you for that. I must also thank Adrian
Mustey for catering for the endless last minute requests, frustrations and
outbursts, “by hook or by crook…”
I would like to thank Falcon Communications and Gwyn Winfield for putting me
on this path initially and for funding the majority of the work.
Finally, I would like to thank my wife, Regie, for your patience, understanding,
encouragement and endless cups of tea. I couldn’t have kept going without your
support, and I assure you the lawn will now be cut far more often, and I’ll start
learning Russian, as promised… 4 years ago.

iv
TABLE OF CONTENTS
ABSTRACT ......................................................................................................... i
ACKNOWLEDGEMENTS................................................................................... iii
LIST OF FIGURES ............................................................................................ vii
LIST OF TABLES ............................................................................................... x
LIST OF ABBREVIATIONS ................................................................................ xi
CHAPTER 1. THESIS STRUCTURE .............................................................. 1
CHAPTER 2. INTRODUCTION ....................................................................... 4
2.1 The chemical components of latent fingermarks ....................................... 6
2.1.1 Sebaceous secretions ........................................................................ 7
2.1.2 Eccrine secretions ............................................................................ 11
2.1.3 Squames .......................................................................................... 12
2.1.4 Typical contents of a latent fingermark ............................................. 13
2.2 Variations in latent fingermark chemistry ................................................ 15
2.3 Destructive and non-destructive analytical techniques for latent
fingermark analysis ....................................................................................... 18
2.3.1 Destructive analysis ......................................................................... 18
2.3.2 Non-destructive analysis .................................................................. 24
2.4 The principles of Fourier Transform Infrared spectroscopy ..................... 30
2.4.1 Overview .......................................................................................... 30
2.4.2 Mid-range IR and fundamental vibrations ......................................... 32
2.4.3 FTIR Quantitative analysis ............................................................... 34
2.5 FTIR spectra of latent fingermarks .......................................................... 35
2.5.1 Sebum .............................................................................................. 35
2.5.2 Sweat ............................................................................................... 36
2.5.3 Peptides and proteins ....................................................................... 36
2.6 Chemical mapping .................................................................................. 38
2.7 References ............................................................................................. 40
CHAPTER 3. AIMS AND OBJECTIVES ........................................................ 48

v
CHAPTER 4. PAPER ONE ........................................................................... 50
The chemical analysis of latent fingermarks: Capabilities and limitations of
FTIR spectroscopy, a GCMS comparison ..................................................... 50
4.1 Abstract ................................................................................................... 50
4.2 Introduction ............................................................................................. 51
4.3 Materials and Methods ............................................................................ 53
4.3.1 Fingermark preparation - FTIR ......................................................... 53
4.3.2 FTIR Microscopy .............................................................................. 53
4.3.3 Fingermark preparation – GC-MS .................................................... 54
4.3.4 GC-MS analysis ............................................................................... 54
4.3.5 Reagents .......................................................................................... 55
4.4 Results and Discussion ........................................................................... 56
4.4.1 FTIR - Chemical Mapping ................................................................ 56
4.4.2 FTIR - Relative quantification ........................................................... 57
4.4.3 GC-MS ............................................................................................. 61
4.4.4 Relative Quantification ..................................................................... 62
4.5 Conclusion .............................................................................................. 68
4.6 References ............................................................................................. 69
CHAPTER 5. PAPER TWO ........................................................................... 74
The effect of moderate temperatures on latent fingerprint chemistry ............ 74
5.1 Abstract ................................................................................................... 74
5.2 Introduction ............................................................................................. 75
5.3 Experimental ........................................................................................... 78
5.3.1 Sample Preparation.......................................................................... 78
5.3.2 Heating of fingerprints ...................................................................... 78
5.3.3 FTIR Microspectroscopy .................................................................. 78
5.3.4 Pure sample preparation .................................................................. 79
5.4 Results and Discussion ........................................................................... 80
5.4.1 Thermally degraded fingerprints ....................................................... 81
5.4.2 Pure compounds .............................................................................. 85
5.5 Conclusions ............................................................................................ 88
5.6 References ............................................................................................. 89

vi
CHAPTER 6. PAPER THREE ....................................................................... 93
A study of the intermolecular interactions of lipid components from
analogue fingermark residues. ...................................................................... 93
6.1 Abstract ................................................................................................... 93
6.2 Introduction ............................................................................................. 94
6.3 Experimental ........................................................................................... 98
6.3.1 Sample preparation .......................................................................... 98
6.3.2 FTIR Microspectroscopy ................................................................ 100
6.4 Results and Discussion ......................................................................... 101
6.4.1 Analogue samples .......................................................................... 102
6.5 Conclusions .......................................................................................... 109
6.6 References ........................................................................................... 110
CHAPTER 7. PAPER FOUR ....................................................................... 116
The temporal degradation of illicit contaminants in latent fingermarks using
Fourier transform infrared spectroscopic imaging ....................................... 116
7.1 Abstract ................................................................................................. 116
7.2 Introduction ........................................................................................... 118
7.3 Experimental ......................................................................................... 121
7.3.1 Analysis of fingermarks .................................................................. 121
7.4 Results and Discussion ......................................................................... 123
7.4.1 Obtaining spectra and chemical maps ........................................... 123
7.4.2 Aged sample analysis using spectroscopic imaging ...................... 127
7.5 Conclusion ............................................................................................ 131
7.6 Reference ............................................................................................. 133
CHAPTER 8. DISCUSSION ........................................................................ 139
8.1 Implications and impact ........................................................................ 139
8.2 References ........................................................................................... 152
CHAPTER 9. CONCLUSIONS AND RECOMMENDATIONS FOR
FUTURE WORK ............................................................................................. 158
9.1 Research conclusions ........................................................................... 158
9.2 Contribution to knowledge .................................................................... 164
9.3 Future Recommendations ..................................................................... 166
Appendix A : Full spectral and graphical data from paper 2 ........................ 169
Appendix B : Publications ........................................................................... 176

vii
LIST OF FIGURES
Figure 1: Location of eccrine and sebaceous glands within human skin anatomy .................................................................................................................... 6
Figure 2: The formation of a wax ester (cetyl oleate) from a fatty acid (oleic acid) and a fatty alcohol (cetyl alcohol) ................................................................ 9
Figure 3: The formation of a cholesterol esters ................................................ 10
Figure 4: Free fatty acid (Oleic acid) in higher concentrations in children (pre-pubescent) ................................................................................................. 16
Figure 5: Fatty acid ester (Oleic acid ethyl ester) in higher concentrations in adults .................................................................................................................. 16
Figure 6: Typical mass spectrum of a latent fingermark ................................... 19
Figure 7: Typical FTIR spectrum of a latent fingermark .................................... 26
Figure 8: “Ball and spring model” - requirements for a molecule to be IR active .................................................................................................................. 31
Figure 9: IR spectrum of carbon dioxide ........................................................... 31
Figure 10: Potential energy curve of an anharmonic oscillator ......................... 33
Figure 11: IR spectrum of sebum deposit ......................................................... 35
Figure 12: IR spectrum of sweat deposit. ......................................................... 36
Figure 13: IR spectrum of a skin cell ................................................................ 36
Figure 14: Typical fingermark containing sebum, sweat, and protein ............... 37
Figure 15: A fingermark image from a light microscope, and the corresponding chemimaps showing the average absorbance of that latent fingermark, and the distribution of carboxylic acid groups. .................................................. 38
Figure 16: Chemimap images of the variations in sebum deposits between two latent fingermarks from the same individual. ............................................. 57
Figure 17: A typical FTIR spectrum of a latent fingermark. .............................. 57
Figure 18: Relationship between the antisymmetric & symmetric C-H stretch of CH2 groups (2924 – 2840 cm-1) and the carbonyl stretch band (1740 cm-1) of a latent fingermark ..................................................................................... 59
Figure 19: Relationship between the antisymmetric & symmetric C-H stretch of CH2 groups (2924 – 2840 cm-1) and the CH3 bend (1464 cm-1) ................ 59

viii
Figure 20: Relationship between the antisymmetric & symmetric C-H stretch of CH2 groups (2900cm-1 - 2840 cm-1) and the C-C-O stretch band (1246 cm-1) .................................................................................................................. 60
Figure 21: A typical mass spectrum of a latent fingermark ............................... 61
Figure 22: A boxplot diagram of the seven most abundant compounds found in the twenty latent fingermarks from this study ............................................. 63
Figure 23: A mass spectrum of a fingermark containing the synthetic oil isopropyl myristate. ................................................................................................... 64
Figure 24: Fourier transform infrared spectrum of a fresh fingermark from study subject ....................................................................................................... 80
Figure 25: Absorbance spectra of latent fingerprints as a function of time and temperature 75oC, 55oC, and 25oC. ........................................................... 81
Figure 26: Changes in IR absorbance of key functional groups over time at 75oC, 55oC, and 25oC .......................................................................................... 82
Figure 27: Rate of change of the C-H stretch band absorbance at 75oC, 65oC, 55oC, 45oC, 35oC, and 25oC ...................................................................... 83
Figure 28: Infrared spectra of the 3250 cm-1 OH-stretch band of pure squalene heated to 75oC for 5 hr .............................................................................. 85
Figure 29: The increase in OH absorbance of SQ, mixed triglycerides, myristyl myristate, serine, palmitic acid, and linoleic acid at 75oC over 5h ............. 86
Figure 30: Coupling effect of the antisymmetric and symmetric C-H stretch of CH2 group ......................................................................................................... 96
Figure 31: Typical FTIR Spectrum of a fresh fingermark ................................ 101
Figure 32: FTIR spectral comparison between the analogue sample and a natural fingermark. ............................................................................................... 102
Figure 33: The antisymmetric and symmetric C-H stretch modes of CH2 groups for analogue samples with the wax ester removed, and with the fatty acid removed. .................................................................................................. 104
Figure 34: The antisymmetric and symmetric C-H stretch modes of CH2 groups for a ‘complete’ analogue sample, with squalene removed, and with cholesterol removed ................................................................................ 105
Figure 35: Average absorbance of C-H stretching modes at 2780 - 2995 cm-1 of analogue samples and natural fingermarks. ............................................ 106
Figure 36: Suggested interaction pathway of lipid compounds within a latent fingermark. ............................................................................................... 107

ix
Figure 37: Averaged control spectra from five deposits of each of the contaminants; ammonium nitrate (AN), sodium chlorate (SC), and cocaine (C) on day 0 and day 30. ......................................................................... 123
Figure 38: Averaged spectra of the uncontaminated latent fingermark at day 0 and day 30 ............................................................................................... 124
Figure 39: Change in absorbance of the C-H stretching modes of CH2 groups of the control fingermark (uncontaminated) over 30 days ............................ 125
Figure 40: Visible image and corresponding chemimap of a latent fingermark contaminated with ammonium nitrate particles ........................................ 125
Figure 41: Chemimap and spectra of AN in a latent fingermark.. ................... 126
Figure 42: Chemimap comparison of ammonium nitrate and cocaine on day 0 and day 30 ............................................................................................... 127
Figure 43: Changes in absorbance of AN over 30 days, focusing on absorbance bands at 1628, 1044, 828 cm-1 ................................................................ 128
Figure 44: Changes in average absorbance over a 30-day period of ammonium nitrate, sodium chlorate and cocaine ....................................................... 129
Figure 45: The development of papers from academic research to practical forensic relevance ................................................................................... 139
Figure 46: Proposed molecular interaction pathway of key fingermark components post-deposition .................................................................... 142
Figure 47: Evidence of oxidation processes taking place over the first 5 hours post-deposition of a latent fingermark ...................................................... 145
Figure 48: The detection of ammonium nitrate in a latent fingermark ............. 147
Figure 49: Thermo Fisher Scientific portable FTIR explosives/narcotics detector ................................................................................................................ 149

x
LIST OF TABLES
Table 1: Thesis structure .................................................................................... 3
Table 2: A summarised composition of sebaceous secretions ........................... 8
Table 3: Components of adult latent fingermarks ............................................. 14
Table 4: Changes in sebum concentration with age ......................................... 15
Table 5: Average percentage quantities of the seven most consistently detected lipids as compared to chlorononane (CN).................................................. 62
Table 6: The compounds and concentrations selected to create the analogue ‘fingermark’ composition ............................................................................ 99
Table 7: The composition of the eight analogue ‘fingermark’ samples ............. 99
Table 8: The three absorbance bands selected for analysis from the contaminants and the latent fingermarks over the duration of the experiment ............... 122

xi
LIST OF ABBREVIATIONS
AN
ATR
C
CHCA
CN
CSI
ESI-MS
FA
FTIR
GC-MS
IED
IFRG
IMS
MALDI
MCT
MS
NIST
PETN
R&D
RDX
SALDI
SC
SERS
SOCO
SOP
SQ
TNB
TNT
TOF
TRL
Ammonium Nitrate
Attenuated Total Reflectance
Cocaine
α-cyano-4-hydroxycinnamic acid
Chlorononane
Crime Scene Investigation
Electronspray Ionisation-Mass spectrometry
Fatty Acid
Fourier Transform Infrared Spectroscopy
Gas Chromatography-Mass Spectrometry
Improvised Explosive Device
International Fingerprint Research Group
Ion Mobility Spectroscopy
Matrix Assisted Laser Desorption/Ionization
Mercury Cadmium Telluride
Mass Spectrometry
National Institute of Standards and Technology
Pentaerythritol Tetranitrate
Research & Development
Research Development Explosive/ Cyclotrimethylenetrinitramine
Surface Assisted laser desorption/Ionisation
Sodium Chlorate
Surface Enhanced Raman Spectroscopy
Scenes of Crime Officer
Standard Operating Procedure
Squalene
Trinitrobenzene
Trinitrotoluene
Time of Flight
Technology Readiness Level


1
CHAPTER 1. THESIS STRUCTURE
The thesis is organised in the research paper format. Each core chapter is
arranged in the form of a journal article, two of which have been published in peer
reviewed journals, and two are currently under review. Table 1 demonstrates the
structure of the thesis in detail. The reason for adopting this approach rather than
a more traditional, monographic PhD thesis is that the author deemed this
structure more suitable given the independent nature of each objective. Each
objective demonstrated original research the author felt worthy of publication, but
when combined these papers provide a broad and comprehensive overview of
the capabilities of FTIR spectroscopy as an analytical tool for the analysis of latent
fingermarks. The author also felt that, with the increased pressure on all
academics to publish, the value of this style of thesis as a learning tool for the
preparation and submission of peer reviewed papers would be of greater long-
term benefit to both the individual and the university. This style of thesis is
therefore likely to become more common in the future because of this.
The objective of the first paper was to demonstrate the capabilities of FTIR
spectroscopy when compared to GC-MS, the predominant analytical technique
for the analysis of latent fingermarks. This paper looks at the capabilities and
limitations of FTIR spectroscopy through experimentation and comparison with
data obtained from GC-MS analysis. Paper 1 identifies previously unreported
observations regarding the relationship between functional groups, and presents
results, such as intra-variability within latent fingermarks, which confirms data
from previous studies. Paper 1 laid the foundations for all subsequent papers in
this thesis.
Paper 2 investigates the effect of moderate temperature variations on latent
fingermark chemistry. A previously neglected area of research within fingermark
analysis, this paper demonstrates the ability of FTIR spectromicroscopy to
analyse a latent fingermark as a system, and the impact of moderate
temperatures on that system in real time.

2
Paper 3 again demonstrates the versatility of FTIR spectroscopy by looking at
simplified analogue solutions of latent fingermarks. This paper aims to better
understand the intermolecular interactions that take place within these simplified
solutions and their potential implications for natural fingermark chemistry.
Paper 4 investigates the temporal degradation of exogenous particulate within
latent fingermarks, another issue yet to be answered in the literature. This paper
focused on spectroscopic imaging to map a fingermark region and identify illicit
compounds as they age and interact with the degrading endogenous
components.

3
Table 1: Thesis structure
Each paper contains related literature, methodology, results and discussion of
key findings. Although each paper is free standing, in the sense that they each
investigate different facets of latent fingermark chemistry, they are all related to
an overarching theme of the applications of FTIR spectroscopy for the analysis
of latent fingermarks. Thus, the thesis can be viewed as a combined contribution
from a collection of the four papers.
Chapter Paper Objective Title Journal Status
4 1 1, 2, 3, 4
The Chemical Analysis of
Latent Fingermarks:
Capabilities and
Limitations of FTIR
Spectroscopy, a GCMS
Comparison
- -
5 2 2 The effect of moderate
temperatures on latent
fingerprint chemistry
Applied Spectroscopy
Applied
Spectroscopy,
71 (9) (2017),
2102-2110
6 3 3
A study of the intermolecular
interactions of lipid
components from analogue
fingermark residues.
Science and Justice
Science and
Justice, 58 (2)
(2018) 121-127
7 4 4
The temporal degradation
of illicit contaminants in
latent fingermarks using
Fourier transform infrared
spectroscopic imaging
Forensic Science
International Under review
8, 9 Discussion, conclusions
and contribution to
knowledge
This section will link
the results from the
different papers to
deliver a coherent
body of work

4
CHAPTER 2. INTRODUCTION
Outline
This chapter provides an essential background to the subject area that will be
expanded upon in the papers presented in the main body of work. An overview
of latent fingermark chemistry and variability is outlined, as well as a summary of
the current analytical techniques used for the investigation of fingermarks. Finally,
a more detailed review of the use of FTIR spectroscopy for the analysis of latent
fingermarks is provided.
Analysis of the unique patterns that make up an individual's fingermarks is
arguably the oldest form of forensic investigation on record, with references
dating back to China 200 BC. Following the fingerprint revolution of 19th century,
the London Metropolitan Police were the first institution to officially use
fingermarks for the purposes of forensic investigations in 1901. Today, the use of
fingermark ridge patterns to identify individuals remains an invaluable tool for law
enforcement agencies and even outperforms DNA in its specificity, no two
fingermarks have ever been found alike in the many billions of human and
automated computer comparisons conducted around the world, which cannot be
said for DNA.
The molecular composition of latent fingermarks, however, is a relatively
emerging area of forensic science due to their immense complexity, with
numerous factors affecting their chemical behaviour. There are significant
challenges, therefore, in utilising fingermark chemistry for forensic science
applications. For example, fingermark chemistry exhibits significant intra- (from
the same individual), and inter-variability (between individuals), and they are
highly susceptible to changes over time [1]. Latent fingermarks are also affected
by endocrine factors [2], as well as variations in environmental conditions.

5
Interest in fingermark chemistry has intensified over the last decade primarily due
to advances in analytical instrumentation, but despite this increase in research
an in-depth understanding is yet to be achieved [3].
One analytical technique utilised within this field is Fourier Transform Infrared
(FTIR) spectroscopy and spectromicroscopy. FTIR analysis is fast, requires no,
or minimal sample preparation and, perhaps most importantly from a forensic
science perspective, is non-destructive. Yet, although FTIR spectroscopy has
many attributes that are appealing to the forensic community, it is yet to become
an established tool within forensic investigations.
Gas chromatography-mass spectrometry (GC-MS) remains the gold standard for
the chemical analysis of latent fingermarks. GC-MS (or MS derivatives) have
been used for the majority of investigations into fingermark composition and
aging, providing detailed, quantifiable analysis of the components present within
latent fingermarks.
Both FTIR spectroscopy and MS analysis can offer unique insight into the
composition of latent fingermarks and could arguably be considered
complementary techniques for such analysis. A greater appreciation of the
capabilities and limitations of FTIR spectroscopy, however, would allow for a
more in-depth understanding of the complex and dynamic nature of latent
fingermarks.
This document will demonstrate the applications of FTIR spectromicroscopy as a
rapid, non-destructive tool for the analysis of latent fingermark chemistry. The
ability of spectral imaging to identify, and spatially map aged illicit substances
within latent fingermarks will also be demonstrated, a capability which could be
of immediate use to the forensic community.

6
2.1 The chemical components of latent fingermarks
The chemical composition of latent fingermarks is both intricate and varied. A
fingermark is a complex composition of hundreds of compounds secreted from
primarily sebaceous and eccrine glands located within the dermis of the skin
(figure 1).
Figure 1: Location of eccrine and sebaceous glands within human skin anatomy
[Google images ©]
(N.B. Apocrine glands are another class of secretory gland but are typically
ignored when considering the chemical make-up of latent fingermarks. This is in
part due to their locations on the body, primarily found under the arms and around
the genitalia, but also due to their secretions being affected by eccrine and
sebaceous gland contamination [4])
Sebaceous deposits found in latent fingermarks are not secreted at the fingertips,
however, but deposited onto them through contact with other parts of the body,
such as the face and neck, known as grooming behaviour. This means that the
concentrations of certain constituents within a fingermark can vary significantly
from one individual to the next. To add further complexity latent fingermark
chemistry is not static, components undergo decomposition through oxidation
and bacterial degradation almost immediately after deposition, known as
fingermark aging.
The study of fingermark aging is arguably the dominant area of research within
the field. The ability to establish the time since deposition of a latent fingermark,
through its state of degradation, would have significant implications for crime

7
scene investigators when looking to potentially rule a suspect in or out of an
investigation. Yet fingermark degradation is still a very active area of research as
a reliable model to establish time since deposition is far from being universally
accepted.
Various studies, spanning back decades, have looked to establish the contents
of fresh latent fingermarks. This in itself has been a challenge given the detection
limits of various analytical techniques, although much of the influential work into
the composition of latent fingermarks has almost exclusively utilised GC-MS until
more recently [1, 4-8]. Mass spectrometry remains the principle technique for the
analysis of fingermark composition, and with the addition of soft ionisation
techniques, such as Matrix Assisted Laser Desorption/Ionisation (MALDI), MS
continues to identify previously unreported components.
Typically, a latent fingermark is comprised of three groups of components,
namely sebaceous, eccrine, and squames (skin cells).
2.1.1 Sebaceous secretions
Sebum is an oily, waxy substance secreted by the sebaceous glands, found
primarily at the base of hair follicles, its function being to waterproof and lubricate
the skin. The sebaceous glands are located throughout the body, except for the
palms of the hands and soles of the feet [9]. The density and distribution of these
glands are greatest around the face and scalp, where up to 800 glands per cm3
can be found [4]. Sebaceous glands are fully developed and functioning before
birth, most likely due to stimulation by maternal hormone signalling, however, at
birth, these glands become mostly inactive due to the withdrawal of this maternal
hormonal stimulus [10]. The glands remain inactive until stimulated by particular
androgenic hormones, in particular, testosterone and aldosterone, at puberty
[11]. Indeed, studies, where testosterone has been administered to children,
reported a significant increase in sebum demonstrating that endogenous
testosterone is essential for sebum production [12].

8
Sebum itself is produced by a holocrine mechanism, i.e., sebum-filled cells
rupture, disintegrate and empty their contents, via sebaceous ducts, onto the skin
surface [13].
As sebum production and secretion is under hormonal control, it varies
considerably in composition and consistency, but is generally composed of fatty
acids, wax esters, triglycerides, squalene - a steroid precursor, and cholesterol
(table 2) [4].
Table 2: A summarised composition of sebaceous secretions [4]
Sebum composition is not only subject to hormonal regulation however, and,
although the general composition of sebum is now accepted, various factors such
as diet, genetics and activity levels, can influence that composition between
individuals making sebum unique from person to person [14].
2.1.1.1 Fatty acids
The amount of free fatty acids in sebum varies considerably, an average
estimation being between 15-25% of total sebum composition [3]. These free fatty
acids are derived primarily from the hydrolysis of triglycerides and wax esters due
to oxidation and bacteriological processes [15]. It has been reported that free fatty
acids increase in concentration over the first 15 days post-deposition within a
latent fingermark, due to this hydrolysis of glycerides, wax esters and long chain
fatty acids [1], but at a particular concentration the pH drops and inhibits the
bacterial lipases, thus halting much of their production [13].

9
Changes in fatty acid concentration within fingermarks demonstrates a
fundamental issue with intra-variability, as it has been observed that fatty acid
content can change considerably over time within the same individual. One study
reported that certain fatty acids from the same donor taken once a week for seven
weeks showed significant variations in concentration [16]. The study also showed
a significant difference between male and female fatty acid composition, although
this has yet to be reliably demonstrated using large sample populations.
2.1.1.2 Wax esters
Wax esters, comprised of a fatty acid esterified with a fatty alcohol (figure 2),
contribute approximately 20 - 25% of adult skin surface lipids [4].
Figure 2: The formation of a wax ester (cetyl oleate) from a fatty acid (oleic acid)
and a fatty alcohol (cetyl alcohol)
It is reported that, of the wax ester fatty acids found in adults, ~27% are branched
chain fatty acids [4]. This is significant as there are very few branch chain fatty
acids found in children’s fingermarks, which have a different composition to that
of adults and are known to ‘disappear’ at crime scenes [8, 17-19]. It is reported
to be rare to find fully saturated straight chain fatty acid components in wax esters
secreted from adults, this is possibly due to their physical state at body
temperature, unsaturation or branching making it more likely that the wax ester
would be liquid at skin temperature [4].

10
2.1.1.3 Sterols
Sterols such as cholesterol are secreted from the sebaceous glands and make
up between 1-2% of sebum. These compounds are most likely incorporated into
sebum from circulatory body fluids (e.g., blood and plasma), and not synthesised
within the sebaceous glands themselves [20]. Once on the skin surface
bacteriological processes, typically staphylococci and propionibacteria, esterify
cholesterol with (primarily) sebum fatty acids (figure 3) [15]. It has also been
reported that sterols and sterol esters are higher in women than men, but, again,
this has yet to be sufficiently demonstrated in latent fingermarks to provide a
reliable test for sex discrimination. This may, however be due to the
decomposition of esters within the fingermarks soon after deposition.
Figure 3: The formation of a cholesterol esters
2.1.1.4 Squalene
Squalene is arguably the single most studied component within sebum regarding
fingermark chemistry due to its propensity to rapidly degrade and ease of
detection, making it an ideal candidate for modelling fingermark degradation and
aging. Squalene, a steroid precursor, makes up approximately 12% of sebum
secretions [4], and squalene production has been found to vary with sebaceous
gland size. Squalene production has also been shown to vary with age (chapter
2.2), squalene levels are known to be elevated in adolescents for example, and
even more so in acne patients, where squalene can constitute to up to 20% of
sebum content [21–23]. Variations such as these make squalene a possible
candidate for obtaining biometric information from an individual’s latent
fingermarks.

11
2.1.2 Eccrine secretions
The human skin contains between two and four million eccrine sweat glands
distributed throughout the body’s surface [24]. In typical individuals, these glands
are capable of secreting up to 4 L of fluid an hour. Eccrine glands are fully formed
at birth and are active immediately, their highest density being on the soles of the
feet and least abundant on the back [24]. Their tubular coiled structure (figure 1)
allows the gland to reabsorb essential solutes such as sodium, chloride,
bicarbonate, and glucose while allowing water to evaporate from the skin surface.
Sweat, secreted from these glands is predominantly made up of approximately
98% water, organic constituents such as proteins, lactic acid and various amino
acids, and inorganic salts as well as traces of urea.
2.1.2.1 Inorganic compounds
The presence of inorganic ions within eccrine sweat acts to reduce the vapour
pressure of the solution and therefore provides faster evaporation rates for
thermoregulation [25]. Although the rate of eccrine sweating is dependent on the
amount of water ingested it does not seem to effect sweat composition, and
therefore the ion concentrations in sweat remain relatively constant [26]. Sodium
is the most abundant ion present in sweat and can seemingly vary immensely
from 34 to 266 mEq/L between individuals [24].
2.1.2.2 Amino acids
At least eighteen amino acids have been identified within latent fingermarks, and
they are a significant focus of fingermark research. In particular, for the
development of visualization techniques, such as ninhydrin which reacts with the
amino acids and proteins present within fingermarks. The total amount of amino
acids in fingermarks varies from between 0.3 to 2.59 mg/L [27], and various
studies have found that serine, glycine, and alanine are the most abundant amino
acids within human sweat [28-30]. Amino acid concentrations can, however, vary
depending on the sample location on the body [29], and regarding latent
fingermarks will vary depending on the amount of grooming behaviour exhibited
by the individual.

12
2.1.2.3 Proteins
The protein content of eccrine secretions can vary from between 15 to 25 mg/dL,
and involves over 400 polypeptide components [4]. The majority of the peptides
in sweat are at the low end of the molecular weight range, but higher molecular
weight proteins have been reported to increase as the rate of sweating increases
[31]. The sensitivity of the analytical technique could, however, have a role to play
in the identification of these higher molecular weight proteins which are
notoriously difficult to detect.
2.1.2.4 Lipids
The detection of lipids in eccrine secretions presents a problem due to the ease
of contamination by sebaceous lipids. One study did demonstrate, however, the
presence of low concentrations (<0.1 µg/mL) of cholesterol and fatty acids [32].
2.1.2.5 Other constituents
Lactate and urea have been reported at significant levels in sweat (between 10-
40 mM) [33], as well trace amounts of creatine, creatinine, and glucose [34].
Various enzymes have also been detected in dissected sweat including acetyl
cholinesterase, acid phosphatase and monoamine oxidase [35]. These
compounds, however, have little impact on latent fingermark analysis due to their
low concentrations.
2.1.3 Squames
The body desquamates up to 40,000 skin cells each day [4] so the number of
skin cells within a latent fingermark can vary greatly. Their formation originates
within the epidermis (figure 1), the cells move from the underlying basal lamina,
known as basal cells, where they are still capable of division, through the prickle
and granular cell layers, to the outer stratum corneum where they are shed. As
these cells transition from one layer to the next the organelles within them
disappear, and the cells become flattened scales or squames, filled with densely
packed keratin and interconnecting collagen. These outer squames are naturally
shed from the stratum corneum (horny layer) of the epidermis, and it is these cells
that are observable in fingermarks.

13
2.1.4 Typical contents of a latent fingermark
Table 3 shows a comprehensive (although not exhaustive) list of the components
currently identified as present within latent fingermarks, and their associated
component group [3-6, 28, 30, 36-38].
Component Source
Amino acids
alanine Eccrine
serine Eccrine
proline Eccrine
valine Eccrine
cysteine Eccrine
leucine Eccrine
isoleucine Eccrine
asparagine Eccrine
aspartic acid Eccrine
glutamic acid Eccrine
glycine Eccrine
ornithine Eccrine
threonine Eccrine
histidine Eccrine
lycine Eccrine
phenylalanine Eccrine
tyrosine Eccrine
Fatty acids
decanoic acid Eccrine/sebaceous
tridecanoic acid Eccrine/sebaceous
13-aminotridecanoic acid Eccrine/sebaceous
palmitoleic acid Eccrine/sebaceous
oleamide Eccrine/sebaceous
Eicosanoic acid Eccrine/sebaceous
henicosoanoic acid Eccrine/sebaceous
docosanoic acid Eccrine/sebaceous
tetracosanoic acid Eccrine/sebaceous
hexacosanoic acid Eccrine/sebaceous
tetradecanoic acid Eccrine/sebaceous
oleic acid Eccrine/sebaceous
stearic acid Eccrine/sebaceous
dodecanoic acid Eccrine/sebaceous
pentadecanoic acid Eccrine/sebaceous
glutamic acid Eccrine/sebaceous
hexadecanoic acid Eccrine/sebaceous
cis-9-octadecanoic acid Eccrine/sebaceous
nonadecanoic acid Eccrine/sebaceous

14
Peptides
SSL-25 Eccrine
VPD-42 Eccrine
DCD-1L Eccrine
LEK-45 Eccrine
Inorganic Ions
chloride Eccrine
sodium Eccrine
potassium Eccrine
iron Eccrine
calcium Eccrine
bicarbonate Eccrine
sulphate Eccrine
phosphate Eccrine
flouride Eccrine
bromide Eccrine
iodide Eccrine
magnesium Eccrine
zinc Eccrine
copper Eccrine
cobalt Eccrine
lead Eccrine
manganese Eccrine
molybdenum Eccrine
tin Eccrine
mercury Eccrine
Others
cholesterol Sebaceous
squalene Sebaceous
urea Eccrine
glucose Eccrine
lactate Eccrine
pyruvate Eccrine
creatine Eccrine
creatinine Eccrine
glycogen Eccrine
uric acid Eccrine
glycerides (mono, di, and tri) Sebaceous
wax esters Sebaceous
cholesterol esters Sebaceous
Collagen Squames
Keratin Squames
Table 3: Components of adult latent fingermarks

15
2.2 Variations in latent fingermark chemistry
The composition of latent fingermarks from one individual can vary significantly
(intra-variability), as well as from different individuals (inter-variability). As
mentioned previously various factors can lead to both intra- and inter-variation in
fingermark composition. Age, diet, genetics, personal grooming habits, individual
metabolism and androgenic hormone levels in the blood, will all affect sebaceous
gland secretions. Eccrine secretions can be influenced by environmental
conditions, physical activity, and activity within the autonomic nervous system.
Variations in sebum composition have been shown to change depending on age,
(table 4), and, as alluded to previously, the effect of hormones on sebaceous
glands has a marked effect on sebum production. The rates of sebum excretion,
fatty acid concentrations, the ratio of wax esters to cholesterol, and cholesterol
esters are all found to change depending on hormonal influences [39]. In one
study the largest change in sebum production occurred between the ages of 12
and 13 in both males and females [40]. Some studies have shown that sebum
production continues to increase with age, peaking in the mid-thirties and then
begins to decline through middle age [41]. Although this is in contrast to other
research which showed no significant changes in sebum composition until old
age, most likely due to a reduction in hormonal stimulation of the sebaceous
glands [10, 42].
Table 4: Changes in sebum concentration with age [4]

16
There are more recognised detectable differences in fingermark composition
between adults and children [8, 18, 19, 43]. The composition of children’s
fingermarks has been studied to a greater extent, due to their reported tendency
to ‘disappear’ at crime scenes faster than that of adults, making lifting and
identification of these fingermarks more difficult. Pre-pubescent children’s latent
fingermarks have higher concentrations of volatile unesterified free fatty acids
(figure 4), while adult’s fingermarks contain less volatile fatty acid esters [18]
(figure 5). Children’s latent fingermarks also have fewer low volatility branched
fatty acids [19], and therefore vaporise more quickly. Other studies, however,
have suggested that certain children’s fingermarks can still be distinguished from
adults up to four weeks after deposition [18, 19] suggesting that even aged
fingermarks can be classified according to maturity.
Figure 4: Free fatty acid (Oleic acid) in higher concentrations in children (pre-
pubescent)
Figure 5: Fatty acid ester (Oleic acid ethyl ester) in higher concentrations in adults
Inter-variation due to gender has been indicated by the amino acid and lipid
content of latent fingermarks [7]. The average percentage of five key fatty acids
(palmitic acid, palmitoleic acid, oleic acid, myristic acid, pentadecanoic acid)
being higher in men than in women; this small study determined, however, that
no statistically significant gender variations were detected. It could be surmised
that men have higher concentrations of fatty acids in their fingermarks due to
higher levels of androgens (testosterone, androstenedione) in the bloodstream,
but this has yet to be conclusively proven.
Latent fingermarks not only vary between individuals or groups, but they also
exhibit changes over time, some examples of which have been touched on
previously. This complex system changes from an "initial composition" state to

17
an "aged composition" state. The change from initial to aged state is dependent
on factors that have been classified into five groups [3]: 1) donor characteristics,
2) deposition conditions, 3) substrate nature, 4) storage conditions, 5)
contaminations.
There are some key temporal changes in fingermark chemistry that are
consistently observed. The complex and dynamic nature of latent fingermarks
means that there is not merely a reduction in quantity of components as they age.
Squalene, for example, oxidises quickly (<15 days) to various hydroperoxides,
particularly in light conditions, to produce a number of short chain fatty acid by-
products. Another example being certain short-chain fatty acids (hexanoic,
octanoic, nonanoic acids), as mentioned previously, increase in concentration in
the early stages of aging and then decrease back to original levels after 15 days
[1]. This area of research is a critical aspect of fingermark chemistry and is
investigated in more detail in the papers section.

18
2.3 Destructive and non-destructive analytical techniques for
latent fingermark analysis
2.3.1 Destructive analysis
2.3.1.1 Gas Chromatography-Mass Spectrometry (GC-MS)
GC-MS has been one of the most utilised analytical techniques for the study of
latent fingermarks. The majority of research into fingermark composition,
variation, and aging, particularly when the research was in its infancy, was carried
out using GC-MS, due to its high sensitivity and specificity.
A separation (GC) and detection (MS) method, GC-MS is ideally suited for the
determination of volatile and semi-volatile organic compounds in complex
mixtures, such as in fingermarks. GC can separate many volatile and semi-
volatile organic components, but not always selectively detect them, whereas MS
can detect compounds but not always separate them. To achieve separation, the
sample is dissolved in an organic solvent, often dichloromethane (DCM), and,
through an injection port is injected into a mobile phase at an elevated
temperature. A carrier gas, usually helium, then carries the vapourised sample
through the stationary phase, typically a capillary column, at a particular flow rate,
2.40 mL/min for example. The analyte in the mobile phase interacts with the
stationary phase, each component of that analyte interacting at a different rate,
thus separation is achieved. Those compounds that interact the fastest, for
example, will exit, or elute, from the column first. As the carrier gas moves the
analyte through the column the temperature is increased in steps, or ‘ramped’,
typically up to 300oC, this increases the degree of separation.
As the analyte components elute from the GC column, they enter the mass
spectrometer and are bombarded by a stream of electrons, causing them to
ionise and fragment. The charged ions are then focused around a path by a
magnetic field through a slit into the detector which, using the radius of that
curved path, can identify the mass and relative abundance of that fragment, and
therefore provides a unique fingerprint for that compound. Once the entire sample
is analysed the resulting mass spectrum (figure 6) can be compared to a library
to identify the compounds present.

19
Figure 6: Typical chromatogram of a latent fingermark
Seminal work investigating latent fingermarks to identify the key components,
such as sebaceous and eccrine content [5, 6, 44, 45], changes in sebum
composition over time [1, 4, 6], and differences in children’s and adults’
fingermarks [19], were all investigated using GC-MS analysis, as well as
investigating the chemical composition of fingermarks for gender determination
[7]. GC-MS enables the quantification of specific fatty acids and lipids found in
low concentrations within fingermarks (figure 6), and the high sensitivity allows
for detailed analysis of intra-variability, changes in fingermark chemistry over
time, or under different environmental conditions.
One of the main shortcomings of this technique, however, is that it is limited in its
ability to analyse the entire contents of a fingermark. The technique depends on
the vapour pressure of a compound for detection, making large, low volatility
molecules difficult to detect. Various studies have shown that, although GC-MS
can consistently detect a broad range of lipids and amino acids, larger molecules
(>C28) such as long chain lipids and wax esters, cholesterol and myristyl
myristoleate for example, are less consistently detected [1, 5, 6, 17].
These larger compounds are sometimes only identifiable when at abnormally
high levels, such as in individuals with hyperlipidemia (high blood cholesterol).
Rela
tive A
bundance
Time (mins)
Ste
aric a
cid

20
This inconsistency in detection is due to a combination of factors; namely
volatility, the variability innate of latent fingermarks, and the low concentrations
of many of these compounds within eccrine and sebum deposits generally [4].
GC-MS is also unable to detect much of the higher molecular weight protein
content within latent fingermarks due to their large size and low vapour pressure.
Although protein content in fingermarks is not typically used for aging or variation
studies, there is some evidence that the quantity of protein in a fingermark can
be used for sex discrimination and possibly to differentiate children's fingermarks
from that of adults [55].
The requirement for sample destruction and the time-consuming nature of GC-
MS analysis has spurred a drive to investigate other more rapid, non-destructive
analytical techniques in recent years. GC-MS is likely to remain a critical
analytical tool however for the analysis of latent fingermarks by forensic
laboratories due to its established reliability, and due to operational requirements
(primarily for the detection of illicit substances). Even as a research tool, the
quantitative specificity and sensitivity of GC-MS for the detection of specific
compounds (such as fatty acids, squalene, and triglycerides) which are essential
for potentially aging an individual, or the fingermark, and its ability to detect
exogenous particulate within latent fingermarks, is unique. It is therefore likely
that any new technique will serve as an orthogonal technology or as an on-scene
presumptive test, to work alongside or more likely prior to laboratory-based GC-
MS analysis.

21
2.3.1.2 Surface assisted laser desorption/ionisation-time of flight-mass
spectrometry (SALDI-TOF-MS)
SALDI-TOF-MS is a variation of mass spectrometry (MS) originally designed for
the separation of large organic molecules, and as such has been used in a
number of latent fingermark studies. This soft ionisation technique (i.e. very little
fragmentation of the sample molecules) has the advantage of reducing sample
preparation compared to that of conventional GC-MS. The time saving of the
preparation stage, however, is sometimes lost in an extra incubation and sample
washing stage, which is not required in GC-MS analysis. Typically, latent
fingermark samples analysed via SALDI-MS require dusting with a specific
dusting powder, such as magnetic silica nanoparticles or magnetic dusting
powder, that not only enables location of the fingermark but then acts as a signal
enhancing agent for the technique. SALDI-TOF-MS has been shown to be highly
effective in the separation of both biological material, nitro-organic and peroxide
explosives, as well narcotics [46, 48, 49]. Modifications to the process using
magnetisable solid phase extraction nanoparticles that generate enhanced signal
intensity have shown capable of detecting certain fingermark constituents such
as trace amounts of amino acids, fatty acids and squalene [50]. The procedure is
cost effective and quick, with much-reduced sample preparation, background
interference, however, can swamp any characteristic peaks and it is currently
unclear why only certain amino acids are detected.

22
2.3.1.3 Matrix Assisted Laser Desorption/Ionisation-time of flight-mass
spectrometry (MALDI-TOF-MS)
MALDI-MS is again a variation of fundamental MS, and is often used in the study
of macro-molecules such as proteins, due to its sensitivity, lack of fragmentation,
and relative speed of preparation. Peak intensities, however, can be significantly
diminished when compared to SALDI-TOF-MS, and as with SALDI-TOF-MS, a
critical ‘make-or-break' step is the successful lifting of the fingermark from the
surface. Preparation for MALDI-TOF-MS analysis requires the sample placed on
a conductive surface and coated with a matrix, α-cyano-4-hydroxycinnamic acid
(CHCA) for example. This matrix absorbs a specific laser wavelength and
therefore ionises the analyte. The sample is then analysed using the mass
spectrometer, typically under pressure. The use of MALDI-TOF-MS in the
analysis of latent fingermarks has revealed the presence of a broad range of
lipids, fatty acids and previously unknown peptides [36]. MALDI-TOF-MS has
established the distribution of endogenous lipids in groomed and ungroomed
fingermarks, and demonstrated spatial maps showing ridge patterns, allowing for
specific compound identification and their location within the fingermark [51-53].
MALDI-TOF-MS has also been used for the detection and mapping of narcotic
particulates present within latent fingermarks [49]. This analytical technique is
currently receiving significant attention as the quantity of retrievable information
from a suspect’s fingermarks using this method is high [54]. MALDI-TOF-MS has
shown promise in identifying biometric information, particularly the sex of an
individual [55]. Combining MALDI-TOF-MS and multivariate modelling enabled
fast analysis of latent fingermarks to differentiate sex through specific peptide and
small protein composition with a validated prediction accuracy range from 67.5%
to 85%. It is believed that with refinement of the sample preparation methodology
this accuracy could be improved. MALDI-MS imaging and profiling (MALDI-
MSI/P) has recently been adopted by West Yorkshire Police, UK, for existing
police casework, and may be admissible evidence in UK courts ‘within months'
[56].

23
2.3.1.4 Electrospray ionisation mass spectrometry (ESI-MS)
ESI-MS is an alternative MS technique less frequently used for latent fingermark
analysis. ESI, another soft ionisation technique, is better suited to polar
molecules; many of which occur in the form of the lipid oxidation products
prevalent when fingermarks age. ESI-MS is limited in its ability to analysis
anything more than fatty acids and some lipids present in latent fingermarks,
though because of the lack of fragmentation, it can yield fine detail of the oxidation
products of these compounds. For example, the use of ESI-MS effectively
demonstrated the numerous oxidation products of squalene in aging fingermarks
[57]. This technique highlighted the impact of UV light on squalene degradation
and its oxidation products, which is consistent with previous findings involving the
rapid depletion of squalene in latent fingermarks in daylight [3, 5]. The use of this
soft ionisation technique showed that many of the squalene (and other fatty acid)
oxidation products are short-lived, and these intermediates are then rapidly
oxidised again to more stable compounds such as hydroperoxides. ESI-MS
analysis has demonstrated the dynamic complexity and chemical variation that
occurs within latent fingermarks as they degrade and may play a future role in
developing an accurate model for fingermark aging.

24
2.3.2 Non-destructive analysis
Mass spectrometry has played a pivotal role in the analysis of latent fingermarks
for over fifty years and remains the most commonly utilised technique within the
field. The major drawback of any form of MS technique, however, is the
preparation and analysis time, and most importantly the destruction of the
sample, preventing further forensic analysis. During the last decade, there has
been a concerted effort, driven by the requirements of the policing and security
communities, to develop a method of rapidly and non-destructively analysing
latent fingermarks. The ultimate aim being to analyse latent fingermarks in the
field, ideally in situ at the crime scene, or perhaps more likely in a mobile forensic
laboratory, to establish biometric information on the fingermark donor and/or to
identify any illicit compounds within the fingermark. Recent developments in the
accuracy and specificity of spectroscopic techniques such as Raman and in
particular FTIR spectroscopy have demonstrated the potential to meet these
requirements.
2.3.2.1 Raman Spectroscopy
Raman spectroscopy has been well established as a forensic tool since the
beginning of the century. It has been used for drug and explosive identification,
currency verification and for the verification and aging of works of art [58-60].
Raman spectroscopy has also been utilised in the biomedical industry to identify
specific protein and amino acid markers, for example in diabetic patients [61].
Raman spectroscopy is often considered a complementary technique to FTIR
due to their mutual exclusion of molecular symmetries from a molecule of interest.
That is to say, a vibrational mode that is inactive to IR will be active to Raman
(figure 8) and vice versa. Raman spectroscopy occurs when inelastic scattered
photons are collected and their energy differences translated into a wavenumber
indicative of the vibrating bonds within a molecule. Raman spectroscopy,
however, is not so commonly used in the analysis of latent fingermarks; despite
evidence that this spectroscopic technique can yield distinct benefits.
Fingermarks in moist or humid conditions, for example, or of eccrine specific
samples, are better suited to Raman spectroscopy. Surface-enhanced Raman

25
spectroscopy (SERS) is a technique where the sample is placed onto a
nanoscale roughened metal surface which provides enhanced intensity by
reducing Raman scattering. This reduced scattering significantly decreases the
background interference giving a much-enhanced signal that is not affected by
moisture as with FTIR. SERS has been shown to be capable of producing certain
chemical images of latent fingermarks, and identifying a broad range of amino
acids and other eccrine constituents [58]. Raman spectroscopy has also been
used in a limited capacity to detect illicit substances, primarily narcotics [60, 62]
and certain trace explosives in latent fingermarks [63].
One reason Raman spectroscopy has been of limited use for the analysis of latent
fingermarks is because Raman is less specific in identifying sebaceous
secretions when compared to FTIR spectroscopy. As mentioned previously,
sebaceous compounds are critical in the aging of fingermarks, and current
research into the use of latent fingermarks as biomarkers is almost exclusively
concerned with the lipids predominantly produced by sebaceous secretions.
Another issue with Raman spectroscopy is the limited ability to chemically image
fingermark samples; yet this has been established in (particularly mid-range)
FTIR analysis for a number of years.

26
2.3.2.2 Fourier Transform Infrared spectroscopy (FTIR)
Fourier Transform Infrared spectroscopy dominates the non-destructive
analytical tools utilised for the analysis of latent fingermarks. Although Raman
and FTIR spectroscopy share many benefits for fingermark analysis, they also
have differing strengths. As mentioned previously, FTIR yields better spectra for
organic molecules and is therefore generally more suitable for the analysis for
latent fingermarks. Initial studies into latent fingermark chemistry using FTIR
spectroscopy identified the key components; namely sebaceous and eccrine
deposits, as shown in figure 7 [64-66]. Each peak indicating a key functional
group that corresponds to the compounds present within a latent fingermark
(detailed in section 2.1).
Figure 7: Typical FTIR spectrum of a latent fingermark
This ability to identify the functional groups present within a latent fingermark is a
significant advantage of FTIR spectroscopy, a weakness, however, is that it does
not permit the differentiation of one organic compound from that of another with
a similar molecular structure. For example, it is impossible to distinguish between
the fatty acids palmitic acid (CH3(CH2)14COOH) and stearic acid
(CH3(CH2)16COOH) due to their structural similarity and therefore similar IR
absorbance. In the spectrum in figure 7 these two fatty acids, along with many
others, would be contained within the sebaceous bands (green peaks).
The use of FTIR spectroscopy to analyse groups of compounds with similar
structures, such as fatty acids, lipids, and amides, has however proven useful
when comparing variability between latent fingermarks. The previously
Absorb
ance

27
mentioned anecdotal evidence from police and scenes of crime officers that
children’s fingermarks ‘disappear’ after a short period of time [8] was corroborated
by observed chemical differences using both GC-MS [18,19] and FTIR
spectroscopy [43]. Using latent fingermarks as a biometric gauge for aging an
individual has also been demonstrated using FTIR spectroscopy [67], and with
greater granularity than merely child or adult. Using specific regions of the FTIR
spectra (1190-1260cm-1 & 2828-2970 cm-1) initial studies indicate that the study
group ranging from 4 to 64 years of age could be divided into four populations: 4-
5, 11-14, 18-26 and 29-64 years old. This is primarily due to the changes in
concentrations of free fatty acids, in higher concentrations in children, and
esterified fatty acids, in higher concentrations after puberty. The suggested
benefit of this research is that this technique could be used to provide an age
category for an individual when fingermarks found at a crime scene during a
forensic investigation provide no matches from a criminal database.
Despite the inability of FTIR spectroscopy to provide the specificity of MS
instruments, the ability to identify component groups within a latent fingermark
non-destructively suggests the potential for a new capability of on-scene forensic
analysis.
FTIR spectromicroscopy has been shown capable of analysing latent fingermarks
directly from evidence such as bank notes, rubbish bags, drinks containers, duct
tape and copier paper [65] without damaging the fingermark (if it is known where
to locate the mark). This is of particular relevance for forensic analysis because
it allows the fingermark to be unaltered by developing techniques which risk
corrupting any associated forensic evidence such as exogenous particulates or
fibres.
A major issue with analysing undeveloped fingermarks is that these marks are
rarely found at a crime scene. It is likely that the fingermark will only be identified
via a development technique such as conventional development powder,
magnetic powders, fluorescent dusting, cyanoacrylate (superglue) fuming and so
on. To date, there has been very limited research into the effects of fingermark
development techniques on FTIR analysis, yet it is essential that we understand

28
the impact of these techniques if FTIR spectroscopy is to become a practical
analytical tool for the forensic analysis of latent fingermarks.
At present, there have been various studies into the detection of trace quantities
of illicit particulate within latent fingermarks using FTIR spectral imaging [47] and
synchrotron radiation-based FTIR (SR-FTIR) [68], which have relevance for the
forensic, policing and intelligence communities. SR-FTIR allows for high spatial
and spectral resolution and reduced background interference, and therefore
provides more detailed spectra. This technique has been shown capable of
detecting pharmaceutical (aspirin) and explosive (RDX, TNT, PETN)
contaminants within latent fingermarks [68] as well mixtures of contaminants
(aspirin and sugar). This study demonstrated the possibilities of using FTIR to
detect contaminants within latent fingermarks, as well as showing that SR-FTIR
can analyse lifted fingermarks which would contain fewer contaminants than the
in situ originals. SR-FTIR analysis is however not practical for standard forensic
laboratory analysis of fingermarks, and, in the referenced study, the whereabouts
of the fingermarks were known prior to lifting. Therefore, no fingermark
developing techniques were used, which is unrealistic when compared to a
genuine forensic investigation. More ‘real world’ studies for analysing latent
fingermarks have been conducted by agencies such as the FBI and the
Singapore Police Force [69]. In these studies, contaminated fingermarks were
first developed with standard dusting powders, lifted using specific lifting tapes
(lifters) and then analysed using an SR light source. These studies confirmed that
dusting powder adds a level of complexity in locating and analysing any illicit
particles in the visual mode but identifying any explosive particulate via its
corresponding spectrum is possible. Certain lifting tapes are not suitable for direct
FTIR analysis due to their non-transparency, and whichever lifter is used, its
composition may have implications for the identification of illicit substances.
Attenuated total reflectance (ATR)-FTIR is a modification of FTIR analysis which
uses an optically dense crystal for fast analysis of solids and liquid mixtures with
no preparation required. This technique has been used to detect a limited variety
of explosive particulate (TNT, TNB, AN) in latent fingermarks by placing the ATR

29
crystal directly onto an explosive particle within the fingermark residue [70]. This
study demonstrated that detection of illicit substances using conventional FTIR
techniques is possible, but fingermarks were laid down on an ideal, IR transparent
surface (stainless steel) for analysis, were not lifted or dusted, and as with the
previously mentioned study, the contaminants were known prior to analysis.

30
2.4 The principles of Fourier Transform Infrared spectroscopy
2.4.1 Overview
Fourier Transform Infrared spectroscopy is a non-destructive analytical
spectroscopic technique used to obtain analytical data from a sample. FTIR
spectroscopy uses infrared (IR) radiation which passes through a sample and is
absorbed at specific wavelengths dependent on the functional groups within the
molecular structure of the analyte. A sample will produce a unique spectrum
depending on the compounds under analysis, therefore spectral data obtained
from IR analysis is an extremely effective way of analysing functional groups.
The absorption of this radiation results in an increase of energy proportional to
the wavelengths absorbed from a ground vibrational state to an excited state. For
a sample molecule to absorb IR the vibrations and rotations (vibrational modes)
within the molecular bonds must cause a net change in the dipole moment (the
distribution of positive and negative charges within the molecule). The alternating
electrical field within the IR radiation interacts with the fluctuations in the dipole
moment of the molecule. If the frequency of the IR radiation matches the
vibrational frequency of the molecule, then radiation will be absorbed. As an
example, the vibrational modes of carbon dioxide (CO2) can be both IR active
and inactive; as only some of the vibrational modes result in a change in the
dipole moment (figure 8).
A molecule with n atoms has a definite number of vibrational modes that can
occur. The number of vibrational modes is dependent on the shape of the
molecule. The number of vibrational modes for a linear molecule, such as CO2,
is 3n-5 (where n is the number of atoms), for a non-linear molecule, such as H2O,
the vibrational mode is 3n-6. Taking the example of CO2, a simple linear triatomic
molecule (O=C=O), has 3(3)-5 = 4 vibrational modes, while H2O, a non-linear
molecule has 3(3)-6= 3 vibrational modes. Large organic molecules found in
fingermarks, such as lipids and proteins are typically non-linear. The fatty acid
stearic acid, for example, has the molecular structure C18H36O2, so has 3(56)-6 =
162 vibrational modes.
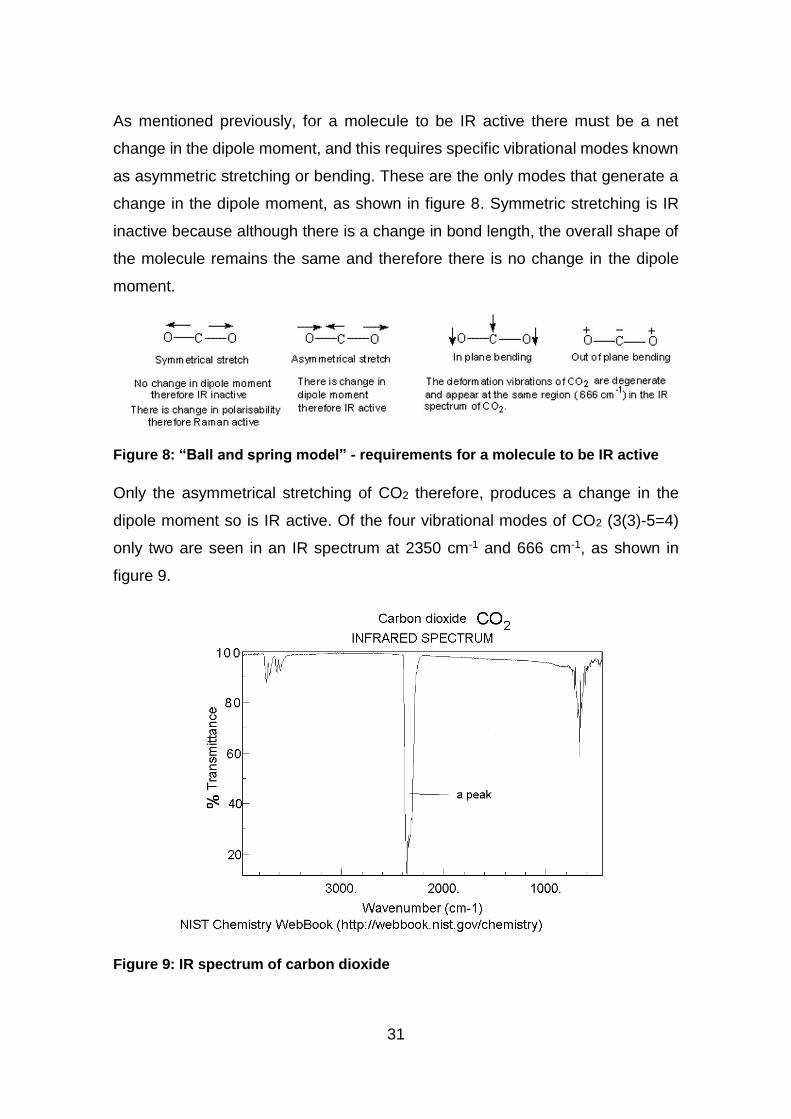
31
As mentioned previously, for a molecule to be IR active there must be a net
change in the dipole moment, and this requires specific vibrational modes known
as asymmetric stretching or bending. These are the only modes that generate a
change in the dipole moment, as shown in figure 8. Symmetric stretching is IR
inactive because although there is a change in bond length, the overall shape of
the molecule remains the same and therefore there is no change in the dipole
moment.
Figure 8: “Ball and spring model” - requirements for a molecule to be IR active
Only the asymmetrical stretching of CO2 therefore, produces a change in the
dipole moment so is IR active. Of the four vibrational modes of CO2 (3(3)-5=4)
only two are seen in an IR spectrum at 2350 cm-1 and 666 cm-1, as shown in
figure 9.
Figure 9: IR spectrum of carbon dioxide

32
2.4.2 Mid-range IR and fundamental vibrations
Mid-range IR, as used in this study, is the spectral range from 4,000 to 400 cm-1.
Mid-range IR is typically used for the analysis of organic materials because
various organic functional groups (C-H, C-O, C=O, C-N) show strong absorbance
in this region, particularly the fingerprint region from ~1500 to 500 cm-1. Specific
functional groups generate unique group frequencies (vibrations that are
associated with a specific functional group) which can then be used for analysis.
The ball and spring model, as demonstrated in figure 8, is not entirely sufficient
to explain organic molecular excitation, and hence the suitability of mid-range IR.
Typically, the quantum mechanical formulism is used to describe discrete energy
levels:
𝐸𝑛 = ℎ ∙ 𝑣 ∙ (𝑣 +1
2)
Where 𝑣 is the vibrational number or energy level. According to this selection rule,
only transitions are allowed with ∆𝑣 = ±1. This is because, for most vibrations of
organic compounds the ground state, 𝑣 = 0, is occupied under ambient
temperatures, the observed IR absorption bands of organic molecules in mid-
range IR are caused by the transition 𝑣 = 0 → 𝑣 = 1, known as a fundamental
vibration (figure 10). As figure 10 shows, this leads to a change from a harmonic
oscillator to the anharmonic oscillator model. The result being an asymmetric
potential curve, the right part of which converges with the bond dissociation
energy.
In Near-infrared (NIR), a growing field within IR spectroscopy and being used
more for the analysis of organic materials, the transitions are principally known
as overtones. Overtones are due to a shift in the selection rule from the harmonic
oscillator, with 𝑣 = ±2, ±3 …, and are the whole number multiples of the
fundamental vibrations (figure 10). Of particular relevance to organic molecules,
containing more than two atoms, combination modes can also be observed,
particularly in NIR. Combination modes refer to the simultaneous excitation of two
vibrational modes at one frequency, leading to additional peaks on an IR spectra
and can cause complications in analysis.

33
Figure 10: Potential energy curve of an anharmonic oscillator

34
2.4.3 FTIR Quantitative analysis
The majority of uses for FTIR spectroscopy are in qualitative analysis, using the
peaks to identify the presence of specific molecules or functional groups. FTIR
can however also be used quantitatively, although the technique is not as
accurate as other analytical techniques such as GC-MS.
Samples are quantified using the principle of Beer’s Law:
𝑨 = 𝐥𝐨𝐠𝑰𝟎
𝑰= 𝒆𝑳𝒄 or A= eLc
Where:
A is the absorbance of the sample
e is the molar absorptivity (L mol-1 cm-1)
L is the path length of the sample (cm)
c is the concentration of the sample (mol L-1)
Beer's Law tells us that absorbance depends on total quantity of the absorbing
sample in the beam path. When absorbance is plotted against concentration, a
linear relationship is seen demonstrating that there is a direct relationship
between absorbance and quantity. This law does have its limitations however as
it does not apply to high concentration samples, and in establishing the
concentration, the path length will be required so is an issue for samples of an
unknown quantity. The requirements for quantification are not always possible
especially in a forensic context where samples will often be unknown and
unmodifiable.

35
2.5 FTIR spectra of latent fingermarks
The FTIR spectra from the three component groups of a latent fingermark are
detailed below (NB all spectra and chemical maps were obtained by the
researcher):
2.5.1 Sebum
An FTIR spectrum of sebum (figure 11) contains the characteristic lipid peaks
that dominate the spectrum of a latent fingermark, primarily the antisymmetric and
symmetric C-H stretch of CH2 groups, from 2920 – 2854 cm-1, and the peaks at
1740 and 1180 cm-1 indicative of the C=O and C-O vibrations from carbonyl
esters.
Figure 11: IR spectrum of sebum deposit, note the antisymmetric and symmetric
C-H stretch of CH2 groups between 2920 - 2854 cm-1

36
2.5.2 Sweat
Eccrine sweat (figure 12) is predominantly comprised of water, inorganic salts,
amino acids, lactic acid and traces of urea. Organic acids from sweat can be
identified by the carboxylic acid peak between 1780 -1710 cm-1, the broad
hydroxyl peak at 3300 cm-1 is predominantly water (N.B. a far smaller peak is also
present at 3300 cm-1 in the presence of protein due to the hydroxyl group).
Figure 12: IR spectrum of sweat deposit, note the large carboxylic acid peak
between 1780-1710 cm-1
2.5.3 Peptides and proteins
It is possible to identify the amide backbone of peptides and proteins within
fingermarks. Specifically, the amide I band between 1700 - 1600 cm-1 from the
C=O stretching of the amide bond, and the amide II band at 1580 - 1480 cm-1
derived from both the N-H bending and C-N stretching within the amide bond
(figure 13).
Figure 13: IR spectrum of a skin cell, note the amide I and amide II peaks between
1700 – 1600 cm-1 and 1580 – 1480 cm-1 respectively.

37
The spectra shown in figures 11 - 13 are however unrealistic when compared to
latent fingermarks found in vivo, such as at a crime scene. Fingermarks found in
these environments are usually a combination of all three components.
Figures 14 shows a typical FTIR spectrum of a latent fingermark analysed in less
contrived circumstances and is more consistent with an individual’s natural
grooming behaviour. The spectrum in figure 14 shows the dominant C-H stretch
peaks at 2920 - 2854 cm-1, the C=O stretch at 1740 cm-1, identifying the presence
of ester groups, as well as the amide I and II peaks at 1700 - 1600 cm-1 and 1580
– 1480 cm-1 respectively. This would indicate that this sample had significant
concentrations of lipids and peptide bonds present.
Figure 14: Typical natural fingermark containing sebum, sweat, and protein
Certain key molecular components within latent fingermarks are essential for
aging a fingermark with regard to time since deposition, and aging the donor.
These components can generally be identified using FTIR analysis. Peaks that
are particularly indicative of these key components are the C-O single bond of
esters at 1190 - 1260 cm-1, the CH bending and C=O stretching from 1440 -1780
cm-1, and the C=C stretch, again from 1440 -1780 cm-1 [67]. It is not, however,
possible to specifically identify individual components such as squalene due to
the overlap of their spectral bands with that of other sebaceous materials [64].

38
2.6 Chemical mapping
Because FTIR spectra identify the functional groups of molecules present within
a sample, it is possible to generate images that show the distribution of these
functional groups using spectral or chemical mapping (chemimaps) based on
their absorbance. These images demonstrate the relative abundance and
distribution of particular compounds within a fingermark, be they endogenous or
exogenous. For example, from a light microscope image (15a), it is possible to
produce a chemimap that shows the average absorbance of a latent fingermark
(15b), or to isolate a specific functional group such as the carboxylic acid bands
at 3000 - 2500 cm-1 and 1780-1710 cm-1. The chemimap will show the locations
and abundance of this functional group within the fingermark (figure 15c).
Figure 15: A fingermark image from a light microscope (a), and the corresponding
chemimaps showing the average absorbance of that latent fingermark (b), and the
distribution of carboxylic acid groups (c).
Figure 15b demonstrates that chemimaps can not only identify the abundance of
particular compounds within a fingermark but can also show the ridge patterns.
These ridge patterns could, if the entire fingermark were scanned, be used for
identification purposes in much the same way as conventional fingermark
patterns.

39
Analysis of the chemical components within latent fingermarks has been
undertaken for a number of years, and as the selectivity and sensitivity of
analytical techniques has improved our understanding of fingermark composition
has developed. An in-depth understanding of the degradation mechanisms that
take place within a fingermark post-deposition is yet to be achieved, however. A
deeper understanding of the various interactions that take place, the intermediary
and end products that develop and in what conditions, would not only advance
our knowledge of fingermark chemistry but would be of great value to the law
enforcement and forensic community. Such detailed understanding could
potentially allow for a multitude of information to be gained from the chemistry of
a fingermark. Information such an age range, gender, time since deposition, and
the identification of illicit substances.
This thesis, through the presentation of four papers, aims to advance our
understanding of latent fingermark degradation by investigating various
mechanisms that may affect fingermark chemistry. Aspects of the fingermark
degradation process, not previously studied, will be analysed using FTIR
microscopy, including the effect of certain environmental factors, the importance
of intermolecular interactions on chemical degradation, and the effect of
fingermark degradation on illicit contaminants. The results of this body of work
will not only aim to advance our academic understanding of fingermark
degradation chemistry but provide information that could be of use to the forensic
community regarding the behaviour of fingermarks post-deposition, the effect of
the environment on the development of fingermarks, and the ability to detect illicit
substances in aged fingermarks.

40
2.7 References
1. N.E. Archer, Y. Charles, J.A. Elliott, S. Jickells, Changes in the lipid
composition of latent fingerprint residue with time after deposition on a
surface. Forensic Sci. Int. 154 (2–3) (2005) 224–239.
2. F.J. Ebling, Steriod hormones and sebaceous secretions, in: Advances in
steriods, 2nd ed. London: Academic press; 1970. 1-11.
3. A. Girod, R. Ramotowski, C. Weyermann, Composition of fingermark
residue: A qualitative and quantitative review. Forensic Sci. Int. 223 (1–3)
(2012) 10–24.
4. R. Ramotowski, Composition of Latent Print Residues, in: Advanced in
Fingerprint Technology, 2nd ed. London: CRC Press; 2001. 63-104.
5. R.S. Croxton, M.G. Baron, D. Butler, T. Kent, V.G. Sears, Variation in
amino acid and lipid composition of latent fingerprints. Forensic Sci. Int.
199 (2010). 93–102.
6. G.M. Mong, C.E. Petersen, T.R.W. Clauss, Advanced Fingerprint Analysis
Project - Fingerprint Constituents. Vol PNNL-13019. Pacific Northwest
National Laboratory: U.S. Department of Energy, 1999.
7. K.G. Asano, C.K. Bayne, K.M. Horsman, M.V. Buchanan, Chemical
composition of fingerprints for gender determination. J. Forensic Sci. 47 (4)
(2002) 805–807.
8. D. Noble, Vanished into thin air. The search for children’s fingerprints. Anal.
Chem. 67 (13) (1995) 435A–438A.
9. R.S. Greene, D.T. Downing, P.E.Pochi, J.S. Strauss, Anatomical Variation
in the Amount and Composition of Human Skin Surface Lipid. J. Investig.
Dermatol. 54 (3) (1970) 240–247.

41
10. P.E. Pochi, J.S. Strauss, Endocrinologic control of the development and
activity of the human sebaceous gland. J. Inv. Derm. 62 (3) (1974)191–
201.
11. J. Ebling, Hormonal Control and Methods of Measuring Sebaceous Gland
Activity. J. Inv. Derm. 62(3) (1974) 161-171.
12. J.S. Strauss, P.E. Pochi, The Human Sebaceaous Gland: Its Regulation by
Steroidal Hormones and its use as an and Organ for Assaying
Androgenicity in Vivo. Recent progress in hormone research. 19 (1963)
385 - 444.
13. T. Nikkari, Comparative Chemistry of Sebum. J. Inv. Derm. 62 (3) (1974)
257–267.
14. R. Mykytowycz, B.S. Goodrich, Skin Glands as Organs of Communication
in Mammals. J. Inv. Derm. 62 (3) (1974) 124-131.
15. R. Marples, A. Kligman, L. Lantis, D. Downing. The Role of the Aerobic
Microflora in the Genesis of Fatty Acids in Human Surface Lipids. J. Inv.
Derm. 55 (3) (1970) 173-178.
16. L. Boniforti, S. Passi, F. Caprilli, F. Nazzaro Porro, Skin surface lipids.
Identification and determination by thin-layer chromatography and gas-
liquid chromatography. Clinica Chimica Acta. 47 (2) (1973) 223-231.
17. C. Weyermann, C. Roux, C. Champod, Initial Results on the Composition
of Fingerprints and its Evolution as a Function of Time by GC/MS Analysis.
J. Forensic Sci. 56 (1) (2011) 102-108.
18. K.M. Antoine, S. Mortazavi, L.M. Miller, A.D. Miller, Chemical differences
are observed in children’s versus adults’ latent fingerprints as a function of
time. J forensic sci. 55 (2) (2010) 513-518.
19. M.V. Buchanan, K.G. Asano, A. Bohanan, Chemical Characterization of
fingerprints from adults and children. International Society of Optical
Engineering. 2941 (1996) 89-95.

42
20. N, Nicolaides, H.C. Fu, M.N.A. Ansari,G.R. Rice, The fatty acids of wax
esters and sterol esters from vernix caseosa and from human skin surface
lipid. Lipids. 7 (8) (1972) 506-517.
21. K.M. Nordstrom, J.N. Labows, K.J. McGinley, J.J. Leyden, Characterization
of Wax Esters, Triglycerides, and Free Fatty Acids of Follicular Casts. J.
Inv. Derm. 86 (6) (1986) 700-705.
22. K.T. Holland, E. Ingham, W.J. Cunliffe, A Review The Microbiology of Acne.
J. Applied Bacteriology. 51 (2) (1981) 195-215.
23. R. Summerly, H.J. Yardley, M. Raymond, A. Tabiowo, E. Ilderton, The lipid
composition of sebaceous glands as a reflection of gland size. British
Journal of Dermatology. 94 (1) (1976)45-53.
24. P.M. Quinton, Sweating and its Disorders. Annual Review of Medicine. 34
(1) (1983) 429-452.
25. D. Larry, G. Berglund, D. Richard, R. Gallagher, D. Preston, E. McNall,
Simulation of the thermal effects of dissolved materials in human sweat.
Computers and Biomedical Research. 6(2) (1973) 127-138.
26. G.W. Cage, S.M. Wolfe, R.H. Thompson, R.S.J. Gordon, Effects of water
intake on composition of thermal sweat in normal human volunteers. J.
Applied Physiology. 29 (1970) 687-690.
27. F. Bayford, Sweat. Fingerprint Whorld. 1 (1976) 42-43.
28. P. Hamilton. Amino-acids on Hands. Nature. 205 (1965) 284-285.
29. B. Hadron, F. Hanimann, P. Anders, H. Curtius, R. Halverson, Free Amino-
acids in Human Sweat from Different Parts of the Body. Nature. 215 (99)
(1967) 416-417.
30. J. Oro, H. Skewes, Free Amino-Acids on Human Fingers: The Question of
Contamination in Microanalysis. Nature. 207 (1) (1965) 1042-1045.
43
31. K. Uyttendaele, M. De Groote, V. Blaton, H. Peeters, F. Alexander, Analysis
of the proteins in sweat and urine by agarose-gel isotachophoresis. J.
Chromatography 132 (2) (1977) 261-266.
32. T.C. Boysen, S. Yanagawa, F. Sato, K. Sato, A modified anaerobic method
of sweat collection. J. Applied Physiology. 56 (5) (1984) 1302-1307.
33. K. Sato, The physiology, pharmacology, and biochemistry of the eccrine
sweat gland. Reviews of Physiology, Biochemistry and Pharmacology. 79
(1977) 51-131.
34. W.C. Lobitz, H.L. Mason, Chemistry of palmar sweat: Vii. discussion of
studies on chloride, urea, glucose, uric acid, ammonia nitrogen and
creatinine. Archives of Dermatology and Syphilology. 57 (5) (1948) 907-
915.
35. L. Förström, M.E. Goldyne, R.K. Winkelmann, Ige in Human Eccrine Sweat.
J. Inv. Derm. 64 (3) (1975) 156-157.
36. M.J. Bailey, N.J. Bright, S. Hinder, B.N. Jones, R.P. Webb, R.S. Croxton,
Chemical characterization of latent fingerprints by matrix-assisted laser
desorption ionization, time-of-flight secondary ion mass spectrometry,
mega electron volt secondary mass spectrometry, gas
chromatography/mass spectrometry, X-ray photoelectron spec. Anal
Chem. 84 (20) (2012) 8514-8523.
37. A. Girod, C. Weyermann, Lipid composition of fingermark residue and
donor classification using GC/MS. Forensic Sci. Int. 238 (2014) 68-82.
38. B. Hadorn, F. Hanimann, P. Anders, H. Curtius, R. Halverson, Free Amino-
acids in Human Sweat from Different Parts of the Body. Nature. 215 (99)
(1965) 416-417.
39. A. Yamamoto, S. Serizawa, M. Ito, Y. Sato, Effect of Aging on Sebaceous
Gland Activity and on the Fatty Acid Composition of Wax Esters. J. Inv
Derm. 89 (5) (1987) 507-512.

44
40. P. Ramasastry, D.T. Downing, P.E. Pochi, J.S. Strauss, Chemical
Composition of Human Skin Surface Lipids from Birth to Puberty. J. Inv.
Derm. 54 (2) (1970) 139-144.
41. E. Jacobsen, J.K. Billings, R.A. Frantz, C.K. Kinney, M.E. Stewart, D.T.
Downing, Age-Related Changes in Sebaceous Wax Ester Secretion Rates
in Men and Women. J. Inv. Derm. 85 (5) (1985) 483-485.
42. W.J. Cunliffe, S. Shuster, Pathogenesis of Acne. The Lancet. 293 (7597)
(1969) 685-687.
43. D.K. Williams, C.J. Brown, J. Bruker, Characterization of children’s latent
fingerprint residues by infrared microspectroscopy: Forensic implications.
Forensic sci. int. 206 (1–3) (2011) 161-165.
44. R. Olsen, The chemical composition of palmar sweat. Fingerprint and
Identification magazine. 53 (1972) 3-23.
45. A. Girod, C. Weyermann, Lipid composition of fingermark residue and
donor classification using GC/MS. Forensic Sci. Int. 238 (2014) 68–82.
46. F. Rowell, K. Hudson, J. Seviour, Detection of drugs and their metabolites
in dusted latent fingermarks by mass spectrometry. Analyst. 4 (2009) 701-
707.
47. P.H.R. Ng, S. Walker, M. Tahtouh, B. Reedy, Detection of illicit substances
in fingerprints by infrared spectral imaging. Analytical & Bioanalytical
Chemistry. 394 (8) (2009) 2039-2048.
48. F. Rowell, J. Seviour, A.Y. Lim, C.G. Elumbaring-Salazar, J. Loke, J. Ma,
Detection of nitro-organic and peroxide explosives in latent fingermarks by
DART- and SALDI-TOF-mass spectrometry. Forensic Sci. Int. 221 (1–3)
(2012) 84–91.
49. L. Sundar, F. Rowell, Detection of drugs in lifted cyanoacrylate-developed
latent fingermarks using two laser desorption/ionisation mass
spectrometric methods. Analyst. 139 (3) (2014) 633-642.

45
50. A.Y. Lim, J. Ma, Z. Ma, F. Rowell, Separation of fingerprint constituents
using magnetic silica nanoparticles and direct on-particle SALDI-TOF-
mass spectrometry. Journal of Chromatography B. 879 (23) (2011) 2244-
2250.
51. R. Wolstenholme, R. Bradshaw, M.R. Clench, S. Francese, Study of latent
fingermarks by matrix-assisted laser desorption/ionisation mass
spectrometry imaging of endogenous lipids. Rapid Communications in
Mass Spectrometry. 23 (19) (2009) 3031–3039.
52. L. Ferguson, R. Bradshaw, R. Wolstenholme, M. Clench, S. Francese,
Two-Step Matrix Application for the Enhancement and Imaging of Latent
Fingermarks. Analytical Chemistry. 83 (14) (2011) 5585–5591.
53. R. Bradshaw, R. Wolstenholme, R.D. Blackledge, M.R. Clench, L.S.
Ferguson, S. Francese, A novel matrix-assisted laser desorption/ionisation
mass spectrometry imaging based methodology for the identification of
sexual assault suspects. Rapid Communications in Mass Spectrometry. 25
(3) (2011) 415–422.
54. S. Francese, R. Bradshaw, N. Denison, An update on MALDI mass
spectrometry based technology for the analysis of fingermarks - stepping
into operational deployment. Analyst. 142 (14) (2017) 2518–2546.
55. L.S. Ferguson, F. Wulfert, R. Wolstenholme, J.M. Fonville, M.R. Clench,
V.A. Carolan, Direct detection of peptides and small proteins in fingermarks
and determination of sex by MALDI mass spectrometry profiling. Analyst.
137 (20) (2012) 4686-4692.
56. A. Sullyman, Fingerprint test that reveals a criminal’s lifestyle to be used
in court ‘in months’. Independent. (2017) online. Available at:
http://www.independent.co.uk/life-style/gadgets-and-
tech/news/fingerprint-test-criminal-lifestyle-profile-drugs-blood-courts-
trials-maldi-mass-spectrometry-a7992621.html

46
57. K.A. Mountfort, H. Bronstein, N. Archer, S.M. Jickells, Identification of
oxidation products of squalene in solution and in latent fingerprints by ESI-
MS and LC/APCI-MS. Analytical Chemistry. 79 (7) (2007) 2650–2657.
58. R.M. Connatser, S.M. Prokes, O.J. Glembocki, R.L. Schuler, C.W.
Gardner, S.A. Lewis, Toward Surface-Enhanced Raman Imaging of Latent
Fingerprints. J. Forensic Sci. 55 (6) (2010) 1462–1470.
59. H.G.M. Edwards, D.M. Farwell, S. Rozenberg, Raman spectroscopic study
of red pigment and fresco fragments from King Herod’s Palace at Jericho.
Journal of Raman Spectroscopy. 30 (5) (1999) 361–366.
60. C.A.F. de Oliveira Penido, L. Silveira, M.T.T. Pacheco, Quantification of
Binary Mixtures of Cocaine and Adulterants using Dispersive Raman and
FTIR Spectroscopy and Principal Component Regression. Instrumentation
Science & Technology. 40 (5) (2012) 441.
61. H.W. Han, X.L. Yan, R.X. Dong, G. Ban, K. Li, Analysis of serum from type
II diabetes mellitus and diabetic complication using surface-enhanced
Raman spectra (SERS). Applied Physics B: Lasers and Optics. 94 (4)
(2009) 667–672.
62. J.S. Day, H.G. Edwards, S.A. Dobrowski, A.M. Voice, The detection of
drugs of abuse in fingerprints using Raman spectroscopy II: cyanoacrylate-
fumed fingerprints. Spectrochimica Acta Part A: Molecular and
Biomolecular Spectroscopy. 60 (8–9) (2004) 1725–1730.
63. C. Cheng, T.E. Kirkbride, D.N. Batchelder, R.J. Lacey, T.G. Sheldon, In situ
detection and identification of trace explosives by Raman microscopy. J.
Forensic sci. 40 (1) (1995) 31–37.
64. D.K. Williams, R.L. Schwartz, E.G. Bartick, Analysis of Latent Fingerprint
Deposits by Infrared Microspectroscopy. Applied Spectroscopy. 58 (3)
(2004) 313–316.

47
65. N.J. Crane, E.G. Bartick, R.S. Perlman, S. Huffman, Infrared spectroscopic
imaging for noninvasive detection of latent fingerprints. J. Forensic Sci. 52
(1) (2007) 48–53.
66. C. Ricci, N. Curum, K.L.A. Chan, S. Jickells, S. Kazarian, Chemical Imaging
of Latent Fingerprint Residues. Applied Spectroscopy. 61 (5) (2007) 514–
522.
67. A. Hemmila, J. McGill, D. Ritter, Fourier transform infrared reflectance
spectra of latent fingerprints: a biometric gauge for the age of an individual.
J. Forensic sci. 53 (2) (2008) 369–376.
68. A. Banas, K. Banas, M.B.H. Breese, J. Loke, S.K. Lim, B. Heng Teo,
Detection of microscopic particles present as contaminants in latent
fingerprints by means of synchrotron radiation-based Fourier transform
infra-red micro-imaging. Analyst. 137 (15) (2012) 3459–3465.
69. A. Banas, K. Banas, M.B. Breese, J. Loke, S.K. Lim, Spectroscopic
detection of exogenous materials in latent fingerprints treated with powders
and lifted off with adhesive tapes. Anal. & Bioanal. Chemistry. 406 (17)
(2014) 4173-4181.
70. Y. Mou, J.W. Rabalais, Detection and Identification of Explosive Particles
in Fingerprints Using Attenuated Total Reflection-Fourier Transform
Infrared Spectromicroscopy. J. Forensic Sci. 54 (4) (2009) 846-850.

48
CHAPTER 3. AIMS AND OBJECTIVES
The overall aim of this research was to investigate the dynamic nature of latent
fingermark chemistry with a particular focus on temporal decomposition.
Despite recent advances in analytical instrumentation enabling a more in-depth
understanding of fingermark chemistry there remains significant gaps in the
literature. As such it was hypothesised that FTIR spectromicroscopy is ideally
suited in providing a broad range of analytical information on latent fingermark
chemistry and illicit substance detection within latent fingermarks, that could
address some of these gaps.
Four areas of original research were identified which would contribute to a deeper
understanding of fingermark chemistry. When combined these objectives test the
hypothesis and deliver against the overall aim of the thesis, summarised in the
diagram over the page.
The four objectives of this research were as follows:
Objective 1. To evaluate and critically review the advantages and limitations of
Fourier Transform Infrared spectromicroscopy when compared to Gas
Chromatography-Mass Spectrometry (GC-MS), the dominant analytical
technique for the investigation of latent fingermark chemistry.
Objective 2. To determine whether moderate temperature variations affect latent
fingermark chemistry in the immediate hours after deposition using FTIR
spectromicroscopy.
Objective 3. To investigate the possible intermolecular interactions that occur
within latent fingermarks and their potential impact on degradation processes
using FTIR spectroscopy.
Objective 4. To detect and identify temporally degraded exogenous
contaminants within latent fingermarks using FTIR spectroscopic imaging.

49
t
? V’s GC-MS FTIR
RT: 0.00 - 16.70
0 1 2 3 4 5 6 7 8 9 10 11 12 13 14 15 16
Time (min)
0
5
10
15
20
25
30
35
40
45
50
55
60
65
70
75
80
85
90
95
100
Rel
ativ
e Ab
unda
nce
3.523.49
2.64
8.27
3.75
5.02
9.32
4.14 8.404.57
9.20
7.34 12.446.09
7.385.21 8.87
6.21 10.05 16.6616.0110.18 15.477.5914.7213.6812.17
NL:
2.06E8
TIC MS AJ
FP6.2 DER T0 RT
Chemical degradation
0-5 hr
25oC – 75oC
Diagrammatic summary of the objectives and workflow of research
Objective 1: Evaluate the advantages and limitations of Fourier Transform
Infrared (FTIR) spectromicroscopy when compared to Gas Chromatography-Mass Spectrometry (GC-MS).
Objective 2: To determine whether moderate temperature variations
affect latent fingermark chemistry in the immediate hours after deposition using FTIR spectromicroscopy.
Objective 3: To investigate the possible intermolecular interactions
that occur within latent fingermarks and their potential impact on degradation processes using FTIR spectroscopy.
Objective 4:
To detect and identify exogenous contaminants within latent fingermarks over time using Fourier Transform spectroscopic imaging.

50
CHAPTER 4. PAPER ONE
(Submitted to Journal of imaging – under review)
The chemical analysis of latent fingermarks: Capabilities and
limitations of FTIR spectroscopy, a GC-MS comparison
Authors
Andrew Johnston1, Keith Rogers1
1Cranfield University, The Defence Academy of the United Kingdom, Shrivenham, SN6 8LA
4.1 Abstract
The capabilities of Fourier Transform Infrared (FTIR) spectroscopy as an analytical
tool for the analysis of latent fingermarks were examined. Data were compared to the
more established technique of gas chromatography-mass spectrometry (GC-MS) for
the analysis of latent fingermark composition.
FTIR spectroscopy allowed for rapid, non-destructive analysis of latent fingermarks.
Chemical imaging using FTIR spectromicroscopy visually demonstrated the intra-
variability and distribution of components within latent fingermark deposits, although
specific compound identification was limited.
Comparing ratios of certain functional groups to the antisymmetric and symmetric C-
H stretch absorbance band (2924 cm-1 - 2840 cm-1) showed a strong correlation
between the relative quantities of some, but not all of those functional groups and the
C-H stretch band.
GC-MS analysis identified the presence of specific amino acids, fatty acids, and
squalene, and demonstrated quantitative intra-variability of these compounds from the
fingermarks of the same individual. GC-MS was able to distinguish between in vivo
lipid secretions and an exogenous synthetic lipid found in cosmetics. These results
show that the orthogonal use of FTIR spectroscopy and GC-MS could provide a
deeper understanding of fingermark chemistry.
Keywords
forensic science, latent fingermarks, chemical composition, FTIR microscopy, CGMS.

51
4.2 Introduction
Fingermark chemistry is complex, with significant variability both within and between
individuals, is susceptible to significant changes over time, in different environmental
conditions, and between children and adults [1-4]. Interest in fingermark chemistry has
increased in the last decade primarily due to advances in analytical instrumentation,
but despite this increase in research an in-depth understanding is yet to be achieved
[4]. One analytical technique that has generated significant interest within in this field
is Fourier Transform Infrared (FTIR) spectroscopy.
FTIR spectroscopic analysis is fast and requires no sample preparation, FTIR
spectroscopic imaging is particularly attractive to forensic scientists and law
enforcement agencies because of its ability to non-destructively analyse a sample for
trace amounts of illicit substances. FTIR imaging, therefore, allows for better continuity
of evidence through the forensic chain compared to the more conventional destructive
analytical methods such as gas chromatography-mass spectrometry (GC-MS) [5-12]
and matrix-assisted laser desorption ionisation (MALDI-MS) [5, 13-16]. FTIR imaging
provides more compelling evidence to a lay jury than GC-MS or MALDI-MS, as it does
not require interpretation of complex data or heavy reliance on expert opinion. The
identification of any illicit substances in a subjects’ fingermarks using FTIR imaging
demonstrates an unequivocal visual link between the individual, the fingermark and
the illicit substance that is far easier for a jury to understand.
Although FTIR spectroscopy has many attributes that are appealing to the forensic
community, it is still broadly considered a research tool for the analysis of endogenous
and exogenous compounds within fingermarks, as opposed to technique actively
utilised by law enforcement agencies. This is in contrast to techniques such as GC-
MS and MALDI-MS which are considered the gold standard for the chemical analysis
of latent fingermarks. GC-MS has been used in the majority of investigations into latent
fingermark chemistry, it not only provides detailed analysis of sebaceous and eccrine
components present within fingermarks [1, 2, 4, 5, 12, 17] but is more practical, being
readily accessible in most research facilities. Both FTIR and GC-MS analysis can offer
unique insight into the composition of a fingermark and could arguably be considered
as complementary techniques for fingermark analysis.

52
Although previous research has looked at the merits of various analytical techniques
for the analysis of fingermarks [5], the aim of this study was to demonstrate the
capabilities and limitations of FTIR spectromicroscopy and compare that to GC-MS, a
more established analytical tool for such analysis.

53
4.3 Materials and Methods
4.3.1 Fingermark preparation - FTIR
All sample fingermarks were obtained from a single donor. Hands were first washed
and dried thoroughly. Hands were then placed in latex gloves to protect them from
contamination. After twenty minutes hands were removed from the gloves, the index
finger was then drawn from the bridge of the nose, under the eye to the temple ten
times to collect sebaceous secretions and to simulate natural grooming behaviour,
and placed directly onto a CaF2 Infrared (IR) microscope slide (10 mm x 10 mm,
Crystran Ltd). In total twenty sample fingermarks were prepared as above. All
fingermarks were laid down between 9am and 11am to avoid significant diurnal
variations in composition, allowing twenty minutes between depositions for sebaceous
and eccrine recovery. For each fingermark the same index finger was used. All
fingermarks were stored at room temperature and humidity for the duration of the
experiment. All fingermarks were destroyed at the end of each day and the process
repeated for each additional day of testing, this ensured fingermarks were fresh and
analysis was not carried out on inadvertently aged fingermarks.
4.3.2 FTIR Microscopy
The latent fingermarks prepared as above were analysed using a Perkin® Elmer
SpectrumTM Spotlight 200 FTIR imaging System equipped with a liquid-nitrogen
cooled MCT linear array detector. Data was analysed using Perkin Elmer software,
Spectrum® (v10.02.00), variations in spectra were processed using peak height
calculations. For each fingermark six deposits were identified and analysed at random
to ensure all components of the latent fingermarks were sampled.
Spectra of fingermark deposits were collected in transmission mode within 4000 to
750 cm-1 spectral range with 10 scans per pixel at 4 cm-1 spectral resolution and 10
µm spatial resolution, using a 100 x 100 µm aperture.

54
4.3.3 Fingermark preparation – GC-MS
Fingermarks were generated in an identical manner to FTIR preparation and deposited
on acetone washed coverslips (22 mm x 22 mm Chance propper Ltd) cut in half to fit
a screw top vial (2 ml, Merck UK). There was a minimum of twenty minutes between
fingermark depositions to allow recovery of glandular secretions, in total twenty
samples were prepared as above. All fingermarks were laid down using the same
index finger.
Once fingermark samples were deposited on the coverslips they were placed into the
screw top vial, each vial was marked with the fingermark number and extraction
technique.
To extract the fingermark 1-chlorononane (30 µL of a 0.078 mg/mL solution in hexane)
was added to 200 µl of the extraction agent dichloromethane (>99.9% pure), and 50
µl N-methyl-N-(trimethylsilyl)-triflouroacetamide (MSTFA) derivatisation agent.
MSTFA alters the properties of compounds, increases their volatility making them
more suitable for GC analysis. The vials were sealed with the screw cap, shaken and
left to stand at room temperate for 15 minutes, shaken intermittently.
After 15 minutes the solution was reduced under a stream of nitrogen until the solution
evaporated and only the solute remained. 100 µl of dichloromethane was added and
75 µl of solution was transferred to 300 µl glass autosampler vials (Thermo Fisher
Scientific, UK) and shaken several times to mix. The samples were then analysed by
GC-MS.
Blank coverslips were taken through the same preparation procedure as above to act
as controls.
4.3.4 GC-MS analysis
Gas chromatography-mass spectrometry (GC-MS) analysis was carried out on a
ThermoQuest GC AS 800 autosampler, Fisons GC model GC8000top with AS 800
liquids auto sampler directly coupled with a Fisons Voyager MS (quadrupole, EI+)
operated in full scan mode. 1 µl of sample was injected in via an AS800 autosampler.
The column was a factor four VF-5MS (15 m length, 0.25 mm id x 0.25 μm film

55
thickness) from Varian. The injector was set at 250oC and the MS transfer line
temperature at 250oC.
Helium was used as the carrier gas at a flow rate of 2.40 ml/min. The MS detector
operated at 170V, emission 350 µA scanning between 15 and 526 amu at 2.1 scans/
s-1. The column was held at 80oC for 3 min after injection and the programmed to rise
at 20oC/min to 300oC, and held at this temperature for 15 min. All mass spectra were
obtained using electron ionisation (70 eV). Analysis software was Xcalibur from
Thermo Scientific with National Institute of Standards and Technology (NIST) spectral
library.
4.3.5 Reagents
Control chemicals: 1-chlorononane (98%, Fluka); cholesterol (99%, Fluka), MSTFA,
were all purchased from Sigma-Aldrich Chemical Company and used without further
purification. Solvents: acetone and dichloromethane were purchased from Fisher
Chemicals.
4.3.5.1 Identification and quantification
Bands detected from the mass spectrum were identified through library matching
against the NIST library of Mass spectra. Relative quantification was achieved by peak
area ratio comparison to chlorononane.

56
4.4 Results and Discussion
4.4.1 FTIR - Chemical Mapping
FTIR spectra identify the functional groups of compounds present within a sample,
with FTIR spectromicroscopy its possible to visually display the distribution of specific
functional groups using chemical mapping. It is possible, for example, to display the
alkenes (3100-3000 cm-1) of unsaturated lipids and the carboxylic acid groups (1760-
1690 cm-1) in sebum deposits within latent fingermarks. These images demonstrate
the relative abundance and distribution of particular compounds within a fingermark
and can be used to look at the relationship between fingermark components by
obtaining specific IR spectra from the chemimaps.
Figure 16 shows the difference in average absorbance, and the distribution of alkenes,
and carboxylic acid groups from two different fingermarks from the same individual
deposited on two consecutive days (figure 16A & B). These fingermarks were taken
within the same thirty-minute time period on each day and were natural deposits, i.e.
no simulated grooming behaviour. As there are no sebaceous glands on the palms of
the hands (or soles of the feet), sebaceous secretions found in fingermarks are
deposited onto the fingertips by natural grooming behaviour, typically face touching [3,
4, 8], and therefore can vary both diurnally and between individuals. Figure 16B shows
a greater average absorbance and therefore higher relative proportion of fingermark
components than 16A, so, as would be expected, there is a higher concentration of
unsaturated lipids (alkenes), and carboxylic acid groups, which are found in various
fingermark components such as fatty acids and amino acids.

57
Figure 16: Chemimap images of the variations in sebum deposits between two latent
fingermarks from the same individual.
4.4.2 FTIR - Relative quantification
The majority of components that make up a latent fingermark have been well
documented using various analytical techniques, not least variations of mass
spectrometry [1-14, 15-22]. As mentioned previously, spectroscopic techniques too
have reported the chemical makeup of latent fingermarks, both Raman and FTIR
spectroscopy, in particular, have been utilised to study the exogenous and
endogenous components present within latent fingermarks [23-34]. Figure 17 shows a
typical FTIR spectrum of a fresh natural fingermark.
Figure 17: A typical FTIR spectrum of a natural latent fingermark.
Ab
so
rba
nce
A
B
Ab
so
rba
nce

58
The spectrum contains the principal components that make up a latent fingermark, i.e.
sebum and eccrine sweat [3, 4], with the key functional groups labelled as consistent
with the literature. Figure 17 shows absorbance bands at 3300 cm-1 (O-H stretch,
water, protein), 2924 cm-1 and 2840 cm-1 (antisymmetric and symmetric C-H stretch
of CH2 groups), 1736 cm-1 (C=O stretch, saturated ester), 1654 cm-1 (I amide C=O
stretch), 1540 cm-1 (II amide N-H in plane bend, C-N stretch), 1464 cm-1 (CH3
asymmetric bend), 1374 cm-1 (CH3 symmetric bend), 1164 cm-1 (C-C-O stretch,
saturated ester), 1110 cm-1 (O-C-C stretch, saturated ester).
The dominant band in an FTIR spectrum of a latent fingermark is the antisymmetric
and symmetric C-H stretch of CH2 groups at 2924 cm-1 - 2840 cm-1. This band is the
sum of the organic components that make up a latent fingermark, Amino acids, fatty
acids, triglycerides, wax esters, sterols, sterol esters, squalene, peptides, are all
organic molecules, and each molecule ranging from two to over thirty carbon atoms
[2-4, 7, 28, 33]. The only exception to this is the presence of water and minimal
amounts of inorganic salts secreted from eccrine glands. It is therefore reasonable to
expect that there is a strong correlation between the concentration of the symmetric
and antisymmetric C-H stretch band of CH2 groups and all the other bands in the
spectrum that identify the various functional groups from organic molecules within a
fingermark. These groups would include the saturated ester carbonyl group (C=O) at
1740 cm-1, the amide I & II groups of peptide bonds (1541 cm-1), the methyl group (R-
CH3) of aliphatic carbon chains at 1464 cm-1, and the C-C-O saturated ester group at
1164 cm-1. The antisymmetric and symmetric C-H stretch of CH2 groups could,
therefore, be considered to be the sum of these (and other) organic components.

59
The figures below show the correlation between the antisymmetric and symmetric C-
H stretch of CH2 groups and three of these other functional group bands.
Figure 18: Relationship between the antisymmetric & symmetric C-H stretch of CH2
groups (2924 – 2840 cm-1) and the carbonyl stretch band (1740 cm-1) of a latent
fingermark (n=20)
Figure 18 shows a strong correlation between the concentration of antisymmetric and
symmetric C-H stretch of CH2 groups and the carbonyl functional group band with a
correlation of R=0.92 (p-value 0.00).
Figure 19: Relationship between the antisymmetric & symmetric C-H stretch of CH2
groups (2924 – 2840 cm-1) and the CH3 bend (1464 cm-1) (n=20)
Absorb
ance C
H2 g
rou
p
Absorbance CH3 band
Absorb
ance C
H2 g
rou
p
Absorbance C=O band

60
Figure 19 shows a general trend of an increase in quantity of methyl groups as the
concentration of the 2924 – 2840 cm-1 CH2 band increases, but there is a significant
degree of scatter and less correlation (R=0.66, p-value = 0.002) than that of the
carbonyl band.
Figure 20: Relationship between the antisymmetric & symmetric C-H stretch of CH2 groups (2924 cm-1 - 2840 cm-1) and the C-C-O stretch band (1246 cm-1) (n=20)
Figure 20 again shows a correlation between the antisymmetric & symmetric C-H
stretch band and the C-C-O functional group but with significant scatter, (R = 0.77, p-
value <0.01).
Figures 18-20 show there is a correlation between the concentration of the
antisymmetric & symmetric C-H stretch of CH2 groups at 2924 cm-1 - 2840 cm-1 and
the associated functional groups, however, in some cases these correlations are not
as strong as might be expected. This suggests that an increase in the total organic
component within a latent fingermark does not necessarily correspond to an increase
in every component part of that fingermark (i.e. fatty acids, triglycerides, wax esters
and so on). For example, as shown in figure 19, an increase in concentration of the
overall organic composition of a latent fingermark (2924 cm-1 - 2840 cm-1) does not
consistently translate into an increase in short aliphatic carbon chains (1464 cm-1). In
contrast, there is a strong correlation between the overall organic composition within
a latent fingermark and the concentration of saturated esters (figure 18).
Absorb
ance C
H2 g
rou
p
Absorbance C-C-O band

61
4.4.3 GC-MS
Figure 21 shows the results of GC-MS analysis of the donor’s latent fingermarks. It is
a typical chromatogram of a fresh fingermark, note the presence of long chain fatty
acids known to be present in latent fingermarks [2, 7, 11, 17, 19, 35]. The most
commonly occurring being palmitic acid (base peak), dodecanoic acid, oleic acid and
stearic acid. Short chain fatty acids such as octanoic acid occurred less frequently, as
previously reported [7, 17, 20]. Squalene was observed in all samples analysed.
Cholesterol was only reliably observed in four of the twenty samples and at very low
concentration. The amino acid glycine was consistently observed in fourteen of the
twenty fresh fingermarks analysed.
Figure 21: A typical chromatogram of a latent fingermark from this study
Rela
tive A
bundance
Time (mins)
Chlorononane
Ste
aric a
cid

62
4.4.4 Relative Quantification
Results were quantified by calculating mean peak area ratio relative to an internal
standard, chlorononane (CN). Table 5 shows the seven most consistently identified
components of the donor’s fingermarks as a percentage of CN. As was consistent with
the results shown by FTIR spectroscopic imaging, the quantity of lipid deposits varied
considerably between samples.
Table 5: Average percentage quantities of the seven most consistently detected lipids
as compared to chlorononane (CN)
% Peak area ratios /chlorononane (CN)
Compound Glycine/CN Tetradecanoic
acid/CN
Palmitelaidic
acid/CN
Palmitic
acid/CN
Oleic
acid/CN
Steric
acid/CN squalene/CN
Mean % 0.023 0.073 0.067 1.38 0.21 0.16 1.07
standard
Dev. 0.12 0.44 0.47 0.86 0.17 0.11 0.37

63
Figure 22 shows a boxplot diagram of the relative quantities of the most abundant
compounds (tetradecanoic acid, palmitelaidic acid, palmitic acid, oleic acid, stearic
acid, glycine and squalene) relative to CN from all twenty samples. The graph shows
that palmitic acid is consistently present in the highest concentrations within the
sampled fingermarks, and with the broadest range from 0% to 2.33%. Squalene was
the next most abundant compound, with less variation but a broad upper range. The
consistent presence of squalene within each sample was observed in previous studies
[1, 2, 7, 10, 11, 21] and is a major reason why it is a crucial molecule for biometric
analysis, and estimating the time since deposition of a fingermark.
Figure 22: A boxplot diagram of the seven most abundant compounds found in the
twenty latent fingermarks from this study
% r
ela
tive t
o C
N

64
Figure 23 shows a chromatogram similar to that of figure 21 but with the base peak
being isopropyl myristate (8.27 min), not palmitic acid (9.32 min). Isopropyl myristate
(C17H34O2) is an oil not naturally produced by the body but a synthetic compound
similar to the naturally occurring fatty acid myristic acid (C14H28O2) and is used in a
number of cosmetics and moisturisers. This particular ester was present within a
moisturiser (Doublebase, Dermal Laboratories, UK) used by the donor.
Figure 23: A chromatogram of a fingermark containing the synthetic oil isopropyl
myristate.
Time (mins)
Rela
tive
ab
und
ance
Chlorononane G
lyce
rol este
r

65
This study aimed to look at the capabilities of FTIR spectromicroscopy as an imaging and
analytical tool for the analysis of latent fingermarks. FTIR spectroscopic data was also
compared to samples analysed by GC-MS, considered the gold standard for fingermark
analysis. The composition of latent fingermarks has been comprehensively studied using
GC-MS, and to a lesser extent using FTIR, but a direct comparison of the two techniques
has never been investigated.
The results obtained from both the GC-MS and FTIR analysis have demonstrated the
complimentary nature of these two techniques. Using FTIR spectroscopic imaging to
chemically map latent fingermarks visually demonstrated the intra-variability in
composition between fingermark samples (figure 16), and is consistent with the GC-MS
data in this study and from previous studies (figure 22) [2, 7, 11]. This variation between
samples from a single donor demonstrates the challenges of using latent fingermarks as
biomarkers for age and gender determination, and supports research carried out by
Asano et al. [6]. This study reported that analysis of fingermark composition for gender
determination was statistically insignificant due to the variability between fingermarks,
although more recent studies using MALDI-TOF-MS have had more success [37].
A further complicating factor in using latent fingermarks as biomarkers, as reported by
Mountfort et al. [21] and Archer et al. [7], is that squalene, and other lipids, [11] are prone
to shortening and oxidation over time. This oxidation results in the formation of
degradation products such as fatty acid esters, peroxides and hydroperoxides,
particularly in light conditions [7]. It is likely that over time the quantities of short-chain
fatty acids, such as pentandioic and hexandioic acid [11], within a fingermark (as well as
a number of intermediary oxidation products) will increase as components such as
triglycerides, unsaturated lipids and squalene continue to degrade. These dynamic
changes that occur within latent fingermarks post-deposition could confuse any attempts
to obtain accurate information about an individual from their endogenous fingermark
chemistry. However, the ratio of certain components to their degradation products, such
as the ratio of squalene (SQ) to SQ hydroperoxides, could perhaps be used to more
accurately estimate the time since deposition of a fingermark. FTIR spectroscopy alone
would, however, be unable to accurately detect these changes as many of the

66
degradation products are structurally similar to pre-existing components and would
therefore be lost within the same spectral regions.
This study demonstrated that there is a correlation between the concentration of the
antisymmetric & symmetric C-H stretch band of CH2 groups (2924 - 2840 cm-1), the
combination of all organic materials within a latent fingermark, and other functional
groups, namely -C=O stretch (1736 cm-1), -CH3 asymmetric bend (1464 cm-1), C-C-O
stretch (1180 cm-1). This correlation, however, was not as consistently significant as
would be expected (Figures 18-20). There was significant variation in the concentrations
of these functional groups when compared to the concentration of the antisymmetric &
symmetric C-H stretch band of CH2 groups. This suggests that an increase in the total
organic content of a latent fingermark does not necessarily correspond to an increase in
every component part of that fingermark. This also suggests that the CH2 band at 2924
cm-1 – 2840 cm-1 is comprised of more than just the organic molecules containing these
identifiable functional groups. This band therefore must contain other organic molecules
with no or very few functional groups, molecules which are effectively undifferentiable to
FTIR. For example, the presence of the metabolic steroid precursor squalene, a large
organic molecule (C30), consists entirely of C-H bonds and makes up approximately 10%
of sebaceous secretions [10]. Therefore, squalene will contribute significantly to the
antisymmetric and symmetric C-H stretch band at 2924-2840 cm-1. Due to the lack of any
other functional groups squalene will not affect the absorbance bands generated by
functional groups present in fatty acids, wax esters, sterols or glycerides. Cholesterol
(C27), making up about 2% of sebaceous secretions, will also contribute to the
antisymmetric and symmetric C-H bands in an FTIR spectrum, with only a minimal
influence on the OH stretch band at 3400 cm-1.
The FTIR data obtained in this study demonstrated that there is a stronger correlation
between the CH2 band at 2924 - 2840 cm-1 to the carbonyl (1740 cm-1) and C-C-O bands
(1246 cm-1), than that of the methyl groups (1464 cm-1). This stronger association is likely
due to the sample fingermarks in this study being donated by an adult. Esters contain
carbonyl groups, and it is known that fatty acids and wax esters increase during and after
puberty, and are found in higher concentrations in adult fingermarks [1, 9]. The weaker

67
correlation between the C-H stretch band at 2924-2840 cm-1 and the methyl asymmetric
bend is harder to explain and will need further investigation, as there is a higher proportion
of CH3 groups in adult sebum due to the more highly branched lipids, wax esters and
branched fatty acids [1].
Further investigation into the correlation between the CH2 band at 2924-2840 cm-1 and
other functional groups, such as the carbonyl or methyl bands, in adult and children’s
latent fingermarks could, when combined with other markers, produce an effective
presumptive identifier to differentiate these fingermarks at a crime scene. The ability to
quantify the concentrations of components such as fatty acids or wax esters within a
fingermark using GC-MS may allow for a better understanding of the contribution of these
compounds to the less defined antisymmetric and symmetric C-H stretch band in an FTIR
spectrum. With further research, this could be used to generate a more detailed model of
the overall molecular composition of these currently loosely defined bands. This, in turn,
would make any significant variations in the composition of these bands easier to identify.
In situ fingermarks found at a crime scene would vary considerably depending on the
grooming behaviour of the individual. The amount of contact with sebaceous secretions
on the face or neck would dramatically increase the concentrations of fatty acids, wax
esters, glycerides, sterols and sterol esters within the fingermark and would rarely be
consistent between different fingermarks even from the same individual, as this study has
shown. The addition of synthetic oils and lipids found in many cosmetics would compound
this variation between fingermarks even further. The use of a spectroscopic technique
such as FTIR cannot reliably distinguish between naturally occurring sebaceous
secretions and synthetic organic compounds found in cosmetics, but the presence of
these synthetic compounds could dramatically alter an FTIR spectrum [36]. The
identification of isopropyl myristate (a synthetic oil commonly used in moisturisers) by GC-
MS analysis in this study highlights this issue and demonstrates the advantages of an
orthogonal analytical technique in certain circumstances when analysing latent
fingermarks using FTIR spectroscopy.

68
4.5 Conclusion
This study has demonstrated both the benefits of using FTIR spectromicroscopy as an
orthogonal technology and its limitations as a stand-alone analytical tool. FTIR
spectroscopic imaging is capable of chemically and spatially identifying the functional
groups that make up a latent fingermark without destroying the sample. Chemical
mapping also visually demonstrated the variability in component concentration within
latent fingermark deposits, even from the same individual, and supported the GC-MS data
which showed broad quantifiable variation in composition within the sample fingermarks
analysed. FTIR analysis demonstrated that concentration ratios of certain functional
groups compared to the antisymmetric & symmetric C-H stretch band of CH2 groups
showed a correlation, but not always as strong as might be expected. With further
research, these ratios may enable the differentiation of children’s and adult’s fingermarks.
With a better understanding of chemical variations between latent fingermarks, FTIR
chemical imaging could potentially be used as a presumptive test to estimate the age of
a fingermark, as it is known that the composition of latent fingermarks varies depending
on time since deposition. FTIR spectroscopy can, however, only qualify the general
composition of a latent fingermark, and the variability in composition between
fingermarks. FTIR analysis cannot provide information on specific compounds such as a
specific fatty acid, and, unlike GC-MS, cannot reliably distinguish between naturally
occurring components that make up a latent fingermark and synthetic oils or lipids from
cosmetics that are present within that fingermark from grooming behaviour.

69
4.6 References
1. K.M. Antoine, S. Mortazavi, L.M. Miller, Chemical differences are observed in
children’s versus adults’ latent fingerprints as a function of time. J. Forensic Sci.
55 (2010) 513-518.
2. R.S. Croxton, M.G. Baron, D. Butler, T. Kent, V.G. Sears, Variation in amino acid
and lipid composition of latent fingerprints. Forensic Sci. Int. 199 (2010) 93-102.
3. S. Cadd, M. Islam, P. Manson, S. Bleay, Fingerprint composition and aging: A
literature review. Sci. Justice. 55 (2015) 219-238.
4. A. Girod, R. Ramotowski, C. Weyermann, Composition of fingermark residue: A
qualitative and quantitative review. Forensic Sci. Int. 223 (2012) 10-24.
5. M.J. Bailey, N.J. Bright, S. Hinder, Chemical characterization of latent fingerprints
by matrix-assisted laser desorption ionization, time-of-flight secondary ion mass
spectrometry, mega electron volt secondary mass spectrometry, gas
chromatography/mass spectrometry, X-ray photoelectron spec. Anal. Chem. 84
(2012) 8514-8523.
6. K.G. Asano, C.K. Bayne, K.M. Horsman, M.V. Buchanan, Chemical composition
of fingerprints for gender determination. J. forensic sci. 47 (4) (2002) 805–807.
7. N.E. Archer, Y. Charles, J.A. Elliott, S. Jickells, Changes in the lipid composition
of latent fingerprint residue with time after deposition on a surface. Forensic Sci.
Int. 154 (2005) 224-239.
8. C. Weyermann, C. Roux, C. Champod, Initial Results on the Composition of
Fingerprints and its Evolution as a Function of Time by GC/MS Analysis. J.
Forensic Sci. 56 (2011) 102-108.
9. M.V. Buchanan, K.G. Asano, A. Bohanon, Chemical Characterization of
fingerprints from adults and children. Int. Soc. Opt. Eng. 2941 (1996) 89-95.

70
10. R. Ramotowski, Composition of Latent Print Residues, in: Advanced in Fingerprint
Technology, 2nd Ed. (Lee. H, Gaensslen. R, eds.). London: CRC Press (2001
11. G.M. Mong, C.E. Petersen, T.R.W. Clauss, Advanced Fingerprint Analysis Project
- Fingerprint Constituents. Vol PNNL-13019. Pacific Northwest National
Laboratory: U.S. Department of Energy. (1999).
12. A. Koenig, A. Girod, C. Weyermann, Identification of wax esters in fingermark
residues by GC/MS and their potential use as aging parameters. J. Forensic
Identification. 61(6) (2011) 652-76.
13. S. Francese, R. Bradshaw, L.S. Ferguson, R. Wolstenholme, M.R. Clench, S.
Bleay, Beyond the ridge pattern: Multi-informative analysis of latent fingermarks by
MALDI mass spectrometry. Analyst. 138 (15) (2013) 4215-4228.
14. L. Ferguson, R. Bradshaw, R. Wolstenholme, M. Clench, S. Francese, Two-Step
Matrix Application for the Enhancement and Imaging of Latent Fingermarks.
Analytical Chemistry. 83 (14) (2011) 5585–5591.
15. R. Wolstenholme, S. Francese, R. Bradshaw, Study of lipid distribution and
degradation in latent fingerprints by spectroscopic imaging techniques. Science &
Justice. 50 (1) (2010) 37-38.
16. R. Bradshaw, W. Rao, R. Wolstenholme, M.R. Clench, S.Bleay, S. Francese,
Separation of overlapping fingermarks by matrix assisted laser desorption
ionisation mass spectrometry imaging. Forensic Sci Int. 222 (1–3) (2012) 318-326.
17. A. Girod, C. Weyermann, Lipid composition of fingermark residue and donor
classification using GC/MS. Forensic Sci Int. 238 (2014) 68-82.
18. R. Bradshaw, S. Bleay, R. Wolstenholme, M.R. Clench, S. Francese, Towards the
integration of matrix assisted laser desorption ionisation mass spectrometry
imaging into the current fingermark examination workflow. Forensic Sci Int. 232
(2013) 111-124.

71
19. B. Emerson, B. Durham, J. Gidden, J.O. Lay, Laser desorption/ionization time-of-
flight mass spectrometry of triacylglycerols and other components in fingermark
samples. J Forensic Sci. 56 (2) (2011) 381-389.
20. A.Y. Lim, J. Ma, Z. Ma, F. Rowell, Separation of fingerprint constituents using
magnetic silica nanoparticles and direct on-particle SALDI-TOF-mass
spectrometry. Journal of Chromatography B. 879 (23) (2011) 2244–2250.
21. K.A. Mountfort, H. Bronstein, N. Archer, S.M. Jickells, Identification of oxidation
products of squalene in solution and in latent fingerprints by ESI-MS and LC/APCI-
MS. Anal. Chem. 79 (2007) 2650-2657.
22. D. Noble, Vanished into thin air. The search for children’s fingerprints. Anal. Chem.
67 (1995) 435A-438A.
23. A. Banas, K. Banas, M.B. Breese, J. Loke, S.K. Lim, Spectroscopic detection of
exogenous materials in latent fingerprints treated with powders and lifted off with
adhesive tapes. Analytical & Bioanalytical Chemistry. 406 (17) (2014) 4173-81.
24. C. Ricci, N. Curum, K.L. Andrew Chan, S. Jickells, S. Kazarian, P. Phiriyavityopas,
Chemical Imaging of Latent Fingerprint Residues. Appl Spectrosc. 61 (2007) 514-
522.
25. T. Chen, Z.D. Schultz, I.W. Levin, Infrared spectroscopic imaging of latent
fingerprints and associated forensic evidence. Analyst. 134 (9) (2009) 1902-1904.
26. R.M. Connatser, S.M. Prokes, O.J. Glembocki, R.L. Schuler, C.W. Gardner, S.A.
Lewis, Toward Surface-Enhanced Raman Imaging of Latent Fingerprints Toward
Surface-Enhanced Raman Imaging of Latent Fingerprints. J. Forensic Sci. 55 (6)
(2010) 1462–1470.
27. N.J. Crane, E.G. Bartick, R.S. Perlman, S. Huffman, Infrared spectroscopic
imaging for noninvasive detection of latent fingerprints. J. Forensic Sci. 52 (2007)
48-53.

72
28. P. Fritz, W. van Bronswjik, K. Lepkova, Infrared microscopy studies of the chemical
composition of latent fingermark residues. Microchem. J. 111 (2013) 40-46.
29. A. Hemmila, J. McGill, D. Ritter, Fourier transform infrared reflectance spectra of
latent fingerprints: a biometric gauge for the age of an individual. J. Forensic sci.
53 (2) (2008) 369–376.
30. P.H.R. Ng, S. Walker, M. Tahtouh, B. Reedy, Detection of illicit substances in
fingerprints by infrared spectral imaging. Anal. Bioanal. Chem. 394 (2009) 2039.
31. M. Tahtouh, J.R. Kalman, C. Roux, B.J. Reedy, C. Lennard, The detection and
enhancement of latent fingermarks using infrared chemical imaging. J Forensic
Sci. 50 (1) (2005) 64-72.
32. M. Tahtouh, P. Despland, R. Shimmon, J.R. Kalman, B.J. Reedy, The Application
of Infrared Chemical Imaging to the Detection and Enhancement of Latent
Fingerprints: Method Optimization and Further Findings. J. Forensic Sci. 52 (2007)
1089-1096.
33. D.K. Williams, R.L. Schwartz, E.G Bartick, Analysis of Latent Fingerprint Deposits
by Infrared Microspectroscopy. Appl. Spectrosc. 58 (2004) 313-316.
34. D.K. Williams, C.J. Brown, J. Bruker, Characterization of children’s latent
fingerprint residues by infrared microspectroscopy: Forensic implications. Forensic
Sci. Int. 206 (2011) 161-165.
35. R. Wolstenholme, R. Bradshaw, M.R. Clench, S. Francese, Study of latent
fingermarks by matrix-assisted laser desorption/ionisation mass spectrometry
imaging of endogenous lipids. Rapid Commun. Mass Spectrom. 23 (2009) 3031-
3039.
36. C. Ricci, S.G. Kazarian, Collection and detection of latent fingermarks
contaminated with cosmetics on nonporous and porous surfaces. Surf. Interface
Anal. 42 (5) (2010) 386-392.

73
37. L. Ferguson, F. Wulfert, R. Wolstenholme, Direct detection of peptides and small
proteins in fingermarks and determination of sex by MALDI mass spectrometry
profiling. Analyst. 137 (2012) 4686 - 4692

74
CHAPTER 5. PAPER TWO
(Published in Applied Spectroscopy, 71 (9) (2017) (2102 – 2110)
The effect of moderate temperatures on latent fingerprint chemistry
Authors
Andrew Johnston1, Keith Rogers1
1Cranfield University, The Defence Academy of the United Kingdom, Shrivenham, SN6 8LA
5.1 Abstract
The effect of moderate temperatures (25oC - 75oC) on latent fingerprints over a 5-hour
period was examined using Fourier Transform Infrared (FTIR) microspectroscopy. The
aim of the study was to detect changes in IR spectra due to any changes in fingerprint
chemistry, these results were then compared to pure compounds found in sebum which
were subjected to 75oC for 5 hours. Latent fingerprints deposited on CaF2 microscope
slides and placed on a Peltier pump heating stage showed that higher temperatures
significantly reduced the quantity of sebaceous compounds after 5 hours, whereas
temperatures below 45oC had little effect on the quantity of these compounds over the
same time period. FTIR microspectroscopy allowed for the real time detection of changes
to the IR spectra and demonstrated an increase in the OH stretch band (3250 cm-1) over
5 hours at all temperatures investigated, suggesting various oxidation processes were
taking place. Pure samples analysed included squalene, fatty acids, wax esters and
mixed triglycerides. Unsaturated lipids showed a similar increase in the OH stretch band
to the latent fingerprints whereas saturated compounds showed no change over time.
This information is required to better understand the effect of moderate temperatures on
latent fingerprints and how these temperatures could affect aged print composition.
Keywords
Fingerprints, Fourier transform infrared microspectroscopy, aging, thermal degradation,
decomposition, oxidation

75
5.2 Introduction
The chemical degradation of latent fingerprints post-deposition is of great interest to the
forensic community. It is well documented that the chemistry of latent fingermarks
changes temporally in both adults and children [1-4]. These changes not only affect
visualisation techniques [5-7], some being more effective than others on aged
fingermarks, but also may potentially provide the basis for an aging tool to establish time
since deposition.
The chemical components of a latent fingerprint have been well documented using a
variety of analytical techniques [8, 9] but the chemical changes that occur over time are
less well understood. Previous studies have shown that there are changes in fingerprint
chemistry over time and under different conditions. Temporal decomposition [10-15]
appears to involve the shortening and degradation of unsaturated lipids including fatty
acids, wax esters, triglycerides, and squalene due to various oxidation processes [16-20].
In contrast, saturated lipids stay relatively stable over longer time periods (>60 days) [20].
A change in unsaturated fatty acids has been observed over time, decreasing significantly
over a thirty-day period [12, 20]. This is due to the unsaturated moiety degrading through
both aerobic and anaerobic processes and increasing the proportion of saturated
compounds [20].
Exposure to light also has a significant impact on fingerprint composition. Studies have
shown that exposure to light affects the breakdown mechanisms of various components
within fingerprint deposits differently and more rapidly than in dark conditions. Short chain
fatty acids and squalene in particular were affected by exposure to light conditions [12].
Squalene (SQ) degradation is supported by the identification of various photo-oxidation
mechanisms that produce intermediary products including peroxides, hydroperoxides and
SQ epoxide and the fully oxidised forms being hexanedioic and pentanedioic acid [19,
20]. These products are particularly prevalent when squalene is exposed to UV radiation,
such as direct sunlight [19-21].
Studies into the temporal changes within latent fingerprints, and exposure to light & dark
conditions over time are numerous and have indicated the complex nature of latent
fingerprint chemistry. Studies into the effects of other environmental conditions on

76
fingerprint chemistry, such as temperature, are also prevalent but these pyrolytic
degradation studies mostly examine the effect of extreme temperatures (>150oC) from
exposure to fires, Improvised Explosive Device (IED) detonations or spent ammunition
cartridges [6, 7, 22-25]. Studies into the effects of more moderate temperature variations
on latent prints (from room temperature to 80oC) are more limited but did demonstrate a
general decrease in lipid components [26]. In contrast to previous studies, detailed
examination of moderate temperature effects (25oC -75oC) could provide significant
information into the natural aging processes that occur within latent fingerprints.
Fourier transform infrared (FTIR) spectromicroscopy is becoming a recognised tool for
forensic research applications. Previous studies have utilised IR techniques to
successfully identify the key components of latent fingerprints [10, 15, 26–29], and FTIR
is ideally suited to the analysis of latent prints due to its non-destructive nature and
specificity in identifying functional groups in organic compounds. FTIR microspectroscopy
has proven to be a powerful tool in monitoring temporal changes in latent fingerprints as
specific sample areas can be repeatedly analysed over the duration of an experiment [26,
27].
The aim of this study was to investigate the immediate effects of elevated temperatures
(25oC to 75oC) on the organic compounds within latent fingerprints from 0 to 5 hours since
deposition. Given the known oxidation processes that occur post-deposition of a latent
print, this study also aimed to analyse any changes in the IR spectra that could allude to
these processes taking place within the first few hours post-deposition. The work was
strengthened through the examination of temperature effects on individual chemical
components found within latent fingerprints thus enabling a more robust interpretation of
observed changes. The compounds selected were either the most abundant in their
group, e.g. serine shown to be the most abundant amino acid [30-32, 37], or known to
have a significant effect on fingerprint degradation, i.e. squalene [16-21]. The individual
components investigated were the steroid precursor squalene, the fatty acids palmitic
acid (saturated), and linoleic acid (polyunsaturated), the amino acid serine, the ester
myristyl myristate, and mixed saturated and unsaturated triglycerides. These compounds
were selected to crudely represent the major components within a latent fingerprint and

77
as a representative for each of the essential functional groups under investigation in this
study.

78
5.3 Experimental
5.3.1 Sample preparation
All sample fingerprints were obtained from a single donor (a single donor was used for
this small scale study to maintain a relative consistency between samples, thus any
notable observations were likely to be from the variations in temperature and not simply
the inter-variability between fingerprints from multiple donors). Hands were first washed
and dried thoroughly. The index finger was then drawn from the bridge of the nose, under
the eye to the temple ten times to collect sebaceous secretions and to simulate natural
grooming behaviour, and placed directly onto a CaF2 Infrared (IR) microscope slide
(10mm x 10mm, Crystran Ltd). All prints were deposited between 9am and 10am to avoid
significant diurnal variations in composition of the latent prints. For each print the same
index finger was used. All fingerprints were destroyed at the end of each day and the
process repeated for each additional print, this ensured prints were fresh and analysis
was not of inadvertently aged prints.
5.3.2 Heating of fingerprints
Once the prints were deposited onto the CaF2 slides they were placed onto a hollowed
out Peltier pump heat stage and placed under the FTIR microscope. The temperatures
investigated were 25oC, 35oC, 45oC, 55oC, 65oC, and 75oC. Five prints were analysed at
each temperature, five deposits were selected for analysis per print, and spectra were
acquired every hour for five hours at relative humidity.
5.3.3 FTIR microspectroscopy
The latent fingerprints were analysed using a PerkinElmer SpectrumTM Spotlight 200 FTIR
imaging System equipped with a liquid-nitrogen cooled MCT linear array detector. Data
was analysed using Perkin Elmer software, Spectrum® (v10.02.00), variations in spectra
were processed using peak area calculations. Spectra from fingerprint deposits were
collected in transmission mode, the IR beam passing through the slide and the hollowed
centre of the heat stage, within 4000 to 750 cm-1 spectral range with 10 scans per pixel
at 4 cm-1 spectral resolution and 10 µm spatial resolution, using a 100 x 100 µm aperture.

79
5.3.4 Pure sample preparation
Squalene ≥98% (Sigma Aldrich, UK), linoleic acid ≥99% (Sigma Aldrich, UK), serine ≥99%
(Sigma Aldrich, UK), myristyl myristate ≥99% (Sigma Aldrich, UK) and mixed saturated
and unsaturated triglycerides ≥98% (100 mg triacetin, tributyrin, tricaproin, tricaprylin,
tricaprin, all equal amounts by weight) (Sigma Aldrich, UK). 10 µL of the pure compound
was pipetted onto a CaF2 slide and analysed in an identical way to the latent fingerprints
at 75oC for 5 hours. Analysis at this temperature allowed for a definitive indication as to
whether these compounds were susceptible to thermal degradation.

80
5.4 Results and Discussion
Before any fingerprints were subjected to heat treatment a control spectrum was obtained
from each print. Figure 24 shows a typical FTIR spectrum of a fresh fingerprint from this
study, the key peaks ranging from 3000 cm-1 to 1100 cm-1.
Figure 24: A typical FT-IR spectrum of a fresh fingerprint from the study subject
This study predominantly focused on variations in quantity of sebaceous materials at
different temperatures. These sebaceous compounds correspond to the 2920 cm-1 and
2854 cm-1 antisymmetric and symmetric C-H stretching modes of CH2 groups, the C=O
stretch of lipids (1741 cm-1), the scissoring mode of CH2 groups and antisymmetric C-H
bending mode of CH3 groups (1463 cm-1), the CH3 symmetric bend (1380 cm-1), the C-C-
O stretch (1160 cm-1), and the O-C-C stretch (1111 cm-1). Variations in quantity of eccrine
secretions were also analysed, amide bonds of peptides and proteins were observed
corresponding to the amide I band (1655 cm-1), and amide II band (1545 cm-1) of
secondary amides. The broad O-H stretch band (3250 cm-1) was also observed. It is
changes to these sebaceous and eccrine absorption bands that correspond to changes
in quantity of the related functional groups and therefore the compounds over time.
Ab
so
rba
nce
cm-1

81
5.4.1 Thermally degraded fingerprints
Analysis of fingerprints exposed to moderate temperatures indicates significant changes
in composition over time.
This study showed a significant reduction in absorbance, and therefore material, of all the
key functional groups over the five hours at 75oC, 65oC, 55oC with the exception of the
amide bands, but no significant reduction at the lower temperatures of 45oC, 35oC, and
25oC (figures 25 and 26).
Figure 25: Absorbance spectra of latent fingerprints as a function of time and temperature
for 75oC, 55oC, and 25oC.

82
This suggests that at the higher temperatures the more volatile sebaceous substituents
are degrading rapidly, but at the lower temperature (45oC, 35oC, 25oC) there is less
degradation over this short time period, certainly at 35oC and 25oC there is no observable
change in absorbance between the control and after 5 hours (see Appendix A2 for visual
comparisons).
Figure 26: Changes in average IR absorbance of key functional groups over time at 75oC,
55oC, and 25oC. A reduction in material at temperatures at 55oC and above, with the
exception of the OH group which increased. At 45oC and below there was no reduction in
composition over the 5 hours, but the OH stretch region increased at all temperatures (n =
25, error bars represent standard error of the mean)

83
This is to be expected given the far longer time periods required for temporal degradation
as observed in the studies mentioned previously, all being performed at room
temperature. The reduction in sebaceous material at higher temperatures is understood
to be due to the degradation through oxidation of lower molecular weight, volatile
unsaturated lipids, including unsaturated fatty acids, triglycerides as well as squalene [12,
19, 20]. Squalene has been reported to breakdown rapidly in aged fingerprints reducing
in quantity within a day and being almost entirely undetectable within one week [19], and
this process it likely to be accelerated at elevated temperatures.
Figure 27 shows the rate of change in absorbance for the 2920 cm-1 and 2854 cm-1 C-H
stretching modes of CH2 groups at all six temperatures.
Figure 27: Rate of change of the C-H stretch band absorbance at 75oC, 65oC, 55oC, 45oC,
35oC, and 25oC (n = 25, error bars represent standard error of the mean)
Samples heated to between 45-75oC show a significant decrease in C-H absorbance
meaning a reduction in material, the fastest reduction in absorbance being at the highest
temperatures. The slight increase in the C-H stretching band at 35oC and 25oC could be
an indication of an initial increase in short chain saturated fatty acids as identified in
previous studies [12], which at higher temperatures evaporate off due to their volatility.
The lack of change in the amide I and II bands (Figure 26) is unsurprising given previous
research demonstrating that these compounds do not seemingly undergo any significant

84
photo-degradation over time and thermal degradation is only seen with temperatures in
excess of 100oC [25].
Most notable in this study was the significant increase in absorbance of the OH stretch
band (3250 cm-1) across all temperatures. This is in contrast to previous temporal
degradation studies that indicate a decrease in OH absorbance over time [15] thought
primarily to be due to a loss of water through evaporation over periods as long as six
weeks.
The rapid oxidation of sebaceous compounds such as unsaturated fatty acids, squalene
and glycerides could account for the increase of the OH stretch absorption band. Even
accounting for water loss, the net gain being the formation of these hydroxide functional
groups due to oxidation mechanisms forming acids, alcohols, and hydroperoxides [12,
19, 20]. This data suggests that the activation energies required for these processes are
below 25oC as there was no statistical relationship between rate of change for the
increase in the OH stretch band over time and temperature. Given the previously reported
rapid degradation of sebaceous compounds such as squalene and certain unsaturated
fatty acids, it is likely that these processes require a low activation energy for oxidation to
occur. Although the temperatures tested in this study do not influence the rate of change
of the OH absorption band, higher temperatures (65oC and 75oC) do appear to limit the
quantity of hydroxide functional groups being formed when compared to lower
temperatures (Figure 26). This is most likely to be due to a more rapid loss of water at
these higher temperatures as well as a loss of the more volatile organic compounds.

85
5.4.2 Pure compounds
If specific sebaceous secretions are responsible for these oxidation processes and the
resulting increase in the OH stretch band of the IR spectra, it is important to identify which
compounds within these secretions are the main contributors to this change. As
mentioned above previous studies have demonstrated that certain unsaturated lipids
decompose rapidly and could therefore contribute to the increase in absorbance of the
OH stretch band at 3250 cm-1. This study looked at the major components of a latent
fingerprint to identify which pure compounds, such as squalene, or compound groups,
such as fatty acids, most readily decomposed and contributed to the increase in
absorbance of the OH band. Compounds primarily found in sebaceous secretions were
selected, namely squalene, palmitic acid (saturated fatty acid), linoleic acid
(polyunsaturated fatty acid), myristyl myristate (wax ester), and mixed triglycerides, as
well as the amino acid serine, an eccrine secretion. Figure 28 shows example spectra of
the changes in the OH stretch band over time for squalene.
Figure 28: Infrared spectra of the 3250 cm-1 OH-stretch band of pure squalene heated to
75oC for 5 hr

86
Of the six compound groups investigated in this study (Figure 29), squalene, the mixed
triglycerides and linoleic acid showed significant changes in the OH stretch region at 3250
cm-1. Serine, palmitic acid and myristyl myristate showed no significant changes over the
duration of the experiment. This data suggests that thermal degradation processes impact
unsaturated sebaceous compounds significantly, but not saturated sebaceous
compounds or amino acids.
Figure 29: The increase in OH absorbance band (3250 cm-1) of SQ, mixed triglycerides,
myristyl myristate, serine, palmitic acid, and linoleic acid at 75oC over 5h, demonstrating
oxidation processes taking place in unsaturated compounds (n = 20, error bars represent
standard error of the mean)
0.0

87
The increase in the OH stretch region at 3250 cm-1 of squalene supports previous studies
reporting the rapid oxidation of this compound to produce intermediaries such as alcohols,
mono- and polyhydroperoxides, epoxides and finally hexanedioic acid and pentanedioic
acid. The mixed triglycerides analysed showed an increase in the OH stretch band over
the 5 hours, indicating degradation processes in action, although not to the same extent
as squalene (Figure 29). Some previous research has suggested possible triglyceride
degradation mechanisms resulting in both saturated and unsaturated fatty acids [33, 34],
the unsaturated fatty acids then likely go through further oxidation thus continuing to
increase the OH band. In a latent fingerprint it is likely that triglyceride degradation
processes would be increased due to the presence of cholesterol which has been shown
to affect triglyceride decomposition [34]. Of the fatty acids (FA) analysed, linoleic acid
(Figure 29), a polyunsaturated FA, showed a rapid initial increase in the OH stretch region
in the first hour, then little change over the remaining four hours. This suggests rapid
oxidation occurring on this unsaturated compound perhaps, as previously proposed, to
produce fatty acid peroxides through aerobic degradation [20, 35]. It is worth
remembering however that polyunsaturated FA’s only make up ~2% of sebaceous
secretions [17, 36] so it is unlikely that these compounds would have a significant effect
on the increase of the OH stretch band of a latent fingerprint. Monounsaturated FA’s
would also degrade aerobically however and they make up ~48% of sebum [17, 36]. The
OH stretch band of palmitic acid, a saturated fatty acid, showed no significant variation in
this study, this is consistent with temporal degradation studies reporting that C16 FA’s
such as palmitic acid remain relatively stable over a 60-day period [20]. The OH stretch
band of myristyl myristate also showed no significant changes over the duration of this
study, again consistent with previous studies showing that these saturated lipids are not
significantly affected by temporal degradation due to a lack of functional groups prone to
degradation [17]. Serine, the only non-sebaceous compound analysed in this study
showed no correlation between temperature and changes in the OH stretch region. As
mentioned above previous studies have shown that significant thermal degradation of
amino acids occurs at 100oC and higher [24, 25] due to their low volatility, so it is not
surprising that there were no significant changes in the 3250 cm-1 OH stretch band in this
study.

88
5.5 Conclusions
The research presented within this paper suggests that the oxidation processes that occur
during thermal degradation of latent fingerprints could be similar if not identical to that of
temporal aging at a constant ambient temperature as shown in previous studies [12, 16,
19, 20], but at a faster rate. It is reasonable to assume that latent fingerprints at a crime
scene would be subject to varying diurnal temperatures from the time of deposition to the
time of analysis by law enforcement agencies, varying from hours to days. This study
demonstrates the dynamic nature of chemical decomposition within a fingerprint after just
a few hours, higher temperatures causing more rapid degradation
of the unsaturated and volatile lipids, which could impact crime scene work. Developing
fingerprints that have been exposed to higher diurnal temperatures could be more
challenging, particularly when using those developing agents that rely on lipophilic
interactions. Further work is required to investigate the extent and consistency of these
degradation processes using multiple donors to identify trends in decomposition, as well
as the effect of different substrates on fingerprint chemistry. Future studies to
better understand the degradation products that are likely to occur at
varying temperatures could lead to better development techniques, more suited to prints
subjected to higher diurnal temperatures.
The pure materials analysed in this study translate to the compounds involved
in the degradation processes of natural fingerprints. The analysis of pure samples that
are present in sebum showed that squalene in particular, but also triglycerides and
mono/poly-unsaturated fatty acids, are most likely to be the cause of an increase in the
OH stretch band at 3250 cm-1 over time, this is likely to be due to various intermediary
and complete oxidation processes. Future work accounting for individual variability would
provide a better understanding of the interactions between these compounds and how
each component affects the stability of the other.
89
5.6 References
1. M.V. Buchanan, K. Asano, A.I. Bohanon. Chemical characterization of
fingerprints. SPIE, Forensic Evidenc Anal Crime Scene Investig. 1997. 2941:89-
95.
2. D.K. Williams, C.J. Brown, J. Bruker. Characterization of children’s latent
fingerprint residues by infrared microspectroscopy: Forensic implications.
Forensic Sci Int. 2011. 206(1-3):161-165.
3. D. Noble. Vanished into thin air: The search for children’s fingerprints. Anal
Chem. 1995. 67(13):435A-438A.
4. K.M. Antoine, S. Mortazavi, L.M. Miller. Chemical differences are observed in
children’s versus adults’ latent fingerprints as a function of time. J. Forensic Sci.
2010. 55(2):513-518.
5. K. Sampson, W. Sampson. Recovery of Latent Prints from Human Skin. J.
Forensic Identif. 2005. 55(3):362-385.
6. A.G. Brown, D. Sommerville, B.J Reedy, R.G Shimmon, M. Tahtouh. Revisiting
the thermal development of latent fingerprints on porous surfaces: new aspects
and refinements. J. Forensic Sci. 2009. 54(1):114-121.
7. A. Dominick, N. Nicdaeid, S. Bleay, V. Sears. The recoverability of fingerprints
on paper exposed to elevated temperatures -Part 1: comparison of
enhancement techniques. J. Forensic Identif. 2010. 59(3):325-339.
8. S. Cadd, M. Islam, P. Manson, S. Bleay. Fingerprint composition and aging: A
literature review. Sci Justice. 2015. 55(4):219-238.
9. M.J. Bailey, N.J. Bright, S. Hinder et al. Chemical characterization of latent
fingerprints by matrix-assisted laser desorption ionization, time-of-flight
secondary ion mass spectrometry, mega electron volt secondary mass
spectrometry, gas chromatography/mass spectrometry, X-ray photoelectron
spec. Anal Chem. 2012. 84(20):8514-8523.

90
10. A. Girod, L. Xiao, B. Reedy, C. Roux, C. Weyermann. Fingermark initial
composition and aging using Fourier transform infrared microspectroscopy (μ-
FTIR). Forensic Sci Int. 2015. 254:185-196.
11. F. Cuthbertson, J.R. Morris. The Chemistry of Fingerprints, AWRE Report No.
013/69, Atomic Energy Authority, U.K., 1969.
12. N.E. Archer, Y. Charles, J.A. Elliott, S. Jickells. Changes in the lipid composition
of latent fingerprint residue with time after deposition on a surface. Forensic Sci
Int. 2005. 154(2-3):224-239.
13. R.S Croxton, M.G. Baron, D. Butler, T. Kent, V.G Sears. Variation in amino acid
and lipid composition of latent fingerprints. Forensic Sci Int. 2010. 199:93-102.
14. A. Girod, R. Ramotowski, C. Weyermann. Composition of fingermark residue: A
qualitative and quantitative review. Forensic Sci Int. 2012. 223(1-3):10-24.
15. P. Fritz, W. van Bronswjik, K. Lepkova et al. Infrared microspectroscopy studies
of the chemical composition of latent fingermark residues. Microchem J. 2013.
111:40-46.
16. C. Weyermann, C. Roux, C. Champod. Initial Results on the Composition of
Fingerprints and its Evolution as a Function of Time by GC/MS Analysis. J.
Forensic Sci. 2011. 56(1):102-108.
17. R. Ramotowski. Composition of Latent Print Residues, in: Advanced in
Fingerprint Technology, 2nd Ed. (Lee. H, Gaensslen. R, eds.). London: CRC
Press. 2001.
18. R. Wolstenholme, R. Bradshaw, M.R. Clench, S. Francese. Study of latent
fingermarks by matrix-assisted laser desorption/ionisation mass spectrometry
imaging of endogenous lipids. Rapid Commun Mass Spectrom. 2009.
23(19):3031-3039.

91
19. K.A. Mountfort, H. Bronstein, N Archer, S.M. Jickells. Identification of oxidation
products of squalene in solution and in latent fingerprints by ESI-MS and
LC/APCI-MS. Anal Chem. 2007. 79(7):2650-2657.
20. G.M. Mong, C.E. Petersen, T. Clauss. Advanced Fingerprint Analysis Project -
Fingerprint Constituents. Vol PNNL-13019. Pacific Northwest National
Laboratory: U.S. Department of Energy. 1999.
21. M. Picardo, C. Zompetta, C. De Luca et al. Squalene peroxides may contribute
to ultraviolet light-induced immunological effects. Photodermatol Photoimmunol
Photomed. 1991. 8(3):105-110.
22. C.M. Girelli, B.J.M. Lobo, A.G. Cunha, J.C.C. Freitas, F.G. Emmerich.
Comparison of practical techniques to develop latent fingermarks on fired and
unfired cartridge cases. Forensic Sci Int. 2015. 250:17-26.
23. W.W. Harper. Latent Fingerprints at High Temperatures. J. Crim Law Criminol.
1938. 29(4):580-583.
24. A. Richmond-Aylor, S. Bell, P. Callery, K. Morris. Thermal degradation analysis
of amino acids in fingerprint residue by pyrolysis GC-MS to develop new latent
fingerprint developing reagents. J. Forensic Sci. 2007. 52(2):380-382.
25. G. De Paoli, S.A. Lewis, E.L. Schuette, L.A. Lewis, R.M. Connatser, T. Farkas.
Photo- and thermal-degradation studies of select eccrine fingerprint
constituents. J. Forensic Sci. 2010. 55(4):962-969.
26. C. Ricci, P. Phiriyavityopas, N. Curum, K.L. Andrew Chan, S. Jickells, S.
Kazarian. Chemical Imaging of Latent Fingerprint Residues. Appl Spectrosc.
2007. 61(5):514-522.
27. D.K. Williams, R.L. Schwartz, E.G. Bartick. Analysis of Latent Fingerprints
Deposits by Infrared Microspectroscopy. Appl Spectrosc. 2004;58(3):313-316.
28. N.J. Crane, E.G. Bartick, R.S. Perlman, S. Huffman. Infrared spectroscopic
imaging for noninvasive detection of latent fingerprints. J Forensic Sci.
2007;52(1):48-53.

92
29. A. Hemmila, J. McGill, D. Ritter. Fourier transform infrared reflectance spectra
of latent fingerprints: a biometric gauge for the age of an individual. J. Forensic
Sci. 2008;53(2):369-376.
30. B. Hadorn, F. Hanimann, P. Anders, H. Curtius, R. Halverson. Free Amino-acids
in Human Sweat from Different Parts of the Body. Nature. 1965. 215(99):416-
417.
31. P. Hamilton. Amino-acids on Hands. Nature. 1965. 205:284-285.
32. J. Oro, H. Skewes. Free Amino-Acids on Human Fingers: The Question of
Contamination in Microanalysis. Nature. 1965. 207(1):1042-1045.
33. A. Srivastava, R. Prasad. Triglycerides-based diesel fuels. Renew Sust Energy
Rev. 2000. 4(2):111-113.
34. L. Iuliano. Pathways of cholesterol oxidation via non-enzymatic mechanisms.
Chem Phys Lipids. 2011. 164(6):457-468.
35. B.B. Dent, S.L. Forbes, B.H. Stuart. Review of human decomposition processes
in soil. Environ Geol. 2004. 45(4):576-585.
36. A. Girod, C. Weyermann. Lipid composition of fingermark residue and donor
classification using GC/MS. Forensic Sci Int. 2014. 238:68-82.
37. T. Atherton, R. Croxton, M. Baron, J. Gonzalez-Rodriguez, L. Gámiz-Gracia,
A.M. García-Campańa. Analysis of amino acids in latent fingerprint residue by
capillary electrophoresis-mass spectrometry. J. Sep Sci. 2012. 35:2994-2999.

93
CHAPTER 6. PAPER THREE
(Published in Science and Justice, 58 (2) (2018) (121-127)
A study of the intermolecular interactions of lipid components from
analogue fingermark residues.
Authors
Andrew Johnston1, Keith Rogers1
1Cranfield University, The Defence Academy of the United Kingdom, Shrivenham, SN6 8LA
6.1 Abstract
A compositionally simplified analogue of a latent fingermark was created by combining
single representatives of each major component of a natural fingermark. Further modified
analogues were also produced each having one component removed. The aim of this
study was to investigate the intermolecular interactions that occurred within these
analogue samples using Fourier Transform Infrared (FTIR) spectroscopy. FTIR
spectroscopy showed that the absence of squalene and cholesterol significantly restricted
the interactions between the other organic constituents within the analogue samples.
Investigating the intermolecular interactions of organic compounds within a simplified
analogue solution could indicate corresponding interactions that occur within natural
fingermarks. These potential interactions could go on to be the target of further
investigation of latent fingermark chemistry, and ultimately contribute to a better
understanding of the aging processes and degradation mechanisms that take place post-
deposition.
Keywords
Latent fingermarks, analogue, lipids, decomposition, squalene, chlolesterol.

94
6.2 Introduction
The dynamic nature of fingermark chemistry post-deposition is a complex process, yet of
great interest to the forensic community. Numerous studies have examined the aging of
fingermarks, the oxidation mechanisms that take place, both short and long term [1, 2],
and the resulting end products [2-5], [8-12]. However, an in-depth understanding of
fingermark degradation processes remains limited. Various studies have investigated the
breakdown of key components within a fingermark such as squalene [1–3], [9], fatty acids
[2-5, 7], cholesterol [4], [9–11], [14], and amino acids [13,15,16], although very little
research has studied the intermolecular interactions between these constituents and their
impact on each other. Ultimately, a better understanding of these intermolecular
interactions within a fingermark will allow for improved modelling of the fingermark aging
process.
Cholesterol and its oxidation products have a significant effect on the decomposition of
triglycerides and fatty acids [10], indicating that lipid stability is influenced by these
intermolecular interactions within latent fingermarks. Auto-oxidation, oxidation in the
absence of enzymatic catalysis, of cholesterol by free radicals and hydroperoxides to form
oxysterols is an established degradation mechanism [10], although evidence of these
oxidation products are yet to be found in latent fingermarks. It has also been shown that
the decomposition of cholesterol can be accelerated by both triglycerides and fatty acids
[11], [17], [18]. This suggests a form of positive feedback wherein cholesterol affects the
decomposition of triglycerides resulting in a mixture of saturated and unsaturated fatty
acids [6]. This increase in fatty acid concentration could then increase the rate of
decomposition of cholesterol.
Squalene is an unsaturated steroid precursor that has received a great deal of attention
in previous studies of fingermark degradation mechanisms and the aging of fingermarks
[1–3], [9], [12]. In latent fingermarks squalene degrades rapidly over time through direct
oxidation and photo-oxidation mechanisms. Measurable reductions in concentration can
be demonstrated within 24 hours following deposition and it is almost undetectable after
a week [1]. Although this degradation is dependent on light conditions as squalene can
still be detected in fingermarks up to 33 days after deposition when stored in the dark [3].

95
During degradation various intermediary and complete oxidation products have
previously been identified [1, 2]. Of particular note is the formation of various
hydroperoxides as squalene decomposes through direct oxidation. These
hydroperoxides then undergo thermolysis with homolytic scission of the peroxide bond,
yielding hydroxyl radicals [18]. Both hydroperoxides and free radicals, such as hydroxyl
radicals produced from squalene degradation, would then impact cholesterol breakdown
and impact the degradation of triglycerides and fatty acids.
This investigation utilised Fourier transform infrared (FTIR) microspectroscopy, a
recognised tool for forensic research applications. Previous studies using IR techniques
have successfully identified the key components of latent fingermarks [19-25]. FTIR
spectroscopy is ideally suited to the analysis of latent fingermarks due to its non-
destructive nature and specificity in identifying functional groups in organic compounds.
Of particular relevance to this study FTIR spectroscopy lends itself to studying the
intermolecular interactions within fingermarks as a major contributor to IR band width is
the strength of intermolecular interactions. Broader peaks being a function of stronger
intermolecular interactions over a wider range and therefore a large number of energy
states.
The antisymmetric and symmetric C-H stretch of the CH2 groups at 2920 – 2850 cm-1
within a fingermark are not truly decoupled due to the slight variation in chemical
environment of the differing species present. Intermolecular forces such as hydrogen
bonding, dipole/dipole interactions, and London Dispersive Forces all combine to
increase organic molecular interactions [26-32]. These interactions will dictate the rate of
reaction and therefore the molecular decomposition in the presence of (in particular) long
chain unsaturated species. These intermolecular interactions affect the range of
vibrational modes of the C-H stretch region of CH2 groups, increasing variations in bond
distance and changing the spring constant [31-35]. The more intermolecular interactions
occurring the broader the antisymmetric and symmetric vibrational modes and the
coupling effect visible on the spectrum (figure 30). Fewer intermolecular interactions
perturb the range of vibrational modes of the C-H stretch band at 2920 – 2850 cm-1,

96
minimising the coupling effect of the antisymmetric and symmetric C-H peaks, therefore
producing two distinct peaks at 2920 – 2850 cm-1.
Figure 30: Coupling effect of the antisymmetric and symmetric C-H stretch of CH2 group
The aim of this study was to generate a simplified chemical analogue of a fingermark,
comprised of a single representative of the major components, in order to better
understand the interactions between these compounds. Studying these intermolecular
interactions could ultimately enable a better understanding of their effect on the aging of
fingermarks post-deposition. Once an acceptable analogue was developed and the IR
spectra compared to that of sebaceous-loaded fingermarks, further analogues were
developed, each with one component removed, and IR spectra were then obtained. This
allowed assessment of how this removed component affected the interactions of the
others.
Replicates of latent fingermarks have previously been developed for both research and
commercial purposes [5, 36, 37] to provide a ‘standardised’ deposition model, and with
more complexity than the analogue samples developed for this study. The objective of
this study however was not to create a complete replicate of a latent fingermark, but to
deliberately develop a much simplified composition that allowed for fundamental analysis
of any critical intermolecular interactions that may occur. More complex replicates
involving hundreds of compounds would have made analysis of specific intermolecular
Absorb
ance
cm-1

97
interactions near impossible, or at least far less conclusive. Another reason why such a
simplified composition was used in this study was because, as stated previously [37],
synthetic solutions can behave differently to natural fingermarks, and the more complex
the solution the more potential there is for inconclusive variability in the results.
A primary use for replicate solutions is for identifying effective fingermark development
reagents. The International Fingerprint Research Group (IFRG) have stated that
replicates are useful for fundamental research and initial study of molecular interactions,
but are not appropriate for optimisation or validation trials [36], and have warned caution
about using (particularly) synthetic lipid solutions for direct evaluation with natural latent
fingermarks, although this was specifically regarding fingermark development reagents
[38].
It is evident therefore that a degree of caution must be employed when using a simplified
analogue solution to study the chemical interactions within fingermarks, and certainly no
direct comparisons between the two can be made. This study therefore aimed to provide
a general indication of the intermolecular interactions that may occur within latent
fingermarks, and thus present a target for further work to look for these potential
interactions in latent fingermarks and their impact on fingermark degradation.

98
6.3 Experimental
6.3.1 Sample preparation
6.3.1.1 Analogue ‘fingermark’ preparation
The composition of the analogue solution was based on the principal compounds
observed during previous studies of latent fingermarks [2], [5], [19], [37], [39], [40]. Where
there was significant variation in the literature regarding the concentration of a
component, an average of all available data was used.
Sebaceous and organic eccrine secretions were selected for the analogue. The
sebaceous secretions comprised a sterol, sterol precursor, a fatty acid, mixed
triglycerides (100 mg triacetin, tributyrin, tricaproin, tricaprylin, tricaprin, all equal amounts
by weight), and a wax ester. The eccrine secretions were composed from an amino acid
and lactic acid. For simplicity, the most abundant compound within each family (i.e. amino
acid, fatty acid, wax ester) was selected to represent the compounds within that family.
For example, serine, being the most abundant amino acid [41–43] was selected to
represent all amino acids, and palmitic acid, the most abundant fatty acid, represented all
fatty acids [2, 3] (Unsaturated fatty acids, although more likely to have an impact on
intermolecular interactions due to a targetable functional group [40], were not included in
this study due to lack of data on origin or quantity).
This abundancy approach was also reflected in the concentrations of each compound
that made up the analogue solution, which represented the total concentration of that
compound group within a latent fingermark. For example, the concentration of serine in
the analogue was 1.45 mgL-1, equivalent to the typical total concentration of amino acids
observed in eccrine sweat [5, 12]. The compounds selected and their concentrations are
shown in table 6 (all compounds ≥98%, obtained from Sigma Aldrich, UK).

99
Compound Squalene Cholesterol Palmitic
acid Serine
Lactic acid
Mixed triglycerides
myristyl myristate
Concentration 11.2 mg/L-1 1.1 mg/L-1 15.4 mg/L-1 2.5 mg/L-1 10 mg/L-1 42.1 mg/L-1 29.9 mg/L-1
Table 6: The compounds and concentrations selected to create the analogue ‘fingermark’
composition
Table 7 shows the composition of each sample. Each sample was made up to a 1 L
solution with distilled water. Sample 1, comprised of all the constituents shown in table 6,
was used as the control and samples 2-8 all having one of the compounds in table 6
removed.
Sample 1 ‘complete’
Squalene Cholesterol Palmitic
acid Serine Lactic acid
Mixed triglycerides
Myristyl myristate
Sample 2 - Cholesterol Palmitic
acid Serine Lactic acid
Mixed triglycerides
Myristyl myristate
Sample 3 Squalene - Palmitic
acid Serine Lactic acid
Mixed triglycerides
Myristyl myristate
Sample 4 Squalene Cholesterol - Serine Lactic acid Mixed
triglycerides Myristyl
myristate
Sample 5 Squalene Cholesterol Palmitic
acid - Lactic acid
Mixed triglycerides
Myristyl myristate
Sample 6 Squalene Cholesterol Palmitic
acid Serine -
Mixed triglycerides
Myristyl myristate
Sample 7 Squalene Cholesterol Palmitic
acid Serine Lactic acid -
Myristyl myristate
Sample 8 Squalene Cholesterol Palmitic
acid Serine Lactic acid
Mixed triglycerides
-
Table 7: The composition of the eight analogue ‘fingermark’ samples
During formulation each sample was heated to 37oC to replicate body temperature and
to force any solid compounds into solution with the addition of 50 mgL-1 of the emulsifier
oleyl alcohol. Immediately after mixing 10 µL of the analogue samples were pipetted onto
CaF2 Infrared (IR) microscope slides (10 mm x 10 mm, Crystran Ltd) and placed on a
Peltier pump heat stage to maintain ‘body temperature’ and placed under the IR
microscope for analysis. Each sample was analysed 20 times and an average spectrum
obtained.

100
6.3.1.2 Sebaceous-loaded fingermarks
All fingermarks were obtained from a single donor (38-year-old male, wearing no
cosmetics) to maintain a relative consistency between samples, and the spectra obtained
were consistent with data from previous studies. Hands were first washed and dried
thoroughly. The index finger was then drawn from the bridge of the nose, under the eye
to the temple ten times to collect sebaceous secretions and to simulate natural grooming
behaviour, and placed directly onto a CaF2 IR microscope slide (10mm x 10mm, Crystran
Ltd). All fingermarks were deposited between 9am and 10am to avoid significant diurnal
variations in composition of the latent fingermark and analysed immediately. For each
fingermark the same index finger was used. 20 samples were analysed at room
temperature and pressure and an average spectrum obtained from 10 randomly chosen
locations per fingermark.
6.3.2 FTIR Microspectroscopy
The sebaceous-loaded fingermarks and the analogue compositions were analysed using
a PerkinElmer SpectrumTM Spotlight 200 FTIR imaging System equipped with a liquid-
nitrogen cooled MCT linear array detector. Data was analysed using Perkin Elmer
software, Spectrum® (v10.02.00), variations in spectra were processed using peak area
calculations. Spectra were collected in transmission mode, the IR beam passing through
the slide, within 4000 to 750 cm-1 spectral range with 10 scans per pixel at 4 cm-1 spectral
resolution and 10 µm spatial resolution, using a 100 x 100 µm aperture.

101
6.4 Results and Discussion
Prior to analysis of the analogue samples, spectra from sebaceous-loaded fingermarks
were obtained to serve as a spectral comparison to the complete analogue sample.
Figure 31 shows a typical FTIR spectrum of a fresh fingermark, the key peaks ranging
from 3000 cm-1 to 1100 cm-1.
Figure 31: Typical FTIR Spectrum of a natural fingermark
This study predominantly focused on the interactions between sebaceous materials
present within fingermarks. These sebaceous compounds correspond to the 2920 cm-1
and 2854 cm-1 antisymmetric and symmetric C-H stretching modes of CH2 groups, the
C=O stretch of lipids (1741 cm-1), the scissoring mode of CH2 groups and antisymmetric
C-H bending mode of CH3 groups (1463 cm-1), the CH3 symmetric bend (1380 cm-1), the
C-C-O stretch (1160 cm-1), and the O-C-C stretch (1111 cm-1). Some eccrine secretions
were also analysed, amide bonds of peptides and proteins were observed corresponding
to the amide I band (1655 cm-1), and amide II band (1545 cm-1) of secondary amides.
A
cm-1

102
6.4.1 Analogue samples
The ‘complete’ analogue sample demonstrated an accurate IR spectral representation of
a sebaceous-loaded fingermark (figure 32).
Figure 32: FTIR spectral comparison between the analogue sample and a natural
fingermark.
The spectra of the ‘complete’ analogue sample correspond well to that of a sebaceous-
loaded fingermark, all the major peaks were present in relatively accurate quantities, the
exception being the 1o amine peak at ~1600cm-1 in the analogue sample. This band
represents the amino acid serine that was a representative for all the amino acids present
in a natural fingermark. This band is not present in natural fingermarks, instead the 1o and
2o amide peaks from peptides and proteins dominate this region. Due to the stability and
unreactive nature of amino acids within latent fingermarks, only degrading at >100oC, and
not undergoing photo-degradation [13, 15] it was felt that this would have a minimal effect
on the dynamics of the analogue composition.
Once it was established that the IR spectra of the ‘complete’ analogue sample accurately
represented that of the sebaceous-loaded fingermark further samples were created, each
cm-1
Ab
sorb
an
ce
Groomed fingermark

103
with a component from the ‘complete’ analogue removed. As would be expected
removing a component from the sample had a corresponding effect on the spectrum for
that sample. For example, removing serine resulted in an absence of the corresponding
absorption band at ~1600cm-1. Equally, removing the wax ester myristyl myristate
resulted in an observable reduction in the antisymmetric and symmetric CH2 stretching
modes at 2920 cm-1and 2854 cm-1, the C=O stretch mode at 1736 cm-1, and the CH2 bend
at 1462 cm-1, although the peak distribution within the spectra remained the same.
Removing lactic acid from the sample had no observable effect on the spectra, this was
to be expected given the small amount of the compound within the sample, also the
functional groups within lactic acid, namely the hydroxide and carbonyl groups, are
present in a many of the other components within the analogue sample as well as in
natural fingermarks.
The 2920 cm-1 and 2854 cm-1 antisymmetric and symmetric C-H stretching modes of CH2
groups are a combination of all the organic components within a sample. Removing key
constituents such as wax esters or fatty acids had an impact on the height of these
absorbance bands, and therefore quantity, as would be expected. As discussed earlier a
cause of variation in band width are intermolecular interactions, which, in this study did
not significantly vary from the ‘complete’ analogue sample in the absence of the wax
ester, fatty acid, amino acid, mixed triglycerides or lactic acid, although peak height was
affected, the coupling effect of the C-H stretch mode was not (figure 33). However, the
absence of the steroid precursor squalene and the sterol cholesterol modified the
coupling effect of the C-H stretching modes significantly (figure 34).

104
It could be reasoned that the absence of cholesterol and squalene would reduce peak
height and therefore overall peak area simply due to a reduction in quantity of the sample
analysed. Peak height however is not significantly different in the absence of these two
components and therefore changes in peak area are directly proportional to peak width
and therefore bond diversity (figure 34). Additionally, a reduction in peak height alone is
not sufficient to explain this decrease in overall peak area in the absence of squalene or
cholesterol. These components made up a small proportion of the overall sample, and as
figure 34 shows, the absence of these components had no observable effect on peak
height and therefore concentration. Also, it is only in the absence of squalene and
cholesterol that such distinct C-H stretching modes, with minimal coupling, are generated.
Figure 33: The antisymmetric and symmetric C-H stretch modes of CH2 groups for
analogue samples with the wax ester removed (33a), and with the fatty acid removed
(33b).
33b

105
Figure 34: The antisymmetric and symmetric C-H stretch modes of CH2 groups for a
‘complete’ analogue sample (34a), with squalene removed (34b), and with cholesterol
removed (34c).
The antisymmetric and symmetric C-H stretching modes of CH2 groups in the absences
of squalene and cholesterol (figure 34b & 34c) show two distinct peaks with little overlap
when compared to the coupling of the same peaks from the ‘complete’ analogue (figure
34a). This indicates that the intermolecular interactions in the absence of squalene and
cholesterol are significantly reduced in these analogue samples.
Peak area calculations of the antisymmetric and symmetric C-H stretching modes of CH2
groups quantify the spectral data and show that analogue samples, in the absence
squalene or cholesterol, have a significantly lower absorbance between
2995 – 2780 cm-1 than that of the other analogue samples (figure 35).
34a
34b
34c
Abs.
Abs.
Abs.

106
Figure 35: Average absorbance of the C-H stretching modes at 2995 - 2780 cm-1 of the
analogue samples and natural fingermarks. (Natural fingermark n = 200, Analogues n=
20, error bars represent standard error of the mean)
The analogue samples investigated in this study suggest that the presence of both
squalene and cholesterol are essential in driving intermolecular interactions within these
samples. This could provide a focus for further research looking at the importance of
these compounds within the dynamic environment of latent fingermark chemistry, and if
squalene and cholesterol have an integral role in the aging processes within natural
fingermarks.
As mentioned previously cholesterol can influence the degradation of triglycerides
producing both saturated and unsaturated fatty acids [10]. The absence of this sterol
could significantly slow the degradation of these other lipid compounds and reduce the
quantity of degradation end products such as fatty acids. In a natural fingermark,
saturated fatty acids appear to increase during the first few days after deposition [3].
The hydroperoxides and hydroxyl radicals produced during the oxidation of squalene

107
are also likely to affect the degradation of cholesterol and unsaturated fatty acids, and
thus have a concomitant effect upon triglyceride decomposition and the initial increase
in saturated fatty acids (figure 36).
Figure 36: Suggested interaction pathway of lipid compounds within a latent fingermark.
Assuming that squalene and cholesterol are essential in driving the interactions
between the various sebaceous compounds present in a latent fingermark, then this
may, at least in part, explain why children’s latent fingermarks are more volatile and
tend to ‘vanish’ instead of adopting the temporal degradation of adult fingermarks [44–
46]. Children’s latent fingermarks contain very little squalene so interactions between
this steroid precursor and other sebaceous compounds (such as unbranched fatty
acids) would be limited. Reduced interactions would mean that degradation of these
other sebaceous compounds (particularly the more volatile ones) to more stable states

108
would be reduced leaving them more prone to evaporation. The sebaceous components
of young children also contain significantly lower levels of triglycerides than that of
adults, so the breakdown of cholesterol and fatty acids through interactions with
triglycerides (and vice versa) to more stable end products would also be inhibited.

109
6.5 Conclusions
The research presented in this paper demonstrates that squalene and cholesterol affect
the intermolecular interactions within the analogue samples studied, this could indicate
the importance of these two compounds in influencing intermolecular interactions
between lipids within latent fingermarks, and provides a hypothesis for studying these
interactions within natural fingermarks. The degradation processes that occur in latent
fingermarks are directed by these interactions and only by studying them will it be
possible to understand the complex and dynamic nature of fingermark aging. Future
studies using analogue compositions could investigate whether these analogue
samples age in similar ways to natural fingermarks by identifying known degradation
products that occur in natural latent fingermarks. Analogue compositions of latent
fingermarks will always be crude representations of the myriad of interactions that occur
within natural fingermarks, but ongoing investigation into these simplified models,
utilising various analytical techniques, could direct research that ultimately provides a
better understanding of the fingermark aging process.
110
6.6 References
1. K. A. Mountfort, H. Bronstein, N. Archer, S. M. Jickells, Identification of oxidation
products of squalene in solution and in latent fingermarks by ESI-MS and
LC/APCI-MS, Anal. Chem. 79 (7) (2007) 2650–2657.
2. G. M. Mong, C. E. Petersen, and T. R. W. Clauss, Advanced Fingerprint Analysis
Project - Fingerprint Constituents, Vol PNNL-13019. U.S. Department of Energy,
Pacific Northwest National Laboratory, 1999.
3. N. E. Archer, Y. Charles, J. a. Elliott, and S. Jickells, Changes in the lipid
composition of latent fingerprint residue with time after deposition on a surface,
Forensic Sci. Int. 154 (2-3) (2005) 224–239.
4. R. S. Croxton, M. G. Baron, D. Butler, T. Kent, and V. G. Sears, Variation in
amino acid and lipid composition of latent fingerprints, Forensic Sci. Int. 199
(2010) 93–102.
5. R. Ramotowski, Composition of Latent Print Residues, in: Advanced in Fingerprint
Technology, 2nd ed. London: CRC Press, 2001.
6. A. Srivastava and R. Prasad, Triglycerides-based diesel fuels, Renew. Sust.
Energy. Rev, 4 (2) (2000) 111–113.
7. B. B. Dent, S. L. Forbes, and B. H. Stuart, Review of human decomposition
processes in soil, Environmental Geology. (2004) 576-585.
8. R. Wolstenholme, R. Bradshaw, M. R. Clench, and S. Francese, Study of latent
fingermarks by matrix-assisted laser desorption/ionisation mass spectrometry
imaging of endogenous lipids, Rapid Commun. Mass Spectrom. 23 (19) (2009)
3031–3039.
111
9. C. Weyermann, C. Roux, and C. Champod, Initial Results on the Composition of
Fingerprints and its Evolution as a Function of Time by GC/MS Analysis, J.
Forensic Sci. 56 (1) (2011) 102–108.
10. L. Iuliano, Pathways of cholesterol oxidation via non-enzymatic mechanisms,
Chemistry and Phys of Lipids, 164 (6) (2011) 457-468.
11. S. K. Kim and W. W. Nawar, Oxidative interactions of cholesterol with
triacylglycerols, J. Am. Oil Chem. Soc, 68 (12) (1991) 931–934.
12. A. Girod, R. Ramotowski, and C. Weyermann, Composition of fingermark residue:
A qualitative and quantitative review, Forensic Sci. Int., 223 (1–3) (2012) 10–24.
.13. T. Atherton, R. Croxton, M. Baron, J. Gonzalez-Rodriguez, L. Gámiz-Gracia, and
A. M. García-Campańa, Analysis of amino acids in latent fingerprint residue by
capillary electrophoresis-mass spectrometry, J. Sep. Sci. 35 (2012) 2994-2999.
14. A. Stadtman, A. Cherkes, C. Anfinsen, Studies on the microbiological degradation
of cholesterol, J. Biol. Chem. 206 (2) (1954) 511–523.
15. A. Richmond-Aylor, S. Bell, P. Callery, and K. Morris, Thermal degradation
analysis of amino acids in fingerprint residue by pyrolysis GC-MS to develop new
latent fingerprint developing reagents, J. Forensic Sci. 52 (2) (2007) 380–382.
16. G. De Paoli, S. A. Lewis, E. L. Schuette, L. A. Lewis, R. M. Connatser,T. Farkas,
Photo- and thermal-degradation studies of select eccrine fingerprint constituents,
J. Forensic Sci. 55 (4) (2010) 962–969.
17. S. K. Kim and W. W. Nawar, Parameters influencing cholesterol oxidation, Lipids.
28 (10) (1993) 917–922.
18. L. L. Smith, Cholesterol autoxidation 1981–1986, Chem. Phys. Lipids. 44 (2–4)
(1987) 87–125.

112
19. A. Girod, L. Xiao, B. Reedy, C. Roux, and C. Weyermann, Fingermark initial
composition and aging using Fourier transform infrared microscopy (μ-FTIR),
Forensic Sci. Int. 254 (2015) 185-196.
20. P. Fritz, W. van Bronswjik, K. Lepkova, S. W. Lewis, K. F. Lim, D. E. Martin, L.
Puskar, K. F. Lim, D. E. Martin, L. Puskar, K. F. Lim, D. E. Martin, and L. Puskar,
Infrared microscopy studies of the chemical composition of latent fingermark
residues, Microchem. J. 111 (2013) 40–46.
21. C. Ricci and S. G. Kazarian, Collection and detection of latent fingermarks
contaminated with cosmetics on nonporous and porous surfaces, Surf. Interface
Anal. 42 (5) (2010) 386–392.
22. D. K. Williams, R. L. Schwartz, and E. G. Bartick, Analysis of Latent Fingerprints
Deposits by Infrared Microspectroscopy, Appl. Spectrosc. 58 (3) (2004) 313–316.
23. N. J. Crane 3, E. G. Bartick, R. S. Perlman, and S. Huffman, Infrared
spectroscopic imaging for noninvasive detection of latent fingerprints, J. Forensic
Sci. 52 (1) (2007) 48–53.
24. A. Hemmila, J. McGill, and D. Ritter, Fourier transform infrared reflectance
spectra of latent fingerprints: a biometric gauge for the age of an individual, J.
Forensic Sci. 53 (2) (2008) 369–376.
25. A. Johnston and K. Rogers, The Effect of Moderate Temperatures on Latent
Fingerprint Chemistry, Appl. Spectrosc. 71 (9) (2017) 2102-2110.
26. N. B. Colthup, L. H. Daly, S. E. Wiberley, N. B. Colthup, L. H. Daly, and S. E.
Wiberley, “Chapter 4 – The Vibrational origin of group frequencies, in Introduction
to Infrared and Raman Spectroscopy. (1990) 171–213.
27. G. Socrates, Infrared Characteristsic Group Frequencies. Tables and Charts,
Second Ed. John Wiley & Son Ltd. (1994) 34–41.

113
28. F. M. Fowkes, Donor-Acceptor Interactions at Interfaces, J. Adhes. 4 (2) (1972)
155–159.
29. N. Israelachvili, J. N., Tabor, The Measurement of Van Der Waals Dispersion
Forces in the Range 1.5 to 130 nm, in Proceedings of The Royal Society A,
(1972) 19-38.
30. J. Israelachvili, Intermolecular and Surface Forces, 3rd ed. Elsevier, 2011.
31. X. Li, Q. Pan, J. Chen, S. Liu, A. He, C. Liu, Y. Wei, K. Huang, L. Yang, J. Feng,
Y. Zhao, Y. Xu, Y. Ozaki, I. Noda, and J. Wu, Asynchronous Orthogonal Sample
Design Scheme for Two-Dimensional Correlation Spectroscopy (2D-COS) and its
Application in Probing Intermolecular Interactions from Overlapping Infrared (IR)
Bands, Appl. Spectrosc. 65 (8) (2011) 901–917.
32. J. Chen, Q. Bi, S. Liu, X. Li, Y. Liu, Y. Zhai, Y. Zhao, L. Yang, Y. Xu, I. Noda, and
J. Wu, Double Asynchronous Orthogonal Sample Design Scheme for Probing
Intermolecular Interactions, J. Phys. Chem. 116 (45) (2012) 10904–10916.
33. N. B. Colthup, L. H. Daly, S. E. Wiberley, N. B. Colthup, L. H. Daly, and S. E.
Wiberley, Chapter 5 – Methyl and Methylene groups, in Introduction to Infrared
and Raman Spectroscopy. (1990) 215–233.
34. A. L. Steber, J. L. Neill, D. P. Zaleski, B. H. Pate, A. Lesarri, R. G. Bird, V.
Vaquero-Vara, and D. W. Pratt, Structural studies of biomolecules in the gas
phase by chirped-pulse Fourier transform microwave spectroscopy, Faraday
Discuss. (2011) 227-242.
35. B. K. Sharma, Instrumental Methods of Chemical Analysis, Twenty Fourth Edition.
Meerut: GOEL, 2005.
36. J. Almog, A.A. Cantu, C. Champod, T. Kent, C. Lennard, Guidelines for the
assessment of fingermark detection techniques. International Fingerprint
Research Group (IFRG), J. Forensic Ident., 64, (2) (2014) 174–200

114
37. A. Girod, C. Weyermann, Lipid composition of fingermark residue and donor
classification using GC/MS, Forensic Sci. Int., 238 (2014) 68–82
38. S. Zadnik, W. Van Bronswijk, A. Frick, P. Fritz, S.W. Lewis, Fingermark simulants
and their inherent problems: A comparison with latent fingermark deposits, J.
Forensic. Ident., 63 (5) (2013) 593–608.
39. M. J. Bailey , N. J. Bright, S. Hinder, B. N. Jones, R. P. Webb, R. S. Croxton, S.
Francese, L. S. Ferguson, R. Wolstenholme, S. Jickells, B. J. Jones, J. J. Ojeda,
S. G. Kazarian, and S. Bleay, Chemical characterization of latent fingerprints by
matrix-assisted laser desorption ionization, time-of-flight secondary ion mass
spectrometry, mega electron volt secondary mass spectrometry, gas
chromatography/mass spectrometry, X-ray photoelectron spec, Anal. Chem. 84
(20) (2012) 8514–8523.
40. S. Cadd, M. Islam, P. Manson, and S. Bleay, Fingerprint composition and aging:
A literature review, Sci. Justice. 55 (4) (2015) 219–238.
41. P. Hamilton, Amino-acids on Hands, Nature. 205 (1965) 284–285.
42. J. Oro and H. Skewes, Free Amino-Acids on Human Fingers: The Question of
Contamination in Microanalysis, Nature. 207 (1) (1965) 1042–1045.
43. B. Hadorn, F. Hanimann, P. Anders, H. Curtius, and R. Halverson, Free Amino-
acids in Human Sweat from Different Parts of the Body, Nature. 215 (99) (1965)
416–417.
44. K. M. Antoine, S. Mortazavi, L. M. Miller, A. D. Miller, K. M. Antoine, S. Mortazavi,
A. D. Miller, L. M. Miller, Chemical differences are observed in children’s versus
adults’ latent fingerprints as a function of time, J. Forensic Sci. 55, (2) (2010) 513–
518.
45. D. K. Williams, C. J. Brown, and J. Bruker, Characterization of children’s latent
fingerprint residues by infrared microspectroscopy: Forensic implications,
Forensic Sci. Int. 206 (1–3) (2011) 161–165.

115
46. D. Noble, Vanished into thin air. The search for children’s fingerprints, Anal.
Chem. 67 (13) (1995) 435A–438A.

116
CHAPTER 7. PAPER FOUR
(Submitted to Forensic Science International – under review)
The temporal degradation of illicit contaminants in latent fingermarks
using Fourier transform infrared spectroscopic imaging
Authors
Andrew Johnston1, Keith Rogers1
1Cranfield University, The Defence Academy of the United Kingdom, Shrivenham, SN6 8LA
7.1 Abstract
Fourier Transform Infrared (FTIR) spectroscopy has been shown to be a rapid, non-
destructive analytical technique capable of detecting trace amounts of exogenous
particulate in fresh latent fingermarks. Fingermarks identified at a crime scene, however,
are rarely fresh and are likely to have been deposited days or even weeks before forensic
analysis, leaving them prone to decomposition.
In this study latent fingermarks were contaminated with trace amounts of the improvised
explosive precursors ammonium nitrate and sodium chlorate, and the addictive narcotic
cocaine. The latent fingermarks were then aged in natural daylight conditions over a 30-
day period and intermittently analysed using FTIR spectromicroscopy. Exogenous
particulate was identified using spectroscopic imaging of each fingermark, and spectra
obtained from the samples were compared to control spectra to confirm the identification
of the contaminant. This study demonstrates that these contaminants are detectable
within latent fingermarks up to at least 30 days after deposition, with only ammonium
nitrate showing signs of decomposition, and that fingermark chemistry has a minimal
effect on their molecular integrity. This information has broad implications for the law
enforcement community as it suggests that the detection of exogenous particulate within
latent fingermarks is possible long after a suspect has handled an illegal substance. This
study also confirms the use of spectroscopic imaging to provide a chemical signature for
these illicit compounds weeks after deposition, and an image of the fingermark ridge
pattern that can then be used for identification purposes.

117
Keywords
Fingermarks, Fourier transform infrared microspectroscopy, spectroscopic imaging,
degradation, exogenous material, detection, explosives, narcotics

118
7.2 Introduction
The ability to detect illicit substances such as explosive compounds/precursors or
narcotics in latent fingermarks is of obvious benefit to the forensic and law enforcement
communities. This is of particular relevance to today’s threat lists with the increased use
of improvised explosive devises (IED’s) by terrorist groups, often formulated from
domestically available products, and the rising trend in cocaine consumption in western
Europe and the US.
Various analytical techniques have proven capable of detecting trace amounts of illicit
materials, particularly in latent fingermarks, such as gas chromatography-mass
spectroscopy (GC-MS), Matrix-assisted laser desorption/ionisation-mass spectrometry
(MALDI-MS), high performance liquid chromatography (HPLC), capillary electrophoresis,
and ion mobility spectroscopy (IMS) [1-7]. These techniques, however, do require the
destruction of the sample for analysis, leaving further investigation of the fingermark
impossible. Whereas spectroscopic techniques such as Raman and Infrared
spectroscopy are capable of detecting these illicit materials rapidly, with limited or no
sample preparation, and, most importantly, are non-destructive with regards to the
sample [8-17]. IR spectromicroscopy in particular has demonstrated the ability to identify
exogenous particulate within latent fingermarks by generating identifiable spectra [9,
10,15], but is also capable of generating spectral images, or maps, that provide spatial
information about a fingermark [18-24]. These spatial images can both identify the
chemical signatures of foreign components within a fingermark, and also provide the
spatial information of the unique ridge patterns that could be used to identify a suspect.
The dynamic nature of fingermark chemistry post-deposition is a complex process,
numerous studies have examined the chemical composition and aging of fingermarks,
the oxidation mechanisms that take place, both short and long term [25, 26], and the
resulting end products [26-36]. For example, it is well documented that the chemistry of
latent fingermarks changes temporally in both adults and children [37-40] and this may
potentially provide the basis for an aging tool to establish time since deposition.
The chemical components of latent fingermarks have been well documented using a
variety of analytical techniques [41, 42]. Previous studies have shown that there are

119
changes in fingermark chemistry over time and under different conditions. Temporal
decomposition, for example, appears to involve the shortening and degradation of
unsaturated lipids including fatty acids, wax esters, triglycerides, squalene (SQ) and
cholesterol due to various oxidation processes [25-28, 30-36, 43-45]. In contrast,
saturated lipids stay relatively stable over longer time periods (>60 days) [26]. A change
in unsaturated fatty acids has been observed over time decreasing significantly over a
thirty-day period [26, 27]. This is due to the unsaturated moiety degrading through both
aerobic and anaerobic processes and increasing the proportion of saturated compounds
[26]. Exposure to light also has a significant impact on fingermark composition. Studies
have shown that exposure to light affects the breakdown mechanisms of various
components within fingermark deposits differently and more rapidly than in dark
conditions. Short chain fatty acids and squalene in particular were affected by exposure
to light conditions [27, 43, 46]. SQ degradation is supported by the identification of various
photo-oxidation mechanisms to produce intermediary products including peroxides,
hydroperoxides and SQ epoxide and the fully oxidised forms being hexanedioic and
pentanedioic acid [25]. These products are particularly prevalent when squalene is
exposed to UV radiation, such as direct sunlight [25, 46].
The identification and chemical imaging of exogenous components within latent
fingermarks, as well as the composition and aging of latent fingermarks has been, and
continues to be, comprehensively studied. Investigations into the temporal degradation
of foreign substances within fingermarks has largely been overlooked however. This is
an important aspect of latent fingermark analysis as fingermarks found at crime scenes
are rarely fresh, and could have been deposited days or weeks prior to investigation by
law enforcement agencies. It is vital, therefore, to understand the effects of fingermark
degradation chemistry on trace evidence over time. This study aims to address this gap
in the literature by using FTIR spectromicroscopy to analyse the temporal degradation of
three exogenous substances within latent fingermarks over a 30-day period. FTIR
spectromicroscopy is ideally suited to monitoring temporal changes in latent fingermarks
as specific sample areas can be repeatedly analysed over the duration of the experiment
[17, 40, 47].

120
Three substances were selected to contaminate the fingermarks; ammonium nitrate (AN)
and sodium chlorate (SC), both common pre-cursor components in IED’s, and the
addictive stimulant narcotic cocaine (C). Fingermarks were contaminated with each one
of these compounds and aged in natural light conditions over 30 days. The same sample
area was analysed and a chemical map generated every 5 days for the duration of the
experiment. Spectra of individual particles from each contaminant were also obtained at
five day intervals to observe any changes in specific absorbance bands as the exogenous
compounds interacted with the chemical makeup of the fingermarks.

121
7.3 Experimental
To prepare the fingermark samples the hands of the volunteer were cleaned with soapy
water, rinsed and air dried for twenty minutes. The index finger of the right hand was
drawn from the bridge of the nose to the temple five times to collect sufficient sebaceous
secretions to simulate natural grooming behaviour. The volunteer’s finger was then
pressed into 500 mg of the contaminant, any excess was brushed off with the other hand
(gloved) until little or no powder was visible on the fingertip. The contaminated finger was
then lightly pressed onto a CaF2 Infrared (IR) microscope slide (10 mm x 10 mm, Crystran
Ltd). Five fingermarks per contaminant were laid down on consecutive days and
deposited between 9am and 10am to avoid significant diurnal variations in composition
of the latent fingermarks. For each fingermark the same index finger was used. An
uncontaminated control fingermark was deposited on an identical CaF2 microscope slide,
and five deposits were analysed from that sample. Control samples of 10 mg of each
contaminant were deposited on three separate CaF2 slides without the fingermark, five
deposits were analysed from each slide. All sample fingermarks were obtained from a
single male donor, 38 years old, to maintain a relative consistency between samples.
Contaminants: Ammonium nitrate ≥99% (Sigma Aldrich, UK), sodium chlorate ≥98%
(Sigma Aldrich, UK), and cocaine free base C-II ≥99% (Sigma Aldrich, UK), milled to a
fine powder.
7.3.1 Analysis of fingermarks
The fingermarks were analysed using a PerkinElmer SpectrumTM Spotlight 200 FTIR
imaging System equipped with a liquid-nitrogen cooled MCT linear array detector. Data
was analysed using Perkin Elmer software, Spectrum® (v10.02.00), variations in spectra
were processed using peak area calculations. All spectra were baseline corrected and
range normalised. Spectra from control samples and contaminated fingermarks were
collected in transmission mode, over the 4000 to 750 cm-1 spectral range at 4 cm-1
spectral resolution and 10 µm spatial resolution, after 32 scans, using a 100 x 100 µm
aperture. All spectra were presented in units of absorbance (𝐴 = − log 𝑇) as a function of
wavenumber, the number of waves per centimetre. As with the control samples five
deposits were selected for spectral analysis from each contaminated fingermark. Each

122
fingermark and control sample was analysed every 5 days with both a visible image scan
(5000x5000 µm), consisting of 169 (13x13) tiles, and a corresponding chemical map
obtained from each sample. Before analysis began, contaminant particles were selected
using the visual microscope capability and that area was sampled for the duration of the
30-day experiment. The same location was identified for each analysis by returning to the
same area on the slide and identifying a characteristic group of particulate. The chemical
maps allowed for individual spectra from each contaminant particle to be obtained and
any changes in absorbance observed over the duration of the experiment. Changes in
absorbance for the control samples and the contaminants within the fingermarks were
calculated by selecting the three most dominant absorbance bands from each compound
(table 8), measuring their peak area after each scan, and averaging each sample. All
samples were stored in natural light conditions at room temperature and humidity. All
statistical tests were carried out using Minitab 18 software.
Sample
Absorbance bands selected for analysis (cm-1)
Band 1 Band 2 Band 3
Ammonium nitrate 1628 1044 828
Sodium chlorate 1887 1595 1415
Cocaine 2946 1735 1449
Fingermark 2925 2858 1738
Table 8: The three absorbance bands selected for analysis from the contaminants and the
latent fingermarks over the duration of the experiment

123
7.4 Results and Discussion
7.4.1 Obtaining spectra and chemical maps
Before the contaminated fingermarks were analysed control spectra were obtained from
pure samples of the contaminants on day 0 and day 30 (figure 37). Five deposits on each
of the three slides containing 10 mg of each contaminant were analysed. This was to
identify any changes in absorbance, indicating degradation, that were unrelated to
interactions with fingermark chemistry. The spectral range of analysis for all samples was
4000 to 750 cm-1 with the exception of ammonium nitrate. The ‘fingerprint region’ of the
ammonium nitrate spectrum (2500 cm-1 - 750 cm-1) was selected for analysis for both the
control and contaminated fingermark samples as this region provided the most accurate
data on changes in absorbance over time. As figure 37 shows there was no significant
change (p > 0.05) in the absorbance of the three control contaminants.
Figure 37: Averaged control spectra from five deposits of each of the contaminants;
ammonium nitrate (AN), sodium chlorate (SC), and cocaine (C) on day 0 and day 30 (n=15
error bars represent standard error of the mean).

124
Control spectra and chemical maps of the uncontaminated latent fingermark were also
obtained to measure the chararcteristic peaks, and any observable changes that occured
over the 30-day period (figure 38).
Figure 38: Averaged spectra of an uncontaminated latent fingermark at day 0 and day 30
(n=5)
There were no significant differences (p = 0.13) in the selected absorbance bands from
the control sample contaminants on day 0 and day 30 (figure 37). This indicated that any
changes in absorbance from the exogenous particulate within the fingermarks would be
due to interactions with the fingermark chemistry.
The IR spectra in figure 38 show a general reduction in peak area, and therefore quantity,
across all bands of the uncontaminated control fingermark over the 30-day period, and
notably the OH band at 3260 cm-1 showed a significant reduction, most likely due to water
loss. Figure 39 shows that the absorbance of the antisymmetric and symmetric C-H
stretching modes of CH2 groups (2920-2854 cm-1) significantly decreased over the 30
days, as would be expected.

125
Figure 39: Change in absorbance of the C-H stretching modes of CH2 groups of the control
fingermark (uncontaminated) over 30 days (n=5, error bars represent standard error of the
mean)
This band is a culmination of all the organic material within a latent fingermark, and as
mentioned previously various oxidation mechanisms take place within a latent fingermark
over time and materials such as triglycerides, wax esters, short chain fatty acids, and
squalene decrease in quantity, especially in light conditions [25, 26, 27].
Figure 40 shows the visible image and corresponding chemical map (chemimap) of the
same area of a latent fingermark contaminated with AN. The AN particles observed in the
visible image show strong absorbance in the chemimap.
Figure 40: Visible image and corresponding chemimap of a latent fingermark contaminated
with ammonium nitrate particles
Absorb
ance

126
Figure 41 a-c shows the indiviual spectra obtained from each of these AN particles, as
well as a background spectrum of the endogenous fingermark (41d). The spectra confirm
the identity these particles as ammonium nitrate when compared to the control spectrum
for AN (41e). This process was repeated for the fingermarks contaminated with sodium
chlorate and cocaine.
Figure 41: Chemimap and spectra of AN in a latent fingermark. 41a, b and c show
consistent spectra of ammonium nitrate particles present within the fingermark when
compared to the control spectrum of AN (41e). 41d shows a typical spectrum of a
fingermark from the donor used in this study.

127
7.4.2 Aged sample analysis using spectroscopic imaging
The objective of this study was to investigate the degradation effects of fingermark
chemistry on different contaminants over a 30-day period using FTIR spectroscopic
imaging. The previous findings (7.4.1) demonstrate that there is no significant degradation
of the contaminant control samples over time (figure 37), and that it is possible to reliably
detect exogenous particulate within latent fingermarks using chemical mapping (figures
40 & 41).
Figure 42 shows two examples of spectroscopic images of latent fingermarks
contaminated with ammonium nitrate (42A) and cocaine (42B) on day 0 and day 30.
Figure 42: Chemimap comparison of the degradation of ammonium nitrate (A) and cocaine
(B) on day 0 and day 30
Absorb
ance

128
In Figure 42A the chemimaps show an observable difference in the average absorbance,
and therefore quantity of material, of ammonium nitrate from day 0 to day 30, but there is
no obvious difference between the chemimaps of fingermarks contaminated with cocaine
(42B). This reduction in average absorbance between day 0 and day 30 for ammonium
nitrate, as shown in figure 42A, was confirmed by the peak area calculations from the
spectral data (figure 43), but these changes were not seen in the averaged spectra of the
sodium chlorate or cocaine samples. N.B. The saturated nitrate ion band at 1410-1340
cm-1 is a natural consequence of absorption in the larger AN particulates, typical of that
within fingermark contamination. This band was not used in any calculations for this study.
Figure 43: Changes in absorbance of AN over 30 days, focusing on absorbance bands at
1628, 1044, 828 cm-1 (n=25)
To establish any quantifiable changes in absorbance of the three contaminants over the
30-day period spectral data was analysed using peak area analysis, and ’s Rho
Correlation (Minitab 18) was used to identify any significant correlation between time and
average absorbance of the three contaminants. No significant correlation was observed
for sodium chlorate (p = 0.2) or cocaine (p = 0.05), but there was a significant reduction
in absorbance for ammonium nitrate (p < 0.01) over the 30-day period. Figure 44 plots
the average absorbance for each of the three contaminants over the 30-day period. As
confirmed by the Spearman’s Rho correlation only AN showed a significant decrease in

129
quantity, although this reduction occurred almost entirely within the first 10 days, and AN
particulates were still detectable after 30 days (figure 42A & 43).
Figure 44: Changes in average absorbance over a 30-day period of ammonium nitrate (AN),
sodium chlorate (SC) and cocaine (C) (n=25, error bars represent standard error of the
mean)
Ammonium nitrate showed a 31% decrease in absorbance within the first ten days and
then only a 4% decrease over the following twenty days. It is likely that this initial reduction
in absorbance of AN is due to ionic interactions with both water molecules and
endogenous unsaturated lipid components within the fingermark. It is known that these
unsaturated lipids, such as squalene and unsaturated fatty acids, decompose within the
first few days’ post-deposition [26, 27, 36, 43]. Polar water molecules will break the ionic
bonds within ammonium nitrate to form ammonium and nitrate ions, these ions would
then be available to interact with the unsaturated lipids. This interaction between the
inorganic ions and unsaturated lipids would also be assisted by the photo-oxidation
mechanisms that are known to take place in light conditions [25, 27, 43, 46]. The lack of
change in absorbance after the first ten days is likely to be in part due to the evaporation
of water from the fingermark, and due to the near complete decomposition of these
unsaturated lipids.

130
Ammonium nitrate and sodium chlorate are ionic compounds so it might be expected that
they would both show some degradation over time in the aqueous and dynamic
environment of a latent fingermark. Yet it was only AN that degraded over the 30-day
period, SC remaining unchanged. This is likely due to the difference in lattice enthalpy of
the two compounds. AN has a significantly lower lattice enthalpy than SC, so is more
likely to form ions in solution in the ambient conditions of a latent fingermark. Cocaine is
a covalently bonded alkaloid ester, so the lack of change in absorbance over time in this
study is consistent with its intramolecular stability.

131
7.5 Conclusion
This study demonstrates that trace amounts of ammonium nitrate, sodium chlorate, and
cocaine, are still detectable in latent fingermarks up to at least 30 days post-deposition in
ambient conditions. It also reiterates the advantages of using FTIR spectromicroscopy to
identify trace amounts of contaminant within latent fingermarks, and the ability to analyse
any chemical changes in that contaminant over time without destroying the sample. All
three contaminants were detectable after thirty days, only ammonium nitrate showed any
significant reduction in quantity over the test period, primarily in the first 10 days. This
study used one donor for the fingermarks, which, given the reported variability between
individuals, could be considered limiting with regard to chemical variation. It was felt
however, that for this study, this consistency was an advantage in assessing changes in
contaminant composition over time. Further research should look into the effect of various
donors on the chemical integrity of these contaminants, which may in addition provide
more information on the chemical variability between individuals.
The variety of illicit contaminants, from either explosive/explosive precursors or narcotics,
that could potentially be found in latent fingermarks is immensely broad. Although only
three contaminants were selected for this study the data does suggest that any
contaminant degradation that does occur is likely to arise within ten-days of fingermark
deposition. This is when the naturally occurring oxidation mechanisms within a latent
fingermark are most active and therefore intermolecular interactions with other species
are more likely. It is also when the water content of a fingermark is at its highest enabling
the more polar compounds to form a solution. It is worth noting that the fingermarks used
for this study were sebaceous-loaded to represent natural grooming behavior. This
loading however, can artificially enrich fingermarks with lipid components, and may affect
degradation rates of certain contaminants given there are more lipid materials to interact
with. Although even with sebaceous-loaded fingermarks the contaminants in this study
were still detectable for the duration of the experiment.
In this work FTIR spectromicroscopy has demonstrated the ability to not only chemically
identify trace amounts of illicit compounds within latent fingermarks weeks after

132
deposition, but also to simultaneously provide a recognizable ridge pattern that can be
used for identification purposes without destroying the sample. This data has broad
implications for the law enforcement community as the ability to detect illicit compounds
in latent fingermarks a considerable time after deposition is potentially of great value to a
criminal investigation, for example when tracing the movements of a terrorist or terrorist
group synthesizing improvised explosive compounds. Further work is needed on a
broader range of illicit substances to identify any compounds that are particularly
susceptible to degradation within the chemical environment of a latent fingermark, and
how varying environmental conditions could affect that rate of decomposition.

133
7.6 Reference
1. D. S. Moore, Instrumentation for trace detection of high explosives. Rev.
Sci. Instrum. 75 (2004) 2499-2512.
2. M. Nambayah, T.I. Quickenden, A quantitative assessment of chemical
techniques for detecting traces of explosives at counter-terrorist portals.
Talanta. 63 (2004) 461-467.
3. S. Singh, Sensors—An effective approach for the detection of explosives.
J. Hazard Mater. 144 (2007) 15-28.
4. H. Lai, A. Leung, M. Magee, J.R. Almirall, Identification of volatile
chemical signatures from plastic explosives by SPME-GC/MS and
detection by ion mobility spectrometry. Anal. Bioanal. Chem. 396 (2010)
2997-3007.
5. F. Rowell, J. Seviour, A.Y. Lim, C.G. Elumbaring-Salazar, J. Loke, J. Ma,
Detection of nitro-organic and peroxide explosives in latent fingermarks
by DART- and SALDI-TOF-mass spectrometry. Forensic Sci. Int. 221
(2012) 84-91.
6. S. Francese, R. Bradshaw, N. Denison, An update on MALDI mass
spectrometry based technology for the analysis of fingermarks - stepping
into operational deployment. Analyst. 142 (2017) 2518-2546.
7. G. Groeneveld, M. de Puit, S. Bleay, R. Bradshaw, S.Francese, Detection
and mapping of illicit drugs and their metabolites in fingermarks by MALDI
MS and compatibility with forensic techniques. Sci. Rep. 5 (2015) 11716.
8. A. Banas, K. Banas, M. B. H. Breese, J. Loke, B. Heng Teo and S. K.
Lim, Detection of microscopic particles present as contaminants in latent
fingerprints by means of synchrotron radiation-based Fourier transform
infra-red micro-imaging. Analyst 137 (2012) 3459-3465.

134
9. A. Grant, T.J. Wilkinson, D.R. Holman, M.C. Martin, Identification of
Recently Handled Materials by Analysis of Latent Human Fingerprints
Using Infrared Spectromicroscopy. Appl. Spectrosc. 59 (2005) 1182-
1187.
10. Y. Mou, J.W. Rabalais, Detection and Identification of Explosive Particles
in Fingerprints Using Attenuated Total Reflection-Fourier Transform
Infrared Spectromicroscopy. J. Forensic Sci. 54 (2009) 846.
11. D.K. Williams, R.L. Schwartz, E.G Bartick, Analysis of Latent Fingerprint
Deposits by Infrared Microspectroscopy. Appl. Spectrosc. 58 (2004) 313-
316.
12. J.S. Day, H.G. Edwards, S.A. Dobrowski, A.M. Voice, The detection of
drugs of abuse in fingerprints using Raman spectroscopy II:
cyanoacrylate-fumed fingerprints. Spectrochim. Acta. Part A Mol. Biomol.
Spectrosc. 60 (2004) 1725-1730.
13. J.S. Day, H.G.M. Edwards, S.A. Dobrowski, A.M. Voice, The detection of
drugs of abuse in fingerprints using Raman spectroscopy I: latent
fingerprints. Spectrochim. Acta. Part A Mol. Biomol. Spectrosc. 60 (2004)
563-568.
14. C. Cheng, T. Kirkbride, D. Batchelder, R. Lacey, T. Sheldon, In Situ
Detection and Identification of Trace Explosives by Raman Microscopy
BT - In Situ Detection and Identification of Trace Explosives by Raman
Microscopy. (1995).
15. M.J. West, M.J. Went, The spectroscopic detection of exogenous material
in fingerprints after development with powders and recovery with
adhesive lifters. Forensic Sci. Int. 174 (2008) 1-5.
135
16. A. Tripathi, E.D. Emmons, P.G. Wilcox, Semi-Automated Detection of
Trace Explosives in Fingerprints on Strongly Interfering Surfaces with
Raman Chemical Imaging. Appl. Spectrosc. 65 (2011) 611-619.
17. C. Ricci, N. Curum, K.L. Andrew Chan, S. Jickells, S. Kazarian, P.
Phiriyavityopas, Chemical Imaging of Latent Fingerprint Residues. Appl
Spectrosc. 61 (2007) 514-522.
18. P.H.R. Ng, S. Walker, M. Tahtouh, B. Reedy, Detection of illicit
substances in fingerprints by infrared spectral imaging. Anal. Bioanal.
Chem. 394 (2009) 2039.
19. N.J. Crane, E.G. Bartick, R.S. Perlman, S. Huffman, Infrared
spectroscopic imaging for noninvasive detection of latent fingerprints. J.
Forensic Sci. 52 (2007) 48-53.
20. M. Tahtouh, P. Despland, R. Shimmon, J.R. Kalman, B.J. Reedy, The
Application of Infrared Chemical Imaging to the Detection and
Enhancement of Latent Fingerprints: Method Optimization and Further
Findings. J. Forensic Sci. 52 (2007) 1089-1096.
21. G. Payne, C. Wallace, B. Reedy., Visible and near-infrared chemical
imaging methods for the analysis of selected forensic samples. Talanta.
67 (2005) 334-344.
22. E. Bartick, R. Schwartz, R. Bhargava, M. Schaeberle, D. Fernandez, I.
Levin, Spectrochemical analysis and hyperspectral imaging of latent
fingerprints. In: 16th Meeting of the International Association of Forensic
Sciences. International Association of Forensic Sciences. (2002) 61-64.
23. A.G. Mercado, J.A. Janni, B. Gilbert, Image analysis of explosives
fingerprint contamination using a Raman imaging spectrometer. Proc
SPIE. 2511 (1995) 142-152.

136
24. C. Ricci, S. Bleay, S.G. Kazarian, Spectroscopic Imaging of Latent
Fingermarks Collected with the Aid of a Gelatin Tape. Anal. Chem. 79
(2007) 5771-5776.
25. K.A. Mountfort, H. Bronstein, N. Archer, S.M. Jickells, Identification of
oxidation products of squalene in solution and in latent fingerprints by
ESI-MS and LC/APCI-MS. Anal. Chem. 79 (2007) 2650-2657.
26. G.M. Mong, C.E. Petersen, T.R.W. Clauss, Advanced Fingerprint
Analysis Project - Fingerprint Constituents. Vol PNNL-13019. Pacific
Northwest National Laboratory: U.S. Department of Energy. (1999).
27. N.E. Archer, Y. Charles, J.A. Elliott, S. Jickells, Changes in the lipid
composition of latent fingerprint residue with time after deposition on a
surface. Forensic Sci. Int. 154 (2005) 224-239.
28. R.S. Croxton, M.G. Baron, D. Butler, T. Kent, V.G. Sears, Variation in
amino acid and lipid composition of latent fingerprints. Forensic Sci. Int.
199 (2010) 93-102.
29. R. Ramotowski, Composition of Latent Print Residues, in: Advanced in
Fingerprint Technology, 2nd Ed. (Lee. H, Gaensslen. R, eds.). London:
CRC Press (2001).
30. A. Srivastava, R. Prasad, Triglycerides-based diesel fuels. Renew. Sust.
Energy Rev. 4 (2000) 111-113.
31. B.B. Dent, S.L. Forbes, B.H. Stuart, Review of human decomposition
processes in soil. Environ. Geol. 45 (2004) 576-585.
32. R. Wolstenholme, R. Bradshaw, M.R. Clench, S. Francese, Study of
latent fingermarks by matrix-assisted laser desorption/ionisation mass
spectrometry imaging of endogenous lipids. Rapid Commun. Mass
Spectrom. 23 (2009) 3031-3039.

137
33. C. Weyermann, C. Roux, C. Champod, Initial Results on the Composition
of Fingerprints and its Evolution as a Function of Time by GC/MS
Analysis. J. Forensic Sci. 56 (2011) 102-108.
34. L. Iuliano, Pathways of cholesterol oxidation via non-enzymatic
mechanisms. Chem. Phys. Lipids. 164 (2011) 457-468.
35. S.K. Kim, W.W. Nawar, Oxidative interactions of cholesterol with
triacylglycerols. J. Am. Oil Chem. Soc. 68 (1991) 931-934.
36. A. Girod, R. Ramotowski, C. Weyermann, Composition of fingermark
residue: A qualitative and quantitative review. Forensic Sci. Int. 223
(2012) 10-24.
37. M.V. Buchanan, K.G. Asano, A. Bohanon, Chemical Characterization of
fingerprints from adults and children. Int. Soc. Opt. Eng. 2941 (1996) 89-
95.
38. D.K. Williams, C.J. Brown, J. Bruker, Characterization of children’s latent
fingerprint residues by infrared microspectroscopy: Forensic implications.
Forensic Sci. Int. 206 (2011) 161-165.
39. D. Noble, Vanished into thin air. The search for children’s fingerprints.
Anal. Chem. 67 (1995) 435A-438A.
40. K.M. Antoine, S. Mortazavi, L.M. Miller, Chemical differences are
observed in children’s versus adults’ latent fingerprints as a function of
time. J. Forensic Sci. 55 (2010) 513-518.
41. M.J. Bailey, N.J. Bright, S. Hinder, Chemical characterization of latent
fingerprints by matrix-assisted laser desorption ionization, time-of-flight
secondary ion mass spectrometry, mega electron volt secondary mass
spectrometry, gas chromatography/mass spectrometry, X-ray
photoelectron spec. Anal. Chem. 84 (2012) 8514-8523.
42. S. Cadd, M. Islam, P. Manson, S. Bleay, Fingerprint composition and
aging: A literature review. Sci. Justice. 55 (2015) 219-238.

138
43. A. Girod, L. Xiao, B. Reedy, C. Roux, C. Weyermann, Fingermark initial
composition and aging using Fourier transform infrared microscopy (μ-
FTIR). Forensic Sci. Int. 254 (2015) 185-196.
44. F. Cuthbertson, J.R. Morris, The Chemistry of Fingerprints,
memorandum332; (1972).
45. P. Fritz, W. van Bronswjik, K. Lepkova, Infrared microscopy studies of the
chemical composition of latent fingermark residues. Microchem. J. 111
(2013) 40-46.
46. M. Picardo, C. Zompetta, C. De Luca, Squalene peroxides may contribute
to ultraviolet light-induced immunological effects. Photodermatol
Photoimmunol Photomed. 8 (1991) 105-110.
47. A. Johnston, K.D. Rogers, The Effect of Moderate Temperatures on
Latent Fingerprint Chemistry. Appl. Spectrosc. 71 (2017) 2102-2110

139
CHAPTER 8. DISCUSSION
8.1 Implications and impact
The overarching aim of this body of work was to investigate the dynamic nature
of latent fingermark chemistry. Additionally, the content within this thesis strived
to, where possible, progress from academic research into fingermark chemistry
to research with genuine practical applications for forensic science. Figure 45
shows how each paper develops from academic knowledge toward practical
information for the forensic community.
Figure 45: The development of papers from academic research to practical
forensic relevance
An understanding of the applications and limitations of FTIR spectroscopy was
vital before any further research could be achieved. FTIR spectroscopy has been
used within forensic science in one form or another for almost 40 years, yet the
majority of research into latent fingermarks has been undertaken by MS and its
derivatives. As outlined in paper 1, however, FTIR spectroscopy can provide a
rapid, non-destructive, holistic approach to the analysis of fingermark chemistry,
capable of analysing the relationship between the various functional groups and
the total organic composition (represented by the antisymmetric and symmetric

140
C-H stretch of CH2 groups), for example. Unlike GC-MS, a latent fingermark can
be viewed as a complete system using FTIR spectroscopy, and the relationship
between specific molecular groups within that system can be analysed and
chemically mapped, thus not only providing chemical analysis of the sample but
also spatial information about the fingermark. GC-MS can quantifiably measure
specific compounds within a fingermark and has been instrumental in developing
our understanding of latent fingermark chemistry, albeit with time-consuming
sample preparation and destruction of the sample. Within the context of specific
molecular identification this is not possible using FTIR spectroscopy, and, as in
paper 1, cosmetic contaminants, similar in composition to natural sebaceous
secretions, can distort the IR spectra and could produce misleading results,
whereas GC-MS can identify these contaminants and factor them into any
analysis.
FTIR spectroscopy, therefore, appeared to be ideally suited for the analysis of
latent fingermark chemistry as a whole and investigating the molecular
interactions that take place within a fingermark post-deposition. Paper 1 outlined
the capabilities of FTIR spectroscopy and dictated the areas of research that
would ultimately lead to paper 4 and the investigation of contaminant degradation
within latent fingermarks. As mentioned previously understanding the limitations
of FTIR spectroscopy was essential to the author in directing further research,
however, there is a wider impact to this work as well. Published research has
investigated the various analytical techniques applied to the analysis of latent
fingermark chemistry [1-12], but a direct comparison between FTIR spectroscopy
and GC-MS as reported in paper 1 had only been carried out by Bailey et al [1],
amongst other analytical techniques. Information within this paper could be
important for crime scene investigators and forensic laboratories as it could
contribute to procedural change as to how fingermarks are analysed in the future
to maximize evidence retrieval. Alternatively, a summary of this work could be
incorporated into an operating guide or decision making tool advising on how best
to process and analyse fingermark evidence. It is not uncommon for
manufacturers to make exaggerated claims regarding the capabilities of their

141
analytical tool, which can be misleading for a new user, especially when acquiring
an unfamiliar technology. The research in paper 1 could contribute to this
decision-making process, and be used as part of an independent ‘buyers’ guide'
to the two orthogonal technologies, and their appropriateness for requirements.
Fingermark degradation is arguably the most active area of fingermark research
currently, because it has the potential to impact on obtaining critical biometric
information on an individual, and perhaps more importantly, for establishing time
since deposition of that fingermark. Establishing when a fingermark was
deposited would potentially enable a suspect to be ruled in or out of an
investigation. By analysis of the known mechanisms of degradation, there is the
potential to develop a ‘model of fingermark aging’ which could be used to indicate
the time since deposition of a latent fingermark. Degradation mechanisms such
as; oxidation of squalene (SQ) to SQ hydroperoxide intermediates, the presence
of the known SQ oxidation end products, hexanedioic acid or pentanedioic acid,
a high concentration of saturated fatty acids and low concentration of triglycerides
and unsaturated fatty acids would all be integral to developing this model in
adults. There has been significant research into this area of fingermark chemistry,
but there remain gaps in our understanding that have prevented the development
of such a model. Although certain molecular degradation products have been
identified (or at least proposed) within latent fingermarks [11,13-31], the
fundamental cause of these degradation pathways, i.e. the intermolecular
interactions between the molecular species, is poorly understood. This is
primarily because studying the behaviour and impact of a single compound,
cholesterol, for example, is almost impossible within the complex matrix of
components that make up a latent fingermark. It is because of this, and an
understanding of the capabilities of FTIR spectroscopy derived from paper 1, that
the research for paper 3 was developed.
Arguably, the only way to gain an understanding of the influence of a particular
molecular component on the entire chemical system within a latent fingermark is
to develop a simplified analogue. Such as presented in paper 3.

142
FTIR spectroscopy (in particular mid-range FTIR) is ideally suited to this type of
analysis. Through peak area calculations of common functional groups, it was
possible to study a whole chemical system, and, by creating simplified analogue
samples that represent the basic chemical makeup of a latent fingermark, that
system can be controlled and modified. The results reported in paper 3
demonstrated that two key molecules, squalene and cholesterol, are instrumental
in influencing the intermolecular interactions within the analogue samples. As
stated in paper 3, caution must be observed when comparing these simplified
solutions to natural fingermarks. However, this data does support previous
findings on the influence of these two compounds on key degradation processes
[11, 24, 29, 32], and hence, for the first time, a suggested molecular interaction
pathway was proposed (figure 46).
Figure 46: Proposed molecular interaction pathway of key fingermark
components post-deposition

143
This paper aimed to provide a focus for further research into the critical
intermolecular interactions that contribute to latent fingermark degradation in a
way that is not possible when studying natural fingermarks. It is not possible to
completely remove squalene from a natural fingermark, for example, and
examine the impact on degradation processes. So although these analogue
solutions, no matter how complex, will always be simplified representations of
natural fingermarks, they can provide indicators into the processes that may be
occurring within a natural fingermark system. Research into fingermark
degradation can then be built around these indicators. For example, children's
fingermarks contain low levels of squalene and triglycerides; so does cholesterol
degradation occur at the same rate and to the same extent in children's
fingermarks as in adults? Do the free fatty acids in children's fingermarks remain
in higher concentrations than that of adults because there are fewer triglyceride
or squalene degradation products to interact with, and as a result, these free fatty
acids evaporate more rapidly? Questions such as these are vital in advancing our
understanding of fingermark degradation chemistry in both adults and children,
and simplified models can guide these investigations. Currently the vast majority
studies into fingermark degradation chemistry are limited to areas of academic
interest and developing a broader understanding of the field. The research is still
a significant way off the ultimate goal of enabling the development of a robust
model of degradation that can be applied to crime scene investigations. If such a
model can be developed, which accounts for the broad inter- and intra-variability
within fingermark chemistry, and capable of providing an accurate estimation of
time since deposition for a fingermark found at a crime scene (that is admissible
in a court of law), then it is likely that this will only happen with the integration of
all avenues of research into fingermark chemistry, previous and on-going. This
would include the continuing work on the identification of degradation products
from various key chemical components using an array of analytical techniques,
studies using extremely large sample groups looking into the intra- and inter-
variability within fingermark chemistry, and the development of simplified models
that can then be applied to natural fingermark behaviour. Also, the development
of increasingly complex analogue solutions that behave more like natural

144
fingermarks, a current issue with synthetic solutions, will be a strong indication of
a more comprehensive understanding of natural fingermark chemistry post-
deposition.
Papers 1 and 3 were essential research projects for the author that provided an
advanced understanding of the capabilities of FTIR spectromicroscopy, and an
understanding of latent fingermark composition and degradation. An objective of
the overall body of work, however, was to take this knowledge and apply it to
more practical applications for FTIR spectromicroscopy that could have a more
immediate impact on forensic investigations requiring fingermark analysis. Paper
2 investigated the effects of moderate temperature variations on latent fingermark
chemistry. This research addressed a gap in the literature on the impact of
moderate temperatures on latent fingermark chemistry over a short period of
time. The vast majority of the published data looked at exposure to extreme
temperatures, such as fires, IED detonations, and gunshot propellant [27, 28, 33-
36].
A latent fingermark is not typically deposited in a static environment, and will
experience (sometimes dramatic) variations in diurnal temperatures. In the UK,
temperatures at certain crime scenes, typically enclosed spaces with no
ventilation, inside vehicles for example, can routinely vary from 0oC to 38oC as
reported by the London Metropolitan Police, and in more arid or tropical climates,
such as southern Europe, or the Middle East (where the UK is currently providing
forensic training programmes to countries such as Afghanistan and Iraq),
temperatures at crime scenes have exceeded 55oC. Paper 2 demonstrated that
a significant reduction in fingermark composition could be observed at
temperatures above 55oC, and, unsurprisingly, higher temperatures saw a more
rapid and complete reduction in composition. With temperatures below 55oC
fingermark chemistry was relatively stable within the first 5 hours post-deposition,
although whatever the temperature there was evidence that oxidation processes
had already begun within this timeframe (figure 47).

145
Figure 47: Evidence of oxidation processes taking place over the first 5 hours
post-deposition of a latent fingermark
These results could help CSI's prioritise evidence collection and, in extreme
environments, remove latent fingermarks from the crime scene to a more stable
environment for analysis, if for nothing else to preserve the ridge patterns for
development. This work could become even more relevant if, as discussed
previously, a model for fingermark degradation to establish time since deposition
can be developed and utilised for crime scene analysis. Variations in
environmental temperature will likely have a significant effect on the oxidation
processes within a latent fingermark, as reported in paper 2, and this would have
to be factored into any model that accurately estimates time since deposition.
This paper exemplifies the complexities involved in developing such a reliable
model that can be used by forensic and law enforcement agencies, and how
much further work is required in this area.
Paper 4 was designed to be of immediate use to the forensic community, and to
be the culmination of the knowledge gained from papers 1-3. The detection of
exogenous, typically illicit, particulate at a crime scene is of obvious benefit to
crime scene investigators, and the detection of these compounds within latent
fingermarks can narrow an investigation to particular persons of interest.
Currently, the detection of narcotics or even explosive precursors, if done at all,
is done by variations on mass spectrometry; extremely reliable, but usually
labourious, and ultimately requires the destruction of the sample. Non-destructive
techniques such as Raman and FTIR spectroscopy have been shown capable of

146
detecting various explosives/precursors and narcotic particulate [37-44], but are
not commonly utilised as part of a forensic investigation SOP.
There were two issues with the research papers referenced in paper 4 which
were worthy of address. Firstly, the choice of explosive particulate to be analysed
in these papers were typically military grade explosives, such as TNT, RDX and
PETN (although ammonium nitrate was also investigated). These types of
explosive are no longer routinely used by terrorist organisations. These
compounds, commonly used by terrorist groups in the post-war era until the turn
of the century, Semtex (RDX & PETN) used in the Lockerbie bombing of 1988 for
example, have passed out of favour with terrorist groups primarily due to a lack
of access, a global tightening of security regarding these explosive compounds,
and their complexity of synthesis. Terrorist groups now, almost universally, opt
for ‘homemade’ explosive mixtures, IED’s, synthesised from domestically
available products which are almost impossible to monitor by the authorities, and
are easy to make with instructions available on the internet. For this reason, the
author selected two common IED precursors, ammonium nitrate, and sodium
chlorate, both still commonly found in use by terrorist cells around the world.
The second issue the author aimed to address was that in previous research the
contaminated fingermarks were analysed immediately after deposition. This is
unrealistic concerning a criminal investigation; a crime scene, and any
fingermarks within it, may not be identified by police for days or even weeks after
an incident. The recently failed detonation of an IED at Parson's Green, London,
is an example, the attack took place on the 15th September 2017, but forensic
officers were establishing crime scenes and lifting aged fingermarks 14 days
later. Therefore, as discussed previously, those fingermarks of interest were likely
to have begun to degrade. Any interactions between the exogenous particulate
within the fingermarks and the degrading endogenous components could have
an impact on their detectability over time.

147
Paper 4 demonstrated that, after 30 days, all three contaminants analysed
(ammonium nitrate, sodium chlorate, and cocaine) were detected (figure 48).
There had been no significant degradation evident for sodium chlorate and
cocaine, however, ammonium nitrate showed a 31% decrease in absorbance
(and therefore quantity) over the first 10 days. This demonstrates that ammonium
nitrate is prone to a degree of degradation, but perhaps more significantly,
indicates that degradation of certain contaminants may well occur within the first
10 days' post-deposition when the water content of a fingermark is at its highest
and the oxidation of unsaturated lipids will be most active.
Figure 48: The detection of ammonium nitrate in a latent fingermark
This research, therefore, has significant implications for law enforcement
agencies. Not only does it demonstrate the effective use of FTIR
spectromicroscopy in non-destructively identifying, and chemically mapping, illicit
compounds weeks after deposition, but it shows that certain compounds of
interest, considered chemically stable, may degrade faster than others, and
should be prioritised where possible during an investigation.

148
This body of work has demonstrated the effectiveness of FTIR spectroscopy as
a tool for academic research into fingermark chemistry, and as practical tool that
can be utilised by law enforcement agencies. The principal advantage of FTIR
spectroscopy is the rapid, non-destructive analysis of latent fingermarks, both in
terms of immediate benefit to forensic investigators, i.e. illicit substance detection,
and the potential long-term applications, i.e. biometric analysis of fingermark
chemistry, and temporal modelling.
The non-destructive nature and rapid analysis of FTIR spectroscopy can be
utilised as a decision-making tool within a crime scene investigation, providing
CSI's and investigating officers with the capability to rapidly analyse, and
chemically map fingermarks (for both illicit substance detection and to provide a
ridge pattern for suspect identification). The results of which provide information
that could aid decision making and direct a line of enquiry.
Future advancements in technology could conceivably see analysis being even
faster through the development of portable IR spectroscopic detectors designed
for fingermark analysis, allowing for presumptive sampling at the crime scene.
This is not a near future capability and would require significant research and
development (R&D) to achieve a workable Technology Readiness Level (TRL),
but the component parts of such a device are already in existence, such as micro-
staring array detectors, portable imaging ATR technologies and linear micro-
scanners. With such a technology it is conceivable that fingermarks could be lifted
from a crime scene on a bespoke substrate and placed onto a portable or vehicle-
based IR detector. The fingermark would then be analysed for lipid content, illicit
substances, and chemically mapped, obtaining images of ridge patterns that
could be uploaded to the national fingermark database. The pathway of
development could be envisaged in much the same way as explosive detectors
have evolved in the post-9/11 era (figure 49).
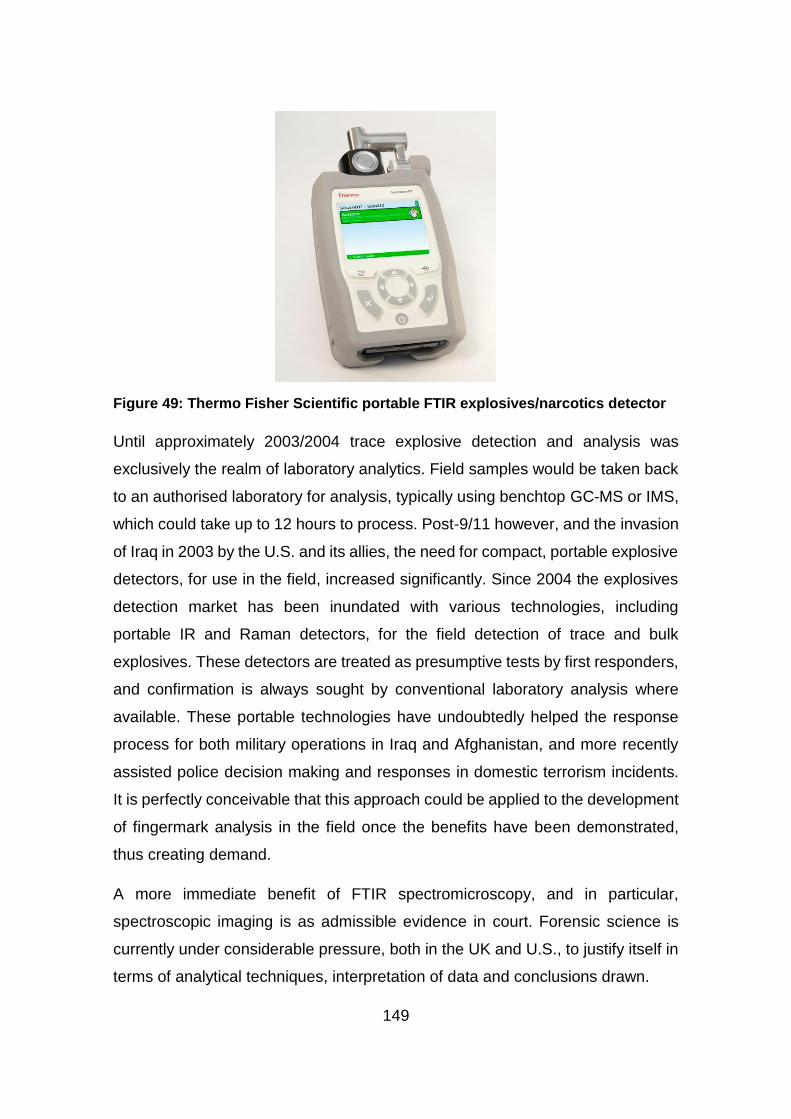
149
Figure 49: Thermo Fisher Scientific portable FTIR explosives/narcotics detector
Until approximately 2003/2004 trace explosive detection and analysis was
exclusively the realm of laboratory analytics. Field samples would be taken back
to an authorised laboratory for analysis, typically using benchtop GC-MS or IMS,
which could take up to 12 hours to process. Post-9/11 however, and the invasion
of Iraq in 2003 by the U.S. and its allies, the need for compact, portable explosive
detectors, for use in the field, increased significantly. Since 2004 the explosives
detection market has been inundated with various technologies, including
portable IR and Raman detectors, for the field detection of trace and bulk
explosives. These detectors are treated as presumptive tests by first responders,
and confirmation is always sought by conventional laboratory analysis where
available. These portable technologies have undoubtedly helped the response
process for both military operations in Iraq and Afghanistan, and more recently
assisted police decision making and responses in domestic terrorism incidents.
It is perfectly conceivable that this approach could be applied to the development
of fingermark analysis in the field once the benefits have been demonstrated,
thus creating demand.
A more immediate benefit of FTIR spectromicroscopy, and in particular,
spectroscopic imaging is as admissible evidence in court. Forensic science is
currently under considerable pressure, both in the UK and U.S., to justify itself in
terms of analytical techniques, interpretation of data and conclusions drawn.

150
The "misuse and misunderstanding of forensic evidence" (Hugh Miller. Traces of
Guilt: Forensic Science Under the Microscope) has led to a number of
miscarriages of justice in recent years, and some cases have led to a wide-scale
review of forensic practices. Most recently in the UK for example, two forensic
scientists were arrested for manipulating hundreds of drugs tests in a forensic
laboratory in Manchester in 2017. In the U.S. a case was thrown out of court
because the complexity of the analytical technique used was “well beyond the
understanding of even a reasonably educated U.S. citizen” according to the
presiding judge.
The scientific principles of most analytical techniques, including FTIR
spectroscopy, require a relatively advanced level of scientific understanding, and
the presentation of any results from these techniques in court is usually reliant on
the jury understanding the basic principles of that technique. Presenting a GC-
MS chromatogram to identify the presence of a narcotic or explosive for example,
requires a complex explanation of the peaks present and how they relate to
chemical composition of the analyte. Presenting that same information using a
spectroscopic image, however (paper 4), that looks like a fingermark, with an
identifiable ridge pattern, and the exogenous particles of interest visible, has far
more of a visual impact, and is more accessible to a jury with varying scientific
backgrounds.
FTIR spectroscopy is now considered an established forensic tool for the analysis
of latent fingermarks, but its use is primarily focused on academic research and
the advancement of knowledge as opposed to a technique routinely used by
practising forensic examiners applied to criminal investigations. Currently the
chemical analysis of latent fingermarks to detect trace amounts of illicit
substances are not often (if ever) carried out by CSI's, and certainly, our
understanding of latent fingermark chemical composition is not yet sufficient to
be utilised by law enforcement agencies for determining much biometric
information. The work presented here has demonstrated the ability of FTIR
spectromicroscopy to not only advance our academic understanding of latent
fingermark chemistry, but also provided research of genuine and immediate use

151
to the forensic community. This work can now be expanded upon and builds a
case for the use of FTIR spectromicroscopy as an essential tool for criminal
investigations.

152
8.2 References
1. M.J. Bailey et al, Chemical characterization of latent fingerprints by
matrix-assisted laser desorption ionization, time-of-flight secondary ion
mass spectrometry, mega electron volt secondary mass spectrometry,
gas chromatography/mass spectrometry, X-ray photoelectron spec., and
attenuated total reflection Fourier Transform Infrared Spectroscopic
Imaging: An Intercomparison. Anal. Chem. 84 (2012) 8514-8523.
2. C. Weyermann, C. Roux, C. Champod, Initial Results on the Composition
of Fingerprints and its Evolution as a Function of Time by GC/MS
Analysis. J. Forensic Sci. 56 (2011) 102-108.
3. R. Ramotowski, Composition of Latent Print Residues, in: Advanced in
Fingerprint Technology, 2nd Ed. (Lee. H, Gaensslen. R, eds.). London:
CRC Press (2001).
4. A. Koenig, A. Girod, C. Weyermann, Identification of wax esters in
fingermark residues by GC/MS and their potential use as aging
parameters. J. Forensic Ident. 61(6) (2011) 652-76.
5. S. Francese, R. Bradshaw, L.S. Ferguson, R. Wolstenholme, M.R.
Clench, S. Bleay, Beyond the ridge pattern: Multi-informative analysis of
latent fingermarks by MALDI mass spectrometry. Analyst. 138 (15)
(2013) 4215-4228.
6. L. Ferguson, R. Bradshaw, R. Wolstenholme, M. Clench, S. Francese,
Two-Step Matrix Application for the Enhancement and Imaging of Latent
Fingermarks. Anal. Chem. 83 (14) (2011) 5585–5591.
7. R. Wolstenholme, R. Bradshaw, M.R. Clench, S. Francese, Study of
latent fingermarks by matrix-assisted laser desorption/ionisation mass
spectrometry imaging of endogenous lipids. Rapid Commun. Mass
Spectrom. 23 (2009) 3031-3039.

153
8. R. Bradshaw, W. Rao, R. Wolstenholme, M.R. Clench, S. Bleay, S.
Francese, Separation of overlapping fingermarks by Matrix Assisted
Laser Desorption Ionisation Mass Spectrometry Imaging. Forensic
science international. 222 (1–3) (2012) 111-124
9. R. Bradshaw, S. Bleay, R. Wolstenholme, M.R. Clench, S. Francese,
Towards the integration of matrix assisted laser desorption ionisation
mass spectrometry imaging into the current fingermark examination
workflow. Forensic Sci Int. 232 (2013) 111-124.
10. B. Emerson, B. Durham, J. Gidden, J.O. Lay, Laser desorption/ionization
time-of-flight mass spectrometry of triacylglycerols and other components
in fingermark samples. J Forensic Sci. 56 (2) (2011) 381-389.
11. K.A. Mountfort, H. Bronstein, N. Archer, S.M. Jickells, Identification of
oxidation products of squalene in solution and in latent fingerprints by
ESI-MS and LC/APCI-MS. Anal. Chem. 79 (2007) 2650-2657.
12. A.Y. Lim, J. Ma, Z. Ma, F. Rowell, Separation of fingerprint constituents
using magnetic silica nanoparticles and direct on-particle SALDI-TOF-
mass spectrometry. Journal of Chromatography B. 879 (23) (2011)
2244–2250.
13. S. Cadd, M. Islam, P. Manson, S. Bleay, Fingerprint composition and
aging: A literature review. Sci. Justice. 55 (2015) 219-238.
14. A. Girod, L. Xiao, B. Reedy, C. Roux, C. Weyermann, Fingermark initial
composition and aging using Fourier transform infrared microscopy (μ-
FTIR). Forensic Sci. Int. 254 (2015) 185-196.
15. F. Cuthbertson, J.R. Morris, The Chemistry of Fingerprints,
memorandum332; (1972).

154
16. N.E. Archer, Y. Charles, J.A. Elliott, S. Jickells, Changes in the lipid
composition of latent fingerprint residue with time after deposition on a
surface. Forensic Sci. Int. 154 (2005) 224-239.
17. R.S. Croxton, M.G. Baron, D. Butler, T. Kent, V.G. Sears, Variation in
amino acid and lipid composition of latent fingerprints. Forensic Sci. Int.
199 (2010) 93-102.
18. A. Girod, R. Ramotowski, C. Weyermann, Composition of fingermark
residue: A qualitative and quantitative review. Forensic Sci. Int. 223
(2012) 10-24.
19. P. Fritz, W. van Bronswjik, K. Lepkova, Infrared microscopy studies of
the chemical composition of latent fingermark residues. Microchem. J.
111 (2013) 40-46.
20. C. Weyermann, C. Roux, C. Champod, Initial Results on the Composition
of Fingerprints and its Evolution as a Function of Time by GC/MS
Analysis. J. Forensic Sci. 56 (2011) 102-108.
21. G.M. Mong, C.E. Petersen, T.R.W. Clauss, Advanced Fingerprint
Analysis Project - Fingerprint Constituents. Vol PNNL-13019. Pacific
Northwest National Laboratory: U.S. Department of Energy. (1999).
22. M. Picardo, C. Zompetta, C. De Luca, Squalene peroxides may
contribute to ultraviolet light-induced immunological effects.
Photodermatol Photoimmunol Photomed. 8 (1991) 105-110.
23. A. Srivastava, R. Prasad, Triglycerides-based diesel fuels. Renew. Sust.
Energy Rev. 4 (2000) 111-113.
24. L. Iuliano, Pathways of cholesterol oxidation via non-enzymatic
mechanisms. Chem. Phys. Lipids. 164 (2011) 457-468.

155
25. T. Atherton, R. Croxton, M. Baron, J. Gonzalez-Rodriguez, L. Gámiz-
Gracia, A.M. García-Campańa. Analysis of amino acids in latent
fingerprint residue by capillary electrophoresis-mass spectrometry. J.
Sep Sci. 2012. 35:2994-2999.
26. A. Stadtman, A. Cherkes, C. Anfinsen, Studies on the microbiological
degradation of cholesterol, J. Biol. Chem. 206 (2) (1954) 511–523.
27. A. Richmond-Aylor, S. Bell, P. Callery, K. Morris. Thermal degradation
analysis of amino acids in fingerprint residue by pyrolysis GC-MS to
develop new latent fingerprint developing reagents. J. Forensic Sci.
2007. 52(2):380-382.
28. G. De Paoli, S.A. Lewis, E.L. Schuette, L.A. Lewis, R.M. Connatser, T.
Farkas. Photo- and thermal-degradation studies of select eccrine
fingerprint constituents. J. Forensic Sci. 2010. 55(4):962-969.
29. S. K. Kim and W. W. Nawar, Parameters influencing cholesterol
oxidation, Lipids. 28 (10) (1993) 917–922.
30. R.S. Greene, D.T. Downing, P.E.Pochi, J.S. Strauss, Anatomical
Variation in the Amount and Composition of Human Skin Surface Lipid.
J. Inv. Derm. 54 (3) (1970) 240–247.
31. L. L. Smith, Cholesterol autoxidation 1981–1986, Chem. Phys. Lipids. 44
(2–4) (1987) 87–125.
32. S.K. Kim, W.W. Nawar, Oxidative interactions of cholesterol with
triacylglycerols. J. Am. Oil Chem. Soc. 68 (1991) 931-934.
33. A.G. Brown, D. Sommerville, B.J Reedy, R.G Shimmon, M. Tahtouh.
Revisiting the thermal development of latent fingerprints on porous
surfaces: new aspects and refinements. J. Forensic Sci. 2009. 54(1):114-
121.

156
34. A. Dominick, N. Nicdaeid, S. Bleay, V. Sears. The recoverability of
fingerprints on paper exposed to elevated temperatures -Part 1:
comparison of enhancement techniques. J. Forensic Identif. 2010. 59(3):
325-339.
35. C.M.A. Girelli, B.J.M. Lobo, A.G. Cunha, J.C.C. Freitas, F.G. Emmerich,
Comparison of practical techniques to develop latent fingermarks on fired
and unfired cartridge cases, Forensic Sci. Int. 250 (2015) 17–26.
36. W.W. Harper. Latent Fingerprints at High Temperatures. J. Crim Law
Criminol. 1938. 29(4):580-583.
37. A. Grant, T.J. Wilkinson, D.R. Holman, M.C. Martin, Identification of
Recently Handled Materials by Analysis of Latent Human Fingerprints
Using Infrared Spectromicroscopy. Appl. Spectrosc. 59 (2005) 1182-
1187.
38. D.K. Williams, R.L. Schwartz, E.G Bartick, Analysis of Latent Fingerprint
Deposits by Infrared Microspectroscopy. Appl. Spectrosc. 58 (2004) 313-
316
39. J.S. Day, H.G. Edwards, S.A. Dobrowski, A.M. Voice, The detection of
drugs of abuse in fingerprints using Raman spectroscopy II:
cyanoacrylate-fumed fingerprints. Spectrochim. Acta. Part A Mol. Biomol.
Spectrosc. 60 (2004) 1725-1730.
40. C. Cheng, T. Kirkbride, D. Batchelder, R. Lacey, T. Sheldon, In Situ
Detection and Identification of Trace Explosives by Raman Microscopy
BT - In Situ Detection and Identification of Trace Explosives by Raman
Microscopy. (1995).
41. M.J. West, M.J. Went, The spectroscopic detection of exogenous
material in fingerprints after development with powders and recovery with
adhesive lifters. Forensic Sci. Int. 174 (2008) 1-5.

157
42. A. Tripathi, E.D. Emmons, P.G. Wilcox, Semi-Automated Detection of
Trace Explosives in Fingerprints on Strongly Interfering Surfaces with
Raman Chemical Imaging. Appl. Spectrosc. 65 (2011) 611-619.
43. Y. Mou, J.W. Rabalais, Detection and Identification of Explosive Particles
in Fingerprints Using Attenuated Total Reflection-Fourier Transform
Infrared Spectromicroscopy. J. Forensic Sci. 54 (2009) 846 - 850.
44. C. Ricci, S. Bleay, S.G. Kazarian, Spectroscopic Imaging of Latent
Fingermarks Collected with the Aid of a Gelatin Tape. Anal. Chem. 79
(2007) 5771-5776.

158
CHAPTER 9. CONCLUSIONS AND
RECOMMENDATIONS FOR FUTURE WORK
Outline
Conclusions drawn from this work are presented, in addition to recommendations
for future work. Finally, an explanation of the key contributions of this research to
general knowledge and specifically to the development of IR spectroscopy as a
tool for criminal investigations is provided.
9.1 Research conclusions
During this work, the dynamic nature of latent fingermark chemistry was
investigated.
Initially, the capabilities and limitations of FTIR spectroscopy were compared to
that of GC-MS, the gold standard in the analysis of latent fingermarks. The ability
of FTIR spectromicroscopy to identify specific functional groups within latent
fingermarks and provide spatial maps of these functional groups was
demonstrated. Although FTIR spectroscopy could not achieve the specificity of
GC-MS in providing data on specific compounds, such as a specific fatty acid or
wax ester, FTIR spectroscopy did allow for the analysis of a fingermark as a
holistic system. Using the symmetric and asymmetric C-H stretch of CH2 groups
at 2924 cm-1 - 2854 cm-1 as the combination of all the organic material within the
fingermark it was possible to compare that to specific functional groups and study
their relationship, something not possible using GC-MS analysis. This
investigation did demonstrate how FTIR spectra could be distorted by lipid-based
cosmetics such as moisturisers which will contribute to the symmetric and
asymmetric C-H stretch of CH2 groups and potentially give a false representation
of the natural lipid content of a fingermark. GC-MS, due to its specificity, was
capable of identifying such exogenous compounds, even those with similar
chemical structures to endogenous lipids.
Paper 1 provided the basic understanding and groundwork for the following
research looking into the effects of moderate temperature variations on latent

159
fingermark chemistry. The versatility of FTIR spectromicroscopy enabled in situ
sampling while the sample was maintained at the required temperature. This
allowed for changes in fingermark chemistry to be observed in real time through
spectral analysis. Pure compounds such as squalene were also heated to identity
any trends in decomposition that were comparable to those observed within the
natural fingermarks. The study demonstrated that fingermarks heated to 55oC
and above showed a significant reduction in the quantity of lipid components over
the 5-hour period, but fingermarks heated to 45oC and below showed little change
in composition within the same period. Arguably the key finding from this study
was the identification of an increase in the OH stretch region (3250 cm-1) of all
the fingermarks analysed. This increase indicating that oxidation processes
within fingermarks are taking place almost immediately after deposition. Although
there appeared to be no relationship between time/temperature and the rate of
oxidation, the quantity of the oxidation products was temperature dependent, with
the higher temperatures (65oC and 75oC) limiting the concentration of hydroxide
groups being formed. This is most likely due to the loss of water and of the more
volatile organic compounds at these temperatures.
The study into moderate temperature dependent degradation of latent
fingermarks developed the idea of the importance of intermolecular interactions
for the degradation of fingermark composition post-deposition. Studying
intermolecular interactions in natural fingermarks is near impossible due to the
complex matrix of components that make up a fingermark. Removing or inhibiting
one compound to study its impact on the fingermark system as a whole is not
possible. Because of this a simplified analogue solution was developed,
containing only the most common components, which represented all the
compounds within that family. Serine, the most abundant amino acid,
represented all the amino acids present within a natural fingermark for example.
Additional solutions were then produced, each with a single component from the
control solution removed. This allowed for the impact of this compound on the
interactions with the remaining components to be investigated. FTIR
spectroscopy again demonstrated its versatility in analysing fingermark chemistry

160
as a system and by quantifying changes in peak width, and therefore
intermolecular interactions, in the absence or presence of a particular compound,
thus allowing the effect of these compounds on the system to be analysed.
The data suggested that squalene and cholesterol were critical in driving
intermolecular interactions within these solutions. The absence of these two
compounds caused a significant reduction in IR peak width not seen in the
absence of any other compounds. It was stressed that caution must be observed
when drawing direct comparisons between analogue samples and natural
fingermarks, as previous literature has stated, although much of this caution was
related to validation trials for fingermark development reagents. Within the
context of fundamental research, however, there is significant value in the use of
these simplified solutions as they can identify potential avenues of research that
would otherwise be impossible.
This research not only identified the potential importance of squalene and
cholesterol in intermolecular interaction pathways within fingermarks but also
provided an additional explanation for the behaviour of children's fingermarks.
The lack of squalene and triglycerides in children's fingermarks could inhibit the
degradation chain, and thus lipid compounds are unable to form more stable end
products. Short chain, unbranched fatty acids, typical of children's fingermarks,
as well as other lipids, are therefore more susceptible to evaporation; hence
children's fingermarks have been reported to ‘vanish' from a crime scene.
Finally, the culmination of this research was the detection of illicit compounds
within latent fingermarks over time using FTIR spectroscopy and spectroscopic
imaging. Previous research had demonstrated the ability of FTIR spectroscopy
to chemically map and identify (typically) military grade explosives within latent
fingermarks; however, these contaminated fingermarks were analysed
immediately after deposition. This, however, is unrealistic during criminal
investigations where fingermarks may not be discovered and collected for days
or even weeks after deposition. It was important therefore to investigate the effect
of natural fingermark degradation mechanisms on these contaminants over time.
For the first time an understanding of fingermark chemistry and degradation,

161
gained from the previous studies, was combined with the ability to chemically
identify and map illicit substances within latent fingermarks. The contaminants
used for the study were chosen for their current relevance regarding terrorist
activities and narcotics consumption in Western Europe and the US. Ammonium
nitrate (AN) and sodium chlorate (SC) are common IED precursors used by
terrorist cells all over the world, and cocaine (C) consumption has increased
significantly within Western societies and is no longer purely a recreational drug
of the wealthy.
The research in this study demonstrated that FTIR spectromicroscopy could
reliably detect and identify all three contaminants when compared to a control
sample and chemically map their distribution within a fingermark. Most
importantly it remained possible to detect all three contaminants up to thirty days
after deposition, with only a slight degradation of AN, almost entirely within the
first 10 days’ post-deposition. This degradation is likely due to the dynamic nature
of fingermark chemistry within the first ten days. The majority of oxidation
mechanisms taking place during this time period, thus unsaturated lipids would
interact with the ammonium and nitrate ions, and the water content within the
fingermark is at its highest making ion dissociation more likely.
The work presented in this thesis has demonstrated the capabilities of FTIR
spectroscopy as a holistic analytical tool for the analysis of latent fingermarks.
FTIR spectromicroscopy has shown capable of identifying key functional groups
and their intra-variability, as well as mapping their distribution within the
fingermark. For the first time, the versatility of FTIR spectromicroscopy allowed
for the in situ, real-time analysis of latent fingermarks whilst subjected to varying
temperatures, and the study of intermolecular interactions of analogue
representations of latent fingermarks. The culmination of the work being the
identification and mapping of contaminants within latent fingermarks over time.
This research is unique to the capabilities of FTIR spectroscopy and
spectromicroscopy and would not be possible utilising alternative analytical
techniques such as GC-MS or MALDI-TOF-MS, primarily due to the destructive
nature of these techniques. This study has demonstrated a role for FTIR

162
spectroscopy not only for the academic study of latent fingermark chemistry and
behaviour, but also as a tool for forensic scientists to rapidly gather valuable
forensic evidence on an individual without destroying the fingermark. As our
understanding of fingermark composition and aging develops, and more reliable
aging models can be generated, then FTIR spectroscopy is likely to have an even
greater role for the forensic investigator. The technique could be used to rule
fingermarks in or out of an investigation based on their state of chemical
decomposition, to establish an age range, gender, and even time since
deposition. With the miniaturisation of key technologies, this could conceivably
be done as a presumptive test at the crime scene, or in a mobile laboratory, and
help to guide an investigation to focus on a particular avenue of enquiry.

163
Analysis of latent fingermarks using both FTIR spectroscopy and GC-MS
Comparison of data obtained from each technique and to that of existing literature
Latent fingermarks heated to between 25oC and 75oC and analysed in situ over 5h
Peak area calculations used to measure changes in quantity of functional groups
Development of simplified analogue composition of a latent fingermark
Removal of a molecular component
Variation in IR peak width
Contamination of fingermarks with AN,
SC, and C
Variations in absorbance of contaminants over time
Chemical
mapping
FT
IR s
pectr
oscopic
ana
lysis
of la
tent finge
rmark
s
Objective 1
FTIR v GC-MS
Capability & limitations
Objective 2
The effect of moderate temperature variations
0-5 hr
Objective 3
Investigate the intermolecular interactions
that lead to latent fingermark degradation
Objective 4
The ability of FTIR spectroscopy to identify
illicit contaminants in fingermarks
Relationship between specific functional groups identified using FTIR
GC-MS demonstrated significant intra-variability between fingermarks
Unlike GC-MS, FTIR unable to differentiate certain cosmetic contaminants from natural secretions
Reduction in quantity of all
materials at 55oC and over
Oxidation processes occur at all
temperatures but more rapidly at
higher temperatures
The presence of squalene and
cholesterol have a critical role in
intermolecular interactions within
the analogue solutions
Potential impact of these
compounds on degradation
pathways in natural fingermarks
Possible explanation for behaviour
of children’s fingermarks
Spectroscopic imaging detected
AN, SC, and C up to 30 days
after deposition
Some degradation of AN over
time
Any degradation of illicit
compounds likely to occur within
first 10 days since deposition.

164
9.2 Contribution to knowledge
The work presented in this thesis focused on critical gaps in the literature and
provided new insights into the behaviour of latent fingermarks. The results
provide a significant contribution to knowledge across a wide range of disciplines
within latent fingermark research.
Within the field of fingermark chemistry research, the chemical degradation of
fingermarks has been, and continues to be, comprehensively studied, particularly
focusing on degradation products. Research has shown that fingermark
degradation is significantly affected by environmental conditions, such as light,
temperature, and humidity, but little research had focused on the short-term
effects of moderate temperatures on latent fingermarks. The results in this thesis
demonstrate that higher moderate temperatures do have an effect on fingermark
composition within five-hours of deposition, and that oxidation mechanisms occur
at any moderate temperature almost immediately after deposition. This has
relevance for the forensic community as these oxidation processes are likely to
affect certain development techniques, and at higher temperatures forensic
investigators may need to prioritise fingermark evidence for removal from the
crime scene for the sake of preservation.
The process of fingermark degradation is at the forefront of latent fingermark
research, a better understanding of the degradation mechanisms that take place
post-deposition will have a profound effect for both research applications and
criminal investigations involving fingermarks. Currently, these processes are
poorly understood with only certain degradation products identified, and the
mechanisms that generate those products poorly defined. Intermolecular
interactions are key to these processes but have rarely been investigated due to
the complexity of fingermark chemistry. The analogue solutions study presented
in this thesis contribute further to this extremely complex and variable process.
The identification of two key components that significantly affected intermolecular
interactions within these simplified solutions points to their importance for natural
fingermark degradation and may provide a focus for further research on natural

165
fingermarks. The research presented here suggests the significance of these two
compounds for fingermark degradation and supports previous research
proposing a chain of degradation and their significance within it. This research
provides greater insight into this complex process and can be built upon to
investigate further the importance of these compounds for oxidation processes
within fingermarks.
During criminal investigations the ability to detect illicit particulate within latent
fingermarks is of immediate benefit to investigating officers, this is especially true
if those fingermarks can then be attributed to an individual. Paper 4 presented
within this thesis demonstrates the ability for FTIR spectromicroscopy to identify
and chemically map certain contaminants but, for the first time, accounts for the
temporal degradation of these compounds. Accounting for the effects of temporal
decomposition of a latent fingermark on these contaminants is far more realistic
to an on-going criminal investigation. This was only possible with an in-depth
understanding of fingermark chemistry and aging, again something not previously
considered when investigating the detection of illicit substances in fingermarks.
Overall, this thesis has demonstrated previously unreported research into the
behaviour of latent fingermarks, accounting for more realistic conditions such as
temporal degradation and moderate variations in temperature. The research has
strengthened previous work and provided compelling evidence for further
avenues of research to better understand molecular interactions within
fingermarks. Finally, this work has demonstrated the versatility of FTIR
spectroscopy for the analysis of latent fingermarks, and how this technology could
be utilised both within the laboratory and in the field. This provides a platform for
future research and debate.

166
9.3 Future Recommendations
Various aspects of latent fingermark chemistry have been studied for several
decades. The work presented in this thesis has contributed to furthering
knowledge within the field, and future work, generated from this research, is a
necessity if a better understanding of fingermark composition, degradation and
molecular interactions are to be gained. It is also essential that future work aims
to be of greater benefit to the forensic and law enforcement communities.
For this thesis, latent fingermarks were subjected to moderate temperatures, and
irrespective of the temperature rapid oxidation was observed over the 5 hours
post-deposition (section 5.4.1), this suggests that the activation energy for this
decomposition was below 25oC. FTIR spectroscopy was able to identify this
oxidation taking place in real time but identifying the individual components that
contributed to this process is not possible using this technique. Further research
is required to identify the reactants that oxidise so quickly within a latent
fingermark with greater granularity than is currently known. Such work would
identify those compounds that are most likely to degrade quickly and help provide
information on the time since deposition, and may potentially help the production
of more effective fingermark development reagents. These compounds that
oxidise so rapidly may provide a better understanding of the behaviour of
children’s fingermarks depending on whether they are present or absent. Further
work in this area may also help forensic scientists identify and process
fingermarks in more extreme environments where higher temperatures will
degrade the contents of a fingermark much faster.
The development and use of synthetic fingermark solutions has historically had
mixed results within the field of fingermark research, trials and validations.
Solutions designed to represent natural fingermarks have only been moderately
successful in validation trials and reported to have ‘behaved differently’ when
introduced to development reagents. This lack of success in creating realistic
synthetic solutions, accounting for the many hundreds of compounds found within
a natural fingermark and that is adaptable to the many external factors that can

167
influence them, is a primary indication of the current lack of understanding of
fingermark chemistry. Continued research is required to fill these gaps in the
literature. Future work, possibly starting with simplified analogue solutions as in
this thesis, that can more accurately replicate the behaviour of natural
fingermarks, would undoubtedly better our understanding of fingermark
chemistry. Aging of synthetic solutions, for example, to establish if the same
degradation products are produced as in natural fingermarks would be a strong
indicator of an advancement in our understanding. It would also go some way to
addressing the existing scepticism around synthetic solutions and their value to
the field both as a tool for fundamental research and in validation trials.
In this thesis latent fingermarks were contaminated with three exogenous
compounds of particular relevance to today's law enforcement agencies. The
study showed that these compounds were still detectable after thirty days within
a fingermark exposed to normal diurnal light conditions and at room temperature
and humidity. Only one compound (ammonium nitrate), showed any signs of
degradation and that was primarily within the first ten days’ post-deposition. IED's
commonly used by terrorist groups are synthesised from a myriad of precursors,
yet require certain basic properties to be effective, (an oxidiser, or an acidic
solution for example). Future work to investigate how these categories (or even
specific compounds of interest, such as acetone) interact with fingermark
chemistry could be of great value to law enforcement agencies. The research
may identify a bespoke reaction product present within the fingermark which
indicates the handling of an illicit compound and would therefore enable the
generation of a specific development reagent accordingly. Knowing if any IED
precursors or narcotics degrade rapidly within fingermarks is also of use to
forensic investigators, it may help prioritise analysis of fingermark evidence, or
target analysis to detect a specific end product only produced in the presence of
a specific contaminant.
The use of FTIR spectroscopy for the analysis latent fingermarks has been
demonstrated in this thesis, all research being carried out on the same benchtop
FTIR microscope. More generally IR spectroscopy has shown great potential as

168
a portable, handheld device for various applications including gas analysis, liquid
and solid explosives detection and compound identification. Further work,
utilising advancements in IR technology; micro-scanners and detectors as well
as ATR technology, could enable the development of a portable handheld, or
mobile benchtop FTIR fingermark analysis device, in much the same way as
MALDI-MS technology is being utilised currently. These devices could be used
at the crime scene or in a mobile laboratory to rapidly, and non-destructively
analyse fingermarks and provide immediate presumptive information to the
investigating officers.

169
Appendix A : Full spectral and graphical data from
paper 2
A.1 Spectral data

170
Figure A-1: Absorbance spectra of latent fingermarks as a function of time and
temperature for 75oC, 65 oC, 55 oC, 45 oC, 35 oC, 25oC

171
A.2 Graphical data
75oC
65oC

172
55oC
45oC

173
Figure A-2: Changes in IR absorbance of key functional groups over time at 75oC,
65 oC, 55 oC, 45 oC, 35 oC, 25oC
35oC
25oC

174
Figure A-3: 100 x 100 µm microscopic image of fingermark deposit at t=0 and t=5
hr at 65oC
Figure A-4: 100 x 100 µm microscopic image of fingermark deposit at t=0 and t=5
hr at 35oC
O hr
65oC
5 hr
65oC
O hr
35oC
5 hr
35oC

175
Figure A-5: Possible decomposition pathways contributing to increase in OH
stretch band (3250 cm-1) in IR spectra. (Diagrams from Cadd et al. Fingerprint
composition and aging: A literature review. Science and Justice 55 (2015) 219-238)

176
Appendix B : Publications
Title The effect of moderate temperatures on latent fingerprint
chemistry
Journal Applied Spectroscopy
Received 20th November 2016
Accepted 30th January 2017
Title A study of the intermolecular interactions of lipid components
from analogue fingerprint residues
Journal Science and Justice
Received 25th July 2017
Accepted 20th November 2017

177

178

179

180

181
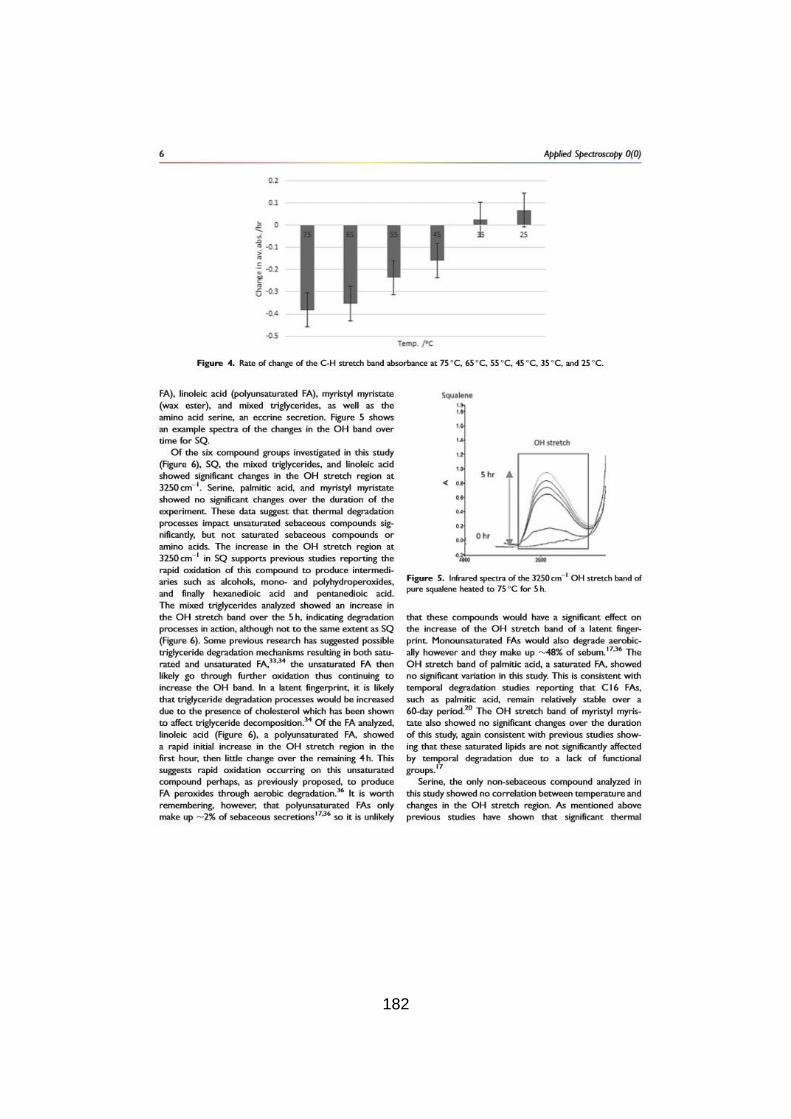
182

183

184

185
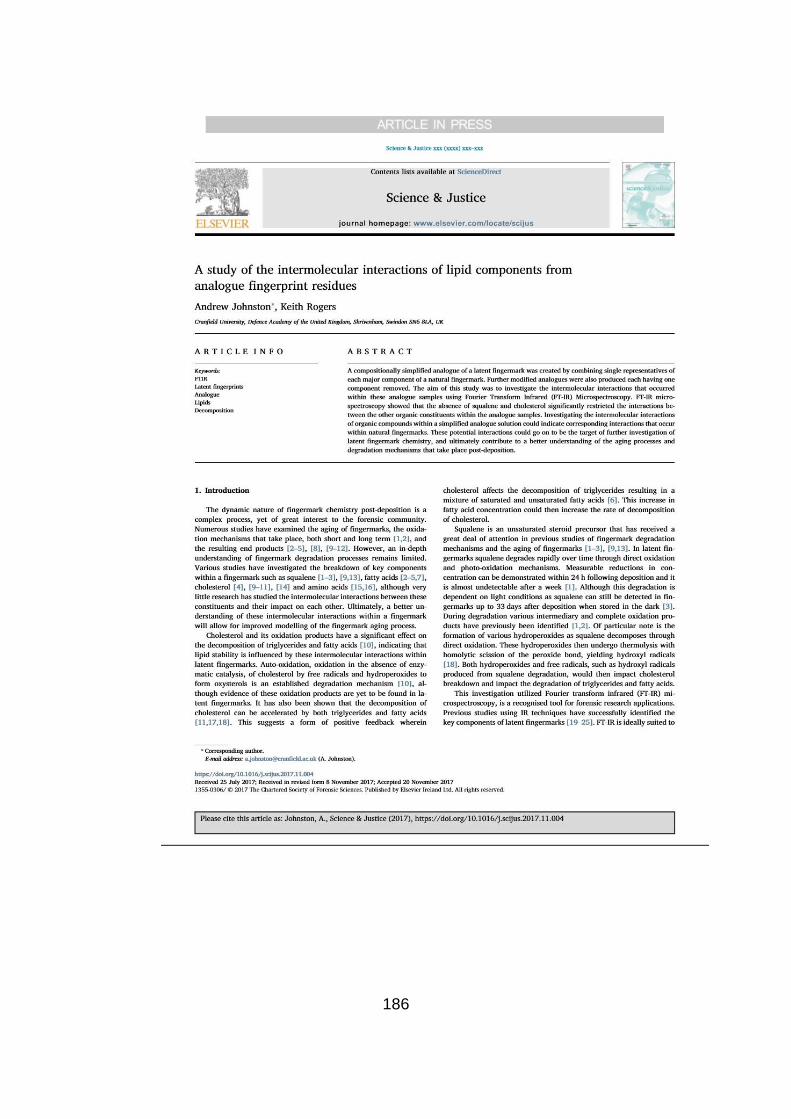
186

187

188

189
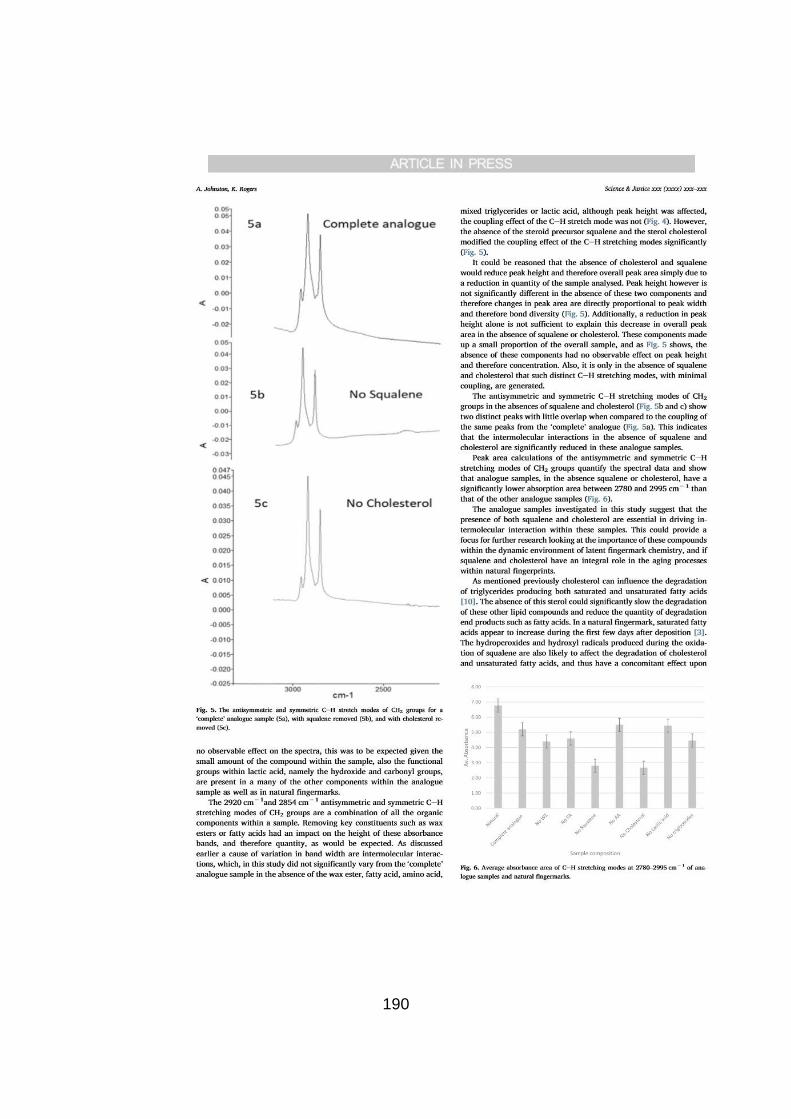
190

191

192