cover photograph courtesy of fao and fao smartfish, … · whatsoever on the part of the food and...
TRANSCRIPT

FISH CONSUMPTION SURVEY
Mauritius
FAO SmartFish Publication 30

Cover photograph courtesy of FAO and FAO SmartFish, Davide Signa

REPORT/RAPPORT: SF-FAO/2013/30
Fish Consumption Survey
Mauritius
GCP/RAF/466/EC SmartFish Project

The designations employed and the presentation of material in this
information product do not imply the expression of any opinion
whatsoever on the part of the Food and Agriculture Organization of the
United Nations (FAO) concerning the legal or development status of any
country, territory, city or area or of its authorities, or concerning the
delimitation of its frontiers or boundaries. The mention of specific
companies or products of manufacturers, whether or not these have
been patented, does not imply that these have been endorsed or
recommended by FAO in preference to others of a similar nature that
are not mentioned.
The views expressed in this information product are those of the
author(s) and do not necessarily reflect the views or policies of FAO.
The contents of this publication are the sole responsibility of the
author(s) and can in no way be taken to reflect the views of the
European Union
© FAO 2013
FAO encourages the use, reproduction and dissemination of material in
this information product. Except where otherwise indicated, material
may be copied, downloaded and printed for private study, research and
teaching purposes, or for use in non-commercial products or services,
provided that appropriate acknowledgement of FAO as the source and
copyright holder is given and that FAO’s endorsement of users’ views,
products or services is not implied in any way.
All requests for translation and adaptation rights, and for resale and
other commercial use rights should be made via www.fao.org/contact-
us/licence-request or addressed to [email protected].
FAO information products are available on the FAO website
(www.fao.org/publications) and can be purchased through publications-
For more information, please contact [email protected].
Fishermen Investment Trust. 2013. Fish Consumption Survey, Mauritius
Report/Rapport: SF-FAO/2013/30. FAO-SmartFish Programme of the Indian Ocean
Commission, Ebene, Mauritius.

3
Acknowledgements
The Fishermen Investment Trust would like to thank Mr Signa Davide, Mr Ansen Ward
and Mrs Clotilde Bodiguel of the IOC FAO SmartFish Programme for their continuous
support during the course of this study. Our thanks are also extended to Mrs Roshini
Brizmohun Gopaul of the University of Mauritius for leading the team of enumerators and
providing valuable assistance for the analysis and finalisation of this report.
Our sincere thanks to Statistics Mauritius for initial guidance and to the following
enumerators and Data analysts from the University of Mauritius for their dedication and
hard work: Ms Zainal Kareemun, Mr Ludovic Baya, Mr Roomesh Doolum Ms Mehtaab Bibi
Conhyea, Ms Varsha Ooma Raderam, Ms Ishtee La Rose, Ms Khawla Domun, Ms Teesha
Baboorun, Ms Yogeshwaree Rambojun, Mr Nadeem Durbarry
We would like to thank the EU for providing the necessary funding for this project
through the IOC SmartFish programme.
Last but not the least, our sincere appreciation go to the staff of the Fishermen
Investment Trust for ensuring the success of this project and to all the people who gave
us their strong cooperation and assistance during the field survey, which included
hundreds of respondents around Mauritius. This survey would not have been possible
without the collaboration and support of everyone involved.
Satish Hanoomanjee
CEO Fishermen Investment Trust
AFRC, Albion, Mauritius

4
Executive summary
Very little is known about the habits of fish consumers in Mauritius. In this context and
with assistance from the EU through the IOC FAO/SmartFish programme, a fish
consumption survey was conducted to provide an insight into the habits of Mauritian fish
consumers.
This involved interviewing one thousand respondents in 21 localities around Mauritius.
The enumerators worked in teams of two and interviewed consumers at various sites
around the island. Respondents were from both rural1 and urban areas.
The results give an excellent snapshot of fish consumption habits in Mauritius. Analysis of
the results shows a per capita consumption of fresh and frozen fish of 23.1 kg/year and
per capita consumption of other fishery products of 16.8 kg/year. Hence, Mauritians
consume some 40 kg of fish and other fishery products annually. It has to be noted that
non-consumers/vegetarians were excluded from these calculations. The official figures
from Statistics Mauritius indicate a per capita consumption of 21 kg/year in 2011, similar
to FAO statistics.
The study shows that culinary habits with regards to fish have changed very little over
the years with Mauritians preferring fish curries both in rural and urban areas. Fresh fish
is preferred though frozen fish is also consumed. People in Mauritius prefer to eat whole
fresh fish; however this is slowly changing towards ready cleaned and packed frozen
products.
The study revealed that 88 percent of respondents preferred local fish rather than
imported fish and one of the reasons given for those preferring imported fish (12 percent
of the respondents) is a perceived better quality (42.1 percent). One of the main reasons
for not buying and consuming fish or other fishery products is associated to religious
beliefs (e.g. many Hindus do not consume fish or meat).
Many respondents were quite knowledgeable with regards to fish quality, though quite a
number of people interviewed failed to give correct responses. However, there appears to
be a general lack of awareness amongst the general public as to the existence of Omega
3 & 6 in fish. Sixty-two percent of respondents are also keen to try new products such
as fish sausages. People from the rural coastal areas are greater consumers of the
Cordonnier (rabbit fish or Siganus sutor), probably due to the better availability of the
fish in those areas. Interestingly, it was also noted that perceptions and some oral
traditions are still predominant within the society e.g. hallucinations caused from eating
the Cordonnier. These need to be addressed through awareness campaigns, if Cordonnier
aquaculture is to be promoted.
1 Rural refers to locations outside main towns. Most of the villages in the coastal belt may be classed as rural areas.

5
Many respondents (80.1 percent) agreed that cleanliness of the places where they buy
fish definitely affects their purchasing habits. The main problems encountered with fish or
other fishery products are allergies (31.9 percent), bad quality of fish (26.7 percent) and
food poisoning (19.8 percent). These problems could be a result of, inappropriate
conservation methods, poor sanitary conditions, inadequate handling of fish and
preparation in the home and/or consumption of spoilt fish. Since Mauritius is a tropical
island it is important that consumers are fully aware of the main factors of fish spoilage
and basic hygiene. This could also form part of an awareness campaign. It was also
noted that 40.6 percent of respondents do not think that fish is cheaper than meat.
Again, this could be a question of availability and the marketing chain of fish.
A key recommendation is the need for further awareness campaigns to educate the
population on fish quality, the nutritional benefits of eating fish and alternative
preparation and cooking techniques.
The present study could serve as a reference for future investigations relating to fish
consumption habits in Mauritius.

6
Résumé exécutif
On sait peu de choses sur les habitudes de consommation du poisson à Maurice. C’est
dans ce contexte qu’une enquête sur la consommation du poisson a été lancée, afin
d’avoir une idée des habitudes des consommateurs mauriciens. Cette étude a été
réalisée grâce à l’assistance du Programme SmartFish, financé par l’Union européenne.
Une centaine de personnes ont été interviewées dans 21 localités de Maurice. Les
enquêteurs ont travaillé par groupe de deux et ont interviewés des consommateurs dans
divers site de l’île. Les personnes interviewées venaient de zones rurales2 et urbaines.
Les résultats ont donné un excellent aperçu des habitudes des consommateurs de
poisson à Maurice. L’analyse de ces résultats montre que la consommation de poisson
frais et congelés par personne est de 23.1kg/an et que la consommation d’autres
produits de la pêche et de 16.8kg/an. Aussi, les mauriciens consomment quelque 40 kg
de poissons et autres produits de la pêche annuellement. Il faut noter que les
végétariens et non consommateurs ont été exclus de ce calcul. Les chiffres officiels du
Bureau mauricien des Statistiques, tout comme les statistiques FAO, indiquent que la
consommation par habitant est de 21kg/an en 2011.
L’étude montre que les habitudes culinaires pour le poisson ont très peu changé au fil des
ans : les mauriciens préférant les currys de poisson aussi bien dans les zones rurales
qu’urbaines. Le poisson frais est préféré au poisson congelé, qui est tout de même
également consommé. La population mauricienne préfère manger des poissons frais
entiers. Cependant, cette habitude est tout doucement en train d’évoluer vers des
produits surgelés, nettoyés et emballés.
L’étude révèle que 88% des personnes interrogées préfèrent le poisson local au poisson
importé. L’une des raisons donnée par les 12% de répondants préférant le poisson
importé est la meilleure qualité (pour 42.1% d’entre eux). L’une des raisons principales
expliquant l’absence d’achat et de consommation de poisson ou autres produits de la mer
est la croyance religieuse (par exemple, de nombreux hindous ne consomment ni poisson
ni viande).
De nombreux répondants avaient pas mal de connaissances sur la qualité du poisson,
même si un certain nombre de personnes interrogées n’ont pas pu donner de bonnes
réponses. Cependant, un manque de prise de conscience général au sein du grand public
au sujet de l’existence des Omega 3 et 6 dans le poisson est apparu. Soixante-deux
pourcent des répondants ont indiqué être favorable au test de nouveaux produits tels
que des saucisses de poisson.
2 C’est-à-dire en dehors des principales villes. La plupart des villages côtiers peuvent être classées comme zones rurales.

7
Les populations rurales côtières sont de grandes consommatrices de Cordonniers
(Siganus sutor). Cela est probablement dû au fait de sa disponibilité dans ces régions. Il
a également été noté que les perceptions et traditions orales sont toujours ancrées dans
les sociétés. Par exemple, le risque d’hallucinations pouvant être causées par l’ingestion
de Cordonnier. Cela pourrait faire l’objet d’une campagne de sensibilisation si
l’aquaculture du Cordonnier devait être promue.
De nombreux répondants (80.1%) ont affirmé que la propreté de l’endroit om ils
achètent leur poisson influence leurs habitudes d’achat. Les principaux problèmes
rencontrés sont les allergies au poisson ou autres produits de la pêche (31.9%), la
mauvaise qualité du poisson (26.7%), et l’intoxication alimentaire (19.8%). Ces
problèmes résulteraient de méthodes de conservation inappropriées, de mauvaises
conditions sanitaires, une mauvaise manipulation du poisson, et une préparation maison
et/ou consommation de poisson abimés. Maurice étant une île tropicale, il est important
que les consommateurs soient pleinement conscients des principaux facteurs qui abiment
le poisson et des principes d’hygiène de base. Ces éléments pourraient également faire
l’objet d’une campagne de sensibilisation. Il faut également noter que 40,6% des
répondants ne pensent pas que le poisson est meilleur marché que la viande. Là encore,
il est peut-être question d’une disponibilité et d’un marketing de la chaine du poisson.
Une recommandation clé est le besoin d’une campagne de sensibilisation pour éduquer la
population à la qualité du poisson, les bénéfices nutritionnels qu’il représente et les
méthodes de préparation et de cuisson alternatives.
La présente étude pourrait servir de référence à de futures recherches sur les habitudes
de consommation du poisson à Maurice.

8
Contents
Acknowledgements______________________________________________________________________ 3
Executive summary _______________________________________________________________________ 4
Résumé exécutif __________________________________________________________________________ 6
Contents _________________________________________________________________________________ 8
List of tables ______________________________________________________________________________ 9
List of figures _____________________________________________________________________________ 9
Acronyms and abbreviations _____________________________________________________________ 10
1. Introduction ________________________________________________________________________ 11
1.1 Background _____________________________________________________________________ 11
1.2 Objectives _______________________________________________________________________ 12
1.3 Survey locations _________________________________________________________________ 13
1.4 Output _________________________________________________________________________ 14
1.5 Structure of the report ___________________________________________________________ 15
2. Methodology ______________________________________________________________________ 15
2.1 Questionnaire design process _____________________________________________________ 15
2.2 Pre testing process _______________________________________________________________ 16
2.3 Locations and selection process __________________________________________________ 16
2.4 Data collection __________________________________________________________________ 17
2.5 Responsibilities of enumerators ____________________________________________________ 17
2.6 Data analysis ____________________________________________________________________ 18
3. Results _____________________________________________________________________________ 18
3.1 Section A: Fish consumption in Mauritius ___________________________________________ 18
3.2 Section B: Consumer knowledge of fish ____________________________________________ 32
3.3 Section C: Consumer attitudes towards fish and other fishery products ______________ 34
3.4 Section D: Consumer profiles _____________________________________________________ 38
4. Discussion __________________________________________________________________________ 40
4.1 Fish Consumption in Mauritius _____________________________________________________ 40
4.2 Consumption of the Cordonnier (Rabbit fish) ______________________________________ 42
4.3 Consumer knowledge of fish ______________________________________________________ 43
4.4 Consumer attitudes towards fish and other fishery products _________________________ 43
4.5 Consumption per capita _________________________________________________________ 44
5. Conclusions and recommendations __________________________________________________ 45
5.1 Recommendations ______________________________________________________________ 45
6. References __________________________________________________________________________ 47
Annex 1. Terms of reference __________________________________________________________ 48
Annex 2. Questionnaire ______________________________________________________________ 49
Annex 2.1. Statistical outputs ___________________________________________________________ 53
Annex 3. Location and survey plan ___________________________________________________ 81
Annex 4. Contact details of team members ___________________________________________ 82
Annex 5. Photos _____________________________________________________________________ 83

9
List of tables
Table 1: Location of sites .......................................................................................................................... 13
Table 2: Amount of fish consumed (per kg) per household in a typical meal…………………. 21
Table 3: Interest in consuming fish sausages ........................................................................................ 28 Table 4: Likert sca le categories for some attitude statements ........................................................ 34 Table 5: Most effective mode for obtaining information about benefits
and use of fish and other fishery products ............................................................................ 36 Table 6: Details of consumers (n=1000) ................................................................................................. 38 Table 7: Contact details of survey team ............................................................................................... 82
List of figures
Figure 1: Per capita fish consumption ___________________________________________________ 11
Figure 2: Survey sites in Mauritius__________________________________________________________14
Figure 3: Four sections in the consumer questionnaire ____________________________________ 16 Figure 4: Fish purchase and consumption _______________________________________________ 18 Figure 5: Age grouping of fish consumers ________________________________________________ 19 Figure 6: Reasons for not consuming and purchasing fish _________________________________ 19 Figure 7: Frequency of eating fresh or frozen fish (excluding other fishery products) ________ 20
Figure 8: Frequency of eating other fishery products (excluding fresh or frozen fish)_________ 20
Figure 9: Preferred places to purchase fish________________________________________________22
Figure 10: Reasons for purchase of fish from preferred places _____________________________ 22 Figure 11: Preferred fish preparation(s) __________________________________________________ 23 Figure 12: Consumption of fish and other fishery products ________________________________ 23 Figure 13: Fish consumption from rural and urban regions _________________________________ 24 Figure 14: Factors affecting the purchase of fish and other fishery products________________ 24 Figure 15: Consumer perception with regards to quality __________________________________ 25 Figure 16: Preference to local or imported fish ___________________________________________ 25 Figure 17: Preference for imported fish why? _____________________________________________ 26 Figure 18: Purchase of fish snacks _______________________________________________________ 26 Figure 19: Age groups and consumption of fish snacks ___________________________________ 27 Figure 20: Reasons for not consuming fish snacks_________________________________________ 27 Figure 21: Interest in consuming fish sausages ____________________________________________ 28 Figure 22: Reasons for not consuming fish sausages ______________________________________ 29 Figure 23: Consumption of the Cordonnier fish in urban and rural regions __________________ 29 Figure 24: Culinary preference for the Cordonnier _______________________________________ 30 Figure 25: Reasons for not consuming the Cordonnier ____________________________________ 30 Figure 26: Purchasing habits for the Cordonnier __________________________________________ 31 Figure 27: Price respondents willing to pay for a ready-to-eat
vacuum-packed Cordonnier (300g) __________________________________________ 31 Figure 28: Price respondents willing to pay for vacuum-packed
Cordonnier fillets (300g) ______________________________________________________ 32 Figure 29: Awareness of Omega 3 ______________________________________________________ 33 Figure 30: Fish consumption and a child’s brain development ____________________________ 33 Figure 31: Factors affecting fish spoilage ________________________________________________ 34 Figure 32: Likert scale categories for attitude statement on fish availability_________________ 35 Figure 33: Problems encountered with the consumption of fish or other
fishery products ______________________________________________________________ 35 Figure 34: Problems encountered with fish and other fishery products _____________________ 36 Figure 35: Suggestions for the promotion of fish consumption _____________________________ 37 Figure 36: Age groups based on residential region _______________________________________ 39 Figure 37: Gender based on residential region ___________________________________________ 39

10
Acronyms and abbreviations
AFRC Albion Fisheries Research Centre
EEZ Exclusive Economic Zone
EU European Union
FAO Food and Agricultural Organization
FIT Fishermen Investment Trust
g Grams
GDP Gross Domestic Products
IOC Indian Ocean Commission
Kg Kilogram
Km2 Kilometre square
Rs Rupees
US $ US Dollars

11
1. Introduction
1.1 Background
Mauritius is located in the middle of the Indian Ocean. The economy is mainly dependent
on services (an estimated 71.8 percent, 2011) and industries (23.8 percent, 2011), while
agriculture and fisheries contribute some 4.4 percent to the GDP3. The estimated GDP per
capita was US $8,665 in 20104. The potential of the vast Exclusive Economic Zone (EEZ)
of 2.3 million square kilometres (of which some 396,000 km2 are co-shared with
Seychelles) is as yet unexplored. It is mainly the lagoons and banks that are exploited by
the domestic fisheries sector, but the domestic fleet is not able to supply enough fish to
satisfy local demand. Mauritius currently imports some 11,500 tonnes of fish and fishery
products per year to satisfy the demand of Mauritians and the growing numbers of tourists
visiting the island.
The fisheries sector contributed around 1.5 percent to the GDP in 2012. In Rodrigues, the
fisheries sector contributes a greater share to the economy and is the island’s largest
employer. While the total local production is small at about 4,125 tonnes in 2012,
Mauritius fish processing and the export sector dominate seafood activities concentrated in
the so-called ‘Seafood Hub’. Seafood turnover amounted to some 22.28 billion rupees in
2012.
Figure 1: Per capita fish consumption
Source: Ministry of Fisheries, unpublished data
Fish is an important source of protein in the local diet and the per capita consumption of
fish stood at 21.0 kg in 2011 and 22.9 kg in 2012 (Figure 1), representing one quarter of
total animal protein intake5.
3 2011 estimate, data released in February 2012. 4 Global Finance, Country Economic Reports & GDP data, June 2012 5 FAO General Economic Data, 2006
2006 2007 2008 2009 2010 2011 2012
19.9 18.3
21.5 21.1 21.7 21
22.9

Fish Consumption Survey, Mauritius 12
It is worth noting that per capita consumption rates are estimates derived from the
general population, inclusive of both consumers and non-consumers. Thus, per capita
rates are primarily useful for trend analyses rather than representing actual consumption.
Studies that specifically address consumption rates for commercial fish species are lacking
or have probably never been carried out in Mauritius.
It should be noted that there is no foolproof methodology that will provide an accurate
depiction of all people in a population that consume fish. This is due, in part, to the
inherent variability in fish-consuming populations and in part to the inability of any survey
(methodology) to achieve unbiased sampling due to various factors. Hence, when using
the results of fish consumption surveys, it is important to recognize the limitations of the
estimates derived and it is equally important to exercise prudence and discretion in
making generalizations or assumptions about study results and their validity.
Various documents were consulted during the course of this survey namely AMSAT
International, 2011 that looks at fish and animal protein consumption in Timor-Leste; Fish
Consumption Survey in Banda Aceh; ARC/FAO, Survey of Fish Consumption in Madras,
BOBP, 1992; Baya, J. F. L., 2013. A Conceptual Framework for the Investigation of Fresh
Fish Availability and Consumption in Regions of Saint Pierre, Rose Hill and Quatre Bornes
in Mauritius, Kareemun.Z.B, 2013, an evaluation of consumer behaviour relating to
aquaculture and food security in Mauritius. Other documents have also been referred to in
this report.
The survey provides information on fish (fresh and processed) consumption habits of
Mauritians, including demand, supply, availability and market chains issues and
complements baseline information related to fishery product development, improving
supply chains to market, and strengthening/diversifying income opportunities of fisher
families.
1.2 Objectives
The objectives of the survey were to estimate current levels of fish consumption and
obtain related information on supply, demand and availability and the way Mauritians
prefer to eat fish. The terms of reference for the survey are provided in Annex 1.

Introduction 13
1.3 Survey locations
Table 1 provides a summary of the locations in Mauritius where consumers were
interviewed for the survey.
Table 1: Location of sites
4 teams of 2 enumerators: teams A to D
No
. Location Place Team
No.
of
days
Dates
1 Curepipe Monoprix
Supermarkets
A 25/10/13 26/10/13
2 Phoenix Jumbo B 25/10/13 26/10/13
3 St. Jean Shoprite C 25/10/13 26/10/13
4 Belle Rose Super U D 16 25/10/13 26/10/13
5 Flacq Winners A 29/10/13 30/10/13
6 Cascavelle Pick & Pay B 29/10/13 30/10/13
7 Mahebourg King Savers C 29/10/13 30/10/13
8 Rose Belle Moulin D 16 29/10/13 30/10/13
9 Quatre Bornes Intermart A 31/10/13 01/11/13
10 Vacoas London Way B 31/10/13 01/11/13
11 Beau Bassin Spar C 31/10/13 01/11/13
12 Riviere Noire London Way D 16 31/10/13 01/11/13
13 Tamarin Shoprite 6/11/13
14 Port Louis
Markets
A 02/11/13
15 Quatre Bornes B 02/11/13
16 Vacoas C 02/11/13
17 Rose Hill D 16 02/11/13
18 Rose Hill
Fish Shops
A 05/11/13 06/11/13
19 St. Paul B 05/11/13 06/11/13
20 Tamarin
Landing stations
C 05/11/13 06/11/13
21 Cap Malheureux D 16 05/11/13 06/11/13

Fish Consumption Survey, Mauritius 14
Figure 2: Survey sites in Mauritius
1.4 Output
The main output of this project is the publication of a report highlighting fish consumption,
supply, demand, preference, eating habits, etc., in Mauritius. The results could be used as
a basis for the further development of policies and strategies by authorities concerned.
The survey provides a model for consumption surveys in the future and for other countries
such as those to be undertaken by the IOC FAO SmartFish Programme in Malawi, Rwanda
and Zambia.
Introduction 15
1.5 Structure of the report
The report consists of five distinct sections:
1. Introduction including the background, objective, survey locations, output and report
structure;
2. Survey methodology;
3. General demographic features of the survey respondents;
4. Results of the survey with comments and analyses where appropriate;
5. Conclusions and recommendations.
2. Methodology
The survey was a formal type questionnaire survey involving face-to-face interviews with
consumers at key locations.
2.1 Questionnaire design process
The questionnaire was designed based on previous consumer surveys carried out in
Mauritius and other countries and was reviewed by FAO experts in Fisheries and Marketing
prior to finalization. Both open-ended and closed questions were included in the
questionnaire. The open-ended questions allowed the respondents to freely express
themselves while the closed questions consisted of Likert scaled questions to assess the
attitudes of respondents.
The questionnaire was divided into four major sections as shown in Figure 3 (the full
questionnaire can be found in Annex 2).

Fish Consumption Survey, Mauritius 16
• The respondents were asked about their general purchasing habits, in terms of frequency of purchase and preference of fish and fishery products.
Section A:
Fish consumption
• This section consisted of 3 general questions to assess consumer knowlege of Omega 3, the benefits of fish for a child's brain development and the factors that may spoil fish.
Section B:
Knowledge of fish
• The respondents were asked to rate different statements using a five-point likert scale ranging from 'Strongly agree' to 'Strongly disagree'. This section also consisted of some open-ended and closed questions.
Section C:
Attitudes towards fish & fishery products
• This section consisted of general questions on the profile of the respondents, such as their place of residence, gender and age, amongst others.
Section D:
Consumer details
Figure 3: Four sections in the consumer questionnaire
2.2 Pre testing process
The questionnaire was pre-tested at the Albion Fisheries Research Centre (AFRC) in
October 2013 with 20 interviewees to detect any ambiguities in the questions. The
enumerators were trained on how to carry out the interviews and to make sure the time
taken for per interview does not exceed more than 10 minutes. After the pre-testing,
some questions were reformulated, as some respondents encountered difficulties and/or
were confused with some of the questions asked. The survey questionnaire can be found
in Annex 2.
The assistance of an FAO consultant was very much appreciated in the finalization of the
questionnaire and guidance during the pre-trial survey.
2.3 Locations and selection process
Twenty-one different regions were randomly selected around the island. Face-to-face
interviews were carried out at the various sites identified namely supermarkets, local
markets, fish landing sites and fish shops.

Methodology 17
For the purpose of this study, a representative sample of 1,000 respondents was randomly
identified at the various locations around the island. It should be noted that Statistics
Mauritius interviews some 900 consumers for its household survey every month.
2.4 Data collection
Face-to-face interviews, using the questionnaire in Annex 2 were carried out for this
survey. Initially, respondents were briefed as to the purpose of the interview and were
assured of the confidentiality of their responses. The open-ended questions were asked in
a probing, unbiased manner to encourage the respondents to voice their opinions.
The main constraint encountered during the survey, was the limiting time factor for the
consumers.
2.5 Responsibilities of enumerators
The enumerators were fully briefed on the questionnaire and mock exercises carried out at
the Fishermen Investment Trust’s (FIT) office in Albion. Furthermore, a pre-trial survey
was also carried out on some twenty people at the AFRC. Results of the pre-trial and
constraints identified were discussed at length and advice given to the enumerators who
were tasked with the following:
Fully understand the questions in the questionnaire and apply them to the local
context;
Cooperate with other survey team enumerators during the fieldwork to ensure that
the survey is carried out in a timely and professional manner;
Briefly explain the purpose of the interview to the respondents and ensure them of
the confidentiality of their responses;
Make sure that the interview does not take more than 10 minutes per respondent;
Conduct a specific number of interviews each day. (The team leader - based on prior
experience and field conditions - established a daily quota);
Make sure all questionnaires are completed in the field and check thoroughly each
questionnaire for completeness, legibility and accuracy;
Keep in regular contact with the team leader and supervisor and request immediate
assistance if needed.

Fish Consumption Survey, Mauritius 18
95%
5%
Yes No
n= 1000
2.6 Data analysis
The data collected were evaluated using the Statistical Package for Social Sciences (SPSS)
Version 17.0 and Microsoft Excel 2007. All questionnaires were coded to conceal the
identity of the respondents due to the confidential nature of the work. The outputs were
presented by means of charts and frequency distributions tables (see Annex 2.1)
3. Results
The results presented in this chapter relate to fish consumption per capita, consumption
habits (purchases and preferences), knowledge of consumers with regards to the benefits
of eating fish and other fishery products, basic hygiene and other factors such as the
handling and conservation of fish. Attitudes toward fish consumption were also
investigated. The results also provide an insight into the general characteristics of the
consumer.
3.1 Section A: Fish consumption in Mauritius
Figure 4 shows that 95 percent of the respondents (n=1000) buy or consume fish/fishery
products.
Figure 4: Fish purchase and consumption

Results 19
23.8%
19.9%
23.3%
19.8%
13.2%
0%
5%
10%
15%
20%
25%
18-25 26-35 36-45 46-55 >55
Pe
rce
nta
ge
of
resp
on
de
nts
Age groups n= 954
Figure 5: Age grouping of fish consumers
Out of 954 respondents, 23.8 percent were between 18 and 25 years old. However, a chi
square test revealed that there is no significant relationship between fish consumers and
age group (p>0.05).
Figure 6: Reasons for not consuming and purchasing fish
Five per cent of the respondents do not consume fish or other fishery products (Figure 4)
for various reasons. It would seem that religious belief is the most important reason for
not eating fish (32.6 percent of the non-consumers) (Figure 6), followed by dislike of fish
(28.3 percent). However, no firm conclusions can be deduced, as the population analysed
is too small.
28.3%
6.5% 4.3%
6.5%
2.2%
32.6%
6.5%
26.1%
0%
5%
10%
15%
20%
25%
30%
35%
Do notlike fish
Tooexpensive
Too manybones
Do notlike thesmell
Got sicklast time
Religiousbeliefs
Allergic tofish
Others
Pe
rce
nta
ge
of
resp
on
de
nts
n= 46

Fish Consumption Survey, Mauritius 20
20.6%
14.0%
29.8%
16.9%
6.6%
0.8% 4.9% 6.3%
0%
5%
10%
15%
20%
25%
30%
35%
Once amonth
Onceevery 2weeks
Once aweek
Twice aweek
3 to 6times aweek
Everyday Others Do not eatfish
products
Pe
rce
nta
ge
of
resp
on
de
nts
n= 954
Figure 7: Frequency of eating fresh or frozen fish (excluding other fishery
products)
Figure 7 illustrates the frequency of consumption of fresh or frozen fish among the
consumers (n=954). 33.6 percent of respondents eat fresh/frozen fish at least once per
week, while only 3.2 percent consume fresh or frozen fish everyday. 0.3 percent of fish
consumers claimed that they do not eat fresh or frozen fish, which may point to the
consumption of canned or other fish products as outlined in Figure 7. It should also be
noted that 29.8 percent of respondents consume fish products (excluding fresh and
frozen) at least once a week and 16.9 percent of them eat fish products at least twice a
week. 4.9 percent of them stated that they rarely consume fish products.
Figure 8: Frequency of eating other fishery products (excluding fresh or frozen
fish)
11.3%
18.0%
33.6%
23.4%
8.3%
3.2% 1.8% 0.3% 0%
5%
10%
15%
20%
25%
30%
35%
40%
Once amonth
Onceevery 2weeks
Once aweek
Twice aweek
3 to 6times aweek
Everyday Others Do not eatfresh orfrozen
fish
Pe
rce
nta
ge
of
resp
on
de
nts
n= 954

Results 21
Figure 8 illustrates the frequency of consumption of fish products among the consumers
(n=954). It shows that 29.8 percent of them consume fish products once per week and
6.3 percent of them do not eat fish products. 4.9 percent of them stated that they rarely
consume fish products while some did not mention any reason for not consuming.
Table 2: Amount of fish consumed (per kg) per household in a typical meal
Amount of fish (Kg) % of respondents
(n= 908)
Less than 1 5.1
1 - 2 49.4
2 - 3 27.1
3 - 4 11.7
More than 4 6.7
From Table 2, it may be deduced that a high percentage of the consumers (54.5 percent)
consume between 1 to 2 kg of fish during a typical family meal (n=954). However, more
than 27.1 percent of consumers eat 2 to 3 kg of fish per meal, which may reflect a larger
family.
Per capita fish consumption based on data from the survey:
Per capita fish consumption (including fresh, frozen & fishery products): 40 kg/year;
Per capita fresh and frozen fish consumption (excluding fishery products): 23.1 kg/year;
Per capita fish products consumption (excluding fresh and frozen fish): 16.8 kg/year.
Per capita fish consumption was calculated based on data collected during the survey. It
was observed that per capita consumption of fresh and frozen fish stands at 23.1 kg/year,
much higher than the per capita consumption of fishery products of 16.8 kg/year. This
confirms the fact that Mauritians generally prefer fresh/frozen fish (Figure 12). It should
be noted that non-consumers/vegetarians were excluded from the above calculations.
Note that official figures from Statistics Mauritius indicated a per capita consumption of
21.7 kg/year in 2010 and 21 kg/year in 2011.
Some 46.1 percent of respondents prefer to buy their fish at the supermarket (Figure 9),
which is a major shift from previous surveys. This is probably due to the accessibility of
the product 60.5 percent (Figure 10). Other reasons noted were the good quality of fish
and hygienic conditions observed at the supermarkets, which tended to favour these
locations for the purchase of fish.

Fish Consumption Survey, Mauritius 22
1.6%
5.8%
10.2%
15.8%
28.3%
34.8%
46.1%
0% 10% 20% 30% 40% 50%
Fishing activities
Fishermen
Door to door
Fish landing
Fish shop
Market
Supermarket
Percentage of respondents
Pla
ces
n= 954
16.1%
53.7%
60.5%
5.0%
Cheap Fresh fish More accessible Others
Per
cen
tage
of
resp
on
den
ts
n= 948
Figure 9: Preferred places to purchase fish
Figure 10: Reasons for purchase of fish from preferred places

Results 23
8.5%
18.0%
25.8%
67.1%
88.6%
0% 20% 40% 60% 80% 100%
Others
Boiled
Grilled
Fried
Curry
Percentage of respondents
Pre
pa
rati
on
me
tho
ds
n= 948
Figure 11 illustrates the preference of respondents with regards to culinary habits in
Mauritius.
Figure 11: Preferred fish preparation(s)
88.6 percent of respondents showed a preference for fish curries and 67.1 percent
preferred fried fish. It should be noted that many families prefer to half fry the fish prior to
dipping the fish in a curry sauce. As expected from an island country, 71.7 percent of
respondents (n=954) showed a preference for the consumption of fresh fish (Figure 12)
followed by frozen fish, canned fish products and others.
Figure 12: Consumption of fish and other fishery products
71.7%
20.6%
2.4%
36.5%
8.7%
0%
10%
20%
30%
40%
50%
60%
70%
80%
Fresh Canned Smoked Frozen Salted
Pe
rce
nta
ge
of
resp
on
de
nts
Types of fish consumed n= 954

Fish Consumption Survey, Mauritius 24
36.7% 30.3%
41.7%
17.7%
51.6%
2.7%
Always freshand good
quality
Affordable & fitbudget
Like the taste Easy toprepare
Make ushealthy
Others
n= 950
46.8%
60.9%
66.7%
75.0%
58.6%
53.2%
39.1%
33.3%
25.0%
41.4%
0% 20% 40% 60% 80% 100%
Fresh
Frozen
Canned
Smoked
Salted
Percentage of respondents
Ty
pe
s o
f fi
sh c
on
sum
ed
Urban
Rural
n= 87
n= 24
n= 207
n= 366
n= 720
Figure 13: Fish consumption from rural and urban regions
Figure 13 illustrates the various categories of fish consumed in rural and urban areas. A higher
proportion of respondents from rural regions (53.2 percent) consumed more fresh fish
compared to urban regions (46.8 percent). In contrast, respondents from urban regions
consumed much more salted, smoked, canned and frozen fish. Note that most of the rural
regions covered by this study are coastal areas where the availability of fresh fish is much
higher.
Figure 14: Factors affecting the purchase of fish and other fishery products
Health awareness, quality and taste, seem to be the main criteria when deciding whether
to purchase fish or other fishery products. 51.6 percent of respondents were more health
conscious and purchased fish because of its nutritional benefits whilst 41.7 percent liked
the taste. The quality and price of fish were also considered prior to purchase.

Results 25
88%
4% 8%
Local
Imported
Don't know
n= 950
A small percentage of respondents (2.7 percent) purchased fish based on the preferences
of their family members and on the type of dish to be prepared.
Figure 15: Consumer perception with regards to quality
The majority of respondents judged the fish quality by close observation of the eyes, gill
colour and the smell of the fish. Some of the respondents trusted the fishermen or fish
seller as far as the quality of fish are concerned. Some 17.5 percent of respondents did not
know the characteristics of a good quality fresh fish.
Figure 16: Preference to local or imported fish
Eighty eight per cent of the consumers (n= 950) preferred local fish to imported ones.
However, 4 percent could not see a difference between local and imported fish (Figure 16).
Those respondents purchasing imported fish perceived that the quality was much better
and the fish was more readily available (Figure 17), however, this group was not
statistically relevant.
15.2%
35.4%
29.3%
36.8%
19.8% 17.5%
3.8%
0%
5%
10%
15%
20%
25%
30%
35%
40%
Colour ofskin
Gill colour Smell Eyes Firmness offlesh
Don't know Others
Pe
rce
nta
ge
of
resp
on
de
nts
Characteristics of fish n= 948

Fish Consumption Survey, Mauritius 26
Figure 17: Preference for imported fish why?
Over the last few years snacking has grown into a major business where high turnovers
are recorded annually. Fish snacks are diverse in nature and include samosa’s, nems6, fish
nuggets, fish balls, fish fingers, burgers and so on. It was not surprising to note that 68
percent of respondents purchased and consumed such snacks (Figure 18).
Figure 18: Purchase of fish snacks
The main consumers of fish snacks are aged between 18 and 45 years. A chi square test
revealed that there was no significant relationship between the consumption of fish snacks
and the age of the respondents.
6 Samosa’s and nems are snacks that can be made using fish.
42.1%
10.5%
5.3% 5.3%
15.8%
10.5%
5.3% 5.3%
Betterquality
Habit Betterconservation
More choice Moreaccessible&
available
Certified Less bonesthan local
ones
Have bettertaste
Pe
rce
nta
ge
of
resp
on
de
nts
n= 19
68%
32%
Yes No
n= 955

Results 27
Figure 19: Age groups and consumption of fish snacks
Figure 20: Reasons for not consuming fish snacks
Various reasons for not consuming fish snacks were put forward. 34.7 percent did not like
the artificial products that were used whilst a smaller percentage of respondents did not
perceive fish snacks to be of good quality or beneficial to their health. Others preferred
home made products.
28.6%
21.1% 22.4%
17.0%
10.8% 13.6%
17.5%
25.2% 25.6%
18.1%
0%
5%
10%
15%
20%
25%
30%
35%
18-25 26-35 36-45 46-55 >55
Pe
rce
nta
ge
of
resp
on
de
nts
Age Groups
Consume
Do notconsume
n= 646
3.0%
4.0%
4.0%
7.0%
7.0%
7.0%
7.5%
9.5%
16.1%
34.7%
Too oily
Not nutritive
Prefer whole fish
Do not trust content
Expensive
Don't like the taste
Not interested
Home preparation
Health issues
Do not like artificial…
Percentage of respondents
Re
aso
ns
n= 199

Fish Consumption Survey, Mauritius 28
Figure 21: Interest in consuming fish sausages
Presently there are no fish sausage manufacturers in Mauritius though it is evident that a
local market exists for this product. 62 percent of fish consumers (n= 954) showed a keen
interest in consuming fish sausages for various reasons illustrated in Table 3. A high
percentage (86.2 percent) of them stated that they would like to taste this new product.
Table 3: Interest in consuming fish sausages
Reasons Percentage of respondents
(n= 497)
New product (to taste and try) 86.2
Preference for fish 3.4
Nutritional value 3.0
Alternative to other fish products 3.0
Availability 0.4
Ingredients to be included on labels 0.4
Quality & norms 0.2
62%
38%
Yes No
n=954

Results 29
62.7%
85.6%
22.8%
9.8% 14.5% 4.7%
0%
10%
20%
30%
40%
50%
60%
70%
80%
90%
100%
Urban Rural
Pe
rce
nta
ge
of
resp
on
de
nts
Don't know
No
Yes
n= 483 n= 471
Figure 22: Reasons for not consuming fish sausages
Twenty eight per cent of respondents did not consume any type of sausages whilst 14.6
percent appeared not to trust the contents/ingredients used. Some did not like processed
products (11.5 percent), while others preferred to eat whole fresh fish (6.2 percent).
Figure 23: Consumption of the Cordonnier fish in urban and rural regions
It should be noted that a higher percentage of respondents (85.6 percent) from rural
areas eat Cordonnier7 fish compared to 62.7 percent from urban areas.
7 Cordonnier (Signanus sutor or rabbit fish). See photo in Annex 5.
0.4%
0.4%
0.8%
1.2%
1.9%
2.7%
6.2%
11.5%
12.7%
14.6%
18.8%
28.8%
Prefer homemade sausages
Religious beliefs
Allergic to processed food
Prefer other type sausage
Personal reasons
Not nutritive
Prefer whole fresh fish
Do not like processed/oily…
Never tasted
Don't trust content
Not interested
Do not eat normal sausages
n= 260

Fish Consumption Survey, Mauritius 30
1.6%
2.2%
4.8%
51.7%
75.6%
0% 20% 40% 60% 80%
Others
Grilled
Boiled
Fried
Curry
Percentage of respondents
Me
tho
ds
of
pre
pa
rati
on
n= 627
Better availability and probably lower price in the coastal regions8 could account for the
higher consumption of this species in the rural zones. Moreover, 22.8 percent of the
respondents (n= 483) from urban regions stated that they have never eaten the
‘Cordonnier’ as compared to 9.8 percent of respondents (n= 471) from rural regions. It
was also noted that Mauritians preferred to eat a fish curry (75.6 percent) or fried fish
(51.7 percent) rather than other types of preparation (Figure 24).
Figure 24: Culinary preference for the Cordonnier
Figure 25: Reasons for not consuming the Cordonnier
8 Most of the coastal regions are classed as rural areas.
0.7%
1.5%
2.2%
3.0%
3.7%
5.2%
10.4%
28.36%
44.78%
0% 10% 20% 30% 40% 50%
Expensive
Too many bones
Allergic
Difficult to prepare
Don't remember
Not available
Taste
Not preferred one
Negative perception
Percentage respondents
Re
aso
ns
n= 134

Results 31
71.2%
17.1%
2.2% 0.7% 9.2%
1.5% 3.4%
14.8%
0%
10%
20%
30%
40%
50%
60%
70%
80%
Fresh wholefish
Fillets Smoked Salted FrozenWhole fish
Steaks Precookedfillets
vacuumpacked
Don’t want to buy
Pe
rce
nta
ge
of
resp
on
de
nts
n= 954
55.3%
21.5%
3.8% 2.3%
17.1%
0%
10%
20%
30%
40%
50%
60%
<Rs130 Rs130-150 >Rs150 Others Don't want tobuy
Pe
rce
nta
ge
re
spo
nd
en
ts
Prices n= 954
There seems to be a general perception that consumption of the rabbit fish causes an
increase in hypertension (28.4 percent) or that it could cause nightmares and
hallucinogenic reactions (14.2 percent). It should be noted that hallucinogenic fish
poisoning is caused by eating the heads or body parts of certain species of herbivorous fish
and has previously only been recorded in the Indo Pacific region (Clarke, 2006). There are
no records of fatal cases with regards to the consumption of Cordonnier fish in Mauritius.9
28.36 percent of the respondents did not like eating Cordonnier for various reasons or did
not like the taste (Figure 25).
Figure 26: Purchasing habits for the Cordonnier
Seventy one percent of respondents preferred to purchase whole fresh rabbit fish whilst
17.1 percent preferred to buy it as fillet. Some of the respondents (14.8 percent) prefer
not to buy rabbit fish (Figure 26). It is worth noting that 55.3 percent of respondents were
ready to pay slightly less than Rs.130 for a 300 gram vacuum packed fillet pack whilst
21.5 percent of respondent were willing to pay between Rs.130 and Rs.150 (Figure. 27).
Figure 27: Price respondents willing to pay for a ready-to-eat vacuum packed
Cordonnier (300g)
9 Personal communication

Fish Consumption Survey, Mauritius 32
63.8%
40.9%
63.9%
48.8% 46.8%
36.2%
59.1%
36.1%
51.2% 53.2%
0%
10%
20%
30%
40%
50%
60%
70%
Don't want tobuy
Others More thanRs150
Rs130-150 Less thanRs130
Pe
rce
nta
ge
re
spo
nd
en
ts
Price (Rs.)
Urban n=483
n=954
Figure 28: Price respondents willing to pay for vacuum-packed Cordonnier fillets
(300g)
Figure 28 shows the different range of prices that respondents from urban regions
(n=483) and rural regions (n=471) are willing to pay for a marinated Cordonnier vacuum-
packed fillet of 300g. A high percentage (63.9 percent) of respondents from urban regions
stated that they were ready to pay for more than Rs.150. 59.1 percent of respondents
from rural regions (n=471) and 40.9 percent of respondents from urban regions (n=483)
were willing to purchase the product if the price was less than Rs.130. Moreover, a chi
square test revealed that there is a relationship between consumers from urban and rural
regions and the price they are willing to pay for a ready-to-eat vacuum-packed Cordonnier
(p<0.05).
3.2 Section B: Consumer knowledge of fish
Thirty eight percent of respondents identified Omega 3 as an essential fat whilst 31.8
percent did not know about Omega 3. There seems to be a general lack of awareness of
the general public as to the benefits of Omega 3 & 6. This could form part of the Ministry
of Fisheries awareness programmes to educate the public as to the benefits of Omega 3 &
6.

Results 33
Figure 29: Awareness of Omega 3
Figure 30: Fish consumption and a child’s brain development
Figure 30 shows that 90.2 percent of respondents (n= 1000) agreed on the positive
impact of fish consumption for a child’s brain development.
1.1% 1.4%
27%
38.7%
31.8%
0 %
5 %
10 %
15 %
20 %
25 %
30 %
35 %
40 %
45 %
Carbohydrate Dietary fibre Protein Essential fats Don't know
Pe
rce
nta
ge
of
resp
on
de
nts
n= 1000
90.2%
1.4% 8.4%
Yes
No
Don't know
n= 1000

Fish Consumption Survey, Mauritius 34
4.4%
64.1%
51.8%
14.1%
5.4% 3.3%
Water Heat Bacteria/germs
Enzymes/chemicals
Don't know Others
Pe
rce
nta
ge
re
spo
nd
en
ts
Factors causing fish spoilage
n= 1000
Figure 31: Factors affecting fish spoilage
Sixty-four and 51 percent of the respondents stated that heat and bacteria/germs
respectively affect the quality of fish whilst 5.4 percent of respondents were not aware of
the factors that spoil fish.
3.3 Section C: Consumer attitudes towards fish and other fishery products
Table 4: Likert scale categories for some attitude statements
Attitude statements
Strongly
disagree
(%)
Disagree
(%)
Neutral
(%)
Agree
(%)
Strongly
agree
(%)
Eating fish is good for health 0.4 0.1 2.3 37.2 60.0
Fish is always available to buy 3.5 24.0 18.0 38.3 16.2
If fresh fish chilled, it will
remain fresh for longer 2.7 19.8 21.9 42.0 13.5
The place where I buy fish is
clean and makes me want to
buy fish there again
1.9 2.8 15.1 53.1 27.0
Fish is cheaper than other
protein/meats 10.5 30.1 24.9 25.7 8.8
Results shown in Table 4 are self-explanatory. However it should be noted that the
majority of respondents (97.2 percent) agreed with the attitude statement that eating fish
is good for health.

Results 35
More than half (54.5 percent) agreed that fish is always available to buy and 55.5 percent
were of the opinion that fresh fish will remain fresh for longer if it is chilled. Interestingly,
some 40.6 percent of the respondents felt that fish was not cheaper than other proteins or
meat while 24.9 percent were not able to provide an answer for this statement. The
attitude statements seem to highlight that most of the people interviewed had a decent
notion of quality.
Figure 32: Likert scale categories for attitude statement on fish availability
The Likert scale categories (Figure 32) illustrates that a higher percentage of respondents
from rural areas (57.3 percent) agreed that fish is readily available for purchase compared
to those from urban areas (41.7 percent). A chi square test however revealed no
significant relationship between the availability of fish for purchase and the residential
areas of the respondents (p>0.05).
Figure 33: Problems encountered with the consumption of fish or other fishery
products
3.4%
22.7%
16.6%
37.6%
19.7%
3.5%
25.3%
19.5%
38.9%
12.8%
0%
5%
10%
15%
20%
25%
30%
35%
40%
45%
stronglydisagree
Disagree Neutral Agree StronglyAgree
Pe
rce
nta
ge
re
spo
nd
en
ts
Likert scale categories
Rural n= 471
Urban n=483
14%
86%
Yes
No
n= 971

Fish Consumption Survey, Mauritius 36
Eighty six per cent (fig 33) of respondents had never encountered any problems with the
purchase and/or consumption of fish or other fishery products. However some 14 percent
did encounter problems such as food poisoning, bad quality of the fish purchased or
allergic reactions (fig 34).
Figure 34: Problems encountered with fish and other fishery products
Table 5: Most effective mode for obtaining information about benefits and use of
fish and other fishery products
Communication methods % respondents
n= 937
TV shows 38.2
Radio 28.2
Newspaper 16.9
Internet 6.2
Fishermen 3.1
People, relatives, family 2.8
Posters, magazines and flyers 2.1
Education 0.6
Conversation 0.6
Doctors/health centre/campaigns 0.5
Experience and habits 0.4
Sellers/fish shops 0.3
Table 5 shows the most common methods of obtaining information about the benefits and
use of fish and other fishery products according to respondents. The three main modes
preferred by respondents are TV shows at 38.2 percent, radio at 28.2 percent and
newspapers at 16.9 percent.
31.9 %
26.7 %
19.8 %
7.8 %
6.9 %
2.6 %
1.7 %
0.9 %
0.9 %
0.9 %
Had allergies
Bad quality of fish
Had food poisoning
Health problems
Fish not available
Swallowed spines
Expensive
Expiry date
Hallucinations
Problems with fish products Percentage of respondents
Pro
ble
ms
en
cou
nte
red
n= 116

Results 37
Figure 35: Suggestions for the promotion of fish consumption
Figure 35 shows the various suggestions from respondents as to how to promote fish
consumption in Mauritius. 70.1 percent of the respondents proposed to have more
information about fish through sensitisation campaigns and advertisements by different
media while 27.6 percent suggested that the price of fish on the local market be reviewed
so that it is affordable to all.
Interestingly, respondents have also suggested new product development, value addition
and culinary promotions.10
10
Refer to Annex B1, Section C, table: “How to promote consumption” for complete details
5.8%
9.9%
12.5%
27.6%
70.1%
0% 20% 40% 60% 80%
Improve quality, sanitary andservices
Increase production of fish
Increase availability of fish
Lower the price of fish
Communication
Percentage respondents
Su
gg
est
ion
s
n= 797

Fish Consumption Survey, Mauritius 38
3.4 Section D: Consumer profiles
Table 6: Details of consumers (n=1000)
Profiles Labels % respondents
Residential Area Urban 51.0
Rural 49.0
Gender Male 50.7
Female 49.3
Age group
18-25 23.3
26-35 20.1
36-45 23.1
46-55 19.5
>55 14.0
Educational
level
Primary 15.8
Secondary 50.7
Tertiary 31.4
Vocational 1.1
No schooling 1.0
Occupation
Working 69.7
Not working 11.4
Student 13.7
Pensioner 5.2
Range of
household
salary
<Rs 5,000 1.9
Rs 5,000 - 10,000 8.3
Rs 11,000 - 15,000 8.7
Rs 16,000 - 20,000 7.0
Rs 21,000 - 25,000 11.1
>Rs 25,000 24.2
No reply 38.8

Results 39
22.4% 24.3%
18.0% 22.2%
22.4% 23.9%
20.4% 18.6%
16.9% 11.0%
0%
20%
40%
60%
80%
100%
120%
Urban Rural
Pe
rce
nta
ge
of
resp
on
de
nts
Residential regions
>55
46-55
36-45
26-35
18-25
49.4% 52.0%
50.6% 48.0%
0%
20%
40%
60%
80%
100%
120%
Urban Rural
Pe
rce
nta
ge
of
resp
on
de
nts
Residential regions
Female
Male
Figure 36 illustrates the distribution of respondents (n=1000) according to their age group
for each residential region. 22.4 percent and 24.3 percent of the respondents from urban
and rural regions respectively were aged between 18-25 years old.
Figure 36: Age groups based on residential region
Figure 37 outlines the distribution of respondents (n=1000) according to their gender for
each residential region.
Figure 37: Gender based on residential region

Fish Consumption Survey, Mauritius 40
4. Discussion
4.1 Fish Consumption in Mauritius
This survey is probably the most comprehensive fish consumption survey that has been
carried out for a long time. Baya (2013), and Kareemun (2013) carried out fish surveys at
selected locations in Mauritius (BSc thesis). As part of their Household Survey, Statistics
Mauritius request a minimum of details with regards to fish consumption. The official fish
consumption level in Mauritius was 21.7 kg/year in 2010 and 21.0 kg/year in 2011.11
However based on calculations from this survey, it was found that fish consumption among
the sample of respondents is 40.0 kg/caput/year (excluding vegetarians and non-
consumers). This is a more realistic figure although the survey targeted likely fish
consumers rather than the general public at large. Further studies are recommended in
order to gain more information about issues not covered in the present survey.
The present survey, carried out in November 2013, selected 21 sites to represent both
urban and rural areas. The survey was carried out at supermarkets, markets, landing
sites, fish shops, etc. It was found that the majority of respondents (95 percent) are
buyers and consumers of fish and other fishery products. The consumption/purchase of
fish and other fishery products among the respondents were well spread among
throughout the different age groups with the highest percentage of fish
consumption/purchase within the groups ranging between 18-45 years old. One of the
main reasons for not buying and consuming fish or other fishery products was associated
to religious beliefs (32.6 percent) and taste (28.3 percent).
Mauritians (33.6 percent) preferred to consume fresh or frozen fish at least once a week
with a lower percentage (23.4 percent) consuming fresh/frozen fish twice a week. The
frequency of fish consumption, despite the availability of other meat products, is a good
indication of health awareness/benefits from consuming fish regularly by the population. It
should be noted that as an island state, fish consumption is well established in Mauritius.
Eating at least some fish per week tends to lower the Coronary Heart Disease (CHD)
mortality rate when compared to those who do not eat any fish (Stone, 1994).
Consumers (46.1 percent) preferred to purchase fish at supermarkets.12 This may be due
to the fact that supermarkets are easily accessible for most consumers (60.5 percent).
Over the last few years there has been a proliferation of supermarkets across the island. It
should also be noted that the disappearance of door-to-door fish sellers and traditional
Chinese shops in villages, coupled with the rise in purchasing power of Mauritians,
nowadays tend to favour purchases from supermarkets.
11 Published by Statistics Mauritius 12 Survey interviews took place outside several supermarkets.

Discussion 41
With regards to culinary habits, most of the consumers (88.6 percent) prepare fish as
curries. However, a high percentage (67.1 percent) also consumed fried fish, which is not
a very good method of fish preparation. A past study (Nihn, 2011)13 revealed that women
who ate even one serving of fried fish during a week had a 48 percent higher risk of heart
failure, compared to those consumers who rarely or never ate fish. It should be noted that
there might be other variables not accounted for in the study linked with this statement.
The survey also found that some 25.8 percent of respondents preferred grilled fish, which
could be an alternative cooking method to be promoted among the public.
Respondents from rural areas had a higher preference for fresh fish. This may be due to
the fact that the rural areas surveyed were mostly coastal, where consumers have easy
access to fresh fish. Many rural consumers are themselves amateur fishers. Consumers
from urban areas consumed much more frozen fish, which may be attributed to
supermarkets selling frozen fish sometimes already cleaned and cut in pieces and also due
to logistical problems bringing in fresh fish. An interesting fact to note is that 75 percent of
the respondents (n=24) consuming smoked fish were from urban areas. Presently there
are only a few smoked fish manufacturers in Mauritius. Though the size of the population
analysed is small, it could be safely inferred that there may be a potential to further
develop this type of product in Mauritius for a niche local market.
A fresh fish has clear bright eyes, bright red gills and moist/shiny skin. They also have a
sea-fresh smell and firm flesh. A good percentage of respondents were aware of those
characteristics while 17.5 percent of them could not distinguish good quality fresh fish. The
study also revealed that 88 percent of respondents preferred local fish rather than
imported ones and the reasons given by those preferring imported fish were because they
perceived that imported fish were of better quality (42.1 percent).
Sixty eight per cent of respondents buy fish snacks such as fish balls and fish fingers,
amongst others. This compares favourably with the study carried out in Seychelles (SFA,
2008). It was observed that a higher percentage of respondents (28.6 percent) consuming
snacks were aged between 18 and 25 years. Food industries could consider developing
marketing strategies to enhance consumption of fish snacks for this age group. It was also
found that 34.7 percent of respondents did not like artificial products associated with fish
snacks while some did not consume snacks due to health issues such as allergies (16.1
percent). However, if good cooking methods that can preserve the nutritional value of fish
can be employed then fish snacks could be a viable means to promote fish consumption.
Promotion of fish consumption using the bycatch from tuna long liners could also be
envisaged for the production of fish sausages. Presently there are no manufacturers of fish
sausages in Mauritius though 62 percent of the respondents were interested to consume
fish sausages, whilst 86.2 percent of the respondents were willing to taste such a product.
13
National Institute of Health and Nutrition

Fish Consumption Survey, Mauritius 42
It was found that labelling of ingredients to show the nutritional value and content of fish
sausages could enhance consumption. The manufacture of fish sausages could be
envisaged in Mauritius.
4.2 Consumption of the Cordonnier (Rabbit fish)
The IOC FAO/SmartFish programme is assisting Mauritius by supporting the small-scale
sector develop the cage culture of the ‘Cordonnier’ rabbit fish. This species are herbivorous
and thus minimal cost is required for artificial pellet feed as they feed on algae from the
lagoon. The IOC FAO/SmartFish Programme, in collaboration with the Fishermen
Investment Trust (FIT), launched the aquaculture project by setting six grow-out cages at
sea at Poste de Flacq and Quatre Soeurs. Fisher cooperatives are involved in the day-to-
day management of the cages. Hence, the findings of the current study should further
assess consumption habits and levels of this fish among consumers and look into the
possibility of vertical integration of the project.
The study revealed that a high percentage (85.6 percent) of respondents from rural
regions compared to 62.7 percent from urban regions have consumed rabbit fish. The
lower consumption in urban areas may be due to the availability of fresh fish in towns.
However, widening the availability and accessibility of this fish on the market could
increase the consumption of rabbit fish.
Findings showed that a high percentage of consumers (75.6 percent) prepared the
‘Cordonnier’ as curry, followed by fried (51.7 percent) and boiled (4.8 percent). This
finding is in line with overall preparation methods of fish whereby fish is mostly consumed
as a curry in Mauritius. This could also imply that consumers are not aware of other
culinary methods. Future awareness programmes should take this into account and show
how the fish can be prepared in other ways.
Consumers gave several reasons for not eating rabbit fish and these are mainly associated
with negative perceptions (44.78 percent) such as nightmares, hallucinations and
hypertension. It should be noted that hallucinogenic fish poisoning is thought to be caused
by eating the head or body parts of certain species of herbivorous fish and this has
previously only been recorded in the Indo Pacific region, (Clarke, 2006). Ciguatera
poisoning is associated with the consumption of reef fish that have fed on particular types
of algae. There are however no records for ciguatera poisoning due to consumption of the
‘Cordonnier’ fish in Mauritius though consumption of the fish is perceived to cause
nightmares.
Some respondents (28.36 percent) stated that they did not like the taste of the
‘Cordonnier’. To further promote the consumption of this fish and for the success of the
pilot project, awareness campaigns should focus on the nutritional value and alternative
preparation and cooking techniques for this fish.

Discussion 43
The majority (71.2 percent) of respondents preferred to buy fresh whole ‘Cordonnier’ while
17.1 percent prefer it as fillets and 9.2 percent as frozen. Lower responses were observed
for precooked fillets of vacuum-packed (3.4 percent), smoked (2.2 percent) and salted
(0.7 percent) ‘Cordonnier’. This may be due to the fact that these types of products are
currently available on the market. The production of vacuum-packed marinated/precooked
fillets could enhance consumption of ‘Cordonnier’ in urban areas, which are the main focus
of the project.
4.3 Consumer knowledge of fish
Some respondents (38.7 percent) are aware of the health benefits of Omega 3 e.g. for the
prevention of coronary heart disease. It was noted that quite a number of respondents
either did not know or confused Omega 3 with protein (27 percent). Thus there is scope to
reflect on the current state of consumer knowledge on the nutritional benefits of fish with
a view to improving awareness.
Sixty-four percent of respondents agreed that heat is an important factor that may affect
the quality of fish. Similarly, bacteria/germs (51.8 percent) area also essential factors that
spoil fish according to respondents. It is known that bacteria due to high temperatures
cause fish spoilage, especially fresh fish. Since Mauritius is a tropical island it is important
that consumers are fully aware of the main factors of fish spoilage. This could also be part
of an awareness campaign.
4.4 Consumer attitudes towards fish and other fishery products
Ninety-seven percent of respondents totally agreed that fish is beneficial for health though
they are not always aware as to why fish consumption is good. The availability of fresh fish
might be lacking in urban areas especially in central regions due to higher logistical costs.
However no relationship was found in a Chi-square test between regions and fish
consumption (including fresh fish and other fishery products). 55.5 percent of the
respondents agreed that fresh fish when chilled would keep for longer while 22.7 percent
did not agree and 21.9 percent were found to be neutral, which might be an indication that
44.7 percent are not really sure about the importance of ice in preserving fish quality. This
could be an issue to take into consideration to inform the population about the right way
and methods of conserving fish quality and hence raise awareness about how to choose
and buy good quality and properly handled fish.
The majority of respondents agreed (80.1 percent) that the cleanliness of the places where
they buy fish would definitely affect their willingness to buy. Meanwhile, 40.6 percent of
respondents (disagreed) did not find fish cheaper than meat. Again, this could be a
question of availability and the marketing chain of fish.

Fish Consumption Survey, Mauritius 44
The main food safety issues perceived by consumers are allergies (31.9 percent), bad
quality fish (26.7 percent) and food poisoning (19.8 percent). These problems could be the
result of improper handling, inappropriate conservation methods, poor sanitary conditions,
or the consumption of spoilt fish or poor preparation and cooking at home. It should be
noted that fish might also be contaminated by the environment before capture or as a
result of feeding habits e.g. heavy metals, toxins, and this is independent of handling and
hygiene issues.
The survey suggested that the best way to inform the population about consumption
issues is were through TV shows (38.2 percent0, radio (38.2 percent) and newspapers
(16.9 percent). These were considered as the most effective way to disseminate
information across the country.
4.5 Consumption per capita
The Ministry of Fisheries in collaboration with Statistics Mauritius found that Mauritians
consume 21.7 kg of fish annually per caput (calculated on the total population). 14
However, these calculations do not take into account vegetarians and those people who do
not like to consume fish for one reason or another.
The present study found a per capita fish and other fishery products consumption of 40.0
kg/year. These calculations excluded vegetarians and other non-consumers of fish and
other fishery products. This is a much more realistic figure for the consumption of fish by
consumers in Mauritius. The per capita consumption of fresh and frozen fish was found to
be 23.1kg/year whilst the per capita consumption of fish products only was 16.8 kg/year.
One of the main constraints in carrying out the survey was the time factor of consumers.
For future surveys this will need to be taken into consideration when designing the
questionnaire. Interviews in future surveys need to be a maximum length of 7-8 minutes.
14 Ministry of Fisheries Annual Report, 2010.

Conclusions and recommendations 45
5. Conclusions and recommendations
Per capita fish consumption in Mauritius, as found in this survey, is 40 kg per capita which
is well above the world average of 17 kg/caput/year. Fish and other fishery products
remain important sources of animal protein for the country.
However, the domestic production of fish and fishery products is not sufficient and the
country has to import nearly 11,500 tonnes of fish and other fishery products from various
countries per annum. The focus is currently on aquaculture as a mean to increase
domestic fish production.
As an island country, Mauritians love to eat fish and culinary habits have not changed
much over the years as shown in this report. Fish supply from local sources is an
important component and additional research should be undertaken to determine current
fish supplies and sources of variation in this supply.
Consumption avoidance, reflecting traditional and/or perceptions and beliefs could be
addressed through targeted education programmes, starting at the community level.
These programmes could emphasize the nutritional benefits of eating fish in particular and
stimulate growth in the seafood sector. Perceptions relating to poor product quality could
also be addressed by improving supply chain management and processing facilities, thus
enhancing obvious economic and social benefits.
5.1 Recommendations
Based on the results of this study it is recommended that:
Similar surveys are repeated regularly, for example at least once every three years,
using the present study as a reference to monitor behavioural changes in fish
consumption habits and perceptions of consumers;
Awareness campaigns are carried out regularly and a culinary programme be
developed in collaboration with the local TV station to promote and raise awareness
on the health benefits of eating fish and alternative ways of cooking fish and other
fishery products. Awareness on the proper handling and conservation of fish may
also be necessary in the context of norms and standards (hygiene) to be kept prior
to fish sales.
A toxicity study on the cultured Cordonnier fish is undertaken. This may dispel many
preconceived ideas. Such as study could also look into other health issues such as
allergies.
Fish be included in all food security policies/strategies and the commercial culture of
the Cordonnier and other species be seriously promoted (funds to be made available
by Government), both on a small scale and an industrial level, in line with the
government concept of a blue Mauritius.

Fish Consumption Survey, Mauritius 46
The use of tuna by-catch and canning waste for human consumption through
innovative product development be encouraged. This would definitely boost per
capita consumption to avoid resorting to costly imports.

References 47
6. References
AMSAT International, 2011. Fish and animal protein consumption and availability in Timor-
Leste. Regional Fisheries Livelihoods Programme for South and Southeast Asia
(GCP/RAS/237/SPA) Field Project Document 2011/TIM/02
ARC/FAO Banda Aceh, Fish Consumption and Quality Questionnaire
Baya, J. F. L., 2013. A Conceptual Framework for the Investigation of Fresh fish
Availability and Consumption in Regions of Saint Pierre, Rose Hill and Quatre Bornes in
Mauritius. Thesis (BSc), University of Mauritius.
BOBP, Survey of fish consumption in Madras, 1992. BOBP/WP/83
Clarke, M., 2006. Men hallucinate after eating fish. Available from:
http://www.practicalfishkeeping.co.uk/content.php?sid=888
CSO, 2012. Ministry of Finance & Economic Development, Digest of Agriculture Statistics,
2011. Central Statistics Office, Mauritius. Available from:
http://www.gov.mu/portal/goc/cso/file/DigestAgric2011.pdf
Kareemun, Z. B., 2013. An evaluation of consumer behaviour relating to aquaculture and
food security in Mauritius. Thesis (BSc), University of Mauritius
Ministry of fisheries and Rodrigues, 2010. Annual Report 2010: Fisheries Division.
Available from:
http://fisheries.gov.mu/English/Publication/Annual%20Report/Documents/report%202010
Sea fish, 2010. Chilled vs. frozen: consumer perceptions. Brahm/Seafish
SFA, 2008. Seychelles seafood consumption survey 2008. Seychelles Fishing Authority
Research Division
Stone N.J, 1994: Fish consumption; fish oil, lipids and coronary heart disease, American
Heart Association, Public Information, 7272 Greenville, Dallas, TX 75231-4596.

Fish Consumption Survey, Mauritius 48
Annex 1. Terms of reference
Terms of reference of the amendment:
Terms and conditions
1. Work plan and timeframe
The timeframe for this agreement shall be from the date of signature of this agreement by
both parties until 15 January 2014.
It is understood that unforeseen circumstances may affect the completion of this
agreement. In such cases the duration and timing will be adjusted by mutual consent of
the CVF and FAO, however the adjustment of any timing changes cannot go beyond 18
months of the date of signing the agreement.
2. Changes in the activities planned and additional activities
The following activities have been included in the revised work plan:
Activity 3.1 Assessment of consumer habits with regards to fish consumption
Indicators:
At least 500 stakeholders interviewed in 18 locations by 20 November 2013
A national fish consumption survey report produced by 1st December 2013
Time and cost-related implications of the activities listed above are summarized in the
revised work plan and budget annexed.

Annexes 49
Annex 2. Questionnaire
Fishermen Investment Trust/IOC SmartFish/University of Mauritius
Fish consumption survey
Dear respondent,
On behalf of the Fishermen Investment Trust and the IOC SmartFish Programme, we
would like to thank you for taking time to fill in this questionnaire. This survey is about
buying and eating fish. Your contribution will help us understand more about fish
consumers and fish consumption in Mauritius. Thank You.
Interview location
type
Supermarket Local market Fish shop Landing site
Location: Date:
Name of interviewer:
Please select the option(s) that best indicate(s) your choice(s). More than 1 option is
allowed.
Section A: Fish consumption
A1. Do you or your household buy and eat fish and other fishery products?
Yes No
If no, why not?
Do not like fish Too expensive Too many bones
Do not like the smell Got sick last time Religious reasons
Allergic to fish Do not know how to cook Other (specify)………
[If no, move on to complete knowledge (Section B), attitude questions (Section C) and
consumer details (Section D) and then end the interview]
A2. How often do you or your household eat fresh or frozen fish?
Once a month Once every 2 weeks Once a week
Twice a week 3 to 6 times a week Everyday Other (specify)
A3. How often do you or your household eat fish products fish (e.g. canned,
dried)?
Once a month Once every 2 weeks Once a week
Twice a week 3 to 6 times a week Everyday Other(specify)

Fish Consumption Survey, Mauritius 50
A4. How much fish do you or your family eat at a typical meal?______ kg
A5. (i) Where do you normally buy fish?
Market Fish landing Fish Shop
Door to door seller Supermarket Other (specify)
(ii) Why do you buy from these places?
Cheap Fresh fish available More accessible Other (specify)
A6. How do you normally prepare the fish & fishery products for eating?
Fried Grilled Boiled Curry Other (specify)
A7. What types of fish do you consume more frequently?
Fresh fish Canned fish Smoked fish
Frozen fish Salted fish
A8. What are the factors that affect your purchase of fish or other fishery
products?
Always fresh & good quality Affordable & fits budget Like the taste
Easy to prepare Is healthy for us Other (specify)
A9. How do you normally tell whether the fresh fish you buy is of good quality or
not?
Colour of skin Gill colour Smell Eyes
Firmness of flesh Don’t know Other (specify)
A10. Do you prefer local or imported fish?
Local Imported If imported, why? ………… Don’t know …….
A11. Do you usually buy fish snacks (e.g., fish balls, samosa, etc.)?
Yes No If No, why?………….. If yes, state which ones …………..
A12. Would you be interested to eat fish sausages?
Yes If yes, why?……………….
No If no, why not? .......………
A13. Have you ever eaten Cordonnier fish?
Yes No Don’t know
If yes, how do you prepare it at home? ……………………………………………………
If no, why do you not eat it? ..............…………………………………………………….

Annexes 51
A14. How would you prefer to purchase the Cordonnier?
Fresh whole fish Fillets Smoked Salted
Frozen Whole fish Steaks Precooked vacuum-packed fillets
A15. How much would you be prepared to pay for a ready-to-eat vacuum-packed
Cordonnier fillet (300g)?
< Rs. 130 Rs. 130-150 Rs. >150 Other (specify) ………
Section B: Knowledge of fish
B1. Fish is a good source of Omega 3. What is Omega 3?
A. Carbohydrate B. Dietary fibre
C. Protein D. Essential fats E. Don’t know
B2. Is eating fish good for a child’s brain development?
Yes No Don’t know
B3. What makes fish spoil or go bad?
Water Heat Bacteria/ germs
Enzymes/ chemicals Don’t know Other (specify) …………
Section C: Consumer attitudes towards fish & fish products
C1. Please tick the box that best indicates your opinion of the following
statements:
Attitude statements Strongly
Disagree Disagree Neutral Agree
Strongly
Agree
Eating fish is good for your health
Fish (any type) is always available
If fresh fish is chilled then it will remain in
good quality
The place where I buy fish is clean and
makes me want to buy fish there
Fish is cheaper than other protein/meat

Fish Consumption Survey, Mauritius 52
C2. Have you ever encountered any problem with fish or other fishery products?
Yes No If yes, what type(s) of problem? …………………
C3. Which of the following activities do you find most effective in informing you
about the benefits and use of fish and other fishery products? Please circle ONLY
ONE option.
A. Radio B. Newspaper C. TV shows Other …………
C4. What, in your opinion, can be done to promote the consumption of fish and
other fishery products in Mauritius?
Section D: Consumer details
D1. Residential Area: Urban Rural
D2. Gender: Male Female
D3. Age group:
18-25 26-35 36-45 46-55 > 55
D4. What is your level of education?
Primary Secondary Tertiary Other (specify) ………
D5. What is your occupation?
Working Not working Student Pensioner
Please specify your profession:………..……………………………..
D6. How many people are there in your household? ………………
D7. Can you indicate your household income per month?
Less than 5,000 Rs. 5,000 – 10,000 Rs. 10,000– 15,000
Rs. 15,000 – 20,000 Rs. 20,000 – 25,000 More than Rs. 25,000
Prefer not to answer
D8. Name of respondent: ……………………………………………
D9. Contact details: ………………………………………………….

Annexes 53
Annex 2.1. Statistical outputs
Section A: Fish consumption in Mauritius
Do you or your household buy and eat fish and other fishery
products?
Frequency % Valid Per cent Cumulative percentage
Valid Yes 954 95.4 95.4 95.4
No 46 4.6 4.6 100
Total 1,000 100 100
Case Processing Summary
Cases
Valid Missing Total
N % N % N %
Do you or your household buy
and eat fish and other fishery
products? * Age group
1,000 100 0 0 1,000 100
Do you or your household buy and eat fish and other fishery products? * Age
group cross tabulation
Age group (%)
Total 18-25 26-35 36-45 46-55 >55
Do you or
your
household
buy and eat
fish and
other
fishery
products?
Yes Count 227 190 222 189 126 954
Do you or your household
buy and eat fish and other
fishery products?
23.8 19.9 23.3 19.8 13.2 100
Percentage within age
group 97.4 94.5 96.1 96.9 90 95.4
Percentage of Total 22.7 19 22.2 18.9 12.6 95.4
No Count 6 11 9 6 14 46
Do you or your household
buy and eat fish and other
fishery products?
13 23.9 19.6 13 30.4 100
Percentage within age
group 2.6 5.5 3.9 3.1 10 4.6
Percentage of Total .6 1.1 .9 .6 1.4 4.6
Total Count 233 201 231 195 140 1,000
Do you or your household
buy and eat fish and other
fishery products?
23.3 20.1 23.1 19.5 14 100
Percentage within age
group 100 100 100 100 100 100
Percentage of Total 23.3 20.1 23.1 19.5 14.0 100

Fish Consumption Survey, Mauritius 54
Case summary
Valid Missing Total
N % N % N %
46 4.6 954 95.4 1000 100
Frequency: Reasons for not consuming fish
Response
% cases
N %
Reasons
Do not like fish 13 25.0 28.3
Too expensive 3 5.8 6.5
Too many bones 2 3.8 4.3
Do not like the
smell 3 5.8 6.5
Got sick last time 1 1.9 2.2
Religious beliefs 15 28.8 32.6
Allergic to fish 3 5.8 6.5
Other 12 23.1 26.1
Total 52 100 113
Statistics
Frequency of eating fresh fish or frozen fish
N Valid 954
Missing 46
Frequency: Eating fresh or frozen fish
Frequency % Valid % Cumulative %
Valid
Once a month 108 10.8 11.3 11.3
Once every 2
weeks 172 17.2 18 29.4
Once a week 321 32.1 33.6 63
Twice a week 223 22.3 23.4 86.4
3 to 6 times a
week 79 7.9 8.3 94.7
Everyday 31 3.1 3.2 97.9
Others 17 1.7 1.8 99.7
Do not eat (fresh
or frozen fish) 3 .3 .3 100
Total 954 95.4 100
Missing System 46 4.6
Total 1000 100

Annexes 55
Statistics
Frequency of eating fish products
N Valid 954
Missing 46
Frequency: Eating fish products
Frequency % Valid % Cumulative %
Valid Once a month 197 19.7 20.6 20.6
Once every 2
weeks
134 13.4 14 34.7
Once a week 284 28.4 29.8 64.5
Twice a week 161 16.1 16.9 81.3
3 to 6 times a
week
63 6.3 6.6 87.9
Everyday 8 .8 .8 88.8
Others 47 4.7 4.9 93.7
Do not eat (fish
products)
60 6 6.3 100
Total 954 95.4 100
Missing System 46 4.6
Total 1,000 100
Statistics
Amount of fish consumed per household in
a typical meal
N Valid 908
Missing 92
Amount of fish consumed per household in a typical meal
Frequency % Valid % Cumulative %
Valid <1kg 46 4.6 5.1 5.1
1-2Kg 449 44.9 49.4 54.5
2-3kg 246 24.6 27.1 81.6
3-4kg 106 10.6 11.7 93.3
>4kg 61 6.1 6.7 100
Total 908 90.8 100
Missing System 92 9.2
Total 1,000 100

Fish Consumption Survey, Mauritius 56
Per capita fish consumption formula:
(Mean) Household consumption (lbs) per meal = a
(Mean) Number of people in household consuming fish = b
Per capita consumption per meal = a/b
(Mean) Frequency of fish consumption per month = c
Monthly per capita consumption = a/b x c
Annual per capita consumption = (a/b) x c x 12 months
Per capita
fresh/frozen
fish
consumption
Annual per capita
consumption = (a/b) x c x
12 months
0.61*6.32*12
46.29 lbs/year
a/b= 0.61 2 lbs = 1 kg
(n = 954) c for fresh & frozen = 6.32
46.29 lbs = 23.15
kg
23.15 kg/year
Per capita fish
products
consumption
Annual per capita
consumption = (a/b) x c x
12 months
0.61*4.6*12
33.70lbs/year
a/b= 0.61 2 lbs = 1 kg
(n = 954) c for other fishery products
= 4.6
33.70 lbs = 16.85
kg
16.85 kg/year
Total fish consumption= 23.15 + 16.85 = 40.0 kg per year or
Per capita
fish
consumption
Annual per capita
consumption = (a/b) x c x
12 months
0.61*10.92*12
79.99 lbs/year
a/b= 0.61 2 lbs = 1 kg
(n = 954) c = 10.92
79.99 lbs = 40 kg
40 kg/year

Annexes 57
Case summary
Valid Missing Total
N % N % N %
954 95.4 46 4.6 1,000 100
Frequency: Places to buy fish
Responses % cases
N %
Place where
respondents
normally buy
fish
Market 332 24.4 34.8
Fish landing 151 11.1 15.8
Fish shop 270 19.9 28.3
Door to door 97 7.1 10.2
Supermarket 440 32.4 46.1
Fishermen 55 4.0 5.8
Fishing
activities
15 1.1 1.6
Total 1,360 100 142.6
Case summary
Q A5.2 a Valid Missing Total
N % N % N %
948 94.8 52 5.2 1,000 100
Reason for buying fish from preferred places
Responses % cases
N %
Why
respondents
bought fish
there a
Cheap 153 11.9 16.1
Fresh fish 509 39.7 53.7
More accessible 574 44.7 60.5
Others* 47 3.7 5.0
1283 1,283 100 135.3
*: good quality fish and hygienic conditions
Case summary
Q A6 a Valid Missing Total
N % N % N %
948 94.8 52 5.2 1,000 100
a: group

Fish Consumption Survey, Mauritius 58
Frequency: Method of preparing fish
Responses % cases
N %
How fish and
other fishery
products
prepared
Fried 636 32.2 67.1
Grilled 245 12.4 25.8
Boiled 171 8.7 18
Curry 840 42.6 88.6
Other* 81 4.1 8.5
Total 1,973 100 208.1
*: includes those who do not prepare fish themselves
Case summary
Q A7 a Valid Missing Total
N % N % N %
950 95 50 5 1,000 100
a: group
Frequency: Type of fish most consumed
Responses % cases
N %
Type of fish
most consumed
by respondent
Fried 720 51.3 75.8
Canned 207 14.7 21.8
Smoked 24 1.7 2.5
Frozen 366 26.1 38.5
Salted 87 6.2 9.2
Total 1,404 100 147.8
Residential Area
Urban Rural Total
Count Row N % Count Row N % Count Row N%
I
consume fresh
fish more
frequently
Fresh fish 337 46.8 383 53.2 720 100
Canned fish 138 66.7 69 33.3 207 100
Smoked fish 18 75 6 25 24 100
Frozen fish 223 60.9 143 39.1 366 100
Salted fish 51 58.6 36 41.4 87 100

Annexes 59
Case summary
Q A8 a Valid Missing Total
N % N % N %
950 95 50 5 1,000 100
a: group
Frequency: Factors affecting purchase of fish and other fishery
products
Responses % cases
N %
Factors
affecting
purchase of
fish and
other
fishery
productsa
Always fresh and
good quality
349 20.3 36.7
Affordable & fit
budget
288 16.8 30.3
Like the taste 396 23.1 41.7
Easy to prepare 168 9.8 17.7
Make us healthy 490 28.5 51.6
Other 26 1.5 2.7
Total 1,717 100 180.7
a: group
Case summary
Q A9 a Valid Missing Total
N % N % N %
948 94.8 52 5.2 1,000 100
a: group
Fish quality
Responses % cases
N %
How
respondents
determine fish
quality
Colour of skin 144 9.6 15.2
Gill colour 336 22.4 35.4
Smell 278 18.6 29.3
Eyes 349 23.3 36.8
Firmness of
flesh
188 12.6 19.8
Don't know 166 11.1 17.5
Others* 36 2.4 3.8
Total 1,497 100 157.9
a: group * includes if labelled will verify expiry date, ask sellers and verify environmental conditions

Fish Consumption Survey, Mauritius 60
Statistics
Preference for local or imported fish
N Valid 950
Missing 50
Preference for local or imported fish
Frequency % Valid % Cumulative %
Valid Local 836 83.6 88 88
Imported 35 3.5 3.7 91.7
Don’t
know 79 7.9 8.3 100
Total 950 95 100
Missing System 50 5
Total 1,000 100
Statistics
If imported fish - why?
N Valid 19
Missing 9981
If imported fish - why?
Frequency % Valid % Cumulative %
Valid Better quality 8 .8 42.1 42.1
Habit 2 .2 10.5 52.6
Better
conservation
1 .1 5.3 57.9
More choice 1 .1 5.3 63.2
More accessible
and available
3 .3 15.8 78.9
Certified 2 .2 10.5 89.5
Local one too
many bones
1 .1 5.3 94.7
Taste better 1 .1 5.3 100
Total 19 1.9 100
Missing System 981 98.1
Total 1,000 100
Statistics
Purchase of fish snacks
N Valid 955
Missing 45

Annexes 61
Frequency: Purchase of fish snacks
Frequency % Valid % Cumulative %
Valid Yes 646 64.6 67.6 67.6
No 309 30.9 32.4 100
Total 955 95.5 100
Missing System 45 4.5
Total 1,000 100 100
Do you usually buy fish snacks? * Age group cross tabulation
Age group (%)
Total 18-25 26-35 36-45 46-55 >55
Do you
usually
buy
fish
snacks?
Yes Count 185 136 145 110 70 646
Do you
usually
buy fish
snacks?
28.6 21.1 22.4 17 10.8 100
Age group 81.5 71.6 65 58.2 55.6 67.6
Percentage
of total 19.4 14.2 15.2 11.5 7.3 67.6
No Count 42 54 78 79 56 309
Do you
usually
buy fish
snacks?
13.6 17.5 25.2 25.6 18.1 100.0
Age group 18.5 28.4 35 41.8 44.4 32.4
Percentage
of total 4.4 5.7 8.2 8.3 5.9 32.4
Total Count 227 190 223 189 126 955
Do you
usually
buy fish
snacks?
23.8 19.9 23.4 19.8 13.2 100
Age group 100 100 100 100 100 100
Percentage
of total 23.8 19.9 23.4 19.8 13.2 100

Fish Consumption Survey, Mauritius 62
Statistics
Do not eat fish snacks
N Valid 199
Missing 801
Frequency: Reasons for not eating fish snacks
Frequency % Valid % Cumulative %
Valid Do not like artificial
products
69 6.9 34.7 34.7
Health issues 32 3.2 16.1 50.8
Not nutritive 8 .8 4 54.8
Do not trust content 14 1.4 7 61.8
Home preparation 19 1.9 9.5 71.4
Expensive 14 1.4 7 78.4
Prefer whole/fresh 8 .8 4 82.4
Too oily 6 .6 3 85.4
Don't like the taste 14 1.4 7 92.5
Not interested 15 1.5 7.5 100
Total 199 19.9 100
Missing System 801 80.1
Total 1,000 1000
Chi-Square Tests – Fish snacks and age group
Value df Asymp. Sig. (2-sided)
Pearson Chi-Square 38.06a 4 .000
Likelihood ratio 39.43 4 .000
Linear-by-linear
association 36.78 1 .000
No. of valid cases 955
a. 0 cells (.0 percent) have expected count less than 5. The
minimum expected count is 40.77.
Statistics
Would you like to eat fish sausages?
N Valid 954
Missing 46

Annexes 63
Would you like to eat fish sausages?
Frequency % Valid % Cumulative %
Valid Yes 587 58.7 61.5 61.5
No 367 36.7 38.5 100
Total 954 95.4 100
Missing System 46 4.6
Total 1,000 100
Statistics
Why would you like to eat fish sausages?
N Valid 497
Missing 503
Frequency: Why would you like to eat fish sausages?
Frequency % Valid % Cumulative %
Valid New product 428 42.8 86.2 86.2
Easy to prepare 17 1.7 3.4 89.6
Preference for fish 17 1.7 3.4 93
Nutritional value 15 1.5 3 96
Alternative to other
fish products 15 1.5 3 99
Availability 2 .2 .4 99.4
Ingredients to be
included on labels 2 .2 .4 99.8
Quality and norms 1 .1 .2 100
Total 497 49.7 100
Missing System 503 50.3
Total 1,000 100
Statistics
Why would you not eat fish sausages?
N Valid 260
Missing 740

Fish Consumption Survey, Mauritius 64
Frequency: Reasons for not eating fish sausages
Frequency % Valid % Cumulative %
Valid Do not like
processed/oily
products
30 3 11.5 11.5
Do not eat normal
sausages
75 7.5 28.8 40.4
Do not trust content 38 3.8 14.6 55
Prefer whole/fresh 16 1.6 6.2 61.2
Not interested 49 4.9 18.8 80
Not nutritional 7 .7 2.7 82.7
Never tasted 33 3.3 12.7 95.4
Allergic to
processed foods
5 .5 1.9 97.3
Prefer other
sausages
2 .2 .8 98.1
Religious reasons 3 .3 1.2 99.2
Prefer to make
myself
1 .1 .4 99.6
Total 260 26 100
Missing System 740 74
Total 1,000 1000
Statistics
Consumption of Cordonnier fish
N Valid 954
Missing 46
Consumption of Cordonnier fish
Frequency % Valid % Cumulative %
Valid Yes 706 70.6 74 74
No 156 15.6 16.4 90.4
Don’t
know 92 9.2 9.6 100
Total 954 95.4 100
Missing System 46 4.6
Total 1,000 100

Annexes 65
Chi-Square Tests – Consumption of Cordonnier and residential
area
Value df Asymp. Sig. (2-sided)
Pearson Chi-Square 65.32a 2 .000
Likelihood ratio 67.43 2 .000
Linear-by-linear
association 60.14 1 .000
No. of valid cases 954
a. 0 cells (.0 percent) have expected count less than 5. The
minimum expected count is 45.42
Do you usually buy fish snacks? * Age group cross tabulation
Residential area
Total 18-25 26-35 Urban Rural >55
Have you
ever eaten
Cordonnier?
Yes Count 185 136 145 110 70 646
Do you
usually
buy fish
snacks?
28.6 21.1 22.4 17 10.8 100
Age group 81.5 71.6 65 58.2 55.6 67.6
Percentage
of total 19.4 14.2 15.2 11.5 7.3 67.6
No Count 42 54 78 79 56 309
Do you
usually
buy fish
snacks?
13.6 17.5 25.2 25.6 18.1 100.0
Age group 18.5 28.4 35 41.8 44.4 32.4
Percentage
of total 4.4 5.7 8.2 8.3 5.9 32.4
Total Count 227 190 223 189 126 955
Do you
usually
buy fish
snacks?
23.8 19.9 23.4 19.8 13.2 100
Age group 100 100 100 100 100 100
Percentage
of total 23.8 19.9 23.4 19.8 13.2 100

Fish Consumption Survey, Mauritius 66
Consumption of Cordonnier * Residential Area Cross tabulation
Residential area
(%)
Urban Rural Total
Have you ever eaten
the "Cordonnier"?
Yes Count 303 403 706
Have you ever eaten
Cordonnier?
42.9 57.1 100
Within residential area 62.7 85.6 74
Percentage of Total 31.8 42.2 74
No Count 110 46 156
Have you ever eaten
Cordonnier?
70.5 29.5 100
Within residential area 22.8 9.8 16.4
Percentage of Total 11.5 4.8 16.4
Don't
know
Count 70 22 92
Have you ever eaten
Cordonnier?
76.1 23.9 100
Within Residential Area 14.5 4.7 9.6
Percentage of Total 7.3 2.3 9.6
Total Count 483 471 954
Have you ever eaten
Cordonnier?
50.6 49.4 100
Within residential Area 100 100 100
Percentage of Total 50.6 49.4 100
Case summary
Q A13.2 a Valid Missing Total
N % N % N %
627 62.7 373 37.3 1,000 100
Frequency: Number of respondents who prepare Cordonnier
Responses % cases
N %
How many
respondents
normally
prepare
Cordonnier
Fried 324 38 51.7
Grilled 14 1.6 2.2
Boiled 30 3.5 4.8
Curry 474 55.6 75.6
Other* 10 1.2 1.6
Total 852 100 135.9

Annexes 67
Statistics
Reasons for not consuming Cordonnier fish
N Valid 134
Missing 866
Frequency: Reasons for not eating fish sausages
Frequency % Valid % Cumulative %
Valid Allergic 3 .3 2.2 2.2
Do not like* 23 2.3 17.2 19.4
Taste 14 1.4 10.4 29.9
Difficult to prepare 4 .4 3 32.8
Do not buy 4 .4 3 35.8
Nightmares** 19 1.9 14.2 50
Hypertension** 38 3.8 28.4 78.4
Not my choice 3 .3 2.2 80.6
Never eaten 8 .8 6 86.6
Don't remember 5 .5 3.7 90.3
Not available 7 .7 5.2 95.5
Hallucination** 3 .3 2.2 97.8
Too many bones 2 .2 1.5 99.3
Expensive 1 .1 .7 100
Total 260 26 100
Missing System 740 74
Total 1,000 100
*regroup into ‘not preferred one’ **regroup into ‘negative perception’
Frequency: Preference of Cordonnier
Responses % cases
N %
How would
you prefer to
buy
Cordonnier?
Fresh whole fish 679 59.3 71.2
Fillets 163 14.2 17.1
Smoked 21 1.8 2.2
Salted 7 .6 .7
Frozen Whole
fish 88 7.7 9.2
Steaks 14 1.2 1.5
Precooked
vacuum-packed
fillets
32 2.8 3.4
Don’t want to
buy 141 12.3 14.8
Total 1145 100 120

Fish Consumption Survey, Mauritius 68
Statistics
Price willing to pay for a ready-to-eat vacuum-packed
Cordonnier fillet (300g)
N Valid 954
Missing 46
Frequency: Price willing to pay for a ready-to-eat vacuum-packed
Cordonnier fillet (300g)
Frequency % Valid % Cumulative %
Valid < Rs. 130 528 52.8 55.3 55.3
Rs. 130-150 205 20.5 21.5 76.8
> Rs. 150 36 3.6 3.8 80.6
Other 22 2.2 2.3 82.9
Don't want to buy 163 16.3 17.1 100
Total 954 95.4 100
Missing System 46 4.6
Total 1,000 100

Annexes 69
Section B: Consumer knowledge of fish
Frequency: Omega 3 in fish
Frequency % Valid % Cumulative %
Valid Carbohydrate 11 1.1 1.1 1.1
Dietary fibre 14 1.4 1.4 2.5
Protein 270 26.9 27 29.5
Essential fats 387 38.5 38.7 68.2
Don't know 318 31.7 31.8 100
Total 1000 99.6 100
Missing System 4 0.4
Total 1,000 100
Benefits for a child’s brain development
Frequency % Valid % Cumulative %
Valid Yes 902 89.8 90.2 90.2
No 14 1.4 1.4 91.6
Don't know 84 8.4 8.4 100
Total 1000 99.6 100
Missing System 4 0.4
Total 1,000 100
Case summary
Q B3 a Valid Missing Total
N % N % N %
1,000 100 0 .0 1,000 100
a. Group
Frequency: Factors that affect fish spoilage
Responses % cases
N %
What makes
fish spoil or go
bad?
Water 44 3.1 4.4
Heat 641 44.8 64.1
Bacteria/germs 518 36.2 51.8
Enzymes/chemicals 141 9.9 14.1
Don't know 54 3.8 5.4
Other* 33 2.3 3.3
Total 1,431 100 143.1
* includes environmental conditions, packaging, expiry date on package

Fish Consumption Survey, Mauritius 70
Section C: Consumer attitudes towards fish & fishery products
Eating fish is good for health
Frequency % Valid % Cumulative %
Valid Strongly disagree 4 .4 .4 .4
Disagree 1 .1 .1 .5
Neutral 22 2.2 2.3 2.8
Agree 355 35.4 37.2 40
Strongly Agree 572 57 60 100
Total 954 95 100
Missing System 50 5
Total 1,004 100
Fish is always available to buy
Frequency % Valid % Cumulative %
Valid Strongly disagree 33 3.3 3.5 3.5
Disagree 229 22.8 24 27.5
Neutral 172 17.1 18 45.5
Agree 365 36.4 38.3 83.8
Strongly Agree 155 15.4 16.2 100
Total 954 95 100
Missing System 50 5
Total 1,004 100
If fish is chilled it will be good quality
Frequency % Valid % Cumulative %
Valid Strongly disagree 26 2.6 2.7 2.7
Disagree 189 18.8 19.8 22.5
Neutral 209 20.8 21.9 44.4
Agree 401 39.9 42 86.5
Strongly Agree 129 12.8 13.5 100
Total 954 95 100
Missing System 50 5
Total 1,004 100
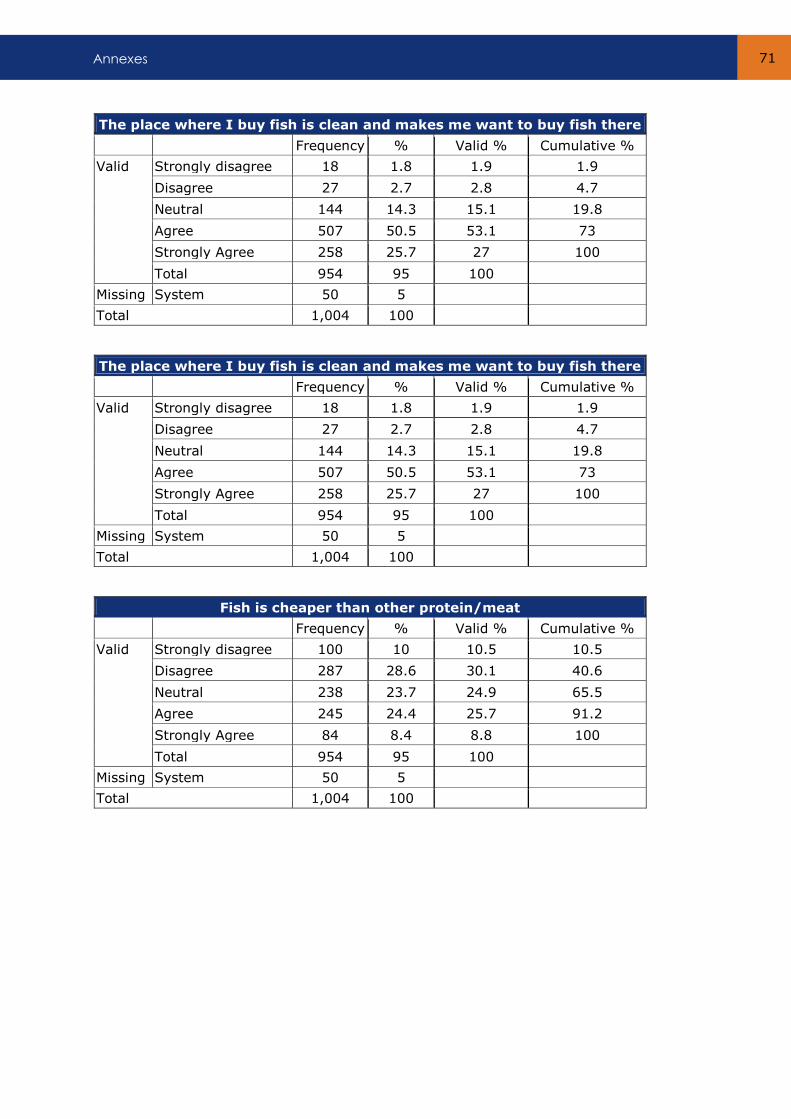
Annexes 71
The place where I buy fish is clean and makes me want to buy fish there
Frequency % Valid % Cumulative %
Valid Strongly disagree 18 1.8 1.9 1.9
Disagree 27 2.7 2.8 4.7
Neutral 144 14.3 15.1 19.8
Agree 507 50.5 53.1 73
Strongly Agree 258 25.7 27 100
Total 954 95 100
Missing System 50 5
Total 1,004 100
Fish is cheaper than other protein/meat
Frequency % Valid % Cumulative %
Valid Strongly disagree 100 10 10.5 10.5
Disagree 287 28.6 30.1 40.6
Neutral 238 23.7 24.9 65.5
Agree 245 24.4 25.7 91.2
Strongly Agree 84 8.4 8.8 100
Total 954 95 100
Missing System 50 5
Total 1,004 100

Fish Consumption Survey, Mauritius 72
Fish is always available to buy * Residential Area Cross tabulation
Residential area
(%)
Urban Rural Total
Fish is always available
to buy
Strongly
disagree
Count 17 16 33
Fish is always available
to buy 51.5 48.5 100
Within residential area 3.5 3.4 3.5
Percentage of Total 1.8 1.7 3.5
Disagree Count 122 107 229
Fish is always available
to buy 53.3 46.7 100
Within residential area 25.3 22.7 24
Percentage of Total 12.8 11.2 24
Neutral Count 70 22 92
Fish is always available
to buy
76.1 23.9 100
Within Residential Area 14.5 4.7 9.6
Percentage of Total 7.3 2.3 9.6
Agree Count 94 78 172
Fish is always available
to buy 54.7 45.3 100
Within Residential Area 19.5 16.6 18
Percentage of Total 9.9 8.2 18
Strongly
agree
Count 188 177 365
Fish is always available
to buy 51.5 48.5 100
Within Residential Area 38.9 37.6 38.3
Percentage of Total 19.7 18.6 38.3
Total Count 483 471 954
Fish is always available
to buy 50.6 49.4 100
Within Residential Area 100 100 100
Percentage of Total 50.6 49.4 100

Annexes 73
Chi-Square Tests – Availability of fish and residential area
Value df Asymp. Sig. (2-sided)
Pearson Chi-Square 8.88a 4 .064
Likelihood ratio 8.93 4 .063
Linear-by-linear
association 4.43 1 .035
No. of valid cases 954
a. 0 cells (.0 percent) have expected count less than 5. The
minimum expected count is 16.29
Statistics
Problems with fish or other fishery products
N Valid 971
Missing 29
Problems with fish or other fishery products
Frequency % Valid % Cumulative %
Valid Yes 138 13.8 14.2 14.2
No 833 83.3 85.8 100
Total 971 97.1 100
Missing System 29 2.9
Total 1,000 100
Statistics
Problems with fish
N Valid 116
Missing 884

Fish Consumption Survey, Mauritius 74
Problems encountered with fish
Freque
ncy % Valid % Cumulative %
Valid Had allergies 37 3.7 31.9 31.9
Food poisoning 23 2.3 19.8 51.7
Bad quality of fish 31 3.1 26.7 78.4
Hypertension* 5 .5 4.3 82.8
Fish not available 8 .8 6.9 89.7
Swallowed spines 3 .3 2.6 92.2
Problems with fish
products 1 .1 .9 93.1
Headache* 1 .1 .9 94
Expiry date 1 .1 .9 94.8
Hallucinations 1 .1 .9 95.7
Expensive 2 .2 1.7 97.4
Diarrhoea* 1 .1 .9 98.3
Problems in
pregnancy* 1 .1 .9 99.1
Health problems* 1 .1 .9 100
Total 116 11.6 100
Missin
g
System 884 88.4
Total 1,000 100
* Regroup into health problems
Statistics
Which is the most appropriate means to inform people
about the benefits and use of fish and other fishery
products?
N Valid 937
Missing 63

Annexes 75
Which is the most appropriate means to inform people about the
benefits and use of fish and other fishery products?
Frequency % Valid % Cumulative %
Valid Radio 264 26.4 28.2 28.2
Newspaper 158 15.8 16.9 45.0
TV shows 358 35.8 38.2 83.2
Internet 58 5.8 6.2 89.4
Education 6 .6 .6 90.1
People, relatives,
family 26 2.6 2.8 92.8
Conversation 6 .6 .6 93.5
Fishermen 29 2.9 3.1 96.6
Posters, magazines
and flyers 20 2.0 2.1 98.7
Doctors/health
centre/campaigns 5 .5 .5 99.3
Experience and
habit 4 .4 .4 99.7
Sellers/ fish shops 3 .3 .3 100.0
Total 937 93.7 100
Missing System 63 6.3
Total 1,000 100
Case summary
Q C4 Valid Missing Total
N % N % N %
797 79.7 203 20.3 1,000 100

Fish Consumption Survey, Mauritius 76
Frequency: Promoting consumption
Responses % cases
N %
How to
promote
consumption
More fish species on the
market* 7 .7 .9
Increase quality of fish
and sanitary level** 35 3.5 4.4
More advertising and
marketing*** 83 8.3 10.4
Lower the price of
fish**** 213 21.2 26.7
Information on benefits
of fish*** 265 26.4 33.2
Publicity*** 111 11.1 13.9
Promote aquaculture* 32 3.2 4
Offer services** 11 1.1 1.4
Culinary activities and
new recipes*** 49 4.9 6.1
Promotion**** 7 .7 .9
Increase availability of
fish and
accessibility*****
84 8.4 10.5
Media programs*** 52 5.2 6.5
Increase sales point of
fish and sellers***** 16 1.6 2
Encourage fishermen
and fishing activities* 10 1 1.3
New products on the
market* 19 1.9 2.4
Doped fish* 1 .1 .1
Protect the marine
ecosystem and control
fishing activities*
6 .6 .8
Increase import of fish* 2 .2 .3
Development in
fisheries* 1 .1 .1
Promote aquaculture* 1,004 100 126
Total 1,004 100 126
* Regroup into ‘increase production of fish’ ** Regroup into ‘improve quality, sanitary and services’ *** Regroup into ‘communication’ **** Regroup into ‘lower the price of fish’ ***** Regroup into ‘increase availability of fish’

Annexes 77
Section D: Consumer profiles
Statistics
Residential
Area Gender Age group
Educational
level Occupation
Range of
household
salary
N Valid 1,000 1,000 1,000 1,000 1,000 1,000
Missing 0 0 0 0 0 0
Residential area
Frequency % Valid % Cumulative %
Valid Urban 510 51 51 51
Rural 490 49 49 100
Total 1000 100 100
Gender
Frequency % Valid % Cumulative %
Valid
Male 507 50.7 50.7 50.7
Female 493 49.3 49.3 100
Total 1,000 100 100
Age group
Frequency % Valid % Cumulative %
Valid
18-25 233 23.3 23.3 23.3
26-35 201 20.1 20.1 43.4
36-45 231 23.1 23.1 66.5
46-55 195 19.5 19.5 86
>55 140 14 14 100
Total 1,000 100 100
Educational level
Frequency % Valid % Cumulative %
Valid
Primary 158 15.8 15.8 15.8
Secondary 507 50.7 50.7 66.5
Tertiary 314 31.4 31.4 97.9
Vocational 11 1.1 1.1 99
No schooling 10 1 1 100
Total 1,000 100 100

Fish Consumption Survey, Mauritius 78
Occupation
Frequency % Valid % Cumulative %
Valid
Working 697 69.7 69.7 69.7
Not working 114 11.4 11.4 81.1
Student 137 13.7 13.7 94.8
Pensioner 52 5.2 5.2 100
Total 1,000 100 100
Range of household salary
Frequency % Valid % Cumulative %
Valid
<Rs 5 000 19 1.9 1.9 1.9
Rs 5 000-10 000 83 8.3 8.3 10.2
Rs 11 000-15 000 87 8.7 8.7 18.9
Rs 16 000-20 000 70 7 7 25.9
Rs 21 000- 25 000 111 11.1 11.1 37
>Rs 25 000 242 24.2 24.2 61.2
Prefer not to reply 388 38.8 38.8 100
Total 1,000 100 100
Case processing summary
Valid Missing Total
N % N % N %
Residential area * age
group 1,000 100 0 .0 1,000 100

Annexes 79
Residential area * age group cross tabulation
Age group (%)
Total 18-25 26-35 36-45 46-55 >55
Residential
area
Urban Count 114 92 114 104 86 510
Within
residential
area
22.4 18.0 22.4 20.4 16.9 100
Within age
group 48.9 45.8 49.4 53.3 61.4 51
Percentage of
total 11.4 9.2 11.4 10.4 8.6 51
Rural Count 119 109 117 91 54 490
Within
residential
area
24.3 22.2 23.9 18.6 11 100
Within age
group 51.1 54.2 50.6 46.7 38.6 49
Percentage of
total 11.9 10.9 11.7 9.1 5.4 49
Total Count 233 201 231 195 140 1,000
Within
residential
area
23.3 20.1 23.1 19.5 14.0 100
Within age
group 100 100 100 100 100 100
Percentage of
total 23.3 20.1 23.1 19.5 14.0 100
Case processing summary
Valid Missing Total
N % N % N %
Residential area *
gender 1,000 100 0 .0 1,000 100

Fish Consumption Survey, Mauritius 80
Residential area * gender cross tabulation
Gender (%)
Total Male Female
Residential Area Urban Count 252 258 510
Within residential area 49.4 50.6 100
Within gender 49.7 52.3 51
Percentage of total 25.2 25.8 51
Rural Count 255 235 490
Within residential area 52 48 100
Within gender 50.3 47.7 49
Percentage of total 25.5 23.5 49
Total Count 507 493 1,000
Within residential area 50.7 49.3 100
Within gender 100 100 100
Percentage of total 50.7 49.3 100

Annexes 81
Annex 3. Location and survey plan

Fish Consumption Survey, Mauritius 82
Annex 4. Contact details of team members
Table 7: Contact details of survey team
Name Position Email address Telephone
Roshini
Brizmohun-
Gopaul
Project Coordinator [email protected] 5 2567871
Zainal Banu
Kareemun Project Team Leader,
Data Analyst [email protected] 5 933 3876
Jean François
Ludovic Baya Data Analyst [email protected] 5 739 2882
Chiranjivee
Teesha
Bahoorun
Project Enumerator [email protected] 5 981 0181
Mehtaab Bibi
Begum Conhyea Project Enumerator
[email protected] 5 948 7838
Khawla Lutf-
Un-Nissa Domun Project Enumerator [email protected]
5 734 2959
Roomesh
Doolum Project Enumerator
[email protected] 5 934 6974
Nadeem
Mohammad
Duberry
Project Enumerator [email protected]
5 714 95 55
Ishtee La Rose Project Enumerator
[email protected] 5 777 4349
Ooma Varsha
Raderam Project Enumerator
[email protected] 5 724 4884
Yogeshwaree
Prisha Rambojun Project Enumerator
mu 5 787 1684

Annexes 83
Annex 5. Photos
Enumerators at work

Fish Consumption Survey, Mauritius 84
Discussing the pre-test with the CEO of the FIT

Annexes 85
Enumerator team with Ansen Ward at AFRC

SmartFish is a regional fisheries programme managed by the Indian Ocean Commission, funded by the European Union and co-implemented by the Food and Agriculture Organization of the United Nations. SmartFish, which operates in 20 countries throughout the East and Southern Africa - Indian Ocean region, focuses on fisheries governance, management, monitoring, control and surveillance, trade, and food security.
As an island country, Mauritians love to eat fish and culinary habits have not changed much over the years. At the same time, very little is known about the habits of fish consumers in Mauritius. This report presents the results of a survey that was carried out on the fish consumption habits of both the rural and urban population across the country and provides additional information on demand, supply, availability, and fish market chain issues.
It is hoped that the results of this survey might be of use as a basis for the further development of policies and strategies by the authorities concerned.