cotton - cost & return studies - university of california, davis
TRANSCRIPT

UNIVERSITY OF CALIFORNIA COOPERATIVE EXTENSION
2012
SAMPLE COSTS TO PRODUCE
COTTON PIMA VARIETY
SAN JOAQUIN VALLEY
Robert B Hutmacher UC Cooperative Extension Specialist Plant Sciences Department UC Davis Steven D Wright UC Cooperative Extension Farm Advisor Tulare and Kings Counties Larry Godfrey UC Cooperative Extension Specialist Entomology Department UC Davis Daniel S Munk UC Cooperative Extension Farm Advisor Fresno County Brian H Marsh UC Cooperative Extension Farm Advisor Kern County Karen M Klonsky UC Cooperative Extension Specialist Department of Agricultural and Resource
Economics UC Davis Richard L De Moura UC Cooperative Extension Staff Research Associate Department of Agricultural
and Resource Economics UC Davis Kabir P Tumber UC Cooperative Extension Staff Research Associate Department of Agricultural
and Resource Economics UC Davis
UNIVERSITY OF CALIFORNIA COOPERATIVE EXTENSION
SAMPLE COSTS TO PRODUCE COTTON ndash PIMA VARIETY SAN JOAQUIN VALLEY - 2012
CONTENTS
INTRODUCTION 2 ASSUMPTIONS3 Production Operating Costs 3 Labor Equipment and Interest8 Cash Overhead Costs 9
Non-Cash Overhead Costs9 ACKNOWLEDGEMENTS10 REFERENCES 11 Table 1 COSTS PER ACRE TO PRODUCE PIMA COTTON12 Table 2 COSTS AND RETURNS PER ACRE TO PRODUCE PIMA COTTON14 Table 3 MONTHLY CASH COSTS PER ACRE TO PRODUCE PIMA COTTON 16 Table 4 RANGING ANALYSIS 17 Table 5 WHOLE FARM ANNUAL EQUIPMENT INVESTMENT amp BUSINESS OVERHEAD COSTS18 Table 6 HOURLY EQUIPMENT COSTS 19 Table 7 OPERATIONS WITH EQUIPMENT20
INTRODUCTION
Sample costs for Pima cotton production in the San Joaquin Valley (SJV) are presented in this study This study is intended as a guide only and can be used to make production decisions determine potential returns prepare budgets and evaluate production loans Practices described are based on production procedures considered typical for growing conditions in the San Joaquin Valley Sample costs given for labor materials equipment and contract services are based on current figures Some costs and practices used in this study may not be applicable to all situations A blank column titled ldquoYour Costrdquo is provided to enter your own costs on Tables 1 and 2
For an explanation of calculations used for the study refer to the ldquoAssumptionsrdquo section call the Department of Agricultural and Resource Economics University of California Davis at (530) 752-3589 or your local UC Cooperative Extension Farm Advisor
Sample cost and return studies for many commodities are available and can be requested through the Department of Agricultural and Resource Economics UC Davis downloaded from the department website at httpcoststudiesucdavisedu or obtained from selected county UC Cooperative Extension offices
The University of California is an affirmative actionequal opportunity employer
2012 Cotton Costs and Returns Study (Pima) San Joaquin Valley UC Cooperative Extension 2
ASSUMPTIONS
The following assumptions give background information relevant to the values shown in Tables 1 to 7 and pertain to sample costs for producing Pima cotton in the San Joaquin Valley The costs figures are based on typical cultural practices for 30-inch rows used by farmers in the San Joaquin Valley Some practices described may not be used in every production year or on every farm and some operations not described may be performed The use of trade names and cultural practices does not constitute an endorsement or recommendation by the University of California nor is any criticism implied by omission of other similar products or cultural practices
Land The farm consists of 1500 acres of non-contiguous land valued at $8500 per acre Seven hundred fifty acres are planted to cotton and the remaining acres are planted to other field and row crops including processing tomatoes corn wheat alfalfa onions garlic pistachios and almonds The owner manages the farm
Production Operating Costs
Tables 1 through 3 show costs associated with ground preparation planting growing and harvesting cotton Land preparation is done from November to March and the crop is harvested in October and November The crop year in this study is November to November
Land Preparation The ground is ripped or subsoiled in two passes 2 to 3 feet deep to break up compaction which affects root penetration and water infiltration In this study subsoiling is done once every three years and one-third of the cost is allocated to the crop each year The ground is then disced twice with a stubble disc to break up large clods and smooth the surface The ground is disced again with a finish (offset) disc to incorporate the herbicide and smooth the surface Afterwards the beds are listed
Row Spacing Cotton row spacings range from 30-inch to 40-inch rows Carefully consider and examine local experience with row spacing Examine several row spacing options to determine the best systems and the likely impacts on yields and production costs The optimal row spacing will vary depending on soil types rotation crops (especially with drip irrigation systems available equipment and factors impacting plant vigormdasheg salinity compaction nutrient status) In this study cotton is planted on 30-inch beds Some field trials in the 1980rsquos and 1990rsquos done by University of California researchers indicated that yields could increase as much as 7 by changing from 38 or 40-inch row spacing to 30-inch rows In the research evaluations these yield improvements were achieved without increases in water or fertilizer requirements The yield improvements were most commonly observed in the northern part of the San Joaquin Valley with less consistent results or even no reported yield increases in other parts of the San Joaquin Valley
Planting A Pima cotton variety is seeded at a rate of 15 to 20 pounds per acre This study assumes 180 pounds per acre are seeded in April Cotton is planted using a six-row planter Seed populations range from 35000 to as much as 85000 per acre with an optimum stand of 40000 to 55000 plants per acre Yields are generally not significantly affected by plant populations ranging from about 30000 to 60000 plants per acre but average final plant population targets for most growers and varieties in 30-inch row cotton production areas are generally in the 45000 to 60000 plants per acre range The seed cost includes the San Joaquin Valley Cotton Board assessment (see ldquoAssessmentrdquo section)
2012 Cotton Costs and Returns Study (Pima) San Joaquin Valley UC Cooperative Extension 3
Irrigation In this study water costs $100 per acre-foot Assumed water cost reflects a mix of district water supplies and pumped groundwater Grower applied water ranges from 20 to 35 acre feet based on soil type irrigation method water application uniformity crop rooting depth in some soils evaporation and runoff Based on current information it is estimated that 25 acre-feet of water is applied during the growing season for cotton in the region Irrigation water application amounts should be adjusted according to on-farm rainfall measurements Price per acre-foot for water will vary by grower depending on the irrigation district and its limits on available water increased costs and competition for water and increased energy costs for running irrigation wells where groundwater is available as a backup water supply and rainfall Water costs depending on irrigation district or pumping variables can range from $20 to over $175 per acre-foot for late season irrigation in water-short districts
For the purposes of this evaluation the irrigation system used is a ditch-based furrow irrigation system with the farm already having installed water delivery mainlines or primary ditches to move water to the fields Other types of systems used in cotton production include level basin irrigation gated pipe furrow irrigation subsurface drip irrigation and various types of hand-move sprinkler systems Many growers in clay loam soils use hand-move sprinklers to allow them to apply lower amounts of irrigation water for preplant and first within-season irrigations then switch over to furrow irrigation for the remaining irrigations
Fertilization Nitrogen (N) is the primary nutrient applied to cotton throughout the growing season UN-32 (32-0-0) is sidedressed at a rate of 150 pounds of N per acre during the month of May A fertilizer applicator is rented from the fertilizer dealer Thirty pounds of N as UN-32 is water run in July The labor cost for applying the water run N is included in the irrigation costs
Cotton is very responsive to nitrogen but excessive applications can cause rank or vegetative growth and lead to increased pest problems poor defoliation lower yields and nitrate leaching The desirability of the water run nitrogen in July is largely dependent upon the yield potential of the plant and relative plant vigor (i e the better the yield potential on the plant or the lower the vigor the more likely that a favorable and cost-effective response will be obtained with later water-run nitrogen applications) Care must be exercised in particular with late-season nitrogen management in Pima cotton as many Pima varieties have a pronounced tendency to sustain vegetative growth well into late-summer and early fall and can be hard to prepare for a timely harvest
If the crop rotation includes heavily-fertilized vegetable crops or alfalfa or if dairy waste or manure applications are common practices on individual fields residual soil nitrogen and even potassium may be high These situations would then present an opportunity to reduce input costs and lower applied nitrogen resulting in fewer problems with excessive growth and leaching losses
Pest Management The pesticides rates and cultural practices mentioned in this cost study are listed in the UC IPM Pest Management Guidelines Cotton Pesticides mentioned in this study are not recommendations but those commonly used in the region For information and pesticide use permits contact the local county Agricultural Commissionerrsquos office For information on other pesticides available pest identification monitoring and management visit the UC IPM website at wwwipmucdavisedu Pest control costs can vary considerably each year depending upon local conditions and pests in any given year Ranges can be as dramatic as $50 per acre for one year and over $200 the next
Pest Control Adviser (PCA) Written recommendations are required for many pesticides and are made by licensed pest control advisers In addition the PCA or an agronomist consultant will monitor the field for agronomic problems including pests and nutrition Growers may hire private PCAs or receive the service as part of a service agreement with an agricultural chemical andor fertilizer company In this study a fee is allocated for a PCA 2012 Cotton Costs and Returns Study (Pima) San Joaquin Valley UC Cooperative Extension 4
In the absence of clear data to the contrary Pima cotton should be monitored for insects and mites using the same techniques and economic thresholds as for Upland varieties which are varieties that are native to Mexico and Central America (eg Acala) Common observations among University researchers as well as PCAs are that (1) Pima varieties typically exhibit lower spider mite populations and a higher tolerance to spider mites than Acala cotton (2) cotton aphids and silverleaf whitefly build up faster and can cause more problems in Pima than in Acala cotton and (3) fruit loss in Pima varieties can be worse than in Acala types at similar Lygus bug populations Since under typical management most Pima varieties require a longer growing season to mature than Acala types Pima has a longer potential period of exposure to late-season insect pests than typical for Acala cotton which could increase insect control costs This information should be kept in mind when planning for Pima production costs but without clear documentation of higher costs in University studies assumed insect management practices will be the same as in the Acala cost study ldquo2012 Sample Costs to Produce Cotton ndash Acalardquo
Insects In this study pest management is for mites aphids lygus and thrips Seeds are treated with Orthene at planting in April to control thrips An aerial application of Carbine plus Zephyr are made in June for lygus and mite control and Assail in July for aphid and whitefly control A ground application of Radiant is made in May for thrip control Monitoring of insect populations is necessary to determine if and when to treat the crop
Lygus bugs feed on the squares (flower buds) and small fruit (bolls) Damaged squares will usually drop off while damaged bolls at a minimum may have stained lint and damaged seeds or can be lost if damaged when bolls are less than 10 to 12 days of age past the flower stage In cases where there are repeated or sustained infestations of lygus bugs it is not uncommon for growers to need more than the assumed one insecticide application for lygus control
Aphids cause physical damage to the leaves andor contaminate the lint with their honeydew production Also their feeding may reduce the carbohydrates needed for boll maturation resulting in yield loss Mites feeding on the leaves reduce plant vigor and result in extensive defoliation
Cost estimates do not include insecticide applications for beet armyworm control In some years andor locations beet armyworm can develop populations capable of significant yield reductions and their control will be an additional expense
Cost estimates also do not include control measures for silverleaf whitefly which can be a major late-season pest in parts of the southern and even central San Joaquin Valley Silverleaf whitefly has the potential to cause sticky cotton and reduce the value of cotton lint (fiber) Insect growth regulators and insecticides are available to aid in control but costs are highly variable by location and timing of infestations choice of control measures and the number of applications required Similarly if aphid problems continue into the late-season when bolls open and cotton lint is exposed to aphid honeydew another insecticide application in addition to the assumed application may be required to prevent sticky cotton
Weeds In February a contact herbicide glyphosate (Roundup) is applied Some growers may apply additional herbicides such as Shark however careful timing consideration must be taken to minimize chemical drift into neighboring crops In March a pre-emergent herbicide (Triflurex) is applied and incorporated in the fields with discing This application will control many early season annual broadleaves and grasses In May an ldquoover-the-toprdquo herbicide (Staple) is applied to control broadleaves Cultivations begin in late April (depending upon planting date) and continue until the end of June A total of four cultivations are done in this study using rolling cultivators The first cultivation is made prior to planting in March and the remaining three are done from April to June Hand hoeing is done in June and a post-directed herbicidelayby treatment is made in June with Shark
2012 Cotton Costs and Returns Study (Pima) San Joaquin Valley UC Cooperative Extension 5
Growth Regulator amp Defoliation A plant growth regulator (mepiquat chloride also known as ldquoStancerdquo variations on the name ldquoPIXrdquo or other trade names) is applied at one pint per acre in late June or July and again a second time at one-half pint in late-July or early August Plant growth regulators control excessive vegetative growth and promote a balance between vegetative and reproductive growth Their use can result in a more uniform boll set for once-over harvesting The total number of applications and rates used can vary with a number of factors in the range of practices used in the SJV Considerations include (1) the degree to which growers use delayed irrigations to aid in limiting vegetative growth (2) the lateness of the crop and (3) soil factors such as as prevailing nitrogen levels or salinity levels Under low vigor conditions such as in saline soil or compacted soil conditions caution is warranted to avoid negative impacts of too high a rate of growth regulator application
Harvest aid chemicals often called by the group names ldquodefoliantsrdquo and ldquodesiccantsrdquo are applied in September andor October Typical harvest aid applications include two application timings with materials such as Ethephon (Prep Finish) and Ginstar applied in the first application and a second application 10 to 14 days or more later with materials such as Defol Shark or ET
Defoliants are applied prior to picking to aid harvest by causing the leaves to drop Desiccants are applied to help reduce the presence of green high water content leaves that can cause fiber staining and other damage to harvested fiber Defoliation reduces the amount of trash collected with the cotton and reduces staining of the lint Because of the more indeterminate growth than Upland varieties the Pima varieties may need additional applications aswell as the use of higher rates Defoliation is more critical in appearance which directly correlates to the quality of cotton
Harvest The farm in this study owns two six-row cotton harvesters and two module builders The cotton is dumped from the harvester directly into the module builder that presses loose seed cotton into a dense and economical unit for transportation to the gin A tractor and tractor driver monitor each module Two laborers maintain the area ndash cleaning cotton off the ground placing a tarp on the finished module etc ndash during the harvest operations
The assumption for this cost study is that Pima cotton requires two harvests with the second harvest required to collect seed-cotton from late-maturing bolls For the second harvest the grower again uses two pickers but only one module builder due to reduced yields per acre Harvest time is reduced due to faster harvesting speeds compared to the first picking and less time required for dumping Pima cotton matures over a longer time than Upland cotton better quality is obtained in the first pick due to favorable weather conditions earlier in the season However depending on the value of Pima seed and lint in years with good early boll set and warm pre-harvest weather many newer Pima varieties can mature more evenly and require only one pick for harvest Growers may choose to adjust the harvest costs accordingly if that is the typical harvest experience in their area
Typical custom picking costs for Pima cotton are $115 per acre Growers may choose to own cotton pickers and module builders purchased either new or used or hire a custom harvester to perform the harvest Many factors are important in deciding which harvesting option a grower uses The decision to invest in cotton harvesting equipment requires consideration of differences in production practices and equipment requirements for all of the crops in rotation as well as the direct cost of the harvesting equipment These factors and appropriate method of analysis are discussed by Blank et al (1992) Though their report specifically addresses hay harvesting the same principles and methodology can be used with cotton harvesting
Yields The crop yield used in this study is 1500 pounds of lint and 2655 pounds of seed per acre for San Joaquin Valley Pima cotton Returns for various lint yields are shown in Table 4
2012 Cotton Costs and Returns Study (Pima) San Joaquin Valley UC Cooperative Extension 6
Returns An estimated price of $130 per pound of lint is used to calculate returns The price is based on current returns and from county averages over the last five years Some cooperative cotton gins pay growers as much as $30 to $45 per bale for seed credit above grower ginning costs and this study assumes growers receive $35 per 500 pound bale Table 4 shows grower returns for varying returns
Revenue from federal government programs The typical revenue available for the Acalarsquos (Upland cotton) is not available to the Pima (Extra Long Staple [ELS]) producers Pima growers may be eligible for Nonrecourse Marketing Assistance Loans however this study assumes the grower does not receive governmental assistance For additional information contact your local county USDA Farm Service Agency
Transportation Transportation costs are based on roundtrip distances from the field to the gin Most gins within a close radius of the field do not charge because the cost is included in the ginning fee Longer hauls (over 40 miles round trip) may have a hauling charge Hauling companies may also have a surcharge for modules less than a minimum weight This study assumes the grower does not have additional transportation costs
Ginning Commercial cotton gins normally keep cottonseed and give growers a credit to cover ginning and transportation costs so most growers do not see a ginning charge In this study ginning fees are covered by the seed credit and are not included as a line-item cost Some gins may return to the grower a net difference of $30 to $45 per bale between the seed value and ginning costs In this study we assume that growers receive $35 per bale return from the cotton gin
Some cotton gins charge growers for compressing lint into universal density (UD) bales for shipping merchant samples a loading charge or an invoice fee This study assumes no additional ginning charges
Assessments Most assessments are collected by the gin or handler and deducted from the growersrsquo gross returns Both mandatory and voluntary assessments are discussed below
USDA-HVI The USDA levies a fee for High Volume Instrumentation (HVI) classing This determines the marketing classification cotton grade Growers are mandated with a $215 per bale fee
Pink Bollworm Project The California State Department of Food and Agriculture (CDFA) manages and enforces the Pink Bollworm Project This program which through detection and legislated postharvest practices controls pink bollworm in the San Joaquin Valley and other cotton growing districts in the state The Pink Bollworm Project maintains several control districts to administer the program Under the project growers are assessed a fee only if cotton is ginned within a project district CDFA has a current charge of $200 per bale
National Cotton Council The National Cotton Council a voluntary organization collects an assessment to provide lobbying advocacy and public relations for the cotton industry at the national level The current assessment rate paid by growers is $055 per bale
California Cotton Growers And Ginners Association The California Cotton Growers And Ginners Association assists California cotton growers in advocating their position in the legislature The growers are charged $025 per bale and the ginners are charged $025 per bale Participation in this organization is voluntary
San Joaquin Valley Cotton Board The board reviews test program data and approves variety releases The assessment is added to the seed price As of March 2012 the assessment paid by the grower is $472 per planting seed hundredweight
2012 Cotton Costs and Returns Study (Pima) San Joaquin Valley UC Cooperative Extension 7
Supima Association The Supima Association composed of American Pima cotton growers promotes US Pima cotton and is also involved in quality assurance research programs and working with government agencies to maintain a viable marketing environment The voluntary assessment is $300 per bale The funds are collected by the first post-ginning handler of the cotton
Pickup Two pickups ndash one-half ton and three-quarter ton ndash are used on the ranch It is assumed that each pickup travels 4998 miles each year for total ranch use
Labor Equipment and Interest
Labor Basic hourly wages for workers are $1050 per hour for machine operators and $850 per hour for non-machine workers Adding 37 for the employers share of federal and state payroll taxes and other benefits raises the total labor costs to $1439 per hour for machine operators and $1165 per hour non-machine labor The overhead includes the employersrsquo share of federal and California state payroll taxes workers compensation insurance for field crops and a percentage for other possible benefits Workersrsquo compensation costs will vary among growers but for this study the cost is based upon the average industry final rate as of January 1 2011 (personal email from California Department of Insurance March 2011 unreferenced) Machinery labor cost is approximately 20 higher than general labor prices which accounts for the extra labor involved in equipment set up moving maintenance work breaks and field repair
Equipment Operating Costs Repair costs are based on purchase price annual hours of use total hours of life and repair coefficients formulated by the American Society of Agricultural Engineers (ASAE) Fuel and lubrication costs are also determined by ASAE equations based on maximum PTO horsepower and fuel type Prices for on-farm delivery of diesel and gasoline are $343 and $382 per gallon respectively The cost includes a 250 sales tax on diesel fuel and 750 sales tax on gasoline Gasoline also includes federal and state excise tax which can be refunded for on-farm use when filing your income tax The fuel lube and repair cost per acre for each operation in Table 1 is determined by multiplying the total hourly operating cost in Table 6 for each piece of equipment used for the selected operation by the hours per acre Tractor time is 10 higher than implement time for a given operation to account for setup travel and down time
Interest on Operating Capital Interest on operating capital is based on cash operating costs and is calculated monthly until harvest at a nominal rate of 575 per year A nominal interest rate is the typical market cost of borrowed funds The interest rate will vary depending upon various factors The rate is this study is considered a typical lending rate by a farm lending agency as of January 2012
Risk The risks associated with crop production should not be minimized While this study makes every effort to model a production system based on typical real world practices it cannot fully represent financial agronomic and market risks which affect the profitability and economic viability
2012 Cotton Costs and Returns Study (Pima) San Joaquin Valley UC Cooperative Extension 8
Cash Overhead Costs
Cash overhead consists of various cash expenses paid out during the year that are assigned to the whole farm and not to a particular operation These costs include property taxes interest on operating capital office expense liability and property insurance equipment repairs and management
Property Taxes Counties charge a base property tax rate of 1 on the assessed value of the property In some counties special assessment districts exist and charge additional taxes on property including equipment buildings and improvements For this study county taxes are calculated as 1 of the average value of the property Average value equals new cost plus salvage value divided by 2 on a per acre basis
Insurance Insurance for farm investments varies depending on the assets included and the amount of coverage Liability insurance covers accidents on the farm and costs $1470 for the entire farm
Office Expense Office and business expenses are estimated at $50 per acre These expenses include office supplies telephones bookkeeping accounting legal fees shop and office utilities and miscellaneous administrative charges
Investment Repairs Annual maintenance is calculated as 2 of the purchase price
Non-Cash Overhead Costs
Non-cash overhead is calculated as the capital recovery cost for equipment and other farm investments
Capital Recovery Costs Capital recovery cost is the annual depreciation and interest costs for a capital investment It is the amount of money required each year to recover the difference between the purchase price and salvage value (unrecovered capital) It is equivalent to the annual payment on a loan for the investment with the down payment equal to the discounted salvage value This is a more complex method of calculating ownership costs than straight-line depreciation and opportunity costs but more accurately represents the annual costs of ownership because it takes the time value of money into account (Boehlje and Eidman) The formula for the calculation of the annual capital recovery costs is ((Purchase Price ndash Salvage Value) x (Capital Recovery Factor) + (Salvage Value x Interest Rate))
Salvage Value Salvage value is an estimate of the remaining value of an investment at the end of its useful life For farm machinery (tractors and implements) the remaining value is a percentage of the new cost of the investment (Boehlje and Eidman) The percent remaining value is calculated from equations developed by the American Society of Agricultural Engineers (ASAE) based on equipment type and years of life The life in years is estimated by dividing the wear out life as given by ASAE by the annual hours of use in this operation For other investments including irrigation systems buildings and miscellaneous equipment the value at the end of its useful life is zero The salvage value for equipment and investments are shown in Table 5
Capital Recovery Factor Capital recovery factor is the amortization factor or annual payment whose present value at compound interest is 1 The amortization factor is a table that corresponds to the interest rate used and the life of the machine
Interest Rate An interest rate of 475 is used to calculate capital recovery The rate will vary depending upon loan amount and other lending agency conditions but is the basic suggested rate by a farm lending agency as of January 2012 2012 Cotton Costs and Returns Study (Pima) San Joaquin Valley UC Cooperative Extension 9
Land The grower owns 1500 acres of row-crop land valued at $8500 per acre Values for land with relatively secure irrigation water supplies in the San Joaquin Valley range from $4500 per acre to $11000 depending upon location soil condition and water availability
Building The buildings are metal buildings erected on a cement slab and cover approximately 2400 square feet
Tools This includes shop tools hand tools and miscellaneous field tools The number is not based upon an actual or average inventory
Fuel Tanks Diesel and gasoline fuel tanks with electric pumps are set up in a cement containment pad that meets federal state and county regulations
Equipment Farm equipment is purchased new or used but the study shows the current purchase price for new equipment The new purchase price is adjusted to 60 to indicate a mix of new and used equipment Annual ownership costs for equipment and other investments are shown in Table 4 Equipment costs are composed of three parts non-cash overhead cash overhead and operating costs Both of the overhead factors have been discussed in previous sections The operating costs consist of repairs fuel and lubrication and are discussed under operating costs
Irrigation The irrigation system is assumed to be a ditch-based furrow irrigation system with water delivery from the water source to the individual fields delivered through a pre-existing buried mainline or ditch Ditches at the field level are pulled in for pre-irrigation and removed prior to planting Ditches are removed and replaced during the season to allow for ground equipment operations as defined in the list of field operations Water is delivered from ditches to furrows using siphon tubes
Table Values Due to rounding the totals may be slightly different from the sum of the components
ACKNOWLEDGEMENTS
Thank you to the many individuals businesses and associations in the agricultural industry that provided prices and inputs for this study
2012 Cotton Costs and Returns Study (Pima) San Joaquin Valley UC Cooperative Extension 10
REFERENCES
American Society of Agricultural Engineers 1994 American Society of Agricultural Engineers Standards Yearbook Russell H Hahn and Evelyn E Rosentreter (ed) St Joseph Missouri 41st edition
Blank Steve Karen Klonsky Kim Norris and Steve Orloff 1992 Acquiring Alfalfa Hay Harvest Equipment A Financial Analysis Of Alternatives University of California Oakland California Giannini Information Series No 92-1
Boehlje Michael D and Vernon R Eidman 1984 Farm Management John Wiley and Sons New York New York
California Chapter of the American Society of Farm Managers and Rural Appraisers 2011 Trends in Agricultural Land amp Lease Values California Chapter of The American Society of Farm Managers and Rural Appraisers Woodbridge CA
Palla Greg F 2012 (Furnished various information relating to assessments) San Joaquin Valley Quality Cotton Growers Association Bakersfield CA
University of California Statewide Integrated Pest Management Program UC Pest Management Guidelines Cotton 2012 University of California Davis CA httpwwwipmucdavisedu
Robert B Hutmacher Ron N Vargas Bill L Weir Steven D Wright Bruce A Roberts Brian H Marsh Daniel S Munk Karen M Klonsky and Rich DeMoura 2003 Sample Cost to Produce Cotton in The San Joaquin Valley 30-Inch Row Department of Agricultural Economics University of California Cooperative Extension Davis CA
Williams Earl 2012 (Furnished various information sources relating to ginning and assessments) California Cotton Ginners and Growers Association Fresno CA
2012 Cotton Costs and Returns Study (Pima) San Joaquin Valley UC Cooperative Extension 11
UC COOPERATIVE EXTENSION SAN JOAQUIN VALLEY - SOUTH 2012
Table 1 COSTS PER ACRE TO PRODUCE PIMA COTTON
Operation Cash and Labor Costs per Acre Time Labor Fuel Lube Material Custom Total Your
Operation (HrsA) Cost amp Repairs Cost Rent Cost Cost Cultural
Rip fields 1X3Yrs 013 2 9 0 0 12 Disc 2X 027 5 14 0 0 19 Apply herbicide (Roundup) 010 2 4 7 0 13 Spray Triflurex 020 3 9 7 0 19 Incorporate Triflurex 013 2 7 0 0 9 List beds 007 1 2 0 0 4 Make ditch 006 1 3 0 0 4 Irrigate 400 47 0 250 0 297 Close ditch 006 1 3 0 0 4 Cultivate - Preplant 010 2 3 0 0 5 Plant amp apply seed treatment (Orthene) 012 2 5 57 0 64 Uncap beds 008 1 3 0 0 4 Cultivate 031 5 10 0 0 15 Fertilize - Sidedress (UN32) 014 2 4 126 4 136 Weed Control - Over -the-top (Staple) 020 3 6 28 0 38 Weed control - Directlayby (Shark) 020 3 6 9 0 19 Insect control - Lygus (Carbine amp Zephyr) 000 0 0 77 10 87 Insect control - Lygus (Leverage) 000 0 0 19 10 29 Apply growth regulator amp KNO3 000 0 0 1 10 11 Fertilize - Water run (UN32) 000 0 0 25 0 25 Insect control - Aphid whitefly (Assail) 000 0 0 19 10 29 Defoliate cotton - 2X 000 0 0 75 20 95 PCA 000 0 0 0 12 12 Chop stalks (post-harvest) 010 2 5 0 0 6 Disc residue - 2X (post-harvest) 024 4 18 0 0 22 Pickup truck use 044 8 4 0 0 12
TOTAL CULTURAL COSTS 696 98 115 699 76 988 Harvest
Harvest - 2X 040 7 77 0 0 84 Boll buggy - 2X 010 2 5 0 0 6 Build module (tractor 1) - 2X 020 3 6 0 0 10 Build module (machines 1 (2X) and 2) 035 10 6 0 0 16 Build module (tractor 2) 015 3 4 0 0 7
TOTAL HARVEST COSTS 120 24 98 0 0 122 Assessment
Assessments 000 0 0 24 0 24 TOTAL ASSESSMENT COSTS 000 0 0 24 0 24 Interest on operating capital at 575 30 TOTAL OPERATING COSTSACRE 816 122 213 723 76 1164 CASH OVERHEAD Liability insurance 1 Office expense 50 Property taxes 89 Property insurance 3 Investment repairs 3 TOTAL CASH OVERHEAD COSTSACRE 145 TOTAL CASH COSTSACRE 1309
2012 Cotton Costs and Returns Study (Pima) San Joaquin Valley UC Cooperative Extension 12
UC COOPERATIVE EXTENSION SAN JOAQUIN VALLEY - SOUTH 2012
Table 1 Continued
Total Your Cost Cost
NON-CASH OVERHEAD Per producing Annual Cost Acre Capital Recovery
Building - 2400sqft 40 3 3 Fuel tanks - 500 gallons (2) 4 0 0 Service truck - 2 ton 90 10 10 Shopfield tools 8 1 1 Siphon pipes 3x 90rdquo 18 2 2 Land 8500 404 404 Equipment 870 98 98 TOTAL NON-CASH OVERHEAD COSTS 9531 517 517 TOTAL COSTSACRE 1827
2012 Cotton Costs and Returns Study (Pima) San Joaquin Valley UC Cooperative Extension 13
UC COOPERATIVE EXTENSION
SAN JOAQUIN VALLEY - SOUTH 2012
Table 2 COSTS AND RETURNS PER ACRE TO PRODUCE PIMA COTTON
Quantity Price or Value or Your Acre Unit CostUnit CostAcre Costs
GROSS RETURNS
Lint (3 bales) 150000 lb 130 1950
Seed 300 bale equivalent 3500 105
TOTAL GROSS RETURNS 150000 2055
OPERATING COSTS
Insecticide 118
Fuel-gas 000 gal 382 0
TOTAL OPERATING COSTSACRE 1164
Orthene 325 oz 098 3
Zephyr 800 floz 746 60
Carbine 50WG 250 oz 687 17
Leverage 27 500 floz 388 19
Assail 70WP 110 oz 1682 19
Defoliant 61
Finish 6 Pro 200 pint 1375 28
Ginstar 1000 floz 274 27
Defol 5 100 gal 637 6
Herbicide 64
Roundup 3200 floz 022 7
Triflurex HFP 150 pt 452 7
Staple 038 floz 7288 28
Shark EW 250 floz 909 23
Growth Regulator 1
Mepex Gin Out 200 floz 039 1
Seed 54
Seed (Pima) 1800 lb 300 54
Fertilizer 151
UN 32 18000 lb N 084 151
Custom 60
Air application 600 acre 1000 60
Rent 4
Fertilizer applicator 100 acre 350 4
Irrigation 250
Water 3000 acin 833 250
Contract 12
PCAconsultant fee 100 acre 1200 12
Assessment 24
CA Cotton Growers 300 bale 025 1
National Cotton Council 300 bale 055 2
Pink Bollworm Project 300 bale 200 6
USDA Classing Fee 300 bale 215 6
Supima Association 300 bale 300 9
Labor 122
Equipment operator labor 499 hrs 1439 72
Irrigation labor 400 hrs 1165 47
Non-machine labor 030 hrs 1165 4
Machinery 213
Fuel-diesel 3763 gal 343 129
Lube 19
Machinery repair 65
Interest on operating capital at 575 30
NET RETURNS ABOVE OPERATING COSTS 891
2012 Cotton Costs and Returns Study (Pima) San Joaquin Valley UC Cooperative Extension 14
UC COOPERATIVE EXTENSION
SAN JOAQUIN VALLEY - SOUTH 2012
Table 2 Continued
CASH OVERHEAD COSTS Liability insurance Office expense Property taxes Property insurance Investment repairs
Value or Your CostAcre Costs
1 50 89
3 3
TOTAL CASH OVERHEAD COSTSACRE 145
TOTAL CASH COSTSACRE 1309
NON-CASH OVERHEAD COSTS (Capital Recovery) Buildings - 2400 sqft Fuel Tanks - 500 gallons (2) Service Truck - 2 Ton Shopfield tools Siphon pipes 3 x 90 Land Equipment
3 0
10 1 2
404 98
TOTAL NON-CASH OVERHEAD COSTS 517 TOTAL COSTACRE 1827
NET RETURNS ABOVE TOTAL COST 228
2012 Cotton Costs and Returns Study (Pima) San Joaquin Valley UC Cooperative Extension 15
UC COOPERATIVE EXTENSION SAN JOAQUIN VALLEY - SOUTH 2012
Table 3 MONTHLY CASH COSTS PER ACRE TO PRODUCE PIMA COTTON
Beginning 11-11 NOV DEC JAN FEB MAR APR MAY JUN JUL AUG SEP OCT NOV TOTAL Ending 11-12 11 11 12 12 12 12 12 12 12 12 12 12 12 Cultural
Rip fields 1X3 yrs 12 12 Disc 2X 19 19 Apply herbicide (Roundup) 13 13 Spray Triflurex 19 19 Incorporate Triflurex 9 9 List beds 4 4 Make ditch 1 1 1 4 Pre-irrigate 95 78 62 62 297 Close ditch 1 1 1 4 Cultivate - Preplant 5 5 Plant amp Orthene treatment 64 64 Uncap beds 4 4 Cultivate 5 5 5 15 Fertilize - Sidedress (UN32) 136 136 Weed Control - Over -the-top (Staple) 38 38 Weed control - Directlayby (Shark) 19 19 Insect control - Lygus (Carbine amp Zephyr) 87 87 Insect control - Lygus (Leverage) 29 29 Apply growth regulator amp KNO3 11 11 Fertilize - Water run (UN32) 25 25 Insect Control - Aphid whitefly (Assail) 29 29 Defoliate cotton - 2X 95 95 PCA 1 1 1 1 1 1 1 1 1 1 1 1 1 12 Chop stalks (Post-harvest) 6 6 Disc residue - 2X (post-harvest) 22 22 Pickup truck use 1 1 1 1 1 1 1 1 1 1 1 1 1 13
TOTAL CULTURAL COSTS 32 2 2 20 131 75 182 192 130 92 3 97 30 989 Harvest
Harvest - 2X 84 84 Boll buggy - 2X 6 6 Build module (tractor 1) - 2X 10 10 Build module (machines 1 (2X) and 2) 16 16 Build module (tractor 2) 7 7
TOTAL HARVEST COSTS 122 122 Assessment
Assessments 24 24 TOTAL ASSESSMENT COSTS 0 0 0 0 0 0 0 0 0 0 0 0 24 24 Interest on operating capital at 575 0 0 0 0 1 1 2 3 4 4 4 5 5 30 TOTAL OPERATING COSTSACRE 32 2 2 20 131 77 184 195 134 96 7 101 182 1165 CASH OVERHEAD Liability insurance 1 1 Office expense 4 4 4 4 4 4 4 4 4 4 4 4 4 50 Property taxes 44 44 89 Property insurance 3 3 Investment repairs 0 0 0 0 0 0 0 0 0 0 0 0 0 3 TOTAL CASH OVERHEAD COSTS 4 48 7 4 4 48 5 4 4 4 4 4 4 145 TOTAL CASH COSTSACRE 36 50 9 24 135 125 189 200 138 100 11 106 186 1310 TOTAL CASH COSTSLB 002 003 001 002 009 008 013 013 009 007 001 007 011 086
2012 Cotton Costs and Returns Study (Pima) San Joaquin Valley UC Cooperative Extension 16
UC COOPERATIVE EXTENSION SAN JOAQUIN VALLEY - SOUTH 2012
Table 4 RANGING ANALYSIS
COST PER ACRE AT VARYING YIELDS TO PRODUCE PIMA
YIELD (lbs lintacre) 750 1000 1250 1500 1750 2000 2250
OPERATING COSTS Cultural Cost 988 988 988 988 988 988 988 Harvest Cost 66 85 104 122 141 160 179 Assessment Cost 24 24 24 24 24 24 24
Interest on operating capital at 575 30 30 30 30 30 30 30 TOTAL OPERATING COSTSACRE 1108 1126 1145 1164 1183 1201 1220
TOTAL OPERATING COSTSLB 148 113 092 078 068 060 054 CASH OVERHEAD COSTSACRE 145 145 145 145 145 145 145 TOTAL CASH COSTSACRE 1253 1272 1290 1309 1328 1347 1365 TOTAL CASH COSTSLB 167 127 103 087 076 067 061 NON-CASH OVERHEAD COSTSACRE 517 517 517 517 517 517 517 TOTAL COSTSACRE 1770 1789 1808 1827 1845 1864 1883 TOTAL COSTSLB 236 179 145 122 105 093 084
NET RETURNS PER ACRE ABOVE OPERATING COSTS
YIELD(lbs lintacre) 750 1000 1250 1500 1750 2000 2250
PRICE($lb) PRICE ($bale) YIELD ($500 lb lint bale equivalent) Lint Seed 15 20 25 30 35 40 45 090 3500 -380 -156 67 291 515 739 962 110 3500 -230 44 317 591 865 1139 1412 130 3500 -80 244 567 891 1215 1539 1862 150 3500 70 444 817 1191 1565 1939 2312 170 3500 220 644 1067 1491 1915 2339 2762 190 3500 370 844 1317 1791 2265 2739 3212 210 3500 520 1044 1567 2091 2615 3139 3662
NET RETURNS PER ACRE ABOVE CASH COSTS
YIELD(lbs lintacre) 750 1000 1250 1500 1750 2000 2250
PRICE($lb) PRICE ($bale) YIELD ($500 lb lint bale equivalent) Lint Seed 15 20 25 30 35 40 45 090 3500 -525 -302 -78 146 370 593 817 110 3500 -375 -102 172 446 720 993 1267 130 3500 -225 98 422 746 1070 1393 1717 150 3500 -75 298 672 1046 1420 1793 2167 170 3500 75 498 922 1346 1770 2193 2617 190 3500 225 698 1172 1646 2120 2593 3067 210 3500 375 898 1422 1946 2470 2993 3517
NET RETURNS PER ACRE ABOVE TOTAL COSTS
PRICE($lb) Lint 090 110 130 150 170 190 210
PRICE ($bale) Seed 3500 3500 3500 3500 3500 3500 3500
750
15 -1043
-893 -743 -593 -443 -293 -143
YIELD(lbs lintacre) 1000 1250 1500 1750
YIELD ($500 lb lint bale equivalent) 20 25 30 35
-819 -595 -372 -148 -619 -345 -72 202 -419 -95 228 552 -219 155 528 902
-19 405 828 1252 181 655 1128 1602 381 905 1428 1952
2000
40 76
476 876
1276 1676 2076 2476
2250
45 300 750
1200 1650 2100 2550 3000
2012 Cotton Costs and Returns Study (Pima) San Joaquin Valley UC Cooperative Extension 17
UC COOPERATIVE EXTENSION
SAN JOAQUIN VALLEY - SOUTH 2012
Table 5 WHOLE FARM ANNUAL EQUIPMENT INVESTMENT AND BUSINESS OVERHEAD COSTS
ANNUAL EQUIPMENT COSTS
Cash Overhead Yrs Salvage Capital
Yr Description Price Life Value Recovery Insurance Taxes Total 12 105 hp 2WD tractor 94159 10 27813 9809 490 610 10909 12 105 hp 4WD tractor 107347 10 31709 11183 558 695 12437 12 150 hp 4WD tractor 153548 10 45356 15996 799 995 17789 12 230 hp track-type 287000 10 84775 29899 1493 1859 33250 12 Boll buggy 23000 10 4067 2615 109 135 2859 12 Cultivator Roll 20 16000 5 5212 2722 85 106 2913 12 Disc - Offset 21 43877 12 6077 4494 201 250 4944 12 Disc - Stubble 18 1 59000 10 10434 6709 279 347 7335 12 Disc - Stubble 18 2 42000 10 7427 4776 198 247 5222 12 Ditcher - 8 7800 15 749 703 34 43 781 12 Harvester - 6-Row 1 557253 10 105115 62838 2659 3312 68809 12 Harvester - 6-Row 2 557253 10 105115 62838 2659 3312 68809 12 Lister - 6-Row 20 22000 12 3047 2253 101 125 2479 12 Module builder 1 40000 10 0 5117 161 200 5478 12 Module builder 2 40000 10 0 5117 161 200 5478 12 Mower - Flail 20 29558 15 2838 2666 130 162 2958 12 Pickup - 12 ton 24000 5 10756 3549 140 174 3862 12 Pickup - 34 ton 28000 5 12549 4140 163 203 4506 12 Planter - 6-Row 20 41784 15 4012 3768 184 229 4181 12 Rear Blade - 10 4500 18 299 367 19 24 410 12 Saddle Tank 300 gal 3218 5 1048 548 17 21 586 12 Spray Boom 20 3630 3 1510 847 21 26 893 12 Subsoiler - 10 26534 10 4692 3017 125 156 3299 12 Uncapper - 6-row 20 10500 10 1857 1194 50 62 1305 TOTAL 2221961 476457 247166 10834 13492 271493
60 of new cost 1333177 285874 148300 6500 8095 162896 Used to reflect a mix of new and used equipment
ANNUAL INVESTMENT COSTS
Cash Overhead Yrs Salvage Capital
Description Price Life Value Recovery Insurance Taxes Repairs Total Buildings - 2400 sqft 60000 30 0 3793 241 300 1200 5533 Fuel tanks 2-500 gallons 6514 20 651 491 29 36 130 686 Service truck 2-ton 135500 10 25000 15325 644 803 2510 19281 Shopfield tools 12000 15 1200 1080 53 66 240 1439 Siphon pipes 3x90 13496 10 0 1727 54 67 160 2008 Land 12750000 25 12750000 605625 0 127500 0 733125 TOTAL INVESTMENT 12977510 12776851 628040 1021 128772 4240 762073
ANNUAL BUSINESS OVERHEAD COSTS
Description Units Farm Unit
Price Unit
Total Cost
Liability insurance Office expense
1500 1500
acre acre
098 5000
1470 75000
2012 Cotton Costs and Returns Study (Pima) San Joaquin Valley UC Cooperative Extension 18
UC COOPERATIVE EXTENSION
SAN JOAQUIN VALLEY - SOUTH 2012
Table 6 HOURLY EQUIPMENT COSTS
COSTS PER HOUR Cash Overhead Operating
Actual Capital Lube amp Fuel Total Total Yr Description Hours Used Recovery Insurance Taxes Repairs Oper CostsHr
12 105 hp 2WD tractor 1203 483 024 030 745 2090 2835 3372 12 105 hp 4WD tractor 182 405 020 025 589 2090 2679 3130 12 150 hp 4WD tractor 758 468 023 029 767 2986 3753 4273 12 230 hp track-type 305 1401 070 087 1641 4578 6219 7777 12 Boll buggy 75 785 033 041 317 000 317 1175 12 Cultivator Roll 20 309 461 014 018 088 000 088 581 12 Disc - Offset 21 99 1287 057 072 530 000 530 1946 12 Disc - Stubble 18 1 202 1991 083 103 963 000 963 3140 12 Disc - Stubble 18 2 180 1433 060 074 693 000 693 2259 12 Ditcher - 8 45 325 016 020 122 000 122 483 12 Harvester - 6-Row 1 165 11075 469 584 8487 7963 16450 28577 12 Harvester - 6-Row 2 165 11075 469 584 8487 7963 16450 28577 12 Lister - 6-Row 20 52 814 036 045 448 000 448 1344 12 Module builder 1 150 1297 041 051 620 1029 1649 3037 12 Module builder 2 113 1535 048 060 705 1029 1734 3378 12 Mower - Flail 20 77 1227 060 075 1344 000 1344 2706 12 Pickup - 12 ton 167 533 021 026 282 686 968 1548 12 Pickup - 34 ton 167 622 024 030 312 686 998 1674 12 Planter - 6-Row 20 91 1700 083 103 840 000 840 2726 12 Rear Blade - 10 45 137 007 009 067 000 067 220 12 Saddle Tank 300 gal 576 051 002 002 000 000 000 054 12 Spray Boom 20 523 070 002 002 069 000 069 143 12 Subsoiler - 10 97 919 038 048 615 000 615 1621 12 Uncapper - 6-row 20 61 358 015 019 216 000 216 607
2012 Cotton Costs and Returns Study (Pima) San Joaquin Valley UC Cooperative Extension 19
UC COOPERATIVE EXTENSION
SAN JOAQUIN VALLEY - SOUTH 2012
Table 7 OPERATIONS WITH EQUIPMENT
Field Operation Labor Material Rate
Operation Month Tractor Implement HrsAcre acre Unit Rip fields 1X3 yrs Nov 230 hp track-type Subsoiler - 10 016 Disc 2X Nov 150 hp 4WD tractor Disc - stubble 18 032 Apply herbicide Feb 150 hp 4WD tractor Saddle tank 300 gal 012 Roundup 32 floz Spray Triflurex Mar 150 hp 4WD tractor Spray boom 20 024 Triflurex HFP 15 pt Incorporate Triflurex Mar 150 hp 4WD tractor Disc - offset 21 016 List beds Mar 150 hp 4WD tractor Lister 6-row 20 008 Make ditch Mar 150 hp 4WD tractor Ditcher - 8 002
July 150 hp 4WD tractor Ditcher - 8 002 Irrigate Mar 100 Water 1000 acin
June 100 Water 800 acin July 100 Water 600 acin Aug 100 Water 600 acin
Close ditch Mar 150 hp 4WD tractor Rear blade - 10 002 June 150 hp 4WD tractor Rear blade - 10 002 Sept 150 hp 4WD tractor Rear blade - 10 002
Cultivate - Preplant Feb 150 hp 2WD tractor Cultivator roll 20 012 Plant amp Orthene treatment Apr 150 hp 2WD tractor Planter - 6-Row 20 015 Seed (Pima) 1800 lb
Orthene 325 oz Uncap beds Apr 105 hp 2WD tractor Uncapper - 6-row 20 010 Cultivate Apr 105 hp 2WD tractor Cultivator Roll 20 012
May 105 hp 2WD tractor Cultivator Roll 20 012 June 105 hp 2WD tractor Cultivator Roll 20 012
Fertilize - Sidedress (UN32) May 105 hp 2WD tractor 017 UN32 lbN 15000 lb N Fertilizer rental 100 acre
Weed Control - Over-the-top (Staple) May 105 hp 2WD tractor Saddle Tank 300 gal 024 Staple 038 floz Spray Boom 20
Weed control - Directlayby (Shark) June 105 hp 2WD tractor Saddle Tank 300 gal 024 Shark EW 100 floz Spray Boom 20
Insect control - Lygus (Carbine Zephyr) June Carbine 50WG 250 oz Zephyr 800 floz Air application 100 acre
Insect control - Lygus (Leverage) July Leverage 27 500 floz Air application 100 acre
Apply growth regulator amp KNO3 July Mepex Gin Out 200 floz Air application 100 acre
Fertilize - Water run (UN32) July UN32 lbN 3000 lb N Insect control - Aphid whitefly (Assail) Aug Assail 70WP 110 oz
Air application 100 acre Defoliate cotton - 2X Oct Finish 6 Pro 200 pint
Ginstar 1000 floz Air application 100 acre
Oct Defol 5 100 gal Shark EW 150 floz Air application 100 acre
PCA Oct PCAconsultant fee 100 acre Harvest - 2X Nov Harvester 6-Row 1 024
Nov Harvester 6-Row 2 024
2012 Cotton Costs and Returns Study (Pima) San Joaquin Valley UC Cooperative Extension 20
UC COOPERATIVE EXTENSION
SAN JOAQUIN VALLEY - SOUTH 2012
Table 7 CONTINUED
Operation Field Labor Material Rate Operation Month Tractor Implement HrsAcre acre Unit Boll buggy - 2X Nov 150 hp 4WD tractor Boll buggy 012 Build module (tractor 1) - 2X Nov 105 hp 2WD tractor 024 Build module Nov Module builder 1 015
Nov Module builder 2 015 Build module (tractor 2) Nov 105 hp 4WD Tractor 018 Assessments Nov CA Cotton Growers 300 bale
Natl Cot Council 300 bale Pink Bollworm Proj 300 bale USDA Classing Fee 300 bale Supima Association 300 bale
Chop stalks (post-harvest) Nov 105 hp 2WD tractor Mower - Flail 20 012 Disc residue - 2X (post-harvest) Nov 230 hp track-type Disc - Stubble 18 029 Pickup truck use Nov Pickup - 34 ton 027
Nov Pickup - 12 ton 027
2012 Cotton Costs and Returns Study (Pima) San Joaquin Valley UC Cooperative Extension 21

UC COOPERATIVE EXTENSION SAN JOAQUIN VALLEY - SOUTH 2012
Table 1 Continued
Total Your Cost Cost
NON-CASH OVERHEAD Per producing Annual Cost Acre Capital Recovery
Building - 2400sqft 40 3 3 Fuel tanks - 500 gallons (2) 4 0 0 Service truck - 2 ton 90 10 10 Shopfield tools 8 1 1 Siphon pipes 3x 90rdquo 18 2 2 Land 8500 404 404 Equipment 870 98 98 TOTAL NON-CASH OVERHEAD COSTS 9531 517 517 TOTAL COSTSACRE 1827
2012 Cotton Costs and Returns Study (Pima) San Joaquin Valley UC Cooperative Extension 13
UC COOPERATIVE EXTENSION
SAN JOAQUIN VALLEY - SOUTH 2012
Table 2 COSTS AND RETURNS PER ACRE TO PRODUCE PIMA COTTON
Quantity Price or Value or Your Acre Unit CostUnit CostAcre Costs
GROSS RETURNS
Lint (3 bales) 150000 lb 130 1950
Seed 300 bale equivalent 3500 105
TOTAL GROSS RETURNS 150000 2055
OPERATING COSTS
Insecticide 118
Fuel-gas 000 gal 382 0
TOTAL OPERATING COSTSACRE 1164
Orthene 325 oz 098 3
Zephyr 800 floz 746 60
Carbine 50WG 250 oz 687 17
Leverage 27 500 floz 388 19
Assail 70WP 110 oz 1682 19
Defoliant 61
Finish 6 Pro 200 pint 1375 28
Ginstar 1000 floz 274 27
Defol 5 100 gal 637 6
Herbicide 64
Roundup 3200 floz 022 7
Triflurex HFP 150 pt 452 7
Staple 038 floz 7288 28
Shark EW 250 floz 909 23
Growth Regulator 1
Mepex Gin Out 200 floz 039 1
Seed 54
Seed (Pima) 1800 lb 300 54
Fertilizer 151
UN 32 18000 lb N 084 151
Custom 60
Air application 600 acre 1000 60
Rent 4
Fertilizer applicator 100 acre 350 4
Irrigation 250
Water 3000 acin 833 250
Contract 12
PCAconsultant fee 100 acre 1200 12
Assessment 24
CA Cotton Growers 300 bale 025 1
National Cotton Council 300 bale 055 2
Pink Bollworm Project 300 bale 200 6
USDA Classing Fee 300 bale 215 6
Supima Association 300 bale 300 9
Labor 122
Equipment operator labor 499 hrs 1439 72
Irrigation labor 400 hrs 1165 47
Non-machine labor 030 hrs 1165 4
Machinery 213
Fuel-diesel 3763 gal 343 129
Lube 19
Machinery repair 65
Interest on operating capital at 575 30
NET RETURNS ABOVE OPERATING COSTS 891
2012 Cotton Costs and Returns Study (Pima) San Joaquin Valley UC Cooperative Extension 14
UC COOPERATIVE EXTENSION
SAN JOAQUIN VALLEY - SOUTH 2012
Table 2 Continued
CASH OVERHEAD COSTS Liability insurance Office expense Property taxes Property insurance Investment repairs
Value or Your CostAcre Costs
1 50 89
3 3
TOTAL CASH OVERHEAD COSTSACRE 145
TOTAL CASH COSTSACRE 1309
NON-CASH OVERHEAD COSTS (Capital Recovery) Buildings - 2400 sqft Fuel Tanks - 500 gallons (2) Service Truck - 2 Ton Shopfield tools Siphon pipes 3 x 90 Land Equipment
3 0
10 1 2
404 98
TOTAL NON-CASH OVERHEAD COSTS 517 TOTAL COSTACRE 1827
NET RETURNS ABOVE TOTAL COST 228
2012 Cotton Costs and Returns Study (Pima) San Joaquin Valley UC Cooperative Extension 15
UC COOPERATIVE EXTENSION SAN JOAQUIN VALLEY - SOUTH 2012
Table 3 MONTHLY CASH COSTS PER ACRE TO PRODUCE PIMA COTTON
Beginning 11-11 NOV DEC JAN FEB MAR APR MAY JUN JUL AUG SEP OCT NOV TOTAL Ending 11-12 11 11 12 12 12 12 12 12 12 12 12 12 12 Cultural
Rip fields 1X3 yrs 12 12 Disc 2X 19 19 Apply herbicide (Roundup) 13 13 Spray Triflurex 19 19 Incorporate Triflurex 9 9 List beds 4 4 Make ditch 1 1 1 4 Pre-irrigate 95 78 62 62 297 Close ditch 1 1 1 4 Cultivate - Preplant 5 5 Plant amp Orthene treatment 64 64 Uncap beds 4 4 Cultivate 5 5 5 15 Fertilize - Sidedress (UN32) 136 136 Weed Control - Over -the-top (Staple) 38 38 Weed control - Directlayby (Shark) 19 19 Insect control - Lygus (Carbine amp Zephyr) 87 87 Insect control - Lygus (Leverage) 29 29 Apply growth regulator amp KNO3 11 11 Fertilize - Water run (UN32) 25 25 Insect Control - Aphid whitefly (Assail) 29 29 Defoliate cotton - 2X 95 95 PCA 1 1 1 1 1 1 1 1 1 1 1 1 1 12 Chop stalks (Post-harvest) 6 6 Disc residue - 2X (post-harvest) 22 22 Pickup truck use 1 1 1 1 1 1 1 1 1 1 1 1 1 13
TOTAL CULTURAL COSTS 32 2 2 20 131 75 182 192 130 92 3 97 30 989 Harvest
Harvest - 2X 84 84 Boll buggy - 2X 6 6 Build module (tractor 1) - 2X 10 10 Build module (machines 1 (2X) and 2) 16 16 Build module (tractor 2) 7 7
TOTAL HARVEST COSTS 122 122 Assessment
Assessments 24 24 TOTAL ASSESSMENT COSTS 0 0 0 0 0 0 0 0 0 0 0 0 24 24 Interest on operating capital at 575 0 0 0 0 1 1 2 3 4 4 4 5 5 30 TOTAL OPERATING COSTSACRE 32 2 2 20 131 77 184 195 134 96 7 101 182 1165 CASH OVERHEAD Liability insurance 1 1 Office expense 4 4 4 4 4 4 4 4 4 4 4 4 4 50 Property taxes 44 44 89 Property insurance 3 3 Investment repairs 0 0 0 0 0 0 0 0 0 0 0 0 0 3 TOTAL CASH OVERHEAD COSTS 4 48 7 4 4 48 5 4 4 4 4 4 4 145 TOTAL CASH COSTSACRE 36 50 9 24 135 125 189 200 138 100 11 106 186 1310 TOTAL CASH COSTSLB 002 003 001 002 009 008 013 013 009 007 001 007 011 086
2012 Cotton Costs and Returns Study (Pima) San Joaquin Valley UC Cooperative Extension 16
UC COOPERATIVE EXTENSION SAN JOAQUIN VALLEY - SOUTH 2012
Table 4 RANGING ANALYSIS
COST PER ACRE AT VARYING YIELDS TO PRODUCE PIMA
YIELD (lbs lintacre) 750 1000 1250 1500 1750 2000 2250
OPERATING COSTS Cultural Cost 988 988 988 988 988 988 988 Harvest Cost 66 85 104 122 141 160 179 Assessment Cost 24 24 24 24 24 24 24
Interest on operating capital at 575 30 30 30 30 30 30 30 TOTAL OPERATING COSTSACRE 1108 1126 1145 1164 1183 1201 1220
TOTAL OPERATING COSTSLB 148 113 092 078 068 060 054 CASH OVERHEAD COSTSACRE 145 145 145 145 145 145 145 TOTAL CASH COSTSACRE 1253 1272 1290 1309 1328 1347 1365 TOTAL CASH COSTSLB 167 127 103 087 076 067 061 NON-CASH OVERHEAD COSTSACRE 517 517 517 517 517 517 517 TOTAL COSTSACRE 1770 1789 1808 1827 1845 1864 1883 TOTAL COSTSLB 236 179 145 122 105 093 084
NET RETURNS PER ACRE ABOVE OPERATING COSTS
YIELD(lbs lintacre) 750 1000 1250 1500 1750 2000 2250
PRICE($lb) PRICE ($bale) YIELD ($500 lb lint bale equivalent) Lint Seed 15 20 25 30 35 40 45 090 3500 -380 -156 67 291 515 739 962 110 3500 -230 44 317 591 865 1139 1412 130 3500 -80 244 567 891 1215 1539 1862 150 3500 70 444 817 1191 1565 1939 2312 170 3500 220 644 1067 1491 1915 2339 2762 190 3500 370 844 1317 1791 2265 2739 3212 210 3500 520 1044 1567 2091 2615 3139 3662
NET RETURNS PER ACRE ABOVE CASH COSTS
YIELD(lbs lintacre) 750 1000 1250 1500 1750 2000 2250
PRICE($lb) PRICE ($bale) YIELD ($500 lb lint bale equivalent) Lint Seed 15 20 25 30 35 40 45 090 3500 -525 -302 -78 146 370 593 817 110 3500 -375 -102 172 446 720 993 1267 130 3500 -225 98 422 746 1070 1393 1717 150 3500 -75 298 672 1046 1420 1793 2167 170 3500 75 498 922 1346 1770 2193 2617 190 3500 225 698 1172 1646 2120 2593 3067 210 3500 375 898 1422 1946 2470 2993 3517
NET RETURNS PER ACRE ABOVE TOTAL COSTS
PRICE($lb) Lint 090 110 130 150 170 190 210
PRICE ($bale) Seed 3500 3500 3500 3500 3500 3500 3500
750
15 -1043
-893 -743 -593 -443 -293 -143
YIELD(lbs lintacre) 1000 1250 1500 1750
YIELD ($500 lb lint bale equivalent) 20 25 30 35
-819 -595 -372 -148 -619 -345 -72 202 -419 -95 228 552 -219 155 528 902
-19 405 828 1252 181 655 1128 1602 381 905 1428 1952
2000
40 76
476 876
1276 1676 2076 2476
2250
45 300 750
1200 1650 2100 2550 3000
2012 Cotton Costs and Returns Study (Pima) San Joaquin Valley UC Cooperative Extension 17
UC COOPERATIVE EXTENSION
SAN JOAQUIN VALLEY - SOUTH 2012
Table 5 WHOLE FARM ANNUAL EQUIPMENT INVESTMENT AND BUSINESS OVERHEAD COSTS
ANNUAL EQUIPMENT COSTS
Cash Overhead Yrs Salvage Capital
Yr Description Price Life Value Recovery Insurance Taxes Total 12 105 hp 2WD tractor 94159 10 27813 9809 490 610 10909 12 105 hp 4WD tractor 107347 10 31709 11183 558 695 12437 12 150 hp 4WD tractor 153548 10 45356 15996 799 995 17789 12 230 hp track-type 287000 10 84775 29899 1493 1859 33250 12 Boll buggy 23000 10 4067 2615 109 135 2859 12 Cultivator Roll 20 16000 5 5212 2722 85 106 2913 12 Disc - Offset 21 43877 12 6077 4494 201 250 4944 12 Disc - Stubble 18 1 59000 10 10434 6709 279 347 7335 12 Disc - Stubble 18 2 42000 10 7427 4776 198 247 5222 12 Ditcher - 8 7800 15 749 703 34 43 781 12 Harvester - 6-Row 1 557253 10 105115 62838 2659 3312 68809 12 Harvester - 6-Row 2 557253 10 105115 62838 2659 3312 68809 12 Lister - 6-Row 20 22000 12 3047 2253 101 125 2479 12 Module builder 1 40000 10 0 5117 161 200 5478 12 Module builder 2 40000 10 0 5117 161 200 5478 12 Mower - Flail 20 29558 15 2838 2666 130 162 2958 12 Pickup - 12 ton 24000 5 10756 3549 140 174 3862 12 Pickup - 34 ton 28000 5 12549 4140 163 203 4506 12 Planter - 6-Row 20 41784 15 4012 3768 184 229 4181 12 Rear Blade - 10 4500 18 299 367 19 24 410 12 Saddle Tank 300 gal 3218 5 1048 548 17 21 586 12 Spray Boom 20 3630 3 1510 847 21 26 893 12 Subsoiler - 10 26534 10 4692 3017 125 156 3299 12 Uncapper - 6-row 20 10500 10 1857 1194 50 62 1305 TOTAL 2221961 476457 247166 10834 13492 271493
60 of new cost 1333177 285874 148300 6500 8095 162896 Used to reflect a mix of new and used equipment
ANNUAL INVESTMENT COSTS
Cash Overhead Yrs Salvage Capital
Description Price Life Value Recovery Insurance Taxes Repairs Total Buildings - 2400 sqft 60000 30 0 3793 241 300 1200 5533 Fuel tanks 2-500 gallons 6514 20 651 491 29 36 130 686 Service truck 2-ton 135500 10 25000 15325 644 803 2510 19281 Shopfield tools 12000 15 1200 1080 53 66 240 1439 Siphon pipes 3x90 13496 10 0 1727 54 67 160 2008 Land 12750000 25 12750000 605625 0 127500 0 733125 TOTAL INVESTMENT 12977510 12776851 628040 1021 128772 4240 762073
ANNUAL BUSINESS OVERHEAD COSTS
Description Units Farm Unit
Price Unit
Total Cost
Liability insurance Office expense
1500 1500
acre acre
098 5000
1470 75000
2012 Cotton Costs and Returns Study (Pima) San Joaquin Valley UC Cooperative Extension 18
UC COOPERATIVE EXTENSION
SAN JOAQUIN VALLEY - SOUTH 2012
Table 6 HOURLY EQUIPMENT COSTS
COSTS PER HOUR Cash Overhead Operating
Actual Capital Lube amp Fuel Total Total Yr Description Hours Used Recovery Insurance Taxes Repairs Oper CostsHr
12 105 hp 2WD tractor 1203 483 024 030 745 2090 2835 3372 12 105 hp 4WD tractor 182 405 020 025 589 2090 2679 3130 12 150 hp 4WD tractor 758 468 023 029 767 2986 3753 4273 12 230 hp track-type 305 1401 070 087 1641 4578 6219 7777 12 Boll buggy 75 785 033 041 317 000 317 1175 12 Cultivator Roll 20 309 461 014 018 088 000 088 581 12 Disc - Offset 21 99 1287 057 072 530 000 530 1946 12 Disc - Stubble 18 1 202 1991 083 103 963 000 963 3140 12 Disc - Stubble 18 2 180 1433 060 074 693 000 693 2259 12 Ditcher - 8 45 325 016 020 122 000 122 483 12 Harvester - 6-Row 1 165 11075 469 584 8487 7963 16450 28577 12 Harvester - 6-Row 2 165 11075 469 584 8487 7963 16450 28577 12 Lister - 6-Row 20 52 814 036 045 448 000 448 1344 12 Module builder 1 150 1297 041 051 620 1029 1649 3037 12 Module builder 2 113 1535 048 060 705 1029 1734 3378 12 Mower - Flail 20 77 1227 060 075 1344 000 1344 2706 12 Pickup - 12 ton 167 533 021 026 282 686 968 1548 12 Pickup - 34 ton 167 622 024 030 312 686 998 1674 12 Planter - 6-Row 20 91 1700 083 103 840 000 840 2726 12 Rear Blade - 10 45 137 007 009 067 000 067 220 12 Saddle Tank 300 gal 576 051 002 002 000 000 000 054 12 Spray Boom 20 523 070 002 002 069 000 069 143 12 Subsoiler - 10 97 919 038 048 615 000 615 1621 12 Uncapper - 6-row 20 61 358 015 019 216 000 216 607
2012 Cotton Costs and Returns Study (Pima) San Joaquin Valley UC Cooperative Extension 19
UC COOPERATIVE EXTENSION
SAN JOAQUIN VALLEY - SOUTH 2012
Table 7 OPERATIONS WITH EQUIPMENT
Field Operation Labor Material Rate
Operation Month Tractor Implement HrsAcre acre Unit Rip fields 1X3 yrs Nov 230 hp track-type Subsoiler - 10 016 Disc 2X Nov 150 hp 4WD tractor Disc - stubble 18 032 Apply herbicide Feb 150 hp 4WD tractor Saddle tank 300 gal 012 Roundup 32 floz Spray Triflurex Mar 150 hp 4WD tractor Spray boom 20 024 Triflurex HFP 15 pt Incorporate Triflurex Mar 150 hp 4WD tractor Disc - offset 21 016 List beds Mar 150 hp 4WD tractor Lister 6-row 20 008 Make ditch Mar 150 hp 4WD tractor Ditcher - 8 002
July 150 hp 4WD tractor Ditcher - 8 002 Irrigate Mar 100 Water 1000 acin
June 100 Water 800 acin July 100 Water 600 acin Aug 100 Water 600 acin
Close ditch Mar 150 hp 4WD tractor Rear blade - 10 002 June 150 hp 4WD tractor Rear blade - 10 002 Sept 150 hp 4WD tractor Rear blade - 10 002
Cultivate - Preplant Feb 150 hp 2WD tractor Cultivator roll 20 012 Plant amp Orthene treatment Apr 150 hp 2WD tractor Planter - 6-Row 20 015 Seed (Pima) 1800 lb
Orthene 325 oz Uncap beds Apr 105 hp 2WD tractor Uncapper - 6-row 20 010 Cultivate Apr 105 hp 2WD tractor Cultivator Roll 20 012
May 105 hp 2WD tractor Cultivator Roll 20 012 June 105 hp 2WD tractor Cultivator Roll 20 012
Fertilize - Sidedress (UN32) May 105 hp 2WD tractor 017 UN32 lbN 15000 lb N Fertilizer rental 100 acre
Weed Control - Over-the-top (Staple) May 105 hp 2WD tractor Saddle Tank 300 gal 024 Staple 038 floz Spray Boom 20
Weed control - Directlayby (Shark) June 105 hp 2WD tractor Saddle Tank 300 gal 024 Shark EW 100 floz Spray Boom 20
Insect control - Lygus (Carbine Zephyr) June Carbine 50WG 250 oz Zephyr 800 floz Air application 100 acre
Insect control - Lygus (Leverage) July Leverage 27 500 floz Air application 100 acre
Apply growth regulator amp KNO3 July Mepex Gin Out 200 floz Air application 100 acre
Fertilize - Water run (UN32) July UN32 lbN 3000 lb N Insect control - Aphid whitefly (Assail) Aug Assail 70WP 110 oz
Air application 100 acre Defoliate cotton - 2X Oct Finish 6 Pro 200 pint
Ginstar 1000 floz Air application 100 acre
Oct Defol 5 100 gal Shark EW 150 floz Air application 100 acre
PCA Oct PCAconsultant fee 100 acre Harvest - 2X Nov Harvester 6-Row 1 024
Nov Harvester 6-Row 2 024
2012 Cotton Costs and Returns Study (Pima) San Joaquin Valley UC Cooperative Extension 20
UC COOPERATIVE EXTENSION
SAN JOAQUIN VALLEY - SOUTH 2012
Table 7 CONTINUED
Operation Field Labor Material Rate Operation Month Tractor Implement HrsAcre acre Unit Boll buggy - 2X Nov 150 hp 4WD tractor Boll buggy 012 Build module (tractor 1) - 2X Nov 105 hp 2WD tractor 024 Build module Nov Module builder 1 015
Nov Module builder 2 015 Build module (tractor 2) Nov 105 hp 4WD Tractor 018 Assessments Nov CA Cotton Growers 300 bale
Natl Cot Council 300 bale Pink Bollworm Proj 300 bale USDA Classing Fee 300 bale Supima Association 300 bale
Chop stalks (post-harvest) Nov 105 hp 2WD tractor Mower - Flail 20 012 Disc residue - 2X (post-harvest) Nov 230 hp track-type Disc - Stubble 18 029 Pickup truck use Nov Pickup - 34 ton 027
Nov Pickup - 12 ton 027
2012 Cotton Costs and Returns Study (Pima) San Joaquin Valley UC Cooperative Extension 21

UC COOPERATIVE EXTENSION
SAN JOAQUIN VALLEY - SOUTH 2012
Table 2 COSTS AND RETURNS PER ACRE TO PRODUCE PIMA COTTON
Quantity Price or Value or Your Acre Unit CostUnit CostAcre Costs
GROSS RETURNS
Lint (3 bales) 150000 lb 130 1950
Seed 300 bale equivalent 3500 105
TOTAL GROSS RETURNS 150000 2055
OPERATING COSTS
Insecticide 118
Fuel-gas 000 gal 382 0
TOTAL OPERATING COSTSACRE 1164
Orthene 325 oz 098 3
Zephyr 800 floz 746 60
Carbine 50WG 250 oz 687 17
Leverage 27 500 floz 388 19
Assail 70WP 110 oz 1682 19
Defoliant 61
Finish 6 Pro 200 pint 1375 28
Ginstar 1000 floz 274 27
Defol 5 100 gal 637 6
Herbicide 64
Roundup 3200 floz 022 7
Triflurex HFP 150 pt 452 7
Staple 038 floz 7288 28
Shark EW 250 floz 909 23
Growth Regulator 1
Mepex Gin Out 200 floz 039 1
Seed 54
Seed (Pima) 1800 lb 300 54
Fertilizer 151
UN 32 18000 lb N 084 151
Custom 60
Air application 600 acre 1000 60
Rent 4
Fertilizer applicator 100 acre 350 4
Irrigation 250
Water 3000 acin 833 250
Contract 12
PCAconsultant fee 100 acre 1200 12
Assessment 24
CA Cotton Growers 300 bale 025 1
National Cotton Council 300 bale 055 2
Pink Bollworm Project 300 bale 200 6
USDA Classing Fee 300 bale 215 6
Supima Association 300 bale 300 9
Labor 122
Equipment operator labor 499 hrs 1439 72
Irrigation labor 400 hrs 1165 47
Non-machine labor 030 hrs 1165 4
Machinery 213
Fuel-diesel 3763 gal 343 129
Lube 19
Machinery repair 65
Interest on operating capital at 575 30
NET RETURNS ABOVE OPERATING COSTS 891
2012 Cotton Costs and Returns Study (Pima) San Joaquin Valley UC Cooperative Extension 14
UC COOPERATIVE EXTENSION
SAN JOAQUIN VALLEY - SOUTH 2012
Table 2 Continued
CASH OVERHEAD COSTS Liability insurance Office expense Property taxes Property insurance Investment repairs
Value or Your CostAcre Costs
1 50 89
3 3
TOTAL CASH OVERHEAD COSTSACRE 145
TOTAL CASH COSTSACRE 1309
NON-CASH OVERHEAD COSTS (Capital Recovery) Buildings - 2400 sqft Fuel Tanks - 500 gallons (2) Service Truck - 2 Ton Shopfield tools Siphon pipes 3 x 90 Land Equipment
3 0
10 1 2
404 98
TOTAL NON-CASH OVERHEAD COSTS 517 TOTAL COSTACRE 1827
NET RETURNS ABOVE TOTAL COST 228
2012 Cotton Costs and Returns Study (Pima) San Joaquin Valley UC Cooperative Extension 15
UC COOPERATIVE EXTENSION SAN JOAQUIN VALLEY - SOUTH 2012
Table 3 MONTHLY CASH COSTS PER ACRE TO PRODUCE PIMA COTTON
Beginning 11-11 NOV DEC JAN FEB MAR APR MAY JUN JUL AUG SEP OCT NOV TOTAL Ending 11-12 11 11 12 12 12 12 12 12 12 12 12 12 12 Cultural
Rip fields 1X3 yrs 12 12 Disc 2X 19 19 Apply herbicide (Roundup) 13 13 Spray Triflurex 19 19 Incorporate Triflurex 9 9 List beds 4 4 Make ditch 1 1 1 4 Pre-irrigate 95 78 62 62 297 Close ditch 1 1 1 4 Cultivate - Preplant 5 5 Plant amp Orthene treatment 64 64 Uncap beds 4 4 Cultivate 5 5 5 15 Fertilize - Sidedress (UN32) 136 136 Weed Control - Over -the-top (Staple) 38 38 Weed control - Directlayby (Shark) 19 19 Insect control - Lygus (Carbine amp Zephyr) 87 87 Insect control - Lygus (Leverage) 29 29 Apply growth regulator amp KNO3 11 11 Fertilize - Water run (UN32) 25 25 Insect Control - Aphid whitefly (Assail) 29 29 Defoliate cotton - 2X 95 95 PCA 1 1 1 1 1 1 1 1 1 1 1 1 1 12 Chop stalks (Post-harvest) 6 6 Disc residue - 2X (post-harvest) 22 22 Pickup truck use 1 1 1 1 1 1 1 1 1 1 1 1 1 13
TOTAL CULTURAL COSTS 32 2 2 20 131 75 182 192 130 92 3 97 30 989 Harvest
Harvest - 2X 84 84 Boll buggy - 2X 6 6 Build module (tractor 1) - 2X 10 10 Build module (machines 1 (2X) and 2) 16 16 Build module (tractor 2) 7 7
TOTAL HARVEST COSTS 122 122 Assessment
Assessments 24 24 TOTAL ASSESSMENT COSTS 0 0 0 0 0 0 0 0 0 0 0 0 24 24 Interest on operating capital at 575 0 0 0 0 1 1 2 3 4 4 4 5 5 30 TOTAL OPERATING COSTSACRE 32 2 2 20 131 77 184 195 134 96 7 101 182 1165 CASH OVERHEAD Liability insurance 1 1 Office expense 4 4 4 4 4 4 4 4 4 4 4 4 4 50 Property taxes 44 44 89 Property insurance 3 3 Investment repairs 0 0 0 0 0 0 0 0 0 0 0 0 0 3 TOTAL CASH OVERHEAD COSTS 4 48 7 4 4 48 5 4 4 4 4 4 4 145 TOTAL CASH COSTSACRE 36 50 9 24 135 125 189 200 138 100 11 106 186 1310 TOTAL CASH COSTSLB 002 003 001 002 009 008 013 013 009 007 001 007 011 086
2012 Cotton Costs and Returns Study (Pima) San Joaquin Valley UC Cooperative Extension 16
UC COOPERATIVE EXTENSION SAN JOAQUIN VALLEY - SOUTH 2012
Table 4 RANGING ANALYSIS
COST PER ACRE AT VARYING YIELDS TO PRODUCE PIMA
YIELD (lbs lintacre) 750 1000 1250 1500 1750 2000 2250
OPERATING COSTS Cultural Cost 988 988 988 988 988 988 988 Harvest Cost 66 85 104 122 141 160 179 Assessment Cost 24 24 24 24 24 24 24
Interest on operating capital at 575 30 30 30 30 30 30 30 TOTAL OPERATING COSTSACRE 1108 1126 1145 1164 1183 1201 1220
TOTAL OPERATING COSTSLB 148 113 092 078 068 060 054 CASH OVERHEAD COSTSACRE 145 145 145 145 145 145 145 TOTAL CASH COSTSACRE 1253 1272 1290 1309 1328 1347 1365 TOTAL CASH COSTSLB 167 127 103 087 076 067 061 NON-CASH OVERHEAD COSTSACRE 517 517 517 517 517 517 517 TOTAL COSTSACRE 1770 1789 1808 1827 1845 1864 1883 TOTAL COSTSLB 236 179 145 122 105 093 084
NET RETURNS PER ACRE ABOVE OPERATING COSTS
YIELD(lbs lintacre) 750 1000 1250 1500 1750 2000 2250
PRICE($lb) PRICE ($bale) YIELD ($500 lb lint bale equivalent) Lint Seed 15 20 25 30 35 40 45 090 3500 -380 -156 67 291 515 739 962 110 3500 -230 44 317 591 865 1139 1412 130 3500 -80 244 567 891 1215 1539 1862 150 3500 70 444 817 1191 1565 1939 2312 170 3500 220 644 1067 1491 1915 2339 2762 190 3500 370 844 1317 1791 2265 2739 3212 210 3500 520 1044 1567 2091 2615 3139 3662
NET RETURNS PER ACRE ABOVE CASH COSTS
YIELD(lbs lintacre) 750 1000 1250 1500 1750 2000 2250
PRICE($lb) PRICE ($bale) YIELD ($500 lb lint bale equivalent) Lint Seed 15 20 25 30 35 40 45 090 3500 -525 -302 -78 146 370 593 817 110 3500 -375 -102 172 446 720 993 1267 130 3500 -225 98 422 746 1070 1393 1717 150 3500 -75 298 672 1046 1420 1793 2167 170 3500 75 498 922 1346 1770 2193 2617 190 3500 225 698 1172 1646 2120 2593 3067 210 3500 375 898 1422 1946 2470 2993 3517
NET RETURNS PER ACRE ABOVE TOTAL COSTS
PRICE($lb) Lint 090 110 130 150 170 190 210
PRICE ($bale) Seed 3500 3500 3500 3500 3500 3500 3500
750
15 -1043
-893 -743 -593 -443 -293 -143
YIELD(lbs lintacre) 1000 1250 1500 1750
YIELD ($500 lb lint bale equivalent) 20 25 30 35
-819 -595 -372 -148 -619 -345 -72 202 -419 -95 228 552 -219 155 528 902
-19 405 828 1252 181 655 1128 1602 381 905 1428 1952
2000
40 76
476 876
1276 1676 2076 2476
2250
45 300 750
1200 1650 2100 2550 3000
2012 Cotton Costs and Returns Study (Pima) San Joaquin Valley UC Cooperative Extension 17
UC COOPERATIVE EXTENSION
SAN JOAQUIN VALLEY - SOUTH 2012
Table 5 WHOLE FARM ANNUAL EQUIPMENT INVESTMENT AND BUSINESS OVERHEAD COSTS
ANNUAL EQUIPMENT COSTS
Cash Overhead Yrs Salvage Capital
Yr Description Price Life Value Recovery Insurance Taxes Total 12 105 hp 2WD tractor 94159 10 27813 9809 490 610 10909 12 105 hp 4WD tractor 107347 10 31709 11183 558 695 12437 12 150 hp 4WD tractor 153548 10 45356 15996 799 995 17789 12 230 hp track-type 287000 10 84775 29899 1493 1859 33250 12 Boll buggy 23000 10 4067 2615 109 135 2859 12 Cultivator Roll 20 16000 5 5212 2722 85 106 2913 12 Disc - Offset 21 43877 12 6077 4494 201 250 4944 12 Disc - Stubble 18 1 59000 10 10434 6709 279 347 7335 12 Disc - Stubble 18 2 42000 10 7427 4776 198 247 5222 12 Ditcher - 8 7800 15 749 703 34 43 781 12 Harvester - 6-Row 1 557253 10 105115 62838 2659 3312 68809 12 Harvester - 6-Row 2 557253 10 105115 62838 2659 3312 68809 12 Lister - 6-Row 20 22000 12 3047 2253 101 125 2479 12 Module builder 1 40000 10 0 5117 161 200 5478 12 Module builder 2 40000 10 0 5117 161 200 5478 12 Mower - Flail 20 29558 15 2838 2666 130 162 2958 12 Pickup - 12 ton 24000 5 10756 3549 140 174 3862 12 Pickup - 34 ton 28000 5 12549 4140 163 203 4506 12 Planter - 6-Row 20 41784 15 4012 3768 184 229 4181 12 Rear Blade - 10 4500 18 299 367 19 24 410 12 Saddle Tank 300 gal 3218 5 1048 548 17 21 586 12 Spray Boom 20 3630 3 1510 847 21 26 893 12 Subsoiler - 10 26534 10 4692 3017 125 156 3299 12 Uncapper - 6-row 20 10500 10 1857 1194 50 62 1305 TOTAL 2221961 476457 247166 10834 13492 271493
60 of new cost 1333177 285874 148300 6500 8095 162896 Used to reflect a mix of new and used equipment
ANNUAL INVESTMENT COSTS
Cash Overhead Yrs Salvage Capital
Description Price Life Value Recovery Insurance Taxes Repairs Total Buildings - 2400 sqft 60000 30 0 3793 241 300 1200 5533 Fuel tanks 2-500 gallons 6514 20 651 491 29 36 130 686 Service truck 2-ton 135500 10 25000 15325 644 803 2510 19281 Shopfield tools 12000 15 1200 1080 53 66 240 1439 Siphon pipes 3x90 13496 10 0 1727 54 67 160 2008 Land 12750000 25 12750000 605625 0 127500 0 733125 TOTAL INVESTMENT 12977510 12776851 628040 1021 128772 4240 762073
ANNUAL BUSINESS OVERHEAD COSTS
Description Units Farm Unit
Price Unit
Total Cost
Liability insurance Office expense
1500 1500
acre acre
098 5000
1470 75000
2012 Cotton Costs and Returns Study (Pima) San Joaquin Valley UC Cooperative Extension 18
UC COOPERATIVE EXTENSION
SAN JOAQUIN VALLEY - SOUTH 2012
Table 6 HOURLY EQUIPMENT COSTS
COSTS PER HOUR Cash Overhead Operating
Actual Capital Lube amp Fuel Total Total Yr Description Hours Used Recovery Insurance Taxes Repairs Oper CostsHr
12 105 hp 2WD tractor 1203 483 024 030 745 2090 2835 3372 12 105 hp 4WD tractor 182 405 020 025 589 2090 2679 3130 12 150 hp 4WD tractor 758 468 023 029 767 2986 3753 4273 12 230 hp track-type 305 1401 070 087 1641 4578 6219 7777 12 Boll buggy 75 785 033 041 317 000 317 1175 12 Cultivator Roll 20 309 461 014 018 088 000 088 581 12 Disc - Offset 21 99 1287 057 072 530 000 530 1946 12 Disc - Stubble 18 1 202 1991 083 103 963 000 963 3140 12 Disc - Stubble 18 2 180 1433 060 074 693 000 693 2259 12 Ditcher - 8 45 325 016 020 122 000 122 483 12 Harvester - 6-Row 1 165 11075 469 584 8487 7963 16450 28577 12 Harvester - 6-Row 2 165 11075 469 584 8487 7963 16450 28577 12 Lister - 6-Row 20 52 814 036 045 448 000 448 1344 12 Module builder 1 150 1297 041 051 620 1029 1649 3037 12 Module builder 2 113 1535 048 060 705 1029 1734 3378 12 Mower - Flail 20 77 1227 060 075 1344 000 1344 2706 12 Pickup - 12 ton 167 533 021 026 282 686 968 1548 12 Pickup - 34 ton 167 622 024 030 312 686 998 1674 12 Planter - 6-Row 20 91 1700 083 103 840 000 840 2726 12 Rear Blade - 10 45 137 007 009 067 000 067 220 12 Saddle Tank 300 gal 576 051 002 002 000 000 000 054 12 Spray Boom 20 523 070 002 002 069 000 069 143 12 Subsoiler - 10 97 919 038 048 615 000 615 1621 12 Uncapper - 6-row 20 61 358 015 019 216 000 216 607
2012 Cotton Costs and Returns Study (Pima) San Joaquin Valley UC Cooperative Extension 19
UC COOPERATIVE EXTENSION
SAN JOAQUIN VALLEY - SOUTH 2012
Table 7 OPERATIONS WITH EQUIPMENT
Field Operation Labor Material Rate
Operation Month Tractor Implement HrsAcre acre Unit Rip fields 1X3 yrs Nov 230 hp track-type Subsoiler - 10 016 Disc 2X Nov 150 hp 4WD tractor Disc - stubble 18 032 Apply herbicide Feb 150 hp 4WD tractor Saddle tank 300 gal 012 Roundup 32 floz Spray Triflurex Mar 150 hp 4WD tractor Spray boom 20 024 Triflurex HFP 15 pt Incorporate Triflurex Mar 150 hp 4WD tractor Disc - offset 21 016 List beds Mar 150 hp 4WD tractor Lister 6-row 20 008 Make ditch Mar 150 hp 4WD tractor Ditcher - 8 002
July 150 hp 4WD tractor Ditcher - 8 002 Irrigate Mar 100 Water 1000 acin
June 100 Water 800 acin July 100 Water 600 acin Aug 100 Water 600 acin
Close ditch Mar 150 hp 4WD tractor Rear blade - 10 002 June 150 hp 4WD tractor Rear blade - 10 002 Sept 150 hp 4WD tractor Rear blade - 10 002
Cultivate - Preplant Feb 150 hp 2WD tractor Cultivator roll 20 012 Plant amp Orthene treatment Apr 150 hp 2WD tractor Planter - 6-Row 20 015 Seed (Pima) 1800 lb
Orthene 325 oz Uncap beds Apr 105 hp 2WD tractor Uncapper - 6-row 20 010 Cultivate Apr 105 hp 2WD tractor Cultivator Roll 20 012
May 105 hp 2WD tractor Cultivator Roll 20 012 June 105 hp 2WD tractor Cultivator Roll 20 012
Fertilize - Sidedress (UN32) May 105 hp 2WD tractor 017 UN32 lbN 15000 lb N Fertilizer rental 100 acre
Weed Control - Over-the-top (Staple) May 105 hp 2WD tractor Saddle Tank 300 gal 024 Staple 038 floz Spray Boom 20
Weed control - Directlayby (Shark) June 105 hp 2WD tractor Saddle Tank 300 gal 024 Shark EW 100 floz Spray Boom 20
Insect control - Lygus (Carbine Zephyr) June Carbine 50WG 250 oz Zephyr 800 floz Air application 100 acre
Insect control - Lygus (Leverage) July Leverage 27 500 floz Air application 100 acre
Apply growth regulator amp KNO3 July Mepex Gin Out 200 floz Air application 100 acre
Fertilize - Water run (UN32) July UN32 lbN 3000 lb N Insect control - Aphid whitefly (Assail) Aug Assail 70WP 110 oz
Air application 100 acre Defoliate cotton - 2X Oct Finish 6 Pro 200 pint
Ginstar 1000 floz Air application 100 acre
Oct Defol 5 100 gal Shark EW 150 floz Air application 100 acre
PCA Oct PCAconsultant fee 100 acre Harvest - 2X Nov Harvester 6-Row 1 024
Nov Harvester 6-Row 2 024
2012 Cotton Costs and Returns Study (Pima) San Joaquin Valley UC Cooperative Extension 20
UC COOPERATIVE EXTENSION
SAN JOAQUIN VALLEY - SOUTH 2012
Table 7 CONTINUED
Operation Field Labor Material Rate Operation Month Tractor Implement HrsAcre acre Unit Boll buggy - 2X Nov 150 hp 4WD tractor Boll buggy 012 Build module (tractor 1) - 2X Nov 105 hp 2WD tractor 024 Build module Nov Module builder 1 015
Nov Module builder 2 015 Build module (tractor 2) Nov 105 hp 4WD Tractor 018 Assessments Nov CA Cotton Growers 300 bale
Natl Cot Council 300 bale Pink Bollworm Proj 300 bale USDA Classing Fee 300 bale Supima Association 300 bale
Chop stalks (post-harvest) Nov 105 hp 2WD tractor Mower - Flail 20 012 Disc residue - 2X (post-harvest) Nov 230 hp track-type Disc - Stubble 18 029 Pickup truck use Nov Pickup - 34 ton 027
Nov Pickup - 12 ton 027
2012 Cotton Costs and Returns Study (Pima) San Joaquin Valley UC Cooperative Extension 21
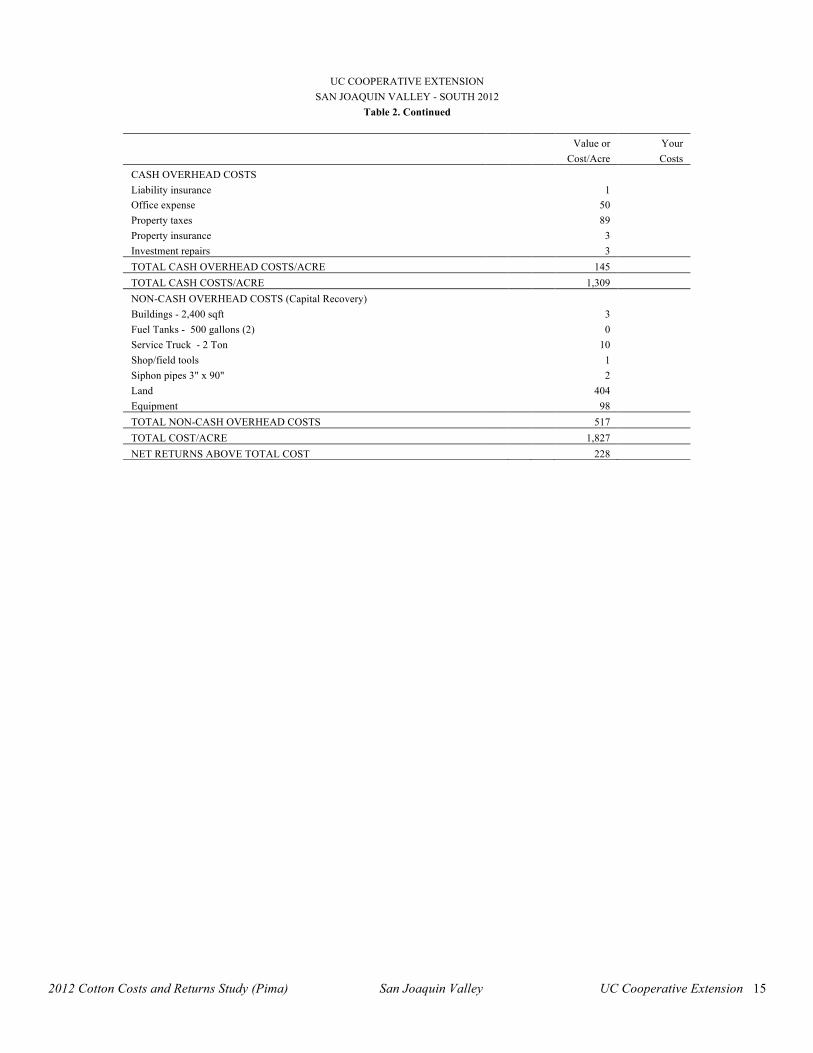
UC COOPERATIVE EXTENSION
SAN JOAQUIN VALLEY - SOUTH 2012
Table 2 Continued
CASH OVERHEAD COSTS Liability insurance Office expense Property taxes Property insurance Investment repairs
Value or Your CostAcre Costs
1 50 89
3 3
TOTAL CASH OVERHEAD COSTSACRE 145
TOTAL CASH COSTSACRE 1309
NON-CASH OVERHEAD COSTS (Capital Recovery) Buildings - 2400 sqft Fuel Tanks - 500 gallons (2) Service Truck - 2 Ton Shopfield tools Siphon pipes 3 x 90 Land Equipment
3 0
10 1 2
404 98
TOTAL NON-CASH OVERHEAD COSTS 517 TOTAL COSTACRE 1827
NET RETURNS ABOVE TOTAL COST 228
2012 Cotton Costs and Returns Study (Pima) San Joaquin Valley UC Cooperative Extension 15
UC COOPERATIVE EXTENSION SAN JOAQUIN VALLEY - SOUTH 2012
Table 3 MONTHLY CASH COSTS PER ACRE TO PRODUCE PIMA COTTON
Beginning 11-11 NOV DEC JAN FEB MAR APR MAY JUN JUL AUG SEP OCT NOV TOTAL Ending 11-12 11 11 12 12 12 12 12 12 12 12 12 12 12 Cultural
Rip fields 1X3 yrs 12 12 Disc 2X 19 19 Apply herbicide (Roundup) 13 13 Spray Triflurex 19 19 Incorporate Triflurex 9 9 List beds 4 4 Make ditch 1 1 1 4 Pre-irrigate 95 78 62 62 297 Close ditch 1 1 1 4 Cultivate - Preplant 5 5 Plant amp Orthene treatment 64 64 Uncap beds 4 4 Cultivate 5 5 5 15 Fertilize - Sidedress (UN32) 136 136 Weed Control - Over -the-top (Staple) 38 38 Weed control - Directlayby (Shark) 19 19 Insect control - Lygus (Carbine amp Zephyr) 87 87 Insect control - Lygus (Leverage) 29 29 Apply growth regulator amp KNO3 11 11 Fertilize - Water run (UN32) 25 25 Insect Control - Aphid whitefly (Assail) 29 29 Defoliate cotton - 2X 95 95 PCA 1 1 1 1 1 1 1 1 1 1 1 1 1 12 Chop stalks (Post-harvest) 6 6 Disc residue - 2X (post-harvest) 22 22 Pickup truck use 1 1 1 1 1 1 1 1 1 1 1 1 1 13
TOTAL CULTURAL COSTS 32 2 2 20 131 75 182 192 130 92 3 97 30 989 Harvest
Harvest - 2X 84 84 Boll buggy - 2X 6 6 Build module (tractor 1) - 2X 10 10 Build module (machines 1 (2X) and 2) 16 16 Build module (tractor 2) 7 7
TOTAL HARVEST COSTS 122 122 Assessment
Assessments 24 24 TOTAL ASSESSMENT COSTS 0 0 0 0 0 0 0 0 0 0 0 0 24 24 Interest on operating capital at 575 0 0 0 0 1 1 2 3 4 4 4 5 5 30 TOTAL OPERATING COSTSACRE 32 2 2 20 131 77 184 195 134 96 7 101 182 1165 CASH OVERHEAD Liability insurance 1 1 Office expense 4 4 4 4 4 4 4 4 4 4 4 4 4 50 Property taxes 44 44 89 Property insurance 3 3 Investment repairs 0 0 0 0 0 0 0 0 0 0 0 0 0 3 TOTAL CASH OVERHEAD COSTS 4 48 7 4 4 48 5 4 4 4 4 4 4 145 TOTAL CASH COSTSACRE 36 50 9 24 135 125 189 200 138 100 11 106 186 1310 TOTAL CASH COSTSLB 002 003 001 002 009 008 013 013 009 007 001 007 011 086
2012 Cotton Costs and Returns Study (Pima) San Joaquin Valley UC Cooperative Extension 16
UC COOPERATIVE EXTENSION SAN JOAQUIN VALLEY - SOUTH 2012
Table 4 RANGING ANALYSIS
COST PER ACRE AT VARYING YIELDS TO PRODUCE PIMA
YIELD (lbs lintacre) 750 1000 1250 1500 1750 2000 2250
OPERATING COSTS Cultural Cost 988 988 988 988 988 988 988 Harvest Cost 66 85 104 122 141 160 179 Assessment Cost 24 24 24 24 24 24 24
Interest on operating capital at 575 30 30 30 30 30 30 30 TOTAL OPERATING COSTSACRE 1108 1126 1145 1164 1183 1201 1220
TOTAL OPERATING COSTSLB 148 113 092 078 068 060 054 CASH OVERHEAD COSTSACRE 145 145 145 145 145 145 145 TOTAL CASH COSTSACRE 1253 1272 1290 1309 1328 1347 1365 TOTAL CASH COSTSLB 167 127 103 087 076 067 061 NON-CASH OVERHEAD COSTSACRE 517 517 517 517 517 517 517 TOTAL COSTSACRE 1770 1789 1808 1827 1845 1864 1883 TOTAL COSTSLB 236 179 145 122 105 093 084
NET RETURNS PER ACRE ABOVE OPERATING COSTS
YIELD(lbs lintacre) 750 1000 1250 1500 1750 2000 2250
PRICE($lb) PRICE ($bale) YIELD ($500 lb lint bale equivalent) Lint Seed 15 20 25 30 35 40 45 090 3500 -380 -156 67 291 515 739 962 110 3500 -230 44 317 591 865 1139 1412 130 3500 -80 244 567 891 1215 1539 1862 150 3500 70 444 817 1191 1565 1939 2312 170 3500 220 644 1067 1491 1915 2339 2762 190 3500 370 844 1317 1791 2265 2739 3212 210 3500 520 1044 1567 2091 2615 3139 3662
NET RETURNS PER ACRE ABOVE CASH COSTS
YIELD(lbs lintacre) 750 1000 1250 1500 1750 2000 2250
PRICE($lb) PRICE ($bale) YIELD ($500 lb lint bale equivalent) Lint Seed 15 20 25 30 35 40 45 090 3500 -525 -302 -78 146 370 593 817 110 3500 -375 -102 172 446 720 993 1267 130 3500 -225 98 422 746 1070 1393 1717 150 3500 -75 298 672 1046 1420 1793 2167 170 3500 75 498 922 1346 1770 2193 2617 190 3500 225 698 1172 1646 2120 2593 3067 210 3500 375 898 1422 1946 2470 2993 3517
NET RETURNS PER ACRE ABOVE TOTAL COSTS
PRICE($lb) Lint 090 110 130 150 170 190 210
PRICE ($bale) Seed 3500 3500 3500 3500 3500 3500 3500
750
15 -1043
-893 -743 -593 -443 -293 -143
YIELD(lbs lintacre) 1000 1250 1500 1750
YIELD ($500 lb lint bale equivalent) 20 25 30 35
-819 -595 -372 -148 -619 -345 -72 202 -419 -95 228 552 -219 155 528 902
-19 405 828 1252 181 655 1128 1602 381 905 1428 1952
2000
40 76
476 876
1276 1676 2076 2476
2250
45 300 750
1200 1650 2100 2550 3000
2012 Cotton Costs and Returns Study (Pima) San Joaquin Valley UC Cooperative Extension 17
UC COOPERATIVE EXTENSION
SAN JOAQUIN VALLEY - SOUTH 2012
Table 5 WHOLE FARM ANNUAL EQUIPMENT INVESTMENT AND BUSINESS OVERHEAD COSTS
ANNUAL EQUIPMENT COSTS
Cash Overhead Yrs Salvage Capital
Yr Description Price Life Value Recovery Insurance Taxes Total 12 105 hp 2WD tractor 94159 10 27813 9809 490 610 10909 12 105 hp 4WD tractor 107347 10 31709 11183 558 695 12437 12 150 hp 4WD tractor 153548 10 45356 15996 799 995 17789 12 230 hp track-type 287000 10 84775 29899 1493 1859 33250 12 Boll buggy 23000 10 4067 2615 109 135 2859 12 Cultivator Roll 20 16000 5 5212 2722 85 106 2913 12 Disc - Offset 21 43877 12 6077 4494 201 250 4944 12 Disc - Stubble 18 1 59000 10 10434 6709 279 347 7335 12 Disc - Stubble 18 2 42000 10 7427 4776 198 247 5222 12 Ditcher - 8 7800 15 749 703 34 43 781 12 Harvester - 6-Row 1 557253 10 105115 62838 2659 3312 68809 12 Harvester - 6-Row 2 557253 10 105115 62838 2659 3312 68809 12 Lister - 6-Row 20 22000 12 3047 2253 101 125 2479 12 Module builder 1 40000 10 0 5117 161 200 5478 12 Module builder 2 40000 10 0 5117 161 200 5478 12 Mower - Flail 20 29558 15 2838 2666 130 162 2958 12 Pickup - 12 ton 24000 5 10756 3549 140 174 3862 12 Pickup - 34 ton 28000 5 12549 4140 163 203 4506 12 Planter - 6-Row 20 41784 15 4012 3768 184 229 4181 12 Rear Blade - 10 4500 18 299 367 19 24 410 12 Saddle Tank 300 gal 3218 5 1048 548 17 21 586 12 Spray Boom 20 3630 3 1510 847 21 26 893 12 Subsoiler - 10 26534 10 4692 3017 125 156 3299 12 Uncapper - 6-row 20 10500 10 1857 1194 50 62 1305 TOTAL 2221961 476457 247166 10834 13492 271493
60 of new cost 1333177 285874 148300 6500 8095 162896 Used to reflect a mix of new and used equipment
ANNUAL INVESTMENT COSTS
Cash Overhead Yrs Salvage Capital
Description Price Life Value Recovery Insurance Taxes Repairs Total Buildings - 2400 sqft 60000 30 0 3793 241 300 1200 5533 Fuel tanks 2-500 gallons 6514 20 651 491 29 36 130 686 Service truck 2-ton 135500 10 25000 15325 644 803 2510 19281 Shopfield tools 12000 15 1200 1080 53 66 240 1439 Siphon pipes 3x90 13496 10 0 1727 54 67 160 2008 Land 12750000 25 12750000 605625 0 127500 0 733125 TOTAL INVESTMENT 12977510 12776851 628040 1021 128772 4240 762073
ANNUAL BUSINESS OVERHEAD COSTS
Description Units Farm Unit
Price Unit
Total Cost
Liability insurance Office expense
1500 1500
acre acre
098 5000
1470 75000
2012 Cotton Costs and Returns Study (Pima) San Joaquin Valley UC Cooperative Extension 18
UC COOPERATIVE EXTENSION
SAN JOAQUIN VALLEY - SOUTH 2012
Table 6 HOURLY EQUIPMENT COSTS
COSTS PER HOUR Cash Overhead Operating
Actual Capital Lube amp Fuel Total Total Yr Description Hours Used Recovery Insurance Taxes Repairs Oper CostsHr
12 105 hp 2WD tractor 1203 483 024 030 745 2090 2835 3372 12 105 hp 4WD tractor 182 405 020 025 589 2090 2679 3130 12 150 hp 4WD tractor 758 468 023 029 767 2986 3753 4273 12 230 hp track-type 305 1401 070 087 1641 4578 6219 7777 12 Boll buggy 75 785 033 041 317 000 317 1175 12 Cultivator Roll 20 309 461 014 018 088 000 088 581 12 Disc - Offset 21 99 1287 057 072 530 000 530 1946 12 Disc - Stubble 18 1 202 1991 083 103 963 000 963 3140 12 Disc - Stubble 18 2 180 1433 060 074 693 000 693 2259 12 Ditcher - 8 45 325 016 020 122 000 122 483 12 Harvester - 6-Row 1 165 11075 469 584 8487 7963 16450 28577 12 Harvester - 6-Row 2 165 11075 469 584 8487 7963 16450 28577 12 Lister - 6-Row 20 52 814 036 045 448 000 448 1344 12 Module builder 1 150 1297 041 051 620 1029 1649 3037 12 Module builder 2 113 1535 048 060 705 1029 1734 3378 12 Mower - Flail 20 77 1227 060 075 1344 000 1344 2706 12 Pickup - 12 ton 167 533 021 026 282 686 968 1548 12 Pickup - 34 ton 167 622 024 030 312 686 998 1674 12 Planter - 6-Row 20 91 1700 083 103 840 000 840 2726 12 Rear Blade - 10 45 137 007 009 067 000 067 220 12 Saddle Tank 300 gal 576 051 002 002 000 000 000 054 12 Spray Boom 20 523 070 002 002 069 000 069 143 12 Subsoiler - 10 97 919 038 048 615 000 615 1621 12 Uncapper - 6-row 20 61 358 015 019 216 000 216 607
2012 Cotton Costs and Returns Study (Pima) San Joaquin Valley UC Cooperative Extension 19
UC COOPERATIVE EXTENSION
SAN JOAQUIN VALLEY - SOUTH 2012
Table 7 OPERATIONS WITH EQUIPMENT
Field Operation Labor Material Rate
Operation Month Tractor Implement HrsAcre acre Unit Rip fields 1X3 yrs Nov 230 hp track-type Subsoiler - 10 016 Disc 2X Nov 150 hp 4WD tractor Disc - stubble 18 032 Apply herbicide Feb 150 hp 4WD tractor Saddle tank 300 gal 012 Roundup 32 floz Spray Triflurex Mar 150 hp 4WD tractor Spray boom 20 024 Triflurex HFP 15 pt Incorporate Triflurex Mar 150 hp 4WD tractor Disc - offset 21 016 List beds Mar 150 hp 4WD tractor Lister 6-row 20 008 Make ditch Mar 150 hp 4WD tractor Ditcher - 8 002
July 150 hp 4WD tractor Ditcher - 8 002 Irrigate Mar 100 Water 1000 acin
June 100 Water 800 acin July 100 Water 600 acin Aug 100 Water 600 acin
Close ditch Mar 150 hp 4WD tractor Rear blade - 10 002 June 150 hp 4WD tractor Rear blade - 10 002 Sept 150 hp 4WD tractor Rear blade - 10 002
Cultivate - Preplant Feb 150 hp 2WD tractor Cultivator roll 20 012 Plant amp Orthene treatment Apr 150 hp 2WD tractor Planter - 6-Row 20 015 Seed (Pima) 1800 lb
Orthene 325 oz Uncap beds Apr 105 hp 2WD tractor Uncapper - 6-row 20 010 Cultivate Apr 105 hp 2WD tractor Cultivator Roll 20 012
May 105 hp 2WD tractor Cultivator Roll 20 012 June 105 hp 2WD tractor Cultivator Roll 20 012
Fertilize - Sidedress (UN32) May 105 hp 2WD tractor 017 UN32 lbN 15000 lb N Fertilizer rental 100 acre
Weed Control - Over-the-top (Staple) May 105 hp 2WD tractor Saddle Tank 300 gal 024 Staple 038 floz Spray Boom 20
Weed control - Directlayby (Shark) June 105 hp 2WD tractor Saddle Tank 300 gal 024 Shark EW 100 floz Spray Boom 20
Insect control - Lygus (Carbine Zephyr) June Carbine 50WG 250 oz Zephyr 800 floz Air application 100 acre
Insect control - Lygus (Leverage) July Leverage 27 500 floz Air application 100 acre
Apply growth regulator amp KNO3 July Mepex Gin Out 200 floz Air application 100 acre
Fertilize - Water run (UN32) July UN32 lbN 3000 lb N Insect control - Aphid whitefly (Assail) Aug Assail 70WP 110 oz
Air application 100 acre Defoliate cotton - 2X Oct Finish 6 Pro 200 pint
Ginstar 1000 floz Air application 100 acre
Oct Defol 5 100 gal Shark EW 150 floz Air application 100 acre
PCA Oct PCAconsultant fee 100 acre Harvest - 2X Nov Harvester 6-Row 1 024
Nov Harvester 6-Row 2 024
2012 Cotton Costs and Returns Study (Pima) San Joaquin Valley UC Cooperative Extension 20
UC COOPERATIVE EXTENSION
SAN JOAQUIN VALLEY - SOUTH 2012
Table 7 CONTINUED
Operation Field Labor Material Rate Operation Month Tractor Implement HrsAcre acre Unit Boll buggy - 2X Nov 150 hp 4WD tractor Boll buggy 012 Build module (tractor 1) - 2X Nov 105 hp 2WD tractor 024 Build module Nov Module builder 1 015
Nov Module builder 2 015 Build module (tractor 2) Nov 105 hp 4WD Tractor 018 Assessments Nov CA Cotton Growers 300 bale
Natl Cot Council 300 bale Pink Bollworm Proj 300 bale USDA Classing Fee 300 bale Supima Association 300 bale
Chop stalks (post-harvest) Nov 105 hp 2WD tractor Mower - Flail 20 012 Disc residue - 2X (post-harvest) Nov 230 hp track-type Disc - Stubble 18 029 Pickup truck use Nov Pickup - 34 ton 027
Nov Pickup - 12 ton 027
2012 Cotton Costs and Returns Study (Pima) San Joaquin Valley UC Cooperative Extension 21

UC COOPERATIVE EXTENSION SAN JOAQUIN VALLEY - SOUTH 2012
Table 3 MONTHLY CASH COSTS PER ACRE TO PRODUCE PIMA COTTON
Beginning 11-11 NOV DEC JAN FEB MAR APR MAY JUN JUL AUG SEP OCT NOV TOTAL Ending 11-12 11 11 12 12 12 12 12 12 12 12 12 12 12 Cultural
Rip fields 1X3 yrs 12 12 Disc 2X 19 19 Apply herbicide (Roundup) 13 13 Spray Triflurex 19 19 Incorporate Triflurex 9 9 List beds 4 4 Make ditch 1 1 1 4 Pre-irrigate 95 78 62 62 297 Close ditch 1 1 1 4 Cultivate - Preplant 5 5 Plant amp Orthene treatment 64 64 Uncap beds 4 4 Cultivate 5 5 5 15 Fertilize - Sidedress (UN32) 136 136 Weed Control - Over -the-top (Staple) 38 38 Weed control - Directlayby (Shark) 19 19 Insect control - Lygus (Carbine amp Zephyr) 87 87 Insect control - Lygus (Leverage) 29 29 Apply growth regulator amp KNO3 11 11 Fertilize - Water run (UN32) 25 25 Insect Control - Aphid whitefly (Assail) 29 29 Defoliate cotton - 2X 95 95 PCA 1 1 1 1 1 1 1 1 1 1 1 1 1 12 Chop stalks (Post-harvest) 6 6 Disc residue - 2X (post-harvest) 22 22 Pickup truck use 1 1 1 1 1 1 1 1 1 1 1 1 1 13
TOTAL CULTURAL COSTS 32 2 2 20 131 75 182 192 130 92 3 97 30 989 Harvest
Harvest - 2X 84 84 Boll buggy - 2X 6 6 Build module (tractor 1) - 2X 10 10 Build module (machines 1 (2X) and 2) 16 16 Build module (tractor 2) 7 7
TOTAL HARVEST COSTS 122 122 Assessment
Assessments 24 24 TOTAL ASSESSMENT COSTS 0 0 0 0 0 0 0 0 0 0 0 0 24 24 Interest on operating capital at 575 0 0 0 0 1 1 2 3 4 4 4 5 5 30 TOTAL OPERATING COSTSACRE 32 2 2 20 131 77 184 195 134 96 7 101 182 1165 CASH OVERHEAD Liability insurance 1 1 Office expense 4 4 4 4 4 4 4 4 4 4 4 4 4 50 Property taxes 44 44 89 Property insurance 3 3 Investment repairs 0 0 0 0 0 0 0 0 0 0 0 0 0 3 TOTAL CASH OVERHEAD COSTS 4 48 7 4 4 48 5 4 4 4 4 4 4 145 TOTAL CASH COSTSACRE 36 50 9 24 135 125 189 200 138 100 11 106 186 1310 TOTAL CASH COSTSLB 002 003 001 002 009 008 013 013 009 007 001 007 011 086
2012 Cotton Costs and Returns Study (Pima) San Joaquin Valley UC Cooperative Extension 16
UC COOPERATIVE EXTENSION SAN JOAQUIN VALLEY - SOUTH 2012
Table 4 RANGING ANALYSIS
COST PER ACRE AT VARYING YIELDS TO PRODUCE PIMA
YIELD (lbs lintacre) 750 1000 1250 1500 1750 2000 2250
OPERATING COSTS Cultural Cost 988 988 988 988 988 988 988 Harvest Cost 66 85 104 122 141 160 179 Assessment Cost 24 24 24 24 24 24 24
Interest on operating capital at 575 30 30 30 30 30 30 30 TOTAL OPERATING COSTSACRE 1108 1126 1145 1164 1183 1201 1220
TOTAL OPERATING COSTSLB 148 113 092 078 068 060 054 CASH OVERHEAD COSTSACRE 145 145 145 145 145 145 145 TOTAL CASH COSTSACRE 1253 1272 1290 1309 1328 1347 1365 TOTAL CASH COSTSLB 167 127 103 087 076 067 061 NON-CASH OVERHEAD COSTSACRE 517 517 517 517 517 517 517 TOTAL COSTSACRE 1770 1789 1808 1827 1845 1864 1883 TOTAL COSTSLB 236 179 145 122 105 093 084
NET RETURNS PER ACRE ABOVE OPERATING COSTS
YIELD(lbs lintacre) 750 1000 1250 1500 1750 2000 2250
PRICE($lb) PRICE ($bale) YIELD ($500 lb lint bale equivalent) Lint Seed 15 20 25 30 35 40 45 090 3500 -380 -156 67 291 515 739 962 110 3500 -230 44 317 591 865 1139 1412 130 3500 -80 244 567 891 1215 1539 1862 150 3500 70 444 817 1191 1565 1939 2312 170 3500 220 644 1067 1491 1915 2339 2762 190 3500 370 844 1317 1791 2265 2739 3212 210 3500 520 1044 1567 2091 2615 3139 3662
NET RETURNS PER ACRE ABOVE CASH COSTS
YIELD(lbs lintacre) 750 1000 1250 1500 1750 2000 2250
PRICE($lb) PRICE ($bale) YIELD ($500 lb lint bale equivalent) Lint Seed 15 20 25 30 35 40 45 090 3500 -525 -302 -78 146 370 593 817 110 3500 -375 -102 172 446 720 993 1267 130 3500 -225 98 422 746 1070 1393 1717 150 3500 -75 298 672 1046 1420 1793 2167 170 3500 75 498 922 1346 1770 2193 2617 190 3500 225 698 1172 1646 2120 2593 3067 210 3500 375 898 1422 1946 2470 2993 3517
NET RETURNS PER ACRE ABOVE TOTAL COSTS
PRICE($lb) Lint 090 110 130 150 170 190 210
PRICE ($bale) Seed 3500 3500 3500 3500 3500 3500 3500
750
15 -1043
-893 -743 -593 -443 -293 -143
YIELD(lbs lintacre) 1000 1250 1500 1750
YIELD ($500 lb lint bale equivalent) 20 25 30 35
-819 -595 -372 -148 -619 -345 -72 202 -419 -95 228 552 -219 155 528 902
-19 405 828 1252 181 655 1128 1602 381 905 1428 1952
2000
40 76
476 876
1276 1676 2076 2476
2250
45 300 750
1200 1650 2100 2550 3000
2012 Cotton Costs and Returns Study (Pima) San Joaquin Valley UC Cooperative Extension 17
UC COOPERATIVE EXTENSION
SAN JOAQUIN VALLEY - SOUTH 2012
Table 5 WHOLE FARM ANNUAL EQUIPMENT INVESTMENT AND BUSINESS OVERHEAD COSTS
ANNUAL EQUIPMENT COSTS
Cash Overhead Yrs Salvage Capital
Yr Description Price Life Value Recovery Insurance Taxes Total 12 105 hp 2WD tractor 94159 10 27813 9809 490 610 10909 12 105 hp 4WD tractor 107347 10 31709 11183 558 695 12437 12 150 hp 4WD tractor 153548 10 45356 15996 799 995 17789 12 230 hp track-type 287000 10 84775 29899 1493 1859 33250 12 Boll buggy 23000 10 4067 2615 109 135 2859 12 Cultivator Roll 20 16000 5 5212 2722 85 106 2913 12 Disc - Offset 21 43877 12 6077 4494 201 250 4944 12 Disc - Stubble 18 1 59000 10 10434 6709 279 347 7335 12 Disc - Stubble 18 2 42000 10 7427 4776 198 247 5222 12 Ditcher - 8 7800 15 749 703 34 43 781 12 Harvester - 6-Row 1 557253 10 105115 62838 2659 3312 68809 12 Harvester - 6-Row 2 557253 10 105115 62838 2659 3312 68809 12 Lister - 6-Row 20 22000 12 3047 2253 101 125 2479 12 Module builder 1 40000 10 0 5117 161 200 5478 12 Module builder 2 40000 10 0 5117 161 200 5478 12 Mower - Flail 20 29558 15 2838 2666 130 162 2958 12 Pickup - 12 ton 24000 5 10756 3549 140 174 3862 12 Pickup - 34 ton 28000 5 12549 4140 163 203 4506 12 Planter - 6-Row 20 41784 15 4012 3768 184 229 4181 12 Rear Blade - 10 4500 18 299 367 19 24 410 12 Saddle Tank 300 gal 3218 5 1048 548 17 21 586 12 Spray Boom 20 3630 3 1510 847 21 26 893 12 Subsoiler - 10 26534 10 4692 3017 125 156 3299 12 Uncapper - 6-row 20 10500 10 1857 1194 50 62 1305 TOTAL 2221961 476457 247166 10834 13492 271493
60 of new cost 1333177 285874 148300 6500 8095 162896 Used to reflect a mix of new and used equipment
ANNUAL INVESTMENT COSTS
Cash Overhead Yrs Salvage Capital
Description Price Life Value Recovery Insurance Taxes Repairs Total Buildings - 2400 sqft 60000 30 0 3793 241 300 1200 5533 Fuel tanks 2-500 gallons 6514 20 651 491 29 36 130 686 Service truck 2-ton 135500 10 25000 15325 644 803 2510 19281 Shopfield tools 12000 15 1200 1080 53 66 240 1439 Siphon pipes 3x90 13496 10 0 1727 54 67 160 2008 Land 12750000 25 12750000 605625 0 127500 0 733125 TOTAL INVESTMENT 12977510 12776851 628040 1021 128772 4240 762073
ANNUAL BUSINESS OVERHEAD COSTS
Description Units Farm Unit
Price Unit
Total Cost
Liability insurance Office expense
1500 1500
acre acre
098 5000
1470 75000
2012 Cotton Costs and Returns Study (Pima) San Joaquin Valley UC Cooperative Extension 18
UC COOPERATIVE EXTENSION
SAN JOAQUIN VALLEY - SOUTH 2012
Table 6 HOURLY EQUIPMENT COSTS
COSTS PER HOUR Cash Overhead Operating
Actual Capital Lube amp Fuel Total Total Yr Description Hours Used Recovery Insurance Taxes Repairs Oper CostsHr
12 105 hp 2WD tractor 1203 483 024 030 745 2090 2835 3372 12 105 hp 4WD tractor 182 405 020 025 589 2090 2679 3130 12 150 hp 4WD tractor 758 468 023 029 767 2986 3753 4273 12 230 hp track-type 305 1401 070 087 1641 4578 6219 7777 12 Boll buggy 75 785 033 041 317 000 317 1175 12 Cultivator Roll 20 309 461 014 018 088 000 088 581 12 Disc - Offset 21 99 1287 057 072 530 000 530 1946 12 Disc - Stubble 18 1 202 1991 083 103 963 000 963 3140 12 Disc - Stubble 18 2 180 1433 060 074 693 000 693 2259 12 Ditcher - 8 45 325 016 020 122 000 122 483 12 Harvester - 6-Row 1 165 11075 469 584 8487 7963 16450 28577 12 Harvester - 6-Row 2 165 11075 469 584 8487 7963 16450 28577 12 Lister - 6-Row 20 52 814 036 045 448 000 448 1344 12 Module builder 1 150 1297 041 051 620 1029 1649 3037 12 Module builder 2 113 1535 048 060 705 1029 1734 3378 12 Mower - Flail 20 77 1227 060 075 1344 000 1344 2706 12 Pickup - 12 ton 167 533 021 026 282 686 968 1548 12 Pickup - 34 ton 167 622 024 030 312 686 998 1674 12 Planter - 6-Row 20 91 1700 083 103 840 000 840 2726 12 Rear Blade - 10 45 137 007 009 067 000 067 220 12 Saddle Tank 300 gal 576 051 002 002 000 000 000 054 12 Spray Boom 20 523 070 002 002 069 000 069 143 12 Subsoiler - 10 97 919 038 048 615 000 615 1621 12 Uncapper - 6-row 20 61 358 015 019 216 000 216 607
2012 Cotton Costs and Returns Study (Pima) San Joaquin Valley UC Cooperative Extension 19
UC COOPERATIVE EXTENSION
SAN JOAQUIN VALLEY - SOUTH 2012
Table 7 OPERATIONS WITH EQUIPMENT
Field Operation Labor Material Rate
Operation Month Tractor Implement HrsAcre acre Unit Rip fields 1X3 yrs Nov 230 hp track-type Subsoiler - 10 016 Disc 2X Nov 150 hp 4WD tractor Disc - stubble 18 032 Apply herbicide Feb 150 hp 4WD tractor Saddle tank 300 gal 012 Roundup 32 floz Spray Triflurex Mar 150 hp 4WD tractor Spray boom 20 024 Triflurex HFP 15 pt Incorporate Triflurex Mar 150 hp 4WD tractor Disc - offset 21 016 List beds Mar 150 hp 4WD tractor Lister 6-row 20 008 Make ditch Mar 150 hp 4WD tractor Ditcher - 8 002
July 150 hp 4WD tractor Ditcher - 8 002 Irrigate Mar 100 Water 1000 acin
June 100 Water 800 acin July 100 Water 600 acin Aug 100 Water 600 acin
Close ditch Mar 150 hp 4WD tractor Rear blade - 10 002 June 150 hp 4WD tractor Rear blade - 10 002 Sept 150 hp 4WD tractor Rear blade - 10 002
Cultivate - Preplant Feb 150 hp 2WD tractor Cultivator roll 20 012 Plant amp Orthene treatment Apr 150 hp 2WD tractor Planter - 6-Row 20 015 Seed (Pima) 1800 lb
Orthene 325 oz Uncap beds Apr 105 hp 2WD tractor Uncapper - 6-row 20 010 Cultivate Apr 105 hp 2WD tractor Cultivator Roll 20 012
May 105 hp 2WD tractor Cultivator Roll 20 012 June 105 hp 2WD tractor Cultivator Roll 20 012
Fertilize - Sidedress (UN32) May 105 hp 2WD tractor 017 UN32 lbN 15000 lb N Fertilizer rental 100 acre
Weed Control - Over-the-top (Staple) May 105 hp 2WD tractor Saddle Tank 300 gal 024 Staple 038 floz Spray Boom 20
Weed control - Directlayby (Shark) June 105 hp 2WD tractor Saddle Tank 300 gal 024 Shark EW 100 floz Spray Boom 20
Insect control - Lygus (Carbine Zephyr) June Carbine 50WG 250 oz Zephyr 800 floz Air application 100 acre
Insect control - Lygus (Leverage) July Leverage 27 500 floz Air application 100 acre
Apply growth regulator amp KNO3 July Mepex Gin Out 200 floz Air application 100 acre
Fertilize - Water run (UN32) July UN32 lbN 3000 lb N Insect control - Aphid whitefly (Assail) Aug Assail 70WP 110 oz
Air application 100 acre Defoliate cotton - 2X Oct Finish 6 Pro 200 pint
Ginstar 1000 floz Air application 100 acre
Oct Defol 5 100 gal Shark EW 150 floz Air application 100 acre
PCA Oct PCAconsultant fee 100 acre Harvest - 2X Nov Harvester 6-Row 1 024
Nov Harvester 6-Row 2 024
2012 Cotton Costs and Returns Study (Pima) San Joaquin Valley UC Cooperative Extension 20
UC COOPERATIVE EXTENSION
SAN JOAQUIN VALLEY - SOUTH 2012
Table 7 CONTINUED
Operation Field Labor Material Rate Operation Month Tractor Implement HrsAcre acre Unit Boll buggy - 2X Nov 150 hp 4WD tractor Boll buggy 012 Build module (tractor 1) - 2X Nov 105 hp 2WD tractor 024 Build module Nov Module builder 1 015
Nov Module builder 2 015 Build module (tractor 2) Nov 105 hp 4WD Tractor 018 Assessments Nov CA Cotton Growers 300 bale
Natl Cot Council 300 bale Pink Bollworm Proj 300 bale USDA Classing Fee 300 bale Supima Association 300 bale
Chop stalks (post-harvest) Nov 105 hp 2WD tractor Mower - Flail 20 012 Disc residue - 2X (post-harvest) Nov 230 hp track-type Disc - Stubble 18 029 Pickup truck use Nov Pickup - 34 ton 027
Nov Pickup - 12 ton 027
2012 Cotton Costs and Returns Study (Pima) San Joaquin Valley UC Cooperative Extension 21
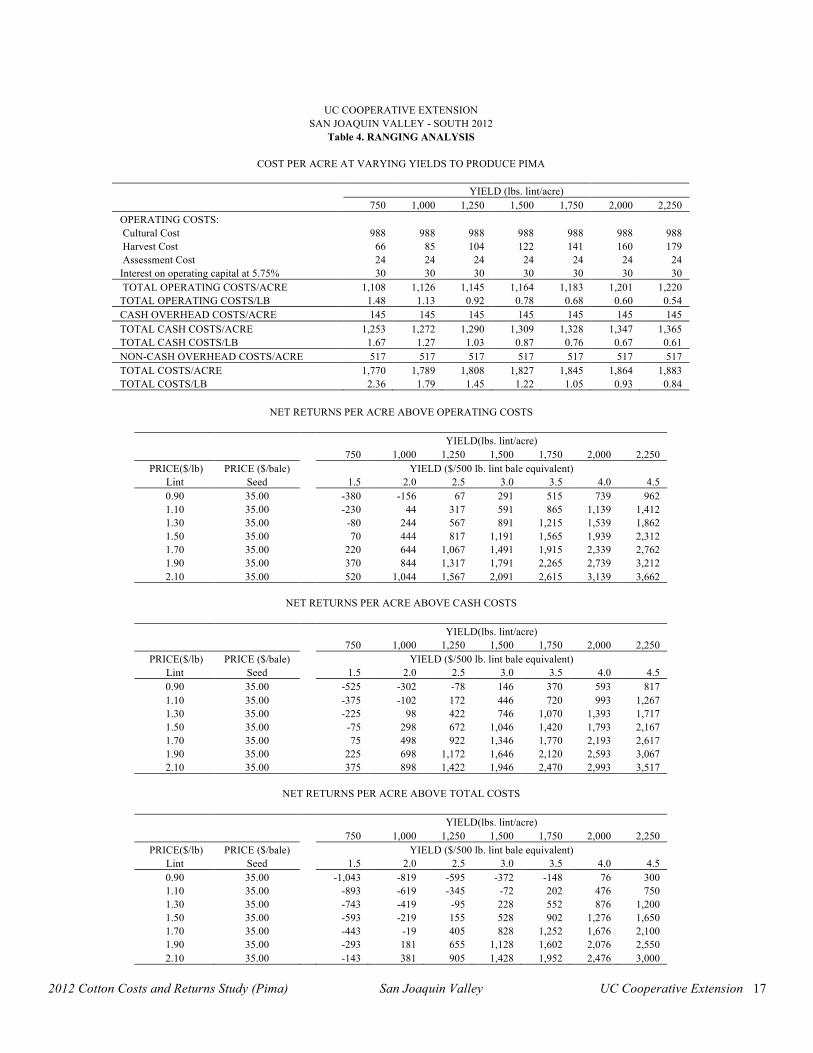
UC COOPERATIVE EXTENSION SAN JOAQUIN VALLEY - SOUTH 2012
Table 4 RANGING ANALYSIS
COST PER ACRE AT VARYING YIELDS TO PRODUCE PIMA
YIELD (lbs lintacre) 750 1000 1250 1500 1750 2000 2250
OPERATING COSTS Cultural Cost 988 988 988 988 988 988 988 Harvest Cost 66 85 104 122 141 160 179 Assessment Cost 24 24 24 24 24 24 24
Interest on operating capital at 575 30 30 30 30 30 30 30 TOTAL OPERATING COSTSACRE 1108 1126 1145 1164 1183 1201 1220
TOTAL OPERATING COSTSLB 148 113 092 078 068 060 054 CASH OVERHEAD COSTSACRE 145 145 145 145 145 145 145 TOTAL CASH COSTSACRE 1253 1272 1290 1309 1328 1347 1365 TOTAL CASH COSTSLB 167 127 103 087 076 067 061 NON-CASH OVERHEAD COSTSACRE 517 517 517 517 517 517 517 TOTAL COSTSACRE 1770 1789 1808 1827 1845 1864 1883 TOTAL COSTSLB 236 179 145 122 105 093 084
NET RETURNS PER ACRE ABOVE OPERATING COSTS
YIELD(lbs lintacre) 750 1000 1250 1500 1750 2000 2250
PRICE($lb) PRICE ($bale) YIELD ($500 lb lint bale equivalent) Lint Seed 15 20 25 30 35 40 45 090 3500 -380 -156 67 291 515 739 962 110 3500 -230 44 317 591 865 1139 1412 130 3500 -80 244 567 891 1215 1539 1862 150 3500 70 444 817 1191 1565 1939 2312 170 3500 220 644 1067 1491 1915 2339 2762 190 3500 370 844 1317 1791 2265 2739 3212 210 3500 520 1044 1567 2091 2615 3139 3662
NET RETURNS PER ACRE ABOVE CASH COSTS
YIELD(lbs lintacre) 750 1000 1250 1500 1750 2000 2250
PRICE($lb) PRICE ($bale) YIELD ($500 lb lint bale equivalent) Lint Seed 15 20 25 30 35 40 45 090 3500 -525 -302 -78 146 370 593 817 110 3500 -375 -102 172 446 720 993 1267 130 3500 -225 98 422 746 1070 1393 1717 150 3500 -75 298 672 1046 1420 1793 2167 170 3500 75 498 922 1346 1770 2193 2617 190 3500 225 698 1172 1646 2120 2593 3067 210 3500 375 898 1422 1946 2470 2993 3517
NET RETURNS PER ACRE ABOVE TOTAL COSTS
PRICE($lb) Lint 090 110 130 150 170 190 210
PRICE ($bale) Seed 3500 3500 3500 3500 3500 3500 3500
750
15 -1043
-893 -743 -593 -443 -293 -143
YIELD(lbs lintacre) 1000 1250 1500 1750
YIELD ($500 lb lint bale equivalent) 20 25 30 35
-819 -595 -372 -148 -619 -345 -72 202 -419 -95 228 552 -219 155 528 902
-19 405 828 1252 181 655 1128 1602 381 905 1428 1952
2000
40 76
476 876
1276 1676 2076 2476
2250
45 300 750
1200 1650 2100 2550 3000
2012 Cotton Costs and Returns Study (Pima) San Joaquin Valley UC Cooperative Extension 17
UC COOPERATIVE EXTENSION
SAN JOAQUIN VALLEY - SOUTH 2012
Table 5 WHOLE FARM ANNUAL EQUIPMENT INVESTMENT AND BUSINESS OVERHEAD COSTS
ANNUAL EQUIPMENT COSTS
Cash Overhead Yrs Salvage Capital
Yr Description Price Life Value Recovery Insurance Taxes Total 12 105 hp 2WD tractor 94159 10 27813 9809 490 610 10909 12 105 hp 4WD tractor 107347 10 31709 11183 558 695 12437 12 150 hp 4WD tractor 153548 10 45356 15996 799 995 17789 12 230 hp track-type 287000 10 84775 29899 1493 1859 33250 12 Boll buggy 23000 10 4067 2615 109 135 2859 12 Cultivator Roll 20 16000 5 5212 2722 85 106 2913 12 Disc - Offset 21 43877 12 6077 4494 201 250 4944 12 Disc - Stubble 18 1 59000 10 10434 6709 279 347 7335 12 Disc - Stubble 18 2 42000 10 7427 4776 198 247 5222 12 Ditcher - 8 7800 15 749 703 34 43 781 12 Harvester - 6-Row 1 557253 10 105115 62838 2659 3312 68809 12 Harvester - 6-Row 2 557253 10 105115 62838 2659 3312 68809 12 Lister - 6-Row 20 22000 12 3047 2253 101 125 2479 12 Module builder 1 40000 10 0 5117 161 200 5478 12 Module builder 2 40000 10 0 5117 161 200 5478 12 Mower - Flail 20 29558 15 2838 2666 130 162 2958 12 Pickup - 12 ton 24000 5 10756 3549 140 174 3862 12 Pickup - 34 ton 28000 5 12549 4140 163 203 4506 12 Planter - 6-Row 20 41784 15 4012 3768 184 229 4181 12 Rear Blade - 10 4500 18 299 367 19 24 410 12 Saddle Tank 300 gal 3218 5 1048 548 17 21 586 12 Spray Boom 20 3630 3 1510 847 21 26 893 12 Subsoiler - 10 26534 10 4692 3017 125 156 3299 12 Uncapper - 6-row 20 10500 10 1857 1194 50 62 1305 TOTAL 2221961 476457 247166 10834 13492 271493
60 of new cost 1333177 285874 148300 6500 8095 162896 Used to reflect a mix of new and used equipment
ANNUAL INVESTMENT COSTS
Cash Overhead Yrs Salvage Capital
Description Price Life Value Recovery Insurance Taxes Repairs Total Buildings - 2400 sqft 60000 30 0 3793 241 300 1200 5533 Fuel tanks 2-500 gallons 6514 20 651 491 29 36 130 686 Service truck 2-ton 135500 10 25000 15325 644 803 2510 19281 Shopfield tools 12000 15 1200 1080 53 66 240 1439 Siphon pipes 3x90 13496 10 0 1727 54 67 160 2008 Land 12750000 25 12750000 605625 0 127500 0 733125 TOTAL INVESTMENT 12977510 12776851 628040 1021 128772 4240 762073
ANNUAL BUSINESS OVERHEAD COSTS
Description Units Farm Unit
Price Unit
Total Cost
Liability insurance Office expense
1500 1500
acre acre
098 5000
1470 75000
2012 Cotton Costs and Returns Study (Pima) San Joaquin Valley UC Cooperative Extension 18
UC COOPERATIVE EXTENSION
SAN JOAQUIN VALLEY - SOUTH 2012
Table 6 HOURLY EQUIPMENT COSTS
COSTS PER HOUR Cash Overhead Operating
Actual Capital Lube amp Fuel Total Total Yr Description Hours Used Recovery Insurance Taxes Repairs Oper CostsHr
12 105 hp 2WD tractor 1203 483 024 030 745 2090 2835 3372 12 105 hp 4WD tractor 182 405 020 025 589 2090 2679 3130 12 150 hp 4WD tractor 758 468 023 029 767 2986 3753 4273 12 230 hp track-type 305 1401 070 087 1641 4578 6219 7777 12 Boll buggy 75 785 033 041 317 000 317 1175 12 Cultivator Roll 20 309 461 014 018 088 000 088 581 12 Disc - Offset 21 99 1287 057 072 530 000 530 1946 12 Disc - Stubble 18 1 202 1991 083 103 963 000 963 3140 12 Disc - Stubble 18 2 180 1433 060 074 693 000 693 2259 12 Ditcher - 8 45 325 016 020 122 000 122 483 12 Harvester - 6-Row 1 165 11075 469 584 8487 7963 16450 28577 12 Harvester - 6-Row 2 165 11075 469 584 8487 7963 16450 28577 12 Lister - 6-Row 20 52 814 036 045 448 000 448 1344 12 Module builder 1 150 1297 041 051 620 1029 1649 3037 12 Module builder 2 113 1535 048 060 705 1029 1734 3378 12 Mower - Flail 20 77 1227 060 075 1344 000 1344 2706 12 Pickup - 12 ton 167 533 021 026 282 686 968 1548 12 Pickup - 34 ton 167 622 024 030 312 686 998 1674 12 Planter - 6-Row 20 91 1700 083 103 840 000 840 2726 12 Rear Blade - 10 45 137 007 009 067 000 067 220 12 Saddle Tank 300 gal 576 051 002 002 000 000 000 054 12 Spray Boom 20 523 070 002 002 069 000 069 143 12 Subsoiler - 10 97 919 038 048 615 000 615 1621 12 Uncapper - 6-row 20 61 358 015 019 216 000 216 607
2012 Cotton Costs and Returns Study (Pima) San Joaquin Valley UC Cooperative Extension 19
UC COOPERATIVE EXTENSION
SAN JOAQUIN VALLEY - SOUTH 2012
Table 7 OPERATIONS WITH EQUIPMENT
Field Operation Labor Material Rate
Operation Month Tractor Implement HrsAcre acre Unit Rip fields 1X3 yrs Nov 230 hp track-type Subsoiler - 10 016 Disc 2X Nov 150 hp 4WD tractor Disc - stubble 18 032 Apply herbicide Feb 150 hp 4WD tractor Saddle tank 300 gal 012 Roundup 32 floz Spray Triflurex Mar 150 hp 4WD tractor Spray boom 20 024 Triflurex HFP 15 pt Incorporate Triflurex Mar 150 hp 4WD tractor Disc - offset 21 016 List beds Mar 150 hp 4WD tractor Lister 6-row 20 008 Make ditch Mar 150 hp 4WD tractor Ditcher - 8 002
July 150 hp 4WD tractor Ditcher - 8 002 Irrigate Mar 100 Water 1000 acin
June 100 Water 800 acin July 100 Water 600 acin Aug 100 Water 600 acin
Close ditch Mar 150 hp 4WD tractor Rear blade - 10 002 June 150 hp 4WD tractor Rear blade - 10 002 Sept 150 hp 4WD tractor Rear blade - 10 002
Cultivate - Preplant Feb 150 hp 2WD tractor Cultivator roll 20 012 Plant amp Orthene treatment Apr 150 hp 2WD tractor Planter - 6-Row 20 015 Seed (Pima) 1800 lb
Orthene 325 oz Uncap beds Apr 105 hp 2WD tractor Uncapper - 6-row 20 010 Cultivate Apr 105 hp 2WD tractor Cultivator Roll 20 012
May 105 hp 2WD tractor Cultivator Roll 20 012 June 105 hp 2WD tractor Cultivator Roll 20 012
Fertilize - Sidedress (UN32) May 105 hp 2WD tractor 017 UN32 lbN 15000 lb N Fertilizer rental 100 acre
Weed Control - Over-the-top (Staple) May 105 hp 2WD tractor Saddle Tank 300 gal 024 Staple 038 floz Spray Boom 20
Weed control - Directlayby (Shark) June 105 hp 2WD tractor Saddle Tank 300 gal 024 Shark EW 100 floz Spray Boom 20
Insect control - Lygus (Carbine Zephyr) June Carbine 50WG 250 oz Zephyr 800 floz Air application 100 acre
Insect control - Lygus (Leverage) July Leverage 27 500 floz Air application 100 acre
Apply growth regulator amp KNO3 July Mepex Gin Out 200 floz Air application 100 acre
Fertilize - Water run (UN32) July UN32 lbN 3000 lb N Insect control - Aphid whitefly (Assail) Aug Assail 70WP 110 oz
Air application 100 acre Defoliate cotton - 2X Oct Finish 6 Pro 200 pint
Ginstar 1000 floz Air application 100 acre
Oct Defol 5 100 gal Shark EW 150 floz Air application 100 acre
PCA Oct PCAconsultant fee 100 acre Harvest - 2X Nov Harvester 6-Row 1 024
Nov Harvester 6-Row 2 024
2012 Cotton Costs and Returns Study (Pima) San Joaquin Valley UC Cooperative Extension 20
UC COOPERATIVE EXTENSION
SAN JOAQUIN VALLEY - SOUTH 2012
Table 7 CONTINUED
Operation Field Labor Material Rate Operation Month Tractor Implement HrsAcre acre Unit Boll buggy - 2X Nov 150 hp 4WD tractor Boll buggy 012 Build module (tractor 1) - 2X Nov 105 hp 2WD tractor 024 Build module Nov Module builder 1 015
Nov Module builder 2 015 Build module (tractor 2) Nov 105 hp 4WD Tractor 018 Assessments Nov CA Cotton Growers 300 bale
Natl Cot Council 300 bale Pink Bollworm Proj 300 bale USDA Classing Fee 300 bale Supima Association 300 bale
Chop stalks (post-harvest) Nov 105 hp 2WD tractor Mower - Flail 20 012 Disc residue - 2X (post-harvest) Nov 230 hp track-type Disc - Stubble 18 029 Pickup truck use Nov Pickup - 34 ton 027
Nov Pickup - 12 ton 027
2012 Cotton Costs and Returns Study (Pima) San Joaquin Valley UC Cooperative Extension 21

UC COOPERATIVE EXTENSION
SAN JOAQUIN VALLEY - SOUTH 2012
Table 7 CONTINUED
Operation Field Labor Material Rate Operation Month Tractor Implement HrsAcre acre Unit Boll buggy - 2X Nov 150 hp 4WD tractor Boll buggy 012 Build module (tractor 1) - 2X Nov 105 hp 2WD tractor 024 Build module Nov Module builder 1 015
Nov Module builder 2 015 Build module (tractor 2) Nov 105 hp 4WD Tractor 018 Assessments Nov CA Cotton Growers 300 bale
Natl Cot Council 300 bale Pink Bollworm Proj 300 bale USDA Classing Fee 300 bale Supima Association 300 bale
Chop stalks (post-harvest) Nov 105 hp 2WD tractor Mower - Flail 20 012 Disc residue - 2X (post-harvest) Nov 230 hp track-type Disc - Stubble 18 029 Pickup truck use Nov Pickup - 34 ton 027
Nov Pickup - 12 ton 027
2012 Cotton Costs and Returns Study (Pima) San Joaquin Valley UC Cooperative Extension 21