olive oil - cost & return studies - uc davis
TRANSCRIPT

OO-NC/CC-11
UNIVERSITY OF CALIFORNIA COOPERATIVE EXTENSION
2011
SAMPLE COSTS TO ESTABLISH A MEDIUM-DENSITY OLIVE ORCHARD AND PRODUCE BOTTLED
OLIVE OIL
NORTH AND CENTRAL COASTS
Paul M. Vossen UC Cooperative Extension Farm Advisor, Sonoma & Marin Counties Rachel B. Elkins UC Cooperative Extension Farm Advisor, Lake & Mendocino Counties Mary L. Bianchi UC Cooperative Extension Farm Advisor, San Luis Obispo & Santa Barbara Counties Karen M. Klonsky UC Cooperative Extension Economist, Department of Agricultural and Resource
Economics, UC Davis Pete Livingston UC Cooperative Extension Staff Research Associate, Department of Agricultural and
Resource Economics, UC Davis Richard L. De Moura UC Cooperative Extension Staff Research Associate, Department of Agricultural and
Resource Economics, UC Davis

2011 Olive Oil Costs and Returns Study North Coast, Central Coast UC Cooperative Extension 2
INTRODUCTION The sample costs to establish a medium-density olive orchard and produce olives for oil including bottling on the North and Central Coasts of California are presented in this study. The study includes assumptions and costs for establishing an orchard and for producing olives and bottling oil after establishment. This study is intended as a guide only, and can be used to make production decisions, determine potential returns, prepare budgets and evaluate production loans. Practices described are based on those production procedures currently being used to grow olives for oil on the North and Central Coasts. Sample costs for labor, materials, equipment and custom services are based on current figures. Some costs and practices presented in this study may not be applicable to your situation. A blank column, “Your Costs”, is provided in Tables 2 and 3 to enter your costs. The hypothetical farm operation, production practices, overhead, and calculations are described under the assumptions. For additional information or an explanation of the calculations used in the study call the Department of Agricultural and Resource Economics, University of California, Davis, 530-752-3589.
STUDY CONTENTS
INTRODUCTION …………………………………………………………………………………………….. 2 ASSUMPTIONS ………………………………………………………………………………………………. 3 Establishment Cultural Practices and Material Inputs …………………………………………………………… 4 Production Cultural Practices and Material Inputs ………………………………………………………………. 5 Cash Overhead Costs…………………………………………………………………………………….……….. 7 Non-Cash Overhead Costs…………………………………………………………………….…..……………… 8 REFERENCES ………………………………………………………………………………………………… 10 Table 1. COSTS PER ACRE TO ESTABLISH A MEDIUM-DENSITY OLIVE ORCHARD …...……………. 11 Table 2. COSTS PER ACRE TO PRODUCE BOTTLED OLIVE OIL.....……………………………………… 13 Table 3. COSTS AND RETURNS PER ACRE TO PRODUCE BOTTLED OLIVE OIL …………………...… 14 Table 4. MONTHLY PER ACRE CASH COSTS – BOTTLED OLIVE OIL…………………………………… 15 Table 5. RANGING ANALYSIS ………………………………………………………………………….….….. 16 Table 6. WHOLE FARM EQUIPMENT, INVESTMENT, AND BUSINESS OVERHEAD COSTS ………..... 17 Table 7. HOURLY EQUIPMENT COSTS ………………………………………………………………………. 17 Table 8. COSTS AND RETURNS/BREAKEVEN ANALYSIS……………………………………………….… 18 Table 9. OPERATIONS WITH EQUIPMENT AND MATERIALS………………………….……………..….. 19 Acknowledgements. Appreciation is expressed to those growers and cooperators who provided information for this study. Sample Cost of Production studies for current and archived commodities are available and can be downloaded from the department website http://coststudies.ucdavis.edu, requested through the Department of Agricultural and Resource Economics, UC Davis or obtained from selected county UC Cooperative Extension offices.
The University of California does not discriminate in any of its policies, procedures or practices. The university is an affirmative action/equal opportunity employer.

2011 Olive Oil Costs and Returns Study North Coast, Central Coast UC Cooperative Extension 3
ASSUMPTIONS
The following assumptions pertain to sample costs to establish a medium-density, conventionally-farmed olive orchard and produce bottled olive oil on the North and Central Coasts of California. Some costs, practices, and materials may not be applicable to your situation nor used every year. Additional practices not indicated may be needed. Establishment and cultural practices vary by grower and region, and variations can be significant. These costs are on an annual, per acre basis. The use of trade names and cultural practices in this report does not constitute an endorsement or recommendation by the University of California nor is any criticism implied by omission of other similar products or cultural practices. Land. The hypothetical farm consists of 15 acres of rolling hillside land. An olive orchard is established on 10 acres and the remaining five acres are used for roads, the irrigation system, unused land, and farmstead. Over all the counties included in the study areas, land values used for growing olives range from $9,000 - $50,000 per acre. In this study property costs $15,000 per acre or $22,500 per producing acre. Trees. Specialty olive cultivars used in this study are Frantoio, Leccino, and Pendolino, which are typical of the coastal medium-density system. Other cultivars planted are: Coratina, Maurino, Mission, Arbequina, and Koroneiki. Depending on size and number of trees ordered, prices range from around $4.00 for “tublets” to $10.00 for one gallon trees. The cost of trees for this study is $5.00 per tree. A more inclusive list of oil producing varieties and their characteristics can be found in the Olive Production Manual. Olive oil cultivars will produce between 30 to 50 gallons of oil per ton. The trees are planted on 9 X 18 foot spacing, 269 trees per acre. Olive trees have a long production life if they are well maintained. The life of the orchard at the time of planting in this study is estimated to be 40 years. Irrigation. The water cost for irrigation is the pumping charge. The cost per acre-foot for water will vary by grower in the region depending on well characteristics and other irrigation factors. In this study, water is calculated to cost $16.50 per acre-inch. Annual irrigation rates, shown in Table A, increase each year as the orchard matures. The trees are irrigated from May through October. The amount of water applied can vary significantly depending on rainfall, soil depth, soil water holding capacity, crop load, and if there is a cover crop present. Young trees require more water to increase vegetative growth and get the trees to fill their allotted space. Mature trees should be watered less to moderate vigor and enhance oil flavor. Because the orchard is planted on rolling hills and unlevel, water is delivered to the orchard through a drip irrigation system. Each tree is watered by two, one-gallon per hour emitters set three feet on each side of the trees. The drip tubing can be raised off the ground by placing it in the trees. Labor. Labor rates of $20.03 per hour for machine operators and $12.50 for general labor includes payroll overhead of 36%. The basic hourly costs for labor are $14.73 for machine operators and $9.19 for general labor. The overhead includes the employers’ share of federal and California state payroll taxes, workers' compensation insurance for orchards (code 0016), and a percentage for other possible benefits. Workers’ compensation insurance costs will vary among growers, but for this study the cost is based upon the average industry final rate as of January 2011 (California Department of Insurance). Labor for operations involving machinery are 20% higher than the operation time given in Table 2 to account for the extra labor involved in equipment set up, moving, maintenance, work breaks, and field repair.
Table A. Annual Water Use Year Acre-inches 1 4 2 8 3 12 4 16 5 20 6 24 7 28 8 32 9+ (Mature) 20
2011 Olive Oil Costs and Returns Study North Coast, Central Coast UC Cooperative Extension 4
ESTABLISHMENT CULTURAL PRACTICES AND MATERIAL INPUTS
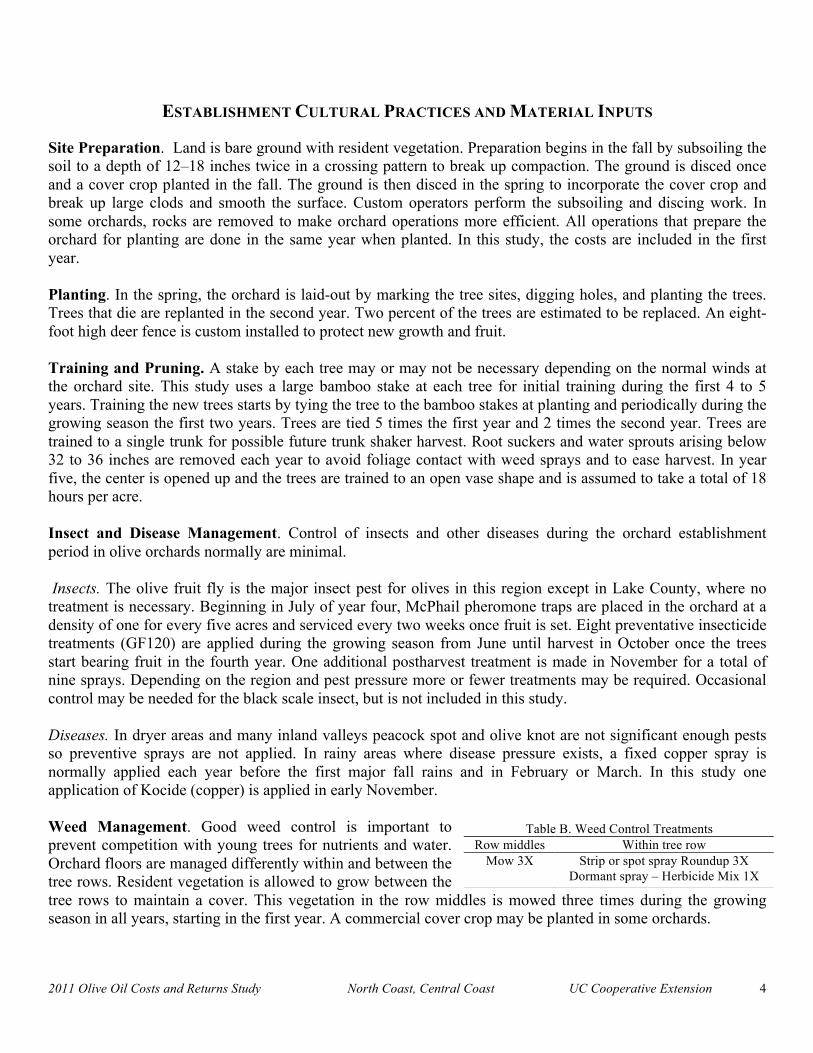
Site Preparation. Land is bare ground with resident vegetation. Preparation begins in the fall by subsoiling the soil to a depth of 12–18 inches twice in a crossing pattern to break up compaction. The ground is disced once and a cover crop planted in the fall. The ground is then disced in the spring to incorporate the cover crop and break up large clods and smooth the surface. Custom operators perform the subsoiling and discing work. In some orchards, rocks are removed to make orchard operations more efficient. All operations that prepare the orchard for planting are done in the same year when planted. In this study, the costs are included in the first year. Planting. In the spring, the orchard is laid-out by marking the tree sites, digging holes, and planting the trees. Trees that die are replanted in the second year. Two percent of the trees are estimated to be replaced. An eight-foot high deer fence is custom installed to protect new growth and fruit. Training and Pruning. A stake by each tree may or may not be necessary depending on the normal winds at the orchard site. This study uses a large bamboo stake at each tree for initial training during the first 4 to 5 years. Training the new trees starts by tying the tree to the bamboo stakes at planting and periodically during the growing season the first two years. Trees are tied 5 times the first year and 2 times the second year. Trees are trained to a single trunk for possible future trunk shaker harvest. Root suckers and water sprouts arising below 32 to 36 inches are removed each year to avoid foliage contact with weed sprays and to ease harvest. In year five, the center is opened up and the trees are trained to an open vase shape and is assumed to take a total of 18 hours per acre. Insect and Disease Management. Control of insects and other diseases during the orchard establishment period in olive orchards normally are minimal. Insects. The olive fruit fly is the major insect pest for olives in this region except in Lake County, where no treatment is necessary. Beginning in July of year four, McPhail pheromone traps are placed in the orchard at a density of one for every five acres and serviced every two weeks once fruit is set. Eight preventative insecticide treatments (GF120) are applied during the growing season from June until harvest in October once the trees start bearing fruit in the fourth year. One additional postharvest treatment is made in November for a total of nine sprays. Depending on the region and pest pressure more or fewer treatments may be required. Occasional control may be needed for the black scale insect, but is not included in this study. Diseases. In dryer areas and many inland valleys peacock spot and olive knot are not significant enough pests so preventive sprays are not applied. In rainy areas where disease pressure exists, a fixed copper spray is normally applied each year before the first major fall rains and in February or March. In this study one application of Kocide (copper) is applied in early November. Weed Management. Good weed control is important to prevent competition with young trees for nutrients and water. Orchard floors are managed differently within and between the tree rows. Resident vegetation is allowed to grow between the tree rows to maintain a cover. This vegetation in the row middles is mowed three times during the growing season in all years, starting in the first year. A commercial cover crop may be planted in some orchards.
Table B. Weed Control Treatments Row middles Within tree row
Mow 3X Strip or spot spray Roundup 3X Dormant spray – Herbicide Mix 1X

2011 Olive Oil Costs and Returns Study North Coast, Central Coast UC Cooperative Extension 5
An application of Roundup (or generic equivalent) is applied to a six foot wide strip (3 ft. on each side of the trees) immediately after planting to kill germinating weeds. Two more Roundup sprays are made during the growing season. Spot and/or strip treatments with Roundup are usually necessary within the tree row to clean up later emerging weeds. (Table B). Fertilization. Nitrogen is the major nutrient required for proper tree growth and optimum yields. Young trees receive liquid nitrogen fertilizer three to four times per growing season (March – June) through the drip irrigation system at increasing rates depending on the age and size of the trees. Potassium (K) is sometimes needed but is not included in this study. Table C shows rates of actual nitrogen; rate of formulated material depends on the percentage of actual nitrogen in each product. Establishment Cost. The establishment cost is the sum of cash costs for land preparation, trees, planting, production expenses, and cash overhead for growing olive trees until oil is produced, minus any returns. In this study, production begins the fourth year. The Total Accumulated Net Cash Cost in the fourth year shown in Table 1 represents the establishment cost per acre. For this study, the cost is $7,151 per acre or $71,510 for the 10 acres planted to olives. Establishment cost normally is amortized over the remaining years of production. Establishment cost is used to determine the non-cash overhead, orchard capital recovery expense for production years.
PRODUCTION CULTURAL PRACTICES AND MATERIAL INPUTS Pruning. In year 5 or when the trees reach greater than 6 feet wide, the central leader is sawed out. In years 6 to 9, one or two internal branches are removed each year to gradually form an open vase shape with 3 to 4 main scaffold branches. Normal pruning is conducted in April on trees that have a heavy bloom (“ON” year) and are expected to have a heavy crop by keeping the centers open and thinning out tall upright branches to an outward facing lateral. Pruning is assumed to take 36 hours per acre. Maximum tree height is kept at 14 feet. No pruning is conducted on “OFF” year trees with light bloom; consequently average pruning over the two years is 18 hours per acre per year. Prunings are placed into the row middles and shredded with an additional mowing. Fertilization. Mature trees receive more N in “ON” years with heavy bloom and heavy crop set (100 lbs of actual N per acre) and much less (40 lbs of actual N per acre) in years with light bloom and low crop load (average 70 lbs per acre per year). The fertilizer is applied to the trees through the drip irrigation system from March through October. Pest Management. Consult the UC IPM Pest Management Guidelines for Olives and the Olive Production Manual for specific pesticide choices and rates. For more information on pest identification, monitoring and management, visit the UC IPM website at http://www.ipm.ucdavis.edu/PMG/crops-agriculture.html. Written recommendations are required for many pesticides and are made by licensed pest control advisers. Contact the local county agricultural commissioner's office for information and pesticide use permits. Contact your county UC farm advisor for additional production information. Weed Control. Weeds in mature orchards are controlled using a combination of herbicides and mowing. Weeds within the tree rows are controlled with a mixture of residual pre-emergent herbicides (Goal, Surflan) and a contact herbicide (Roundup) in the fall or winter. During the growing season, three strip or spot sprays are made within the tree row. In addition to shredding the prunings, the row centers are mowed three times during the spring and summer.
Table C. Nitrogen Applied Year lbs N/acre
1 40-50 2 50-60 3 60-70 4 70-80 5 80-90
6-8 100 9+ 40-100
2011 Olive Oil Costs and Returns Study North Coast, Central Coast UC Cooperative Extension 6
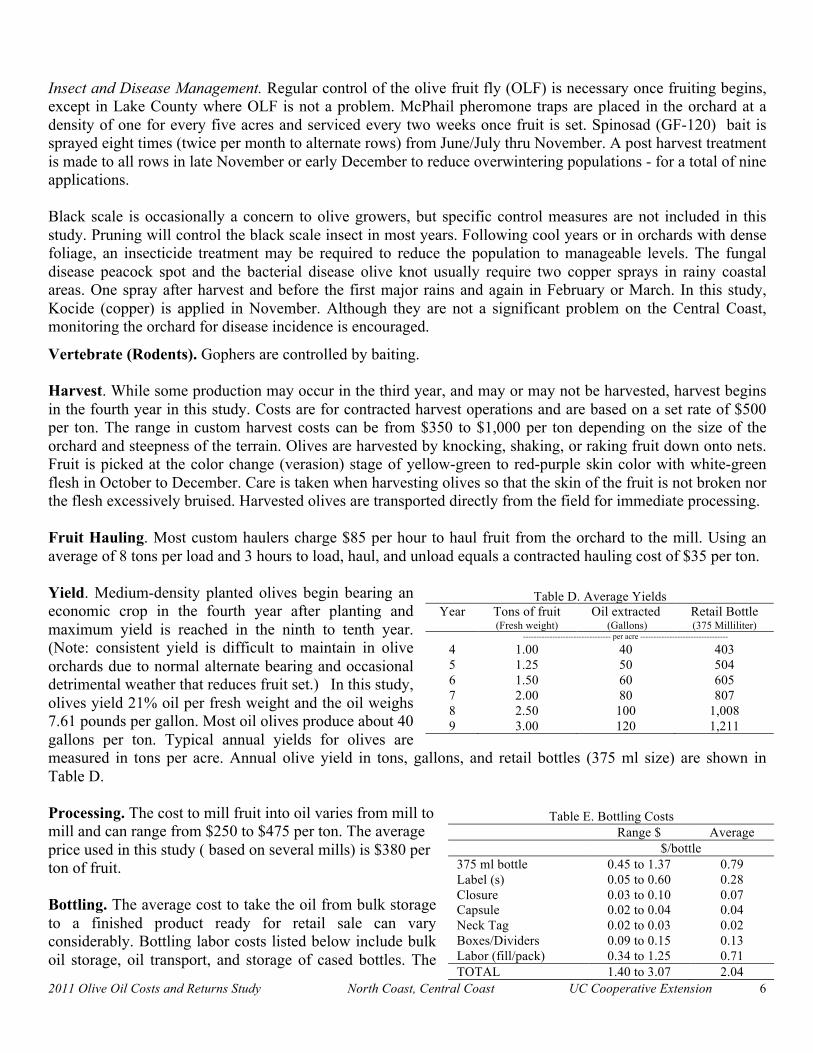
Insect and Disease Management. Regular control of the olive fruit fly (OLF) is necessary once fruiting begins, except in Lake County where OLF is not a problem. McPhail pheromone traps are placed in the orchard at a density of one for every five acres and serviced every two weeks once fruit is set. Spinosad (GF-120) bait is sprayed eight times (twice per month to alternate rows) from June/July thru November. A post harvest treatment is made to all rows in late November or early December to reduce overwintering populations - for a total of nine applications. Black scale is occasionally a concern to olive growers, but specific control measures are not included in this study. Pruning will control the black scale insect in most years. Following cool years or in orchards with dense foliage, an insecticide treatment may be required to reduce the population to manageable levels. The fungal disease peacock spot and the bacterial disease olive knot usually require two copper sprays in rainy coastal areas. One spray after harvest and before the first major rains and again in February or March. In this study, Kocide (copper) is applied in November. Although they are not a significant problem on the Central Coast, monitoring the orchard for disease incidence is encouraged.
Vertebrate (Rodents). Gophers are controlled by baiting. Harvest. While some production may occur in the third year, and may or may not be harvested, harvest begins in the fourth year in this study. Costs are for contracted harvest operations and are based on a set rate of $500 per ton. The range in custom harvest costs can be from $350 to $1,000 per ton depending on the size of the orchard and steepness of the terrain. Olives are harvested by knocking, shaking, or raking fruit down onto nets. Fruit is picked at the color change (verasion) stage of yellow-green to red-purple skin color with white-green flesh in October to December. Care is taken when harvesting olives so that the skin of the fruit is not broken nor the flesh excessively bruised. Harvested olives are transported directly from the field for immediate processing. Fruit Hauling. Most custom haulers charge $85 per hour to haul fruit from the orchard to the mill. Using an average of 8 tons per load and 3 hours to load, haul, and unload equals a contracted hauling cost of $35 per ton. Yield. Medium-density planted olives begin bearing an economic crop in the fourth year after planting and maximum yield is reached in the ninth to tenth year. (Note: consistent yield is difficult to maintain in olive orchards due to normal alternate bearing and occasional detrimental weather that reduces fruit set.) In this study, olives yield 21% oil per fresh weight and the oil weighs 7.61 pounds per gallon. Most oil olives produce about 40 gallons per ton. Typical annual yields for olives are measured in tons per acre. Annual olive yield in tons, gallons, and retail bottles (375 ml size) are shown in Table D. Processing. The cost to mill fruit into oil varies from mill to mill and can range from $250 to $475 per ton. The average price used in this study ( based on several mills) is $380 per ton of fruit. Bottling. The average cost to take the oil from bulk storage to a finished product ready for retail sale can vary considerably. Bottling labor costs listed below include bulk oil storage, oil transport, and storage of cased bottles. The
Table D. Average Yields Year Tons of fruit
(Fresh weight) Oil extracted
(Gallons) Retail Bottle (375 Milliliter)
--------------------------------- per acre ---------------------------------
4 1.00 40 403 5 1.25 50 504 6 1.50 60 605 7 2.00 80 807 8 2.50 100 1,008 9 3.00 120 1,211
Table E. Bottling Costs Range $ Average $/bottle 375 ml bottle 0.45 to 1.37 0.79 Label (s) 0.05 to 0.60 0.28 Closure 0.03 to 0.10 0.07 Capsule 0.02 to 0.04 0.04 Neck Tag 0.02 to 0.03 0.02 Boxes/Dividers 0.09 to 0.15 0.13 Labor (fill/pack) 0.34 to 1.25 0.71 TOTAL 1.40 to 3.07 2.04
2011 Olive Oil Costs and Returns Study North Coast, Central Coast UC Cooperative Extension 7
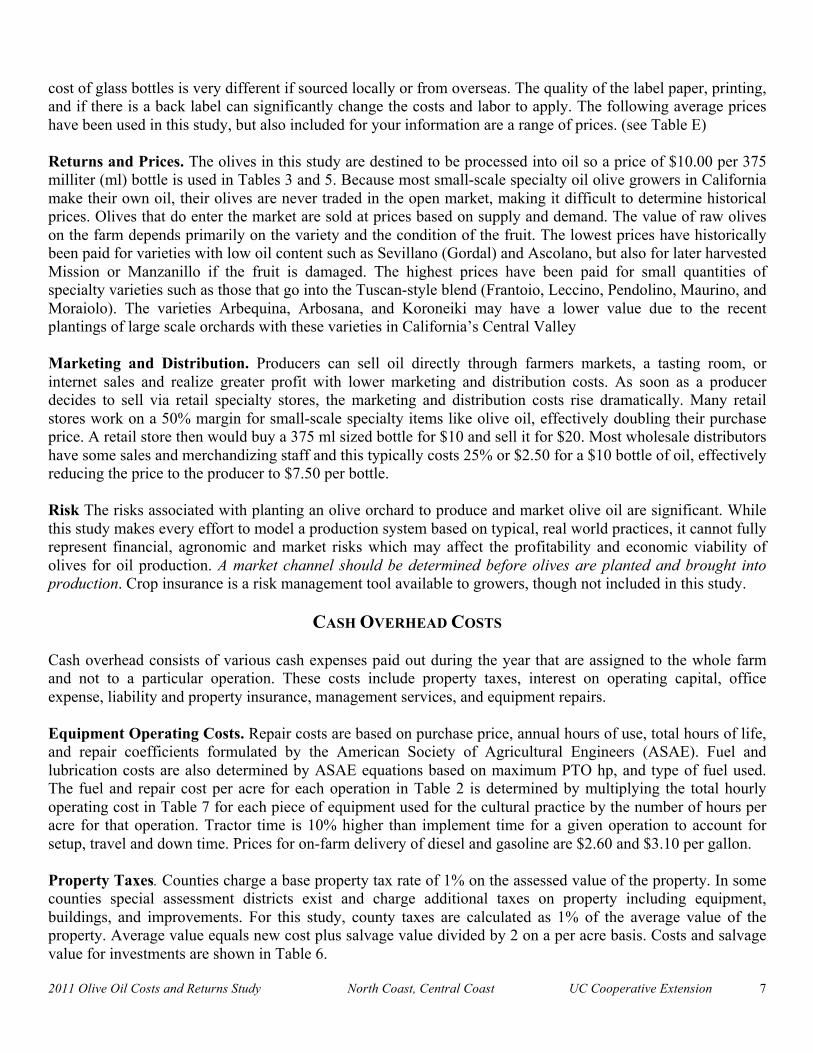
cost of glass bottles is very different if sourced locally or from overseas. The quality of the label paper, printing, and if there is a back label can significantly change the costs and labor to apply. The following average prices have been used in this study, but also included for your information are a range of prices. (see Table E) Returns and Prices. The olives in this study are destined to be processed into oil so a price of $10.00 per 375 milliter (ml) bottle is used in Tables 3 and 5. Because most small-scale specialty oil olive growers in California make their own oil, their olives are never traded in the open market, making it difficult to determine historical prices. Olives that do enter the market are sold at prices based on supply and demand. The value of raw olives on the farm depends primarily on the variety and the condition of the fruit. The lowest prices have historically been paid for varieties with low oil content such as Sevillano (Gordal) and Ascolano, but also for later harvested Mission or Manzanillo if the fruit is damaged. The highest prices have been paid for small quantities of specialty varieties such as those that go into the Tuscan-style blend (Frantoio, Leccino, Pendolino, Maurino, and Moraiolo). The varieties Arbequina, Arbosana, and Koroneiki may have a lower value due to the recent plantings of large scale orchards with these varieties in California’s Central Valley Marketing and Distribution. Producers can sell oil directly through farmers markets, a tasting room, or internet sales and realize greater profit with lower marketing and distribution costs. As soon as a producer decides to sell via retail specialty stores, the marketing and distribution costs rise dramatically. Many retail stores work on a 50% margin for small-scale specialty items like olive oil, effectively doubling their purchase price. A retail store then would buy a 375 ml sized bottle for $10 and sell it for $20. Most wholesale distributors have some sales and merchandizing staff and this typically costs 25% or $2.50 for a $10 bottle of oil, effectively reducing the price to the producer to $7.50 per bottle. Risk The risks associated with planting an olive orchard to produce and market olive oil are significant. While this study makes every effort to model a production system based on typical, real world practices, it cannot fully represent financial, agronomic and market risks which may affect the profitability and economic viability of olives for oil production. A market channel should be determined before olives are planted and brought into production. Crop insurance is a risk management tool available to growers, though not included in this study.
CASH OVERHEAD COSTS
Cash overhead consists of various cash expenses paid out during the year that are assigned to the whole farm and not to a particular operation. These costs include property taxes, interest on operating capital, office expense, liability and property insurance, management services, and equipment repairs. Equipment Operating Costs. Repair costs are based on purchase price, annual hours of use, total hours of life, and repair coefficients formulated by the American Society of Agricultural Engineers (ASAE). Fuel and lubrication costs are also determined by ASAE equations based on maximum PTO hp, and type of fuel used. The fuel and repair cost per acre for each operation in Table 2 is determined by multiplying the total hourly operating cost in Table 7 for each piece of equipment used for the cultural practice by the number of hours per acre for that operation. Tractor time is 10% higher than implement time for a given operation to account for setup, travel and down time. Prices for on-farm delivery of diesel and gasoline are $2.60 and $3.10 per gallon. Property Taxes. Counties charge a base property tax rate of 1% on the assessed value of the property. In some counties special assessment districts exist and charge additional taxes on property including equipment, buildings, and improvements. For this study, county taxes are calculated as 1% of the average value of the property. Average value equals new cost plus salvage value divided by 2 on a per acre basis. Costs and salvage value for investments are shown in Table 6.

2011 Olive Oil Costs and Returns Study North Coast, Central Coast UC Cooperative Extension 8
Interest On Operating Capital. Interest on operating capital is based on cash operating costs and is calculated monthly until harvest at a nominal rate of 5.75% per year. A nominal interest rate is the typical rate for borrowed funds. Management. Wages for management are not included in this study. Any return above total costs is considered a return to management. Insurance. Insurance for farm investments vary depending on the assets included and the amount of coverage. Property insurance provides coverage for property loss and is charged at 0.775% of the average value of the assets over their useful life. Liability insurance covers accidents on the farm and costs $477 for the farm. Office Expense. Office and business expenses are estimated at $1,500 annually. These expenses include office supplies, telephones, bookkeeping, accounting, legal fees, etc. Sanitation Services. Sanitation services provide portable toilets for the orchard and cost the farm $314 annually. The cost includes a single toilet, delivery and 3 months of weekly service.
NON-CASH OVERHEAD COSTS
Non-cash overhead is calculated as the capital recovery cost for equipment and other farm investments.
Capital Recovery Costs. Capital recovery cost is the annual depreciation and interest costs for a capital investment. It is the amount of money required each year to recover the difference between the purchase price and salvage value (unrecovered capital). It is equivalent to the annual payment on a loan for the investment with the down payment equal to the discounted salvage value. This is a more complex method of calculating ownership costs than straight-line depreciation and opportunity costs, but more accurately represents the annual costs of ownership because it takes the time value of money into account (Boehlje and Eidman). The formula for the calculation of the annual capital recovery costs is ((Purchase Price – Salvage Value) x (Capital Recovery Factor)) + (Salvage Value x Interest Rate). Salvage Value. Salvage value is an estimate of the remaining value of an investment at the end of its useful life. For farm machinery (tractors and implements) the remaining value is a percentage of the new cost of the investment (Boehlje and Eidman). The percent remaining value is calculated from equations developed by the American Society of Agricultural Engineers (ASAE) based on equipment type and years of life. The life in years is estimated by dividing the wear out life, as given by ASAE, by the annual hours of use in this operation. For other investments including irrigation systems, buildings, and miscellaneous equipment, the value at the end of its useful life is zero. The salvage value for land is the purchase price. Capital Recovery Factor. Capital recovery factor is the amortization factor or annual payment whose present value at compound interest is 1. The amortization factor is a table value that corresponds to the interest rate used and the life of the machine. Interest Rate. The interest rate of 4.75% is used to calculate capital recovery cost is the effective long-term interest rate in January 2011. It is used to reflect the long-term realized rate of return to these specialized resources that can only be used effectively in the agricultural sector. In other words, the next best alternative use for these resources is in another agricultural enterprise.

2011 Olive Oil Costs and Returns Study North Coast, Central Coast UC Cooperative Extension 9
Irrigation System. The cost of the irrigation system includes re-casing the existing 6-inch well, installation of a submersible 10 hp pump, control valves, electrical panel, filters, mainlines, laterals, and drip tubing with emitters. Pumping costs are based on delivering 20-acre inches to the orchard from a 300-foot well, pumping from a 150 foot depth and 30 pounds per square inch (psi) operating pressure. The irrigation system is installed and completed before the trees are planted. The pump, filter station, and mainlines have an expected useful life of 40 years. The life of the drip irrigation lines and emitters is estimated at 10 years. The irrigation system is considered an improvement to the property and is shown in the capital recovery or investment sections of the tables. Building. Metal building on a cement slab. Pruning Tools. Two electric pole (chainsaw type) pruners, five hand saws and five hand pruning shears. Land. See Land paragraph on page 3. Establishment Costs. See Establishment Cost paragraph on page 5. Equipment. Farm equipment is purchased new or used, but the study shows the current purchase price for new equipment. The new purchase price is adjusted to 60% to indicate a mix of new and used equipment. Equipment costs are composed of three parts: non-cash overhead, cash overhead, and operating costs. Both of the overhead factors have been discussed in previous sections. The operating costs consist of repairs, fuel, and lubrication and are discussed under operating costs. Table Values. Due to rounding, the totals may be slightly different from the sum of the components.

2011 Olive Oil Costs and Returns Study North Coast, Central Coast UC Cooperative Extension 10
REFERENCES
American Society of Agricultural Engineers. 1994. American Society of Agricultural Engineers Standards
Yearbook. Russell H. Hahn and Evelyn E. Rosentreter (ed.) St. Joseph, MO. 41st edition.
Boehlje, Michael D., and Vernon R. Eidman. 1984. Farm Management. John Wiley and Sons. New York, NY California Chapter of American Society of Farm Managers and Rural Appraisers. 2010 Trends in Agricultural
Land and Lease Values. California Chapter of Farm Managers and Rural Appraisers, Woodbridge, CA. Sibbett, G. Steven and Joseph Connell. 1993. Producing Olive Oil in California. Pub. 21516. University of
California, Division of Agriculture and Natural Resources. Oakland, CA. Statewide IPM Project. 2009. UC Pest Management Guidelines, Olive. In M. L. Flint (ed.) UC IPM pest
management guidelines. Pub. 3339. IPM Education and Publ. University of California, Agriculture and Natural Resources. Oakland, CA. http://www.ipm.ucdavis.edu/IPMPROJECT/pestmgmt.html. Internet accessed June, 2010.
University of California. 1995. Olive Production Manual. Pub. 3353. University of California, Division of
Agriculture and Natural Resources. Oakland, CA. Vossen, Paul M., Joseph H. Connell, William H. Krueger, Karen M. Klonsky, and Pete Livingston. 2008.
Sample Costs to Establish a Super-MEDIUM-DENSITY Olive Orchard and Produce Olive Oil – Sacramento Valley. University of California, Cooperative Extension. Department of Agricultural and Resource Economics. Davis, CA.
Vossen, Paul, Karen Klonsky, and Richard L. De Moura. 2001. Sample Costs to Establish an Olive Orchard
and Produce Olive Oil – Central Coast of California. University of California, Cooperative Extension. Department of Agricultural and Resource Economics. Davis, CA.
_________________________________
For information concerning the above or other University of California publications, contact UC DANR Communications Services at 1-800-994-8849, online at www.ucop.edu, or your local county UC Cooperative Extension office.

2011 Olive Oil Costs and Returns Study North Coast, Central Coast UC Cooperative Extension
11
UC COOPERATIVE EXTENSION
Table 1. COSTS PER ACRE TO ESTABLISH A MEDIUM-DENSITY OLIVE OIL ORCHARD NORTH and CENTRAL COASTS 2011
Cost Per Acre
Year: 1st 2nd 3rd 4th Tons: 1.00
Gallons: 40.00 Bottles (375 ml): 403.00
Planting Costs: Land Prep: Subsoil 12 - 18" 250 Land Prep: Plant Cover Crop 38 Land Prep: Disc Cover Crop 34 Land Prep: Finish Disc 2X 24 Plant: Mark, Plant, Stake, Tie (labor, bamboo stakes, ties) 511 Plant: Add Tree Protectors (labor & milk cartons) 91 11 Tree: 269 per acre @ $5 per tree 1,345 30 Irrigation: Install Drip Tape (included in Irrigation Overhead) 0 Install Deer Fence (labor & materials) 180 TOTAL PLANTING COSTS 2,473 41 Cultural Costs: Irrigate: (water & labor) 74 146 305 404 Fertilize: through drip (UN32) 52 59 67 67 Train: Sucker, Tie, Prune 13 19 19 25 Weed: Mow Middles 3X 25 25 25 25 Weed: Strip Spray 3X (Roundup) 86 86 86 86 Vertebrate: Gophers (bait) 24 24 24 24 Weed: Residual (Surflan, Goal, Roundup) 86 86 86 86 Prune: Shred Prunings 8 8 Insect: Pheromone (McPhail Traps) 24 Insect: Olive Fruit Fly (GF120) 9X 221 Disease: Peacock, Olive Knot (Kocide) 42 Pickup Use 114 114 114 114 ATV Use 96 96 96 96 TOTAL CULTURAL COSTS 568 654 829 1,220 Harvest Costs: Assisted Hand Pick, Olives 500 Haul Olives 35 Process Olives 380 Bottle, Label, Store 822 Marketing; Oil 1,008 TOTAL HARVEST COSTS 2,745 Interest On Operating Capital @ 5.75% 109 15 14 31 TOTAL OPERATING COSTS/ACRE 3,151 710 842 3,995 Cash Overhead Costs: Liability Insurance 47 47 47 47 Office Expense 150 150 150 150 Sanitation (portable toilets) 31 31 31 31 Property Taxes 282 278 278 285 Property Insurance 44 41 41 46 Investment Repairs 68 68 68 68 TOTAL CASH OVERHEAD COSTS 624 616 616 628 TOTAL CASH COSTS/ACRE 3,775 1,326 1,458 4,623 INCOME/ACRE FROM PRODUCTION 4,030 NET CASH COSTS/ACRE FOR THE YEAR 3,775 1,326 1,458 593 ACCUMULATED NET CASH COSTS/ACRE 3,775 5,100 6,558 7,151

2011 Olive Oil Costs and Returns Study North Coast, Central Coast UC Cooperative Extension
12
UC COOPERATIVE EXTENSION
Table 1. continued Cost Per Acre
Year: 1st 2nd 3rd 4th Bottles (375 ml): 403.00
Non-Cash Overhead Costs (Capital Recovery): Shop Buildings 55 55 55 55 Fuel Tanks (gravity feed) 49 49 49 49 Land 1,069 1,069 1,069 1,069 Irrigation System 98 98 98 98 Pruning Tools 12 12 12 12 Equipment 680 595 595 692 TOTAL NON-CASH OVERHEAD 1,964 1,879 1,879 1,976 TOTAL COST/ACRE FOR THE YEAR 5,739 3,204 3,337 6,599 INCOME/ACRE FROM PRODUCTION 4,030 TOTAL NET COST/ACRE FOR THE YEAR 5,739 3,204 3,337 2,569 TOTAL ACCUMULATED NET COST/ACRE 5,739 8,943 12,280 14,849

2011 Olive Oil Costs and Returns Study North Coast, Central Coast UC Cooperative Extension
13
UC COOPERATIVE EXTENSION
Table 2. COSTS PER ACRE TO PRODUCE BOTTLED OLIVE OIL NORTH COAST & CENTRAL COAST 2011
Operation ---------------------- Cash and Labor Costs per Acre ----------------------- Time Labor Fuel, Lube Material Custom/ Total Your Operation (Hrs/A) Cost & Repairs Cost Rent Cost Cost Cultural: Irrigate: (water & labor) 0.80 10 0 330 0 340 Fertilize: Nitrogen (UN32) 0.80 10 0 52 0 62 Prune: Prune & Sucker (alternate yrs) 18.00 225 0 0 0 225 Prune: Shred Prunings (alternate yrs) 0.10 2 2 0 0 4 Vertebrate: Gopher (bait) 1.00 13 0 11 0 24 Weed: Mow Middles 3X 0.59 14 11 0 0 25 Weed: Strip or Spot Spray 3X (Roundup) 0.65 16 9 61 0 86 Insect: (McPhail Traps) 0.87 11 0 13 0 24 Insect: Olive Fruit Fly 9X (GF120) 2.12 51 36 67 0 154 Disease: Peacock, Olive Knot (Kocide) 0.42 10 7 24 0 42 Weed: Residual (Goal, Surflan) 0.22 5 3 77 0 86 Pickup Truck Use 3.56 86 28 0 0 114 ATV Use 3.56 86 11 0 0 96 TOTAL CULTURAL COSTS 32.69 538 107 636 0 1,280 Harvest: Assisted Hand Pick 0.00 0 0 0 1,500 1,500 Transport Olives/Oil 0.00 0 0 0 105 105 Process Olives 0.00 0 0 0 1,140 1,140 Bottle, Label, Store Oil (1,211 bottles) 0.00 0 0 0 2,470 2,470 Marketing 0.00 0 0 0 3,028 3,028 TOTAL HARVEST COSTS 0.00 0 0 0 8,243 8,243 Interest on operating capital @ 5.75% 65 TOTAL OPERATING COSTS/ACRE 538 107 636 8,243 9,588 Cash Overhead: Liability Insurance 48 Office Expense 150 Sanitation (field toilets) 31 Property Taxes 320 Property Insurance 74 Investment Repairs 104 TOTAL CASH OVERHEAD COSTS 727 TOTAL CASH COSTS/ACRE 10,315 NON CASH OVERHEAD (Capital Recovery): Per producing -- Annual Cost -- Investment Acre Capital Recovery Buildings 735 55 55 Fuel Tanks/Gravity Feed 651 49 49 Land 22,500 1,069 1,069 Irrigation System 1,749 98 98 Pruning Tools 37 12 12 Olive Orchard Establishment 7,151 418 418 Equipment 7,085 692 692 TOTAL CAPITAL RECOVERY COSTS 39,908 2,394 2,394 TOTAL COSTS/ACRE 12,710

2011 Olive Oil Costs and Returns Study North Coast, Central Coast UC Cooperative Extension
14
UC COOPERATIVE EXTENSION
Table 3. COSTS AND RETURNS TO PRODUCE BOTTLED OLIVE OIL NORTH COAST & CENTRAL COAST 2011
Quantity/ Price or Value or Your Acre Unit Cost/Unit Cost/Acre Cost GROSS RETURNS Olive Oil 1,211.00 botl 10.00 12,110
OPERATING COSTS Irrigation: Water 20.00 acin 16.50 330
Fertilizer: UN32 70.00 lb N 0.74 52
Herbicide: Roundup WeatherMax 88.00 floz 0.92 81 Surflan AS 1.85 pint 14.52 27 Goal 2XL 1.85 pint 16.38 30
Rodenticide: Gopher Bait 2.00 lb 5.62 11
Insecticide: McPhail Trap 0.20 trap 14.00 3 Tortula Yeast Tablet 0.40 lb 25.00 10 GF-120 70.00 floz 0.96 67
Custom: Harvest (hand) 3.00 ton 500.00 1,500 Transport Olives 3.00 ton 35.00 105 Process Olives 3.00 ton 380.00 1,140 Bottle, Label, Store Oil 1,211.00 botl 2.04 2,470
Marketing: Marketing Charge 1,211.00 botl 2.50 3,028
Fungicide: Kocide 101 8.00 lb 3.06 24
Labor (machine) 13.47 hrs 20.03 270 Labor (non-machine) 21.47 hrs 12.50 268 Fuel - Gas 8.32 gal 3.10 26 Fuel - Diesel 16.62 gal 2.60 43 Lube 10 Machinery repair 27 Interest on operating capital @ 5.75% 65 TOTAL OPERATING COSTS/ACRE 9,588 NET RETURNS ABOVE OPERATING COSTS 2,522 CASH OVERHEAD COSTS: Liability Insurance 48 Office Expense 150 Sanitation (field toilets) 31 Property Taxes 320 Property Insurance 74 Investment Repairs 104 TOTAL CASH OVERHEAD COSTS/ACRE 727 TOTAL CASH COSTS/ACRE 10,315 NON-CASH OVERHEAD (Capital Recovery): Buildings 55 Fuel Tanks/Gravity Feed 49 Land 1,069 Irrigation System 98 Pruning Tools 12 Olive Orchard Establishment 418 Equipment 692 TOTAL CAPITAL RECOVERY COSTS/ACRE 2,394 TOTAL COSTS/ACRE 12,710 NET RETURNS ABOVE TOTAL COSTS -600

2011 Olive Oil Costs and Returns Study North Coast, Central Coast UC Cooperative Extension
15
UC COOPERATIVE EXTENSION Table 4. MONTHLY PER ACRE CASH COSTS TO PRODUCE BOTTLED OLIVE OIL
NORTH COAST & CENTRAL COAST 2011 Beginning JAN 11 JAN FEB MAR APR MAY JUN JUL AUG SEP OCT NOV DEC TOTAL Ending DEC 11 11 11 11 11 11 11 11 11 11 11 11 11 Cultural: Irrigate: (water & labor) 43 43 43 43 43 43 43 43 340 Fertilize: Nitrogen (UN32) 8 8 8 8 8 8 8 8 62 Prune: Prune & Sucker (alternate yrs) 225 225 Prune: Shred Prunings (alternate yrs) 4 4 Vertebrate: Gopher (bait) 24 24 Weed: Mow Middles 3X 8 8 8 25 Weed: Strip or Spot Spray 3X (Roundup) 29 29 29 86 Insect: (McPhail Traps) 14 3 3 3 24 Insect: Olive Fruit Fly 9X (GF120) 31 31 31 31 31 154 Disease: Peacock, Olive Knot (Kocide) 42 42 Weed: Residual (Goal, Surflan, Roundup) 86 86 Pickup Truck Use 9 9 9 9 9 9 9 9 9 9 9 9 114 ATV Use 8 8 8 8 8 8 8 8 8 8 8 8 96 TOTAL CULTURAL COSTS 17 17 68 321 105 105 149 102 102 102 176 17 1,280 Harvest: Assisted Hand Pick 1,500 1,500 Transport Olives/Oil 105 105 Process Olives 1,140 1,140 Bottle, Label, Store Oil 2,470 2,470 Marketing 3,028 3,028 TOTAL HARVEST COSTS 8,243 8,243 Interest on operating capital @ 5.75% 0 0 0 2 3 3 4 4 5 45 -1 0 65 TOTAL OPERATING COSTS/ACRE 18 18 68 323 107 108 153 106 106 8,389 175 17 9,588 CASH OVERHEAD: Liability Insurance 48 48 Office Expense 13 13 13 13 13 13 13 13 13 13 13 13 150 Sanitation (field toilets) 31 31 Property Taxes 160 160 320 Property Insurance 37 37 74 Investment Repairs 9 9 9 9 9 9 9 9 9 9 9 9 104 TOTAL CASH OVERHEAD COSTS 218 21 100 21 21 21 218 21 21 21 21 21 727 TOTAL CASH COSTS/ACRE 236 39 168 344 128 129 371 127 127 8,411 196 38 10,315
2011 Olive Oil Costs and Returns Study North Coast, Central Coast UC Cooperative Extension
16
UC COOPERATIVE EXTENSION Table 5. RANGING ANALYSIS
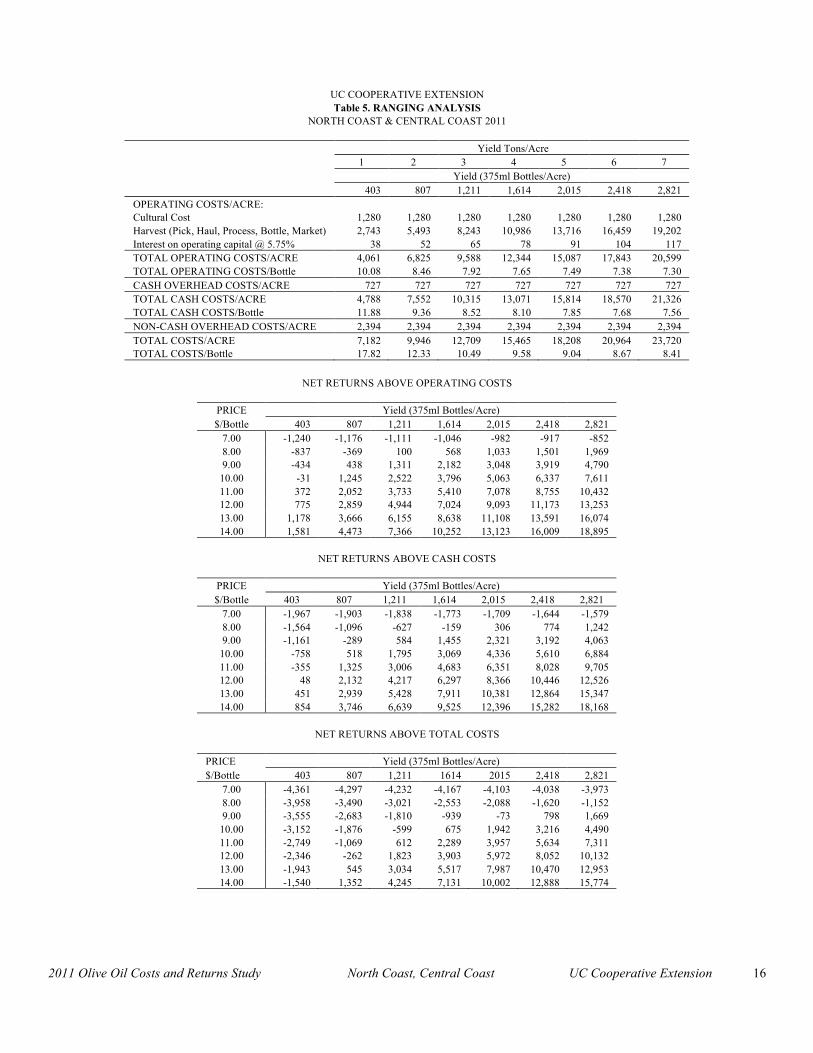
NORTH COAST & CENTRAL COAST 2011 Yield Tons/Acre 1 2 3 4 5 6 7 Yield (375ml Bottles/Acre) 403 807 1,211 1,614 2,015 2,418 2,821 OPERATING COSTS/ACRE: Cultural Cost 1,280 1,280 1,280 1,280 1,280 1,280 1,280 Harvest (Pick, Haul, Process, Bottle, Market) 2,743 5,493 8,243 10,986 13,716 16,459 19,202 Interest on operating capital @ 5.75% 38 52 65 78 91 104 117 TOTAL OPERATING COSTS/ACRE 4,061 6,825 9,588 12,344 15,087 17,843 20,599 TOTAL OPERATING COSTS/Bottle 10.08 8.46 7.92 7.65 7.49 7.38 7.30 CASH OVERHEAD COSTS/ACRE 727 727 727 727 727 727 727 TOTAL CASH COSTS/ACRE 4,788 7,552 10,315 13,071 15,814 18,570 21,326 TOTAL CASH COSTS/Bottle 11.88 9.36 8.52 8.10 7.85 7.68 7.56 NON-CASH OVERHEAD COSTS/ACRE 2,394 2,394 2,394 2,394 2,394 2,394 2,394 TOTAL COSTS/ACRE 7,182 9,946 12,709 15,465 18,208 20,964 23,720 TOTAL COSTS/Bottle 17.82 12.33 10.49 9.58 9.04 8.67 8.41
NET RETURNS ABOVE OPERATING COSTS
PRICE Yield (375ml Bottles/Acre) $/Bottle 403 807 1,211 1,614 2,015 2,418 2,821
7.00 -1,240 -1,176 -1,111 -1,046 -982 -917 -852 8.00 -837 -369 100 568 1,033 1,501 1,969 9.00 -434 438 1,311 2,182 3,048 3,919 4,790
10.00 -31 1,245 2,522 3,796 5,063 6,337 7,611 11.00 372 2,052 3,733 5,410 7,078 8,755 10,432 12.00 775 2,859 4,944 7,024 9,093 11,173 13,253 13.00 1,178 3,666 6,155 8,638 11,108 13,591 16,074 14.00 1,581 4,473 7,366 10,252 13,123 16,009 18,895
NET RETURNS ABOVE CASH COSTS
PRICE Yield (375ml Bottles/Acre) $/Bottle 403 807 1,211 1,614 2,015 2,418 2,821
7.00 -1,967 -1,903 -1,838 -1,773 -1,709 -1,644 -1,579 8.00 -1,564 -1,096 -627 -159 306 774 1,242 9.00 -1,161 -289 584 1,455 2,321 3,192 4,063
10.00 -758 518 1,795 3,069 4,336 5,610 6,884 11.00 -355 1,325 3,006 4,683 6,351 8,028 9,705 12.00 48 2,132 4,217 6,297 8,366 10,446 12,526 13.00 451 2,939 5,428 7,911 10,381 12,864 15,347 14.00 854 3,746 6,639 9,525 12,396 15,282 18,168
NET RETURNS ABOVE TOTAL COSTS
PRICE Yield (375ml Bottles/Acre) $/Bottle 403 807 1,211 1614 2015 2,418 2,821
7.00 -4,361 -4,297 -4,232 -4,167 -4,103 -4,038 -3,973 8.00 -3,958 -3,490 -3,021 -2,553 -2,088 -1,620 -1,152 9.00 -3,555 -2,683 -1,810 -939 -73 798 1,669
10.00 -3,152 -1,876 -599 675 1,942 3,216 4,490 11.00 -2,749 -1,069 612 2,289 3,957 5,634 7,311 12.00 -2,346 -262 1,823 3,903 5,972 8,052 10,132 13.00 -1,943 545 3,034 5,517 7,987 10,470 12,953 14.00 -1,540 1,352 4,245 7,131 10,002 12,888 15,774

2011 Olive Oil Costs and Returns Study North Coast, Central Coast UC Cooperative Extension
17
UC COOPERATIVE EXTENSION
Table 6. WHOLE FARM EQUIPMENT, INVESTMENT, AND BUSINESS OVERHEAD COSTS NORTH COAST & CENTRAL COAST 2011
ANNUAL EQUIPMENT COSTS
- Cash Overhead - Yrs Salvage Capital Insur-
Yr Description Price Life Value Recovery ance Taxes Total 11 75HP 4WD Tractor 48,103 16 8,616 3,988 220 284 4,492 11 ATV 4WD 7,942 7 3,013 987 42 55 1,084 11 Mower-Flail 9' 10,808 10 1,911 1,229 49 64 1,342 11 Orchard Sprayer 250 gal 21,102 20 1,100 1,623 86 111 1,820 11 Pickup 26,190 7 9,935 3,256 140 181 3,576 11 Weed Sprayer 100 gal 3,947 10 698 449 18 23 490 TOTAL 118,092 25,273 11,532 556 717 12,805 60% of New Cost * 70,855 15,164 6,919 333 430 7,683
* Used to reflect a mix of new and used equipment.
ANNUAL INVESTMENT COSTS -------- Cash Overhead -------- Yrs Salvage Capital Insur- Description Price Life Value Recovery ance Taxes Repairs Total INVESTMENT Buildings (400 sqft) 7,350 20 735 555 31 40 202 828 Orchard Establishment 71,510 36 4,184 277 358 358 5,176 Fuel Tanks (gravity feed) 6,514 20 651 491 28 36 33 588 Irrigation System (includes drip) 17,488 40 985 68 87 437 1,577 Land 225,000 40 225,000 10,688 0 2,250 0 12,938 Pruning Tools 368 3 37 123 2 2 10 136 TOTAL INVESTMENT 328,230 226,423 17,025 406 2,773 1,040 21,243
ANNUAL BUSINESS OVERHEAD COSTS Units/ Price/ Total Description Farm Unit Unit Cost Liability Insurance 15 acre 31.80 477 Office Expense 10 acre 150.00 1,500 Sanitation (Toilet Rental) 10 acre 31.40 314
UC COOPERATIVE EXTENSION Table 7. HOURLY EQUIPMENT COSTS
NORTH COAST & CENTRAL COAST 2011 COSTS PER HOUR Actual Cash Overhead Operating Hours Capital Insur- Fuel & Total Total Yr Description Used Recovery ance Taxes Repairs Lube Oper. Costs/Hr 11 75HP 4WD Tractor 45.1 53.06 2.92 3.77 1.22 11.01 12.23 71.98 11 ATV 4WD 35.6 16.63 0.72 0.92 0.59 2.38 2.97 21.24 11 Mower-Flail 9' 6.9 106.26 4.26 5.50 4.55 0.00 4.55 120.57 11 Orchard Sprayer 250 gal 25.4 38.38 2.03 2.62 3.43 0.00 3.43 46.46 11 Pickup 35.6 54.84 2.36 3.04 1.94 5.94 7.88 68.12 11 Weed Sprayer 100 gal 8.7 31.02 1.24 1.61 1.06 0.00 1.06 34.93

2011 Olive Oil Costs and Returns Study North Coast, Central Coast UC Cooperative Extension
18
UC COOPERATIVE EXTENSION Table 8. COSTS AND RETURNS / BREAKEVEN ANALYSIS
NORTH AND CENTRAL COASTS 2011
COSTS AND RETURNS PER ACRE
1. Gross 2. Operating 3. Net Returns 4. Cash 5. Net Returns 6. Total 7. Net Returns Returns Costs Above Operating. Costs Above Cash Costs Above Total Crop Costs (1-2) Costs (1-4) Costs (1-6) Olive Oil 12,110 9,588 2,522 10,315 1,795 12,710 -600
COSTS AND RETURNS - TOTAL ACREAGE 1. Gross 2. Operating 3. Net Returns 4. Cash 5. Net Returns 6. Total 7. Net Returns Returns Costs Above Operating. Costs Above Cash Costs Above Total Crop Costs (1-2) Costs (1-4) Costs (1-6) Olive Oil 121,100 95,880 25,220 103,154 17,946 127,098 -5,998
BREAKEVEN PRICES PER YIELD UNIT Breakeven Price To Cover Base Yield Yield Operating Cash Total CROP (Units/Acre) Units Costs Costs Costs $ per Yield Unit Olive Oil 1,211 Bottle 7.92 8.52 10.50 Breakeven Yield To Cover Yield Base Price Operating Cash Total CROP Units ($/Unit) Costs Costs Costs Yield Units /Acre Olive Oil Bottle 10 959 1,032 1,271

2011 Olive Oil Costs and Returns Study North Coast, Central Coast UC Cooperative Extension
19
UC COOPERATIVE EXTENSION
Table 9. OPERATIONS WITH EQUIPMENT & MATERIALS NORTH & CENTRAL COASTS 2011
Broadcast Material Operation Month Tractor Implement Material Rate/Acre Unit Cultural: Pruning & Suckering (alternate yrs) February Labor Prune: Mow Prunings (alternate yrs) February 75HP Mower Flail Rodent Control April Labor Bait 2.00 lb Insect: Olive Fly (alternate row every 2 wks. July 75 HP Orchard Sprayer GF120 14.00 floz August 75 HP Orchard Sprayer GF120 14.00 floz September 75 HP Orchard Sprayer GF120 14.00 floz October 75 HP Orchard Sprayer GF120 14.00 floz November 75 HP Orchard Sprayer GF120 14.00 floz Insect: McPhail Traps 8X July ATV McPhail Trap 0.20 each July ATV Tortula Yeast 0.10 lb August ATV Tortula Yeast 0.10 lb September ATV Tortula Yeast 0.10 lb October ATV Tortula Yeast 0.10 lb Irrigate March Labor Water 2.50 acin April Labor Water 2.50 acin May Labor Water 2.50 acin June Labor Water 2.50 acin July Labor Water 2.50 acin August Labor Water 2.50 acin September Labor Water 2.50 acin October Labor Water 2.50 acin Fertilize: N through drip March Labor UN32 8.75 lbs April Labor UN32 8.75 lbs May Labor UN32 8.75 lbs June Labor UN32 8.75 lbs July Labor UN32 8.75 lbs August Labor UN32 8.75 lbs September Labor UN32 8.75 lbs October Labor UN32 8.75 lbs Weed: Mow Middles 3X May 75HP Mower Flail June 75HP Mower Flail July 75HP Mower Flail Weed: Strip Spray May 75HP Weed Sprayer Roundup 22.00 floz June 75HP Weed Sprayer Roundup 22.00 floz July 75HP Weed Sprayer Roundup 22.00 floz Harvest: Hand Pick October Contract Olives 3.00 ton Transportation: Olives October Contract Olives 3.00 ton Process Olives October Contract Olives 3.00 ton Bottle, Label, Store October Contract Oil 1,211.00 botl Marketing Oil October Labor Oil 1,211.00 botl Weed: Residual November 75HP Weed Sprayer Surflan AS 1.85 pint Goal 1.85 pint Roundup 0.92 pint Disease: Peacock Spot November Kocide 101 8.00 lb