corrim: phase i final report module c
TRANSCRIPT

CORRIM: Phase I Final Report
Module C
SOFTWOOD LUMBER - SOUTHEAST REGION
June 1, 2004
Prepared by:
Michael R. Milota1 Cynthia D. West Ian D. Hartley
1 Milota is Professor, Oregon State University, West is Assistant Station Director, US Forest Service, and Hartley is Assistant Professor, University of Northern British Columbia. West and Hartley were at Mississippi State University when working on this project.


i
EXECUTIVE SUMMARY
The goal of this work was to develop a life cycle inventory for the production of dimension lumber manufactured in the Southeast region of the US. The target audience are those interested in further life cycle analyses which involve lumber. Approximately one third of the softwood lumber consumed in the United States is produced from southern yellow pine. An estimated 400 mills across 13 southern states currently produce between 16 and 17 billion board feet annually. Sawmill production is concentrated in the states of Georgia, Alabama, Mississippi, and Louisiana, which are described as the Southeast Region in this report. These four states account for 51% of the lumber produced in the South. Harvesting restrictions in the western United States have shifted production and demand for softwood lumber to the South, with the result that over the last decade softwood lumber production in the South increased by 31% while production in the West declined by 17%.
Nine sawmills were identified with the assistance of the Southern Forest Products Association as typical large production pine mills in the southeast. A large production sawmill was defined as having at least 75,000 thousand board feet (Mbf) of production per year. Surveys following the CORRIM research guidelines were sent to each of the nine mills. Four surveys were returned, two from bandmill operations and one each from curve saw and chip and saw operations. The combined total production was approximately 555,500 Mbf and represents 9.4% of the total production of the states represented in the sample, 6.3% of the Southeast Region (Georgia, Alabama, Mississippi, and Louisiana), and 4.1% of all southern pine dimension lumber.
The sawmill process can be divided into unit processes: sawing, kiln drying, planing, and steam production (boiler). The data collected for southern mills is not detailed enough to do this explicitly; however, the SimaPro analysis was divided this way to keep the analytical approach parallel to that of western lumber module (Module B of this report). Additionally, allocations are assigned more appropriately using the unit process approach. The data were summarized as a weighted average based on annual production at each mill.
Some conclusions from the survey are:
• Approximately 80% of the dimension lumber produced was 2-inches thick nominally, with nominal widths ranging from 4 to 10 inches.
• Approximately 42% of the log volume was converted to dimension lumber, with the remaining wood in the log going into pulp chips (31%), sawdust, hogged fuel, and planer shavings.
• It required approximately 138 ft3 of logs to produce 1.0 Mbf of planed dry lumber and the associated co-products.
• All thermal energy for drying was generated internally by burning sawdust, bark, and other wood residue.

ii
TABLE OF CONTENTS
EXECUTIVE SUMMARY.......................................................................................................................................... i
1.0 INTRODUCTION......................................................................................................................................... 1 1.1 LUMBER MANUFACTURING - GENERAL DESCRIPTION ..................................................... 1
1.1.1 Sawing................................................................................................................................ 2 1.1.2 Energy generation............................................................................................................... 2 1.1.3 Drying................................................................................................................................. 2 1.1.4 Planing................................................................................................................................ 3
1.2 MILL SURVEYS ............................................................................................................................. 3 1.3 SOUTHERN YELLOW PINE PHYSICAL PROPERTIES............................................................. 5
2.0 PRODUCT YIELDS..................................................................................................................................... 6
3.0 NON-WOOD INPUTS TO LUMBER MANUFACTURING AND ENERGY GENERATION........... 8 3.1 WATER............................................................................................................................................ 8 3.2 OTHER MATERIALS ..................................................................................................................... 8
4.0 MANUFACTURING ENERGY .................................................................................................................. 9
5.0 EMISSIONS TO AIR, WATER, SOIL, AND LANDFILL..................................................................... 11 5.1 AIR EMISSIONS ........................................................................................................................... 11 5.2 WATER EMISSIONS .................................................................................................................... 11 5.3 EMISSIONS TO SOIL ................................................................................................................... 11 5.4 SOLID EMISSIONS ...................................................................................................................... 11
6.0 STRUCTURE AND INPUT, SIMAPRO MODEL .................................................................................. 12 6.1 SAWING ........................................................................................................................................ 13 6.2 DRYING......................................................................................................................................... 15 6.3 PLANING....................................................................................................................................... 16 6.4 BOILER.......................................................................................................................................... 17 6.5 ELECTRICITY............................................................................................................................... 19
7.0 LCI ESTIMATES FOR PRODUCTION OF PRODUCTS AND CO-PRODUCTS................................................................................................................................ 21 7.1 RAW MATERIALS ....................................................................................................................... 21 7.2 AIRBORNE EMISSIONS.............................................................................................................. 21 7.3 WATERBORNE EMISSIONS....................................................................................................... 22 7.4 SOLID EMISSIONS ...................................................................................................................... 23 7.5 ENERGY........................................................................................................................................ 23
8.0 SENSITIVITY............................................................................................................................................. 25 8.1 EFFECT OF COGENERATION.................................................................................................... 25 8.2 DRYER ENERGY EFFICIENCY.................................................................................................. 27

iii
9.0 CARBON BALANCE .................................................................................................................................28
10.0 COST ANALYSIS .......................................................................................................................................30
11.0 CONCLUSIONS..........................................................................................................................................33
12.0 REFERENCES ............................................................................................................................................34
APPENDIX 1: SOUTHEAST US SOFTWOOD LUMBER INDUSTRY SURVEY .................................35

iv
LIST OF FIGURES
Figure 6.1. Overview of relationships among wood processing processes in SimaPro model. Electrical, fuels, and other inputs are not shown. .............................................................13

v
LIST OF TABLES
Table 1.1. US lumber production by region, 1991-2000..................................................................... 1
Table 1.2. Details of mill types from the surveys for the Southeast Region. ...................................... 4
Table 1.3. Physical data for southern yellow pine of the US Southeast Region.................................. 5
Table 2.1. Percentage of dimension lumber product breakdown based on dimension sizes
for the Southeast Region. ................................................................................................... 6
Table 2.2. Breakdown of products and co-products for the manufacture of 1.0 Mbf of
planed dry lumber in the Southeast. ................................................................................... 7
Table 4.1. Oven-dry mass of fuel (bark and wood) used per 1.0 Mbf of planed dry lumber
produced............................................................................................................................. 9
Table 4.2. Electrical and diesel breakdown among processes. ............................................................ 9
Table 4.3. Southeast region purchased electricity breakdown by fuel source. .................................... 9
Table 4.4. Fuels used in softwood lumber production in the Southeast Region................................ 10
Table 5.1. Solid waste generated at sawmills. ................................................................................... 11
Table 6.1. SimaPro 5 process for lumber selector. ............................................................................ 12
Table 6.2. SimaPro 5 process for sawing showing how data from survey was inserted into
the model. ......................................................................................................................... 15
Table 6.3. SimaPro 5 process for drying showing how data from survey was inserted into
the model. ......................................................................................................................... 16
Table 6.4. SimaPro 5 process for planing showing how data from survey was inserted into
the model. ......................................................................................................................... 17
Table 6.5. SimaPro 5 process for the boiler showing how data from survey and the Franklin
wood boiler were combined and inserted into the model. ................................................ 18
Table 6.6. SimaPro 5 process for boiler selector. .............................................................................. 19
Table 6.7. SimaPro 5 process for the SE electricity showing how the DOE electrical source
data was inserted into the model. ..................................................................................... 20
Table 6.8. SimaPro 5 process for electricity selector. ....................................................................... 20
Table 7.1. Exported results from SimaPro 5 for LCI of raw materials for the production of
one Mbf of planed dry lumber and associated co-products. ............................................. 21
Table 7.2. Exported results from SimaPro 5 for LCI of airborne emissions for the
production of one Mbf of planed dry lumber and associated co-products........................ 22
Table 7.3. Exported results from SimaPro 5 for LCI of waterborne emissions for the
production of one Mbf of planed dry lumber and associated co-products........................ 23
Table 7.4. Exported results from SimaPro 5 for LCI of solid emissions for the production
of one Mbf of planed dry lumber and associated co-products.......................................... 23
Table 7.5. Exported results from SimaPro 5 for LCI of energy for the production of one
Mbf of planed dry lumber and associated co-products..................................................... 24

vi
Table 8.1. Effect of eliminating purchased electricity to simulate on-site cogeneration of all
electricity. .........................................................................................................................26
Table 8.2. Effect of increasing or decreasing thermal energy use at the dryer by 10%. ....................27
Table 9.1. Biomass carbon balance for production of one Mbf of planed dry southern pine
lumber...............................................................................................................................29
Table 10.1 Assumptions for cost analysis...........................................................................................31
Table 10.2. Cost analysis for a 120 Mbf sawmill. ...............................................................................32

vii


1
1.0 INTRODUCTION
Approximately one third of the softwood lumber consumed in the United States is produced from southern yellow pine2. An estimated 400 mills across 13 southern states currently produce between 16 and 17 billion board feet annually. Sawmill production is concentrated in the states of Georgia, Alabama, Mississippi, and Louisiana, which are described as the Southeast Region in this report. These four states account for 51% of the lumber produced in the South. Intensive forest management and the productivity of forestlands in this region are responsible for the location and development of this industry.
Harvesting restrictions in the western United States have shifted production and demand for softwood lumber to the South, with the result that over the last decade softwood lumber production in the South increased by 31% while production in the West declined by 17%. Presented in Table 1.1 are lumber production volumes from these two regions over the last decade.
Table 1.1. US softwood lumber production by region, 1991-2000.
Region – Annual Volume
(million board feet) Year South West Other US Total 1991 12,507 19,075 1,579 33,161 1992 14,106 18,782 1,638 34,526 1993 14,392 17,367 1,588 33,347 1994 15,010 17,449 1,623 34,082 1995 14,710 16,175 1,556 32,441 1996 15,262 16,811 1,839 33,912 1997 16,114 16,818 1,887 34,819 1998 16,156 16,782 1,903 34,841 1999 16,923 17,744 2,150 36,817 2000 16,672 17,173 2,107 35,952
Source: Southern Forest Products Association (2001)
Eighty-one percent of southern pine lumber production is dimension lumber used in framing residential construction according to the Southern Forest Products Association survey of southern pine lumber shipments. Dimension lumber ranges in nominal size3 from 2” x 4” to 2” x 12”. An estimated 60% of dimension lumber is produced in nominal sizes of 2” x 4” and 2” x 6”. The predominant grade produced is No. 2, which accounts for approximately 60% of southern dimension lumber production.
1.1 LUMBER MANUFACTURING - GENERAL DESCRIPTION
A general discussion of lumber production in a southern sawmill is needed to understand the process. A typical sawmill process involves sawing, energy production, drying, and planing.
2 “Southern yellow pine” or “southern pine” are terms used to describe a collection of several pine species (Panshin and de Zeeuw 1980), typically, longleaf pine (Pinus palustris Mill.), shortleaf pine (P. echinata. Mill.), loblolly pine (P. taeda L.) and slash pine (P. elliottii Engelm.).
3 “Nominal size” is a size description of the lumber and is not the actual size. For example, a 2” x 4” is a nominal size although the actual size is 1.5” x 3.5”.

2
1.1.1 Sawing
This unit process begins with logs in the mill yard and includes:
• in-yard conveyance of logs from the point of unloading to the deck;
• sorting and storage of logs;
• in-yard conveyance of logs from the deck to the optimizer or debarker;
• cutting to length of logs (bucking);
• debarking of the log;
• breakdown of logs into rough lumber, pulp chips, bark and sawdust;
• stacking, stickering, and in-yard conveyance of rough lumber to kilns or planer facilities;
• saw filing and maintenance of all sawmill equipment and yard transportation vehicles; and,
• treatment of process air, liquids, and solids.
The outputs of this unit process include the product rough green lumber, and co-products pulp chips, bark, hog fuel, and sawdust. Some of these sawmill co-products might be inputs to energy generation.
1.1.2 Energy generation
This unit process provides heat as steam and in some cases electricity for use in other parts of the mill. During informal discussions with non-participating dry kiln operators, it was found that all boilers in sawmill operations were fueled with wood/bark which is also true for mills surveyed in this study; no mills reported using natural gas for any process. Parts of the process include:
• fuel handling;
• addition of water to the boiler;
• addition of chemicals to the boiler or to steam lines;
• distribution of the steam; and
• the treatment of process air, liquids, and solids.
Process steam is the output of this unit process.
1.1.3 Drying
This unit process begins with rough green lumber on stickers and includes:
• loading of stickered lumber into a conventional high-temperature kiln facility;

3
• heat treatment, drying, equalizing and conditioning of lumber within the kiln;
• maintenance of all kiln equipment and related yard transportation vehicles;
• treatment of process air, liquids and solids; and,
• unloading and conveyance of kiln-dried lumber to the planer mill.
The output of this unit process is stickered, rough kiln-dry lumber delivered to the planer.
1.1.4 Planing
This unit process begins with stickered, rough kiln-dried lumber. The operations associated with this unit process include:
• de-stickering and/or unstacking of lumber;
• planing (surfacing) of lumber;
• trimming, grading, and sorting of lumber;
• stacking, strapping, and packaging of lumber;
• conveyance of lumber within the planer operation and loading for shipping;
• maintenance of all planer equipment and associated yard transportation vehicles; and,
• treatment of process air, liquids and solids.
The output of this unit process is surfaced and packaged lumber, sorted by type, size and grade with co-products of planer shavings.
The survey is presented in Appendix 1. The responses were for the calendar year 1999. Infrastructure (construction of the facilities) is not considered in this study. Nor, in accordance with CORRIM guidelines, were materials and energy associated with overhead and administration surveyed. However, electrical consumption for the overhead and administration is probably included with the process electrical use because of the way in which mills record electrical usage.
1.2 MILL SURVEYS
Nine sawmills were identified with the assistance of the Southern Forest Products Association as typical of large production pine mills in the Southeast. A large production sawmill was defined as having an annual production of 75,000 Mbf or greater. These mills were contacted and sent surveys to complete. Four surveys were returned: two from bandmill operations and one each from curve saw and chip and saw operations. The use of curve saw technology is increasing rapidly throughout the South, which has been driven by improvement in yield and lumber quality from small diameter logs. Table 1.2 presents characteristics of the responding mills including process centers, transport machinery, boiler ratings, and emissions control equipment.

4
Production from the responding mills represents 9.4% of the total production from the sample states of Louisiana, Mississippi, Alabama and 6.3% of the Southeast Region (Louisiana, Mississippi, Alabama and Georgia), and 4.1% of all southern pine dimension lumber. The production period represented by survey data was 1999 and/or 2000.
The data were organized and calculated as input of oven-dry weight per thousand board feet (lbs/Mbf). All of the data were averaged with weighting based on the reported annual production using the following formula:
∑∑
=
== n
i i
n
i iiweighted
f
fXX
1
1
where Xi is the value reported by the mill i, n is the number of mills reporting a value for the material, X, and fi is the fraction of production at mill i.
Table 1.2. Details of mill types from the surveys for the Southeast Region.
Band Mill Process Center Chip and Saw #1 #2
Curve Saw Twin Bands
Log yard X X X X Log sorter Merchandiser
X X X
Debarker X X X X Twin bandmill headrig
X X
Resaws X X Edger X X X X Edger optimizer X X X X Green trimmer X X X X Trimmer optimizer X X X X Conventional kiln (#) Unknown 5 2 4 Planer mill X X X X Process heat boiler using hog fuel
X X X X
Baghouse X X Transport machinery 7 forklifts 8 forklifts None indicated None indicated Boiler rating 8.75E+07 BTU/hr 9.80 E +07
BTU/hr None indicated 1.00 E +08
BTU/hr Boiler steam production rating
3.29 E +08 lbs/hr 3.53 E +08 lbs/hr 4.01 E +08 lbs/hr
8.00 E +05 lbs/hr
Emissions control equipment
None indicated Wellons/ESP baghouse
None indicated Zurn 2-stage multicyclones

5
1.3 SOUTHERN YELLOW PINE PHYSICAL PROPERTIES
The southern pine species group is made-up of several species; however, the majority are loblolly and slash pine. Table 1.3 presents the density data for these species needed to convert wood volume to mass. An average of the values was used. Because dimension lumber is sold at approximately 15% moisture content, a linear interpolation was done between the Wood Handbook values to obtain a specific gravity of 0.54, or 33.7 lb/ft3 for dimension lumber at 15% moisture content. All specific gravity and density values are expressed based on wood mass and wood volume at the specified moisture content. As more plantation trees are used in sawmilling operations, it is expected that there will be different values for the physical properties of southern yellow pine. A study of plantation pine in northern Louisiana showed significantly lower initial moisture content and specific gravity values (Gibson et al. 1986) than commonly reflected in published data. Other studies, including recent emission studies by OSU and NCASI also indicate lower moisture contents than the Wood Handbook (USDA 1999) values. Moisture content was therefore assumed to be 100% on an oven-dry basis, 10% lower than the Wood Handbook value but consistent with several other sources. All moisture content values are expressed as water content as a percentage of dry mass. When oven-dry mass is referred to in this report, it means wood mass without water.
Table 1.3. Physical data for southern yellow pine of the US Southeast Region.
Species Specific Gravitya Density
Green 12%
Greenb 12%c
lbs/ft3 Loblolly Pine 0.47 0.51 29.3 31.8 Slash Pine 0.55 0.59 34.3 36.8 Average 0.51 0.55 31.8 34.3 a USDA Wood Handbook (1999), 0.47 corresponds to a density of 470 kg/m3 etc. b Dry mass, volume at a moisture content greater than 30%, oven-dry basis c Dry mass, volume at a moisture content of 12%, oven-dry basis

6
2.0 PRODUCT YIELDS
One mill reported logs on a volume basis as US South Scribner, while the other three mills reported the logs on a weight basis. The US South Scribner value was converted to a mass measurement using 7.25 tons/Mbf. A volume of 138.4 ft3 or an oven-dry mass of 4406 lbs were required to produce one Mbf of planed dry lumber and the associated co-products. This was very consistent among the four mills, ranging from 129 to 150 ft3.
All of the surveyed mills produced pine dimension lumber as the major product. Table 2.1 shows the percentage breakdown of final products based on survey results and their average weighted-values. Approximately 95%, is nominal 2”-thick lumber, ranging from nominal 4” to 12” in width. The majority of this is 4” to 8” wide so all production was modeled as 6” in width. For the reader not familiar with board feet, we discuss this because there are small differences in the mass of wood in one board foot. For instance, for pieces of the same length, two 2”x4” pieces contain about 3.5% less wood than one 2”x8” piece.
The industry practice is to use nominal sizes, much like the term 1” schedule 40 steel pipe describes pipe for which neither the inside nor outside diameter is 1”. Nominal 2”x 6” planed, dry dimension lumber, for example, has actual dimensions of 1.5 x 5.5 inches. Rough lumber is thicker and wider than the final product to allow for shrinkage in the dry kiln and smoothing of the surface during planing. The dimensions of rough sawn lumber vary by mill. Mills with more variability in the process need larger rough sizes to have the wood leave the planer with a smooth surface. For purposes of analysis, these have been assumed to be 1.7” by 5.9”. Because the rough, dry lumber is an intermediate product, this assumption is not critical to the accuracy of the project.
Table 2.1. Percentage of dimension lumber product breakdown based on dimension sizes for the Southeast Region.
Lumber product
Total survey production Weighted average based on production of each
mill
Percentage based on weighted average
Nominal size (in x in.) Mbf Mbf (%)
1 x 4 9.52E+03 2.29E+03 1.3 1 x 6 7.17E+03 1.76E+03 1.0 1 x 8 4.47E+03 1.10E+03 0.6
1 x 10 1.94E+03 4.77E+02 0.3 5/4 x 6 2.09E+04 5.21E+03 2.9 2 x 4 1.45E+05 4.01E+04 21.9 2 x 6 1.18E+05 4.07E+04 22.2 2 x 8 9.68E+04 3.62E+04 19.8
2 x 10 1.03E+05 3.77E+04 20.6 2 x 12 4.52E+04 1.74E+04 9.5 Total 5.52E+05 1.83E+05 100.0
Table 2.2 provides product and co-product masses (oven-dry) for the production of 1.0 Mbf of planed dry lumber. The co-products consisted of rough green lumber, pulp chips, sawdust, bark, and planer shavings. A material balance indicates that the mills reported 4.5% more mass in products, co-products, and fuel than they reported entering the process as logs. This agreement is excellent and the discrepancy likely arises from mill reporting, the conversion of log volume to mass, and moisture content and specific gravity estimates.

7
Table 2.2. Breakdown of products and co-products for the manufacture of 1.0 Mbf of planed dry lumber in the Southeast.
Product (p) or Co-product (cp) lbs kg %
Planed dry lumber (p) 1,942 882.7 42.2 Rough green lumber (cp) 3.5 1.6 0.1 Pulp chips (cp) 1,450 659.1 31.5 Sawdust (cp) 76.5 34.8 1.7 Sawdust to boiler 195 88.6 4.2 Bark (cp) 182 82.7 4.0 Bark to boiler 414 188.2 9.0 Planer shavings (cp) 342 155.5 7.4 Total 4605 2093.2 100
Notes: All weights are oven-dry.

8
3.0 NON-WOOD INPUTS TO LUMBER MANUFACTURING AND ENERGY GENERATION
3.1 WATER
The mills provided data for either ground water (well) or city water, or both. City water was assumed to be well water. It was also assumed that the water was used mainly to sprinkle logs because large quantities are not used anywhere else in the manufacturing process. Phone conversations with some mills confirmed this. A weighted average of 159 gallons per Mbf of planed dry lumber produced was obtained based on input from three mills. The fourth mill did not report water consumption and was not included in the average. The range was from zero to 218 gallons per Mbf.
3.2 OTHER MATERIALS
Hydraulic oils, greases, motor oils, and lubricants all combined account for 0.28 gallons per Mbf of planed dry lumber. The reported values vary greatly among mills and two to three mills reported in each category. Some boiler chemical and antifreeze are also used, however these fall far below 2% of the product mass, a limit below which materials can be excluded. None of these materials are hazardous or environmentally harmful. Steel strapping and lumber wrap were not reported; however, based on the Pacific Northwest lumber survey these are minor components and also fall below well below the 2% limit for inclusion in the analysis. The transportation of these and all inputs is not included in the analysis.

9
4.0 MANUFACTURING ENERGY
Thermal energy for drying was completely generated from 609 oven-dry pounds of bark and sawdust per Mbf of planed dry lumber (Table 4.1). The CORRIM boiler uses the FAL value of 4500 BTU per pound and an efficiency of 66% so that 3000 BTUs of steam are produced from one pound of fuel (at 100% moisture content oven-dry basis). Thus 609 oven-dry pounds would produce 3,654,000 BTU. If the planed dry lumber and planer shavings are dried from 100% to 15%, then 2284 pounds of water are removed and the energy requirement is 1600 BTU/lb of water removed. This is in good agreement with other studies (USDA 1988) and the theoretical expectation for high temperature lumber drying. The reported fuel usage ranged from 407 to 698 lbs/Mbf.
Table 4.1. Oven-dry mass of fuel (bark and wood) used per 1.0 Mbf of planed dry lumber produced.
Hogged fuel lbs/Mbf kg/m3 Bark 414.4 108.4 Sawdust 194.7 50.9 Total hogged fuel to boiler 609.1 159.3
Electricity is used to run cutting tools, conveyors, fans, and lighting. The surveys indicated that 150.9 kWh were used to produce one Mbf of planed dry lumber; values ranged from 133 to 191 among the four mills. Mills were not able to divide this among the processes because they do not track usage that way. However, electricity needs to be divided among the processes so the correct amounts are allocated to products and co-products. The breakdown was estimated (Table 4.2) mainly from the PNW lumber survey, except we know that drying (and boiler) electrical usage should be somewhat greater in the South because more water is removed and higher air velocities are used in the kilns. This is confirmed in Puettmann and Bowyer (2002) in which 28% of a southern mill’s electrical use is at the kilns.
Table 4.2. Electrical and diesel breakdown among processes.
Survey Estimated Process PNW % PNW % SE % SE % SE, BTU SE, kWh Diesel Electricity Diesel Electricity Diesel Electricity Saw 61.4 52.6 61.4 45 54384 67.9 Dry 8.5 16.8 8.5 25 7556 37.7 Plane 19.3 16.5 19.3 15 17111 22.6 Boiler 10.8 14.1 10.8 15 9545 22.6 Total 100.0 100.0 100.0 100.0 88596 150.9
The Southeast region’s electrical power source breakdown provided from the United States Department of Energy (Table 4.3) was input to SimaPro 5 to allow calculation of the pollutants generated in the life cycle inventory.
Table 4.3. Southeast region purchased electricity breakdown by fuel source.
Electricity % Hydropower 1.8 Nuclear 21.6 Distillate Fuel Oil 4.5 Natural Gas 23.0 Coal 45.6 Undefined 3.5 Total 100 Source: Based on US DOE data for 2000

10
Petroleum-based fuels are presented in Table 4.4. These were reported in gallons and converted to BTUs using 124,467; 138,903; 91,681 and 135,312 BTU/gallon, respectively, for gasoline, diesel, propane, and kerosene. All mills reported diesel use and it ranged from 60,597 to 120,635 BTU/Mbf. Variability is expected due to mill layout and distances within the mill. Three mills reported gasoline use ranging from 2,426 to 7,742 BTU/Mbf. The variability in this value is due to the type of equipment at the facility. Only one mill used propane and one mill used kerosene. The diesel use was divided among the processes in the same proportion as indicated in the PNW survey (Table 4.2). Other fuels were assigned to the sawmill, consistent with the PNW survey.
Table 4.4. Fuels used in softwood lumber production in the Southeast Region.
Product BTU/Mbf MJ/m3 Gasoline 5,962 328 Diesel 88,596 4,868 Propane 1,790 98 Kerosene 201 11 Total 97,379 5,351

11
5.0 EMISSIONS TO AIR, WATER, SOIL, AND LANDFILL
5.1 AIR EMISSIONS
Emissions were reported for the overall mill complex because this is how they are permitted and tracked. Three mills reported a weighted average of particulate matter of 3.9 lbs/Mbf with a range of 0.31 to 7.26 lbs/Mbf. Two mills reported NOx emissions. These ranged from 0.85 to 1.48 lbs/Mbf with a weighted average of 1.1 lbs/Mbf. A weighted average from two mills of SO2 emissions of 0.045 lbs/Mbf was reported with a range of 0.04 to 0.05 lbs/Mbf. VOC emissions were reported by all mills and ranged from 0.1 to 4.19 with a weighted average of 2.2 lbs/Mbf. Despite the range, the weighted average is very close to measured values by NCASI, OSU and MS State. It’s likely that the low value is a reporting error and the high value is a permitted value, not an actual emission factor. Data on other chemicals may not appear on the mill’s operating permit and hence were either reported as zero or left blank. Because mills report permitted values or they don’t know the emission levels, the emissions data is not used in this report. The exception is the VOC value which was attributed to the dryer. This value agreed well with values measured at OSU and MSU (NCASI 2002).
5.2 WATER EMISSIONS
Although some mills provided concentrations for effluents, none indicated any significant amount of water released from the processes.
5.3 EMISSIONS TO SOIL
No emissions to soil were reported.
5.4 SOLID EMISSIONS
Solid wastes produced during the manufacturing of lumber are shown in Table 5.1. Wood and bark solid wastes that are sent to a landfill presumably arise during cleanup operations in which dirt is mixed in with the wood material necessitating that it be sent to a landfill. The wood and bark comprised less than 0.1% of the mass of the products and co-products. The ash is from wood waste burned at the boiler. The wood and bark of southern pines are reported to have 0.5 and 0.7% ash, respectively (Industrial Wood Energy Book, Georgia Institute of Technology 1984). If 609 lbs/Mbf are burned, then 8.1 lbs represents 1.3% of the mass burned. It’s likely that fuel contaminants, such as dirt, make up the rest.
Table 5.1. Solid waste generated at sawmills.
Waste material lbs/Mbf kg/m3 Wood fiber 1.7 0.4 Ash 8.1 1.9 Domestic waste 2.5 0.6

12
6.0 STRUCTURE AND INPUT, SIMAPRO MODEL
SimaPro 5.0.9, a software package designed for analyzing the environmental impact of products during their whole life cycle, was used to perform the life cycle analysis. Developed in the Netherlands by PRé Consultants B.V., SimaPro5 contains a US database for a number of materials, including paper products, fuels, and chemicals. Franklin Associates (FAL) provides an additional US database (Franklin 2001).
Three material processes were defined in SimaPro 5: sawing, drying, and planing. An energy process for steam generation from wood and bark was also defined. These are related to each other as shown by the bold boxes in Figure 6.1. Not shown in the figure are “lumber selector,” “boiler selector,” and “electricity selector” processes. Because SimaPro 5 works on a kg basis, the output of the lumber selector process was set to 1 kg. We then retitled the SimaPro 5 output based on 1 kg, back to 1 Mbf of the selected product mix, the desired reporting basis.
For all processes the input to SimaPro 5 was taken from tables and text already presented. In some cases, these were adapted to the way SimaPro 5 handles input data. In these cases it is explained. All values are weighted (by production) averages of the values reported by the mills.
Table 6.1. SimaPro 5 process for lumber selector.
Substance Unit Value Low High Comment
Materials/fuels Lumber, SP, P, D lb 1942.4 0 0 1942.4 lb/Mbf, OD Weight
Products SimaPro output is based on 1kg Southern Lumber Selector kg 1 0 0 This makes 1 Mbf "=" 1kg

13
Figure 6.1. Overview of relationships among wood processing processes in SimaPro model. Electrical, fuels, and other inputs are not shown.
6.1 SAWING
The inputs and outputs for the southern pine sawing process are shown in Table 6.2. The primary raw material for this process is wood in the form of logs. The product is rough green lumber. Co-products for this process include chips, bark, and sawdust. Some of the sawdust and bark become co-products for the mill complex and some goes to the boiler process.
Inputs: Logs are listed in SimaPro 5 as a flow from nature (under resources) so that no environmental impacts for log production are considered at this time.
Distillate fuel oil (FAL) was used as a surrogate for all organic solvents and lubricants. The weighted averages for organic materials were input to SimaPro as distillate fuel oil.
Because the reporting mills were not able to divide fuels and electricity, these were input as described in section 4.0 of this report. The impacts of diesel and gasoline used in forklifts and other equipment were selected from the Franklin database processes for the cradle-to-grave combustion of fuels for machinery (applies to all processes).
Plane
Dry
Coproducts:Chips,
Sawdust,Bark,
RoughGreenlumber
SawBoiler
Coproduct:Planer
shavings
Product:Planed
drylumber
Raw material:Logs
Plane
Dry
Coproducts:Chips,
Sawdust,Bark,
RoughGreenlumber
SawBoiler
Coproduct:Planer
shavings
Product:Planed
drylumber
Raw material:Logs

14
Because of the difficulty in speciating the water-based materials and the small mass involved, it was decided to not enter this information in SimaPro 5 at this time. While some of the materials in this category require special handling, none are extremely toxic or fall within the HAPs category. The quantities are small.
Emissions: Emissions to air are for the entire mill complex, except that VOCs are included with the kilns where almost all of them come from and all boiler emissions are included in the boiler process. Similarly, solid emissions shown in this process are for the entire mill complex except that boiler ash is included with the boiler process.
Products and co-products: The product is rough green lumber. Most of this is eventually dried and planed and ends up as the main product for the mill complex. A small portion (0.16%) is sold as rough green lumber, a co-product. Other co-products include chips, sawdust, and bark. All of the chips end up as a co-product for the mill complex (none are burned). The SimaPro 5 value is that obtained by the survey divided by the rough green lumber co-product plus the planed dry lumber product to account for the chips associated with the green lumber co-product. The bark and sawdust were calculated similarly and include that going to the boiler. When the boiler process used these as inputs, then the values were reduced to actual co-products for the mill complex. All values are expressed as an oven-dry mass.

15
Table 6.2. SimaPro 5 process for sawing showing how data from survey was inserted into the model.
Substance Unit Value1 Low High Comment
Resources Logs, SE 138.4 cuft 129 151 Need to change to
technosphere Water (well, for cooling) 1319.7 lb 0 2680.9 159 gallons
Materials/fuels Distillate Fuel Oil (DFO) FAL 0.2817 gal 0.09 0.32 Surrogate for all organics
Electricity/heat Electricity, SE Selector 67.9 kWh 134 191 45% of 150.9 for whole
mill Gasoline equipment (BTU) 5962 BTU 2436 7742 For whole mill complex Diesel equipment (BTU) 54384 BTU 60597 120635 61.4% of 88596 for whole
mill Residual Fuel Oil (RFO) FAL 0.00149 Gal 0 0.00569 Surrogate for kerosene,
for whole mill
Emissions to air Dust (PM10)
3.8 lb 0.3 7.3 Entered value is 0.1< than
survey to not double count boiler
Solid emissions
Wood 1.67 lb 1.67 1.67 One mill reported this Paper/board packaging 2.46 lb 2.46 2.46 For "domestic waste", one
mill reported
Products Allocations Bark, SP, R, G 596.2 lb 298 561 13.15% oven-dry
weights Sawdust, SP, R, G 271.0 lb 167 338 5.97% Chips, SP, R, G 1447.4 lb 1324 1619 31.92% Lumber, SP, R, G 2216.6 lb 2043 2043 48.88% Lumber, SP, R, G (CP) 3.5 lb 0 20 0.08%
Notes: 1 Missing values were not included in averages.
6.2 DRYING
The inputs and outputs for the southern pine drying process are shown in Table 6.3. This process starts with rough green lumber and produces rough dry lumber as a product. It uses steam from the boiler as a thermal energy source. There is no change in the mass of the dry lumber during the process.
Inputs: The main input to drying is 1 Mbf of rough green lumber for each 1 Mbf of rough dry lumber produced. The thermal energy source is 3,654,000 BTUs of steam for each 1 Mbf of lumber dried. Because the reporting mills were not able to divide diesel and electricity, these were input as described in section 4.0 of this report.
Emissions: VOC emissions are produced. There are no other significant effluents, solid or liquid.

16
Products and co-products: The product, rough dry lumber, goes to the planer.
Table 6.3. SimaPro 5 process for drying showing how data from survey was inserted into the model.
Substance Unit Value Low High Comment
Materials/fuels Lumber, SP, R, G lb 2216.6
Electricity/heat
Electricity, SE kWh 37.7 25% of mill total (based on PNW and Puettmann)
Diesel equipment (BTU) BTU 7556 8.5% of mill total (based on PNW)
CORRIM Wood Boiler, Steam BTU 3654000 2901000 3786000 All from a wood-fired boiler
Trailer diesel FAL tkm 0 None (all manufacturing at one site)
Emissions to air
VOC lb 2.2 0.1 4.1 For whole mill
Products Allocation Lumber, SP, R, D lb 2216.6 2216.6 2216.6 100%
6.3 PLANING
The inputs and outputs for the southern pine planing process are shown in Table 6.4. In this process, rough dry lumber is machined on four sides to a finished dimension. Planer shavings are produced as a co-product.
Inputs: The main input to this process is rough dry lumber from the drying process. Because the reporting mills were not able to divide diesel and electricity, these were input as described in section 4.0 of this report.
Emissions: No emissions were reported for planing. They are included in the sawmill process.
Products and co-products: Planed dry lumber and planer shavings leave the process and are sold.

17
Table 6.4. SimaPro 5 process for planing showing how data from survey was inserted into the model.
Substance Unit Value Low High Comment
Materials/fuels Lumber, SP, R, D lb 2216.6 2216.0 2216.0 No trim losses were reported,
Electricity/heat
Electricity, SE kWh 22.6 15% of mill total (based on PNW and Puettmann)
Diesel equipment (BTU) BTU 17111 16.5% of mill total (based on PNW)
Products Allocations
Shavings, SP, P, D lb 342.1 252 521 14.98% Lumber, SP, P, D lb 1942.4 1942.0 1942.0 85.02%
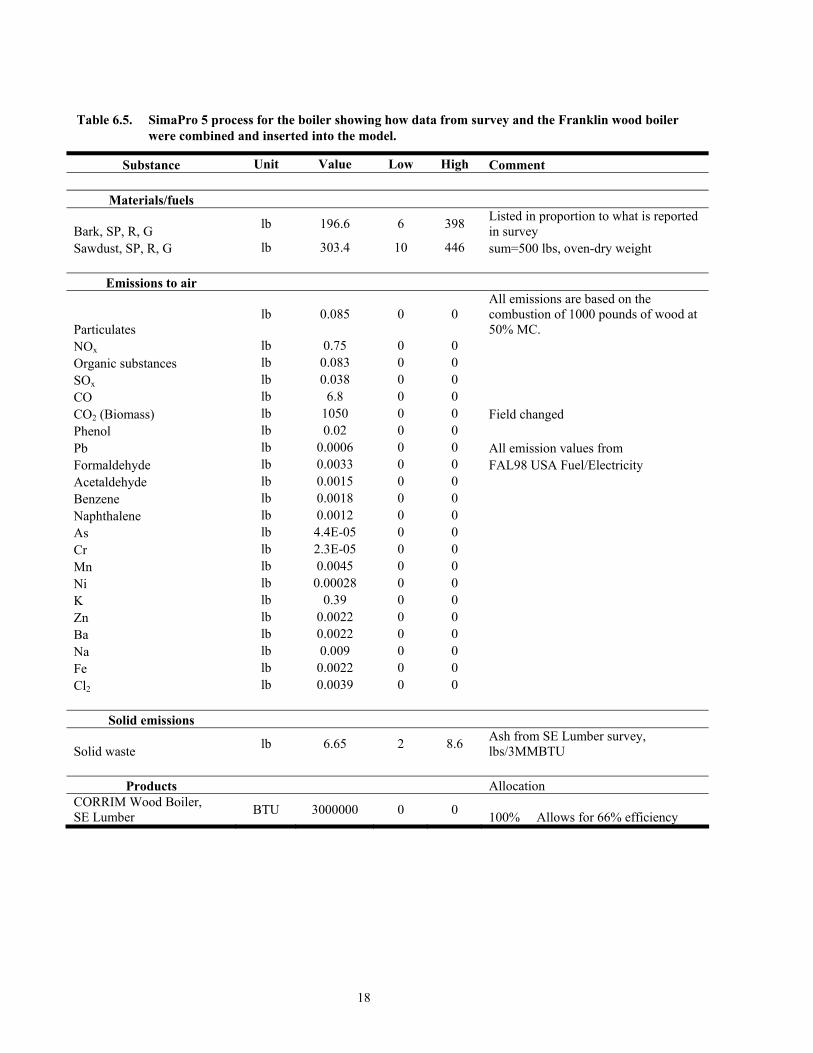
6.4 BOILER
The inputs and outputs for the southern pine boiler process are shown in Table 6.5. The wood boiler process is based on the Franklin database wood boiler. Wood and bark are burned to produce steam.
Inputs: In this boiler, 1000 pounds of wood (50% wet basis moisture content) are burned for each 3,000,000 BTUs of steam produced. The total fuel in Table 6.5 is 500 lbs because the output from the sawmill is in dry mass and the inputs here must match. The relative amounts of sawdust and bark burned were obtained from the survey.
Because the reporting mills were not able to divide fuels and electricity among the processes, these were input as described in section 4.0 of this report. The boiler output is in BTU of steam and the values in Table 4.2 are in BTU/Mbf of planed dry lumber. The values in Table 4.2 were divided by 3,654,000 BTU (required to dry 1 Mbf of lumber) to express them as energy per 3.6 MMBTU. They were then multiplied by 0.821 to express them as energy per 3 MMBTU and used as the input values shown in Table 6.5.
Emissions: The steam output for burning 1000 pounds of wood was set at 3,000,000 BTUs. This is a 67% efficiency from the Franklin value of 4,500,000 BTUs from 1000 pounds of wood. Emission values were not changed except that ash was set to match the survey.
Products and co-products: The product is steam. There are no co-products.
A boiler selector (Table 6.6) was placed in SimaPro so that steam could be a flow from nature or from any of three types of boilers. Based on the survey, the selector was set to use steam only from the wood boiler.
18
Table 6.5. SimaPro 5 process for the boiler showing how data from survey and the Franklin wood boiler were combined and inserted into the model.
Substance Unit Value Low High Comment
Materials/fuels
Bark, SP, R, G lb 196.6 6 398 Listed in proportion to what is reported in survey
Sawdust, SP, R, G lb 303.4 10 446 sum=500 lbs, oven-dry weight
Emissions to air
Particulates lb 0.085 0 0
All emissions are based on the combustion of 1000 pounds of wood at 50% MC.
NOx lb 0.75 0 0 Organic substances lb 0.083 0 0 SOx lb 0.038 0 0 CO lb 6.8 0 0 CO2 (Biomass) lb 1050 0 0 Field changed Phenol lb 0.02 0 0 Pb lb 0.0006 0 0 All emission values from Formaldehyde lb 0.0033 0 0 FAL98 USA Fuel/Electricity Acetaldehyde lb 0.0015 0 0 Benzene lb 0.0018 0 0 Naphthalene lb 0.0012 0 0 As lb 4.4E-05 0 0 Cr lb 2.3E-05 0 0 Mn lb 0.0045 0 0 Ni lb 0.00028 0 0 K lb 0.39 0 0 Zn lb 0.0022 0 0 Ba lb 0.0022 0 0 Na lb 0.009 0 0 Fe lb 0.0022 0 0 Cl2 lb 0.0039 0 0
Solid emissions
Solid waste lb 6.65 2 8.6 Ash from SE Lumber survey, lbs/3MMBTU
Products Allocation
CORRIM Wood Boiler, SE Lumber BTU 3000000 0 0 100% Allows for 66% efficiency

19
Table 6.6. SimaPro 5 process for boiler selector.
Substance Unit Value Low High Comment
Electricity/heat
Electricity, SE Selector kWh 0.0000051 0 0 Estimated at 15% of mill complex
Diesel Equipment (BTU) BTU 0.002145 0 0 10.8% of mill complex (based on PNW)
CORRIM Wood Boiler, SE Lumber BTU 1 0 0 Boiler amounts must sum to 1 BTU
Steam from Diesel Boiler BTU 0 0 0 Steam from Natural Gas Boiler BTU 0 0 0
Products Allocation Boiler, SE Selector BTU 1 0 0 100%
6.5 ELECTRICITY
The electricity was supplied to the other processes from the sources shown in Table 6.7
Inputs: The inputs use the Franklin database (Franklin 2001) and the values sum to 1 kWh. These individual values were set to match DOE power generation statistics for 2000 for the survey region. For example, 23% of the electricity is generated from natural gas.
Emissions: There are no direct emissions associated with this process. Emissions due to use of electrical power are calculated in SimaPro using the Franklin database.
Products and co-products: The product is 1 kWh of electricity.
An electricity selector (Table 6.8) was placed in SimaPro so that electricity could be a flow from nature or come from the SE power grid. For the values in this report electricity was assumed to come from the SE grid in Table 6.7.

20
Table 6.7. SimaPro 5 process for the SE electricity showing how the DOE electrical source data was inserted into the model.
Substance Unit Value Comment All inputs must add to 1kWh
Resources Energy (undef.) kWh 0.035 Wind, solar, and other
Electricity/heat Electricity hydropower FAL kWh 0.018 Electricity from uranium FAL kWh 0.216 with DOE 2000 values Electricity from RFO FAL kWh 0.045 Electricity from nat. gas FAL kWh 0.23 Electricity from coal FAL kWh 0.456
Products Allocation Electricity, SE kWh 1 100%
Table 6.8. SimaPro 5 process for electricity selector.
Substance Unit Value Comment Inputs must sum to 1
Resources Energy (undef.) kWh 0 Set to 1 to neglect impact of electric generation
Materials/fuels Electricity, SE kWh 1 Set to 1 to include impact of electric generation
Products Allocation Electricity, SE Selector kWh 1 100%

21
7.0 LCI ESTIMATES FOR PRODUCTION OF PRODUCTS AND CO-PRODUCTS
LCI estimates will be presented for the product, one Mbf of southern pine dimension lumber, and the co-products. The co-products are 0.0016 Mbf of rough green lumber, 1447.4 lbs of chips, 181.7 pounds of bark, 76.3 pounds of sawdust, and 342.1 lbs of shavings (all masses are dry). These estimates are shown in Tables 7.1 to 7.5.
7.1 RAW MATERIALS
The raw materials used are shown in Table 7.1. Logs are the greatest material input followed by water and coal. The coal is used for off-site electricity production. The value of 2.08 m3 of logs per Mbf of planed dry lumber means that 53% of the log either ends up as lumber or fuel to dry it. Chips account for 32% of the log.
Table 7.1. Exported results from SimaPro 5 for gate-to-gate LCI of raw materials for the production of one Mbf of planed dry lumber and associated co-products.
Product Co-products Total Unit Planed Rough Products Dry Green Green Green Dry and Substance Lumber Lumber Chips Bark Sawdust Shavings Co-products Logs, SE m3 2.08 0.003 1.25 0.16 0.07 0.37 3.9 Water (well, for cooling) kg 317 0.479 191 24 10.1 55.9 598.5
Coal FAL kg 23.8 0.013 5.02 0.63 0.26 4.2 33.9 Natural gas FAL kg 7.32 0.004 1.57 0.20 0.08 1.29 10.5
Crude oil FAL kg 3.54 0.003 1.11 0.14 0.06 0.62 5.5
Limestone kg 1.37 0.001 0.29 0.04 0.02 0.24 2.0 Wood/wood wastes FAL g 21.1 0.011 4.71 0.59 0.25 3.7 30.4
Uranium FAL mg 121 0.064 25.4 3.19 1.34 21.3 172.3
7.2 AIRBORNE EMISSIONS
The airborne emissions are shown in Table 7.2. CO2 is the greatest emission. If designated as “Biomass,” then it originates from the burning of wood or bark on site. If designated as “nonfossil,” then the CO2 does not originate within the sawmill complex, but is associated with materials or energy entering the complex and Is probably from biomass combustion. SimaPro 5 uses this designation to separate fossil and nonfossil CO2.

22
Table 7.2. Exported results from SimaPro 5 for gate-to-gate LCI of airborne emissions for the production of one Mbf of planed dry lumber and associated co-products.
Product Co-products Total Unit Planed Rough Products Dry Green Green Green Dry and
Substance Lumber Lumber Chips Bark Sawdust Shavings Co-
products CO2 (Biomass) kg 493 86.9 579.9 CO2 (fossil) kg 77 0.04 16.8 2.11 0.89 13.6 110.4 CO kg 3.3 0.000 0.04 0.01 0.00 0.58 3.9 Dust (PM10) kg 0.9 0.001 0.55 0.07 0.03 0.16 1.7 VOC g 848 0.000 0.00 0.00 0.00 149 997 NOx g 707 0.210 83.8 10.50 4.41 124 929 SOx g 638 0.332 132 16.60 6.97 112 905 Methane g 159 0.084 33.7 4.23 1.77 28 227 K g 183 x x x x 32.3 215 Non methane VOC
g 97 0.061 24.2 3.04 1.28 17.2 143
Particulates (unspecified)
g 61 0.032 12.9 1.61 0.68 10.7 87
Particulates g 46 0.005 1.95 0.25 0.10 8.1 57 Organic substances
g 39 0.000 0.10 0.01 0.01 6.9 46
CO2 (non- fossil)
g 28 0.016 6.24 0.78 0.33 5.0 41
Particulates (PM10)
g 12 0.006 2.70 0.34 0.14 2.3 18
Phenol g 9.4 0.000 0.00 0.00 0.00 1.66 11 HCl g 4.4 0.002 0.93 0.12 0.05 0.78 6.2 Na g 4.2 x x x x 0.75 5.0 Formaldehyde g 2.9 0.001 0.43 0.05 0.02 0.51 3.9 Mn g 2.1 0.000 0.000 0.000 0.000 0.37 2.5 Cl2 g 1.85 0.000 0.000 0.000 0.000 0.32 2.2 Zn g 1.03 x x x x 0.18 1.2 Fe g 1.03 x x x x 0.18 1.2 Ba g 1.03 x x x x 0.18 1.2
Note: Substances below 1g omitted
7.3 WATERBORNE EMISSIONS
The water emissions are shown in Table 7.3. These are all associated with the inputs to the mill.

23
Table 7.3. Exported results from SimaPro 5 for gate-to-gate LCI of waterborne emissions for the production of one Mbf of planed dry lumber and associated co-products.
Product Co-products Total Unit Planed Rough Products Dry Green Green Green Dry and Substance Lumber Lumber Chips Bark Sawdust Shavings Co-products Dissolved solids
g 392 0.211 84 10.6 4.4 69 561
Suspended solids
g 44 0.023 9.2 1.16 0.5 7.7 62
Sulphate g 27 0.014 5.8 0.72 0.30 4.8 39 Cl- g 18 0.009 3.8 0.48 0.20 3.2 26 Oil g 6.9 0.003 1.5 0.19 0.08 1.2 10 COD g 5.6 0.003 1.2 0.15 0.06 1.0 8.1 Fe g 3.3 0.002 0.7 0.09 0.04 0.6 4.8 B g 2.3 0.001 0.5 0.06 0.03 0.4 3.3 Mn g 1.9 0.001 0.4 0.05 0.02 0.3 2.7 Other organics
g 1.6 0.001 0.3 0.04 0.02 0.3 2.2
Note: Substances below 1g omitted
7.4 SOLID EMISSIONS
The solid emissions are shown in Table 7.4
Table 7.4. Exported results from SimaPro 5 for gate-to-gate LCI of solid emissions for the production of one Mbf of planed dry lumber and associated co-products.
Product Co-products Total Unit Planed Rough Products Dry Green Green Green Dry and Substance Lumber Lumber Chips Bark Sawdust Shavings Co-products Solid waste kg 14.6 0.006 2.4 0.30 0.127 2.6 20 Paper/board packaging
kg 0.6 0.001 0.4 0.004 0.018 0.101 1.1
Wood g 401 0.606 242 30.4 12.7 70.7 757
7.5 ENERGY
The energy consumed is shown in Table 7.5. The total, 2042 MJ, is much greater than reported in the survey. The electrical energy in the survey was 150 kWhs (543 MJ) and the fuel accounts for 95,000 BTU (100MJ). This difference reflects the efficiency with which the resources are converted into delivered fuels, approximately 31% (643/2042 = 0.31). It is important to note that very little of the thermal energy for drying appears in Table 7.5 because it is generated internally from a material input. Only the portion of the energy used by the sawmill which is used to generate the bark and sawdust burned in the boiler would be associated with drying. The electricity for the boiler would also be associated with the thermal drying energy. The thermal energy for drying is 3,654,000 BTU (3843 MJ) and comes mostly from the embodied energy in the sawdust and bark which is burned.

24
Table 7.5. Exported results from SimaPro 5 for gate-to-gate LCI of energy for the production of one Mbf of planed dry lumber and associated co-products.
Product Co-products Total
Unit Planed Rough Products (LHV) Dry Green Green Green Dry and
Substance Lumber Lumber Chips Bark Sawdust Shavings Co-
products Coal FAL MJ 629 0.3 133 17 7.0 111 897 Natural gas FAL MJ 343 0.2 73 9.2 3.9 60 490 Uranium FAL MJ 276 0.15 58 7.3 3.1 49 393 Crude oil FAL MJ 149 0.12 47 5.8 2.7 26 230 Energy (undef.) MJ 13 0.01 2.8 0.3 0.1 2.3 19 Energy from hydro MJ 6.8 0.00 1.4 0.2 0.1 1.2 9.7 Total MJ 1420 0.8 315 40 17 250 2042

25
8.0 SENSITIVITY
A sensitivity analysis was done on selected variables likely to have impact on the LCI results. These were the potential for cogeneration of electricity compared to using purchased electricity and the steam use at the dry kiln. Other variables would yield very straightforward results because the SimaPro 5 inputs and outputs are based on the lumber production. For example, if lumber recovery from the log were changed, all inputs and outputs would remain the same except logs. Electricity from the SE grid was used in these analyses.
8.1 EFFECT OF COGENERATION None of the mills surveyed cogenerated electricity. Doing so could eliminate purchased electricity and the environmental effects associated with it. This is not easy to model with the available data because we don’t know how much the biomass fuel burned would increase. Because wood-based fuels are being burned for thermal energy already, we believe that additional environmental effects due to the cogeneration would be small compared to eliminating purchased electricity. We therefore ran the SimaPro 5 model with and without purchased electricity as a first order approximation of the effect of cogeneration on the life cycle inventory. This is shown in Table 8.1. Logs, water, and other variables tied to wood production are unchanged in cogeneration scenarios because the wood used does not change. In practice, these would increase somewhat with the wood burned. Raw materials associated with electricity production decrease, such as coal, natural gas, and uranium. Biomass CO2 emissions remain unchanged in this model, but would increase with the increased wood fuel consumed in an actual situation. A 10% increase in the wood fuel burned would result in approximately 50 kg of additional biomass CO2. This would be partially offset by the 40 kg decrease in fossil CO2. This would be a favorable environmental tradeoff. SO2 emissions, associated with acid rain, decrease by a factor of two. Most waterborne emissions decrease, as do solid emissions. Any increase in ash at the boiler is more than offset by reductions of solid emissions in other places. Energy use decreases dramatically because it is internally generated from biomass from the logs.

26
Table 8.1. Effect of eliminating purchased electricity to simulate on-site cogeneration of all electricity.
Unit No 100% Substance (/Mbf) Cogen Cogen Raw materials Logs, SE m3 2.08 2.08 Water (well, for cooling) kg 317 317 Coal FAL kg 23.8 11.9 Natural gas FAL kg 7.32 3.71 Crude oil FAL kg 3.54 2.77 Limestone kg 1.37 0.69 Wood/wood wastes FAL g 21.1 11.2 Uranium FAL mg 121 60.1 Air CO2 (Biomass) kg 493 493 CO2 (fossil) kg 77 41 CO kg 3.3 3.3 Dust (PM10) kg 0.9 0.9 VOC g 848 848 SOx g 707 333 NOx g 638 574 Methane g 159 79.7 Water Dissolved solids g 392 200 Suspended solids g 44 22 Sulphate g 27 14 Cl- g 18 9.1 Oil g 6.9 3.6 COD g 5.6 2.9 Fe g 3.3 2.66 B g 2.3 1.7 Mn g 1.9 0.9 Other organics g 1.6 0.8 Solid Solid waste kg 14.6 10.4 Energy (LHV) Total MJ 1420 938 Coal FAL MJ 629 314 Natural gas FAL MJ 343 193 Uranium FAL MJ 276 138 Crude oil FAL MJ 149 116
Notes: Values are per Mbf of planed dry lumber produced.

27
8.2 DRYER ENERGY EFFICIENCY
The steam required for drying was 3,654,000 BTU/Mbf (base case). Increasing and decreasing this in the model by 10% tested the sensitivity of analysis to dryer efficiency. These results are shown in Table 8.2
Dryer energy use is the major factor affecting material and energy use during the manufacturing of planed dry lumber. This is not evident in Table 8.2 because most of the thermal energy for the dryer is 100% generated from within the sawmill complex. Log use increases with energy use because more of the sawmill co-products are burned meaning that the mill complex produces lesser amounts of co-products (such as sawdust) for sale.
Table 8.2. Effect of increasing or decreasing thermal energy use at the dryer by 10%.
Substance Unit (/Mbf) -10% Base 10% Raw Logs, SE m3 2.04 2.08 2.12 Water (well, for cooling) kg 311 317 324 Coal FAL kg 23 24 24 Natural gas FAL kg 7.2 7.3 7.5 Crude oil FAL kg 3.4 3.5 3.6 Air CO2 (Biomass) kg 448 493 543 CO2 (fossil) kg 75 77 79 CO kg 3.0 3.3 3.6 VOC g 848 848 848 SOx g 488 707 926 NOx g 624 638 750 Methane g 156 159 163 CO2 (non-fossil) g 28 28 28 Particulates (PM10) g 12 12 13 Phenol g 8.5 9.4 10 HCl g 4.3 4.4 4.5 Na g 3.8 4.2 4.6 Formaldehyde g 2.7 2.9 3.1 Mn g 1.9 2.1 2.3 Water Dissolved solids g 384 392 401 Suspended solids g 43 44 45 Solid Solid waste kg 14.0 14.6 15.1 Energy Total (LHV) MJ 1390 1420 1450 Coal FAL MJ 616 629 644 Natural gas FAL MJ 335 343 350 Uranium FAL MJ 271 276 283 Crude oil FAL MJ 145 149 152 Energy (undef.) MJ 13 13 13 Energy from hydro power MJ 6.8 6.8 6.8
Notes: Values are per Mbf of planed lumber produced.

28
9.0 CARBON BALANCE
A biomass carbon balance for wood input into the process is shown in Table 9.1. Inputs at the top of the table include logs and fuel to the boiler. Outputs appear below.
The left column in Table 9.1 is the material. The second column is the amount in or out of the unit process in SimaPro 5. The third column, the unit process factor, scales the values to 1000 Mbf of planed dry lumber. For example, the energy generation (boiler) process must run 1.218 times for each one Mbf of planed dry lumber produced. The fourth column is the ratio of the mass of carbon to the total mass of the compounds or materials. For chemicals, these are based on their respective formulae. The carbon content values for southern pine wood and bark came from Georgia Institute of Technology, 1984. The carbon in and out balance is within 6%.
The sum of the carbon out of all unit processes is 2450 lbs/Mbf. Of this, 355 lbs, or 14.4%, are biomass CO2 emissions. The balance of the carbon into the process leaves the mill as products and co-products.

29
Table 9.1. Biomass carbon balance for production of one Mbf of planed dry southern pine lumber.
Mass to or
from Unit process Carbon the unit factor per ratio in Carbon Material process /Mbf PDL material lb/Mbf Inputs Sawing Southern pine logs (wood) 3810 1 0.520 1981.2 Southern pine logs (bark) 596 1 0.570 339.7 Energy generation Wood and bark fuel 500 1.218 0.550 335.0 Sum of Inputs 2320.9 Outputs Products (planed, dry) Southern pine lumber 1942 1 0.520 1009.8 Co-products Sawmill Chips 1450 1 0.520 754.0 Rough green lumber 3.5 1 Sawdust 76.5 1 0.520 39.8 Bark 182 1 0.570 103.7 Planer Shavings 342 1 0.520 177.8 Air emissions Sawing Dust or particulate 3.8 1 0.520 2.0 Drying VOC 2.2 1 0.882 1.9 Energy generation Dust or particulate 8.5E-02 1.218 0.520 0.1 CO 6.8 1.218 0.429 3.6 CO2 1050 1.218 0.278 355.5 Organic substances 0.083 1.218 0.882 0.1 Phenol 0.020 1.218 0.770 0.0 Formaldehyde 0.003 1.218 0.400 0.0 Acetaldehyde 0.002 1.218 0.540 0.0 Benzene 0.002 1.218 0.920 0.0 Naphthalene 0.001 1.218 0.940 0.0 Planing Dust or particulate 0.081 1 0.520 0.0 Solid waste Sawing Wood 1.670 1 0.520 0.9 Sum of Outputs 2449.6
Notes: Italicized items are not included in total to avoid double counting.

30
10.0 COST ANALYSIS
A cost analysis was completed for the sawing, drying, energy generation and planing processes combined. This was based on a 120,000 Mbf/yr sawmill and was a composite of the SE dimension lumber mills surveyed.
The assumptions for this analysis are shown in Table 10.1. Capital cost estimates were obtained from a manufacturer for a mill of average technology. Material and energy costs were set to match other CORRIM modules, where possible. Lumber prices came from the Timber Mart-South 3rd quarter 2002 report. Insurance, maintenance, and labor costs were estimated based on conversations with mill managers. The mill description items are derived from the inputs and outputs in this report.
The results shown in Table 10.2 are based on the assumptions presented in Table 10.1. Data in the far right column of Table 2 is expressed on a basis of one Mbf of total production. Profitability most closely tied to the log and lumber prices as these are the greatest values in the table.

31
Table 10.1 Assumptions for cost analysis.
Item Cost Unit Comments Capital cost of sawmill complex 57,000,000 $ Installed, not including land Salvage value 20 % of new cost Service life of capital 20 years Interest rate 8 % Wood material costs
Southern pine logs 384 $/Mbf log
Timber Mart-South; $400/Mbf Doyle in MSU Timber Price Report July/Aug. 2002
Southern pine, 2&btr lumber 315 $/Mbf TimberMart-South $289 in Crows on Sept 20, 2002
chips 40 $/odt TimberMart-South bark 10 $/odt Estimate hog fuel 10 $/odt Estimate planer shavings 20 $/odt Estimate sawdust 10 $/odt Estimate Other materials www.cpic.com/account/rates electricity purchased 0.1060 $ / kWh demand, energy and monthly charges diesel 0.65 $/gal estimate gasoline 0.90 $/gal estimate propane 0.90 $/gal estimate water 0.05 $/gal CEP, June 2002 Insurance 80,000 $/year Estimate Maintenance 2,400,000 $/year 20 $/Mbf, Mill manager estimate Labor people 0.0005 # /Mbf 1 person per 2 mmbf/yr wages 40,000 $ /yr Estimate for labor plus benefits Mill description production 120,000.000 mbf pdl logs purchased 0.304 mbf pdl 4406 lbs/2000 lbs/ton/7.25 ton/mbf chips sold 0.725 odt/Mbf pdl 1450 lbs/2000lb/ton bark produced 0.091 odt/Mbf pdl 182 lbs/2000lb/ton planer shavings produced 0.171 odt/Mbf pdl 342 lbs/2000 lb/ton sawdust produced 0.38 odt/Mbf pdl 76.5 lbs/2000 lb/ton electrical used 150.9 kWh/Mbf 150.9 kWh/mbf diesel 0.64 gal/Mbf pdl 88596 BTU/138000 BTU/gal water 159 gal/Mbf pdl gasoline 0.043 gal/Mbf pdl 5962 BTU/138000 BTU/gal propane 0.0197 gal/Mbf pdl 1790 BTU/91000 BTU/gal inventory 5,110.00 mbf logs one month of logs

32
Table 10.2. Cost analysis for a 120 Mbf sawmill.
$/Mbf of total Fixed costs $/yr production Interest on capital 4,560,000 38 Insurance 80,000 0.667 Maintenance 2,400,000 20 Variable costs Material water 954,000 7.95 Southern pine logs 14,001,964 116.68 Energy electricity 1,919,448 16.00 diesel 50,076 0.42 gasoline 4,666 0.04 propane 2,124 0.02 Labor 2,400,000 20.00 Interest on inventory 156,979 1.31 Total costs 26,529,258 221.08 Income planed dry southern pine lumber 37,800,000 315.00 chips sold 3,480,000 29.00 bark sold 109,200 0.91 sawdust sold 459,000 3.83 planer shavings 410,400 3.42 Total income 42,258,600 352.16 Pre-depreciation profit or (loss) 15,729,342 131.08 Depreciation cost new $57,000,000 salvage value $11,400,000 depreciation 2,280,000 19.00 Pre tax profit or (loss) 13,449,342 112.08

33
11.0 CONCLUSIONS
The data collected on sawing and planing represents 6.4% of the southern pine dimension lumber produced in Louisiana, Mississippi, Georgia, and Alabama. Three sawing technologies were represented, chip and saw, band mill, and curve sawing.
The lumber manufacturing process has few on-site emissions from sawing and planing. The dryer emits small amounts of VOCs from wood and the boiler has emissions associated with burning wood. Total energy use in lumber manufacturing is driven by the drying process which consumes over 85% of all energy; however, the southern mills generated this internally from wood residue and were independent of natural gas. This makes the life cycle inventory very favorable with respect to energy use.
34
12.0 REFERENCES
Briggs, D. 1994. Forest products measurements and conversion factors: with special emphasis on the US Pacific Northwest. College of Forest Resources. University of Washington. Contribution #75.
Forest Products Laboratory. 1999. Wood Handbook -- Wood as an Engineering Material. General Technical Report. FPL-GTR-113. USDA Forest Service, Forest Products Laboratory, Madison, WI. 463p
Franklin Associates. 2001. The Franklin Associates Life Cycle Inventory Database. SimaPro5 Life-Cycle Assessment Software Package, version 36, 2001.
Georgia Institute of Technology, 1984. The Industrial Wood Energy Use Book. Van Nostrand Reinhold, NY.240 pp.
Gibson, M., C. McMillin and E. Shoulders. 1986. Moisture content and specific gravity of the four major southern pines under the same age and site conditions. Wood and Fiber Science 18(3):428-435
NCASI. 2002. A comparative study of VOC emissions from small-scale and full-scale lumber kilns drying southern pine.Tech. Bull # 845. c. 350 pp.
Panshin, A.J. and C. de Zeeuw. 1980. Textbook of Wood Technology. New York: McGraw-Hill, Inc. 722p.
Puettmann, M.E. and J.L. Bowyer. 2002. Environmental Life-Cycle Assessment of Southern Pine Lumber Treated with Borate Wood Preservative. Submitted to Journal of Industrial Ecology.
Southern Forest Products Association. 2001. Industry Statistics. Webpage address: http://www.sfpa.org/Industry_Statistics/ISregprod.htm. (August 06, 2001).
USDA. 1988. Dry Kiln Operator’s Manual. Forest Products Laboratry, Ag. Handbook #188. 274pp.

35
APPENDIX 1: SOUTHEAST US SOFTWOOD LUMBER INDUSTRY SURVEY

36
CORRIM RAW MATERIALS DATABASE INITIATIVE LIFE CYCLE INVENTORY ANALYSIS OF THE
SOUTHEAST US SOFTWOOD LUMBER INDUSTRY
-- MILL QUESTIONNAIRE --
Company Name: ______________________________
Mill Address: ______________________________
______________________________
Mill ID code: ____________________
Contact Person: ______________________________
Position Title: ______________________________
Telephone: ____________________
Fax: ____________________
This questionnaire is divided into six parts.
• Part I deals with a basic description of your mill and its operations. • Parts II- VI focus on the environmental input and output specifics of the four unit processes required in the course of manufacturing of
softwood dimension lumber. These unit processes have been broken down as follows:
Part II - Resource extraction (inclusive. of roundwood harvesting and transportation). Part III - Sawmilling Part IV - Boiler Part V - Kiln Drying Part VI - Planer Mill (planing and packaging of lumber)
Please complete all parts of the questionnaire by either printing or typing responses in the spaces provided.

37
CRMD: Mill Questionnaire SPACE IS PROVIDED THROUGHOUT THE QUESTIONNAIRE FOR ANY ADDITIONAL COMMENTS, CLARIFICATIONS OR OBSERVATIONS YOUMIGHT CARE TO ADD. PART I – Basic Mill Description
LIFE CYCLE INVENTORY ANALYSIS DATA AVAILABILITY AND INPUT SHEET
Unit Process: OPERATION OVERVIEW Reporting Location
TIME PERIOD Starting Month Ending Month 1. Mill type (please check one): o Dimension mill o Stud mill o Other (specify) __ ______________ 2. Lumber Production
• for reporting year ___________ MMbf • percent kiln dried ______ % 3. Please indicate the number of head rigs (processing lines): _____ rigs
4. Please provide a schematic of the basic plant layout or check all applicable process centers and equipment types in the following list.
log conditioning center ( ο pond or ο yard ) log sorter/merchandizer debarking head rig(s) specify _______________________
____________________________ resaws edger(s) edger optimizer trimmer trimmer optimizer kiln(s)
conventional steam high temperature dehumidification
planer mill process heat boiler cogeneration facility bag house other(s) _______________________

38
CRMD: Mill Questionnaire 5. Please indicate the distance between the following mill process areas:
Location Destination Distance Units Log Yard Log Deck Green Chain Sorter Dry Kiln Dry Kiln Planer Mill Planer Mill Lumber Storage/Shipping
6. Please indicate the material inputs for all carrier equipment used to transport wood materials throughout each
production process:
LOG YARD CARRIERS Material Inputs Units Quantity Hours Used
Carrier Fuel Oil Grease Hydraulic Fluid Antifreeze Ether Other(s)
DRY KILN CARRIERS
Material Inputs Units Quantity Hours Used Carrier Fuel Oil Grease Hydraulic Fluid Antifreeze Ether Other(s)

39
PLANER MILL CARRIERS Material Inputs Units Quantity Hours Used
Carrier Fuel Oil Grease Hydraulic Fluid Antifreeze Ether Other(s)
STORAGE / SHIPPING CARRIERS Material Inputs Units Quantity Hours Used
Carrier Fuel Oil Grease Hydraulic Fluid Antifreeze Ether Other(s)
7. If present, please indicate the capacity of every process heat boiler:
Boiler #1 _______ btu's/hour Boiler #2 _______ btu's/hour Boiler #3 _______ btu's/hour
8. If present, please indicate the cogeneration facility capacity:
_______ Kw/hour or _______ Mw/hour plus process heat _______ btu's/hour

40
TIMBER INPUTS
1. In the space below, please describe the scaling rule or method used to quantify timber inputs to your mill. ____________________________________________________ 2. For the selected reporting year, what was the total timber input to your mill?
_____________ bf/year or m3/yr or _____________ m3/yr or _____________ cubic feet per year 3. Please complete the following table showing the breakdown of the tree species and approximate sizes
processed by your mill.
Species % of total
timber input Average log length
(meters) Average log diameter
(centimeters)
6. Which of the following best describes your timber harvesting method (please check one)
ο manual (chainsaw felling and cable skidder) ο mechanized logging (felling, forwarder, delimber) ο other (describe)_________________________________________________

41
MANUFACTURING 1. Please complete either column 2 or column 3 in the following table to show average annual production
levels for the selected reporting year by lumber size.
LUMBER SIZE
COLUMN 2
MMbf/yr.
Column 3
Per Shift Tally (Mbf)
2. Please fill in the spaces below to show average annual product and co-product recovery for the selected reporting year. If you measure in different units
than those indicated, please use the appropriate space provided to the right and show the units of measure. Volume Volume Alternate
Product Recovered Recovered Units
Lumber (green) ____________ MMbf/yr or ____________ ____________
Lumber (KD) ____________ MMbf/yr or ____________ ____________
Pulpchips ____________ short tons/yr or ____________ ____________
Planer shavings ____________ short tons/yr or ____________ ____________
Sawdust ____________ short tons/yr or ____________ ____________
Bark ____________ short tons/yr or ____________ ____________
Other ____________ short tons/yr or ____________ ____________
Other ____________ short tons/yr or ____________ ____________

42
3. For each of the co-products, please indicate the percentages of total production for the reporting period that are shipped to other users, used internally,
landfilled or stockpiled for future use.
Used Co-product Shipped Internally Landfilled Stockpiled Total _______ Pulp chips ________ ________ ________ ________ 100%
Planer shavings ________ ________ ________ ________ 100% Sawdust ________ ________ ________ ________ 100% Bark ________ ________ ________ ________ 100%
4. If any hog fuel used on-site is purchased from other sources, please indicate the amounts by type in the spaces provided below. Please make sure you
show the units of measure (e.g. green tons or kgs). Per Year Per Mbf Units
PLANER SHAVINGS ________ ________ ________ Sawdust ________ ________ ________ Bark ________ ________ ________ Other_________ ________ ________ ________
1. What is the average percent drying degrade for lumber? ________%
2. Is degraded material chipped and sold? o Yes o No If you answered Yes, please specify the use of chipped material.
ο Hog fuel ο Pulp chips ο Other (please specify) _______________
If you answered “No”, please briefly describe the final disposition of degraded material. ____________________________________________________________ ____________________________________________________________ ____________________________________________________________

43
CRMD: Mill Questionnaire
PART II –RESOURCE EXTRACTION SHEET 1 NOTES
LIFE CYCLE INVENTORY ANALYSIS DATA AVAILABILITY AND INPUT SHEET UNIT PROCESS: RESOURCE EXTRACTION REPORTING LOCATION
TIME PERIOD STARTING MONTH ENDING MONTH
DESCRIPTION OF UNIT PROCESS This unit process begins in the forest with the harvesting of trees. The operations associated with this unit process include: • removal of trees as per an agreed to management regime; • transformation of the tree (delimbing and/or bucking) and forwarding to roadside; • transportation of the tree lengths or logs to the final mill destination; • maintenance and repair of all logging and transportation vehicles and equipment; and • the treatment of process air, liquids and solids; and • site restoration and regeneration which may include (site preparation, planting, aerial seeding or natural regeneration).. The outputs of this unit process are logs or treelengths delivered to the sawmill. Notes: (exceptions/additions) _____________________________________________________ _____________________________________________________________________________ _____________________________________________________________________________ _____________________________________________________________________________ _____________________________________________________________________________ _____________________________________________________________________________ _____________________________________________________________________________

44
CRMD: Mill Questionnaire Sheet 2 NOTES
LIFE CYCLE INVENTORY ANALYSIS DATA AVAILABILITY AND INPUT SHEET
Unit Process: RESOURCE EXTRACTION Reporting Location
PRODUCT OUTPUTS Units Quantity
Transport Type Average Load
Avg. Delivery Distance
TREELENGTHS
Sawlogs
Pulpwood
Pulpchips
Other(s)
Notes: For wood product outputs please briefly describe scaling method used: __________________________________________________________________________ __________________________________________________________________________

45
CRMD: Mill Questionnaire Sheet 3 NOTES
LIFE CYCLE INVENTORY ANALYSIS DATA AVAILABILITY AND INPUT SHEET
Unit Process: RESOURCE EXTRACTION Reporting Location
MATERIAL INPUTS Units Quantity
Transport Type Average Load
Avg. Delivery Distance
HYDRAULIC OILS
Greases
Motor Oil Other(s)

46
Sheet 4 NOTES LIFE CYCLE INVENTORY ANALYSIS DATA AVAILABILITY AND INPUT SHEET
Unit Process: RESOURCE EXTRACTION Reporting Location
Water Consumption UNITS Quantity
SURFACE WATER GROUNDWATER Note: If the source of water used is surface water, then only report net consumption (see questionnaire guidelines for definition of net water usage). If the source water is groundwater, then the total waterremoved from the water table should be reported. Energy Inputs Units Quantity Heavy Fuel Oil Medium Fuel Oil Light Fuel Oil Kerosene Gasoline Diesel Fuel Propane Natural Gas Coal Biomass (hogfuel) Other (specify) Purchased Steam PURCHASED ELECTRICITY
NOTE: IF STEAM OR SELF GENERATED ELECTRICITY IS PRODUCED ON-SITE, THEN THE FUELS USED TO GENERATE THE STEAM OR electricity should be included in the inputs above. Also indicate steam and/or electricity generation hourly capacities in margin to the right of the energy input table.

47
Sheet 5 NOTES
LIFE CYCLE INVENTORY ANALYSIS DATA AVAILABILITY AND INPUT SHEET
Unit Process: RESOURCE EXTRACTION Reporting Location
AIR EMISSIONS
Units Quantity Describe Sampling Procedure (Attach additional sheets if necessary)
Dust Particulates NOX Organics
Hydrocarbons Others (specify)
Note: The following are examples of the data categories associated with Air Emissions: Cl2, CO, CO2, Dust/Particulates, F2, H2SO4, HCl, HF, Hg, Hydrocarbons*, N2O, NH3, NOX,
Organics*, Other metals*, Pb, SO, Other (please specify) *Please list compounds included in these categories

48
Sheet 6 NOTES
LIFE CYCLE INVENTORY ANALYSIS DATA AVAILABILITY AND INPUT SHEET
Unit Process: RESOURCE EXTRACTION Reporting Location
WATER EFFLUENT
Units Quantity Describe Sampling Procedure (Attach additional sheets if necessary)
SUSPENDED SOLIDS
BOD COD Oil & Grease Phenols Stain Prevention Chemicals
Others (specify) Note: The following are examples of the data categories associated with Water Effluent: Acids as H+, BOD, COD, Cl-, CN-, Detergents, Oils and Greases, Dissolved Organics*, F-, Fe ions, Hg, Hydrocarbons, Na+, NH4
+, NO3, Organo-Chlorine*, Other Metals*, Other N*, Phenols, Phosphates, SO4, Suspended Solids, Other (please specify) *Please list compounds included in these categories

49
CRMD: Mill Questionnaire Sheet 7
LIFE CYCLE INVENTORY ANALYSIS DATA AVAILABILITY AND INPUT SHEET
Unit Process: RESOURCE EXTRACTION Reporting Location
SOLID WASTE
Units Quantity Transport Type Average Load Avg. Delivery Distance
Describe Sampling Procedure * (Attach additional sheets if necessary)
Wood fiber Ash Inorganic material e.g. sand
Domestic waste
Others (specify)
* Please provide comprehensive description NOTES:

50
CRMD: Mill Questionnaire
PART III -SAWMILLING SHEET 1 NOTES
LIFE CYCLE INVENTORY ANALYSIS DATA AVAILABILITY AND INPUT SHEET UNIT PROCESS: SAWMILLING REPORTING LOCATION
TIME PERIOD STARTING MONTH ENDING MONTH
DESCRIPTION OF UNIT PROCESS This unit process begins with logs or treelengths in the mill yard. The operations associated with this unit process include: • the cutting to length of treelengths, sorting and storage of logs; • the debarking of the log input into the sawmill; • the breakdown of logs into rough lumber, pulp chips, bark and sawdust; • maintenance and repair of all sawmill equipment and yard transportation vehicles; • the treatment of process air, liquids and solids; and • in-yard-conveyance of rough lumber to kiln drying or planer facilities. The outputs of this unit process are rough green lumber, pulp chips, bark and sawdust. Notes: (exceptions/additions) _____________________________________________________ _____________________________________________________________________________ _____________________________________________________________________________ _____________________________________________________________________________ _____________________________________________________________________________ _____________________________________________________________________________ _____________________________________________________________________________ _____________________________________________________________________________

51
Sheet 2 NOTES
LIFE CYCLE INVENTORY ANALYSIS DATA AVAILABILITY AND INPUT SHEET
Unit Process: SAWMILLING Reporting Location PRODUCT & ENERGY OUTPUTS UNITS Quantity
Transport Type Average Load
Avg. Delivery Distance
Rough green lumber
Pulpchips Sawdust Bark Other(s) Self-generated process steam
Self-generated electricity
Sheet 3 NOTES
LIFE CYCLE INVENTORY ANALYSIS DATA AVAILABILITY AND INPUT SHEET
Unit Process: SAWMILLING Reporting Location
MATERIAL INPUTS Units Quantity
Transport Type Average Load
Avg. Delivery Distance
SAWLOGS Treelengths Stain prevention chemicals
Hydraulic oils Greases Motor oil Other(s)
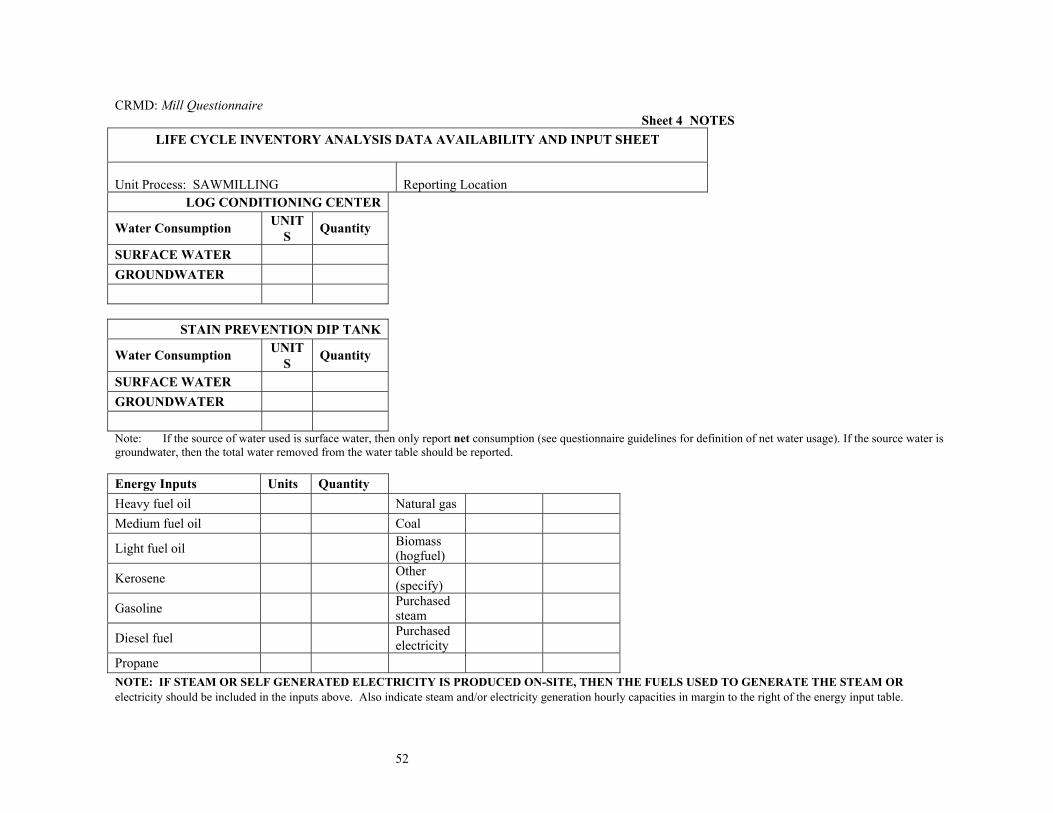
52
CRMD: Mill Questionnaire Sheet 4 NOTES
LIFE CYCLE INVENTORY ANALYSIS DATA AVAILABILITY AND INPUT SHEET
Unit Process: SAWMILLING Reporting Location LOG CONDITIONING CENTER
Water Consumption UNITS Quantity
SURFACE WATER GROUNDWATER
STAIN PREVENTION DIP TANK
Water Consumption UNITS Quantity
SURFACE WATER GROUNDWATER Note: If the source of water used is surface water, then only report net consumption (see questionnaire guidelines for definition of net water usage). If the source water is groundwater, then the total water removed from the water table should be reported. Energy Inputs Units Quantity Heavy fuel oil Natural gas Medium fuel oil Coal
Light fuel oil Biomass (hogfuel)
Kerosene Other (specify)
Gasoline Purchased steam
Diesel fuel Purchased electricity
Propane NOTE: IF STEAM OR SELF GENERATED ELECTRICITY IS PRODUCED ON-SITE, THEN THE FUELS USED TO GENERATE THE STEAM OR electricity should be included in the inputs above. Also indicate steam and/or electricity generation hourly capacities in margin to the right of the energy input table.

53
Sheet 5 NOTES
LIFE CYCLE INVENTORY ANALYSIS DATA AVAILABILITY AND INPUT SHEET
Unit Process: SAWMILLING Reporting Location
AIR EMISSIONS
Units Quantity Describe Sampling Procedure (Attach additional sheets if necessary)
DUST
Particulates
NOX
Organics
Hydrocarbons
Others (specify)
Note: The following are examples of the data categories associated with Air Emissions: Cl2, CO, CO2, Dust/Particulates, F2, H2SO4, HCl, HF, Hg, Hydrocarbons*, N2O, NH3, NOX,
Organics*, Other metals*, Pb, SO, Other (please specify) *Please list compounds included in these categories

54
CRMD: Mill Questionnaire Sheet 6 NOTES
LIFE CYCLE INVENTORY ANALYSIS DATA AVAILABILITY AND INPUT SHEET
Unit Process: SAWMILLING Reporting Location
WATER EFFLUENT
Units Quantity Describe Sampling Procedure (Attach additional sheets if necessary)
SUSPENDED SOLIDS
BOD
COD
Oil & grease Phenols Stain prevention chemicals
Others (specify) Note: The following are examples of the data categories associated with Water Effluent: Acids as H+, BOD, COD, Cl-, CN-, Detergents, Oils and Greases, Dissolved Organics*, F-, Fe ions, Hg, Hydrocarbons, Na+, NH4
+, NO3, Organo-Chlorine*, Other Metals*, Other N*, Phenols, Phosphates, SO4, Suspended Solids, Other (please specify) *Please list compounds included in these categories

55
Sheet 7
LIFE CYCLE INVENTORY ANALYSIS DATA AVAILABILITY AND INPUT SHEET
Unit Process: SAWMILLING Reporting Location
SOLID WASTE
Units Quantity Transport Type
Average Load Avg. Delivery Distance
Describe Sampling Procedure* (Attach additional sheets if necessary)
Wood fiber
Ash Inorganic material e.g. sand Domestic waste Others (specify) * Please provide comprehensive description NOTES:
LIFE CYCLE INVENTORY ANALYSIS DATA AVAILABILITY AND INPUT SHEET
Unit Process: SAWMILLING Reporting Location Saw Sharpening
Units
QUANTITY Alloys Solvents WATER Others (specify) NOTES:

56
CRMD: Mill Questionnaire PART IV –BOILER SHEET 1 NOTES
LIFE CYCLE INVENTORY ANALYSIS DATA AVAILABILITY AND INPUT SHEET
UNIT PROCESS: BOILER REPORTING LOCATION
TIME PERIOD STARTING MONTH ENDING MONTH
DESCRIPTION OF UNIT PROCESS This unit process provides process heat for dry kilns. The operations associated with this unit process include: • the addition of water to the boilers; • the combustion of wood waste and/or supplemental energy sources to heat the water; • the addition of treatment chemicals to the boiler water to enhance thermal efficiency; • the creation of steam to be used by the dry kiln; • the treatment of process water, liquids and solids; The output of this unit process is heat in the form of steam used by the dry kiln. Notes: (exceptions/additions) _____________________________________________________ _____________________________________________________________________________ _____________________________________________________________________________ _____________________________________________________________________________ _____________________________________________________________________________ _____________________________________________________________________________ _____________________________________________________________________________ _____________________________________________________________________________

57
CRMD: Mill Questionnaire Sheet 2 NOTES
LIFE CYCLE INVENTORY ANALYSIS DATA AVAILABILITY AND INPUT SHEET Unit Process: BOILER Reporting Location
PRODUCT & ENERGY OUTPUTS Units Quantity
Self-generated process steam
Self-generated electricity
Other(s) Sheet 2 NOTES
LIFE CYCLE INVENTORY ANALYSIS DATA AVAILABILITY AND INPUT SHEET Unit Process: BOILER Reporting Location
MATERIAL INPUTS Units Quantity Surface water Groundwater Treatment Chemicals (specify)
NATURAL GAS Propane Biomass (hogfuel) Other(s) NOTE: IF STEAM OR SELF GENERATED ELECTRICITY IS PRODUCED ON-SITE, THEN THE FUELS USED TO GENERATE THE STEAM OR electricity should be included in the inputs above. Also indicate steam and/or electricity generation hourly capacities in margin to the right of the energy input table.

58
CRMD: Mill Questionnaire
PART IV – KILN DRYING SHEET 1 NOTES
LIFE CYCLE INVENTORY ANALYSIS DATA AVAILABILITY AND INPUT SHEET UNIT PROCESS: KILN DRYING REPORTING LOCATION
TIME PERIOD STARTING MONTH ENDING MONTH
DESCRIPTION OF UNIT PROCESS This unit process begins with rough green lumber. The operations associated with this unit process include: • the conveyance of rough green lumber to a sticker stacker; • the stacking and loading of stickered lumber into a kiln facility;
• the heat treatment and conditioning of lumber within the kiln; • maintenance and repair of all kiln equipment and related yard transportation
vehicles; • the treatment of process air, liquids and solids; and • the unloading and conveyance of kiln-dried lumber to the planer mill.
The outputs of this unit process are rough green lumber, pulp chips, bark and sawdust. Notes: (exceptions/additions) _____________________________________________________ _____________________________________________________________________________ _____________________________________________________________________________ _____________________________________________________________________________ _____________________________________________________________________________ _____________________________________________________________________________ _____________________________________________________________________________ _____________________________________________________________________________
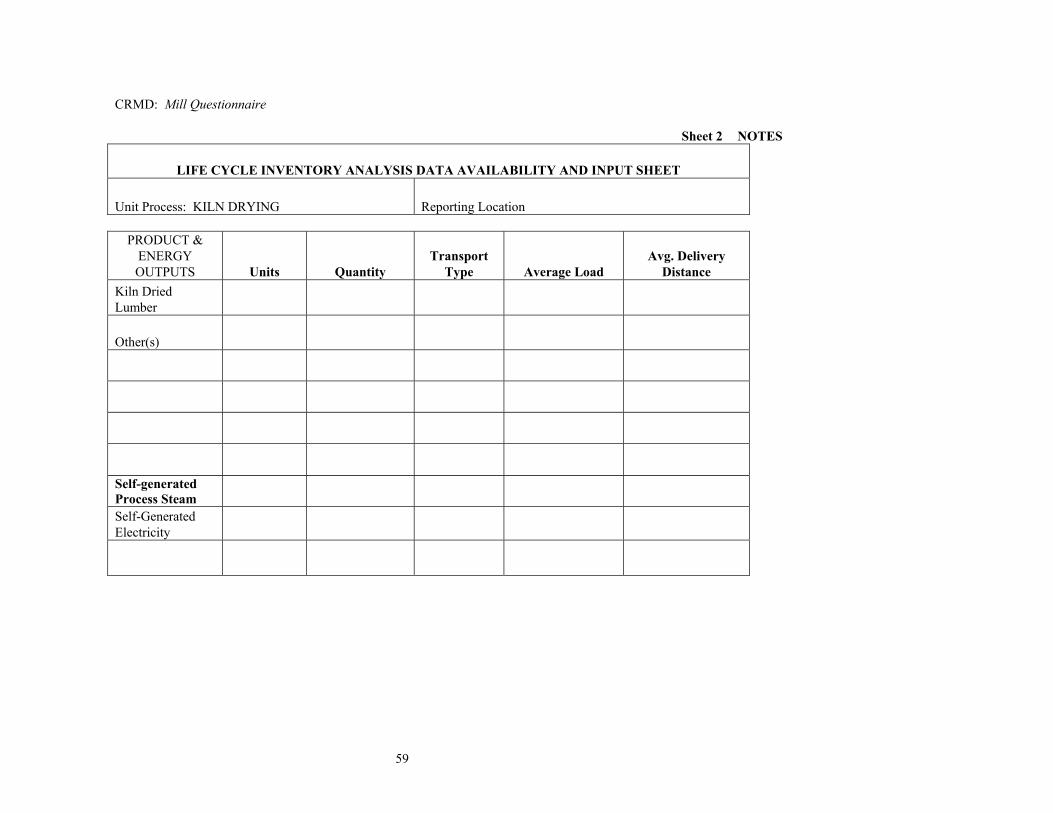
59
CRMD: Mill Questionnaire Sheet 2 NOTES
LIFE CYCLE INVENTORY ANALYSIS DATA AVAILABILITY AND INPUT SHEET
Unit Process: KILN DRYING Reporting Location
PRODUCT & ENERGY OUTPUTS Units Quantity
Transport Type Average Load
Avg. Delivery Distance
Kiln Dried Lumber
Other(s)
Self-generated Process Steam
Self-Generated Electricity

60
Sheet 3 NOTES
LIFE CYCLE INVENTORY ANALYSIS DATA AVAILABILITY AND INPUT SHEET
Unit Process: KILN DRYING Reporting Location
MATERIAL INPUTS Units Quantity
Transport Type Average Load
Avg. Delivery Distance
Rough Green Lumber
STICKERS
Hydraulic Oils Greases Motor Oil Other(s)

61
Sheet 4 NOTES LIFE CYCLE INVENTORY ANALYSIS DATA AVAILABILITY AND INPUT SHEET
Unit Process: KILN DRYING Reporting Location
Water Consumption UNITS Quantity
SURFACE WATER GROUNDWATER Note: If the source of water used is surface water, then only report net consumption (see questionnaire
guidelines for definition of net water usage). If the source water is groundwater, then the total water removed from the water table should be reported.
Energy Inputs Units Quantity
Heavy fuel oil Medium fuel oil Light fuel oil Kerosene Gasoline Diesel fuel Propane Natural gas Coal Biomass (hogfuel) Other (specify) Purchased steam Purchased electricity
NOTE: IF STEAM OR SELF GENERATED ELECTRICITY IS PRODUCED ON-SITE, THEN THE FUELS USED TO GENERATE THE STEAM OR electricity should be included in the inputs above. Also indicate steam and/or electricity generation hourly capacities in margin to the right of the energy input table.

62
CRMD: Mill Questionnaire Sheet 5 NOTES
LIFE CYCLE INVENTORY ANALYSIS DATA AVAILABILITY AND INPUT SHEET
Unit Process: KILN DRYING Reporting Location
AIR EMISSIONS
Units Quantity Describe Sampling Procedure (Attach additional sheets if necessary)
DUST
Particulates
NOX
Organics
Hydrocarbons
Others (specify)
Note: The following are examples of the data categories associated with Air Emissions: Cl2, CO, CO2, Dust/Particulates, F2, H2SO4, HCl, HF, Hg, Hydrocarbons*, N2O, NH3, NOX,
Organics*, Othermetals*, Pb, SO, Other (please specify) *Please list compounds included in these categories

63
CRMD: Mill Questionnaire Sheet 6 NOTES
LIFE CYCLE INVENTORY ANALYSIS DATA AVAILABILITY AND INPUT SHEET
Unit Process: KILN DRYING Reporting Location
WATER EFFLUENT
Units Quantity Describe Sampling Procedure (Attach additional sheets if necessary)
Suspended Solids
BOD
COD
Oil & Grease
Phenols
Others (specify)
Note: The following are examples of the data categories associated with Water Effluent: Acids as H+, BOD, COD, Cl-, CN-, Detergents, Oils and Greases, Dissolved Organics*, F-, Fe ions, Hg, Hydrocarbons, Na+, NH4
+, NO3, Organo-Chlorine*, Other Metals*, Other N*, Phenols, Phosphates, SO4, Suspended Solids, Other (please specify) *Please list compounds included in these categories

64
CRMD: Mill Questionnaire Sheet 7
LIFE CYCLE INVENTORY ANALYSIS DATA AVAILABILITY AND INPUT SHEET
Unit Process: KILN DRYING Reporting Location
SOLID WASTE
Units Quantity Transport Type Average Load Avg. Delivery Distance
Describe Sampling Procedure* (Attach additional sheets if necessary)
Wood fiber
Ash
Inorganic material e.g. sand
Domestic waste Others (specify)
* Please provide comprehensive description NOTES:

65
CRMD: Mill Questionnaire
PART V –PLANER MILL SHEET 1 NOTES
LIFE CYCLE INVENTORY ANALYSIS DATA AVAILABILITY AND INPUT SHEET UNIT PROCESS: PLANER MILL REPORTING LOCATION
TIME PERIOD STARTING MONTH ENDING MONTH
DESCRIPTION OF UNIT PROCESS This unit process begins with either rough green lumber or stickered, rough kiln- dried lumber. The operations associated with this unit process include: • the destickering and/or unstacking of the lumber; • the planing (surfacing) of the lumber; • the trimming, grading and sorting of the lumber; • the stacking, strapping and packaging of lumber; • maintenance and repair of all planer equipment and associated yard transportation vehicles; • the treatment of process air, liquids and solids; The outputs of this unit process is surfaced and packaged lumber by type, size and grade as well as planer shavings, sawdust, pulp chips, and/or lumber trim ends. Notes: (exceptions/additions) _____________________________________________________ _____________________________________________________________________________ _____________________________________________________________________________ _____________________________________________________________________________ _____________________________________________________________________________ _____________________________________________________________________________ _____________________________________________________________________________ _____________________________________________________________________________

66
CRMD: Mill Questionnaire Sheet 2 NOTES
LIFE CYCLE INVENTORY ANALYSIS DATA AVAILABILITY AND INPUT SHEET
Unit Process: PLANER MILL Reporting Location
PRODUCT & ENERGY OUTPUTS Units Quantity
Transport Type Average Load
Avg. Delivery Distance
Planed kiln dried lumber
Planed green lumber
Planer sShavings
Pulpchips sawdust Other(s)
Self-generated process steam
Self-generated electricity

67
Sheet 3 NOTES
LIFE CYCLE INVENTORY ANALYSIS DATA AVAILABILITY AND INPUT SHEET
Unit Process: PLANER MILL Reporting Location
MATERIAL INPUTS Units Quantity
Transport Type Average Load
Avg. Delivery Distance
Rough green lumber
Rough kiln dried lumber
Stickers
Hydraulic oils Greases Motor oil End paint
Polyethylene plastic
Lumber wrap Steel strapping Liner board Other(s)