corridors of freedom - ndp.treasury.gov.za
TRANSCRIPT
Built Environment Performance Plan 2014/15
Draft
Built Environment Performance Plan
2014/15
14 February 2014
Towards the
Corridors of Freedom

Built Environment Performance Plan 2014/15
Table of ContentsPage No
Part A – Introduction (2pages)
1. Background
2. Confirmation of Adoption
Part B – Strategic Review of the Built Environment (14 pages)
1. Current Performance of the Built Environment
2. Economic Infrastructure Review
3. Basic Infrastructure Review
4. Residential Infrastructure Review
5. Community Infrastructure Review
6. Transportation Review
7. Sustainable Development Review
Part C – Strategies and Programmes (20 pages)
1. Long Term Vision 12. The Spatial Development Framework 23. Integration of spatial planning and Strategic Considerations 14. Identification of Urban Network
4.1. Integration Zones 34.2. Spatial Targeting Instruments 34.3 Revision to Spatial Planning and Urban Management Policy 14.4. Catalytic Projects by Integration Zone 24.5. Development Strategies for Integration Zones 24.6. Institutional Arrangements for Integration Zones 14.7. Timeframes for execution of Programmes and Projects within Integration Zones 4
Part D – Outcomes and Outputs (12 pages)
1. Anticipated Built Environment Outcomes for the City of Johannesburg 42. Sector Development Outcomes 43. Outcomes and Impacts for Integration Zones 4Part E – Institutional and Financial Arrangements (12 pages)1. Institutional arrangements for integrated planning 32. Institutional Arrangements for capital programme management 33. Supply chain management and procurement plan 44. Partnerships 2References (A1)
Annexure A: Performance Matrix

Built Environment Performance Plan 2014/15
List of DiagramsNo Description
Abbreviations and acronyms

Built Environment Performance Plan 2014/15

Built Environment Performance Plan 2014/15
Section A – Introduction1. Background
The Built Environment Performance Plan (BEPP) for the City of Johannesburg is a requirement of National Treasury. The document provides a brief strategic overview of the City’s built environmentand related capital investment, and provides the framework by which change within the built environment is to be measured and monitored. The BEPP is a long-term, outcomes based strategic plan to be revised on an annual basis. Its primary purpose is facilitating the spatial integration of Johannesburg through accelerated and inclusive economic growth.
The BEPP indicates how the City applies its capital financing, including grant resources and all other sources of finance, fiscal and regulatory instruments and incentives within its jurisdiction, and the intended impact and outcomes of these interventions.
It is a policy document that seeks to strengthen government relations between the City, Gauteng Province and relevant National Departments by providing greater clarity in relation to the link betweencapital budgeting and where the City allocates its resources. In turn the municipal plan provides a guideline for future Provincial and National Government programmes and funding. The BEPP is meant to complement existing strategic and spatial documents within the City, specifically the Growth and Development Strategy (GDS) – Joburg 2040, the Integrated Plan (IDP), the Spatial Development Framework (SDF), and the Service Delivery Budget Implementation Plan (SDBIP).
The City of Joburg first compiled the BEPP for the 2011/2 financial year as part of the motivation to access the Urban Settlement Development Grant (USDG) (formerly the Municipal Infrastructure Grant- Cities). The 2014/15 iteration of the plan represents an expansion of the initial scope of this plan. Whereas previously the BEPP only related to USDG funding, the current funding is in motivation to National Treasury for accessing the following basket of grants:
NAME OF GRANT PURPOSE OF GRANTIntegrated City Development Grant (ICDG)
To provide a financial incentive for metropolitan municipalities to integrate and focus their use of available infrastructure investment and regulatory instruments to achieve a more compact urban spatial form.
Urban Settlement Development Grant
Supplements the capital revenues of metropolitan municipalities in order to support the national human settlements development Programme focussing on poor households
Human Settlements Development Grant (HSDG)
To provide for the creation of sustainable human settlements
Public Transport Infrastructure Grant(PTIG)
To provide for accelerated planning, construction and improvement of public and non-motorised transport infrastructure
Neighbourhood Development Partnership Grant (NDPG)
To support and facilitate the planning and development of neighbourhood development programmes and projects that provide catalytic infrastructure to leverage third party public and private sector development towards improving the quality of life of residents in targeted under-served neighbourhoods (generally townships)
Integrated National Electrification Grant (INEG)
To implement the Integrated National Electrification Programme by providing capital subsidies to municipalities to address the electrification backlog of occupied residential dwellings, and the installation of bulk infrastructure and

Built Environment Performance Plan 2014/15
rehabilitation and refurbishment of electricity infrastructure in order to improve quality of supply.
Collectively the grant funding represents a significant proportion (approximately 30%) of the City’s annual capital budget.
The BEPP 2014/15 and the basket of grants will be aligned through:
i. The Identification of priority areas for infrastructure delivery within the City of Johannesburgii. The Amendment of conditions and output indicators used to measure the performance of the
grants that highlight critical inter-dependencies viz. number of housing opportunities provided within 500m of a public transport rather than just counting housing opportunities provided
iii. Inclusion of provisions in the DORA relating to the alignment of infrastructure grants to fund a pipeline of prioritised projects
iv. Introduction of fiscal and regulatory instruments to catalyse private sector investmentv. Improving the management of strategic precincts and public transport operations within the
urban network.
In addition the BEPP2014/15 provides the baseline for human settlement indicators – devised by National Treasury – for measuring urban integration within the City over time. Future revisions of the BEPP will report on progress in achieving in the indicators.
The BEPP 2014/15 will focus on three thematic areas namely:
i. Co-ordinating and aligning national initiatives: SIP2 and SIP7 for improved economic development; and upgrading of informal settlements;
ii. The identification and planning of Urban Networks and Integration Zones consisting of the City’s CBD, Urban Hub/s, Activity Corridors, secondary Nodes and Linkages;
iii. Land Development
While these areas of consideration form the focus of the BEPP 2014/15 the document highlights the range and complexity of issues that need to be taken into account in planning for a sustainable more integrated City.
The BEPP 2014/15 is structured is follows:
i. Section B: A strategic overview of the City of Johannesburg’s built environment.ii. Section C: Programmes, Processes and targets for infrastructure delivery within the City of
Johannesburg.iii. Section D: A basis for the City’s infrastructure grant applications, and to facilitate grant
alignment – outcomes and outputs.iv. Section E: Institutional and Financial Arrangements including Human Settlement Indicators to
measure the sustainability of the human settlement to form part of the SBIP.
Content in each section is presented so as address concerns and provide particular information requested by National Treasury.
2. Confirmation of Adoption
This is to confirm that a copy of the Final Built Environment Performance Plan 2014/15 for the City of Johannesburg has been approved by Council.

Built Environment Performance Plan 2014/15

Built Environment Performance Plan 2014/15
Part B – Strategic Review of the Built Environment (14 pages)
1. Current Performance of the Built Environment
According to Census 2011 data the City has a population of 4.4 million. The city’s population is projected to increase at an annual growth rate of about 1,3 % per annum. Based on current trends, it is anticipated that Johannesburg’s population will double within 50 years, shifting from the current 4.4 million people, to an expected 16.1 million people by 2030. Natural increase is an important component of the increase of the City’s population however there are other factors that contribute to this growth.
Migration significantly influences the size and nature of Johannesburg’s population. Johannesburg continues is an important destination for both domestic and international migrants. South Africans constitute the largest percentage of migrants. However there is an increasing number of immigrants from other African countries particularly in the Inner City. Approximately 12% of Johannesburg’s population is deemed to be foreign (UNISA 2010). Most migrants come to Johannesburg to find employment. The nature of their stay varies from permanent to temporary. Similarly, the socio-economic status of migrants varies from wealthy to poor, though indications are that majority of migrants earn no or low incomes.
Over the past twenty years HIV/AIDS related deaths negatively affected projections for future population growth. Due to the role out of anti-retrovirals the death rate due to HIV/AIDs related illnesses has declined since 2004. However, the City acknowledges that South Africa still has one of the largest per capita HIV/AIDS prevalence and infection rates worldwide, and the City continues to be the location of one of “the fastest growing AIDS epidemics” globally (UNISA 2010).
The population of Johannesburg comprises mainly of a young adult population of 20 – 34 years of age. The size of the school age population (i.e. persons aged 5-19 years) is about 20.5% of the total population while the proportion of the working age population is approximately 2.6 million (65% of the total population of the City). The percentage of the size of the elderly population (persons aged 65 years and over) is about 5% of the total population and that of children (persons aged 0-15 years old) is about 26% of the total population of the City.
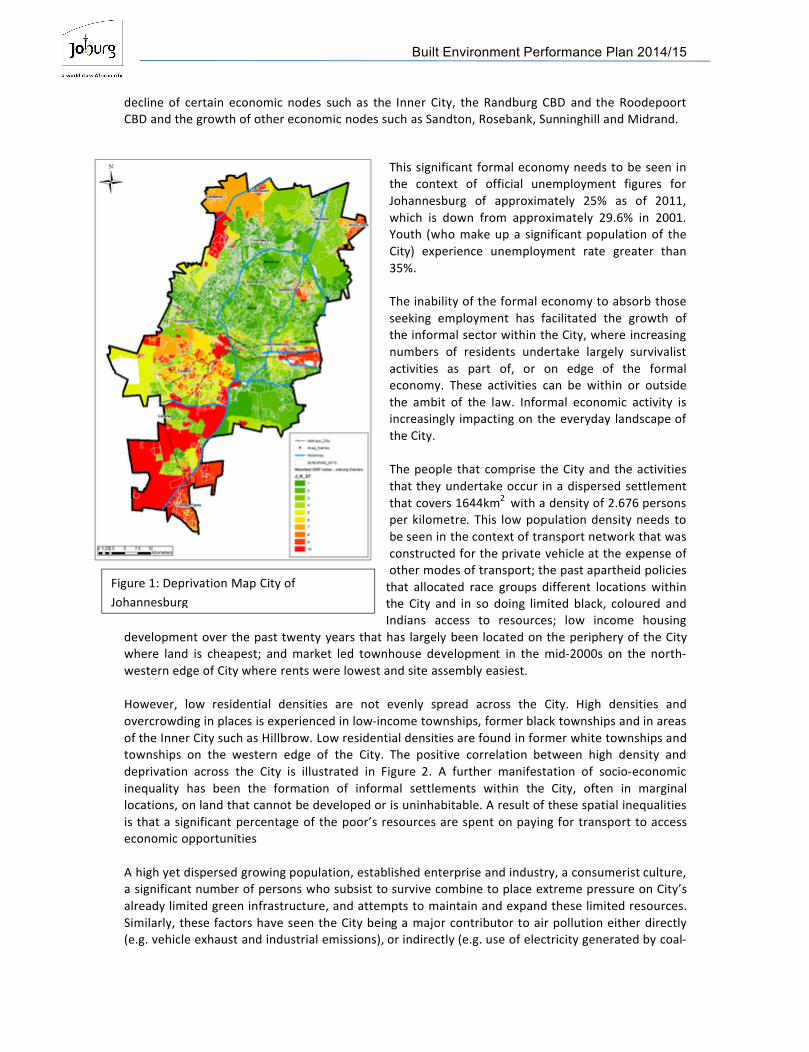
The City of Johannesburg experiences high socio-economic inequality. The Gini Coefficient, a measure of inequality within a given society, is estimated at 0.64 by Global Insight (2009). This indicates that the gap between the wealthy and the poor within the City is very high. This inequalityhas distinctive footprint which was mapped as part of a study undertaken under the auspices of the Community Development Department (see figure 1). What is clear is that the most deprived areas (the areas shaded red) are located in the formerly black township areas of Diepsloot, Ivory Park, Alexandra, Zandspruit, the Inner City, parts of Soweto and the Greater Orange Farm. The more affluent areas in the City are located in the northern suburb areas of Sandton, Randburg and Johannesburg South.
The high levels of inequality within the City are reflected in the economy of the City.
The City has the largest economy in the country, contributing about 17% of the national GDP and approximately 47% of Gauteng’s economy.2 The City’s economy is the main driver of national growth – historically performing at 50% higher in growth rates relative to national growth. The City’s economy is driven by only four economic sectors which are: (a) finance and business services, (b) community services, (c) manufacturing, and (d) trade. These four economic sectors collectively account for more than 82% of economic activity within the City. These sectors also account for the highest levels of formal and informal employment. This state of affairs suggests that the City of Johannesburg’s economy is highly concentrated; making it vulnerable to sudden external shocks such as the recession experienced during 2008/09. An expression of this vulnerability has been the
1 City of Johannesburg, Consolidated Infrastructure Plan: Phase 1. 1 November 20132 City of Johannesburg. Draft Spatial Development Framework. 2013
Built Environment Performance Plan 2014/15
Figure 1: Deprivation Map City of Johannesburg
decline of certain economic nodes such as the Inner City, the Randburg CBD and the Roodepoort CBD and the growth of other economic nodes such as Sandton, Rosebank, Sunninghill and Midrand.
This significant formal economy needs to be seen in the context of official unemployment figures for Johannesburg of approximately 25% as of 2011, which is down from approximately 29.6% in 2001.Youth (who make up a significant population of the City) experience unemployment rate greater than 35%.
The inability of the formal economy to absorb those seeking employment has facilitated the growth of the informal sector within the City, where increasing numbers of residents undertake largely survivalist activities as part of, or on edge of the formal economy. These activities can be within or outside the ambit of the law. Informal economic activity is increasingly impacting on the everyday landscape of the City.
The people that comprise the City and the activities that they undertake occur in a dispersed settlement that covers 1644km2 with a density of 2.676 persons per kilometre. This low population density needs to be seen in the context of transport network that was constructed for the private vehicle at the expense of other modes of transport; the past apartheid policies
that allocated race groups different locations within the City and in so doing limited black, coloured and Indians access to resources; low income housing
development over the past twenty years that has largely been located on the periphery of the City where land is cheapest; and market led townhouse development in the mid-2000s on the north-western edge of City where rents were lowest and site assembly easiest.
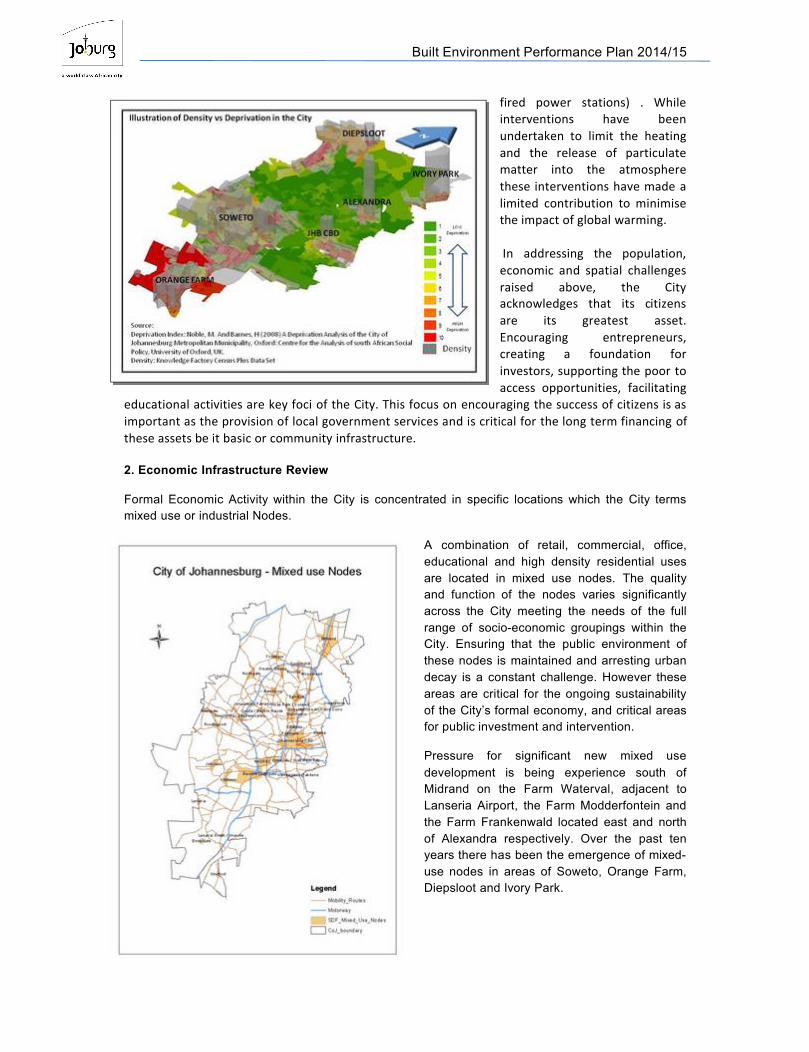
However, low residential densities are not evenly spread across the City. High densities and overcrowding in places is experienced in low-income townships, former black townships and in areas of the Inner City such as Hillbrow. Low residential densities are found in former white townships and townships on the western edge of the City. The positive correlation between high density and deprivation across the City is illustrated in Figure 2. A further manifestation of socio-economic inequality has been the formation of informal settlements within the City, often in marginal locations, on land that cannot be developed or is uninhabitable. A result of these spatial inequalities is that a significant percentage of the poor’s resources are spent on paying for transport to access economic opportunities
A high yet dispersed growing population, established enterprise and industry, a consumerist culture, a significant number of persons who subsist to survive combine to place extreme pressure on City’s already limited green infrastructure, and attempts to maintain and expand these limited resources.Similarly, these factors have seen the City being a major contributor to air pollution either directly (e.g. vehicle exhaust and industrial emissions), or indirectly (e.g. use of electricity generated by coal-
Built Environment Performance Plan 2014/15
fired power stations) . While interventions have been undertaken to limit the heating and the release of particulate matter into the atmosphere these interventions have made a limited contribution to minimise the impact of global warming.
In addressing the population, economic and spatial challenges raised above, the City acknowledges that its citizens are its greatest asset. Encouraging entrepreneurs, creating a foundation for investors, supporting the poor to access opportunities, facilitating
educational activities are key foci of the City. This focus on encouraging the success of citizens is as important as the provision of local government services and is critical for the long term financing of these assets be it basic or community infrastructure.
2. Economic Infrastructure Review
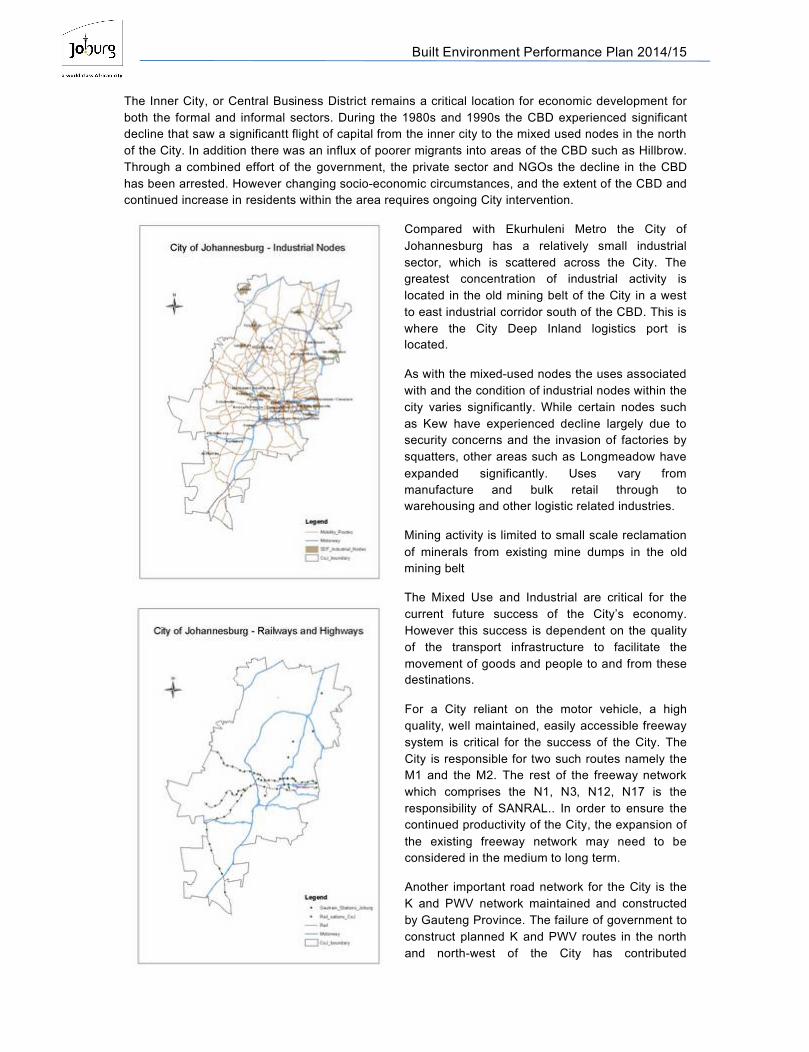
Formal Economic Activity within the City is concentrated in specific locations which the City terms mixed use or industrial Nodes.
A combination of retail, commercial, office, educational and high density residential uses are located in mixed use nodes. The qualityand function of the nodes varies significantlyacross the City meeting the needs of the full range of socio-economic groupings within the City. Ensuring that the public environment of these nodes is maintained and arresting urban decay is a constant challenge. However these areas are critical for the ongoing sustainability of the City’s formal economy, and critical areas for public investment and intervention.
Pressure for significant new mixed use development is being experience south of Midrand on the Farm Waterval, adjacent to Lanseria Airport, the Farm Modderfontein and the Farm Frankenwald located east and north of Alexandra respectively. Over the past ten years there has been the emergence of mixed-use nodes in areas of Soweto, Orange Farm, Diepsloot and Ivory Park.
Built Environment Performance Plan 2014/15
The Inner City, or Central Business District remains a critical location for economic development for both the formal and informal sectors. During the 1980s and 1990s the CBD experienced significant decline that saw a significantt flight of capital from the inner city to the mixed used nodes in the north of the City. In addition there was an influx of poorer migrants into areas of the CBD such as Hillbrow. Through a combined effort of the government, the private sector and NGOs the decline in the CBD has been arrested. However changing socio-economic circumstances, and the extent of the CBD and continued increase in residents within the area requires ongoing City intervention.
Compared with Ekurhuleni Metro the City of Johannesburg has a relatively small industrial sector, which is scattered across the City. The greatest concentration of industrial activity is located in the old mining belt of the City in a west to east industrial corridor south of the CBD. This is where the City Deep Inland logistics port is located.
As with the mixed-used nodes the uses associated with and the condition of industrial nodes within the city varies significantly. While certain nodes such as Kew have experienced decline largely due to security concerns and the invasion of factories by squatters, other areas such as Longmeadow have expanded significantly. Uses vary from manufacture and bulk retail through to warehousing and other logistic related industries.
Mining activity is limited to small scale reclamation of minerals from existing mine dumps in the oldmining belt
The Mixed Use and Industrial are critical for the current future success of the City’s economy. However this success is dependent on the quality of the transport infrastructure to facilitate the movement of goods and people to and from thesedestinations.
For a City reliant on the motor vehicle, a high quality, well maintained, easily accessible freeway system is critical for the success of the City. The City is responsible for two such routes namely the M1 and the M2. The rest of the freeway network which comprises the N1, N3, N12, N17 is the responsibility of SANRAL.. In order to ensure the continued productivity of the City, the expansion of the existing freeway network may need to be considered in the medium to long term.
Another important road network for the City is the K and PWV network maintained and constructed by Gauteng Province. The failure of government to construct planned K and PWV routes in the north and north-west of the City has contributed

Built Environment Performance Plan 2014/15
significantly to the traffic congestion in the as significant middle income townhouse developments were constructed.
Besides the road network, the City does have a rail network which has three components. The first is a freight component under the auspices of TRANSNET. The rail freight network is limited to a series of east-west railway lines in vicinity of City Deep and is closely associated with the inland logistics port. The second, is a heavily used passenger rail service which runs trains from as far south as Orange Farm to the CBD, though the bulk of the service and associated stations services Soweto and is operated by PRASA. PRASA is currently undertaking a recapitalisation process that will see the rolling stock and certain of the existing railway stations being upgraded which will gives rise for future economic development in these localities. The third component is the Gautrain operated by Bombela. The City of Johannesburg has 5 stations currently with a sixth station proposed for Modderfontein. The network serves middle to upper income users and has been partly responsible for significant redevelopment in Rosebank and Sandton. The railway network has also opened up alternative commuter options to and from Tshwane Metro and to a lesser extent.
While the Oliver Tambo international airport is located in Ekurhuleni Metro it is a critical component of the economic infrastructure of the City. The City welcomes the plans to facilitate the development of an Aerotropolis at the Airport as this will benefit the entire City Region especially those mixed used nodes accessed by the Gautrain. Lanseria is the second airport for the City. It is located in the extreme north of the municipality. It has seen significant growth in domestic flights over the past ten years. There are significant plans for enterprise development adjacent to the Airport.
The Presidential Infrastructure Coordinating Commission identified a number of Strategic Intregrated Projects or SIPs to support economic development and address service delivery. The importance of Gauteng as region which drives the national economy was highlighted specifically through SIP2 that spoke to the Durban-Free State – Gauteng Logistics and Industrial Corridor. The aim of the SIP s to Strengthen the logistics and transport corridor between SA’s main industrial hubs and Durban’s export and import facilities. City Deep Inland Port and its associated road and rail infrastructure represents
the City Johannesburg component in this industrial corridor. Currently the growth and functioning of thePort is constrained by it geography and relatively low capacity of its existing bulk infrastructure. Significant infrastructure investment is required to revitalise this critical locale within the City. The City of Johannesburg cannot on its own funded the realisation of this project. It will require a coordinated intervention by all stakeholders. In addition further sites for logistics hubs within Johannesburg should be undertaken to facilitate expected
growth resulting from the SIP2 intiative.
Information Technology Infrastructure
3. Basic Infrastructure Review
The section above reviewed the infrastructure components that form the foundation for current and future growth within the City. This section will review the basic infrastructure provided by the Municipality, namely: water, sewer electricity, local roads and waste removal. Not only are these

Built Environment Performance Plan 2014/15
services prerequites for urban living, they represent key resources in encouraging economic growth in the City. It critical that these services be provided at a high level of service and can be accessed by a range of socio-economic groupings within the City, and that the City is remunerated for these services.
The analysis below is drawn from the Consolidated Infrastructure Plan: Phase 1 undertaken in 2013.The study focused on defining bulk infrastructure requirements for water, sewer, electricity and roads based on an assessment of information provided by the relevant municipal owned entity. Phase 2 of the Consolidated Infrastructure will assess the lower infrastructure for the four services
Water
Joburg Water supplies potable water to the residents across the City. The purified water is purchased from the regional bulk supplier, Rand Water.
Bulk water assets are represented in Figure 7. Bulk water infrastructure is defined as pipelines (the network illustrated on the map) and fixed assets (see Figures 8 and 9)which is represented on the map as dots and squares. The extent (km) and nature (materials used) of the pipelines used in the City is represented in Figure 8. The type, number and capacity of the fixed assets is provided in Figure 9.
The estimated current replacement cost of the City’s water assets is estimated at R17 132 530 060.00.
Joburg Water’s Business Plan indicates a level of service backlog with regards to water of 26 091 households, as at March 2012.
Joburg Water has been monitoring its water purchases from Rand Water since January 1990, and an annual growth rate of 3% has been recorded over the 22-year
monitoring period. The average growth over the past 3 years has reduced to 2.2% p.a. This increase in water consumption has been modelled over the next 10 years including two further scenarios based on the 2011 census customer profile: firstly, based on an annual projected population growth rate of 1.7%, and secondly, using the 1.7% population growth rate but with a progressive reduction in network leakages. Thus, in the worst case scenario, a water demand of around 720 000 Ml p.a. could be expected by 2022, whilst it could be as low as 560 000 Ml p.a. if the annual growth is kept in line with the demand associated with the expected population growth in addition to a reduction of UFW from its present level of 39% to 25%.

Built Environment Performance Plan 2014/15
Water pipelines (m)
Diameter (mm)
MaterialTotalAC uPVC HDPE Steel Other (MPVC,
GRP)<100 928 060 1 728 725 361 525 235 910 3 080 3 257 300
≥100 <200 1 788 590 2 674 010 111 050 1 348 215 17 210 5 939 075≥200 <300 309 220 376 695 4 490 235 660 0 926 065≥300 <500 181 515 134 690 1 530 447 345 0 765 080≥500 <700 39 725 17 225 30 279 255 895 337 130≥700 <900 5 170 3 315 0 120935 0 129 420
≥900 165 6 070 0 58 425 0 64 660Total 3 252 445 4 940 730 478 625 2 725 745 21 185 11 418 730
Asset/component type Extent Unit CapacityReservoirs 94 Number 1 874 (Ml)Water towers 30 Number 25.5 (Ml)Pump stations 38 Number 9 471 (kW)PRV stations 478 Number N/AValves 51 073 Number N/AHydrants 41 092 Number N/AMeters 445 771 Number N/A
The CIP Phase 1 analyses the City’s future water project in terms of capital project and refurbishment projects. Capital projects refer to projects which are required for water services to
address the growing water demand or to replacement projects. Refurbishment projects form part of the capital project list but have been identified separately. These projects have been identified by identifying the assets with an remaining useable life < 20 years.
The capital projects required by the City is illustrated in Figure x. A full list of capital water projects, with estimated budgetscan be made available on request.
Future refurbishment Projects are illustrated in Figure y. A full list of water refurbishment projects with estimated budgets can be made available on request.
From the maps it is apparent that capital requirement is primarily in the north, west and south of the City, while water refurbishment requirements are clustered in the northern central and southern areas.
Built Environment Performance Plan 2014/15
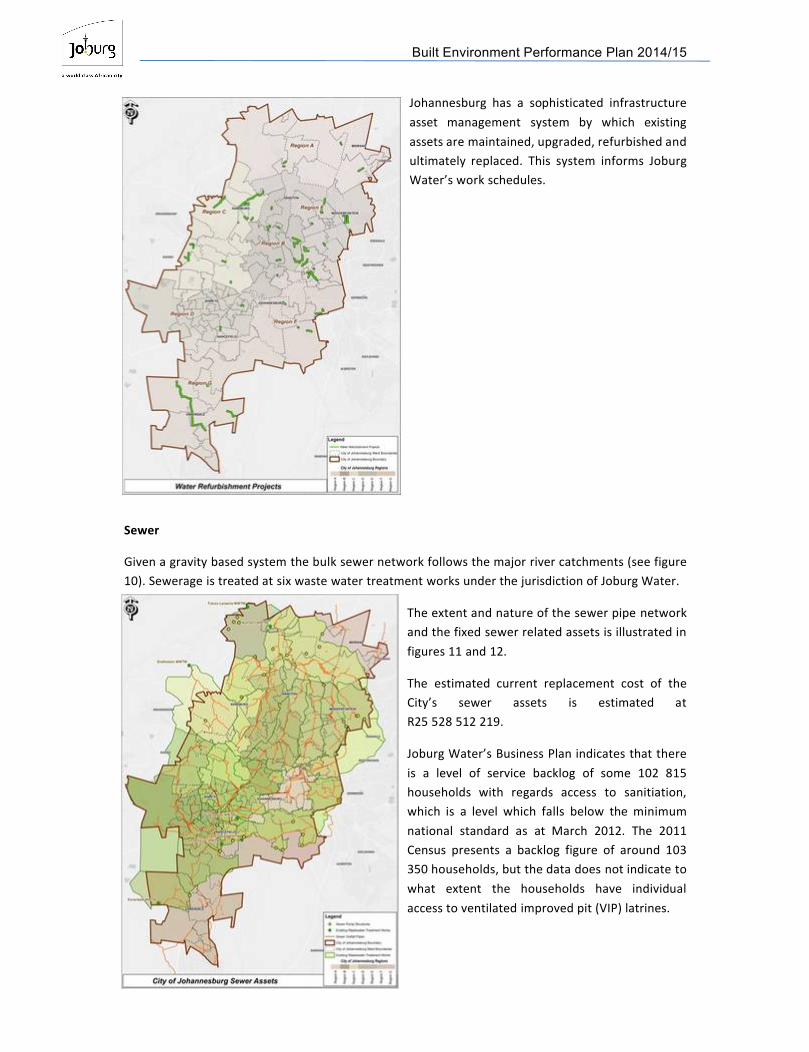
Johannesburg has a sophisticated infrastructure asset management system by which existing assets are maintained, upgraded, refurbished and ultimately replaced. This system informs Joburg Water’s work schedules.
Sewer
Given a gravity based system the bulk sewer network follows the major river catchments (see figure 10). Sewerage is treated at six waste water treatment works under the jurisdiction of Joburg Water.
The extent and nature of the sewer pipe network and the fixed sewer related assets is illustrated in figures 11 and 12.
The estimated current replacement cost of the City’s sewer assets is estimated at R25 528 512 219.
Joburg Water’s Business Plan indicates that there is a level of service backlog of some 102 815 households with regards access to sanitiation, which is a level which falls below the minimum national standard as at March 2012. The 2011 Census presents a backlog figure of around 103 350 households, but the data does not indicate to what extent the households have individual access to ventilated improved pit (VIP) latrines.

Built Environment Performance Plan 2014/15
Wastewater pipelines (m)
Diameter (mm)
MaterialTotalAC uPVC Concrete Clay HDPE Other/
unknown<200 288 440 1 401 815 105 996 7 405 370 4 208 3 434 9 209 263
≥200 <300 18 885 78 092 13 128 522 091 193 2 472 634 861≥300 <500 19 243 55 987 59 577 292 810 10 708 438 325≥500 <700 5 153 7 310 79 256 41 144 8 387 141 250≥700 <900 8 048 41 059 13 537 5 553 68 197
≥900 6 977 243 065 70 547 25 167 345 756Total 356 746 1 543 204 542 081 8 345 499 4 401 55 721 10 837 652
Asset/component type Extent Unit CapacityWastewater treatment works 6 Number 1 118(Ml/d)Pump stations 38 Number 4 227 (kW)Manholes 208 138 Number N/ASewer connections 437 381 Number N/A
As with water the future sewer projects are defined as either capital projects or refurbishment projects. The location of capital projects is represented in Figure (a). The location of refurbishment projects is illustrated in figure (b). Capital projects are concentrated in the Jukskei catchment in the north of the City. Six new stations and a new waste water treatment works forms part of this requirement. Capital projects are also required in the Soweto and Orange Farm areas. Sewer refurbishment projects are concentrated in the northern central area of the City.
Built Environment Performance Plan 2014/15
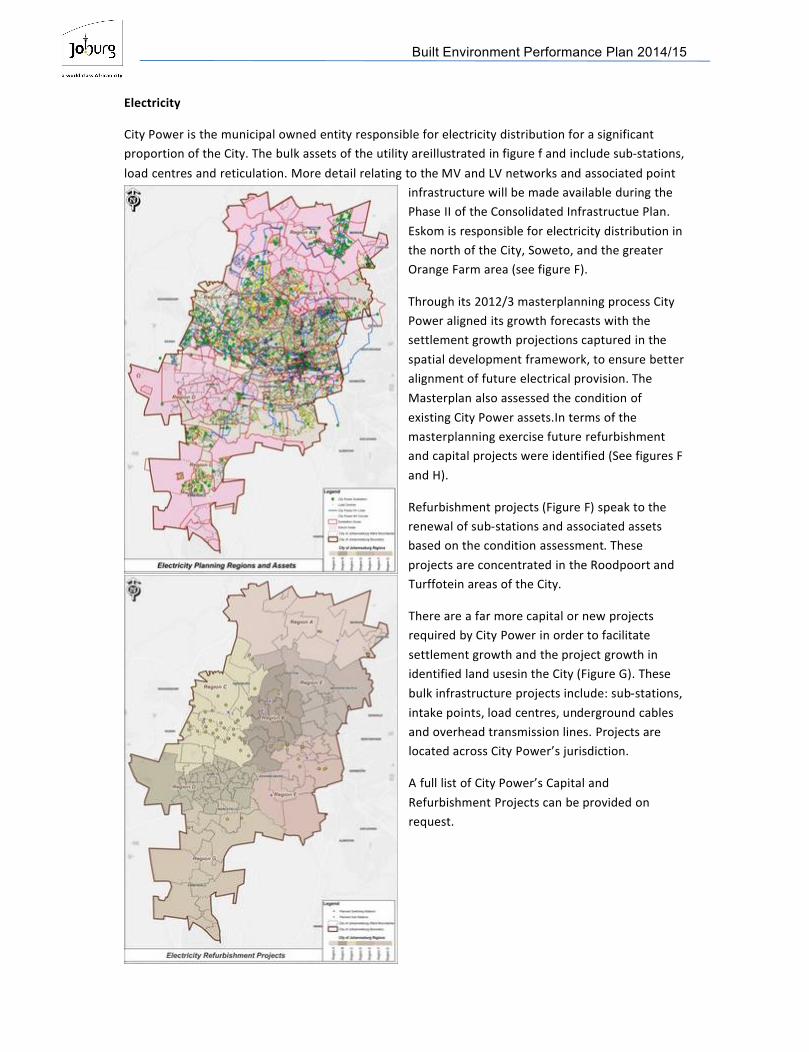
Electricity
City Power is the municipal owned entity responsible for electricity distribution for a significant proportion of the City. The bulk assets of the utility areillustrated in figure f and include sub-stations, load centres and reticulation. More detail relating to the MV and LV networks and associated point
infrastructure will be made available during the Phase II of the Consolidated Infrastructue Plan. Eskom is responsible for electricity distribution in the north of the City, Soweto, and the greater Orange Farm area (see figure F).
Through its 2012/3 masterplanning process City Power aligned its growth forecasts with the settlement growth projections captured in the spatial development framework, to ensure better alignment of future electrical provision. The Masterplan also assessed the condition of existing City Power assets.In terms of the masterplanning exercise future refurbishment and capital projects were identified (See figures F and H).
Refurbishment projects (Figure F) speak to the renewal of sub-stations and associated assetsbased on the condition assessment. These projects are concentrated in the Roodpoort and Turffotein areas of the City.
There are a far more capital or new projects required by City Power in order to facilitate settlement growth and the project growth in identified land usesin the City (Figure G). These bulk infrastructure projects include: sub-stations, intake points, load centres, underground cables and overhead transmission lines. Projects are located across City Power’s jurisdiction.
A full list of City Power’s Capital and Refurbishment Projects can be provided on request.

Built Environment Performance Plan 2014/15
Roads and Stormwater
The Johannesburg Roads Agency (JRA) is responsible for roads, bridges, certain dams and stormwater within the City. The roles and functions of the JRA are defined in Figure c.
Product/service area Interpretation
Traffic regulatory infrastructure
Traffic signalling (robots) Road markings Road signs Regulatory operating system
Road infrastructureRoad reserves (footways or pavement, bridges, verge or edge/border/grass pavement, culvert, guard rails, fencing and billboards) Infrastructure development and maintenance
Rail siding infrastructure Rail reserves (bridges, verge or edge/border/grass pavement, culvert, guard rails and fencing)
Stormwater management Stormwater catchment development and maintenance.
Currently the JRA does not have a recent masterplan for roads and stormwater, neither does it have an asset management plan for these assets. The JRA is currently undertaking a 10 year masterplan for its assets that will function as an infrastructure asset management plan. As such the current capacity and demand projects are not known in detail.
Based on available outdated information the Consolidated Infrastructure Plan: Phase I defined JRA’s assets by the City’s administrative region (A-G). This information is captured in Figure d.
Infrastructure componentRegion
TotalA B C D E F G

Built Environment Performance Plan 2014/15
Infrastructure componentRegion
TotalA B C D E F G
Paved roads (km) - CoJ-owned 678 1408 1298 1462 1245 1534 700 8324Gravel roads (km) 376 1 180 39 10 6 384 997Intersections 4569 4900 6885 8849 5104 6548 7324 43852Stormwater channels/culverts (km) 17 56 50 16 40 70 39 288Stormwater pipes (km) 220 382 412 383 519 477 172 2565Stormwater pipes (unknown) (km) 4 37 15 12 24 35 25 153Stormwater kerb inlets 3392 6705 6547 7401 8634 10302 3228 46209Stormwater inlets (other) 3487 6701 5005 5179 8200 8253 2396 39221Stormwater manholes 1386 5953 3385 3286 5978 5111 1578 26677Stormwater inlets (unknown) (km) 355 1450 275 123 1027 565 0 3775Bridges (CoJ-owned) 64 87 89 45 117 204 10 616Bridges (not CoJ-owned) 66 87 73 21 69 160 73 549Bridges (ownership unknown) 128 29 55 46 46 55 66 425Dams (JRA) 0 2 5 1 0 2 0 10Signs 0 177 80 0 1089 788 0 2134Motorway (lane km) 398
The location of traffic lights, bridges and traffic calming related assets, based on available data, is illustrated in figure d. The location of stormwater related assets is presented in figure e.
Maintenance
According to the Consolidated Infrastructure:
JRA Do have level 1 maintenance plans JRA Depots have systems application programming (SAP) system to manage operations

Built Environment Performance Plan 2014/15
Footways and the road verge are maintained according to a management system of 1996. JRA does not have sufficient budget to operate and maintain its existing assets.
However, JRA has no proper programmed maintenance system in place. All infrastructure is maintained mostly by visual inspections by officials (inspectors) and/or through complaints from the public, which are programmed/prioritised on the system for implementation. This includes roads (surface), road signs and markings, stormwater inlets (kerb inlets – KIs), and roadside furniture, including traffic signals.
(VSM)
Infrastructure Requirements
The CoJ road hierarchy project identified projects which were captured on the City’s Capital Investment Management, but not necessarily in detail. In addition capital projects relating to bridges, road reconstruction, road resurfacing, storm-water projects and other capital related projects are captured on the database. A detailed project list can be provided on request.
(Include CIMS JRA scatter of projects)
Backlogs
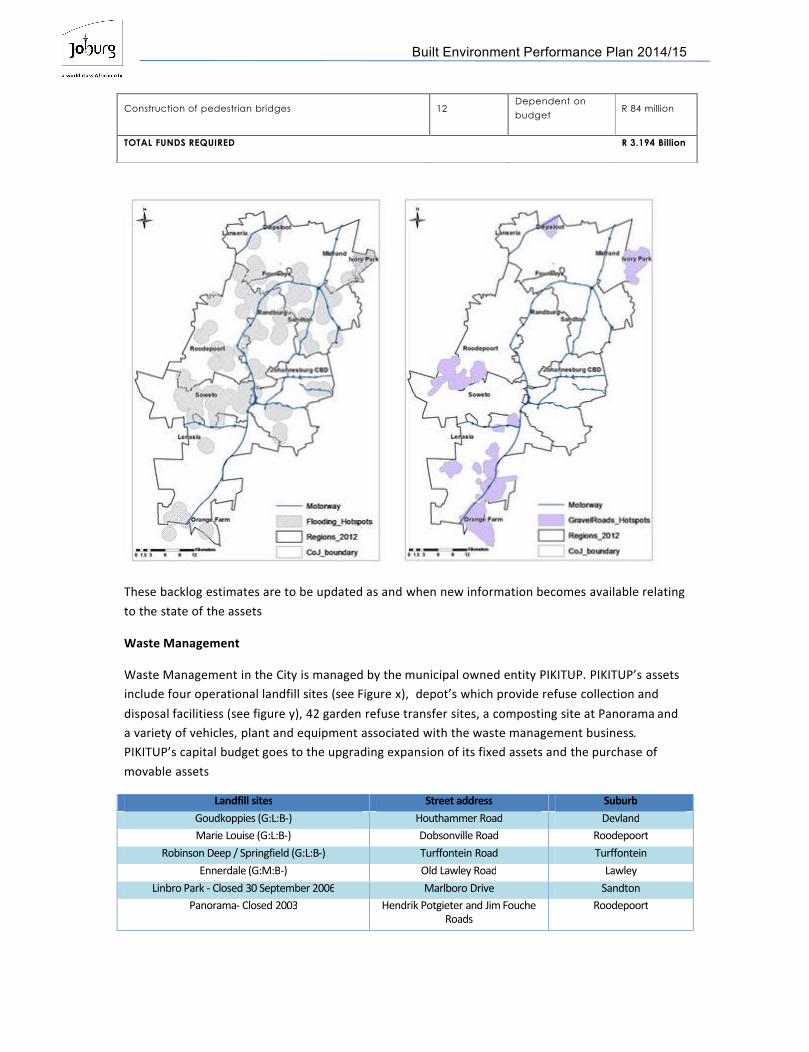
A backlog in the context of the City of Johannesburg refer to the tarring of gravel roads in former black townships and in low income township developments notably Ivory Park, Orange Farm and Diepsloot where the roads were not tarred. The current backlog with regard to gravel roads is 350kilometres. The cost of funding this backlog is approximately R1.2 billon and the estimated time that it would take to eradicate is dependent upon annual capital budget allocations. Other road related backlogs and estimated funding requirements are captured in Table e.
DESCRIPTION UnitsPERIOD TO ERADICATE
Estimated Cost
Gravel Roads programme
Upgrading of Gravel roads to surfaced (Prioritized areas) 350 kmDependent on budget
R 1.200 Billion
Roads Infrastructure programme
Road ReconstructionDependent on budget
R 520 million
Storm Water Management programme
Upgrade of storm water systems and catchmentsDependent on budget
R 900 million
Upgrade of storm water system improvements based on level 4, 5 audits
Dependent on budget
R 154 million
Bridges programme
Built Environment Performance Plan 2014/15
These backlog estimates are to be updated as and when new information becomes available relating to the state of the assets
Waste Management
Waste Management in the City is managed by the municipal owned entity PIKITUP. PIKITUP’s assets include four operational landfill sites (see Figure x), depot’s which provide refuse collection and disposal facilitiess (see figure y), 42 garden refuse transfer sites, a composting site at Panorama and a variety of vehicles, plant and equipment associated with the waste management business.PIKITUP’s capital budget goes to the upgrading expansion of its fixed assets and the purchase of movable assets
Landfill sites Street address SuburbGoudkoppies (G:L:B-) Houthammer Road DevlandMarie Louise (G:L:B-) Dobsonville Road Roodepoort
Robinson Deep / Springfield (G:L:B-) Turffontein Road TurffonteinEnnerdale (G:M:B-) Old Lawley Road Lawley
Linbro Park - Closed 30 September 2006 Marlboro Drive SandtonPanorama- Closed 2003 Hendrik Potgieter and Jim Fouche
RoadsRoodepoort
Construction of pedestrian bridges 12Dependent on budget
R 84 million
TOTAL FUNDS REQUIRED R 3.194 Billion

Built Environment Performance Plan 2014/15
Depot Street address SuburbAvalon Calandula Street Klipspruit WestCentral Camp Cnr Old Potch Road & Nicholas Street DiepkloofMidrand Stand 142, 16th Rroad RandjesparkMarlboro 9th Street MarlboroNorwood Cnr Short & Pine Streets OrchardsRandburg Cnr Malibongwe Drive & Hans Schoeman Streets RandburgRoodepoort 10 Granville Road, Lea Glen RoodepoortSelby Cnr Village & Usher Streets Selby (Jhb CBD)Southdale Cnr Side Road & Third Street SouthdaleWaterval Depot 2 Alberts Street AlbertsvilleZondi Depot Cnr Koma and Elias Motsoaledi Zondi
PIKITUP is currently undertaking a change strategy that focuses on waste minimisation to alleviate pressure from the existing landfills. Capital is being to spent presently and in the foreseeable future on mainstreaming the separation of waste at source, and to facilitate associated recycling and reuse facilities and infrastructure. These initiatives will take up a greater percentage of the capital spend in future.
One of the challenges facing PIKITUP is that the existing landfills are fast reaching their expected lifespan (see figure x). Additional land is being sought for future landfills. Currently PIKITUP is investigating the potential of a regional land to the north of the municipality. Assistant from relevant provincial and national is requested to finalise these investigation and secure a site for such a facility.
Ennerdale Marie Louise Goudkoppies Robinson DeepTotal airspace (including cover) per design
2,223,209m3 6,796,717 m3 9,691,222 m3 22,968,866 m3
Consumed airspace 972,963 m3 4,563,921 m3 4,553,533 m3 16,965,061m3
Airspace available for waste disposal as of 2012 (including cover)
1,250,246 m3 2,232,796 m3 5,137,689 m3 6,003,805 m3
Waste over weighbridge p.a. (May 2011-May 2012)
135,523 tonnes 442,967 tonnes 413,547 tonnes 509,366 tonnes
Projected landfill lifespan (years)
13 years 6 years 16 years 17 years
End date April 2025 March 2018 January 2028 February 2029
Another area where future capital expenditure is to be located is in the purchase of portable builders rubble crushers and the construction of permanent crusher units. This is in order to use a potential profitable means of addressing the challenge of illegal builders rubble dumping in the City.
Purchase of waste vehicle (compactors), and plant and equipment for the landfill sites is becoming an increasing burden on PIKITUP’s fiscus. Alternative solutions to this perennial problem are requested from the responsible provincial or national government.
4. Residential Infrastructure Review
The following reflects some of the challenges and trends related to housing development in the City. The City has recently concluded the Sustainable Human Settlements Urbanisation Plan that highlights and puts forward proposals for existing and future residential development within the City.
Residential Growth Trends
Market forces, informal development pressures and government investment over the last two decades resulted in distinct spatial trends in meeting the demand for residential development. These were:

Built Environment Performance Plan 2014/15
Subdivisions
10 dwelling units per ha
10-40 dwelling units per ha
40-70 dwelling units per ha
70-120 dwelling units per ha
Township Applications Submitted
Regions
1. Greenfields development in the form of township establishments that, in the majority of cases, take in the form of low to medium density urban sprawl on the western and north-western fringes of the urban area. These developments are both private and state driven, the latter being mostly RDP style housing projects (see figure g).
2. Densification through subdivision and redevelopment of existing urban areas into medium to high density residential stock. This trend placed a severe burden on the existing infrastructure capacity within these areas.
3. The proliferation of informal settlements on the outskirts of the City.
These trends of urban sprawl and intermediate densification in areas that are not designed for, or serviced by a public transport systems are not regarded as sustainable. Urban sprawl has been successfully curbed by the institution of an urban development boundary. The proliferation of informal settlements has also resulted in an equally unsustainable pattern, concentrating large enclaves
of poverty at the extreme fringes of the city. This pattern resulted in vulnerable communities without adequate access to existing urban opportunities, high transportation costs and very low-key local economic activity. The high rate of urbanisation has also resulted in nodal areas like the Inner City being transformed with slum conditions evident in some parts.
Public housing: Large scale government housing programmes (Figure) are still predominantly provided at the edge of Johannesburg’s urban system in RDP style subsidised housing developments that are scoring very low on the Sustainable Human Settlement Index. This trend entrenches the geography of poverty and is in direct conflict with one of the fundamental growth principles to not create large enclaves of poverty. The impact of these projects should be considered within the context of the Gauteng City Region, not necessarily from individual municipalities’ perspectives and far better coordination should be facilitated by the Provincial government to ensure a more integrated approach.With the finalisation of the housing accreditation process the Provincial Housing Programme will need to be review.
Informal settlements: The Sustainable Human Settlement Urbanisation Plan (March 2012) compiled for the City’s Housing Department, provides an overview of the spatial location and characteristics of informal settlements in Johannesburg (also see Figure z). It is estimated that the City has 157 informal settlements with an estimated 164 939 informal structures. From the existing CoJ informal settlement database, it was indicated that 25 settlements have been successfully relocated and 17 (comprising 66 327
units) have been formalised in-situ, mostly in the south and west of the City. The CoJ informal

Built Environment Performance Plan 2014/15
(
((
(
(
( (
(
(
(
(
(
Soweto
Lenasia
Midrand
Sandton
Lanseria
Fourways
Randburg
Diepsloot
Ivory Park
Roodepoort
Orange Farm
Johannesburg CBD
Motorway
Informal_Settlements
Regions_2012
CoJ_boundary
Ü
0 3 6 9 121.5Kilometers
settlement database identifies each informal settlement by name and spatial referencing, and links the settlement to a dataset with attributes (such as number of units, ownership, infrastructure, category – i.e. relocate, in-situ upgrade, regularise, project linked).
The majority of the City’s informal settlements occur in Region A, mainly around Diepsloot (25 000 units), andIvory Park (15 000 structures). Regions B and F have the fewest informal settlements, with less than 9 000 structures together – these settlements are mostly well-located within the urban structure, within the Inner City or close to railway stations, industrial areas and other amenities. The informal settlements in Region C show a strong correlation with the western mining belt and represent 38 032 units (23% of the City’s informal structures). Soweto (Region D) have a recorded number of 26 settlements, totalling approximately 12 926 units. Most of these settlements occur around the railway lines in areas such as Kliptown. Alexandra in Region E still accommodates 16 informal settlements, with the largest of them located along the Jukskei and its tributaries. Region
G has about 38 330 units in 27 settlements. More than 45 447 structures have been eradicated in this region by way of formalisation processes over the last number of years.
The outcome of the Formalization and Regularization of Informal Settlements Programme being undertaken is that informal settlements will be mostly upgraded in situ. Most of these settlements are situated within otherwise established (formal) settlements, but there are some that are located peripherally or in isolation from the larger urban area. The danger is that their regularisation could further entrench the geography of poverty, which is contrary to the fundamentals of development described earlier. However, due to historical process of development and engagements with the affected communities the City is obliged to continue with the upgrading process – unless the supply of well-located medium to high density projects, that will start to address the pent-up demand, can be rolled out at scale.
Region Informal settlement New informal settlements Backyard units
No. settlements No. units % of units No. settlements
No. units % of units
No. units
A 45 48 336 30% 1 100 4% 109 156B 4 5 610 3% 0 0 0%C 26 38 032 23% 3 900 33% 19 333D 26 12 926 8% 0 0 0% 141 798E 12 15 962 10% 3 1 164 43% 11 375F 6 3 034 2% 6 449G 27 38 330 24% 32 541TOTAL 146 162 230 100% 11 2 709 100% 320 652TOTAL INFORMAL
157 164 939
TOTAL (Informal+backyard)
485 591

Built Environment Performance Plan 2014/15
Almost 64% of the households are subject to in-situ upgrades via existing projects or programmes (specifically via the Alexandra Renewal Programme and Kliptown Regeneration initiatives, accounting for a further 12% of households). However, from practical experience the yield reflected by the respective projects is frequently insufficient to cater for the full needs and numbers of all households per settlement and an overflow needs to be budgeted for when estimating the supply and demand ratios. Similarly, issues relating to non-qualifiers in terms of subsidy administration also provide challenges in relation to allocation of projected yields and number of households within settlements.
Backyard units: Most of the City’s 320 652 backyard units are located in Region A (34%) and Region D (44%). There are twice as many backyard shacks as there are units in informal settlements in the City. These are shacks constructed of metal, plastic or blocks that are on the same proproperty as a formal dwelling (often an RDP unit). Backyard units represent a far greater challenge to the municipality, as if managed properly can realise a significant income for poor landowners and an important rental market for migrants arriving to the City.There is a definite correlation between backyard units and better located areas with infrastructure, such as Alexandra, Ivory Park and Diepsloot, as well as Soweto, instead of Region G that only accommodates 10% of all backyard units. The spatial distribution of backyard units can be summarised as follows:
Region A: the backyard units are mostly located in Diepsloot, Ivory Park and the southern parts of Rabie Ridge.
In Region C, backyard structures have been recorded in Thulani, Bram Fischerville, Sol Plaatjies and Tshepisong.
Soweto (Region D) has backyard units in all residential areas. Region F: The backyard units are more than double the number of units recorded in informal
settlements and are located in Berea towards the north and in the entire area between Jeppestown and Malvern to the east along Jules Street and the railway line.
Region G: The Deep South – Orange Farm/Zakariyyah Park accommodate the densest patterns of backyard units compared to areas such as Ennerdale, Finetown and Lawley.
Social Housing and Hostels: Most of the City’s social housing projects are well located in the Inner City or the east-west central activity strip towards Roodepoort. The main implementing agents of social housing are JOSHCO, JHC and the ARP and they have completed projects providing an estimated 5 483 units in 16 different projects. There are very few social housing projects that form part of any large scale RDP housing projects.There are 21 hostel projects underway in the City, representing a total of 15 114 units. Most of the hostels are located in the Inner City and Soweto. With regards to rental demand, it is of interest to note the information published by the Social Housing Foundation on the rental market in Gauteng, which indicates that the City has the highest numbers of rented dwelling units in the province, which represents about 31% of all households in the City.
Private (market driven) housing: Trends related to housing provision for other income groups in the City is summarised under the growth trends discussion.
Meeting Residential Demand for a Growing Population
The key focus is on creating a range of housing typologies and tenure options supported by extended public transport infrastructure. Additionally, the construction and operation of appropriate infrastructure and community facilities in these communities is critical to creating sustainable human settlements. The City’s key policy position and requirements for meeting residential demand on outlined in the Sustainable Human Settlement Urbanisation Plan of 2012 and can be summarised as follows:
Human and Social Development A significant proportion of the subsidy-eligible population has the liquidity to invest in their
housing – just not enough to purchase a whole house therefore we need a diversity of housing products that match the affordability profile of the population.
The provision of social facilities and infrastructure within new residential townships often lag far behind the construction of houses. However, the same information is required for bulk infrastructure along with a costing or cost benefit analysis of infrastructure provision. The facilitation of public investment in bulk and social infrastructure and amenities needs to be aligned with new housing settlements and those existing areas currently in need of re-
Built Environment Performance Plan 2014/15
investment. The outcome of this investment will be an integrated environment improving the overall quality of life for the City’s residents.
The City is characterised by periodic migration patterns. The spatial and social needs of the target market need to be assessed and understood to be able to make appropriate decisions relating to affordability of housing products, financial instruments and others.
Economic Growth High levels of unemployment and the informal development of backyard shacks as an income
generator could well be owed to the impact of the continuous spatial separateness of “RDP type housing” from job opportunities and social services.
A “better spatial location” relative to others in the City will not address the issues of job availability and job creation per-se. This will require an upturn in economic activity matching skills levels available with the opportunities created in different parts of the City. A comprehensive strategy dealing with economic development, investment and job creation in the City is a critical step towards bridging the gap regarding this issue and to achieve a sustainable city in future.
Environment and Services Acknowledge the informal sector and the importance of the green economy in terms of job
creation, waste management systems, local economic development and urban regeneration. Transportation corridors have a critical role to play in connecting different regions of the city
and linking the housing, economic and social components of the SHSUP. The City will need to engage extensively with the Transport Department to consider and implement critical transport linkages to unlock development potential where lacking in identified strategic areas, and to enhance the functional integration between land use and transportation in the City.
The SHSUP emphasises the need to develop a well-researched process of land banking in response to the Strategic Areas identified. It also highlighted the importance of expanding existing institutional structures such as the Joint Land Steering Committee in order to ensure that all public owned land in the City is optimally utilised for purposes of providing housing and/or social services and facilities, rather than making the land available to the private sector to develop for short term profit purposes.
Governance Existing housing programmes and their associated funding mechanisms remain the key
financial drivers of the SHSUP. The City will therefore need some financing arrangements that do not depend solely on the existence of a national housing subsidy programme will be key in shifting the focus and qualitative aspects of a SHSUP.
To implement the SHSUP effectively the boundaries of current policy will need to be tested and will require a champion to support a new financing approach that draws in the participation of the state, private and household sectors.
The City proposes the following adjustments to the current National Housing Subsidy Scheme in order increase the efficiency and effectiveness of sustainable settlement:• The affordability of the State and the affordability of the household should be bridged
through an arrangement of appropriately structured financial products to deliver adequate housing.
• The scale of delivery of backyard rentals is unmatched by the public sector. The state will need to financially or administratively support these efforts.
• Redevelopment and regeneration in strategic locations attracts the private sector to invest in these areas. This requires the state’s investment in terms of infrastructure and social amenities – resource strapped local government is unable to deliver at the scale and speed required.
• Remove or otherwise address the resale restrictions currently applying to subsidised housing - housing delivery occurs not only through the construction of new units, but also through subdivisions, home improvements and extensions, and critically, the resale market.
• Controls are required to ensure that the funding for subsidised housing as well as necessary approvals from planning processes are obtained timeously.
It is acknowledged that presently the current housing funding mechanism has limited the development of higher-density subsidised residential developments. In addition, development

Built Environment Performance Plan 2014/15
costs render high-density mixed developments / redevelopments extremely challenging from a financial perspective. Innovative financial mechanisms like extending the payback period for housing bonds from 20 to 25 years (which would reduce the monthly instalment fee), or the introduction of a tax break to projects which include medium to high density affordable housing units similar to the tax benefits provided to developers as part of the Urban Renewal Tax Incentive, could be introduced to make high density developments more affordable to the poor, and financially viable to the private sector.
70% to 80% of residents fail to leverage the full financial benefits associated with capital growth in house prices – and the associated downstream rateability benefits for the municipality.
Historically, decisions relating to policy, strategy and delivery of housing have been mainly around the cost and capital spent of the top structure and infrastructure. Costs should be understood, defined and measured in terms of qualitative aspects relating to SHS in a broader sense.
A need exists to establish an institutional environment that allows the resale market to work at the lower-end of the housing ladder which will assist in the “churn” and flow congruent with the middle and higher end of the market. The City will need to consider whether it could utilise the Sustainable Services Cluster as its institutional arm for the implementation of the SHSUP. This cluster should form an oversight mechanism and framework for the SHSUP, and be aligned with the GDS outcomes. In addition, the City’s Department of Human Settlements must continue the process to obtain housing accreditation level 3 in order to receive direct funding for the delivery of SHS.
The City must ensure the establishment of well-defined roles and responsibilities and accountability in the delivery of SHS. Multi sectoral integration across the entities and agencies responsible for policy formulation, planning and implementation of sustainable human settlements would be required in this regard.
The policy position relayed in SHUSUP has a distinctive spatial rationale for future development of residential development within the City. This is reflected in the following map and accompanying discription. Realisation of the Plan is dependent on the governance, infrastructure and economic growth considerations being addressed.

Built Environment Performance Plan 2014/15
Since SHSUP was adopted the location of the public transport corridors within the City have been redrawn within the City. This has shifted the areas of priority as defined above. However the focus on directing residential development to the Public Transport Priority Network, to existing housing projects in order to complete them, redevelopment areas, and in the long term to consolidation and infill areas as well as to identified expansion areas remains the human settlement policy of the City.
In addition SHSUP provided tools and associated projection for the medium term provision of housing typologies (See table below).
In terms of unit typology the outcome of these projects will be that 62% of units will be RDP type units, 24% will be medium to high density rental and social units and 13% will be bonded. In terms of the allocation of funds 31% are allocated towards medium to high density rental and social units, 51% towards mixed typology projects where a typical split of 50/25/25 for RDP/rental/bonded are achieved. Only 15% of funds will be allocated to exclusively RDP projects. These funding allocations are illustrated in Figure 3.2.
The shift to more integrated higher density rental and social housing is gaining momentum as a substantial amount of planning has been concluded to facilitate the development of such projects. The Inner City and other well established nodes, such as Randburg and Roodepoort CBD, offer high potential for affordable higher density residential and are key focus areas for redevelopment.
The SHSUP also provided projections for the land requirements to accommodate future residential and associated community requirements. This was in the form of a model. A realisation of this model based on typical variables is provided below.
In respect of the guidelines relating to norms and standards, the City has endorsed the following guidelines for social infrastructure for Informal Settlement Upgrades / Related Projects.
Red Book StandardsMin. Popn. Threshold
Building (m2) Required space (m2)
Creche / nursery school 5,000 100 30Primary School 3,000 14,000 10,000High School 6,000 26,000 20,000Clinic 5,000 2,000 0Libraries 5,000 130 0Community Centres 10,000 5,000 0Religious centres 2,000 150 0
Proposed Standard
Min. Household Threshold Building Related Open Space
1 Education Facility (Primary / High School) 1,714 18,000 5,0001 Clinic 1,429 1301 Creche / Nursery School 714 1001 Multi-purpose Centre 1,429 1,000Open Space @ 10% of Land for Housing and Social AmenitiesInternal circulation (road + pedestrian) @ 20% of Land for Housing and Social AmenitiesProposed standards for social facilities for Informal Settlements’ upgrades
PROJECT TYPEInfrustructure Cost ( R )
Top Structure Cost ( R ) Total Cost ( R )
% Cost Split per Project Type
UNITS TO BE DELIVERED RDP Bonded Rental
Serviced Sites Completed to date
Units Complete
Social/Rental med and higher density residential Totals 140900000 1540495000 1681395000 31 5111 250 550 4311Mixed housing project Totals 710523400 2045451010 2755974410 51 36690 17289 8108 11293 5699 1505RDP project Totals 97000000 709346250 806346250 15 22570 22570 0 0 24003 8019Grand total 1159773400 4295292260 5455065660 100 64371 40109 8658 15604 29702 9524
% Split Housing Type 62 13 24

Built Environment Performance Plan 2014/15
Having established a current number of households (an estimated 480 000), by utilising the guidelines the following land requirements become apparent with respect to both housing (at differentiated densities) and the requisite social infrastructure (number and land required).
Avge Sq metres per Erf 250 200 170 150 120 100 80Correlating Densities (Nett) 40 50 59 67 83 100 125# of Resident Households Hectares Required240,000 6,000 4,800 4,080 3,600 2,880 2,400 1,920
Metres Sq Required
60,000,00048,000,000
40,800,000
36,000,000
28,800,000
24,000,000
19,200,000
Land requirements for housing at different densities
Social Facilities Required Facilities required Rounded Sq metres Hectares
Education Facility (Primary / High School) 140 140 3,220,000 322Clinic 168 168 21,840 2Creche / Nursery School 336 336 33,600 3Multi-purpose Centre 168 168 168,000 17Sub-total for Social Amenities 812 812 3,443,440 344
Realising SHSUP land requirements is beyond the resources of the City. After a series of evaluations via satellite photography (2009) and preliminary environmental assessments the City has earmarked +/-140 portions of land (an extent of +/- 680 hectares) to support in-fill, Transit Orientated Development densification for mixed-income / typology initiatives. Characteristically, these portions:
Are considered to be under-developed / vacant. Are currently managed via the Johannesburg Property company. Have been reserved / protected from alienation via Mayoral Committee and Council Resolution
until detailed feasibilities have been completed. Are within 1km of the emerging Bus Rapid Transit (BRT) and / or the existing rail station
infrastructure. Have been provisionally screened and vetted by the Environment Department (noting that in
some cases, more detailed environmental assessments would be required).
To meet the land requirements for future residential development in the City will require the cooperation of all public and private land owners.

Built Environment Performance Plan 2014/15
5. Community Infrastructure Review
Development of social and community facilities will be targeted towards the areas indicated as most deprived on the Multiple Deprivation Index map and especially where there is a high population density. Apart from the Alexandra Renewal Programme, (ARP), there are marginalised areas development programmes in Orange Farm, Diepsloot and the Greater Ivory Park area. The intention of these programmes is to provide facilities and infrastructure in order to create sustainable human settlements that are integrated with the rest of the urban system in order to realise the vision of SHSUP. Where viable, options to provide multiple municipal services in one facility will be implemented. Although these are the priority location, there are many areas in the City that require upgrades to existing facilities.
Achieving sustainable human settlements is a long term process that will require substantial resources. The limited ability of Council to afford and sustain the required capital investment for social facilities is not enough to make a substantial difference over the next decade. A key concern remains the provision of facilities by Provincial Departments – alignment and coordination is problematic as little information is shared and prioritisation decisions are made without consultation with the City.
A project to model the need and accessibility to social facilities and services was undertaken by the DPSA and CSIR in 2012. The key finding of the research was that social facilities, Johannesburg, ‘ in general, were found to be well distributed although lacking in service capacity.’ The need to maximise the capacity of existing social facilities and focus on improving the management of these facilities in order to prove quality services was emphasised. Clustering of services in a single facility was proposed as means of promoting cost effective service provision.
Areas identified as having an underprovision of social facilities were ‘Soweto, Diepsloot, Ivory Park, Alexandra, the Inner City, Orange Farm and Cosmo City.
Specific social facility backlogs for the City of Johannesburg were defined as follows in the research report,
Facility Type Quantity RequiredSocial Grant Payment Points 19 New Payment PointsParks 200 proposed parks at a minimum size of 0.4 haFire Stations 4 new stations RequiredLibraries 3 new libraries requires, and Expansions required to
5 existing facilities
The proposals made in the study will be included within the capital planning processes undertaken by the relevant departments and Municipal Owned Entities in the City. Coordination will be undertaken with the responsible provincial or national departments where necessary. It must be noted that the study focused on the existing urban footprint of the City and did not take into account future greenfield housing projects.
6. Transportation Review
As described previously high capacity well-functioning transport infrastructure be it by rail, road or air is an economic and social priority for the City as a means of accessing employment opportunities, a location for residential densification in certain location and as a means of anchoring future economic growth at mixed use and industrial nodes through the concept of transit orientated development.
Johannesburg’s transport realities are characterised by two distinct features: the majority of residents do not own private cars and travel by bus, rail or private minibus taxis. In contrast, middle-income residents are resolutely car-orientated, with an increase in travel times of nearly 60% since 1980 evident on our roads. This has resulted in a transport system:
Where land uses are designed for private vehicles. The previous public transport systems were inefficient and not designed for the benefit of the
user

Built Environment Performance Plan 2014/15
Which has a hierarchical road network with numerous unconnected roads, loops and dead-ends
Where mobility along major arterials is compromised
In terms of regional movement patterns, (Map 2.5), it is clear that the Johannesburg Inner City plays a central transportation role within the region and that the main movement to the north (Pretoria) and east of the city (Ekhuruleni) is a clear indicator of where the major economic activity of the region is located
To mitigate against increasing petrol prices, the cost of maintaining road infrastructure and increasing air pollution, a modal shift change from private to public transport is the only answer for the future city of Johannesburg. The City has introduced its Rea Vaya Bus Rapid Transit system, and the Gautrain high-speed rail link is operational, forming the back bone of a future urban public transport system. The potential of modal shifts present a number of opportunities for economic development and improved city living. The graph below provides a representation of the assumed figures for passenger ridership (assuming that Phase 1 of the Rea Vaya BRT would carry 430 000 passengers a day). This assumption is modelled, reflecting the impact such a move would have on private vehicle use, and the use of other modes of transport. Even if this assumption was to be realised, the graph
demonstrates private cars will remain dominate for the forseeable future. There aresome indications from the rollout to date that further reductions in private cars could be achieved through the Rea Vaya BRT implementation. However, when projecting to 2040, it is argued that significant increases in the use of bus and rail will need to be actively targeted.
This will require a re-engineering of parts of the City to become public transport
corridors where economic activity, community services and residential developments service and are serviced by a bus based public transport system. Where a broad range of socio-economic groups live and work together. A public transport environment that serves the young, the old and those living with disabilities. Such an initiative will require a long term investment in social, residential and economic infrastructure associated with the identified corridors, combined with an ongoing marketing campaign to promote public transport and the corridors themselves. To this end the City has launched the Corridor of Freedom initiative. The Corridors of Freedom envisage a network of public transport corridors based on the Rea Vaya bus system and the Gautrain Stations across the City (see figure w).

Built Environment Performance Plan 2014/15
The Corridors of Freedom will connect the former black townships of Diepsloot, Soweto and Alexandra with the CBD and other major mixed use nodes within the City while promoting the Corridors as locations for investment and residential densification in their own right.
The future built environment envisaged within the Corridors of Freedom will be a mixed land-use type dominated by high-density accommodation options, supported by office buildings, retail development and opportunities for leisure and recreation.
The intention is that residents of the City will live closer to their workplace and be able to work, stay and play without having to use private motorised transport. Safe, affordable and convenient buses, cycling and pedestrian activity will replace the carbon-burning private car.
The new City skyline will consist of high-rise residential developments growing around the transit nodes, gradually decreasing in height and density as it moves further away from the core. Social infrastructure, schools, clinics,
police stations and government offices will be strategically located to support the growing population.
The key features of the Corridors of Freedom will be:
Safe neighbourhoods designed for cycling and walking with sufficient facilities and attractive streets
Safe complete streets with features to calm traffic, control vehicle traffic speeds and discourage the use of private transport
Rich and poor, black and white living side by side - housing options provided cover a range ofhousing types and prices including rental accommodation
Limited managed parking to reduce the amount of land devoted to parking and further discourage the use of private transport
Convenient transit stops and stations
To date detailed strategic area frameworks have been undertaken for the Louis Botha, Perth-Empire and Turffontein Corridor Areas (see figure ). Through these frameworks areas for transit orientated development have been identied, typologies for residential development defined, population projections proposed with associated requirements for social, economic and service infrastructure. In turn these requirement have been reflected in the City’s capital budget.
It is envisaged that each corridor will be a focus for City Capital investment for a 6 to 9 year period before another corridor becomes the focus for such funds.The realisation of the Corridors however will require a range of coordinated public funding and private sector in order to ensure the success of the Corridors of Freedom combined with ongoing leadership from business and local, provincial and national government leadership.
The Corridors of Freedom is the central built environment concept that will realise significant change in the urban form of the City. The Corridors of Freedom will: (include bullets from safe and SAF boundary maps).
Built Environment Performance Plan 2014/15
7. Sustainable Development Review
The City of Johannesburg falls within two priority areas identified in the National Spatial Biodiversity Assessment (NSBA, Driver et al. 2004), and is home to a disproportionately high percentage of rare and threatened species and threatened ecosystems. A high proportion of South Africa’s mining activity, heavy industry, commercial enterprise and urban population are located in the bioregion, and consequently, the pressures placed on the environment and the remaining natural ecosystems are very high, and opportunities for conservation of biodiversity are limited.
There are at least 12 threatened plant species and 10 threatened animal species in the City of Johannesburg, and 9 ecosystems listed as threatened according to NEMBA 2008. Aquatic systems are equally unique in the bioregion and 100% of wetlands types and 20% of river types in the City are listed as threatened. Just over a third of the City of Johannesburg is in a natural or near natural state (36%), with urbanisation (48%), agriculture (11%) and mining (5%) together covering 64% of the City.
Given the high levels of urbanisation in the City it is not an issue as to whether ecological infrastructure constrains urban growth but a function of the opposite relationship. Areas of high biodiversity have been identified for conservation, but the purchase and subsequent management of such areas does not occur due there being other developmental priorities within the City and limited financial resources. Similarly the urban population has generated high levels of waste which often degrade existing open space and bio-diversity hot-spot areas.
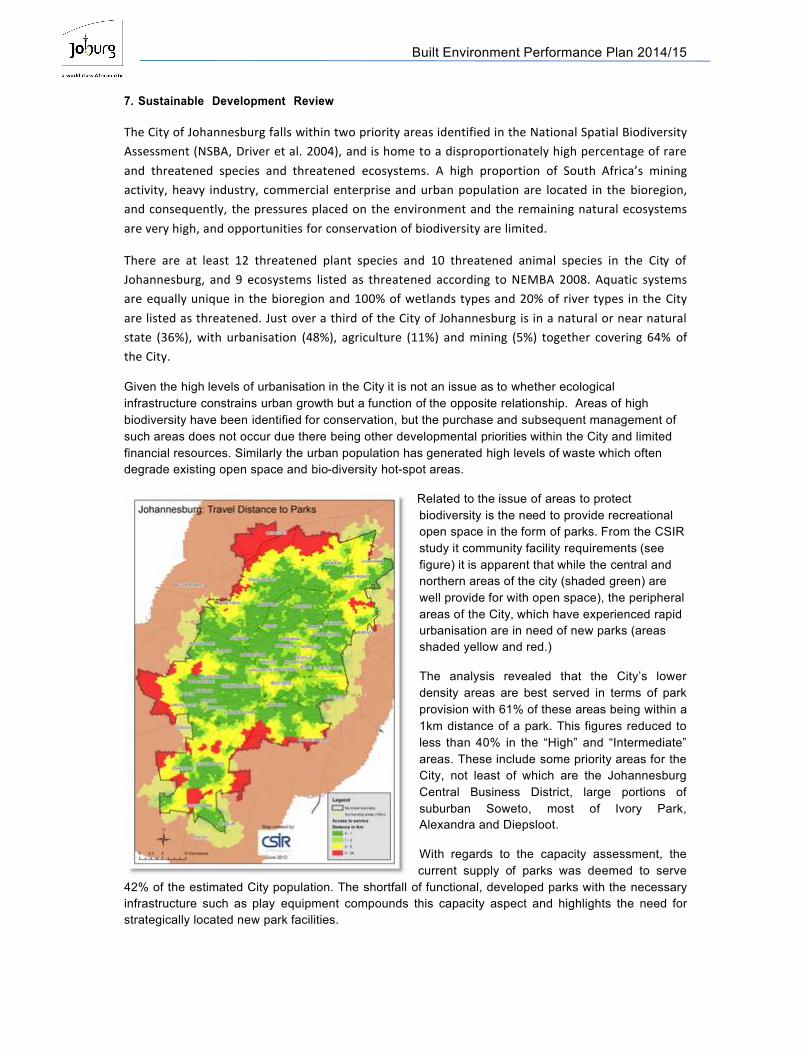
Related to the issue of areas to protect biodiversity is the need to provide recreational open space in the form of parks. From the CSIR study it community facility requirements (see figure) it is apparent that while the central and northern areas of the city (shaded green) are well provide for with open space), the peripheral areas of the City, which have experienced rapid urbanisation are in need of new parks (areas shaded yellow and red.)
The analysis revealed that the City’s lower density areas are best served in terms of park provision with 61% of these areas being within a 1km distance of a park. This figures reduced to less than 40% in the “High” and “Intermediate” areas. These include some priority areas for the City, not least of which are the Johannesburg Central Business District, large portions of suburban Soweto, most of Ivory Park, Alexandra and Diepsloot.
With regards to the capacity assessment, the current supply of parks was deemed to serve
42% of the estimated City population. The shortfall of functional, developed parks with the necessary infrastructure such as play equipment compounds this capacity aspect and highlights the need for strategically located new park facilities.
Built Environment Performance Plan 2014/15
From a green infrastructure perspective the City reflects its socio-economic divisions. The northern,more wealthy areas of the city are well vegetated, while the poorer areas of the City, where the highest population densities are located remain denuded. Having said this the City has had significant success in greening Soweto and providing parks to former black townships, though far more investment in this area of infrastructure is required, combined strong civic initiative is required to support growing of plants and trees particularly from the perspective of promoting urban agriculture.
From an ecological perspective it is the physical environment, in concert with the built environment, that does the most to constrain urban growth:
Johannesburg is negatively affected by dolomite (limestone) geology in the north west and south of the Municipality which give rise to sink holes which can cause serious damage tobuildings and infrastructure. This prevents, or makes it very costly to undertake construction in these areas. Often these areas are targeted for low income housing due to the inexpensive cost of land, with sometimes tragic consequences.
Deep level mining with south central Johannesburg along the gold reef has through under-mining, the poisoining of underground water, the uncontroled accumulation of the aforementioned water, the stacking of unconsoldated sand at mine dumps have combined to make the land within the former mining belt either unusable for construction or highly unpleasant and harmful to residents who live in townships adjacent to these areas. Rehabilitation of the mining belt is critical to ensuring a better urban environment and a critical component of creating a sustainable City given the central location of the Mining Belt.
Flooding is becoming an increased problem within the City. This is due to increased intensity of summer thunderstorms, the growth of informal settlement within the 1:100 floodline, increased storm flow in the City’s river and streams due to the City’s stormwater network and the increase in urban development, increased erosion of stream banks combined with the destruction of remaining wetalands.
8. Impact of Sectors on Spatial Form
1. Continued population growth at a growth rate higher than expected and which has exacerbated social and economic inequalities provides the context for the City’s current built form
2. Poverty and high population densities are entrenched within specific locations away from economic opportunities and wealthy residential areas which are concentrated in mixed-use and industrial nodes in the north of the City.
3. Physically the City has a dispersed settlement pattern that was designed for the private vehicle. This means that the poor have to pay proportionally more in transport fees to access formal employment opportunities and higher levels of service.
4. Having noted this the City has a significant backbone in economic infrastructure in the form of rail, roads, telecommunications and airports.
5. It also has an established and flourishing, though vulnerable, commerccial base6. The City also has a well developed informal economy that has developed due to high levels
of poverty and unemployment within the City.7. Provision of water, electricity, roads and waste removal and community facilities occurs in a
scenario where there is greater demand for the services, but the ability of consumers to pay for the services is diminishing in the face of the economic recession and increases in poverty. Furthermore the dispersed settlement means that networks need to be extended to beyond expected capacity.
Built Environment Performance Plan 2014/15
8. Similarly much of the existing network infrastructure is reaching the end of its expected life and is need of replacement.
9. The squeeze on service revenues is occuring at time when alternative revenues for example from alternative sources of energy, and savings from more environmentally sustainable methods are still at an infancy.
10. Housing provision for the poor, middle income and wealthy has worsened the City’s sprawl in the past 20 years with RDP housing and town house complexes being built where land is cheapest on the edge of the City away from existing social and economic opportunities. Due rate of growth of residential development, the City has failed to keep pace in the provision of Community Facilities though the City’s track record in providing network services and waste management services has been good.
11. The housing shortage for low income housing, in-migration, population growth and the regulation pertaining to accessing the housing subsidy have led to proliferation of informal settlements and backyard shacks. Current progress at addressing the informal settlement challenge has been slow. There is also fears that the current housing strategy with regards informal settlements is entrenching poverty.
12. A response of the City has been to promote public transport through roll out of a city wide bus rapid transit system known as Rea Vaya to link the poorer areas of the City with the socio-economic opportunities at the nodes. The system is still in its infancy and will need ongoing capital and operational funding for the medium to long term, but it has the potential to change the City’s urban form.
13. The concept by which this change will occur is the ‘Corridors of Freedom’ which designates areas adjacent to the Rea Vaya Network and areas within existing economic nodes as places for densification of residential and economic opportunities to cater for a range of income requirements including the poor. The concept sees the corridors as a focus for public investment particularly around bus and rail stations and which promotes a walkable and cyclist friendly environment. Public investment by itself will not be enough, private investment will need to flow into these areas in order for these public transport corridors to be a success.
14. The contradiction that the City stands with is that ongoing population growth places increased pressure on its natural resources be it water, electricity, open space, bio-diversity, it streams. Managing these resources particularly around water, waste water management, storm-water management, acid-mine drainage and mine dumps has become an expensive imperative.
Built Environment Performance Plan 2014/15
PART C – STRATEGIES AND PROGRAMMES
1. Long Term Vision
Johannesburg’s vision is to be a World Class African City of the Future – “a vibrant, equitable African city, strengthened through its diversity; a city that provides real quality of life; a city that provides sustainability for all its citizens; a resilient and adaptive society.”
The long-term plan of the City to realise the City’s Vision is the Growth and Development Strategy 2040 (GDS 2040). The GDS 2040 provides a set of defined strategic directions that frame the five-year Integrated Development Plan and by extension the spatial plans of the City.
The GDS 2040 was approved in October 2011 and the City’s business planning processes and budgets have been aligned with this new strategic direction. The strategy restates the City’s resolve in confronting the past injustices created during Apartheid, working towards a democratic, non-racial, non-sexist and just City while simultaneously confronting present and future challenges as they emerge.
The Joburg 2040 GDS paradigm embraces the concepts of liveability, resilience and sustainability, as the characteristics of the future City. Four drivers were identified to contribute to these ideals –inclusive and productive economic growth, environment and services, human and social development, and sound governance. Principles were defined to unpin these drivers:
Principle 1: Eradicating poverty
Enabling the poor to access basic livelihoods, inter-alia by helping them to secure social grants, facilitating skills development and basic employment opportunities, and supporting ‘self-help’ projects, start-up micro-enterprises and community-based co-operatives;
Ensuring the affordability of municipal services, public transport and social facilities, through progressive tariff structures, creative cross-subsidisation and targeted social packages;
Accommodating the poor, by working to ensure that they can find and retain decent lowest-cost rental housing opportunities – without needing to resort to a life lived in informal settlements and Inner City slums. A key priority is the assimilation of the poor, ensuring they are not relegated to the margins of the city, but can instead find residency in mixed-income residential spaces;
Empowering the poor politically through meaningful participatory governance; and enabling them to feel part of the city, through the use of a range of measures – including sports, recreation, arts and culture – to minimise the experience of social exclusion; and
Making allowances for the poor in terms of the regulation and management of the built environment and the use of public space – e.g. through developing more innovative, supportive regulatory approaches for the management of informal trading, spaza shops and backyard dwellings.
Principle 2: Building and growing an inclusive economy
The City of Johannesburg will continue to support economic growth that is both competitive and job-intensive – thereby ensuring the sharing of economic opportunities.
Principle 3: Building sustainable human settlements
The City is committed to building sustainable human settlements – with this commitment aligned to national imperatives. This commitment cannot, however, be addressed without honestly considering how sustainable human settlements can best be established in a city still divided across race and class lines. In building sustainable human environments, the City must therefore address a triple challenge: breaking through the Apartheid City; creating more liveable environments; and confronting the post-Apartheid reality of urban exclusion. It is this principle that underpins the City’s commitment to reconfigure its urban form.

Built Environment Performance Plan 2014/15
Principle 4: Ensuring resource security and environmental sustainability
The City of Johannesburg is committed to transitioning to a low-carbon economy in pursuit of a healthy urban environment and environmental sustainability – where this is considered a critical step in ensuring the well-being of all Johannesburg’s residents, and those who work and play in the city. In the context of high energy costs, a plan that does not include this transition will result in an energy base and aligned costs that place excessive burdens on the economy, negatively affecting the potential of all economic sectors. Increasing energy costs will also further disadvantage the poor, exacerbating conditions of energy poverty in the city. This City is committed to addressing energy poverty by building an urban form that is energy efficient, and by ensuring that the urban poor are energy-secure.
Principle 5: Achieving social inclusion through support – and enablement
The City will ensure the promotion of social inclusion at all levels of society, through addressing key obstacles, including those that relate to access to service infrastructure and social safety nets. In addition, the City recognises the reality that social inclusion will only be achieved if all play their part. The City will work to build an enabling environment, through which citizens can support themselves and each other, creating change and greater inclusivity through the direct actions of individuals, communities, organisations, alongside the City. The City will continue to work with marginalised groups such as women, children, people with disabilities, migrants and refugees, while also establishing further partnerships through which to drive social inclusion across civil society and business. Importantly, the City will work closely with communities to minimise urban conflict arising from intolerance, prejudice and discrimination. The City will deepen its relationships with marginalised groups and strive to understand new forms of social exclusion that are emerging. Building bridges across diverse communities is an important element in driving inclusivity, and ensuring the restoration of trust within and between communities. The City will assist communities to express their culture through the character of the built environment, while allowing neighbourhoods to develop their own unique character and cultural identities.
Principle 6: Promoting good governance
Good governance is central to all of the principles outlined above – serving as the foundation upon which all other principles can be realised. The City commits to ensuring financial sustainability – and deepening participation. Financial sustainability is critical if the City is to meet the long-term demands for capital infrastructure. In addition, the City will focus on building more innovative mechanisms through which citizens and communities can participate more effectively and meaningfully. Recognising that communication is critical for deepening participation, the City will transform the manner in which communicates with citizens and stakeholders.
In turn, the City identified four outcomes to be achieved by 2040. These outcomes are cross-cutting in nature, and have been developed through a consideration of the paradigm, principles and vision.
The four outcomes are as follows:
Outcome 1: Improved quality of life and development-driven resilience for all Outcome 2: Provide a resilient, liveable, sustainable urban environment – underpinned by
infrastructure supportive of a low-carbon economy. Outcome 3: An inclusive, job-intensive, resilient and competitive economy. Outcome 4: A leading metropolitan government that pro-actively contributes to and builds a
sustainable, socially inclusive, locally integrated and globally competitive GCR.
Each outcome is further unpacked into a number of outputs. The indicators the City proposes to use in order to measure progress against outcomes. The City’s preferred approach is to identify and/or develop indicators that allow for gathering of more nuanced information and data, and appropriate monitoring and evaluation of progress. There has therefore been a move away from ‘standalone’ indicators, with the City preferring to use selected indicators that combine more than one measure, where this is possible. The indicators for achieving Outcome 2 which relates to built environment will

Built Environment Performance Plan 2014/15
be combined with National Treasury’s indicators in order to develop acceptable built environment performance indicators for the City.
To integrate the GDS outcome into the Integrated Development Plan (IDP) (the medium term strategic plan for the City as required in terms of the Municipal Systems Act (56 of 2000) process, four IDP Master programmes were formulated. The four Clusters (Economic Growth, Governance, Human and Social Development and the Sustainable Services Cluster) each formulated a series of sub-programmes in support of these Master programmes.
Given the long term projection inherent in the GDS 2040 strategy the IDP focuses on particular aspects and interventions known as Mayoral Priorities that will achieve the broader GDS 2040 outcomes in the long term. The Mayoral Priorities for the current five year IDP are:
2. The Spatial Development Strategy of the City of Johannesburg
The Spatial Development Framework (SDF) is the legislated component of the City’s IDP that prescribes development strategies and policy guidelines to restructure and re-engineer the City’s urban form. The Spatial Development Framework represented below is a draft document that is currently undergoing public participation.Underpinning the City’sSDF is a series of policies that guide its implementation:
• The Growth Management Strategy
(GMS), now known as the Capital Investment Priority Areas (CIPA), is a city-wide policy that determines where, and under what conditions, growth can be accommodated, in order to achieve the desired urban form presented in the SDF.
• The Regional Spatial Development Frameworks (RSDFs) and associated urban development frameworks and precinct plans provide an area-specific interpretation of the SDF and GMS at the within the 7 Administrative Regions. The Department of Development Planning and Urban Management refers to these policies to assess development applications received by the City. This provides guidance to move towards the achievement of a desired urban form for the City.
• The Capital Investment Framework (CIF), through the application of the strategies and guidelines of the SDF and GMS, is the framework by which the City identifies and prioritises capital projects from which the medium-term capital budget for the City is finalised and captured in the IDP and annual budget.
• Precinct Plans and urban development frameworks that provide detailed design and infrastructure requirements and associated policy for localised areas or defined section of the City. The Strategic Area Frameworks for the Corridors of Freedom fall within this category of plan
The SDF sets out broad development strategies to achieve a resilient, liveable, sustainable urban environment. The strategies, the historic trends that the strategy is meant to address, the desired urban form that the streategy seeks to achieve and the specific objectives related to the development strategy are outlined the table below.
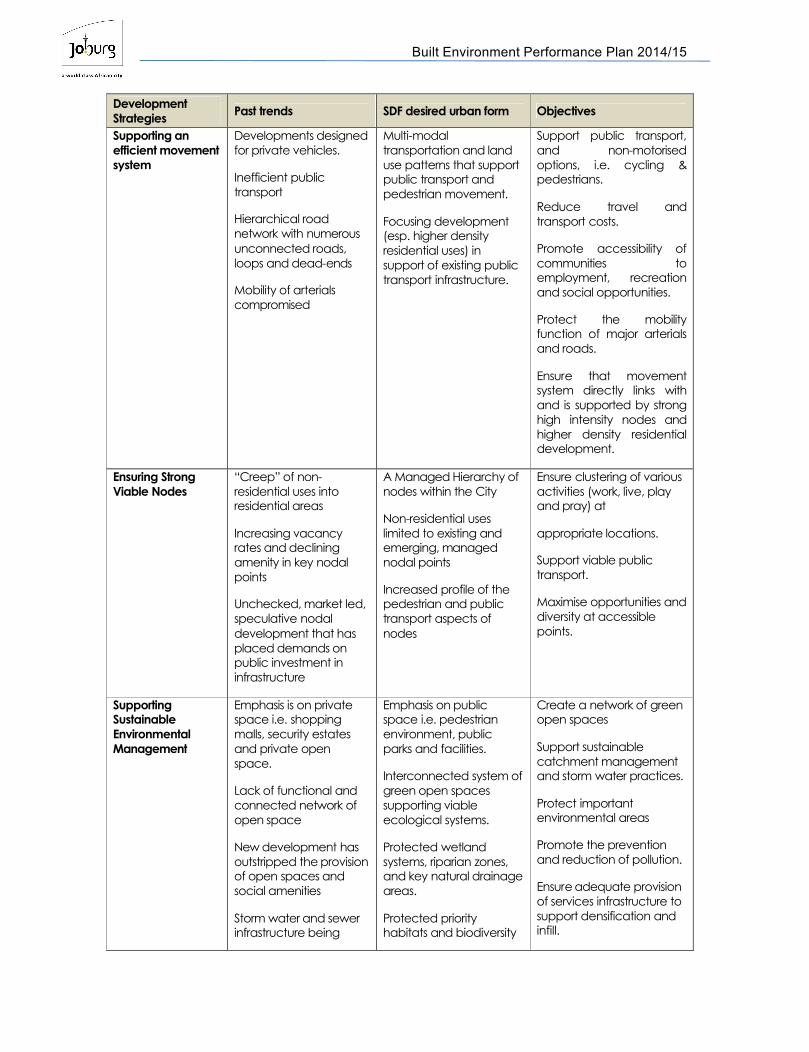
Built Environment Performance Plan 2014/15
Development Strategies Past trends SDF desired urban form Objectives
Supporting an efficient movement system
Developments designed for private vehicles.
Inefficient public transport
Hierarchical road network with numerous unconnected roads, loops and dead-ends
Mobility of arterials compromised
Multi-modal transportation and land use patterns that support public transport and pedestrian movement.
Focusing development (esp. higher density residential uses) in support of existing public transport infrastructure.
Support public transport, and non-motorised options, i.e. cycling & pedestrians.
Reduce travel and transport costs.
Promote accessibility of communities to employment, recreation and social opportunities.
Protect the mobility function of major arterials and roads.
Ensure that movement system directly links with and is supported by strong high intensity nodes and higher density residential development.
Ensuring Strong Viable Nodes
“Creep” of non-residential uses into residential areas
Increasing vacancy rates and declining amenity in key nodal points
Unchecked, market led, speculative nodal development that has placed demands on public investment in infrastructure
A Managed Hierarchy of nodes within the City
Non-residential uses limited to existing and emerging, managed nodal points
Increased profile of the pedestrian and public transport aspects of nodes
Ensure clustering of various activities (work, live, play and pray) at
appropriate locations.
Support viable public transport.
Maximise opportunities and diversity at accessible points.
Supporting Sustainable Environmental Management
Emphasis is on private space i.e. shopping malls, security estates and private open space.
Lack of functional and connected network of open space
New development has outstripped the provision of open spaces and social amenities
Storm water and sewer infrastructure being
Emphasis on public space i.e. pedestrian environment, public parks and facilities.
Interconnected system of green open spaces supporting viable ecological systems.
Protected wetland systems, riparian zones, and key natural drainage areas.
Protected priority habitats and biodiversity
Create a network of green open spaces
Support sustainable catchment management and storm water practices.
Protect important environmental areas
Promote the prevention and reduction of pollution.
Ensure adequate provision of services infrastructure to support densification and infill.

Built Environment Performance Plan 2014/15
Development Strategies Past trends SDF desired urban form Objectives
exceeded
Wetlands and natural drainage areas lost through development encroachment
Inadequate protection of riparian areas and floodplains
Loss of key habitats and biodiversity areas.
areas.
Initiating and Implementing Corridor Development
Ad-hoc and unmanaged approach to linear development
No consistency in the use of the term corridor
Delineation of two development corridors
Focused infrastructure delivery to support corridor development
Series of goals and objectives established per corridor
Determine appropriate interventions
Maximise opportunities
Facilitate linkages
Manage new developments in a co-ordinated fashion.
Managing Urban Growth and Delineating an Urban Development Boundary
Urban sprawl onto greenfield sites
Erosion of rural character of the limited rural assets of the City
Proliferation of subsidised housing initiatives on peripheral locations away from economic and social opportunities
Escalating physical and social infrastructure demands and costs for both new infrastructure and maintenance costs
Infill, “brown-fields” developments
Conservation of rural character of areas beyond the Urban Development Boundary (UDB).
Abatement of urban sprawl on the periphery of the City
Combat urban sprawl.
Create economies of urbanisation.
Focus on in-fill and redevelopment.
Support efficient infrastructure provision (capital investment).
Provide a mechanism for effective growth management.
Support a more efficient urban form that is public transport orientated.
Protect environmentally sensitive areas, agricultural land and open space.
Support a multi-modal transportation system.
Increased densification of strategic locations
Low density and dispersed activities
Market preference for one erf one unit
Perceptions that
Higher densities and clustered activities in identified strategic locations,
Co-ordinated investment in infrastructure to
Promote appropriate densities and densification in appropriate locations.
Promote the optimal use of existing and future infrastructure and
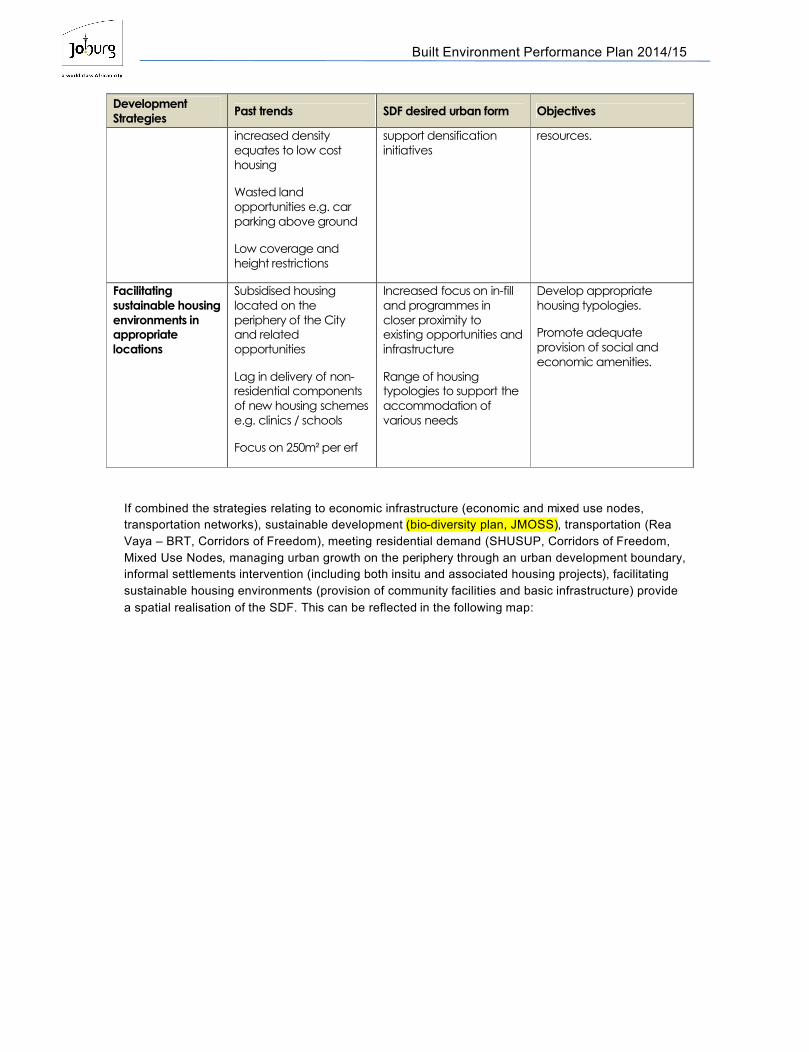
Built Environment Performance Plan 2014/15
Development Strategies Past trends SDF desired urban form Objectives
increased density equates to low cost housing
Wasted land opportunities e.g. car parking above ground
Low coverage and height restrictions
support densification initiatives
resources.
Facilitating sustainable housing environments in appropriate locations
Subsidised housing located on the periphery of the City and related opportunities
Lag in delivery of non-residential components of new housing schemes e.g. clinics / schools
Focus on 250m² per erf
Increased focus on in-fill and programmes in closer proximity to existing opportunities and infrastructure
Range of housing typologies to support the accommodation of various needs
Develop appropriate housing typologies.
Promote adequate provision of social and economic amenities.
If combined the strategies relating to economic infrastructure (economic and mixed use nodes, transportation networks), sustainable development (bio-diversity plan, JMOSS), transportation (Rea Vaya – BRT, Corridors of Freedom), meeting residential demand (SHUSUP, Corridors of Freedom, Mixed Use Nodes, managing urban growth on the periphery through an urban development boundary,informal settlements intervention (including both insitu and associated housing projects), facilitating sustainable housing environments (provision of community facilities and basic infrastructure) provide a spatial realisation of the SDF. This can be reflected in the following map:
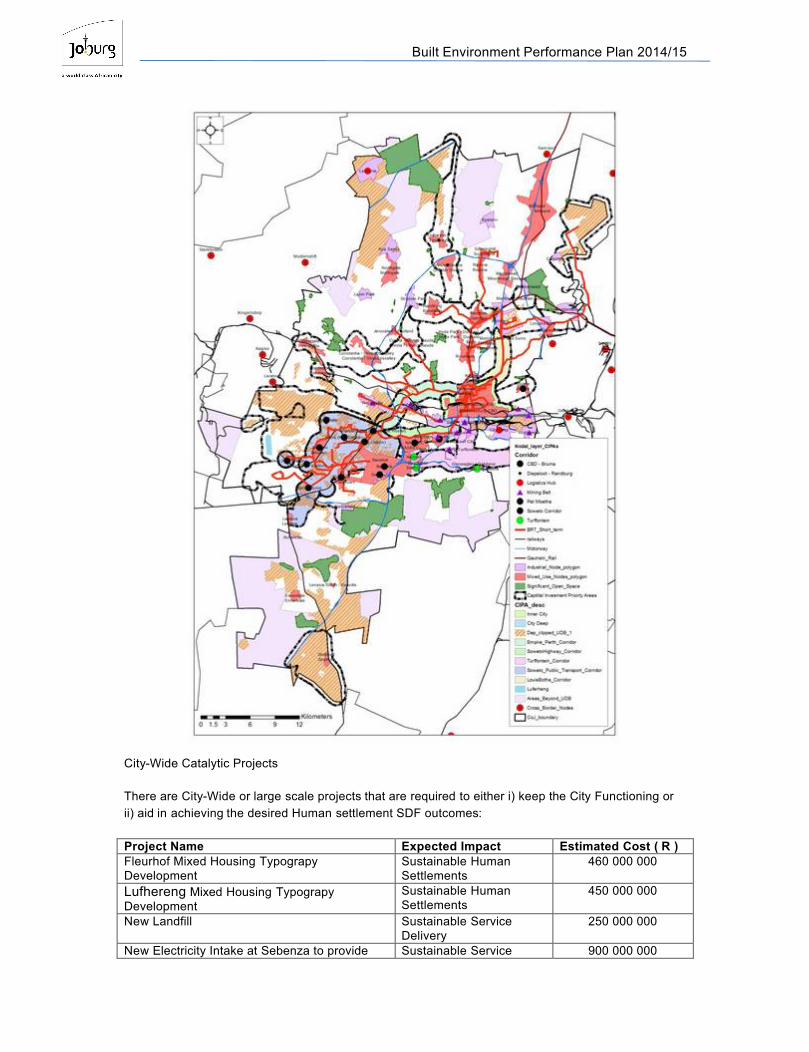
Built Environment Performance Plan 2014/15
City-Wide Catalytic Projects
There are City-Wide or large scale projects that are required to either i) keep the City Functioning or ii) aid in achieving the desired Human settlement SDF outcomes:
Project Name Expected Impact Estimated Cost ( R )Fleurhof Mixed Housing Typograpy Development
Sustainable Human Settlements
460 000 000
Lufhereng Mixed Housing Typograpy Development
Sustainable Human Settlements
450 000 000
New Landfill Sustainable Service Delivery
250 000 000
New Electricity Intake at Sebenza to provide Sustainable Service 900 000 000
Built Environment Performance Plan 2014/15
stable future supply of electricity to the north of the City
Delivery/ Economic Infrastructure
New Electricity Intake at Rivasdale to provide stable future supply of electricity to the south of the City
Sustainable Service Delivery/ Economic Infrastructure
900 000 000
Upgrading of 88kv Overhead lines Sustainable Service Delivery/ Economic Infrastructure
750 000 000
Roll out of pre-paid electricity metres across the City
Sustainable Service Delivery/ Economic Infrastructure
1 000 000 000
Upgrading of Existing Waste Water Treatment Works
Sustainable Service Delivery
360 000 000
Construction of New Waste Water Treatment Works at Lanseria
Sustainable Service Delivery
830 000 000
Upgrading of Highways (M1, M2 and Soweto Highway)
Sustainable Service Delivery/ Economic Infrastructure
660 000 000
Fibre Optic Cabling Project Economic Infrastructure 44 000 000Joburg Market – Market of the Future (Fruit and Vegetables)
Economic Infrastructure/ Food Security Project
520 000 000
Waste to Energy Project Sustainable Service Delivery/ Economic Infrastructure
700 000 000
Rea Vaya Bus Rapid Transit Sustainable Service Delivery/ Economic Infrastructure
15 000 000 000
Construction of Olifantsvlei Cemetery Service delivery 75 000 000
Coordination of SIPs
Concerning the Strategic Integrated Projects - SIP2 the Durban-Free State – Gauteng Logistics and Industrial Corridor the City has budgeted R90 million for the redevelopment of the City Deep Inland Logistics Port. However if this facility is to fulfil its potential as a key piece of economic infrastructure significantly more investment will be needed, and coordinated interventions from all relevant stakeholders will be required. The champion for SIP2 within the City of Johannesburg is the Transportation Department.
SIP 7 – Integrated urban Space and Public Transport Programme – is the other strategic integrated project that is of concern to the City. The champion for SIP7 in the City is the Development Planning Department. The policy that outlines the City’s approach to this SIP as well as the City’s approach to informal settlements and backyard shacks is outlined firstly in the SHUSUP, the City Integrated Transport Plan (particularly through implementation of the Rea Vaya BRT bus network as well as in the SDF. Presently the list of SIP projects as communicated to PRASA is as follows:
Braamfischerville Ext 12&13 Upgrading of sewer outfall in Braamvisherville
Devland Ext 1,27,30,31&33 The Upgrading of Roads and Related Stormwater System
Flats and Stock Upgrading Upgrading of Flats around Joburg

Built Environment Performance Plan 2014/15
Fleurhof Mixed Development (Bulk and internal infrastructure)
The provision of bulk infrastructure including reticulation for specifically the following: Water, Sewer, Roads and Stormwater Management Systems.
Formalisation of informal settlements across the City.
Formalisation of Informal Settlements within the City of Johannesburg Adminstration Regions A-G
Land Purchases Land purchases for properties in Princess Plots, Lindhaven, Jameson Field and Vlakfontein
Lehae Ext 1 Contruction of Bulk Water Pipeline to cater for the Lehae Development
Lehae Ext 2 Formalisation
LufherengMixed Development The project involves the provision of bulk, link and internal roads, sewer, water & stormwater to the Doornkop Greenfields Project (a mixed housing scheme consisting of 25,000 subsidies) being implemented by the Gauteng Department of Housing under its incremental housing programme.
Matholesville Proper Ext 1&2 Construction of Roads and Stormwater including Water and Sewer.
Sol Plaatjies Construction of Bulk Roads & Stormwater and Internal Roads & Stormwater
Fleurhof rental New Housing Development Development of 600 rental housing units
Nancefield Station Precinct Housing Redevelopment of existing flats and construction of additional flat accomodation and the provision of bulk infrastructure associated with the development
Selkirk Social Housing Development of 300 medium density housing within Randburg CBD which will assist in attracting investors in the area
Rea Vaya New Bus Rapid Transit Bus Rapid Transit (BRT) System: roads and ancillary works, depots, termini, land, Intelligent Transport System (Automatic Public Transport Management System & Automated Fare Collection System)
Nancefield Station Precinct Development Provision of bulk infrastructure to support the development of a mixed land use development supporting a range of housing typologies to benefit from the transit options currently available within the precinct
The above project list is subject to change through discussions with PRASA and other stakeholders.
In relation to the Co-ordination and alignment with informal settlement at the City-wide level this matter has been addressed in Section B.
3. Identification of Urban Network, Integration Zones and Hubs
The Urban Network Model is understood by the City as,
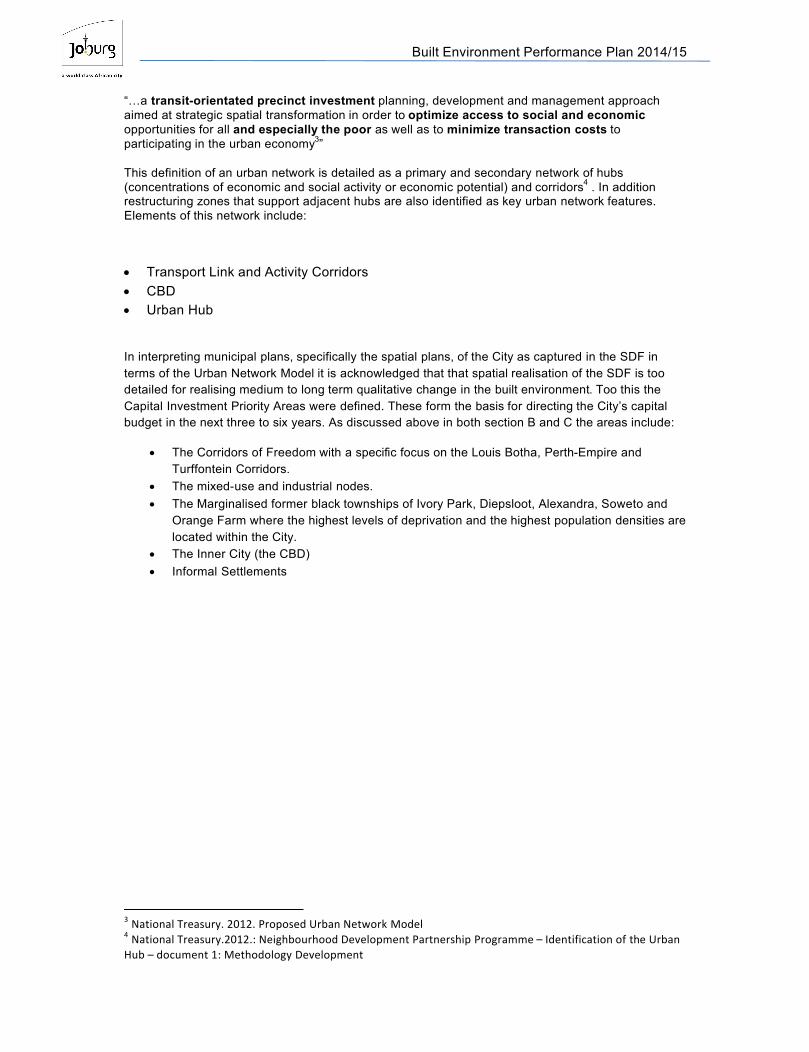
Built Environment Performance Plan 2014/15
“…a transit-orientated precinct investment planning, development and management approach aimed at strategic spatial transformation in order to optimize access to social and economicopportunities for all and especially the poor as well as to minimize transaction costs to participating in the urban economy3”
This definition of an urban network is detailed as a primary and secondary network of hubs (concentrations of economic and social activity or economic potential) and corridors4 . In addition restructuring zones that support adjacent hubs are also identified as key urban network features. Elements of this network include:
Transport Link and Activity Corridors CBD Urban Hub
In interpreting municipal plans, specifically the spatial plans, of the City as captured in the SDF in terms of the Urban Network Model it is acknowledged that that spatial realisation of the SDF is too detailed for realising medium to long term qualitative change in the built environment. Too this the Capital Investment Priority Areas were defined. These form the basis for directing the City’s capital budget in the next three to six years. As discussed above in both section B and C the areas include:
The Corridors of Freedom with a specific focus on the Louis Botha, Perth-Empire and Turffontein Corridors.
The mixed-use and industrial nodes. The Marginalised former black townships of Ivory Park, Diepsloot, Alexandra, Soweto and
Orange Farm where the highest levels of deprivation and the highest population densities are located within the City.
The Inner City (the CBD) Informal Settlements
3 National Treasury. 2012. Proposed Urban Network Model4 National Treasury.2012.: Neighbourhood Development Partnership Programme – Identification of the Urban Hub – document 1: Methodology Development
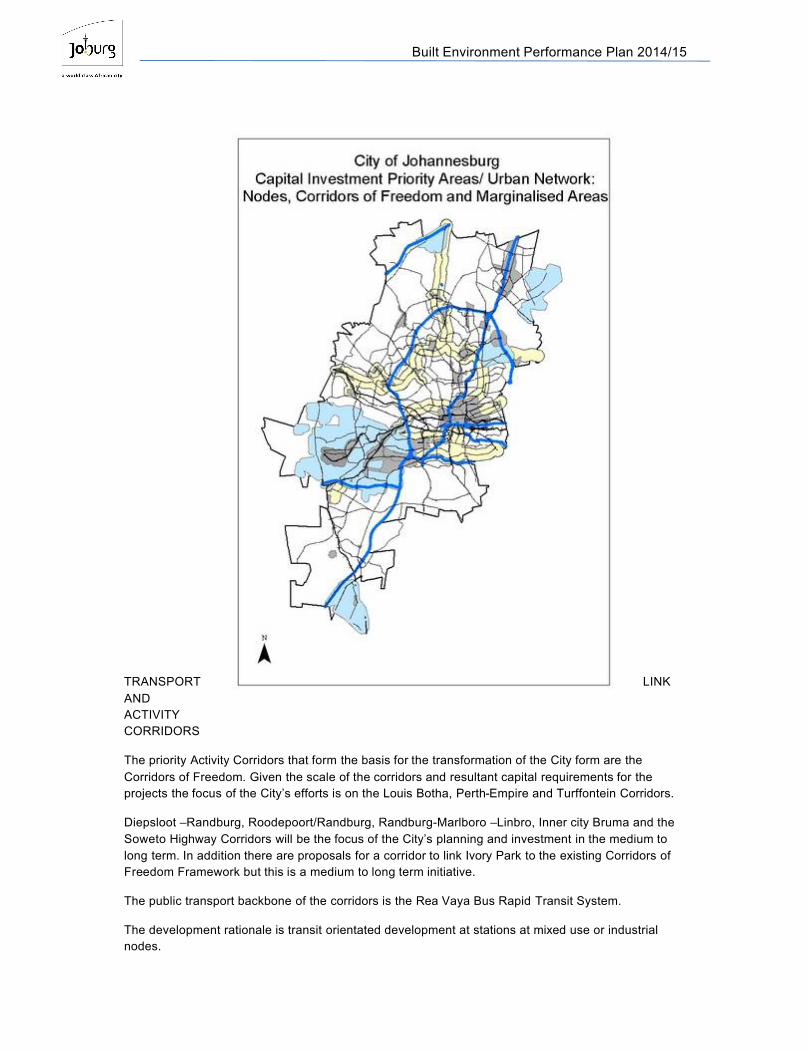
Built Environment Performance Plan 2014/15
TRANSPORT LINK AND ACTIVITY CORRIDORS
The priority Activity Corridors that form the basis for the transformation of the City form are the Corridors of Freedom. Given the scale of the corridors and resultant capital requirements for the projects the focus of the City’s efforts is on the Louis Botha, Perth-Empire and Turffontein Corridors.
Diepsloot –Randburg, Roodepoort/Randburg, Randburg-Marlboro –Linbro, Inner city Bruma and the Soweto Highway Corridors will be the focus of the City’s planning and investment in the medium to long term. In addition there are proposals for a corridor to link Ivory Park to the existing Corridors of Freedom Framework but this is a medium to long term initiative.
The public transport backbone of the corridors is the Rea Vaya Bus Rapid Transit System.
The development rationale is transit orientated development at stations at mixed use or industrial nodes.
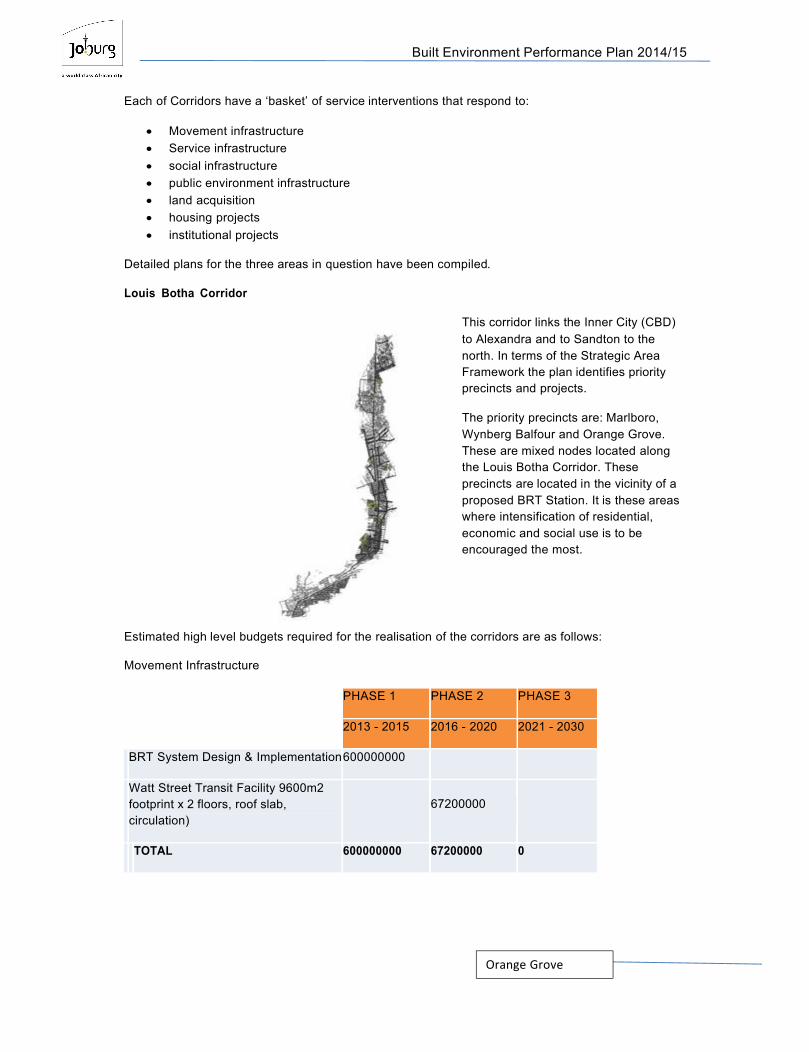
Built Environment Performance Plan 2014/15
Each of Corridors have a ‘basket’ of service interventions that respond to:
Movement infrastructure Service infrastructure social infrastructure public environment infrastructure land acquisition housing projects institutional projects
Detailed plans for the three areas in question have been compiled.
Louis Botha Corridor
This corridor links the Inner City (CBD) to Alexandra and to Sandton to the north. In terms of the Strategic Area Framework the plan identifies priority precincts and projects.
The priority precincts are: Marlboro, Wynberg Balfour and Orange Grove. These are mixed nodes located along the Louis Botha Corridor. These precincts are located in the vicinity of a proposed BRT Station. It is these areas where intensification of residential,economic and social use is to beencouraged the most.
Estimated high level budgets required for the realisation of the corridors are as follows:
Movement Infrastructure
PHASE 1 PHASE 2 PHASE 3
2013 - 2015 2016 - 2020 2021 - 2030
BRT System Design & Implementation600000000
Watt Street Transit Facility 9600m2 footprint x 2 floors, roof slab, circulation)
67200000
TOTAL 600000000 67200000 0
Orange Grove
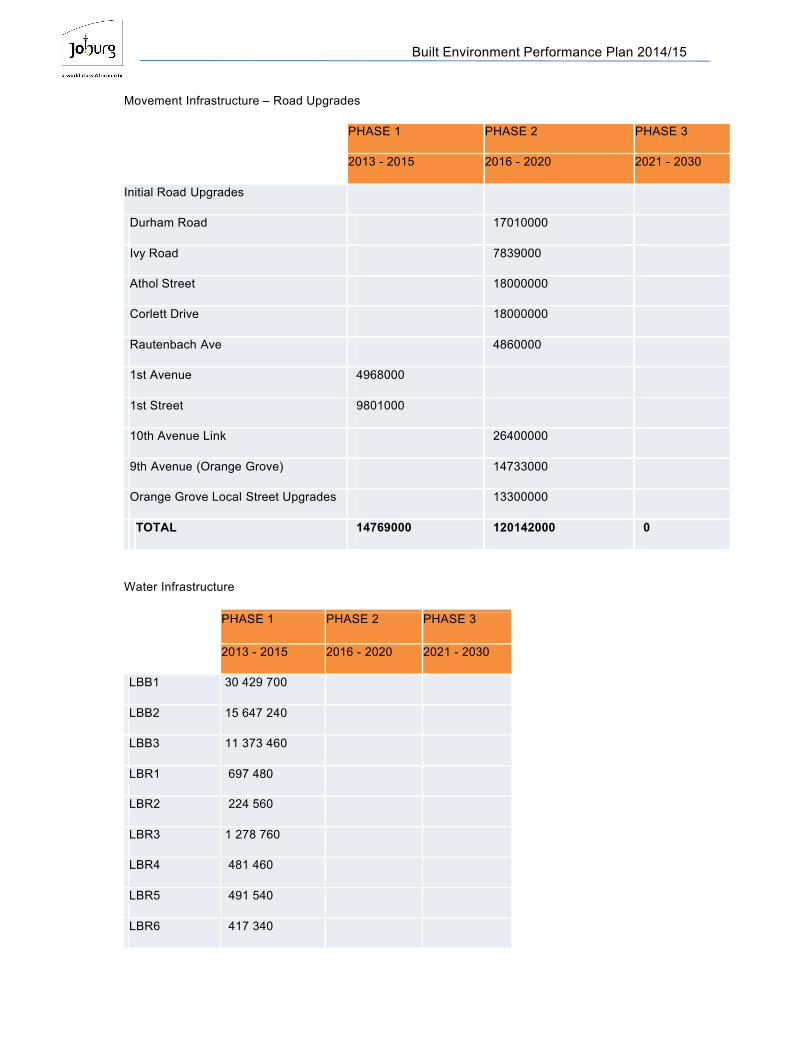
Built Environment Performance Plan 2014/15
Movement Infrastructure – Road Upgrades
PHASE 1 PHASE 2 PHASE 3
2013 - 2015 2016 - 2020 2021 - 2030
Initial Road Upgrades
Durham Road 17010000
Ivy Road 7839000
Athol Street 18000000
Corlett Drive 18000000
Rautenbach Ave 4860000
1st Avenue 4968000
1st Street 9801000
10th Avenue Link 26400000
9th Avenue (Orange Grove) 14733000
Orange Grove Local Street Upgrades 13300000
TOTAL 14769000 120142000 0
Water Infrastructure
PHASE 1 PHASE 2 PHASE 3
2013 - 2015 2016 - 2020 2021 - 2030
LBB1 30 429 700
LBB2 15 647 240
LBB3 11 373 460
LBR1 697 480
LBR2 224 560
LBR3 1 278 760
LBR4 481 460
LBR5 491 540
LBR6 417 340

Built Environment Performance Plan 2014/15
LBR7 7 075 600
LBR8 1 272 320
LBR9 546 280
LBR10 84 700
LBR11 434 420
LBR12 224 840
LBR13 334 040
LBR14 417 340
LBR15 196 000
LBR16 588 420
LBR17 102 620
LBR18 155 400
LBR19 1 281 280
LBR20 150 080
LRR2 12 408 200
PTL1 92 400
PTL2 3 842 160
YYR1 774 480
ZFS27 3 708 320
ZFS28 838 180
MLB9 1 392 160
TOTAL 78 613 920 13800360 4546500
Sewer Infrastructure
PHASE 1 PHASE 2 PHASE 3
2013 - 2015 2016 - 2020 2021 - 2030
BR2 1 132 300

Built Environment Performance Plan 2014/15
BR2 710 000
BR2 147 100
BR2 769 400
BR3 270 000
BR3 264 300
BR3 201 200
BR3 159 000
BRF9 997 400
BR_CIP1 195 600
BR_CIP1 181 400
BR_CIP1 472 900
BR_CIP1 765 200
BR_CIP1 1 055 300
BR_CIP2 478 300
BR_CIP2 564 000
CYD01 350 500
CYD01 304 200
CYD01 894 600
CYD01 1 217 900
CYD02 1 028 600
CYD02 950 900
CYD03 595 400
CYD03 358 500
CYD03 686 800
CYD03 773 200
CYD03 351 300
CYD05 115 300

Built Environment Performance Plan 2014/15
CYD05 883 100
CYD19 2 553 500
CYD23 352 300
CYD23 837 100
CYD23 184 800
CYD24 179 300
CYD25 119 900
CYD26 787 400
CYD27 256 800
CYD27 560 000
CYD_CIP1 221 200
CYD_CIP1 589 200
CYD_CIP2 300 700
CYD_CIP3 243 400
CYD_CIP4 1 125 000
CYD_CIP4 1 161 300
CYD_CIP4 254 400
CYD_CIP4 1 436 200
CYD_CIP5 874 800
CYD_CIP6 948 400
CYD_CIP7 346 500
TOTAL 10 471 600 6137400 13596900
Public Environment Upgrade
PHASE 1 PHASE 2 PHASE 3
2013 - 2015 2016 - 2020 2021 - 2030
Watt Street Interchange
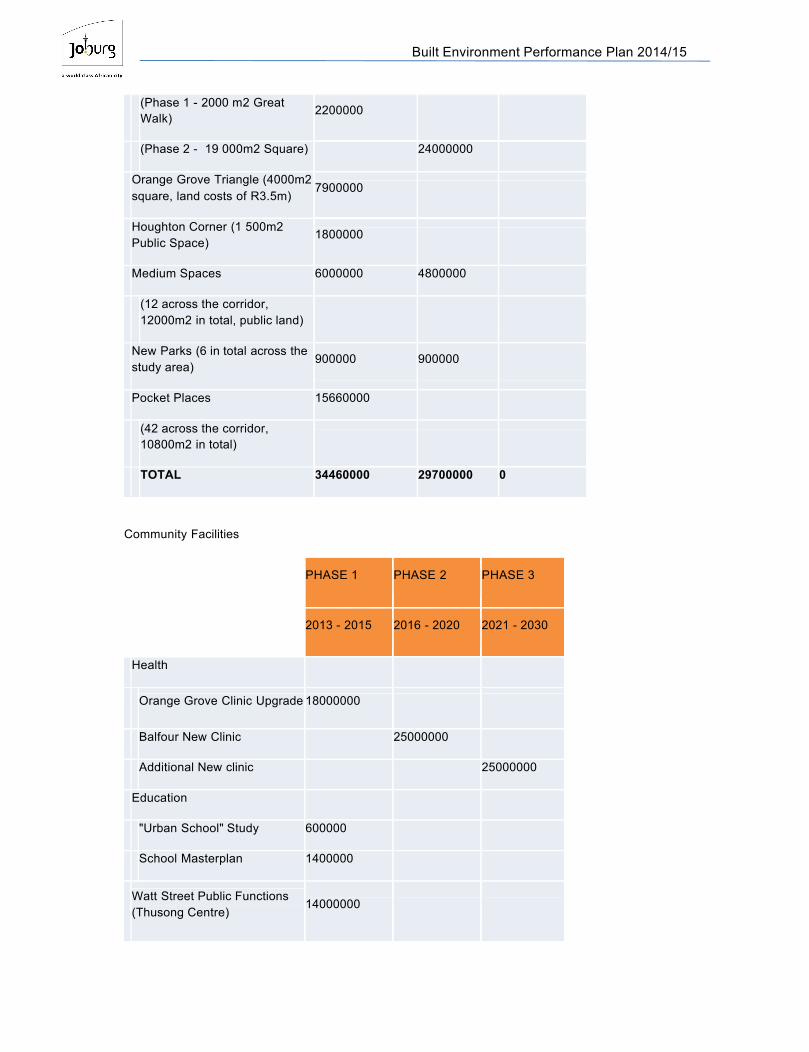
Built Environment Performance Plan 2014/15
(Phase 1 - 2000 m2 Great Walk)
2200000
(Phase 2 - 19 000m2 Square) 24000000
Orange Grove Triangle (4000m2 square, land costs of R3.5m)
7900000
Houghton Corner (1 500m2 Public Space)
1800000
Medium Spaces 6000000 4800000
(12 across the corridor, 12000m2 in total, public land)
New Parks (6 in total across the study area)
900000 900000
Pocket Places 15660000
(42 across the corridor, 10800m2 in total)
TOTAL 34460000 29700000 0
Community Facilities
PHASE 1 PHASE 2 PHASE 3
2013 - 2015 2016 - 2020 2021 - 2030
Health
Orange Grove Clinic Upgrade 18000000
Balfour New Clinic 25000000
Additional New clinic 25000000
Education
"Urban School" Study 600000
School Masterplan 1400000
Watt Street Public Functions (Thusong Centre)
14000000

Built Environment Performance Plan 2014/15
Orange Grove - New Social Facilities Provision
8000000
Balfour - New Social Facilities Provision 12000000 8000000
Marlboro - New Social Facilities Provision
15000000 11000000
TOTAL 69000000 44000000 25000000
Strategic Land Requirements
PHASE 1 PHASE 2 PHASE 3
2013 - 2015 2016 - 2020 2021 - 2030
Upper Houghton 10000000
Orange Grove South 6600000
Orange Grove West - PP 5400000
Orange Grove East 5400000
Orange Grove North 4400000
Highlands North 6400000
Balfour 4800000
Bramley 12000000
Wynberg 6600000
TOTAL 61600000 0 0
Affordable/Rental Housing Requirements
PHASE 1 PHASE 2 PHASE 3

Built Environment Performance Plan 2014/15
2013 - 2015 2016 - 2020 2021 - 2030
Special Development Zone 1450000
Heritage Surveys
Orange Grove/Mountainview 1400000
Highlands 1100000
CID/BID Support 100000 1500000
TOTAL 4050000 1500000 0
Institutional Projects
PHASE 1 PHASE 2 PHASE 3
2013 - 2015 2016 - 2020 2021 - 2030
Special Development Zone 1450000
Heritage Surveys
Orange Grove/Mountainview 1400000
Highlands 1100000
CID/BID Support 100000 1500000
TOTAL 4050000 1500000 0
PERTH / EMPIRE CORRIDOR
The Perth Empire Corridor differs from Louis Botha Corridor as the Rea Vaya BRT Infrastructure has already been implemented. The corridor connects the CBD with Soweto, the largest collective of former black townships in the City, to the south-west.
4. Spatial Targeting Instruments5. Spatial and Land Use Policy Revisions6. Catalytic Projects or programmes by prioritised Integration Zone7. Development Strategy for Integration Zone8. Institutional Arrangements for Integration Zone9. Proposed timeframes for implementation of catalytic projects and programmes

Built Environment Performance Plan 2014/15