copyright 2013, yiqing wei
TRANSCRIPT

DEVELOPMENT OF EQUIVALENT SURCHARGE LOADS FOR THE DESIGN
OF SOIL NAILED SEGMENT OF MSE/SOIL NAIL HYBRID
RETAINING WALLS BASED ON RESULTS FROM
FULL-SCALE WALL INSTRUMENTATION
AND FINITE ELEMENT ANALYSIS
by
Yiqing Wei, BS
A Dissertation
In
Civil Engineering
Submitted to the Graduate Faculty
of Texas Tech University in
Partial Fulfillment of
the Requirements for
the Degree of
DOCTOR OF PHILOSOPHY
Approved
Priyantha W. Jayawickrama
Chair of Committee
William Lawson
Sanjaya Senadheera
Dominick Casadonte
Interim Dean of the Graduate School
May, 2013

Copyright 2013, Yiqing Wei

ii
ACKNOWLEDGMENTS
I wish to acknowledge the financial support to this research by Texas Department
of Transportation
I am deeply grateful to my advisor, Dr. Priyantha Jayawickrama, for giving me
the opportunity to pursue this degree under his guidance and supervision.
My sincere appreciation goes to Dr. William Lawson and Sanjaya Senadheera for
accepting to serve in my committee.
I would like to thank the geotechnical lab team members: Rozbeh, Timothy,
Shannon, Douglas, Roderick, Asitha, Allen, John, for their help and encouragement.
I would also like to thank my wife Liming and my son Ivan for the constant
encouragement and support. You are always my power of study.
Finally, to my parents and sisters who have been the unceasing love and support.
Texas Tech University, Yiqing Wei, May 2013
iii
TABLE OF CONTENTS
ACKNOWLEDGEMENTS............................................................................................ ii
ABSTRACT....................................................................................................................v
LIST OF TABLES............................................................................................................vi
LIST OF FIGURES........................................................................................................ vii
CHAPTER 1 OUTLINE.................................................................................................. 1
1.1 Background............................................................................................................. 1
1.2 Research Problem Statement ................................................................................. 5
1.3 Research Approach................................................................................................. 7
1.4 Organization of the Dissertation........................................................................... 10
CHAPTER 2 REVIEW OF CURRENT DESIGN METHODS FOR REINFORCED SOIL STRUCTURES..................................................................................................... 11
2.1 Mechanism of Reinforced Soil Structure.............................................................. 11
2.2 Design of Soil Nail Walls..................................................................................... 11
2.2.1 Nail Forces in Soil Nail Walls..................................................................... 13
2.2.2 Pullout Behavior of Soil Nail....................................................................... 16
2.3 Global Stability of Soil Nail Wall......................................................................... 22
2.3.1 Davis Design Method.................................................................................. 26
2.3.2 German Design Method............................................................................... 27
2.3.3 Kinematical Limit Analysis..........................................................................29
2.3.4 French Multicriteria Analysis.......................................................................35
2.3.5 FHWA 1996 Design Method........................................................................38
2.3.6 FHWA 2003 Design Method........................................................................40
2.3.6.1 GOLDNAIL...................................................................................... 41
2.3.6.2 SNAIL............................................................................................... 41
2.4 Introduction of MSE wall..................................................................................... 42
CHAPTER 3 INSTRUMENTATION AND MONITORING OF IH 410 MSE/SOIL NAIL HYBRID RETAINING WALL………………………………………………48
Texas Tech University, Yiqing Wei, May 2013
iv
3.1 Project Description................................................................................................ 48
3.2 Construction of the Hybrid Wall........................................................................... 52
3.3 Case Studies.......................................................................................................... 52
3.4 Instrumentation Plan............................................................................................. 54
3.5 Data Interpretation................................................................................................ 57
3.5.1 Inclinometer Data......................................................................................... 57
3.5.2 Grout Strain.................................................................................................. 57
3.5.3 Tensile Forces in Soil Nail............................................................................57
3.6 Discussion of the Results...................................................................................... 64
CHAPTER 4 2D FINITE ELEMENT ANALYSIS OF SOIL NAIL WALL............ 67
4.1 Introduction......................................................................................................... 67
4.2 Cases Study of the Finite Element Modeling for the Soil Nail Walls….............. 69
4.2.1 Polyclinic Wall in Seattle, Washington........................................................69
4.2.2 CLOUTERRE Wall......................................................................................72
4.2.3 Swift-Delta Soil Nail Wall............................................................................74
4.2.4 Simulation of Soil Nail Structures Using PLAXIS 2D.................................77
4.3 Reinforcement Pullout Behavior in Finite Element Program..............................79
4.4 Soil Nail Pullout Simulation by 2D PLAXIS........................................................86
4.5 Simulation of the MSE/Soil Nail Hybrid Retaining Wall.....................................92
CHAPTER 5 PARAMETRIC STUDY AND DEVELOPMENT OF EQUIVALENT SURCHARGE.... ... .. ... ... .. ... .. ... ... .. ... ... ... .. ... . .. .. ... ... . . ... ... .. ... .. ... ... .. ... . . 100
5.1 Parametric Study of MSE/Soil Nail Hybrid Wall............................................... 100
5.2 Equivalent Loads of the MSE Wall Portion…................................................... 101
5.3 Results and Discussion....................................................................................... 106
CHAPTER 6 SUMMARY AND CONCLUSIONS.................................................... 114
REFERENCE…………………………….………………………………………….118
Texas Tech University, Yiqing Wei, May 2013

v
ABSTRACT
MSE/Soil Nail hybrid retaining walls have been used in cut/fill retaining systems
recently. In this type of wall a MSE wall is constructed above an existing soil nail wall.
Therefore, the soil nail wall portion of the hybrid wall system has much heavier
surcharge than the normal one. The dissertation demonstrates the results of
instrumentation and monitoring a MSE/Soil Nail hybrid retaining wall system. The
innovative 2D finite element models were used to simulate the behavior of the hybrid
retaining wall system, considering the soil nail ultimate pullout capacity and the effects of
the construction phase. In order to evaluate the global FOS of the soil nail wall portion,
the equivalent loads considering the vertical loads and horizontal loads of the MSE wall
portion are presented by the results of the finite element analysis. The vertical load factor
is 1.2 times of the self weight of the MSE wall. Meanwhile the horizontal load factors are
in function of the soil nail pullout capacities. The instrumentation data and numerical
analysis results are discussed below.
Texas Tech University, Yiqing Wei, May 2013

vi
LIST OF TABLES
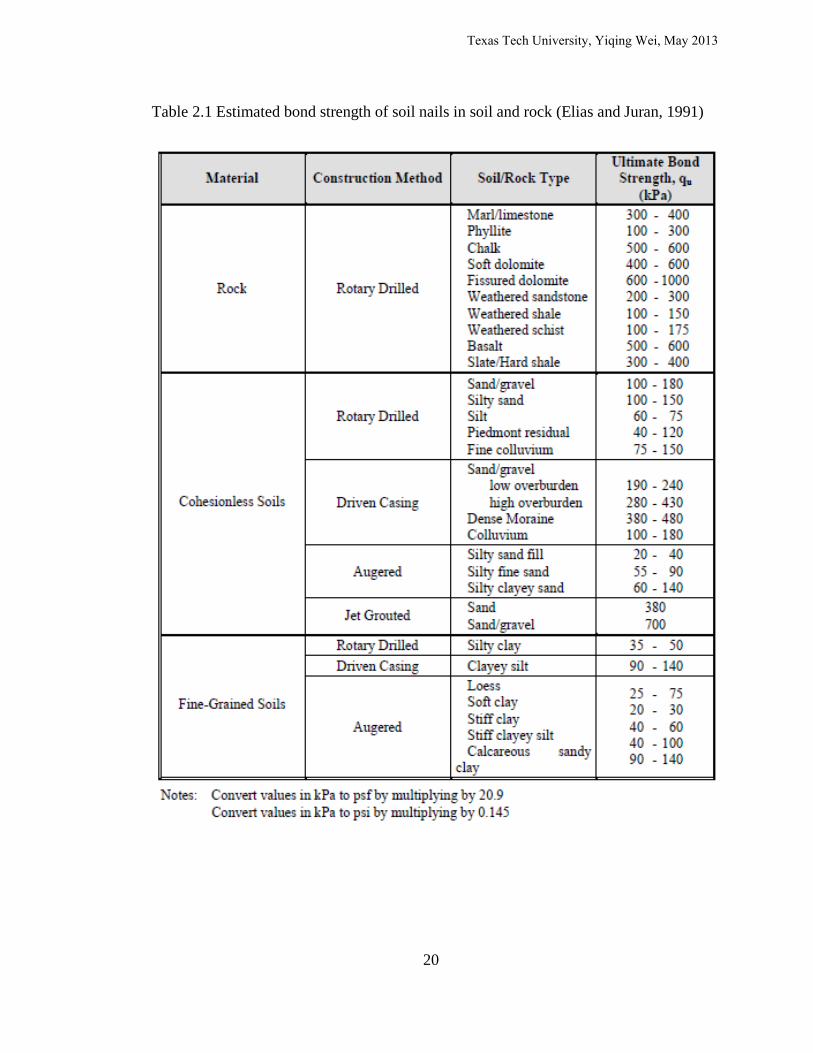
2.1 Estimated bond strength of soil nails in soil and rock ...............................20
2.2 Results of the soil nail pullout displacement at the maximum
pullout forces (PDMPF) for a series of pullout tests in sands ...................21
3.1 The reinforcement of the MSE wall...........................................................50
3.2 Wall No.7 Construction Timeline ............................................................. 55
4.1 Materials properties for the normal numerical pullout test model
(a) Soil’s properties ....................................................................................83
(b) Properties of the facing and reinforcement ..........................................83
4.2 Interlayer’s properties according to different unit pullout capacity
of the nails ................................................................................................. 83
4.3 Material properties for the MSE/Soil Nail hybrid wall models
(a) Soil’s properties ....................................................................................99
(b) Properties of the reinforcements and facing ........................................ 99
5.1 Material properties for the MSE/Soil Nail hybrid wall models
(a) Soil’s properties ..................................................................................105
(b) Properties of the reinforcements and facing .......................................105
5.2 Value of μh
(a) For Soil nail Length=7 m, MSE/SN Height Ratio=1.38 ....................107
(b) For Soil nail Length=7.9 m, MSE/SN Height Ratio=1.38 .................107
(c) For Soil nail Length=8.8 m, MSE/SN Height Ratio=1.38 .................107
(d) For Soil nail Length=7 m, MSE/SN Height Ratio=0.88 ....................108
(e) For Soil nail Length=7.9 m, MSE/SN Height Ratio=0.88 .................108
(f) For Soil nail Length=8.8 m, MSE/SN Height Ratio=0.88. .................108
(g) For Soil nail Length=7 m, MSE/SN Height Ratio=0.55 ................... 109
(h) For Soil nail Length=7.9 m, MSE/SN Height Ratio=0.55 .................109
(i) For Soil nail Length=8.8 m, MSE/SN Height Ratio=0.55 ..................109
6.1 Global FOS of Wall 7 Section A and B analyzed by GOLDNAIL .........117
6.2 Nail forces of Wall 7 Section A and B analyzed by GOLDNAIL...........117
Texas Tech University, Yiqing Wei, May 2013

vii
LIST OF FIGURES
1.1 Use of fill type earth retaining wall in roadway expansion projects ............2
1.2 Use of cut type earth retaining wall in roadway expansion projects ...........3
1.3 Use of Cut/Fill Type Earth Retaining Wall in Side Hill Situations .............4
1.4 Schematic of a MSE/Soil Nail hybrid retaining wall...................................6
1.5 Types of global failure model of MSE/Soil Nail hybrid wall
(a) Type I......................................................................................................8
(b) Type II ....................................................................................................9
(c) Type III ...................................................................................................9
2.1 Typical construction sequences in soil nail walls ......................................12
2.2 Potential failure surfaces and soil nail tensile forces .................................14
2.3 Soil nail stress-transfer mechanism ...........................................................15
2.4 Mechanism of tension mobilization in soil nail wall .................................16
2.5 Typical load-displacement curve of in situ soil nail pullout testing ..........19
2.6 Typical load-displacement curve of laboratory soil nail pullout testing ....19
2.7 Principal modes of failure of soil nail wall systems ..................................24
2.8 Method for analysis global stability of soil nail wall ................................ 25
2.9 (a) Contours of factor of safety derived from finite element analysis .......26
(b) Limit equilibrium method for soil nail wall stability analysis .............26
2.10 German gravity wall method .....................................................................27
2.11 German method: Design chart for stability calculations............................28
2.12 Kinematical limit analysis approach:(a) mechanics of failure and
design assumption; (b) state of stress in inclusion; (c) theoretical
Solution for infinitely long bar Adopted for design purposes ...................32
2.13 Constant modulus of lateral subgrade reaction ..........................................33
2.14 Kinematical limit analysis design chart
(a) Design chart for perfectly flexible nails (N=0) ....................................34
(b) Design chart by kinematical method (N=0.33) ....................................34
2.15 Multicriteria slope stability analysis method
Texas Tech University, Yiqing Wei, May 2013
viii
(a) Schematic distribution of the lateral pressure along the nail ................36
(b) Representation of the various interaction mechanisms within
the normal force (Tn) and shear force (Tc) ..........................................37
2.16 Nail tension distribution diagram...............................................................38
2.17 Construction stability of soil nail wall .......................................................39
2.18 FHWA 1996 preliminary design chart for soil nail walls ..........................39
2.19 FHWA 2003 preliminary design chart for soil nail walls ..........................41
2.20 Stress transfer mechanisms for MSE wall reinforcement ..........................44
2.21 Typical Load-Displacement Curve for the metallic reinforcement
pullout test for the MSE wall .....................................................................45
2.22 Potential external failure mechanisms for a MSE wall ..............................45
2.23 Location of potential failure surface for internal stability design of
MSE walls ..................................................................................................46
2.24 Variation of stress ratio with depth in a MSE wall ....................................47
3.1 Profile view of Wall No.7 in San Antonio and wall panels selected
for instrumentation .....................................................................................49
3.2 Hybrid Wall Sections Selected for Instrumentation and Monitoring:
(a) Wall Section A; (b) Wall Section B .....................................................51
3.3 Cross section of nail tendon with strain gauge location at U.S.
Highway 26-89...........................................................................................53
3.4 Cross section of instrument section for Swift-Delta wall ..........................53
3.5 Spot Welded VWGs: (a) Schematic, (b) VWG covered with tape
for protection. .............................................................................................56
3.6 Model 4210 VWG: (a) Schematic, (b) VWG mounted on
centralizer ...................................................................................................56
3.7 Layout of Spot Welded and Embedment Type VWGs on a 7.9 m
long Soil Nail Tendon ................................................................................56
3.8 Horizontal displacement of Wall 7 Section A ...........................................59
3.9 Final strain of the grout of the soil nails ....................................................60
3.10 Distribution of nail forces during the construction of the hybrid walls
(a) Tensile forces measured in the top row nail of Wall 7 Section A ........60
(b) Tensile forces measured in the second row wail of Wall 7
Texas Tech University, Yiqing Wei, May 2013

ix
Section A ..............................................................................................61
(c) Tensile forces measured in the top row nail of Wall 7 Section B ........61
(d) Tensile forces measured in the second row nail of Wall 7
Section B ..............................................................................................62
(e) Tensile forces measured in the third row nail of Wall 7 Section B ......62
(f) Tensile forces measured in the fourth row nail in Wall 7 Section B ....63
(g) Tensile forces measured in the bottom row nail in Wall 7 Section B ..63
3.11 MSE/Soil Nail hybrid wall at U.S. Highway 26-89, Wyoming
(a) Typical cross section of MSE/Soil Nail hybrid wall Station
20+350 .................................................................................................. 65
(b) Slope inclinometer reading of the MSE/Soil Nail hybrid wall ............65
3.12 Loose fill soil nail slope under high surcharge in Hong Kong
(a) Soil nail slope with surcharge...............................................................66
(b) Soil nail slope horizontal displacement under high surcharge .............66
4.1 Comparison of Mohr-Coulomb model and typical triaxial test
results of soil ....................................................................................……..68
4.2 Mohr-Coulomb yield surface in principal stress when c=0………………68
4.3 Cross section and soil’s properties of Polyclinic wall in Seattle ...............71
4.4 Comparison between the results of the finite element analysis and
the measured data: (a) wall facing displacement; (b) maximum nail
forces ..........................................................................................................71
4.5 Schematic of CLOUTERRE Wall .............................................................72
4.6 Section view of the grout bars of CLOUTERRE wall ...............................73
4.7 Comparison between the results of the finite element analysis and the
measured data: (a) maximum nail forces; (b) wall facing displacement ...73
4.8 Cross section and construction sequence of Swift- Delta wall ..................74
4.9 Finite element model of Swift-Delta wall ..................................................75
4.10 Nail forces of Swift-Delta wall: (a) measured nail forces; (b) finite
element analysis results..............................................................................75
4.11 Horizontal displacement of Swift-Delta wall ............................................76
4.12 Soil nail wall models ..................................................................................77
4.13 Maximum nail forces with different cohesion ...........................................78
Texas Tech University, Yiqing Wei, May 2013

x
4.14 Horizontal displacements with different cohesion .....................................78
4.15 Representation of 3D and 2D models. .......................................................79
4.16 (a) Normal Numerical Pullout test model, (b) Facing opening,
reinforcement and force of the model ........................................................82
4.17 Pullout forces versus pullout displacement for the normal
numerical Pullout test model with varied depth
(a) Unit pullout resistance versus pullout displacement for Rinter=0. .........84
(b) Unit pullout resistance versus pullout displacement for Rinter=1. ........84
4.18 Comparison of the unit pullout capacity of the normal numerical
pullout test model with different Rinter and the MSE wall design
value of highway IH410 located at San Antonio .......................................85
4.19 (a) Soil nail pullout test model ...................................................................88
(b) Interlayer and facing opening of the soil nail .......................................88
4.20 Pullout test results of the innovative soil nail pullout test model
with different unit pullout capacity, Quu
(a) Unit pullout force versus displacement for the interlayer of
Quu=24.5 kN/m/m ................................................................................89
(b) Unit pullout force versus displacement for the interlayer of
Quu=49 kN/m/m ...................................................................................89
(c) Unit pullout force versus displacement for the interlayer of
Quu=73.5 kN/m/m ................................................................................90
(d) Unit pullout force versus displacement for the interlayer of
Quu=98 kN/m/m ...................................................................................90
(e) Unit pullout force versus displacement for the interlayer of
Quu=122.5 kN/m/m ..............................................................................91
4.21 Finite element mesh: PLAXIS V8 finite element models for
MSE/Soil Nail hybrid retaining walls:
(a) Wall 7 Section A ..................................................................................93
(b) Wall 7 Section B……………………………………………………....94
4.22 Comparison between measured nail forces and finite element analysis
results
(a) Wall 7 Section A: Nail Forces on First Row Nail ................................94
(b) Wall 7 Section A: Nail Forces on Second Row Nail ...........................95
Texas Tech University, Yiqing Wei, May 2013
xi
(c) Wall 7 Section B: Nail Forces on First Row Nail ................................95
(d) Wall 7 Section B: Nail Forces on Second Row Nail............................96
(e) Wall 7 Section B: Nail Forces on Third Row Nail ...............................96
(f) Wall 7 Section B: Nail Forces on Fourth Row Nail .............................97
(g) Wall 7 Section B: Nail Forces on Bottom Row Nail ...........................97
4.23 Wall facing displacements of measured data and finite element analysis
results with varied Young’s modulus ........................................................98
5.1 Expected forces imposed by MSE wall on soil nail wall.........................102
5.2 PLAXIS finite element models for calibrating the equilibrium loads
(a) Total stresses of the hybrid wall .........................................................103
(b) Total stresses of the soil nail wall corresponding to the hybrid
wall under the equivalent loads..........................................................104
5.3 Comparison of the results between the hybrid wall model and soil
nail wall model under equivalent loads
(a) Comparison of the facing displacement .............................................110
(b) Comparison of the maximum nail forces ...........................................110
5.4 Relationship between the factor of the equivalent horizontal
distributed loads μh and MSE/SN Height Ratio .......................................111
5.5 Contour lines and potential failure surface of the finite element
models for the MSE/ Soil Nail hybrid walls
(a) MSE/SN Height Ratio equal to 1.35 ..................................................112
(b) MSE/SN Height Ratio equal to 0.88 ..................................................112
(c) MSE/SN Height Ratio equal to 0.55 ..................................................113
6.1 Soil nail walls’ models for the design by GOLDNAIL program
(a) Case 1 and case 2 ................................................................................116
(b) Case 3 .................................................................................................116
Texas Tech University, Yiqing Wei, May 2013

1
CHAPTER 1
OUTLINE
1.1 Background
Highway traffic congestion is a major source of frustration for many roadway
users especially those who commute in and around major metropolitan areas.
Customarily, this problem is addressed by widening the existing roadways and adding
extra travel lanes. However, in many metropolitan areas, it is becoming increasingly
difficult to undertake such roadway expansions due to the high cost of new right-of-way
acquisition and opposition from local groups. Therefore, it is important that
transportation agencies use innovative designs that allow improvement in highway
capacity by maximizing the use of available right-of-way. Such designs often involve the
use of multi-level structures that minimize the footprint of the improvement on the
surrounding landscape. Earth retaining structures allow grade separation to be achieved
within the existing right-of-way and therefore play an important role in the construction
of such multi-level structures.
A variety of earth retaining walls are used in modern transportation systems, with
different types optimally suited for given field situations. Some retaining wall types are
better suited for fill situations while other types are better used for supporting cuts.
Figure 1.1 illustrates two roadways that run parallel to each other. It represents a
situation where inadequate right-of-way requires the use of a retaining wall along the
embankment side slope to maintain grade separation. In this case, the wall is placed at
the bottom of the embankment along the edge of the lower roadway allowing widening of
the upper roadway. Clearly, the construction of the retaining wall is done in conjunction
with placement of a fill. Among the types walls used in fill situations such as this, MSE
walls with pre-cast concrete panels are, by far, the most widely used. They offer the
advantages of ease and speed of construction, cost efficiency, reliability in design and
Texas Tech University, Yiqing Wei, May 2013

2
aesthetic appeal. Modular block walls represent another type of fill wall that is
commonly used in applications where significant curvature in wall alignment exists and
when achieving exact line and grade is not very critical. CIP cantilever walls represent a
third type of fill walls. These walls are found to be cost effective only for small retaining
walls with wall areas less than about 1,000-sq.ft.
Figure 1.1 Use of fill type earth retaining wall in roadway expansion projects
(Jayawickrama, 2009)
A situation that is different the one described above arises if widening of the
lower roadway became necessary. In this case, the retaining wall would be placed along
the edge of the upper roadway as illustrated in Figure 1.2. This represents a cut situation
in which the embankment material must be removed to create additional space needed for
widening of the lower roadway. This type of wall is typically constructed from top down.
Soil nail walls, tied back walls and drilled shafts walls are the most commonly used cut
type walls. The wall height, soil and groundwater conditions usually govern the choice
of the optimum cut type wall. Often, other projects constraints such as the presence of
underground utility lines and/or other buried structures or lack of permanent easement
may also impact the wall selection. In these instances, a retaining wall system with small
Texas Tech University, Yiqing Wei, May 2013
3
footprint, such as the cantilevered drilled shaft retaining wall, may prove to be the
optimum design solution.
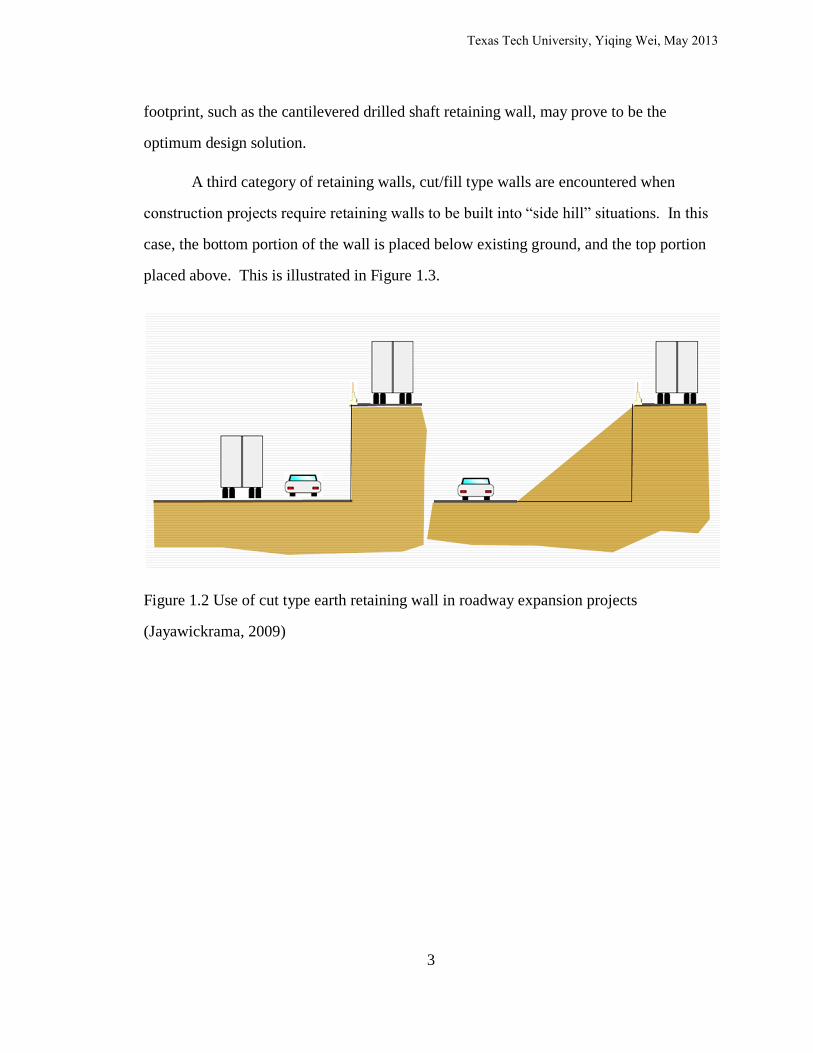
A third category of retaining walls, cut/fill type walls are encountered when
construction projects require retaining walls to be built into “side hill” situations. In this
case, the bottom portion of the wall is placed below existing ground, and the top portion
placed above. This is illustrated in Figure 1.3.
Figure 1.2 Use of cut type earth retaining wall in roadway expansion projects
(Jayawickrama, 2009)
Texas Tech University, Yiqing Wei, May 2013
4
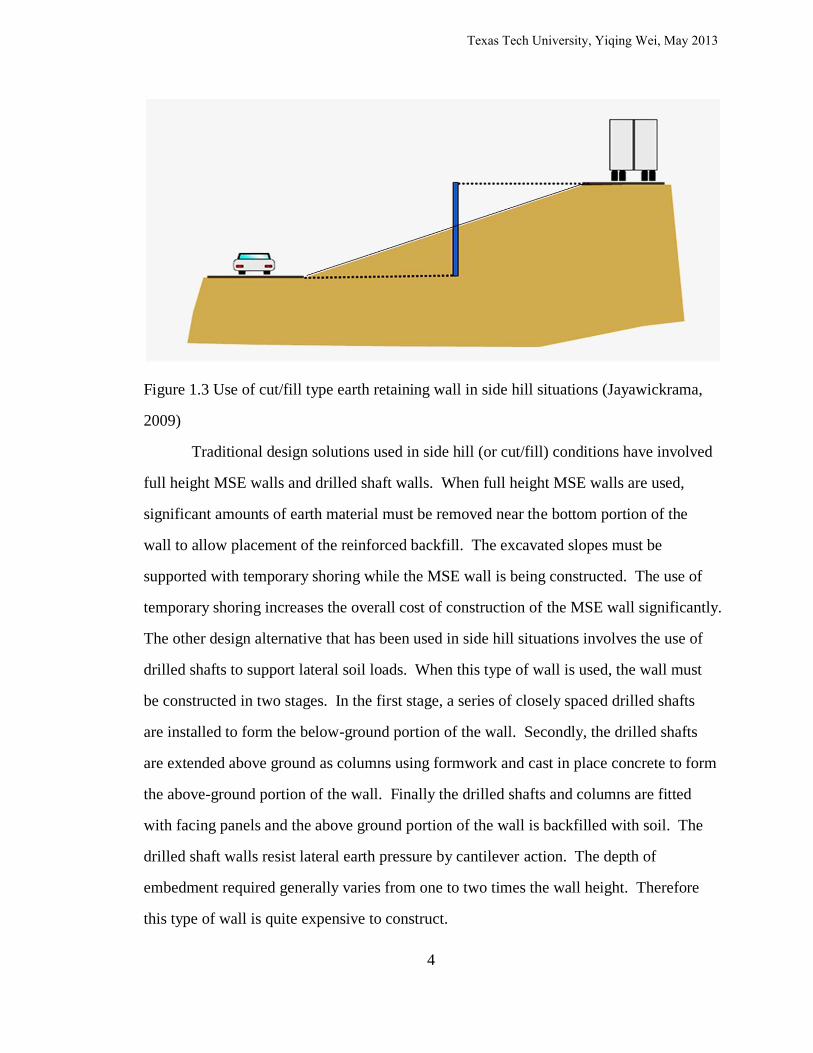
Figure 1.3 Use of cut/fill type earth retaining wall in side hill situations (Jayawickrama,
2009)
Traditional design solutions used in side hill (or cut/fill) conditions have involved
full height MSE walls and drilled shaft walls. When full height MSE walls are used,
significant amounts of earth material must be removed near the bottom portion of the
wall to allow placement of the reinforced backfill. The excavated slopes must be
supported with temporary shoring while the MSE wall is being constructed. The use of
temporary shoring increases the overall cost of construction of the MSE wall significantly.
The other design alternative that has been used in side hill situations involves the use of
drilled shafts to support lateral soil loads. When this type of wall is used, the wall must
be constructed in two stages. In the first stage, a series of closely spaced drilled shafts
are installed to form the below-ground portion of the wall. Secondly, the drilled shafts
are extended above ground as columns using formwork and cast in place concrete to form
the above-ground portion of the wall. Finally the drilled shafts and columns are fitted
with facing panels and the above ground portion of the wall is backfilled with soil. The
drilled shaft walls resist lateral earth pressure by cantilever action. The depth of
embedment required generally varies from one to two times the wall height. Therefore
this type of wall is quite expensive to construct.
Texas Tech University, Yiqing Wei, May 2013

5
An innovative and more economical design alternative that has been used recently
in Texas for side hill walls involves the use of a soil nailed wall in the cut section, and an
MSE wall for the fill section (See Figure 1.4). Although such MSE/Soil Nail hybrid wall
systems have been found to be very cost effective, only a handful of walls of this type
have been built within the state until now.
1.2 Research Problem Statement
The limited use of MSE/Soil Nail hybrid walls in transportation projects is largely
due to lack of an established design procedure for these structures. In other words,
MSE/Soil Nail hybrid walls are still considered “experimental” and many questions
regarding their design and performance remain unanswered. Most importantly, the
FHWA Publication that outlines the design procedure for soil nail walls provides
minimum guidance regarding the design of soil nail walls that support MSE (or other
types of wall) constructed on top. However, it does state that the upper wall system may
be considered as an equivalent surcharge load with vertical, horizontal and moment
components when designing the soil nail wall (FHWA, 1996). This design manual does
not specify reasonable magnitudes of the surcharge loads to be used in the design.
Texas Tech University, Yiqing Wei, May 2013
6
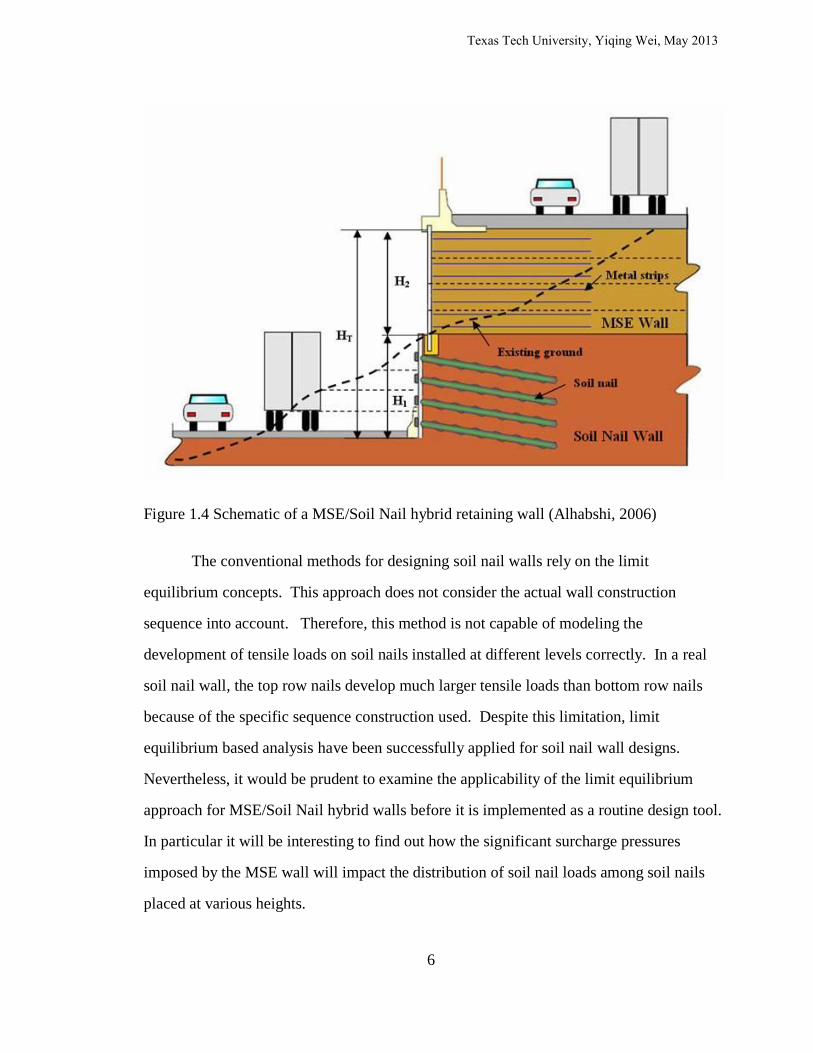
Figure 1.4 Schematic of a MSE/Soil Nail hybrid retaining wall (Alhabshi, 2006)
The conventional methods for designing soil nail walls rely on the limit
equilibrium concepts. This approach does not consider the actual wall construction
sequence into account. Therefore, this method is not capable of modeling the
development of tensile loads on soil nails installed at different levels correctly. In a real
soil nail wall, the top row nails develop much larger tensile loads than bottom row nails
because of the specific sequence construction used. Despite this limitation, limit
equilibrium based analysis have been successfully applied for soil nail wall designs.
Nevertheless, it would be prudent to examine the applicability of the limit equilibrium
approach for MSE/Soil Nail hybrid walls before it is implemented as a routine design tool.
In particular it will be interesting to find out how the significant surcharge pressures
imposed by the MSE wall will impact the distribution of soil nail loads among soil nails
placed at various heights.
Texas Tech University, Yiqing Wei, May 2013

7
Another limitation in the limit equilibrium based design approach is that it does
not address wall deformation in an explicit manner. However, measured maximum wall
deformations of soil nail walls that have been designed using the limit equilibrium
approach have shown that the wall deformations are within acceptable limits. For
vertical soil nail walls of height, H and with typical nail length-to-wall height ratios and
negligible surcharge loadings, the peak wall deformations at the top of the wall tend to
vary from 0.1%H or less for weathered rocks and very competent and dense soils (such as
glacial tills), to 0.2%H for granular soils, and up to 0.4% for fine-grained clay type soils
(Recommendations Clouterre 1991-English Translation, 1993). Deformation of the
nailed soil mass in a hybrid wall is of special interest as it serves as the foundation for the
MSE wall. Excessive deformations of the soil nailed portion of the wall can have adverse
impact on the integrity of the MSE wall system. Therefore, it is important to ascertain
that any design procedure used for hybrid walls will result in nail lengths that are capable
of controlling wall deformations within acceptable limits.
The design of the MSE portion of the hybrid wall is not impacted to the same
extent as the soil nail portion of the hybrid wall because of the unusual wall configuration.
However, one wall failure mode that will be impacted is the global shear failure.
Therefore, it is important to gain insight into how the new wall configuration may
influence the location of the actual failure surface.
1.3 Research Approach
The general objective of this research study is to examine the widely used limit
equilibrium based soil nail wall design procedure with respect to its applicability to
MSE/Soil Nail hybrid walls. The research plan to accomplish this research objective
included several tasks. The first task involved instrumentation and monitoring of two
separate sections of a hybrid wall to observe its behaviors. The data collected from this
wall monitoring project included tensile loads on soils nails and wall deformations. The
Texas Tech University, Yiqing Wei, May 2013

8
research plan also included an independent effort to develop a series of numerical models
to simulate the MSE/Soil Nail hybrid walls by finite element method (FEM). FEM was
selected primarily because of its ability to provide valuable insight into the behaviors of
soil reinforced structures accommodating the actual construction sequence. Data from
the pullout tests of soil nails conducted at the wall construction site and laboratory were
used to develop an appropriate model for load transfer occurring at the soil-nail interface.
The FEM hybrid wall models are then validated with data collected from the
instrumented walls. A series of MSE/Soil Nail hybrid wall models with different MSE
wall to soil nail wall height ratio (MSE/SN Height Ratio) are built and use to come up
equivalent surcharge loading to represent the MSE walls. The failure model for the
hybrid walls will be tested in this dissertation. These walls are shown in Figure 1.5, and
are described as follows:
(a) Type I: The portion of the MSE wall is about 2 times height of the soil nail wall.
(b) Type II: the portions of the MSE and the soil nail wall are relatively even.
(c) Type III: The portion of the MSE is about 1/2 time height of the soil nail wall.
(a) Type I
Texas Tech University, Yiqing Wei, May 2013

9
(b) Type II
(c) Type III
Figure 1.5 Types of global failure model of MSE/Soil Nail hybrid Wall
Texas Tech University, Yiqing Wei, May 2013

10
1.4 Organization of the Dissertation
This dissertation describes the development of a LEM based design method for
MSE/Soil Nail hybrid earth retaining walls. The proposed design method relies on data
collected from instrumentation of a full-scale hybrid wall as well as results from finite
element analysis. Chapter 2 of the dissertation presents a comprehensive review of
existing methods for design of soil nail walls. This chapter also discusses the soil
reinforcement pullout behaviors and MSE walls design methods. Case studies involving
previous soil wall monitoring projects as well as instrumentation of the full-scale
MSE/Soil Nail hybrid retaining wall in this research project are described in Chapter 3.
The measured nail forces, and grout strains and the horizontal displacements of the wall
are also presented in this chapter. Chapter 4 presents the development of a finite element
model to simulate soil reinforcement pullout behavior. An innovative model to
accommodate the laboratory and in situ pullout behavior of soil nails is proposed. This
model is then incorporated in a more comprehensive finite element model that simulates
the entire MSE/Soil Nail hybrid wall system using finite element program PLAXIS V8.2.
The results from the finite element analyses and the instrumentation are compared and
discussed. Subsequently, Chapter 5 includes findings from a parametric study that was
performed using a series of MSE/Soil Nail hybrid wall models to identify the parameters
that have the most dominant influence on hybrid wall design. According to the
recommendation found in FHAW Design Manual (1996), factored horizontal and vertical
distributed surcharge loads are developed based on results from the finite element
analysis for use in limit equilibrium based design of MSE/Soil Nail hybrid earth retaining
walls. Chapter 6 presents the conclusions and recommendations from the research.
Texas Tech University, Yiqing Wei, May 2013

11
CHAPTER 2
REVIEW OF CURRENT DESIGN METHODS FOR REINFORCED
SOIL STRUCTURES
2.1 Mechanism of Reinforced Soil Structure
Soil nail wall and MSE wall are the typical reinforced soil structures which are
widely used in civil engineering area recently. The soil reinforcements are the passive
inclusions in the soil mass and then create a gravity structure which is similar with the
conventional gravity earth retaining wall. The basic design concept consists of
transferring the tensile forces in the reinforcements into the soil through the mobilized
friction at the interfaces. The factor of safety (FOS) of the global stability for the
reinforced soil structure highly depends on the pullout resistance or tensile strength of the
reinforcements. On the other hand, the tensile strength is usually higher than the pullout
resistance. Therefore, the reinforcement pullout resistances are the most important
parameters for the reinforced soil structure design. The reinforcement pullout resistances
mainly depend on the type of the structure, type of the reinforcements, type of the soils,
and construction methods.
2.2 Design of Soil Nail Walls
As a cut-type earth retaining wall, a soil nail wall is constructed top-to-bottom.
Soils in soil nail walls must possess enough true or apparent cohesion to stand long
enough by itself without any reinforcing system at the cut slope, to permit the increment
of excavation and the reinforcements to be installed. Soil nail is basically a rebar
encapsulated in a cement grout. The interaction between soil and soil nail in the walls is
mostly presented by the bond stress between the grout and soil. The bond stress
introduces tensile force in the soil nails. The mobilized nail forces are caused by: (1) the
Texas Tech University, Yiqing Wei, May 2013

12
stressed relief during the excavation; (2) the on-going ground movements of the
marginally stabilized ground; (3) the surcharge on the soil nail wall.
Construction sequences and procedures for a soil nail wall are shown in Figure
2.1.
Figure 2.1 Typical construction sequences in soil nail walls (Byrne et al., 1996)
Texas Tech University, Yiqing Wei, May 2013
13
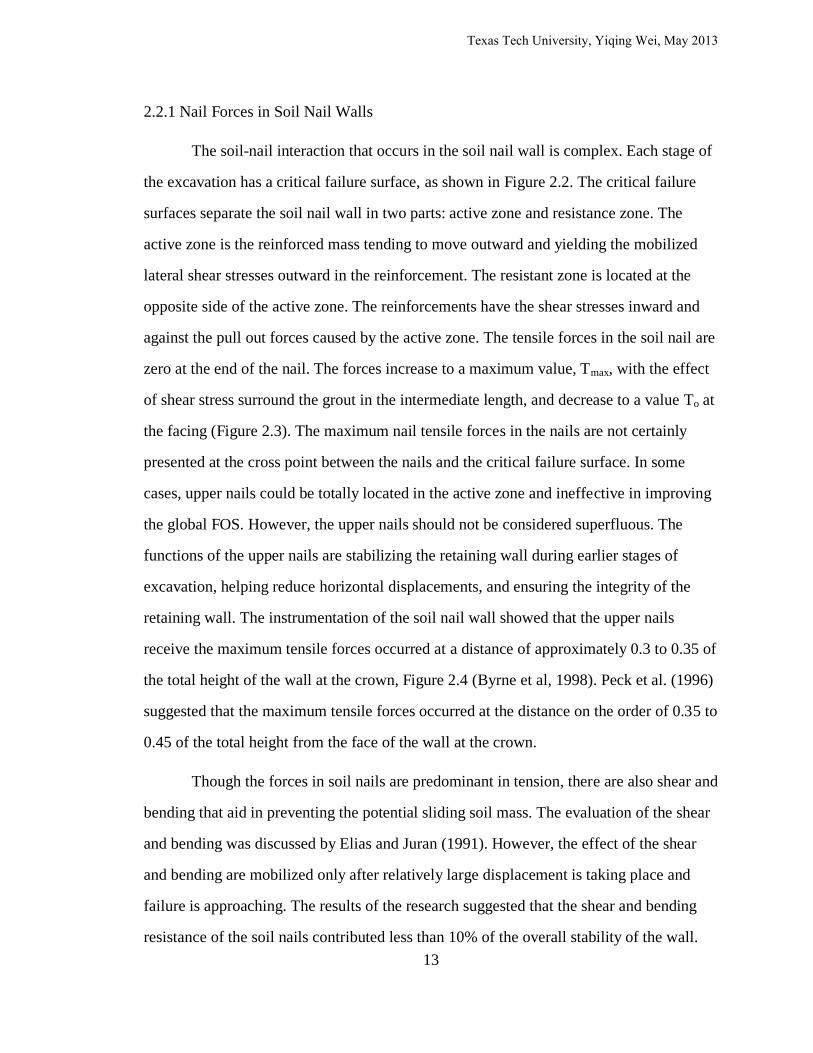
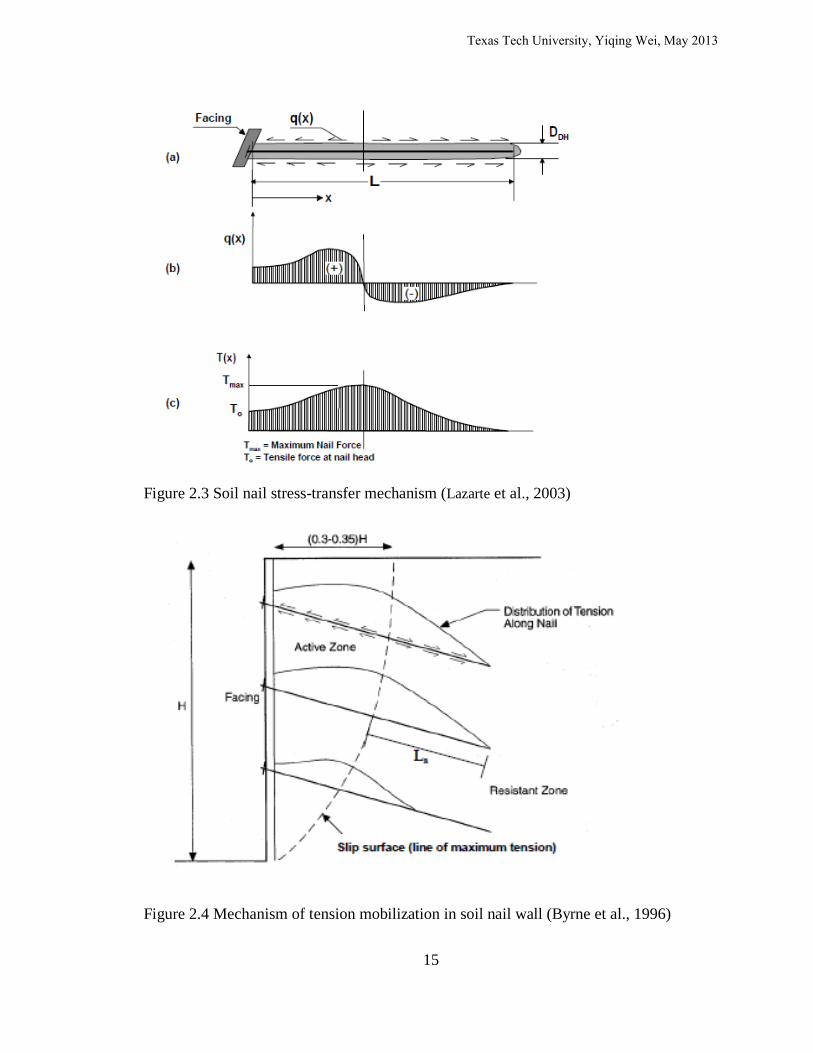
2.2.1 Nail Forces in Soil Nail Walls
The soil-nail interaction that occurs in the soil nail wall is complex. Each stage of
the excavation has a critical failure surface, as shown in Figure 2.2. The critical failure
surfaces separate the soil nail wall in two parts: active zone and resistance zone. The
active zone is the reinforced mass tending to move outward and yielding the mobilized
lateral shear stresses outward in the reinforcement. The resistant zone is located at the
opposite side of the active zone. The reinforcements have the shear stresses inward and
against the pull out forces caused by the active zone. The tensile forces in the soil nail are
zero at the end of the nail. The forces increase to a maximum value, Tmax, with the effect
of shear stress surround the grout in the intermediate length, and decrease to a value To at
the facing (Figure 2.3). The maximum nail tensile forces in the nails are not certainly
presented at the cross point between the nails and the critical failure surface. In some
cases, upper nails could be totally located in the active zone and ineffective in improving
the global FOS. However, the upper nails should not be considered superfluous. The
functions of the upper nails are stabilizing the retaining wall during earlier stages of
excavation, helping reduce horizontal displacements, and ensuring the integrity of the
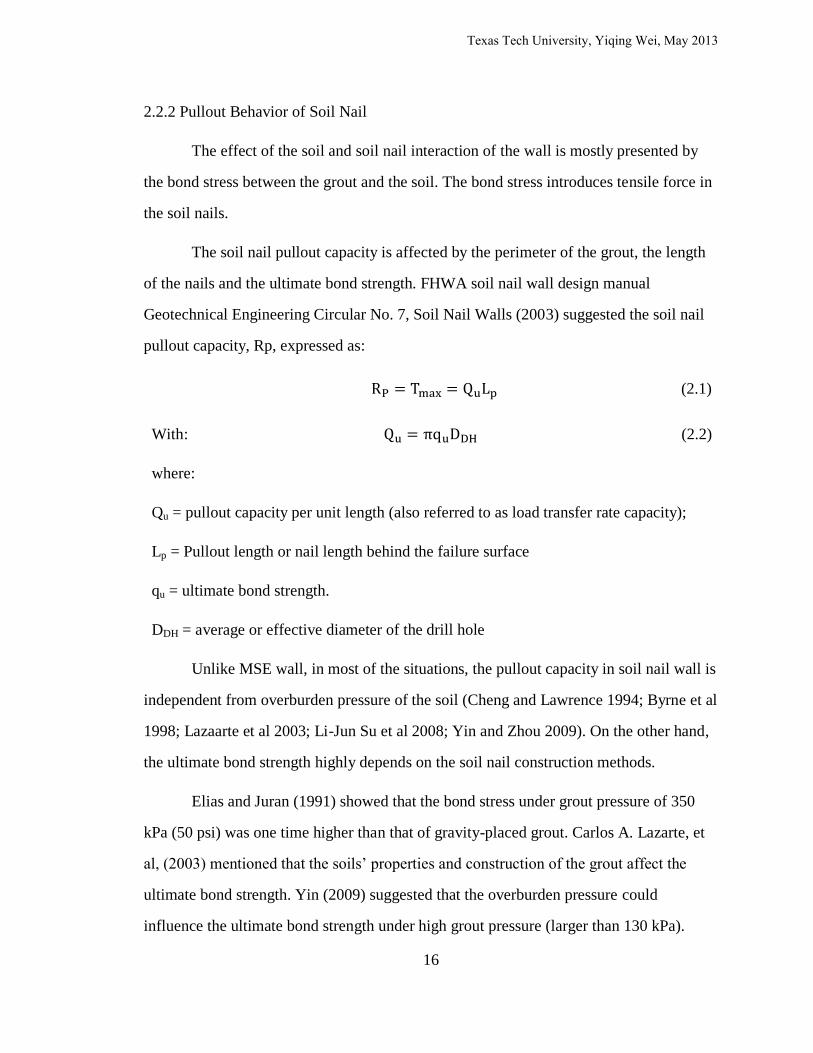
retaining wall. The instrumentation of the soil nail wall showed that the upper nails
receive the maximum tensile forces occurred at a distance of approximately 0.3 to 0.35 of
the total height of the wall at the crown, Figure 2.4 (Byrne et al, 1998). Peck et al. (1996)
suggested that the maximum tensile forces occurred at the distance on the order of 0.35 to
0.45 of the total height from the face of the wall at the crown.
Though the forces in soil nails are predominant in tension, there are also shear and
bending that aid in preventing the potential sliding soil mass. The evaluation of the shear
and bending was discussed by Elias and Juran (1991). However, the effect of the shear
and bending are mobilized only after relatively large displacement is taking place and
failure is approaching. The results of the research suggested that the shear and bending
resistance of the soil nails contributed less than 10% of the overall stability of the wall.
Texas Tech University, Yiqing Wei, May 2013

14
The recent design methods conservatively ignore the effects of the shear and bending
strength of soil nails.
Figure 2.2 Potential failure surfaces and soil nail tensile forces (Lazarte et al., 2003)
Texas Tech University, Yiqing Wei, May 2013
15
Figure 2.3 Soil nail stress-transfer mechanism (Lazarte et al., 2003)
Figure 2.4 Mechanism of tension mobilization in soil nail wall (Byrne et al., 1996)
Texas Tech University, Yiqing Wei, May 2013
16
2.2.2 Pullout Behavior of Soil Nail
The effect of the soil and soil nail interaction of the wall is mostly presented by
the bond stress between the grout and the soil. The bond stress introduces tensile force in
the soil nails.
The soil nail pullout capacity is affected by the perimeter of the grout, the length
of the nails and the ultimate bond strength. FHWA soil nail wall design manual
Geotechnical Engineering Circular No. 7, Soil Nail Walls (2003) suggested the soil nail
pullout capacity, Rp, expressed as:
(2.1)
With: (2.2)
where:
Qu = pullout capacity per unit length (also referred to as load transfer rate capacity);
Lp = Pullout length or nail length behind the failure surface
qu = ultimate bond strength.
DDH = average or effective diameter of the drill hole
Unlike MSE wall, in most of the situations, the pullout capacity in soil nail wall is
independent from overburden pressure of the soil (Cheng and Lawrence 1994; Byrne et al
1998; Lazaarte et al 2003; Li-Jun Su et al 2008; Yin and Zhou 2009). On the other hand,
the ultimate bond strength highly depends on the soil nail construction methods.
Elias and Juran (1991) showed that the bond stress under grout pressure of 350
kPa (50 psi) was one time higher than that of gravity-placed grout. Carlos A. Lazarte, et
al, (2003) mentioned that the soils’ properties and construction of the grout affect the
ultimate bond strength. Yin (2009) suggested that the overburden pressure could
influence the ultimate bond strength under high grout pressure (larger than 130 kPa).
Texas Tech University, Yiqing Wei, May 2013
17
FHWA manual (Byrne et al., 1998) provides the ultimate bond strength value for primary
design (Table 2.1). The values in this table correspond to gravity grouting method only.
Because of the difficulty in estimating bond strength, the field pullout tests are required
to verify the value considering the factor of safety. The Geotechnical manual (Texas
department of transportation, 2006) provides the design charts to estimate the bond
strength (allowable skin friction) based on Texas cone penetration test.
Recently, some researches concentrated on the behavior of soil nail pullout test.
The results of the pullout displacements at the maximum pullout forces (PDMPF) for a
series of soil nail pullout tests in sands are shown in Table 2.2 As it can be seen, the
PDMPF of laboratory pullout tests are ranged from 1.5 to 18 mm. The PDMPF of in-situ
pullout tests are about as much as two times of the PDMPF of laboratory tests. The data
of tensile test of bored pile (Krabbenhoft, et al, 2008) suggested that the PDMPF may
relate to the SPT value of the soils. Higher SPT value of the soils tends to have larger
PDMPF. Figure 2.5 and Figure 2.6 show the typical bond stress- displacement curves of
in-situ and laboratory pullout test. The bond stress in the Figures multiplied by the
perimeter of the grout and the length of the nails yields the maximum pullout force of the
soil nail. French National Project CLOUTERRE (1991) suggested that the ultimate
pullout force can be determined as either the maximum value or the point where increase
of force per 1mm displacement is less than 1%, or a point of the displacement equal to 30
mm.
Based on the above description, it can be concluded that:
1. The PDMPF for soil nail pullout tests in sands are independent from the ultimate
bond strength
2. The PDMPF for soil nail pullout tests in sands are ranged from 1.5 mm to 18 mm for
1 to 2 m long soil nails
Texas Tech University, Yiqing Wei, May 2013
18
3. The load-displacement curves for soil nail pullout tests in sands are close to linear
shape before achieving the maximum bond stresses
4. The influence of surcharge on soil nail pullout capacity and PDMPF is still unknown
and the current design method ignores the influence.
Texas Tech University, Yiqing Wei, May 2013

19
Figure 2.5 Typical load-displacement curve of in situ soil nail pullout testing (Zhang, et
al, 2009)
Figure 2.6 Typical load-displacement curve of laboratory soil nail pullout testing (Su, et
al, 2008)
Texas Tech University, Yiqing Wei, May 2013
20
Table 2.1 Estimated bond strength of soil nails in soil and rock (Elias and Juran, 1991)
Texas Tech University, Yiqing Wei, May 2013

21
Table 2.2 Results of the soil nail pullout displacement at the maximum pullout forces (PDMPF) for a series of pullout tests in sands
Paper or Report Authors and
the Time Nail Type
Grout
Diameter
Effective
Nail Length
(m)
Testing Method PDMPF
Rapid Pullout Test of Soil Nail Ooi Poh Hai
(2006)
Metallic hollow
circular pipes
25mm and
45 mm 0.75 and 1.65
Laboratory rapid
and quasi static
pullout test
Mostly ranged
at 1.5 to 3 mm
The Tensile Capacity of Bored
Piles in Friction Soils
Krabbenhof
t, et al, 2008
20mm bar, installed
vertically
140 mm and
250 mm 2 to 6 In-situ pullout test 8 to 39 mm
Influence of Overburden
Pressure on Soil-Nail Pullout
Resistance
Su, et al,
2008
25 mm bar, grouted
with high pressure 100 mm 1.2 Laboratory test
About 8 to
18mm
Uncertainties of Field Pullout
resistance of Soil Nails
Zhang, et al,
2008 N/A 57-100 mm 2 In-situ pullout test
About 2 to
15mm
Influence of Grouting Pressure
and Overburden Stress on the
Interface Resistance of a Soil
Nail
Yin and
Zhou, 2009 40 mm bar 100 mm 1.2 Laboratory test
About 2 to 8
mm
Texas Tech University, Yiqing Wei, May 2013

22
2.3 Global Stability of Soil Nail Wall
The limit conditions for analysis and design a soil nail wall are service limit
states and strength limit states. Service states failure models of soil nail walls involve
the problems of excessive wall displacement, differential settlement, cracking of
concrete facing, and fatigue caused by repetitive loading. The problems do not cause
collapse of the wall but impair the functions of the structures.
The strength limit states refer to the damage of the components and the failure
of the systems. For soil nail walls, the strength limit states are classified as external
failure model, internal failure model, and facing failure model. The failure models are
presented in Figure 2.7. Internal failure and facing failure are concern about the
failure of the components such as soil nail, nail head, and the facing. External failure
models consider the failure of the systems. Therefore, the consequences of the
external failure could be significant. The external failure models include global failure
model, sliding failure model and bearing failure model.
The analysis of sliding failure and bearing failure model for soil nail walls is
similar with the analysis of traditional gravity earth retaining walls. In this case, the
soil nail wall is treated as a rigid block. The failure of the systems is caused by the
excessive shear forces in the foundation soil.
The developments of soil nail wall design method are mostly about identifying
the global stability of the soil nail walls. Global stability refers to the overall stability
of the reinforced soil nail wall mass. This dissertation also concentrates in the
evaluation of the global stability of soil nail walls.
Current design methods of soil nail wall use 2D limit equilibrium methods
evaluate the global stability. Different limit equilibrium methods have different
assumptions about the active zone, slide surface, force equilibrium, and moment
equilibrium. The active zone is modeled as a rigid block or multiple vertical slices and
potentially sliding alone the slide surface, as shown in Figure 2.8. The equilibrium
equations are established based on the global force equilibrium in different directions
and (or) global moment equilibrium. The slide surface could be linear, bi-linear,
circular, parabolic, or log spiral. The force equilibrium could be total equations,
equations in horizontal and vertical direction, or equations perpendicular and parallel
to the slide surface. The moment equilibrium could be defined as:
Texas Tech University, Yiqing Wei, May 2013

23
(2.3)
or
(2.4)
where,
F is the FOS
Md is driving moment
Ms is the moment due to available shear strength of the soil
Mt is the moment due to reinforcement
Equation (2.3) can be transformed into:
(2.5)
Equation (2.4) can be transformed into:
(2.6)
It is easy to tell the differences between two approaches by equation (2.5) and
(2.6). The moment due to reinforcement is reduced by a FOS in the equation (2.3) and
(2.5). In the equation (2.4) and (2.6), the FOS applied only for soil strength.
For reinforced soil structures, the reinforcement forces are presented as
boundary forces of the slices. The values of the forces are determined by the tensile
force distribution diagram for the soil nails.
The following section presents a brief discussion of the different design
methods and their design concepts.
Texas Tech University, Yiqing Wei, May 2013

24
Figure 2.7 Principal modes of failure of soil nail wall systems (Byrne et al., 1996)
Texas Tech University, Yiqing Wei, May 2013

25
Figure 2.8 Method for analysis global stability of soil nail wall (Duncan & Right,
2005)
Texas Tech University, Yiqing Wei, May 2013

26
2.3.1Davis Design Method
Shen et al. develop an equilibrium method assuming a parabolic failure
surface, passing either entirely or partially within the inclusion. The assumption is
based on the contour of the factor of safety derived from finite element solutions. In
the analysis, the tensile and pullout resistance of nails crossing the failure surface are
considered the governing stabilizing forces. The slope stability analysis is presented
in Figure 2.9.
The nails are assumed to withstand only tension force and their failure can be
defined by either the breakage or the pullout resistance. The factors of safety are
defined by:
Fc = c/cm (2.7)
Fφ = tanφ/tanφm (2.8)
FL = Tp/T (2.9)
where cm, φm, and T are the soils’ mobilized cohesion, mobilized angle of friction
and the nail’s mobilized pullout resistance alone the potential slide surface,
respectively, and c, φ, and Tp are the soils’ cohesion, angle of friction, and the nail
pullout resistance, respectively. The global factor of safety FOS = Fc = Fφ = FL.
Figure 2.9 (a) Contours of factor of safety derived from finite element analysis (b)
limit equilibrium method for soil nail wall stability analysis (Shen et al., 1981)
Texas Tech University, Yiqing Wei, May 2013
27
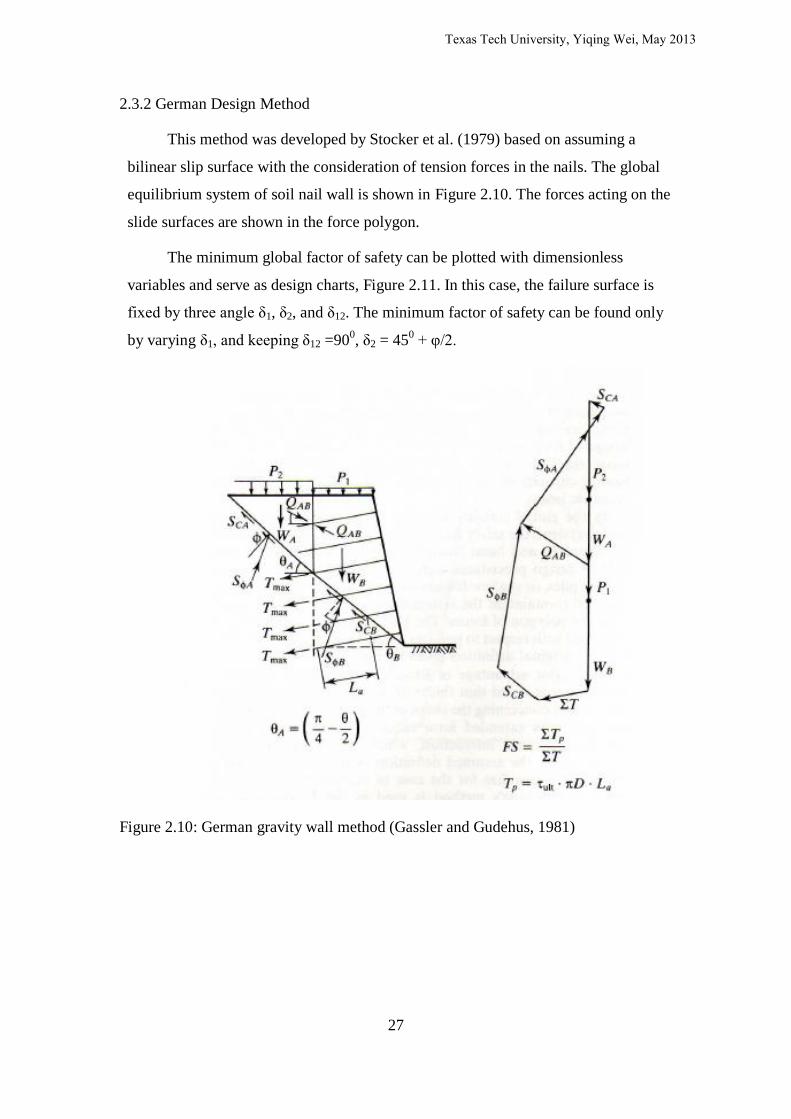
2.3.2 German Design Method
This method was developed by Stocker et al. (1979) based on assuming a
bilinear slip surface with the consideration of tension forces in the nails. The global
equilibrium system of soil nail wall is shown in Figure 2.10. The forces acting on the
slide surfaces are shown in the force polygon.
The minimum global factor of safety can be plotted with dimensionless
variables and serve as design charts, Figure 2.11. In this case, the failure surface is
fixed by three angle δ1, δ2, and δ12. The minimum factor of safety can be found only
by varying δ1, and keeping δ12 =900, δ2 = 45
0 + φ/2.
Figure 2.10: German gravity wall method (Gassler and Gudehus, 1981)
Texas Tech University, Yiqing Wei, May 2013

28
Figure 2.11 German method: Design chart for stability calculations (Gassler and
Gudehus, 1981)
Texas Tech University, Yiqing Wei, May 2013

29
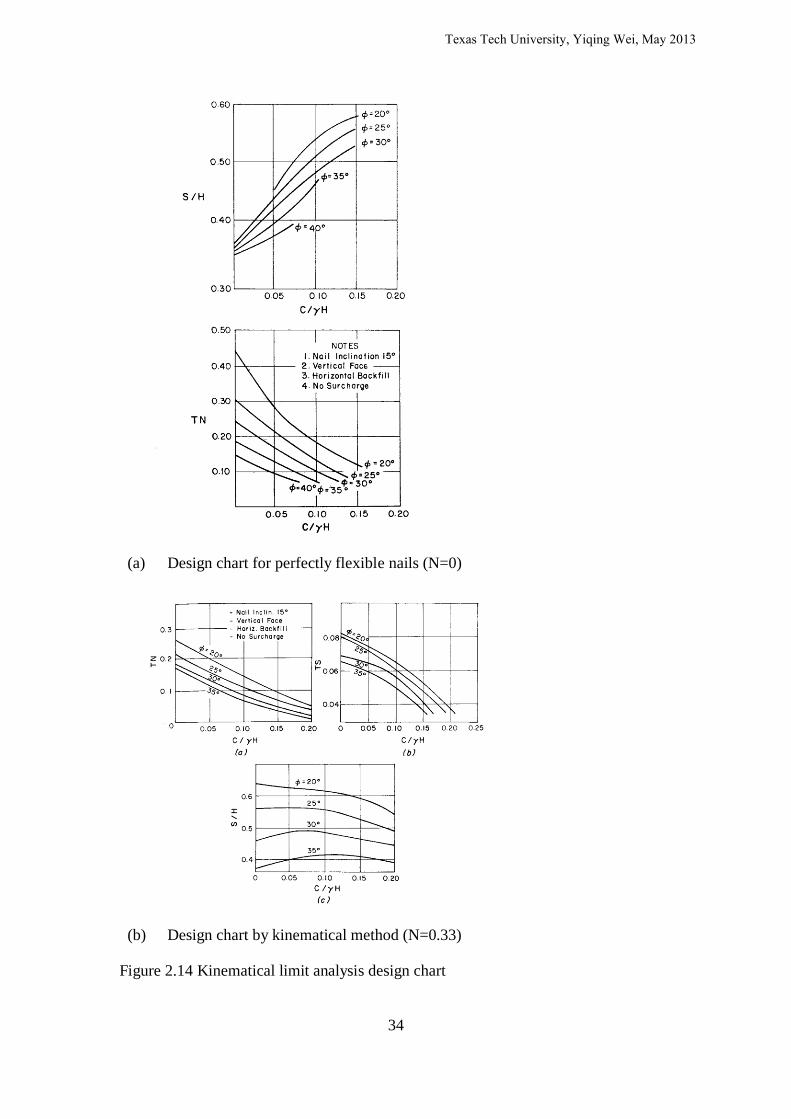
2.3.3 Kinematical Limit Analysis
Kinematical limit analysis design method was developed by Juran and Elias
(1990). This design approach is base on a limit-analysis solution associating a
kinematical admissible displacement/failure mode, as observed on model walls, with
a statically admissible limit equilibrium solution. The main design assumptions are
as follows and shown in Figure 2.12, (Juran et al., 1990):
(a) Failure occurs by quasi-rigid body rotation of the active zone that is limit by
a log-spiral failure surface;
(b) At failure, the locus of maximum tension and shear forces coincide with the
failure surface developed in the soil;
(c) The quasi-rigid active and resistant zones are separated by a thin layer of
soil at a limit state of rigid plastic flow;
(d) The shear resistance of the soil, as defined by Coulomb’s failure criterion, is
entirely mobilized alone the failure surface;
(e) The reinforced mass is divided into slices parallel to the nails.
(f) The horizontal components (Eh) of the inter-slice forces acting in the both
side of a slice compromising nail (Figure 2.12) are equal;
(g) The effect of a slope (or horizontal surcharge, Fh) at the upper surface of
the nailed soil mass on the forces in the conclusions linearly decreases alone
the failure surface.
The effect of the bending stiffness of the inclusion on the actual nail
deformation and the generated resisting forces is analyzed considering the three
following case:
(a) Perfectly flexible nails that withstand only tension forces;
(b) Extremely rigid nails the withstand both tension and shear forces but do not
deform during construction;
(c) Nails with finite bending stiffness that governs their deformation and
thereby the generated shear forces.
In the third case, the actual nail deformation dβ is calculated from available
elastic solutions. As illustrated from Figure 2.12 (c), the tensile force (Tmax) and
Texas Tech University, Yiqing Wei, May 2013
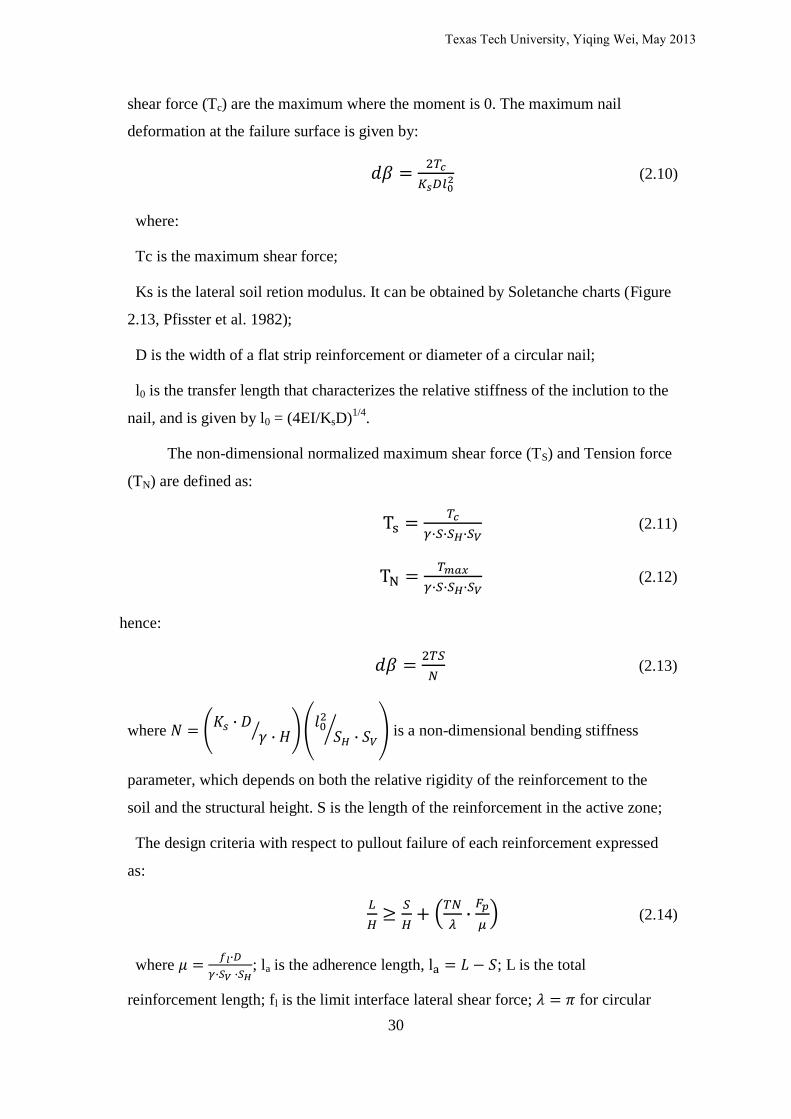
30
shear force (Tc) are the maximum where the moment is 0. The maximum nail
deformation at the failure surface is given by:
(2.10)
where:
Tc is the maximum shear force;
Ks is the lateral soil retion modulus. It can be obtained by Soletanche charts (Figure
2.13, Pfisster et al. 1982);
D is the width of a flat strip reinforcement or diameter of a circular nail;
l0 is the transfer length that characterizes the relative stiffness of the inclution to the
nail, and is given by l0 = (4EI/KsD)1/4
.
The non-dimensional normalized maximum shear force (TS) and Tension force
(TN) are defined as:
(2.11)
(2.12)
hence:
(2.13)
where
is a non-dimensional bending stiffness
parameter, which depends on both the relative rigidity of the reinforcement to the
soil and the structural height. S is the length of the reinforcement in the active zone;
The design criteria with respect to pullout failure of each reinforcement expressed
as:
(2.14)
where
; la is the adherence length, ; L is the total
reinforcement length; fl is the limit interface lateral shear force; for circular
Texas Tech University, Yiqing Wei, May 2013

31
nails and 2 for flat strip reinforcement; Fp is the safety factor with respect to pullout;
S/H is the non-dimensional geometry of the failure surface
Failure by Breakage of Reinforcement
(2.15)
where, Fall and As are the allowable tension stress and the cross-sectional area of the
nail.
For the failure by coupled Tension and shear, the design should satisfy:
(2.16)
where
For failure by excessive bending, the design should satisfy:
(2.17)
where Mp is the plastic bending moment of the nail; FM is the factor of safety with
respect to the plastic moment of the nail; The TN, S/H, TS design chart are shown as
Figure 2.14.
The global safety factor can be defined using the design data per nail:
(2.18)
where n is the number of layers and I is the layer number.
Texas Tech University, Yiqing Wei, May 2013
32
Figure 2.12 Kinematical limit analysis approach: (a) mechanics of failure and design
assumption; (b) state of stress in inclusion; (c) theoretical Solution for infinitely long
bar Adopted for design purposes. (Juran et al., 1990)
Texas Tech University, Yiqing Wei, May 2013

33
Figure 2.13 Constant modulus of lateral subgrade reaction (Pfister et al., 1982)
Texas Tech University, Yiqing Wei, May 2013
34
(a) Design chart for perfectly flexible nails (N=0)
(b) Design chart by kinematical method (N=0.33)
Figure 2.14 Kinematical limit analysis design chart
Texas Tech University, Yiqing Wei, May 2013

35
2.3.4 French Multicriteria Analysis
French national project “CLOUTERRE” presented a Multicriteria analysis
procedure for soil nail wall design. The overall stability is evaluated assuming a
circular slip surface utilizing the simplified Bishop’s method. The method considers
the shear and bending contribution of the nails. It also mentions that the nail shear and
bending capacity increase the global FOS less than 10%. The Multicriteria analysis is
conducted to evaluate the factors of safety with respect to the following (Figure 2.15).
(a) Soil strength.
The soil is characterized by the Mohr-Coulomb criteria. The shear resistance τ
follows the relationship presented as:
τ φ (2.19)
where c is the soil cohesion and φ is internal friction angle of the soil and σ is the
normal vertical stress
(b) Nail resistances.
The nail resistances include resistances of tension, shear, and moment. The
maximum resistance of the nails is depending on the soil-nail interaction criteria.
The maximum shear force, Tc mobilized at the point of intersection of the
failure surface, is given by:
; p < pmax (2.20)
The maximum bending moment mobilized at the distance (π/4) l0 from point
O is given by:
(2.21)
where:
p = Passive maximum shear force, Tc mobilized at the point of intersection between
the failure surface as shown earth pressure on the nail
pmax = Maximum passive resistance that can be mobilized in the soil
l0 = Transfer length given by equation (2.4)
Mp = Limit bending capacity of the nail
Texas Tech University, Yiqing Wei, May 2013
36
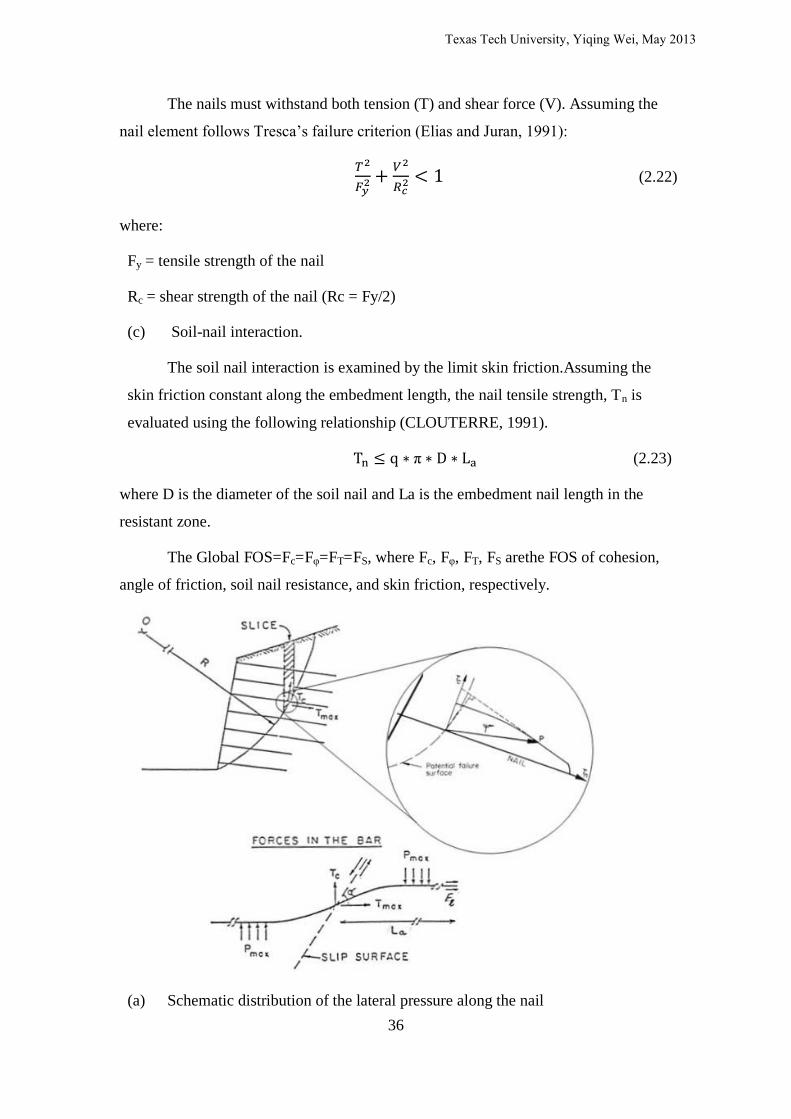
The nails must withstand both tension (T) and shear force (V). Assuming the
nail element follows Tresca’s failure criterion (Elias and Juran, 1991):
(2.22)
where:
Fy = tensile strength of the nail
Rc = shear strength of the nail (Rc = Fy/2)
(c) Soil-nail interaction.
The soil nail interaction is examined by the limit skin friction.Assuming the
skin friction constant along the embedment length, the nail tensile strength, Tn is
evaluated using the following relationship (CLOUTERRE, 1991).
π (2.23)
where D is the diameter of the soil nail and La is the embedment nail length in the
resistant zone.
The Global FOS=Fc=Fφ=FT=FS, where Fc, Fφ, FT, FS arethe FOS of cohesion,
angle of friction, soil nail resistance, and skin friction, respectively.
(a) Schematic distribution of the lateral pressure along the nail
Texas Tech University, Yiqing Wei, May 2013

37
(b) Representation of the various interaction mechanisms within the normal force
(Tn) and shear force (Tc)
Figure 2.15 Multicriteria slope stability analysis method (Schlosser, 1982)
Texas Tech University, Yiqing Wei, May 2013
38
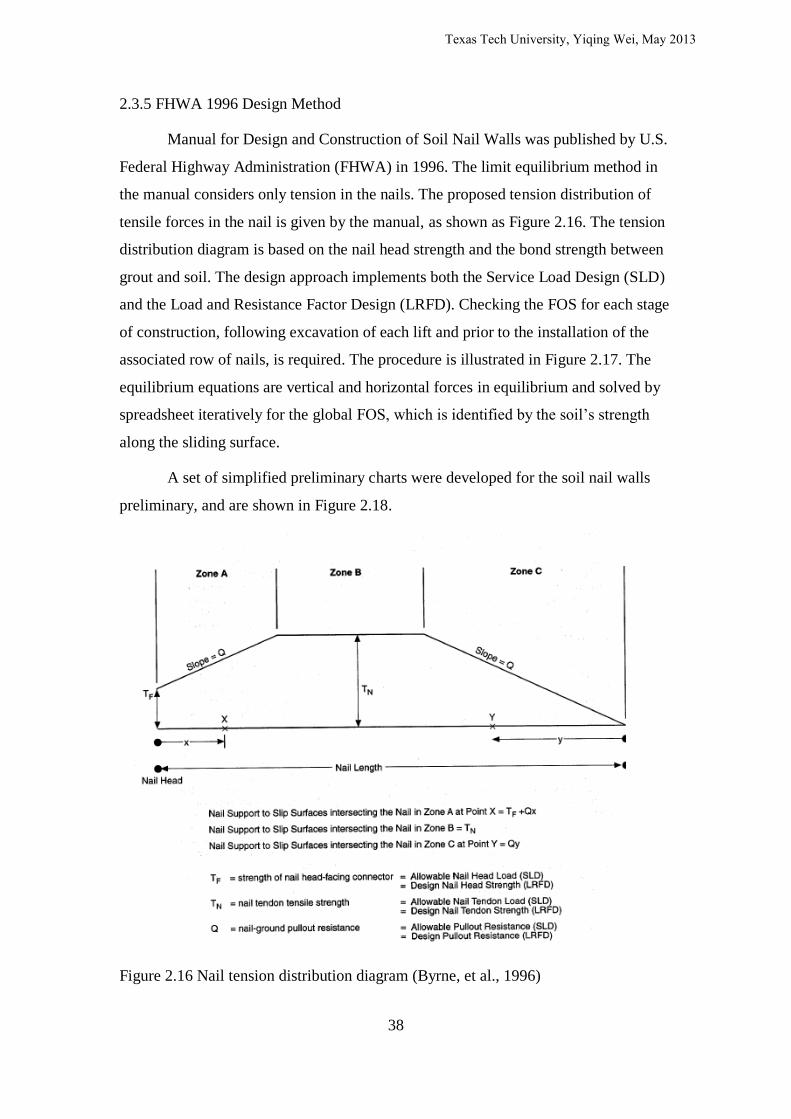
2.3.5 FHWA 1996 Design Method
Manual for Design and Construction of Soil Nail Walls was published by U.S.
Federal Highway Administration (FHWA) in 1996. The limit equilibrium method in
the manual considers only tension in the nails. The proposed tension distribution of
tensile forces in the nail is given by the manual, as shown as Figure 2.16. The tension
distribution diagram is based on the nail head strength and the bond strength between
grout and soil. The design approach implements both the Service Load Design (SLD)
and the Load and Resistance Factor Design (LRFD). Checking the FOS for each stage
of construction, following excavation of each lift and prior to the installation of the
associated row of nails, is required. The procedure is illustrated in Figure 2.17. The
equilibrium equations are vertical and horizontal forces in equilibrium and solved by
spreadsheet iteratively for the global FOS, which is identified by the soil’s strength
along the sliding surface.
A set of simplified preliminary charts were developed for the soil nail walls
preliminary, and are shown in Figure 2.18.
Figure 2.16 Nail tension distribution diagram (Byrne, et al., 1996)
Texas Tech University, Yiqing Wei, May 2013

39
Figure 2.17 Construction stability of soil nail wall (Byrne, et al., 1996)
Figure 2.18 FHWA 1996 preliminary design chart for soil nail walls (Byrne, et al.,
1996)
Texas Tech University, Yiqing Wei, May 2013

40
2.3.6 FHWA 2003 Design Method
In 2003, The FHWA published a new edition design manual, “Geotechnical
Engineering Circular No.7”, for soil nail wall design. The soil nail wall design
approach is based on Allowable Stress Design (ASD) method. A series of preliminary
design charts are also presented by this manual (Figure 2.19). The charts have been
developed using computer program SNAIL for a factor of safety of 1.35. The key
parameter for the design charts are face batter and back slope of the soil nail walls,
and effective friction angle of the soils. The limit equilibrium computer program
SNAIL or GOLDNAIL are used to calculate FOS.
Figure 2.19 FHWA 2003 preliminary design chart for soil nail walls (Lazarte, et al.,
2003)
Texas Tech University, Yiqing Wei, May 2013

41
2.3.6.1 GOLDNAIL
GOLDNAIL version 3.11 is a versatile Windows-based proprietary program
developed in 1993-1998 by Golder Associates. The soil strength criterion is a linear
Mohr-Coulomb envelope with the option of using a bi-linear strength envelope. The
program can model up to 13 soil layers, complex slopes and subsurface geometries,
horizontal and vertical surcharge distributions, groundwater, and pseudo-static
horizontal coefficients. The slip surfaces are circular and pass at or above the toe.
This program satisfies moment and force equilibrium. Similar to conventional
slope stability methods, GOLDNAIL divides the potential sliding mass into vertical
slices. The program modifies iteratively the normal stresses distribution at the base of
the slices until force and moment equilibrium is obtained.
2.3.6.2 SNAIL
SNAIL is a computer program developed by the California Department of
Transportation (CALTRANS) in 1991. The program is based on two-dimensional
limit equilibrium that considers force equilibrium only. The failure surface is bi-linear
(with the failure surface originating at the toe) or tri-linear (with the failure surface
originating at the bottom of the excavation at a point away from the toe). For the case
of a tri-linear failure surface, the resisting forces in the lower wedge beneath the wall
are calculated assuming passive earth pressure conditions, with the inclination of the
passive force fixed at the mobilized friction angle.
SNAIL allows up to two uniform (vertical) surcharge distributions and an
internal or external force (horizontal or oblique).Up to seven soil layers can be
modeled. The maximum of two slope segments can be modeled at the toe. The soil
strength criterion used in SNAIL is the conventional linear Mohr-Coulomb envelope.
Bond strength input is associated with the soil input, not with the nail input. Hence, if
different bond strengths need to be modeled in an otherwise homogeneous soil profile,
a new soil layer must be defined.
Texas Tech University, Yiqing Wei, May 2013

42
2.4 Introduction of MSE wall
Mechanically Stabilized Earth Wall (MSE) is fill-type reinforced soil structure
and constructed from the bottom up. Multiple layers of reinforcement are placed in
the retaining wall equal in the vertical distance. Granular materials are filled and
compacted between the reinforcements. The reinforcements of MSE could be metallic
and nonmetallic reinforcements. The stresses between soil and reinforcements are
depending on the material type and the geometry of the reinforcements, shown as
Figure 2.20. Figure 2.21, shows the typical load- displacement curve of the metallic
reinforcement pullout test for MSE walls. The pullout resistance of the MSE wall
reinforcements is defined as the maximum force before the pullout displacement
equal to 12.5 mm (0.5 inch) or 20 mm (0.75 inches) (Senanayake, 2011). It is
important to mention that the load-displacement curve presented in the Figure
mentioned above (Figure 2.21) has a non-linear behavior and the steps as shown in
the Figure are due to rupture of the reinforcements.
The pullout resistance of MSE wall, Pr, follows the equation:
(2.24)
where:
Le = the embedment or adherence length in the resisting zone behind the failure
surface
C = the reinforcement effective unit perimeter; e.g., C = 2 for strips, grids, and
sheets
F* = the pullout resistance (or friction-bearing-interaction) factor
α = a scale effect correction factor to account for a non linear stress reduction over
the embedded length of highly extensible reinforcements, based on laboratory data
(generally 1.0 for metallic reinforcements and 0.6 to 1.0 for geosynthetic
reinforcements).
= the effective vertical stress at the soil-reinforcement interfaces.
Texas Tech University, Yiqing Wei, May 2013

43
The design method of MSE wall is based on limit equilibrium method. The
types of stability include external, internal, and in some cases, combined
external/internal stability. Shown in Figure 2.22, the external stability of the wall
consists of sliding, overturning, bearing capacity, and deep seated stability. The MSE
wall is treated as a rigid body for the external stability analysis. Meanwhile, because
of the flexibility and satisfactory field performance of MSE walls, the adopted values
for the FOS for external failure are in some cases lower than those used for traditional
gravity earth retaining walls.
The internal failure model could be: i) failure by elongation or breakage of the
reinforcements; ii) failure by pullout. The critical slip surface for internal failure
model is assumed to match the maximum tensile force line of the reinforcements,
illustrated in Figure 2.23. The location of the maximum tensile forces is related to the
type of the reinforcements. The relationships between the stress ratio and overburden
stress with different type of reinforcements are shown in Figure 2.24.
FHWA suggests the computer program MSEW as the official MSE wall
design program.
Texas Tech University, Yiqing Wei, May 2013

44
Figure 2.20 Stress transfer mechanisms for MSE wall reinforcement (Elias et al., 2001)
Texas Tech University, Yiqing Wei, May 2013

45
Figure 2.21 Typical Load-Displacement Curve for the metallic reinforcement pullout
test for the MSE wall (Senanayake, 2011)
Figure 2.22 Potential external failure mechanisms for a MSE wall
Texas Tech University, Yiqing Wei, May 2013

46
Figure 2.23 Location of potential failure surface for internal stability design of MSE
walls.
Texas Tech University, Yiqing Wei, May 2013

47
Figure 2.24 Variation of stress ratio with depth in a MSE wall
Texas Tech University, Yiqing Wei, May 2013

48
CHAPTER 3
INSTRUMENTATION AND MONITORING OF IH 410 MSE/SOIL
NAIL HYBRID RETAINING WALL
3.1 Project Description
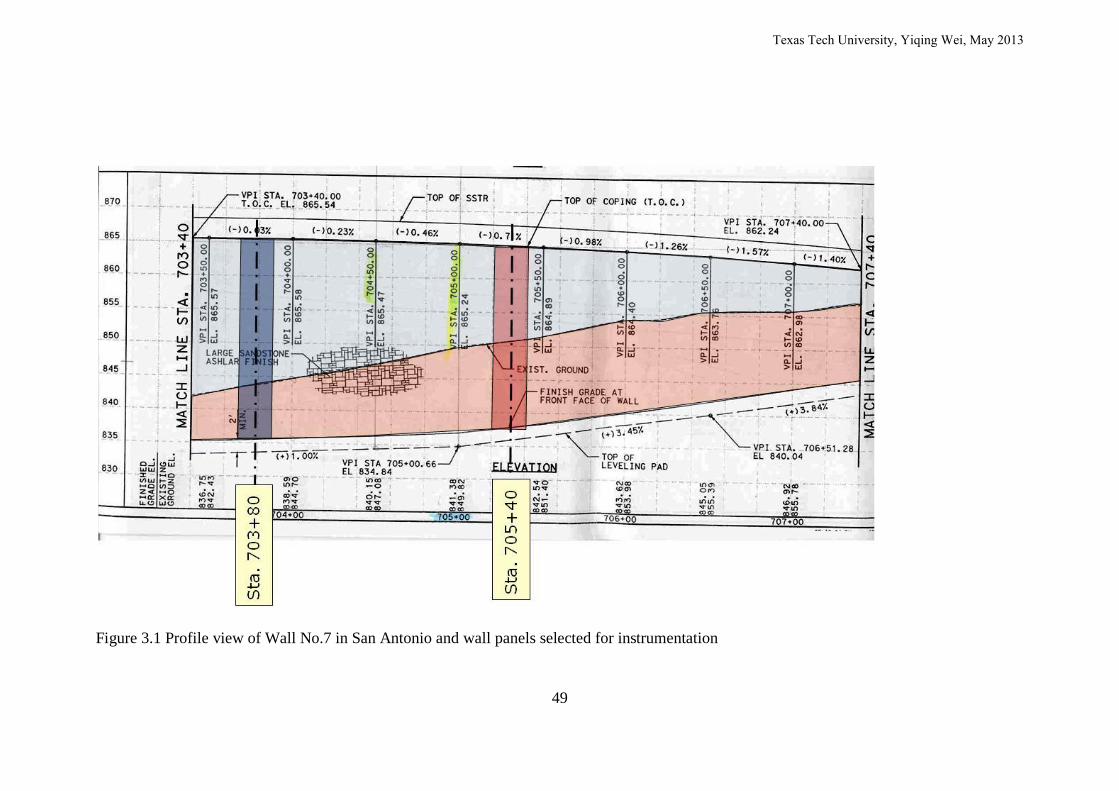
The MSE/Soil Nail hybrid wall project documented in this dissertation was
approximately 2200 ft in length and was located near the IH-410 overpass over
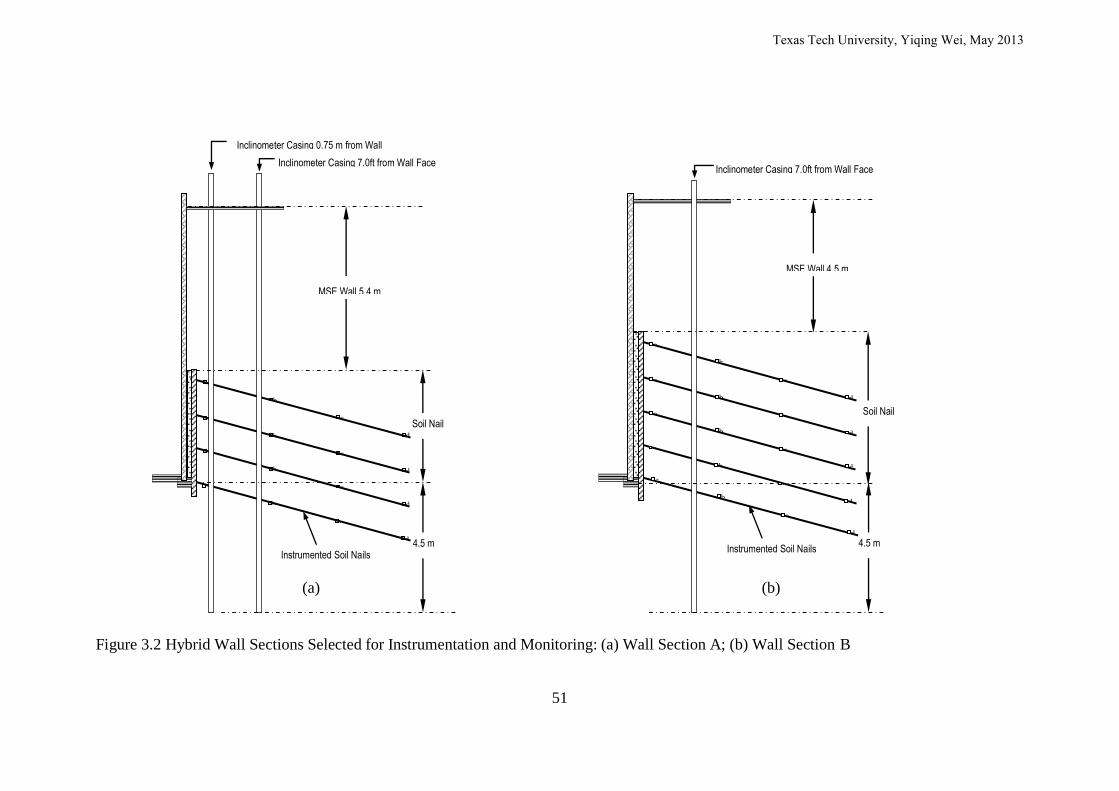
Ingram Road in San Antonio, Texas (Figure 3.1). As shown in Figure 3.2, the heights
of soil nail wall and MSE wall portions varied along the length of the wall. Two
separate sections of the wall were selected for the purpose of instrumentation and
monitoring. The first, Wall 7 Section A, is located at Station 703+80. The height of
the soil nail wall at this location is 4.0 m and the height of the MSE wall is 5.4 m. The
MSE/Soil Nail hybrid wall has a MSE/SN Height Ratio of 1.35. The second wall
section, Wall 7 Section B, is located at Station 705+40. It has a 5.0 m soil nail wall
and a 4.5 m MSE wall yielding a MSE/SN Height Ratio of 0.88. Cross sectional
views of the two wall sections are shown in Figures 3.2 (a) and (b).
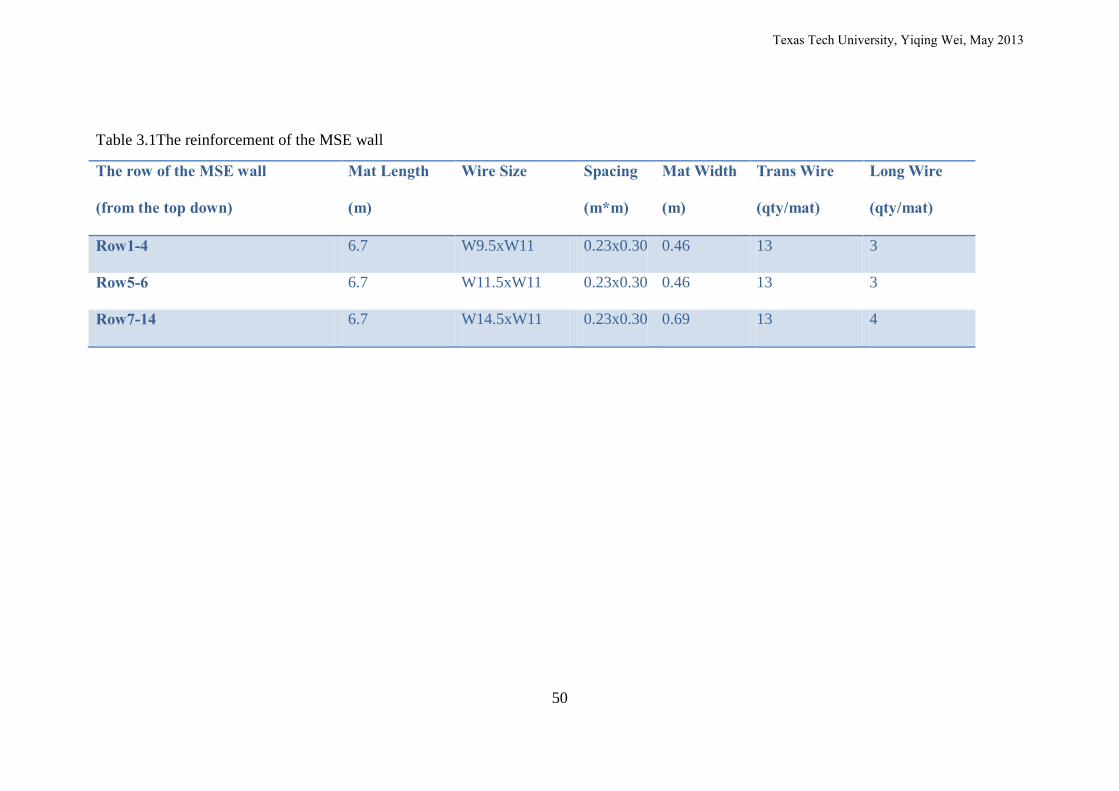
The reinforcement of MSE wall consisted of 6.7 m geogrid mats anchored on
the width of 2.3 m precast panels. There were 2 goegrid mats per panel for each layer.
The types of geogrid mats are show in Table 3.1. Soil nails were installed at 1.0 m and
1.05 m horizontally and vertically, respectively. Grouting holes were 150 mm in
diameter and rebars were 25 mm in diameter. The length of the soil nails in Wall 7
Section A were 8.5 m for the first row and 7.9 m for the remaining rows. Wall 7
Section B had a length of soil nails equal to 7 m. The inclination of nails was 15
degrees below horizontal. The soil for MSE wall was free drain granular material with
an angle of friction of 34 degree and a unit weight of 19.6 kN/m3. The soil for soil nail
walls consisted of gravelly silty sand with a design angle of friction of 35 degree and
a unit weight of 19.6 kN/m3.
Texas Tech University, Yiqing Wei, May 2013
49
Figure 3.1 Profile view of Wall No.7 in San Antonio and wall panels selected for instrumentation
Texas Tech University, Yiqing Wei, May 2013
50
Table 3.1The reinforcement of the MSE wall
The row of the MSE wall
(from the top down)
Mat Length
(m)
Wire Size Spacing
(m*m)
Mat Width
(m)
Trans Wire
(qty/mat)
Long Wire
(qty/mat)
Row1-4 6.7 W9.5xW11 0.23x0.30 0.46 13 3
Row5-6 6.7 W11.5xW11 0.23x0.30 0.46 13 3
Row7-14 6.7 W14.5xW11 0.23x0.30 0.69 13 4
Texas Tech University, Yiqing Wei, May 2013
51
(a) (b)
Figure 3.2 Hybrid Wall Sections Selected for Instrumentation and Monitoring: (a) Wall Section A; (b) Wall Section B
a
a
a
a
b
b
b
b
c
c
c
c
d
d
d
d
Instrumented Soil Nails
Inclinometer Casing 0.75 m from Wall
Face Inclinometer Casing 7.0ft from Wall Face
MSE Wall 5.4 m
Soil Nail
Wall 4 m
4.5 m
Embedment
a
b
c
d
a
a
a
b
b
b
c
c
c
d
d
d
a
b
c
d
MSE Wall 4.5 m
Soil Nail
Wall 5 m
4.5 m
Embedment
Inclinometer Casing 7.0ft from Wall Face
Instrumented Soil Nails
Texas Tech University, Yiqing Wei, May 2013
52
3.2 Construction of the Hybrid Wall
The construction started from Feb 19th
2008 and the phases are shown in Table
3.2. The increments of the first excavation for the soil nail wall portions was 1.5 m
and the rest varied from 1.05 m to 1.35 m. The construction of the MSE wall started
after all the soil nail wall sections were finished. By May 30th
2008, the construction
of the MSE wall was terminated and the pavement above the MSE wall was
completed by August 14th
2008.
3.3 Case Studies
In order to study the behaviors of the soil nail walls, the instrumentations and
monitoring of these walls have been performed since 1980s. Two aspects are mainly
concerned by the instrumentation: the maximum tensile forces of the nails, and the
horizontal displacement of the wall. The maximum tensile forces of the nails illustrate
the interaction between the soil and the nails. Furthermore, the locations of the
maximum tensile forces at the nails may present the critical failure surface of the soil
nail wall. The horizontal displacements reveal the failure pattern of the soil nail walls.
The serviceability for these walls also requires the horizontal displacements less than
the tolerable deformation and must not affect the other structures behind the walls.
Strain gages and inclinometer are used to measure the strain of nails and the
horizontal displacement of soil nail walls respectively. The nail forces then can be
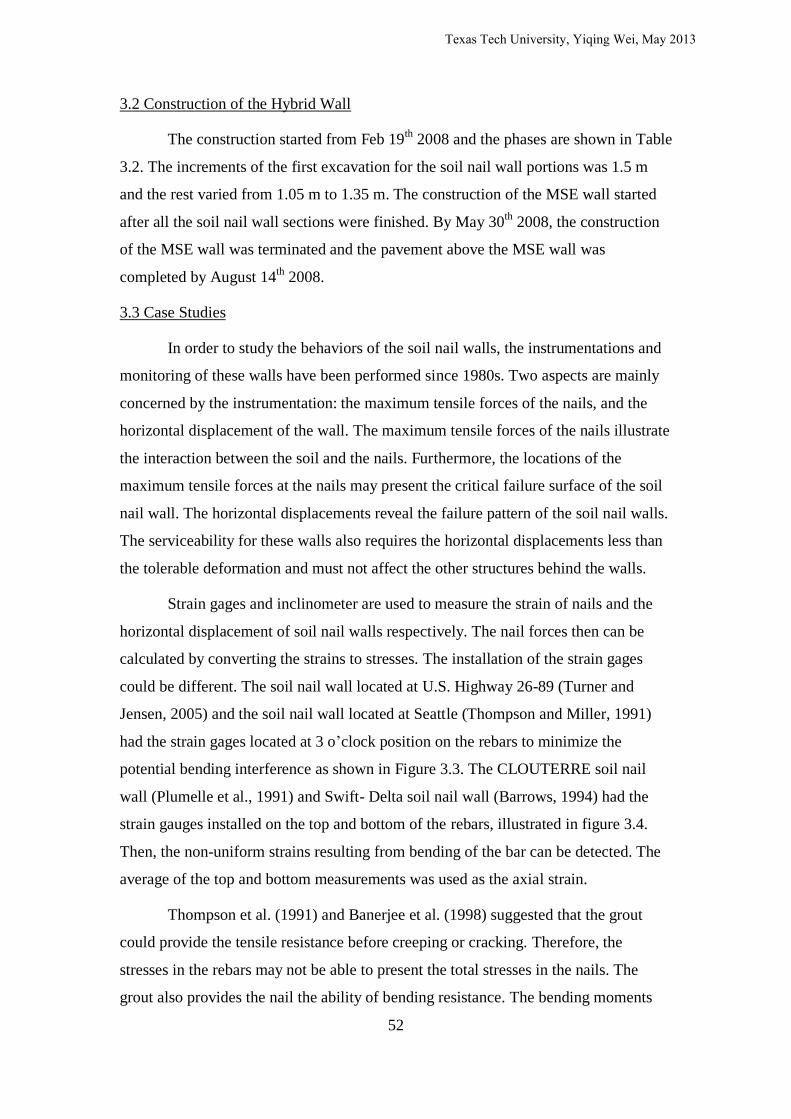
calculated by converting the strains to stresses. The installation of the strain gages
could be different. The soil nail wall located at U.S. Highway 26-89 (Turner and
Jensen, 2005) and the soil nail wall located at Seattle (Thompson and Miller, 1991)
had the strain gages located at 3 o’clock position on the rebars to minimize the
potential bending interference as shown in Figure 3.3. The CLOUTERRE soil nail
wall (Plumelle et al., 1991) and Swift- Delta soil nail wall (Barrows, 1994) had the
strain gauges installed on the top and bottom of the rebars, illustrated in figure 3.4.
Then, the non-uniform strains resulting from bending of the bar can be detected. The
average of the top and bottom measurements was used as the axial strain.
Thompson et al. (1991) and Banerjee et al. (1998) suggested that the grout
could provide the tensile resistance before creeping or cracking. Therefore, the
stresses in the rebars may not be able to present the total stresses in the nails. The
grout also provides the nail the ability of bending resistance. The bending moments
Texas Tech University, Yiqing Wei, May 2013
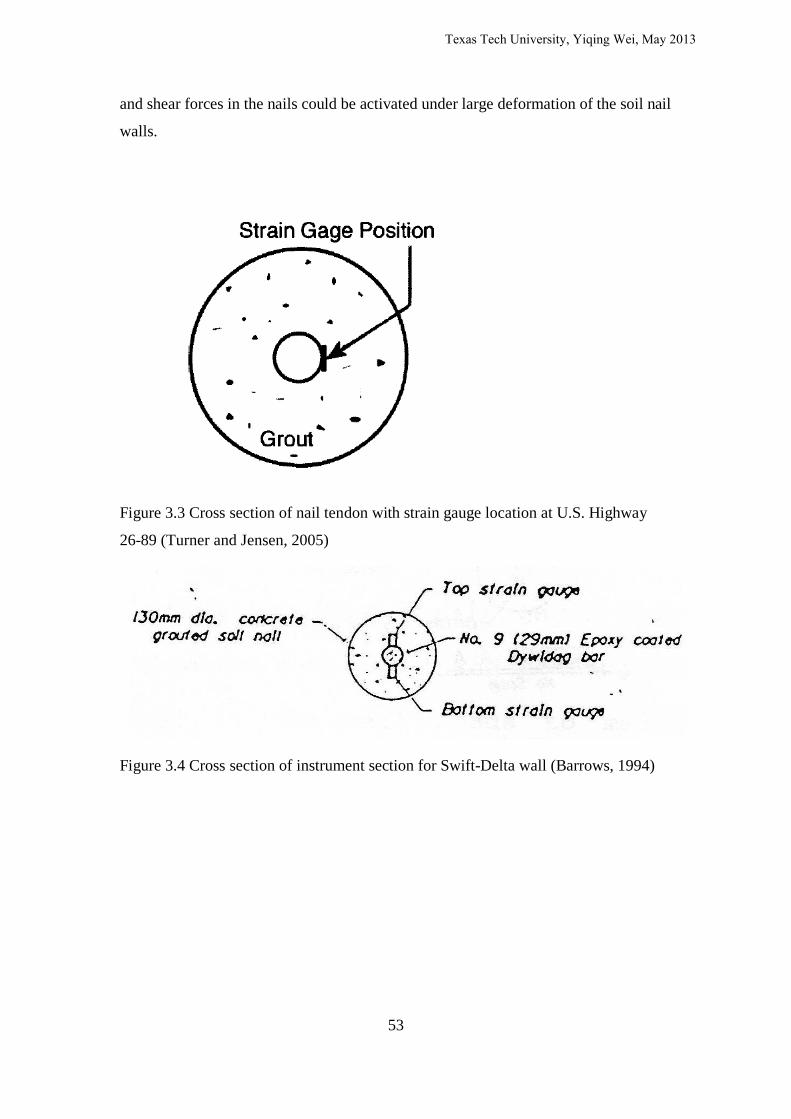
53
and shear forces in the nails could be activated under large deformation of the soil nail
walls.
Figure 3.3 Cross section of nail tendon with strain gauge location at U.S. Highway
26-89 (Turner and Jensen, 2005)
Figure 3.4 Cross section of instrument section for Swift-Delta wall (Barrows, 1994)
Texas Tech University, Yiqing Wei, May 2013

54
3.4 Instrumentation Plan
Two types of vibrating wire strain gages (VWG) were installed. The first type
of VWG was spot welded to the soil nails in order to measure rebar strains. The
instrumentation scheme is illustrated in Figure 3.5 (a) and (b). The spot welded
gauges were place at the top and bottom of the rebars at the gage location.
The second type of VWGs were Model 4210 VWG, illustrated in Figure 3.6 (a)
and (b), embedded in the grout to measure the its strains. The Model 4210 VWG have
plates at either end of the gage that lock into place in the grout. The gage then behaves
the same way as the spot welded gage. Figure 3.6 (b) shows a Model 4210 VWG that
had been mounted on the plastic centralizer attached to the steel bar. Figure 3.7 shows
the gage layout on the bar for a 7.9 m long nail that carried both types of strain gages.
The inclinometer casing was installed 0.75 m behind the facing at Wall 7 Section A
to determine the deformation in the soil mass behind the wall. The casing was placed
by drilling, down to approximately 4.6 m below the final bottom ground level.
Texas Tech University, Yiqing Wei, May 2013

55
Table 3.2 Wall No.7 Construction Timeline
Date (2008)
Wall Section A Wall Section B
Feb 19
--- Depth of excavation = 1.5 m; Top
row nails installed and grouted
Feb 20 Depth of excavation = 1.5 m
Top row nails installed and
grouted
Shotcreted top nail
Feb 21 Shotcreted top nails ---
Feb 22 --- Depth of excavation = 2.6 m
Feb 23 Depth of excavation = 2.6 m
Feb 25 --- The second row nails installed and
grouted
Feb 26 The second row nails installed,
grouted and shotcreted
The second row nails shotcreted
Feb 27 --- Depth of excavation = 3.7 m; The
third row nails installed and
grouted
Feb 28 --- The third row nails shotcreted;
Depth of excavation = 5.0 m
Mar 4 Depth of excavation = 4.0 m ---
Mar 5 The third row and fourth row
nails installed, grouted and
shotcreted
---
Mar 7 --- The fourth and fifth row nails
installed and grouted
Mar 10 --- The fourth and fifth row nails
shotcreted
May 2 MSE wall height = 0.3 m MSE wall height = 0.3 m
May 9 MSE wall height = 2.4 m MSE wall height = 1.5 m
May 30 MSE completed, height = 5.4 m MSE completed, height = 4.4 m
Jun 16 Construction of traffic barriers Construction of traffic barriers
Aug 14 Pavement Construction Complete Pavement Construction Complete
Texas Tech University, Yiqing Wei, May 2013

56
(a) (b)
Figure 3.5 Spot Welded VWGs; (a) Schematic, (b) VWG covered with tape for
protection
(a) (b)
Figure 3.6 Model 4210 VWG ; (a) Schematic, (b) VWG mounted on centralizer
Figure 3.7 Layout of Spot Welded and Embedment Type VWGs on a 7.9 m long Soil
Nail Tendon
Welded VWG Model 4210 VWG
Texas Tech University, Yiqing Wei, May 2013

57
3.5 Data Interpretation
3.5.1 Inclinometer Data
The horizontal displacement of Wall 7 Section A is shown in Figure 3.8.
Under high surcharge, the maximum displacements were recorded as 38 mm and 47
mm by the end of MSE wall construction phase, and the pavement completion,
respectively. The ratio of horizontal displacement versus height of the soil nail
wall, δ
, wall was 1.18%.
3.5.2 Grout Strain
The grout used in the soil walls had a theoretical maximum tensile strain of
202 με and maximum compressive strain of 901 με. Grout strains in the soil nail walls
were mostly over the limit for tensile and undergoing large cracking after the
completion of the pavement construction (Figure 3.9). Therefore, the grout sustained
almost nothing of tensile force when the soil nail walls had significant surcharge. The
tensile forces in the rebars were representing the most part of the tensile forces of the
soil nails. Likewise, there was no significant bending resistance in the soil nails.
3.5.3 Tensile Forces in Soil Nail
The strain gage data provided behavior of soil nails under significant
surcharge. The development of soil nail forces was found to be associated with the
stages of construction. The fourth and fifth row nails in Wall 7 Section B were
installed after the last excavation of the soil nail wall. Therefore, the nail forces of
fourth and fifth row for Wall 7 Section B were 0 kN at the completion of soil nail wall.
All of the nail forces kept increasing with different increments during the following
construction of the MSE wall and the pavement. Figure 3.10 shows the distribution
and increments of nail loads along the soil nails under different stages.
The highest nail forces for wall 7 sections A and B, happened at the first row
nail. The maximum tensile force of the first row of Wall 7 Section A occurred at the
nail head during the beginning of the several construction stages. The maximum
tensile force moved to the right-hand side of the soil nail in the last construction stage.
This phenomenon suggests that the potential failure surface of the retaining wall
system moved to the right-hand side of the wall. The active zone of the soil nail wall
may pass through the top nail since the maximum tensile force was found to be 3/4 of
Texas Tech University, Yiqing Wei, May 2013
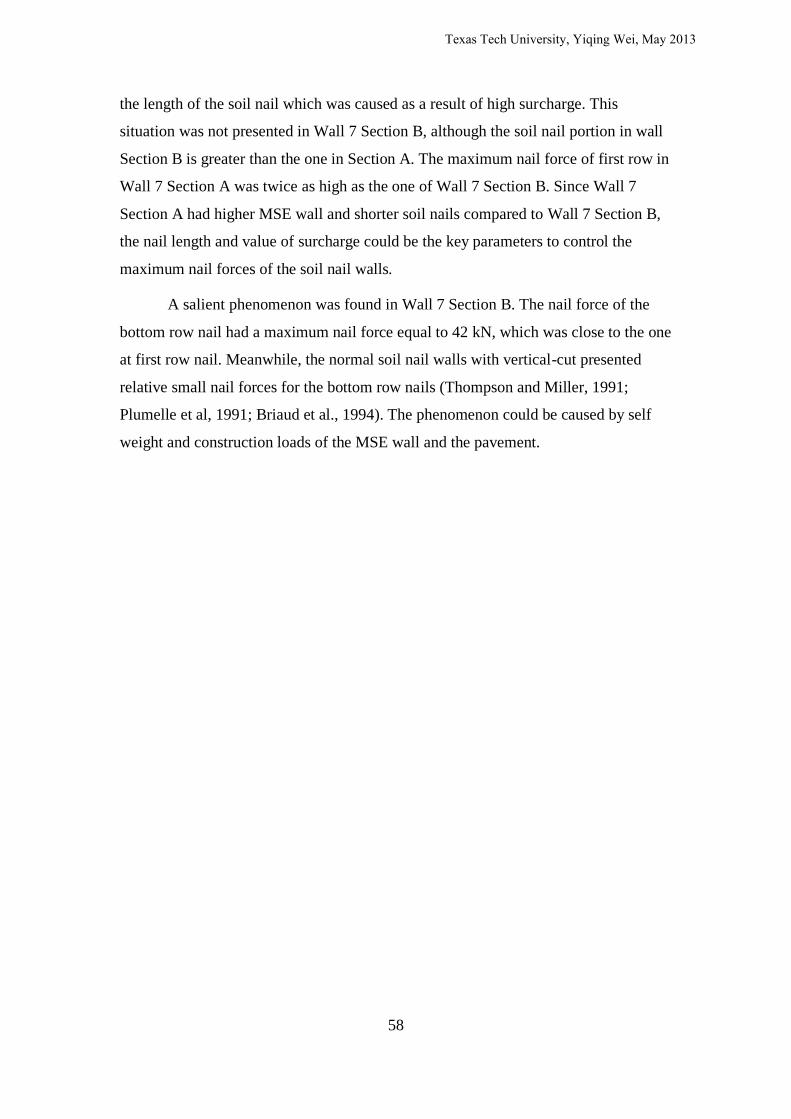
58
the length of the soil nail which was caused as a result of high surcharge. This
situation was not presented in Wall 7 Section B, although the soil nail portion in wall
Section B is greater than the one in Section A. The maximum nail force of first row in
Wall 7 Section A was twice as high as the one of Wall 7 Section B. Since Wall 7
Section A had higher MSE wall and shorter soil nails compared to Wall 7 Section B,
the nail length and value of surcharge could be the key parameters to control the
maximum nail forces of the soil nail walls.
A salient phenomenon was found in Wall 7 Section B. The nail force of the
bottom row nail had a maximum nail force equal to 42 kN, which was close to the one
at first row nail. Meanwhile, the normal soil nail walls with vertical-cut presented
relative small nail forces for the bottom row nails (Thompson and Miller, 1991;
Plumelle et al, 1991; Briaud et al., 1994). The phenomenon could be caused by self
weight and construction loads of the MSE wall and the pavement.
Texas Tech University, Yiqing Wei, May 2013

59
Figure 3.8 Horizontal displacement of Wall 7 Section A
0
1
2
3
4
5
6
7
8
9
-20 -10 0 10 20 30 40 50 60
Hei
ght
fro
m t
he
Bo
tto
m o
f th
e In
clin
om
eter
(m
)
Horizontal Displacement (mm)
MSE Wall Construction Completed
Pavement Construction Completed
Texas Tech University, Yiqing Wei, May 2013

60
Figure 3.9 Final strain of the grout of the soil nails
(a) Tensile forces measured in the top row nail of Wall 7 Section A
-1000
-500
0
500
1000
1500
2000
0 1 2 3 4 5 6 7 8
Mic
rost
rain
(με)
Distance From The Facing (m)
Wall 7 Section A Row 1 Wall 7 Section B Row 1
Wall 7 Section B Row 3 Wall 7 Section B Row 4
0
10
20
30
40
50
60
70
80
90
0 1 2 3 4 5 6 7 8
Ten
sile
Fo
rce
(K
N)
Distance from Facing (m)
Soil Nail Wall Completed MSW Wall Height = 2.4 m(8 ft)
MSW Wall Height = 5.4 m(17.8 ft) Pavement Construction Completed
Texas Tech University, Yiqing Wei, May 2013

61
(b) Tensile forces measured in the second row wail of Wall 7 Section A
(c) Tensile forces measured in the top row nail of Wall 7 Section B
0
5
10
15
20
25
30
35
40
45
50
0 1 2 3 4 5 6 7 8
Tesi
le F
orc
e (
KN
)
Distance from Facing (m)
Soil Nail Wall Completed MSW Wall Height = 2.4 m(8 ft)
MSW Wall Height = 5.4 m(17.8 ft) Pavement Construction Completed
0
5
10
15
20
25
30
35
40
45
50
0 1 2 3 4 5 6 7 8
Tesi
le F
orc
e (k
N)
Diatance from Facing (m)
Soil Nail Wall Completed MSW Wall Height = 1.5 m(5 ft)
MSW Wall Height = 4.4 m(14.5 ft) Pavement Construction Completed
Texas Tech University, Yiqing Wei, May 2013
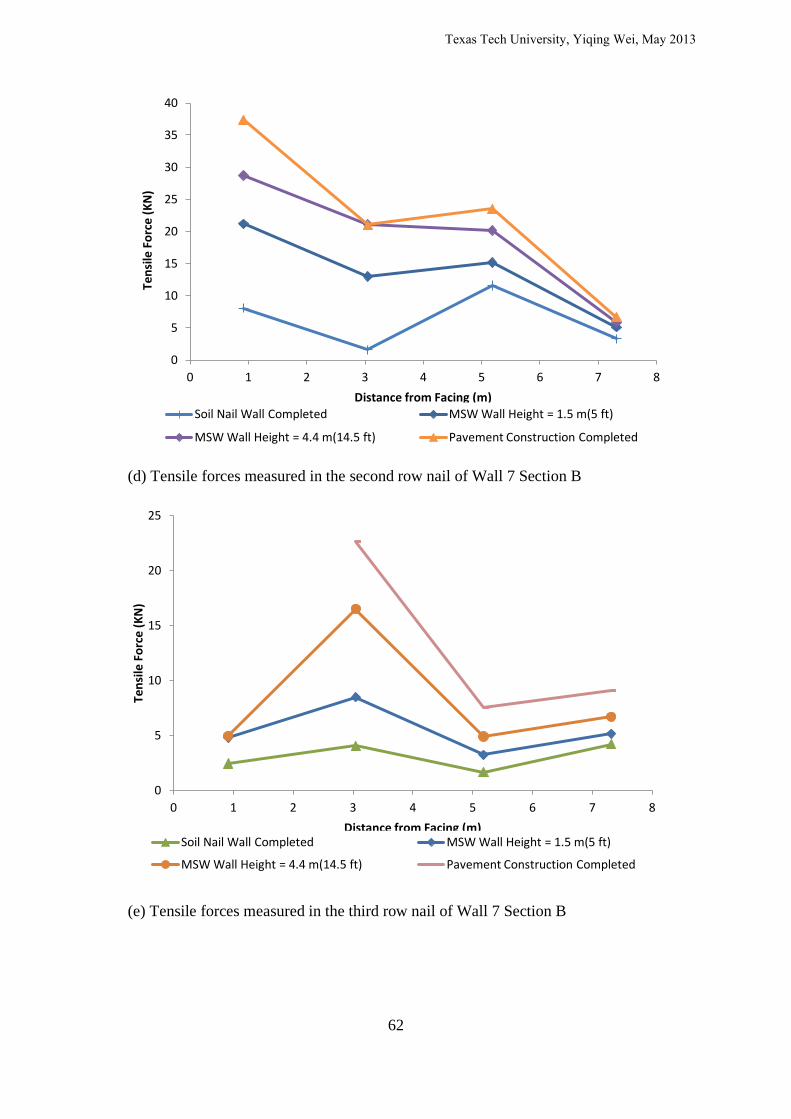
62
(d) Tensile forces measured in the second row nail of Wall 7 Section B
(e) Tensile forces measured in the third row nail of Wall 7 Section B
0
5
10
15
20
25
30
35
40
0 1 2 3 4 5 6 7 8
Ten
sile
Fo
rce
(K
N)
Distance from Facing (m) Soil Nail Wall Completed MSW Wall Height = 1.5 m(5 ft)
MSW Wall Height = 4.4 m(14.5 ft) Pavement Construction Completed
0
5
10
15
20
25
0 1 2 3 4 5 6 7 8
Ten
sile
Fo
rce
(K
N)
Distance from Facing (m) Soil Nail Wall Completed MSW Wall Height = 1.5 m(5 ft)
MSW Wall Height = 4.4 m(14.5 ft) Pavement Construction Completed
Texas Tech University, Yiqing Wei, May 2013
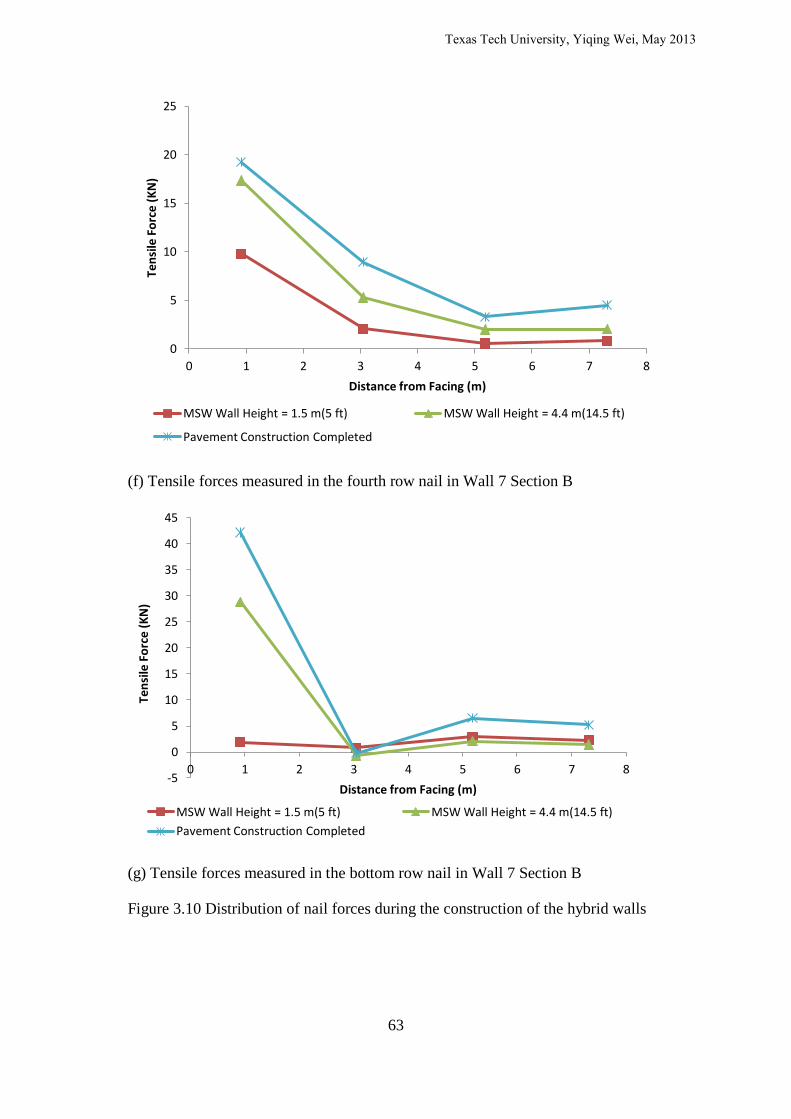
63
(f) Tensile forces measured in the fourth row nail in Wall 7 Section B
(g) Tensile forces measured in the bottom row nail in Wall 7 Section B
Figure 3.10 Distribution of nail forces during the construction of the hybrid walls
0
5
10
15
20
25
0 1 2 3 4 5 6 7 8
Ten
sile
Fo
rce
(K
N)
Distance from Facing (m)
MSW Wall Height = 1.5 m(5 ft) MSW Wall Height = 4.4 m(14.5 ft)
Pavement Construction Completed
-5
0
5
10
15
20
25
30
35
40
45
0 1 2 3 4 5 6 7 8
Ten
sile
Fo
rce
(KN
)
Distance from Facing (m)
MSW Wall Height = 1.5 m(5 ft) MSW Wall Height = 4.4 m(14.5 ft)
Pavement Construction Completed
Texas Tech University, Yiqing Wei, May 2013

64
3.6 Discussion of Results
The instrumentation of soil nail strengthened slope under high surcharge have
been performed by Turner et al. (2005) and Li et al. (2008), as shown in Figure 3.11
(a) and 3.12 (a). The soil nail strengthened slope in Wyoming was 1.8 to 3 m in height
and had the MSE wall of 4 to 7.6 m height above it. Another soil nail strengthen slope
in Hong Kong was 4.75 m in height and 9 m in width. Five layers of concrete blocks
were placed at the crest of the slope as surcharge. The dimensions of each concrete
block were 1.0x1.0x0.6 m.
The horizontal displacements of the soil nail strengthen slopes are show in
Figure 3.11 (b) and 3.12 (b). The δ
values of the horizontal displacements were
much higher than the ones of a normal soil nail wall which usually has δ
value less
than 1/333 (FHAW 2003). The soil nail strengthen slope in Wyoming had the δ
values equal to 1.15% and the soil nail strengthen slope in Hong Kong had the δ
values equal to 0.8%. Also, the soil nail wall portion of the MSE/Soil Nail hybrid wall
in IH 410 had δ
equal to 1.18%.
The conclusions made for the instrumentation of the MSE /Soil Nail hybrid
wall are shown below:
1. High surcharge could cause large horizontal displacement of the soil nail wall in
its facing direction. The measured data showed that the ratio of horizontal
displacement versus height,
, of the soil nail wall may be greater than 1%. The
similar phenomenon was observed by Turner et al (2005) and Li et al (2008).
2. The grout of the soil nail was undergoing large cracking with high surcharge and
the tensile forces were mostly carried by the rebars, and the soil nails presented
very limited bending resistance.
3. The soil nail forces were significantly influenced by the surcharge. The bottom
row nails might have the maximum nail forces close to the first row nails.
Texas Tech University, Yiqing Wei, May 2013

65
(a) Typical cross section of MSE/Soil Nail hybrid wall Station 20+350
(b) Slope inclinometer reading of the MSE/Soil Nail hybrid wall
Figure 3.11 MSE/Soil Nail hybrid wall at U.S. Highway 26-89, Wyoming (Turner
and Jensen, 2005)
Texas Tech University, Yiqing Wei, May 2013

66
(a) Soil nail slope with surcharge
(b) Soil nail slope horizontal displacement under high surcharge
Figure 3.12 Loose fill soil nail slope under high surcharge in Hong Kong (Li et al.,
2008)
Texas Tech University, Yiqing Wei, May 2013

67
CHAPTER 4
2D FINITE ELEMENT ANALYSIS OF SOIL NAIL WALL
4.1 Introduction
Even though limit equilibrium methods (LEM) are capable of analyzing a soil
nail wall’s overall stability and the rupture and pullout capacities of the
reinforcements, they do not have the capability to model the wall’s deformation
behavior. The nail forces calculated by limit equilibrium methods do not present the
working forces since the theories are based on the extreme failure conditions.
On the other hand, finite element methods (FEM) can provide insight into the
deformation behavior and assess the overall performance of soil nail walls under
various conditions (geometry, soils’ properties, and reinforcements’ properties).
Soil materials are the heterogeneous their behavior is strongly influenced by
factors, such as: grain size, mineralogy, structure, pore water pressure, and initial
stress state etc. Finite element models require additional soil parameters, such as
Young’s modulus and Poisson’s ratio that are not considered in LEM, for describing
the stress-strain relationship of soils.
In order to characterize the stress-strain behavior of soil materials before and
after failure, a series of constitutive models have been developed. The most common
constitutive model used in soil mechanics is the Mohr-Coulomb model, also named
perfectly elastic-plastic behavior. Figure 4.1 shows the basic idea of a perfectly
elastic-plastic model for the finite element programs. The plasticity is associated with
the development of irreversible strain.
The full Mohr-Coulomb yield condition consists of six yield functions:
(4.1)
(4.2)
(4.3)
(4.4)
Texas Tech University, Yiqing Wei, May 2013

68
(4.5)
(4.6)
where:
are the principal effective stresses and arranged in algebraic
order:
; φ is the angle of friction; c is the cohesion.
The six yield functions together present a hexagonal cone in principal stress
space, shown in Figure 4.2.
Figure 4.1 Comparison of Mohr-Coulomb model and typical triaxial test results of
soil (Popa and Batali, 2010)
Figure 4.2 Mohr-Coulomb yield surface in principal stress when c=0 (PLAXIS
Material Manual)
Texas Tech University, Yiqing Wei, May 2013
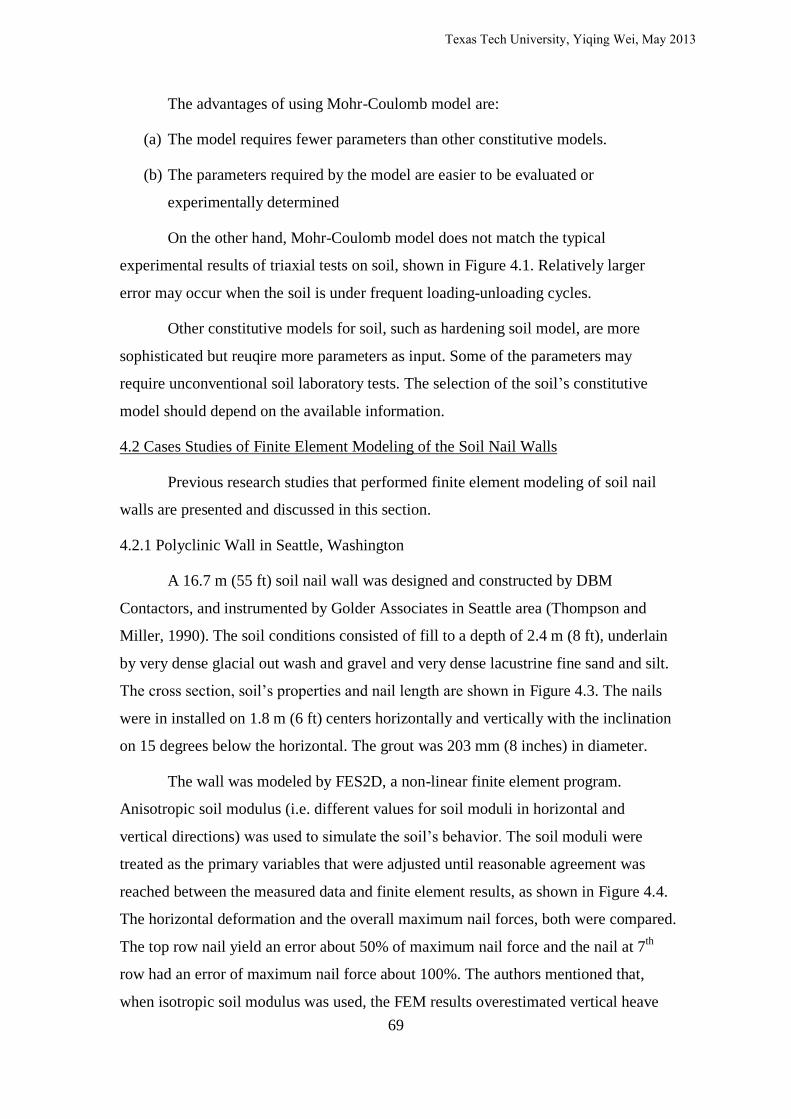
69
The advantages of using Mohr-Coulomb model are:
(a) The model requires fewer parameters than other constitutive models.
(b) The parameters required by the model are easier to be evaluated or
experimentally determined
On the other hand, Mohr-Coulomb model does not match the typical
experimental results of triaxial tests on soil, shown in Figure 4.1. Relatively larger
error may occur when the soil is under frequent loading-unloading cycles.
Other constitutive models for soil, such as hardening soil model, are more
sophisticated but reuqire more parameters as input. Some of the parameters may
require unconventional soil laboratory tests. The selection of the soil’s constitutive
model should depend on the available information.
4.2 Cases Studies of Finite Element Modeling of the Soil Nail Walls
Previous research studies that performed finite element modeling of soil nail
walls are presented and discussed in this section.
4.2.1 Polyclinic Wall in Seattle, Washington
A 16.7 m (55 ft) soil nail wall was designed and constructed by DBM
Contactors, and instrumented by Golder Associates in Seattle area (Thompson and
Miller, 1990). The soil conditions consisted of fill to a depth of 2.4 m (8 ft), underlain
by very dense glacial out wash and gravel and very dense lacustrine fine sand and silt.
The cross section, soil’s properties and nail length are shown in Figure 4.3. The nails
were in installed on 1.8 m (6 ft) centers horizontally and vertically with the inclination
on 15 degrees below the horizontal. The grout was 203 mm (8 inches) in diameter.
The wall was modeled by FES2D, a non-linear finite element program.
Anisotropic soil modulus (i.e. different values for soil moduli in horizontal and
vertical directions) was used to simulate the soil’s behavior. The soil moduli were
treated as the primary variables that were adjusted until reasonable agreement was
reached between the measured data and finite element results, as shown in Figure 4.4.
The horizontal deformation and the overall maximum nail forces, both were compared.
The top row nail yield an error about 50% of maximum nail force and the nail at 7th
row had an error of maximum nail force about 100%. The authors mentioned that,
when isotropic soil modulus was used, the FEM results overestimated vertical heave
Texas Tech University, Yiqing Wei, May 2013
70
response of the excavation and yielded a deformation pattern that did not match with
the measured deformations.
Texas Tech University, Yiqing Wei, May 2013
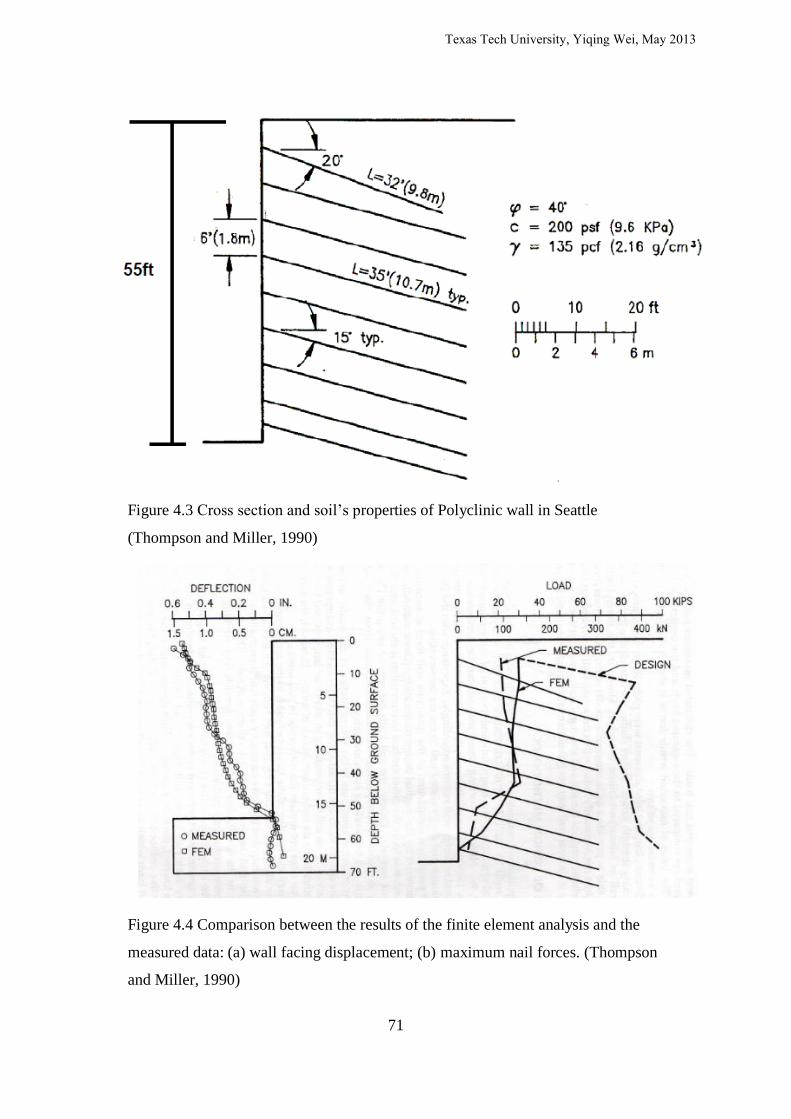
71
Figure 4.3 Cross section and soil’s properties of Polyclinic wall in Seattle
(Thompson and Miller, 1990)
Figure 4.4 Comparison between the results of the finite element analysis and the
measured data: (a) wall facing displacement; (b) maximum nail forces. (Thompson
and Miller, 1990)
Texas Tech University, Yiqing Wei, May 2013
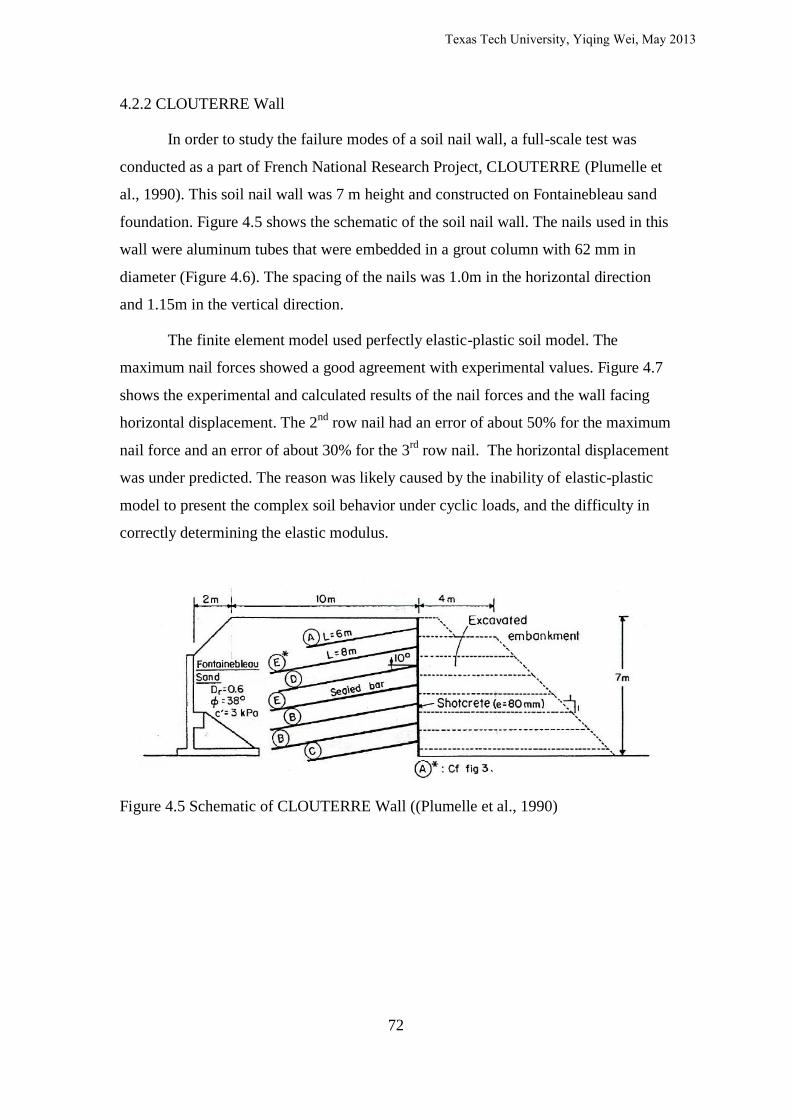
72
4.2.2 CLOUTERRE Wall
In order to study the failure modes of a soil nail wall, a full-scale test was
conducted as a part of French National Research Project, CLOUTERRE (Plumelle et
al., 1990). This soil nail wall was 7 m height and constructed on Fontainebleau sand
foundation. Figure 4.5 shows the schematic of the soil nail wall. The nails used in this
wall were aluminum tubes that were embedded in a grout column with 62 mm in
diameter (Figure 4.6). The spacing of the nails was 1.0m in the horizontal direction
and 1.15m in the vertical direction.
The finite element model used perfectly elastic-plastic soil model. The
maximum nail forces showed a good agreement with experimental values. Figure 4.7
shows the experimental and calculated results of the nail forces and the wall facing
horizontal displacement. The 2nd
row nail had an error of about 50% for the maximum
nail force and an error of about 30% for the 3rd
row nail. The horizontal displacement
was under predicted. The reason was likely caused by the inability of elastic-plastic
model to present the complex soil behavior under cyclic loads, and the difficulty in
correctly determining the elastic modulus.
Figure 4.5 Schematic of CLOUTERRE Wall ((Plumelle et al., 1990)
Texas Tech University, Yiqing Wei, May 2013

73
Figure 4.6 Section view of the grout bars of CLOUTERRE wall (Plumelle et al.,
1990)
(a)
(b)
Figure 4.7 Comparison between the results of the finite element analysis and the
measured data: (a) maximum nail forces; (b) wall facing displacement. (Plumelle et
al., 1990)
Texas Tech University, Yiqing Wei, May 2013
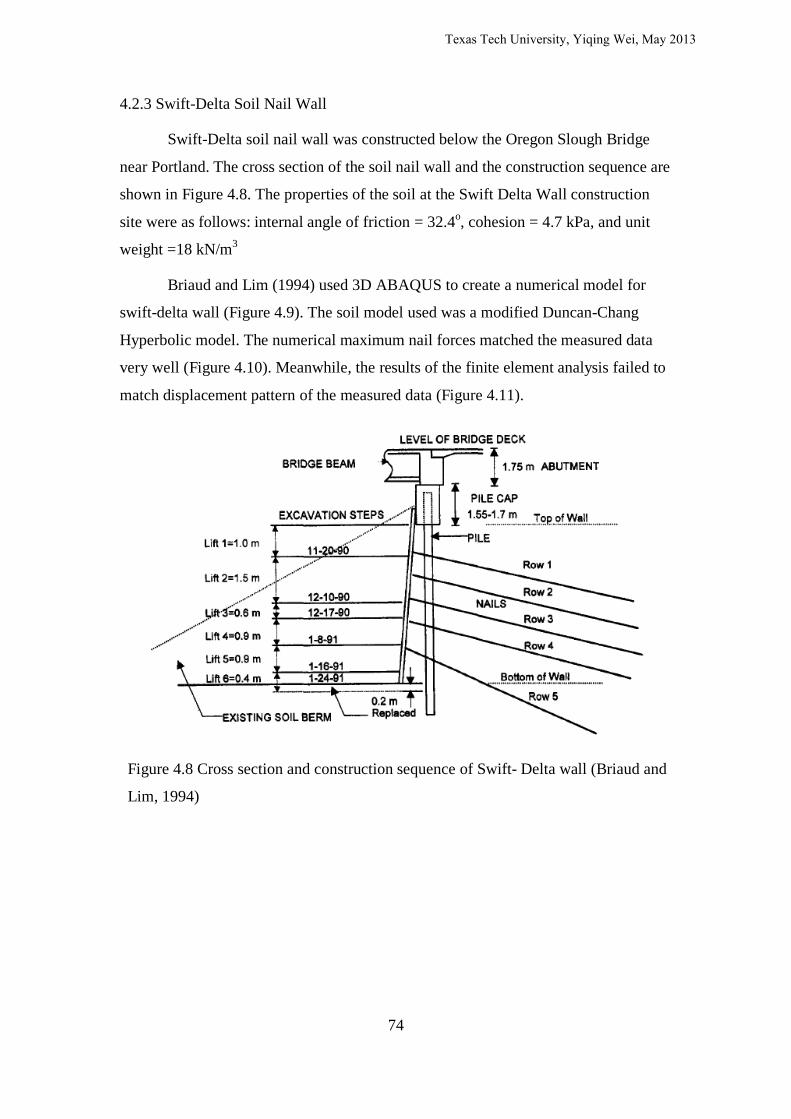
74
4.2.3 Swift-Delta Soil Nail Wall
Swift-Delta soil nail wall was constructed below the Oregon Slough Bridge
near Portland. The cross section of the soil nail wall and the construction sequence are
shown in Figure 4.8. The properties of the soil at the Swift Delta Wall construction
site were as follows: internal angle of friction = 32.4o, cohesion = 4.7 kPa, and unit
weight =18 kN/m3
Briaud and Lim (1994) used 3D ABAQUS to create a numerical model for
swift-delta wall (Figure 4.9). The soil model used was a modified Duncan-Chang
Hyperbolic model. The numerical maximum nail forces matched the measured data
very well (Figure 4.10). Meanwhile, the results of the finite element analysis failed to
match displacement pattern of the measured data (Figure 4.11).
Figure 4.8 Cross section and construction sequence of Swift- Delta wall (Briaud and
Lim, 1994)
Texas Tech University, Yiqing Wei, May 2013

75
Figure 4.9 Finite element model of Swift-Delta wall (Briaud and Lim, 1994)
Figure 4.10 Nail forces of Swift-Delta wall: (a) measured nail forces; (b) finite
element analysis results. (Briaud and Lim, 1994)
Texas Tech University, Yiqing Wei, May 2013

76
Figure 4.11 Horizontal displacement of Swift-Delta wall (Briaud and Lim, 1994)
Texas Tech University, Yiqing Wei, May 2013

77
4.2.4 Simulation of Soil Nail Structures Using PLAXIS 2D (Sivakumar Babu, G. L.,
Singh, V. P., 2009, 2010)
Babu and Singh (2009, 2010) presented findings from a study in which used
“plate” or “geogrid” elements for simulating soil nails in the finite element program
PLAXIS. Plate element has the capacity to resist bending moment, tensile forces, and
shear forces while geogrid element can resist only tensile forces. Two soil nail walls
of 10 m and 18 m vertical height were used in the above study (Figure 4.12). The
authors concluded that the plate element and geogrid element provide similar results
of global FOS and horizontal displacement of the walls. The maximum tensile forces
developed in the nails simulated using geogrid elements were 15% more in
comparison to that of the plate elements. The impact of the cohesion of the soil also
was presented by the authors with a 6.6 m height soil nail wall model. The maximum
nail forces had a slight effect due to change of cohesion (Figure 4.13). Meanwhile, the
horizontal displacement had increments of 100% when the cohesion was increased
from 10 kPa to 20 kPa (Figure 4.14).
Figure 4.12 Soil nail wall models (Babu and Singh, 2009)
Texas Tech University, Yiqing Wei, May 2013
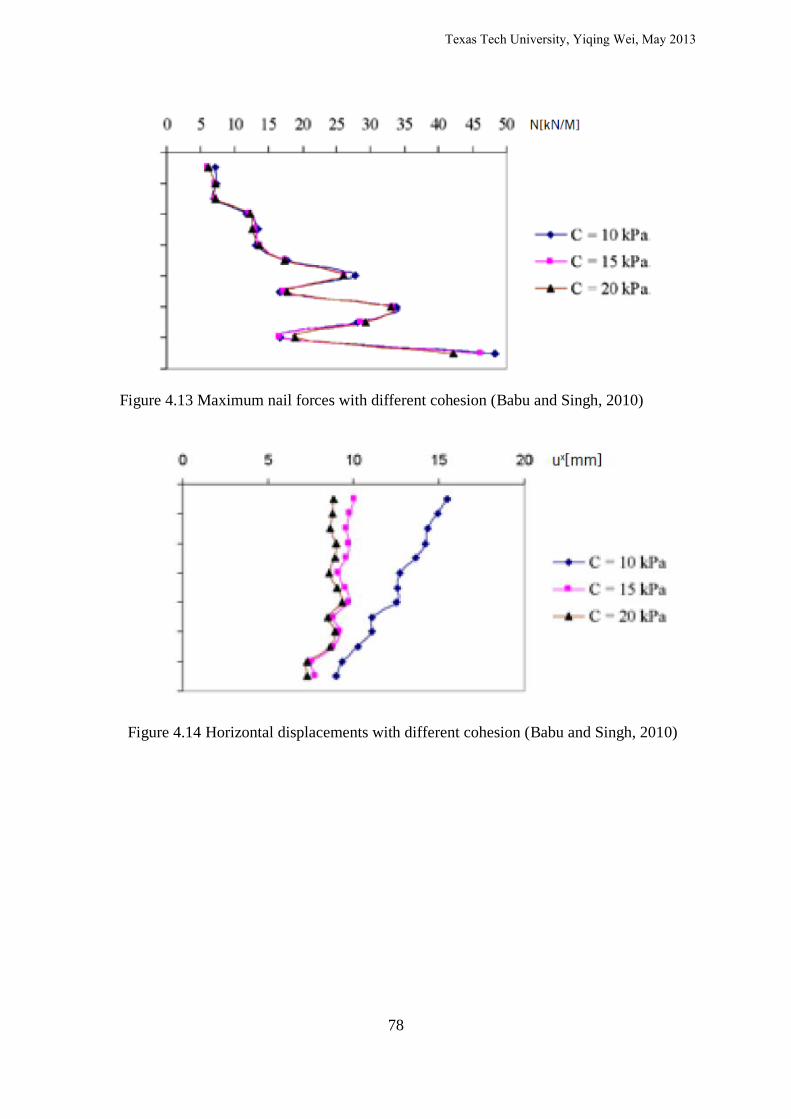
78
Figure 4.13 Maximum nail forces with different cohesion (Babu and Singh, 2010)
Figure 4.14 Horizontal displacements with different cohesion (Babu and Singh, 2010)
Texas Tech University, Yiqing Wei, May 2013

79
4.3 Reinforcement Pullout Behavior in Finite Element Program
Although the finite element simulation studies described in Section 4.1
provided important information on the overall behavior of soil nail walls, the
interaction at the soil-nail interface was not adequately considered. Wei and Chen
(2010) suggested that the technique may be more suitable for fill type reinforced soil
structures.
First of all, an approximation must be made in order to model 3D earth
reinforcements such as soil nails using 2D finite elements, as shown in Figure 4.15.
The grout is ignored in the numerical models since it would undergo cracking at large
strains and therefore would not be capable of carrying significant tensile forces at the
final stage. This phenomenon was observed in IH 410 MSE/soil nail wall
instrumentation project. Accordingly, the equivalent elastic modulus of soil nails,
EAeq, in 2D models, is defined as follows:
(4.7)
where EA is the elastic modulus of soil reinforcements and Sh is the horizontal
spacing of the soil reinforcements.
One important parameter in the 2D numerical model is the Unit pullout
capacity Quu,
(4.8)
where Rp is reinforcement pullout capacity, Qu is pullout capacity per unit length, Lp
is Pullout length.
Figure 4.15 Representation of 3D and 2D models (Zevgolis and Bourfeau, 2007)
Texas Tech University, Yiqing Wei, May 2013
80
The finite element program PLAXIS was used to investigate the reinforcement
pullout behaviors in the finite element models. The soil constitutive model used in this
analysis was the Mohr-Coulomb model. French National Project CLOUTERRE (1991)
concluded that the mobilized bending moment and shear force to be mobilized in the
nails occurred only if a shear zone developed in the soil nailed mass. The shear and
bending of the soil nails are also disregarded in FHWA soil nail wall design
guidelines (Lazarte et al, 2003). Therefore, the soil nails were simulated as geogrid
elements in the finite element model developed in this study. Geogrid elements in the
PLAXIS program can only resist tensile forces.
PLAXIS program allows the users to introduce an interface parameter, Rinter,
between the soil nails and soil. PLAXIS uses Rinter to calculate the strength parameters
corresponding to the interface elements based on the following the rules:
(4.9)
(4.10)
where ci and φi are the interface material properties, csoil and φsoil are the soil’s
properties. Rinter is less or equal to 1.0 in the program.
The PLAXIS is also capable calculating a global FOS for the models. The
global FOS provided by PLAXIS, , is defined as below:
φ
φ
(4.11)
where the soil strength parameters with the subscript “input” refer to the input
properties entered in the material sets and the parameters with the subscript “reduced”
refer to the reduced values used in the analysis.
The finite element models of the soil structure reach fully failure under the
reduced parameters. Unlike in the limit equilibrium models, the failure of the finite
element models may not relate to a failure surface.
A normal numerical pullout test model was created as shown in Figure 4.16.
The wall facing was supported by anchors and struts in order to minimize the effect of
wall facing displacement. There were the openings of 0.03 m (0.1 ft) on the facing for
the reinforcements. A series of reinforcements were 0.9 m (3 ft) in length and had a
vertical spacing of 1.2 m (4 ft). The soil and reinforcement parameters are shown in
Texas Tech University, Yiqing Wei, May 2013
81
Table 4.1. The numerical model simulated the construction stages are as indicated
below:
(a) The excavation of the vertical slope and installation of the facing, anchor,
and strut
(b) The installation of the reinforcements
(c) The pullout test of the reinforcements one by one
The displacements of the reinforcements under different forces and interfaces
were recorded. The pullout behaviors of the reinforcements are shown in Figure 4.17.
The unit pullout force, Puu, is defined as:
(4.12)
where, Pn is the force acted on the reinforcements of the numerical model, Lp is the
length of the reinforcement.
For the normal numerical pullout test model, the test results show that:
1. The reinforcement unit pullout capacity Quu and pullout displacement at
maximum pullout force, PDMPF are dependent on the soil’s properties and
the magnitude of the soil interface parameter, Rinter.
2. The reinforcement unit pullout capacity Quu and PDMPF linearly increase
with depth.
3. The reinforcement unit pullout capacity Quu and PDMPF do not behave the
same as the typical soil nail pullout test performance.
4. The curves of the pullout displacement match typical MSE wall metallic
reinforcement pullout test results
5. By varying the magnitude of the interface parameter, Rinter, it is possible to
achieve close agreement between the reinforcement unit pullout capacity Quu
and the MSE wall design value, as shown in Figure 4.18.
Texas Tech University, Yiqing Wei, May 2013

82
(a) (b)
Figure 4.16 (a) Normal Numerical Pullout test model, (b) Facing opening,
reinforcement and force of the model
Texas Tech University, Yiqing Wei, May 2013

83
Table 4.1 Materials properties for the normal numerical pullout test model
Material Unit Weight
(kN/m3)
Young’s
Modulus (MPa)
Poisson’s
Ratio
Angle of
friction (o)
Cohesion
(kPa)
Soil 19 20 0.3 30 2.5
(a) Soil’s properties
Facing EA
(kN/m)
EI (kN/m2/m) Poisson’s
Ratio
Weight
(kN/m2)
MSE Wall 120000 3140000 0.15 1.6
Reinforcement 73000
(b) Properties of the facing and reinforcement
Table 4.2 Interlayer’s properties according to different unit pullout capacity of the nails
Unit Pullout Capacity of the Soil Nail, Quu Interlayer’s Properties,Angle of friction φ= 10
Quu=24.5 kN/m/m (0.5 kip/ft/ft) c=34.3 kPa, E = 9.8 MPa, Rinter=0.3, ν=0.3
Quu=49 kN/m/m (1.0 kip/ft/ft) c=73.5 kPa, E = 24.5 MPa, Rinter=0.3, ν=0.3
Quu=73.5 kN/m/m (1.5 kip/ft/ft) c=102.9 kPa, E = 49 MPa, Rinter=0.3, ν=0.3
Quu=98 kN/m/m (2.0 kip/ft/ft) c=161.7 kPa, E = 73.5 MPa, Rinter=0.3, ν=0.3
Quu=122.5 kN/m/m (2.5 kip/ft/ft) c=191.1 kPa, E = 98 MPa, Rinter=0.3, ν=0.3
Texas Tech University, Yiqing Wei, May 2013

84
(a) Unit pullout resistance versus pullout displacement for Rinter=0.4
(b) Unit pullout resistance versus pullout displacement for Rinter=1.0
Figure 4.17 Pullout forces versus pullout displacement for the normal numerical
Pullout test model at various depths
0
20
40
60
80
100
0 5 10 15 20 25 30
Uin
t P
ullo
ut
Forc
es
Pu
u (
KN
/m/m
)
Displacement (mm)
Depth=4.9 m (16 ft)
Depth=3 m (10 ft)
Depth=1.2 m (4 ft)
0
20
40
60
80
100
120
0 5 10 15 20
Uin
t P
ullo
ut
Forc
es
Pu
u (
KN
/m/m
)
Displacement (mm)
Depth=4.9 m (16 ft)
Depth=3 m (10 ft)
Depth=1.2 m (4 ft)
Texas Tech University, Yiqing Wei, May 2013
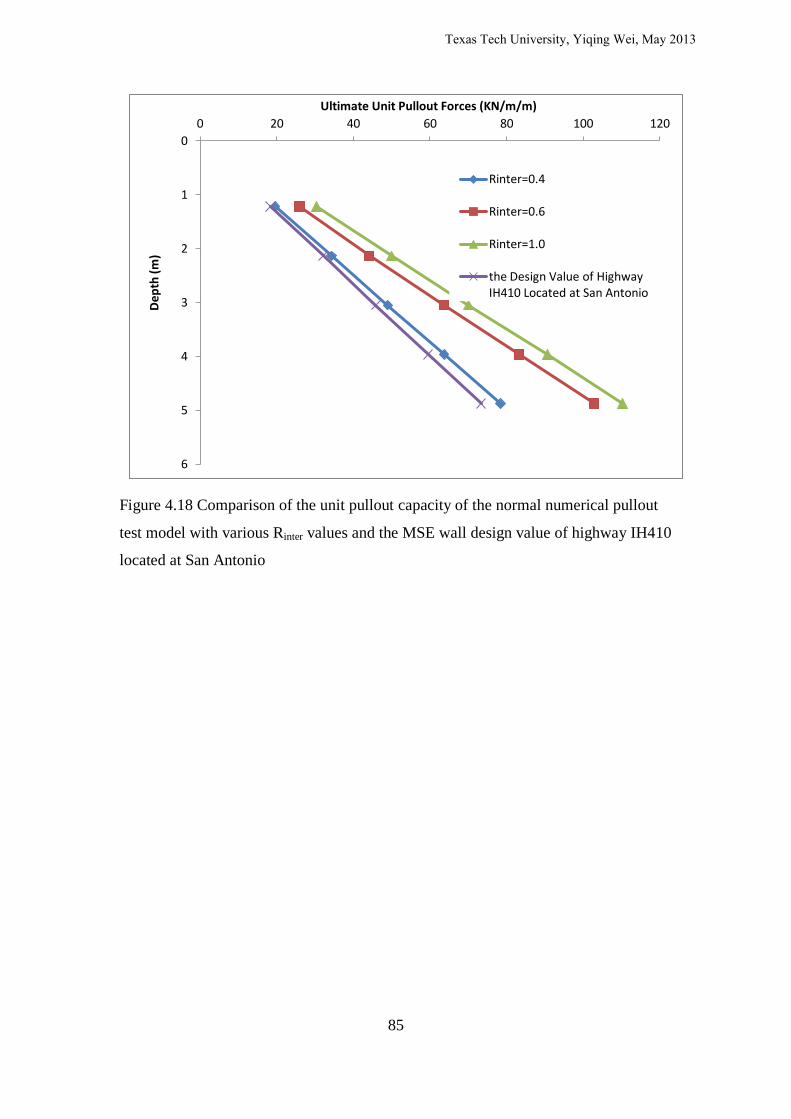
85
Figure 4.18 Comparison of the unit pullout capacity of the normal numerical pullout
test model with various Rinter values and the MSE wall design value of highway IH410
located at San Antonio
0
1
2
3
4
5
6
0 20 40 60 80 100 120
Dep
th (
m)
Ultimate Unit Pullout Forces (KN/m/m)
Rinter=0.4
Rinter=0.6
Rinter=1.0
the Design Value of Highway IH410 Located at San Antonio
Texas Tech University, Yiqing Wei, May 2013

86
4.4 Soil Nail Pullout Simulation by 2D PLAXIS
In this research, an innovative numerical model was introduced in order to
simulate the soil nail pullout behavior. The soil nail pullout test model is shown in
Figure 4.19 (a). The model was similar to the normal numerical pullout test model
except it had a 1:2 back slope. Also, an interlayer with thickness of 0.15 m was
introduced around every soil nail, as shown in Figure 4.19 (b). The interlayers were
defined as the soils with an angle of friction of 1o, but with different cohesions and
different Young’s moduli. The values of the cohesion and Young’s modulus were
depended on the desired unit pullout capacity Quu and PDMPF. Table 4.2 shows the
interlayer’s properties according to varied unit pullout capacity of the nails. Figure
4.20 shows the test results of the soil nail pullout test model. In most situations, the
interlayers were able to simulate the pullout performance of the soil nails. For some
cases, such as those shown in Figure 17 (c), (d), and (e), the Quu value were lower
than the expected value when the overburden was relatively small. However, even in
these instances, Puu/displacement ratios were the same when compared to others. Also
this problem was not critical for the hybrid wall since the soil nail wall portion had
high surcharge.
The use of interlayer partially changed the soil’s properties of the soil nail. For
the soil nail wall portion of the hybrid wall, the interlayer was only 15% of the soil.
After using the inter layer, the overall shear strength of the soil for the soil nail wall
portion was about 90% to 110% of the original one. Considering the soil nail wall
portion was only about 50% of the hybrid wall, the influence of this on the hybrid
wall was even smaller.
The advantages for introducing the interlayer for soil nail are:
(a) The soil nail unit pullout capacity Quu can be simulated and has little impact
on the soil normal stresses.
(b) Under high surcharge, all of the soil nails will yield the desired soil nail unit
pullout capacity Quu.
(c) The PDMPF of soil nails can be described by the model and has relatively
uniform values.
(d) The soil nail pullout performance is independent of the soil’s properties of
Texas Tech University, Yiqing Wei, May 2013

87
the retaining wall.
(e) The curves of the pullout displacement match the in situ test results from soil
nail pullout test.
Texas Tech University, Yiqing Wei, May 2013

88
(a)
(b)
Figure 4.19 (a) Soil nail pullout test model, (b) Interlayer and facing opening of the
soil nail.
Interlayer
0.15 m
Texas Tech University, Yiqing Wei, May 2013

89
(a) Unit pullout force versus displacement for the interlayer of Quu=24.5 kN/m/m
(b) Unit pullout force versus displacement for the interlayer of Quu=49 kN/m/m
0
5
10
15
20
25
30
0 2 4 6 8 10
Uin
t P
ullo
ut
Forc
es
Pu
u (
KN
/m/m
)
Displacement (mm)
Depth=0.45 m
Depth=3.65 m
Depth=7.9 m
0
10
20
30
40
50
60
0 2 4 6 8 10
Uin
t P
ullo
ut
Forc
es
Pu
u (
KN
/m/m
)
Displacement (mm)
Depth=0.45 m
Depth=3.65 m
Depth=7.9 m
Texas Tech University, Yiqing Wei, May 2013

90
(c) Unit pullout force versus displacement for the interlayer of Quu=73.5 kN/m/m
(d) Unit pullout force versus displacement for the interlayer of Quu=98kN/m/m
0
10
20
30
40
50
60
70
80
0 2 4 6 8 10
Uin
t P
ullo
ut
Forc
es
Pu
u (
KN
/m/m
)
Displacement (mm)
Depth=0.45 m
Depth=1.5 m
Depth=3.65 m
Depth=7.9 m
0
10
20
30
40
50
60
70
80
90
100
110
0 2 4 6 8 10
Uin
t P
ullo
ut
Forc
es
Pu
u (
KN
/m/m
)
Displacement (mm)
Depth=0.45 m
Depth=1.5 m
Depth=3.65 m
Depth=7.9 m
Texas Tech University, Yiqing Wei, May 2013
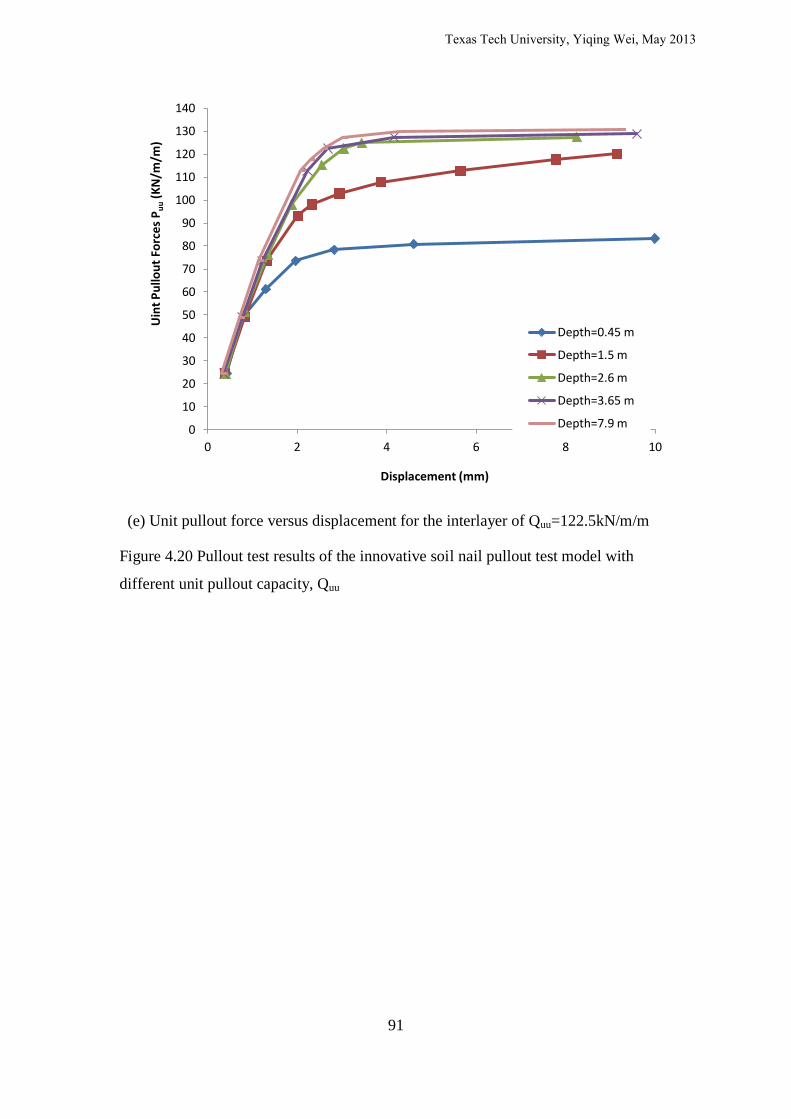
91
(e) Unit pullout force versus displacement for the interlayer of Quu=122.5kN/m/m
Figure 4.20 Pullout test results of the innovative soil nail pullout test model with
different unit pullout capacity, Quu
0
10
20
30
40
50
60
70
80
90
100
110
120
130
140
0 2 4 6 8 10
Uin
t P
ullo
ut
Forc
es
Pu
u (
KN
/m/m
)
Displacement (mm)
Depth=0.45 m
Depth=1.5 m
Depth=2.6 m
Depth=3.65 m
Depth=7.9 m
Texas Tech University, Yiqing Wei, May 2013

92
4.5 Simulation of the MSE/Soil Nail Hybrid Retaining Wall
According to results from the two numerical pullout test models described in
Section 4.2 and 4.3 above, an FEM models of the MSE/Soil Nail hybrid wall were
built for Wall 7 Section A and Section B, as shown in Figure 4.21. The models of the
construction stages for soil nail wall and MSE wall portions were simulated according
to Table 3.2. Each lift of the construction for the MSE wall was 0.3 m (1 foot) and had
24.5 kPa (500 psf) compaction load. The models did not simulate the construction of
the pavement since the pavement structures and construction loads were different
from the ones of the MSE wall. The interlayer was introduced in order to simulate the
soil nail pullout design value. The soil nail wall portion had an ultimate bond strength
of qu=49.2 kPa with the factor of safety equal to 2.0. Therefore, unit pullout capacity
is expressed as follows:
π
Since the Puu has the factor of safety equal to 2.0, the numerical models used:
Quu =23.2*2=46.4 ≈ 49 kN/m/m.
The materials’ properties of the MSE/ Soil Nail hybrid wall models are shown
in Table 4.3.
The comparison of the nail forces between measured data and the finite
element analysis is shown in Figure 4.22. As it is noted, the finite element analysis
provided results that agreed well with the measured data except for the third and
fourth row nails of Wall 7 Section B.
The soil nail wall facing horizontal displacements under different soil’s
Young’s modulus also were tested by the finite element models. The soil’s Young’s
modulus of the hybrid wall numerical models were 9.8 MPa (200 ksf), 14.7 MPa (300
ksf), 19.6 MPa (400 ksf), and 29.4 MPa (600 ksf). The soil nail wall facing horizontal
displacements of the measured data and finite element analysis results are shown in
Figure 4.23. The finite element results suggested that the wall facing displacement
was highly dependent of the value of the soil’s Young’s modulus. Though, the finite
element model did not match the pattern of the measured horizontal displacement, it
was able to provide the close value of the maximum horizontal displacement.
Texas Tech University, Yiqing Wei, May 2013
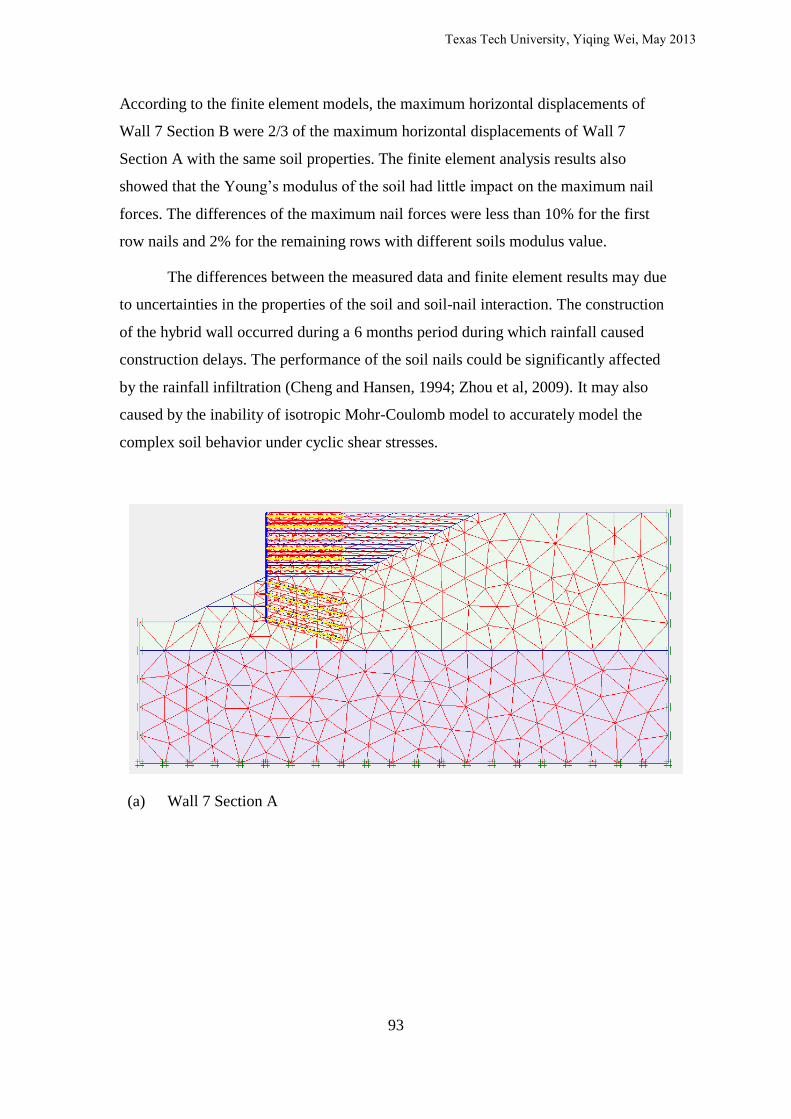
93
According to the finite element models, the maximum horizontal displacements of
Wall 7 Section B were 2/3 of the maximum horizontal displacements of Wall 7
Section A with the same soil properties. The finite element analysis results also
showed that the Young’s modulus of the soil had little impact on the maximum nail
forces. The differences of the maximum nail forces were less than 10% for the first
row nails and 2% for the remaining rows with different soils modulus value.
The differences between the measured data and finite element results may due
to uncertainties in the properties of the soil and soil-nail interaction. The construction
of the hybrid wall occurred during a 6 months period during which rainfall caused
construction delays. The performance of the soil nails could be significantly affected
by the rainfall infiltration (Cheng and Hansen, 1994; Zhou et al, 2009). It may also
caused by the inability of isotropic Mohr-Coulomb model to accurately model the
complex soil behavior under cyclic shear stresses.
(a) Wall 7 Section A
Texas Tech University, Yiqing Wei, May 2013
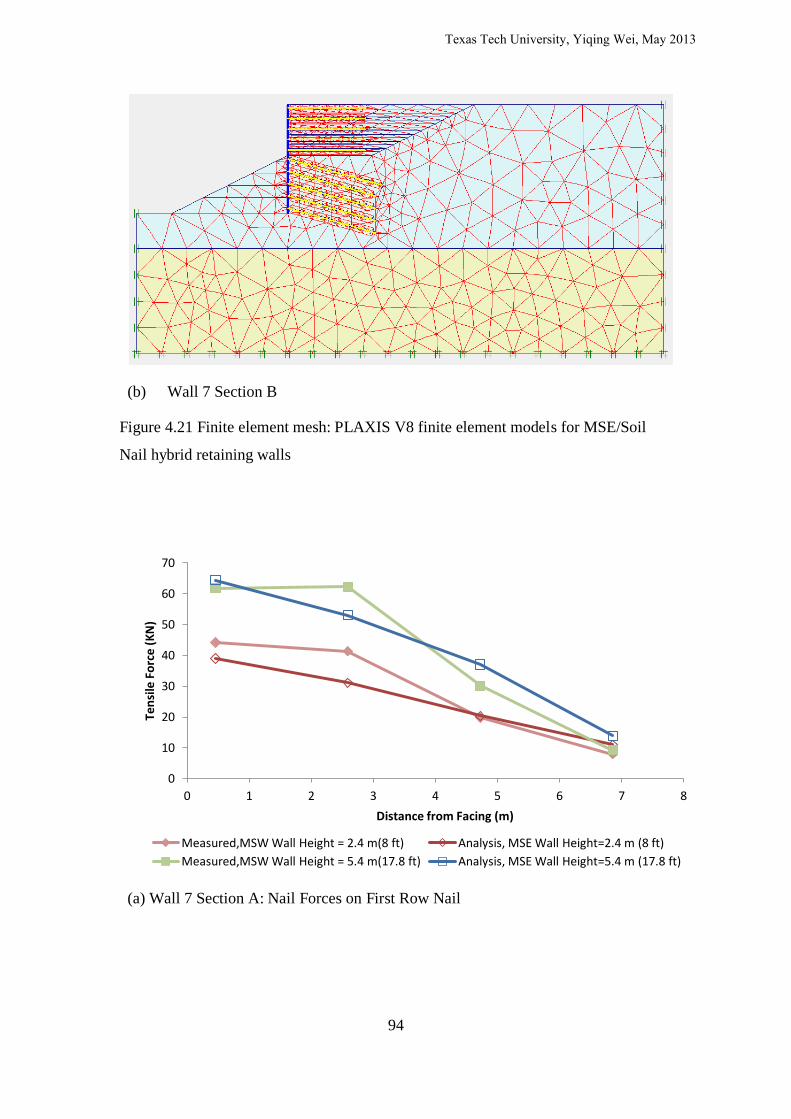
94
(b) Wall 7 Section B
Figure 4.21 Finite element mesh: PLAXIS V8 finite element models for MSE/Soil
Nail hybrid retaining walls
(a) Wall 7 Section A: Nail Forces on First Row Nail
0
10
20
30
40
50
60
70
0 1 2 3 4 5 6 7 8
Ten
sile
Fo
rce
(K
N)
Distance from Facing (m)
Measured,MSW Wall Height = 2.4 m(8 ft) Analysis, MSE Wall Height=2.4 m (8 ft)
Measured,MSW Wall Height = 5.4 m(17.8 ft) Analysis, MSE Wall Height=5.4 m (17.8 ft)
Texas Tech University, Yiqing Wei, May 2013
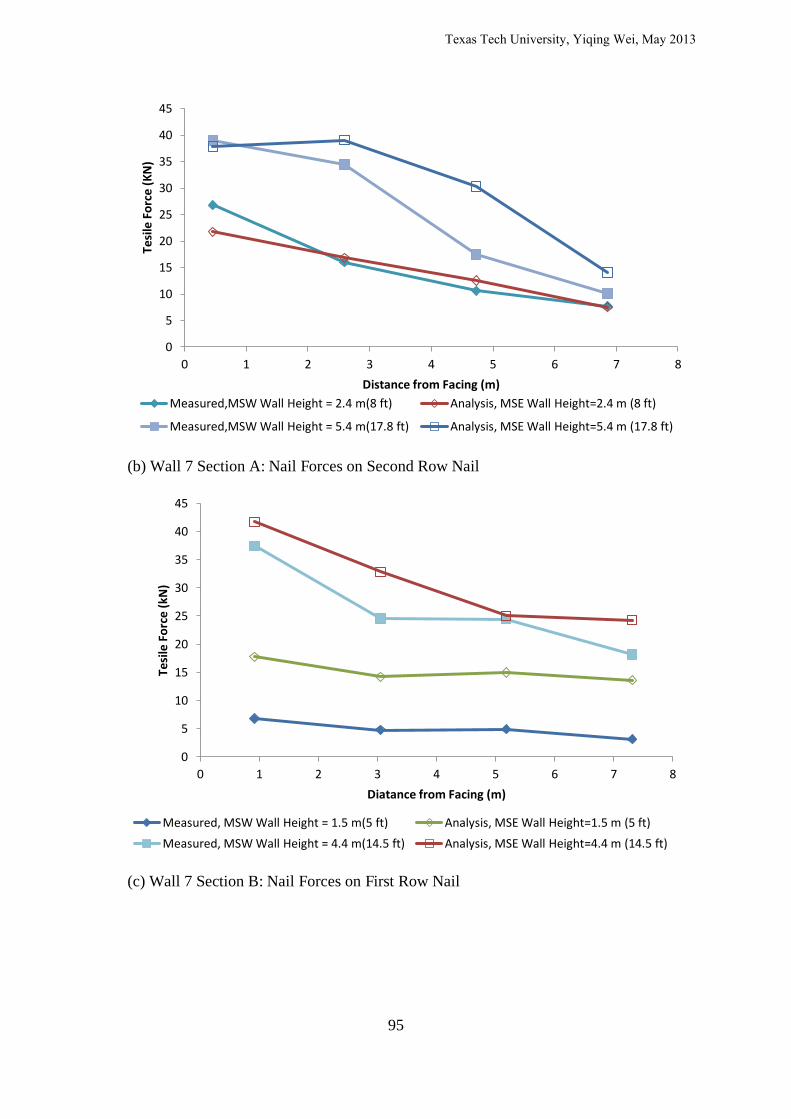
95
(b) Wall 7 Section A: Nail Forces on Second Row Nail
(c) Wall 7 Section B: Nail Forces on First Row Nail
0
5
10
15
20
25
30
35
40
45
0 1 2 3 4 5 6 7 8
Tesi
le F
orc
e (
KN
)
Distance from Facing (m)
Measured,MSW Wall Height = 2.4 m(8 ft) Analysis, MSE Wall Height=2.4 m (8 ft)
Measured,MSW Wall Height = 5.4 m(17.8 ft) Analysis, MSE Wall Height=5.4 m (17.8 ft)
0
5
10
15
20
25
30
35
40
45
0 1 2 3 4 5 6 7 8
Tesi
le F
orc
e (
kN)
Diatance from Facing (m)
Measured, MSW Wall Height = 1.5 m(5 ft) Analysis, MSE Wall Height=1.5 m (5 ft)
Measured, MSW Wall Height = 4.4 m(14.5 ft) Analysis, MSE Wall Height=4.4 m (14.5 ft)
Texas Tech University, Yiqing Wei, May 2013
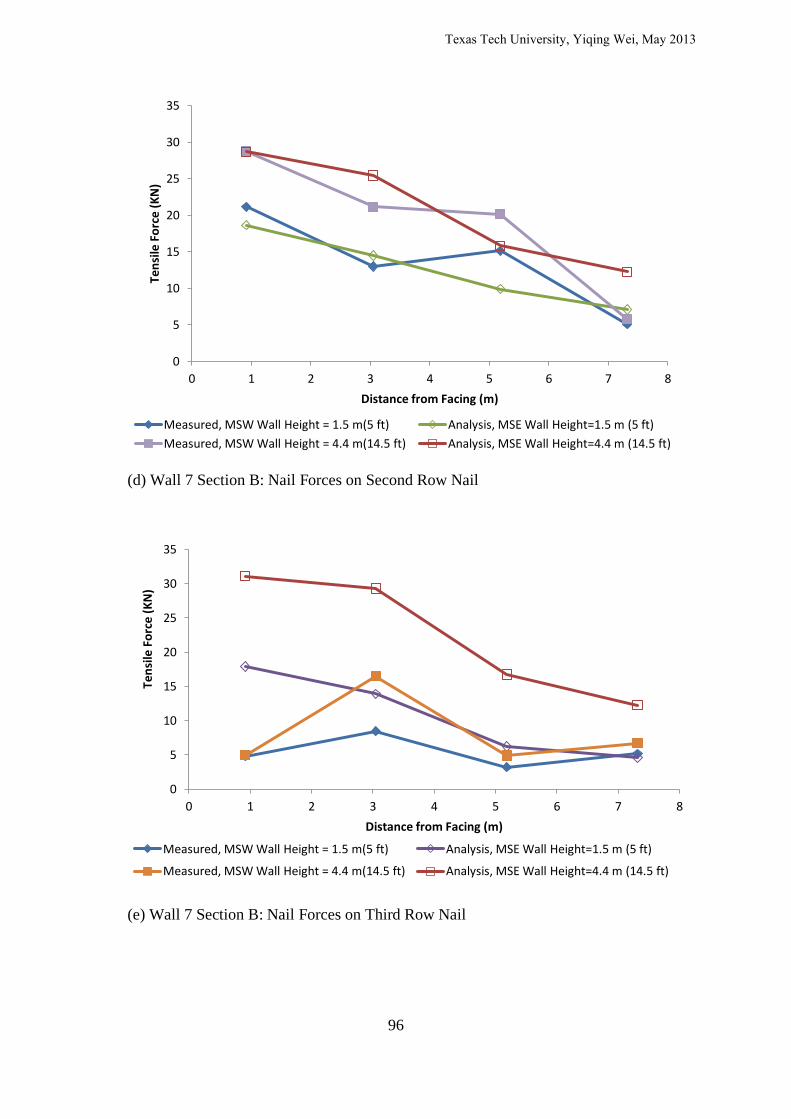
96
(d) Wall 7 Section B: Nail Forces on Second Row Nail
(e) Wall 7 Section B: Nail Forces on Third Row Nail
0
5
10
15
20
25
30
35
0 1 2 3 4 5 6 7 8
Ten
sile
Fo
rce
(K
N)
Distance from Facing (m)
Measured, MSW Wall Height = 1.5 m(5 ft) Analysis, MSE Wall Height=1.5 m (5 ft)
Measured, MSW Wall Height = 4.4 m(14.5 ft) Analysis, MSE Wall Height=4.4 m (14.5 ft)
0
5
10
15
20
25
30
35
0 1 2 3 4 5 6 7 8
Ten
sile
Fo
rce
(K
N)
Distance from Facing (m)
Measured, MSW Wall Height = 1.5 m(5 ft) Analysis, MSE Wall Height=1.5 m (5 ft)
Measured, MSW Wall Height = 4.4 m(14.5 ft) Analysis, MSE Wall Height=4.4 m (14.5 ft)
Texas Tech University, Yiqing Wei, May 2013

97
(f) Wall 7 Section B: Nail Forces on Fourth Row Nail
(g) Wall 7 Section B: Nail Forces on Bottom Row Nail
Figure 4.22 Comparison between measured nail forces and finite element analysis
results
0
5
10
15
20
25
30
0 1 2 3 4 5 6 7 8
Te
nsi
le F
orc
e (
KN
)
Distance from Facing (m)
Measured, MSW Wall Height = 1.5 m(5 ft) Analysis, MSE Wall Height=1.5 m (5 ft)
Measured, MSW Wall Height = 4.4 m(14.5 ft) Analysis, MSE Wall Height=4.4 m (14.5 ft)
-5
0
5
10
15
20
25
30
35
0 1 2 3 4 5 6 7 8
Ten
sile
Fo
rce
(K
N)
Distance from Facing (m)
Measured, MSW Wall Height = 1.5 m(5 ft) Analysis, MSE Wall Height=1.5 m (5 ft)
Measured, MSW Wall Height = 4.4 m(14.5 ft) Analysis, MSE Wall Height=4.4 m (14.5 ft)
Texas Tech University, Yiqing Wei, May 2013

98
Figure 4.23 Wall facing displacements of measured data and finite element analysis
results with varied Young’s modulus
0
1.5
3
4.5
0 10 20 30 40 50 60
Elev
atio
n o
f So
il N
ail W
all F
acin
g (m
)
Horizontal Displacement (mm)
Measured E=9.8 MPa E=14.7 Mpa
E=19.6 MPa E=29.4 MPa
Texas Tech University, Yiqing Wei, May 2013

99
Table 4.3 Material properties for the MSE/Soil Nail hybrid wall models
Soil Type Unit
Weight
(kN/m3)
Young’s
Modulus
(MPa)
Poisson’
s Ratio
Angle of
friction (o)
Cohesio
n (kPa)
Interfac
e, Rinter
EA
(kN/m)
Soil for MSE
wall
19 20 0.3 30 2.5 0.4 -
Soil for Soil
Nail Wall
19.5 20 0.3 35 25 - -
Interlayer for
Quu=49 kN/m/m
19.5 24.5 0.3 1 73.5 0.3 -
(a) Soil’s properties
Reinforcement and Facing EA (kN/m) EI (kN/m2/m) Poisson’s Ratio Weight
(kN/m2)
Soil Nail 38000 - - -
Reinforcement of the MSE Wall 73000 - - -
Soil Nail Wall facing 290000 630000 0.15 2
MSE Wall facing 120000 3140000 0.15 1.6
(b) Properties of the reinforcements and facing
Texas Tech University, Yiqing Wei, May 2013

100
CHAPTER 5
PARAMETRIC STUDY AND DEVELOPMENT OF EQUIVALENT
SURCHARGE
5.1 Parametric Study of MSE/Soil Nail Hybrid Wall
The previous chapter described the development of a PLAXIS based Finite
Element Model to simulate the behavior of the MSE/Soil Nail hybrid retaining wall
constructed in San Antonio. As explained in that chapter, this model had the
following unique features:
(a) The FE model simulates each stage of construction as it actually takes place
in the field
(b) The interaction between soil reinforcements and surrounding soil material is
modeled using interface elements so that FEM predicted pullout behavior
would match those observed during pullout testing of soil nails and MSE
reinforcements.
It was further demonstrated that the predictions made by the PLAXIS FE
model for tensile forces developed in soil nails were in good agreement with those
measured in the field. Accordingly, this FE model can now be considered as a reliable
predictor of how an actual MSE/Soil Nail hybrid wall would perform with respect to
tensile forces that develop in soil nails. Therefore, it can be used as the basis for
development of equivalent surcharge loads representing MSE walls constructed on
top of soil nail walls. The first step in the development of equivalent surcharge loads
involved a parametric study to determine which MSE wall parameters has the greatest
influence on the performance of the soil nail wall that supports it.
Such a parametric study was conducted by Alhabshi (2006) using PLAXIS. In
this study, the performance of the soil nail wall portion was assessed based on three
aspects of the soil nail wall performance: maximum horizontal displacement of the
soil nail wall facing δmax, global FOS calculated by PLAXIS, and the maximum
forces of the nails Fmax. Alhabshi suggested that the length of the reinforcements of
the MSE wall has very limited effect on the soil nail wall when it length is larger than
the height of the MSE wall.
Texas Tech University, Yiqing Wei, May 2013

101
Using the hybrid wall model of Wall 7 Section A, the same parametric study
was performed by the authors. The results obtained from this parametric study are as
follows:
1. When the angle of the friction of the soil in the MSE wall was varied from
30o to 40
o, δmax, FOS, and Fmax varied 13.4% , 10.2%, and 10.4%
respectively.
2. When the pullout capacity of the reinforcement for the MSE wall was
changed by varying the Rinter parameter from 0.4 to 1.0, as shown in Figure
4.18, then the corresponding changes in δmax , FOS, and Fmax were observed
to be 2.9% , 3.2%, and 4.9% respectively.
3. When the stiffness of the reinforcement for the MSE wall was changed by
varying its EA from 120,000 kN/m to 360,000 kN/m, then the corresponding
changes in δmax , FOS, and Fmax were less than 2%.
The results of the parametric study shows that the above-mentioned material
properties have little effect on the soil nail wall behavior and, therefore, can be
ignored for further research purposes of the MSE/Soil Nail hybrid wall.
5.2 Equivalent Loads of the MSE Wall Portion
FHWA Manual for Design & Construction Monitoring of Soil Nail Walls
(1996) suggested that the MSE wall portion of the hybrid retaining wall should be
treated as surcharge when designing the soil nail portion of the composite wall system.
Therefore, in the next step, parallel analyses were performed using two FE models,
one that simulates a hybrid wall system and another that simulates a soil nail wall
with vertical and horizontal surcharge. The objective of this analysis was to find the
magnitudes of the equivalent loads that would produce the same response in soil nail
wall performance as the actual MSE wall.
The estimation of the equivalent loads is based on the following assumption:
the MSE wall is treated as a rigid body and resists the lateral earth pressure behind the
MSE wall. Therefore, the equivalent loads should consist of two parts: vertical
distributed load and horizontal distributed load, as shown in Figure 5.1. The vertical
distributed load is caused primarily by the self-weight of the MSE system, the soils
behind the MSE wall, and the construction load. These vertical distributed loads may
be described by the following form of the equation:
Texas Tech University, Yiqing Wei, May 2013

102
(5.1)
where:
qv = the equivalent vertical distributed load
μv = the vertical distributed load coefficient, to be determined
M = the density of the soil of MSE Wall
hM =the height of the MSE wall
The horizontal distributed load is primarily caused by the lateral earth pressure
behind the MSE wall and the load transfer of that load to the soil nail portion at the
base of the MSE wall. Therefore, the length of the distributed load is equal to the
length of the reinforcement of the MSE wall. The horizontal distributed load may be
expressed as follows:
(5.2)
where:
qh = the equivalent horizontal distributed load
μh = the horizontal distributed load coefficient, to be determined
LM = the length of the reinforcement of the MSE wall
Figure 5.1 Expected forces imposed by MSE wall on soil nail wall (Alhabshi, 2006)
A series of PLAXIS finite element models of the MSE/ Soil Nail hybrid walls
and the corresponding soil nail walls under equivalent loads (Figure 5.2) were built in
Texas Tech University, Yiqing Wei, May 2013

103
order to identify the the equivalent distributed load coefficients, μv and μh, . The
following parameter combinations were considered in this analysis:
(a) MSE/SN Height Ratio equal to 1.35, 0.88, and 0.55
(b) The length of soil nail equal to 7.0 , 7.9 , and 8.8 m
(c) The angle of friction for the soil in the soil nail wall equal to 30o, 35
o, and
40o
(d) The Unit pullout capacity Quu equal to 24.5, 49, 73.5, 98.0, 122.5 kN/m/m
All of the hybrid wall models had the same height of 9.4 m (31 feet). The
length of the reinforcement in the MSE wall is 6.7 m (22 feet). A conservative
estimate of 30o was used as the angle of friction of the MSE wall backfill. Since the
soils in the hybrid walls were sandy soil, the relative small value of cohesion was used
for the soils. The cohesion of the soil in MSE wall was 2.5 kPa and 10 kPa for the soil
in the soil nail wall. The models had the same construction phases and construction
load as Wall 7 Section A and B, as shown in Table 3.2.
Under the equivalent loads, the soil nail portion in the hybrid wall and the soil
nail wall under the equivalent loads should have:
(a) Similar maximum nail forces
(b) Similar wall facing displacements
(c) Similar global FOS calculated by the PLAXIS program
(a) The total stresses of the hybrid wall
Texas Tech University, Yiqing Wei, May 2013
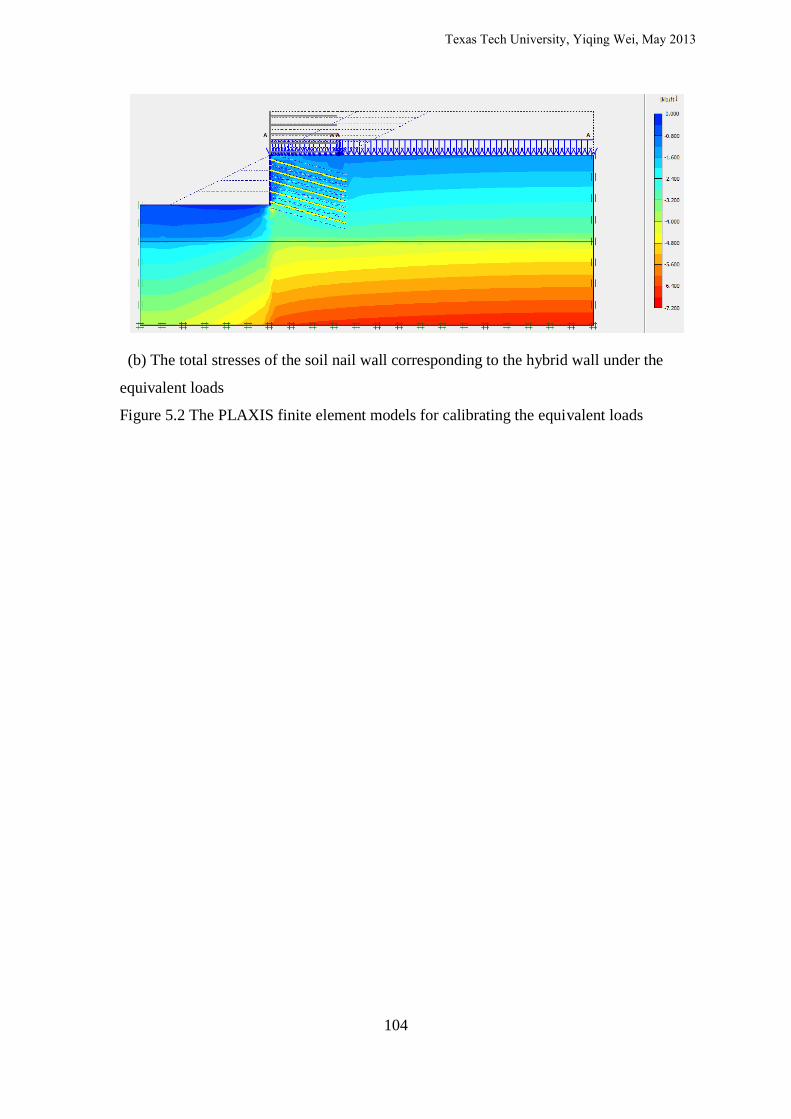
104
(b) The total stresses of the soil nail wall corresponding to the hybrid wall under the
equivalent loads
Figure 5.2 The PLAXIS finite element models for calibrating the equivalent loads
Texas Tech University, Yiqing Wei, May 2013

105
Table 5.1 Material properties for the MSE/Soil Nail hybrid wall models
Soil Type Unit Weight
(kN/m3)
Young’s
Modulus
(MPa)
Poisson’s
Ratio
Angle of
friction (o)
Cohesion
(kPa)
Interface,
Rinter
EA (kN/m)
Soil for MSE wall 19 20 0.3 30 2.5 0.4 -
Soil for Soil Nail
Wall
19.5 20 0.3 35 25 - -
Interlayer for
Quu=49 kN/m/m
19.5 24.5 0.3 1 73.5 0.3 -
(a) Soil’s properties
Reinforcement and Facing EA (kN/m) EI (kN/m2/m) Poisson’s Ratio Weight (kN/m2)
Soil Nail 38000 - - -
Reinforcement of the MSE Wall 73000 - - -
Soil Nail Wall facing 290000 630000 0.15 2
MSE Wall facing 120000 3140000 0.15 1.6
(b) The properties of the reinforcements and facing
Texas Tech University, Yiqing Wei, May 2013

106
5.3 Results and Discussion
Comparison of soil nail performance as predicted by the two FE models
described above revealed that a vertical distributed load coefficient, μv of 1.2 provided
the best overall agreement. The horizontal distributed load coefficient, μh, however,
varied depending on two main parameters, MSE/SN Height Ratio and Ultimate Soil
Nail Pullout Capacity. These effects are shown in Table 5.2. As it is noted, Quu equal
to 98 kN/m/m and 122.5 kN/m/m presented same μh values. The finite element hybrid
wall models failed when the angle of friction φ and unit pullout capacity Quu were low
and therefore μh values were not available for these situations.
Figure 5.3 shows the typical comparison of the facing displacements and the
maximum nail forces between the soil nail wall portion of the hybrid wall and the soil
nail wall, under equivalent load situation. The data show that the facing displacement
and global FOS will have a 7% to 15 % difference between the previous mentioned
cases. Meanwhile, the maximum nail forces in the bottom rows of soil nails wall
under equivalent loads are about 20% to 60% less than that of the of the hybrid wall.
The phenomenon suggests that the numerical models under equivalent surcharge
loads may underestimate the mobilized tensile forces of the bottom rows of nails.
Texas Tech University, Yiqing Wei, May 2013
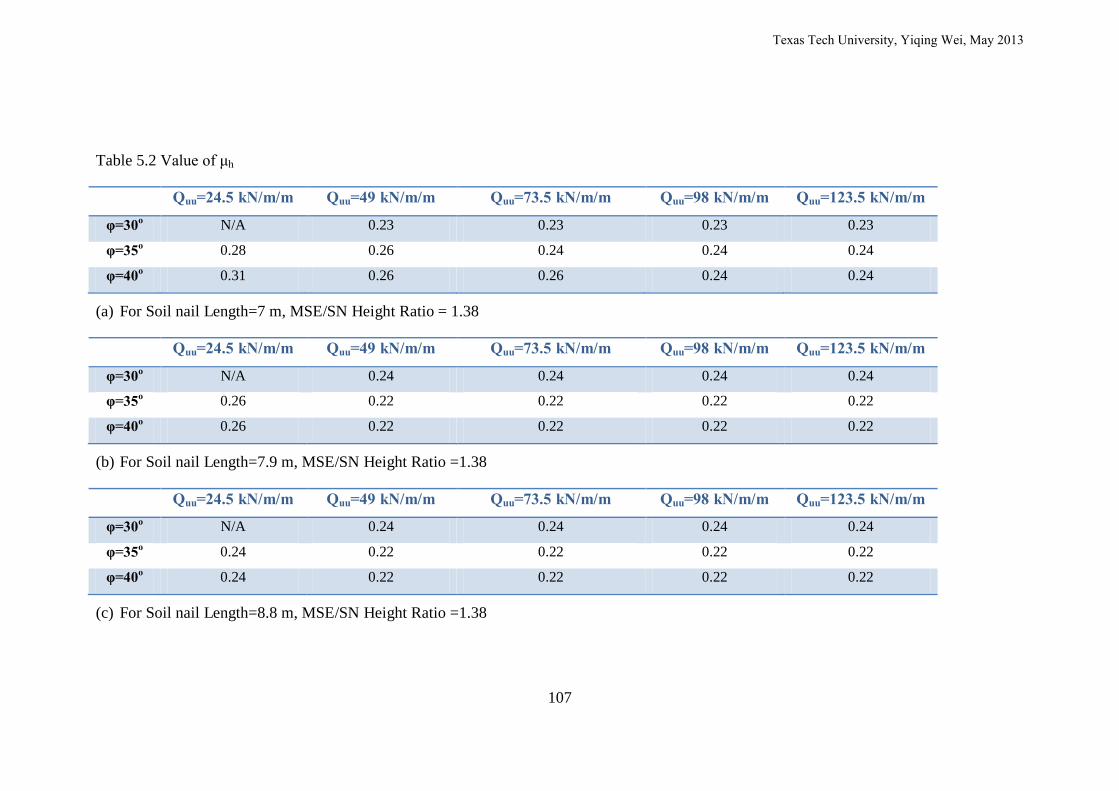
107
Table 5.2 Value of μh
Quu=24.5 kN/m/m Quu=49 kN/m/m Quu=73.5 kN/m/m Quu=98 kN/m/m Quu=123.5 kN/m/m
φ=30o N/A 0.23 0.23 0.23 0.23
φ=35o 0.28 0.26 0.24 0.24 0.24
φ=40o 0.31 0.26 0.26 0.24 0.24
(a) For Soil nail Length=7 m, MSE/SN Height Ratio = 1.38
Quu=24.5 kN/m/m Quu=49 kN/m/m Quu=73.5 kN/m/m Quu=98 kN/m/m Quu=123.5 kN/m/m
φ=30o N/A 0.24 0.24 0.24 0.24
φ=35o 0.26 0.22 0.22 0.22 0.22
φ=40o 0.26 0.22 0.22 0.22 0.22
(b) For Soil nail Length=7.9 m, MSE/SN Height Ratio =1.38
Quu=24.5 kN/m/m Quu=49 kN/m/m Quu=73.5 kN/m/m Quu=98 kN/m/m Quu=123.5 kN/m/m
φ=30o N/A 0.24 0.24 0.24 0.24
φ=35o 0.24 0.22 0.22 0.22 0.22
φ=40o 0.24 0.22 0.22 0.22 0.22
(c) For Soil nail Length=8.8 m, MSE/SN Height Ratio =1.38
Texas Tech University, Yiqing Wei, May 2013

108
Quu=24.5 kN/m/m Quu=49 kN/m/m Quu=73.5 kN/m/m Quu=98 kN/m/m Quu=123.5 kN/m/m
φ=30o N/A N/A 0.22 0.24 0.24
φ=35o N/A 0.24 0.24 0.24 0.24
φ=40o 0.35 0.28 0.24 0.24 0.24
(d) For Soil nail Length=7 m, MSE/SN Height Ratio = 0.88
Quu=24.5 kN/m/m Quu=49 kN/m/m Quu=73.5 kN/m/m Quu=98 kN/m/m Quu=123.5 kN/m/m
φ=30o N/A 0.23 0.23 0.23 0.23
φ=35o N/A 0.26 0.26 0.26 0.26
φ=40o 0.38 0.28 0.26 0.26 0.26
(e) For Soil nail Length=7.9 m, MSE/SN Height Ratio = 0.88
Quu=24.5 kN/m/m Quu=49 kN/m/m Quu=73.5 kN/m/m Quu=98 kN/m/m Quu=123.5 kN/m/m
φ=30o N/A 0.24 0.24 0.24 0.24
φ=35o 0.36 0.28 0.28 0.28 0.28
φ=40o 0.4 0.28 0.28 0.28 0.28
(f) For Soil nail Length=8.8 m, MSE/SN Height Ratio = 0.88
Texas Tech University, Yiqing Wei, May 2013

109
Quu=24.5 kN/m/m Quu=49 kN/m/m Quu=73.5 kN/m/m Quu=98 kN/m/m Quu=123.5 kN/m/m
φ=30o N/A 0.32 0.26 0.26 0.26
φ=35o N/A 0.32 0.26 0.26 0.26
φ=40o 0.52 0.32 0.26 0.26 0.26
(g) For Soil nail Length=7 m, MSE/SN Height Ratio =0.55
Quu=24.5 kN/m/m Quu=49 kN/m/m Quu=73.5 kN/m/m Quu=98 kN/m/m Quu=123.5 kN/m/m
φ=30o N/A 0.32 0.26 0.26 0.26
φ=35o N/A 0.34 0.28 0.28 0.28
φ=40o 0.52 0.4 0.32 0.32 0.32
(h) For Soil nail Length=7.9 m, MSE/SN Height Ratio = 0.55
Quu=24.5 kN/m/m Quu=49 kN/m/m Quu=73.5 kN/m/m Quu=98 kN/m/m Quu=123.5 kN/m/m
φ=30o N/A 0.32 0.26 0.26 0.26
φ=35o 0.52 0.36 0.3 0.3 0.3
φ=40o 0.56 0.42 0.36 0.36 0.36
(i) For Soil nail Length=8.8 m, MSE/SN Height Ratio = 0.55
Texas Tech University, Yiqing Wei, May 2013

110
(a) Comparison of the facing displacement
(b) Comparison of the maximum nail forces
Figure 5.3 Comparison of the results between the hybrid wall model and soil nail wall
model under equivalent loads.
Figure 5.4 shows the relationship between the equivalent horizontal equivalent
distributed load coefficient and MSE/SN Height Ratio for Quu equal to 24.5, 49.0, and
122.5 kN/m/m. The μh values showed the regression according to the Quu. The
regression shad close relationship the values presented by the situation which the soil
nail wall portions had the angle of friction equal to 35o and the nail length equal to 7.9
0
2
4
6
8
10
12
14
0.5 0.7 0.9 1.1 1.3 1.5
Ele
vati
on
(ft
)
Displacement (in)
For Phi=35, P=1.5 kip/ft/ft
Hybrid Wall Displacement
Equivalent SN Wall
0
5
10
15
0 5 10 15
Ele
vati
on
(ft
)
Nail Forces (kips)
For Phi=35, P=1.5 kip/ft/ft
Hybrid Wall Nail Forces
Equivalent SN Wall
Texas Tech University, Yiqing Wei, May 2013

111
m. Therefore, the authors tested the equivalent loads for the soil nail wall that had
cohesion equal to 25 kPa, angle of friction equal to 35o, and soil nail length equal to
7.9 m. By changing the cohesion from 10 kPa to 25 kPa, the μv still is equal to1.2,
while μh increased about 8%.
Figure 5.4 Relationship between the equivalent horizontal distributed load coefficient,
μh and MSE/SN Height Ratio
The contour lines of the total displacement obtained for three different
MSE/SN Height Ratios are shown in Figure 5.5. The potential failure surfaces of the
models can be identified by the density of the contour lines. The highest density of the
contour lines represents the potential failure surface. This failure surface consists of
two separate portions as seen in the figures. The first portion of the failure surface,
which is in the soil nail wall, passes through the soil nails. The second portion of the
failure surface, which is in the MSE wall, passes behind the reinforcements. When the
MES/SN Height Ratio is 0.55, the model had two potential failure surfaces. One of
the potential surfaces was similar to the other hybrid wall and the second one was
similar to the potential surface of the traditional soil nail wall.
y = 0.3375x-0.754 R² = 0.9495
y = 0.2614x-0.421 R² = 0.757
y = 0.2463x-0.224 R² = 0.5308
0
0.1
0.2
0.3
0.4
0.5
0.6
0 0.2 0.4 0.6 0.8 1 1.2 1.4 1.6
μh
MSE /SN Height Ratio
Quu=24.5 KN/m/m Quu=49 KN/m/m
Quu=122.5 KN/m/m Power (Quu=24.5 KN/m/m)
Power (Quu=49 KN/m/m) Power (Quu=122.5 KN/m/m)
Texas Tech University, Yiqing Wei, May 2013

112
(a) MSE/SN Height Ratio equal to 1.35
(b) MSE/SN Height Ratio equal to 0.88
Potential failure surface
Potential failure surface
Texas Tech University, Yiqing Wei, May 2013
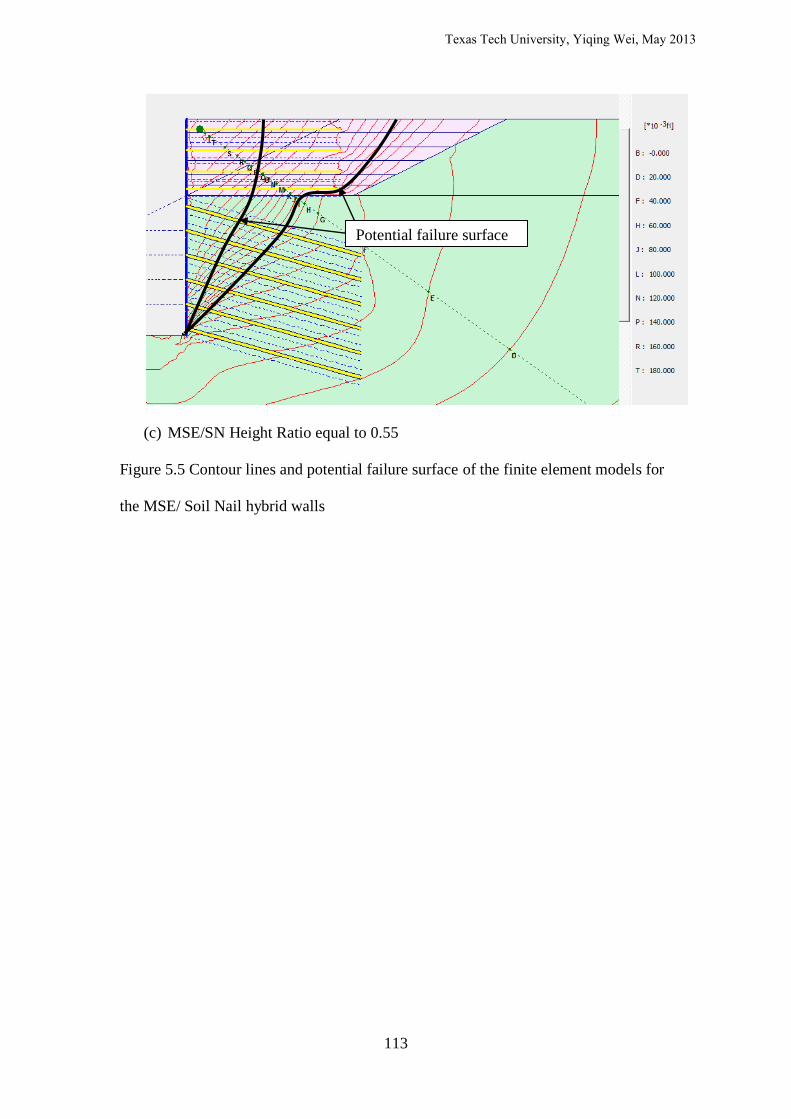
113
(c) MSE/SN Height Ratio equal to 0.55
Figure 5.5 Contour lines and potential failure surface of the finite element models for
the MSE/ Soil Nail hybrid walls
Potential failure surface
Texas Tech University, Yiqing Wei, May 2013
114
CHAPTER 6
SUMMARY AND CONCLUSIONS
This research was undertaken with the primary objective of developing a
simplified design method that can be used in the routine design of hybrid retaining
walls constructed in side hill situations. This type of hybrid wall uses a soil nail wall
in the cut section and an MSE wall in the fill section. Therefore, the loads imposed
by the upper MSE wall must be appropriately taken into account when designing the
lower soil nail wall. The FHWA design manual for soil nail walls (FHWA, 1996)
suggests that the upper wall may be considered as an equivalent surcharge load with
vertical and horizontal components when evaluating the soil nail wall for global factor
of safety. However, the design manual does not provide specific guidelines regarding
the magnitudes of these surcharge loads. The primary goal of this research study was
to determine load coefficients associated with these vertical and horizontal surcharge
loads.
The methodology used in this research relied on data collected from two
separate sections of an MSE/Soil Nail hybrid wall constructed at highway IH 410 and
Ingram Road, in San Antonio, Texas. The soil nails installed on these wall sections
were provided with strain gages so that tensile forces that develop on these soil nails
could be monitored during wall construction. Strain gages were mounted on the steel
tendon as well as within the grout column. The strain gage readings in the grout
showed that much of grout had suffered cracking under tensile loads. This observation
implied that the tensile forces on the soil nail were resisted only by the steel tendon
The strain gages mounted on diametrically opposite sides confirmed that
reinforcements did not develop significant bending resistance. Furthermore, the
strain gage results indicated that the nail forces increased significantly due to the
construction of the MSE walls. Unlike the normal soil nail walls, in the MSE/Soil
Nail hybrid walls even the soil nails in the bottom row carried significant tensile
forces. The surcharge also caused large horizontal displacement in the soil nail wall.
Similar to strengthened soil nail slopes under high surcharge, the soil nail wall portion
of the hybrid wall experienced horizontal displacements larger than 1% of the soil nail
wall height.
Texas Tech University, Yiqing Wei, May 2013
115
To develop guidelines for equivalent surcharge load coefficients, a series of
innovative 2D finite element models of the hybrid wall were built. These 2D finite
element models were capable of simulating the pullout behavior of the reinforcements
for soil nail wall and the MSE wall. The equivalent distributed loads are evaluated
based on three soil nail wall performance criteria: maximum horizontal displacement
of the soil nail wall facing δmax, global FOS calculated by PLAXIS , and the
maximum soil nail forces Fmax.
Based on the findings from finite element analysis, two equations (Equation
5.1, and 5.2) were developed to calculate the equivalent vertical and horizontal
distributed loads representing the MSE wall portion.
The vertical distributed load coefficient, μv recommeded is 1.2, whereas the
horizontal distributed load coefficient μh varied within the range 0.23 to 0.4 according
to the relationships presented in Figure 5.4.
Limit equilibrium program GOLDNAIL was used to evaluate the global FOS
of IH 410 Wall 7 Section A and B for three different cases (Figure 6.1):
(a) Case 1: Based on the equivalent loads analysis in the chapter 5, the soil nail
walls had the equivalent horizontal and vertical distributed loads calculated using
Equations 5.1and 5.2.
(b) Case 2: The equivalent loads considered only the self weight of the MSE wall
and the active lateral pressure behind the MSE. Therefore, the value of the
vertical and distributed loads can be described as:
(6.1)
(6.2)
where, Ka is the coefficient of active lateral pressure.
(c) Case 3: The hybrid walls were treated as full height soil nail walls.
The nail forces and global FOS are shown in Table 6.1 and 6.2.
The results show that the global FOS in Case 1 is smaller than other cases and
the nail forces are greater than other cases. It means the global FOS is over-estimated
and the nail forces are under- estimated in Case 2 and 3.
Texas Tech University, Yiqing Wei, May 2013

116
The finite element models show that the potential failure surfaces of the
MSE/Soil Nail hybrid walls would normally consist of two separate portions, as
shown in Figure 5.5. The first portion of the failure surface is in the soil nail wall and
passes through the soil nails. The second portion is in the MSE wall and behind the
reinforcements. When the MSE/SN Height Ratio is 0.55, the model has two potential
failure surfaces. One of the potential surfaces is similar to the other hybrid wall and
the other one is similar to the potential surface of the traditional soil nail wall. These
phenomena suggest that the traditional limit equilibrium design methods that use a
circular or bilinear failure surface may not be suitable for the design of MSE/Soil Nail
hybrid wall when it is analyzed as one unit.
(a) Case 1 and case 2
(b) Case 3
Figure 6.1 Soil nail walls’ models for the design by GOLDNAIL program
Texas Tech University, Yiqing Wei, May 2013
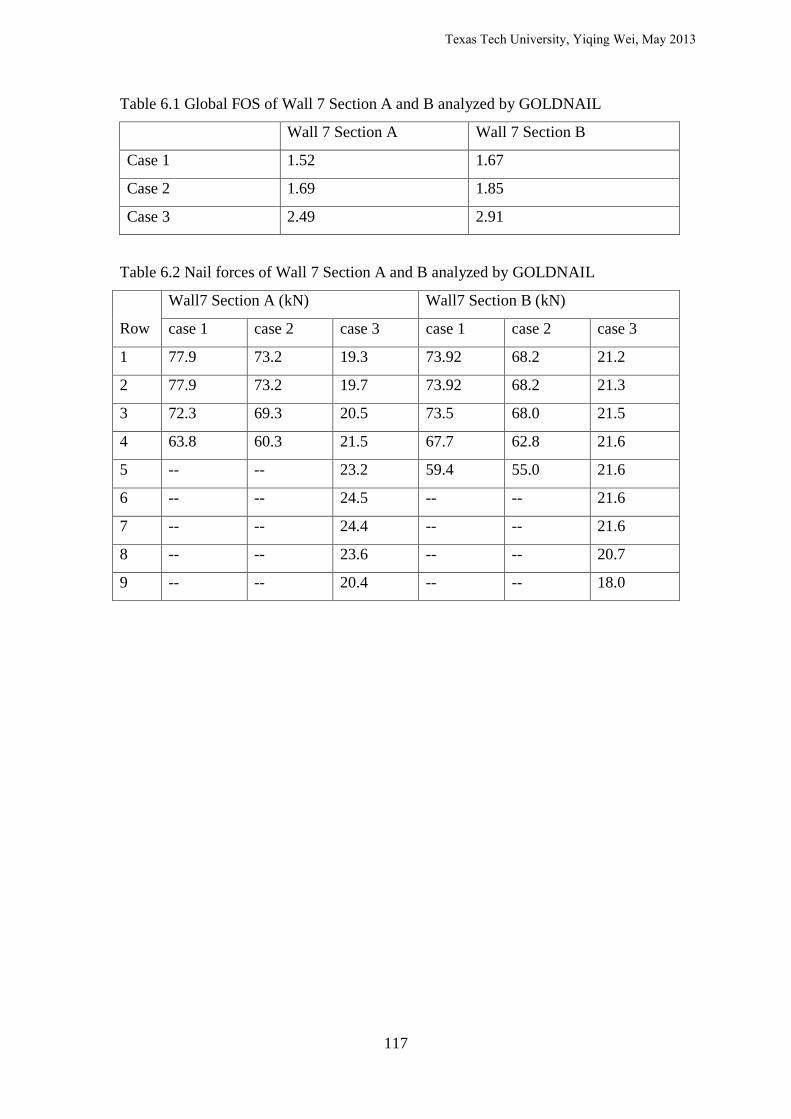
117
Table 6.1 Global FOS of Wall 7 Section A and B analyzed by GOLDNAIL
Wall 7 Section A Wall 7 Section B
Case 1 1.52 1.67
Case 2 1.69 1.85
Case 3 2.49 2.91
Table 6.2 Nail forces of Wall 7 Section A and B analyzed by GOLDNAIL
Row
Wall7 Section A (kN) Wall7 Section B (kN)
case 1 case 2 case 3 case 1 case 2 case 3
1 77.9 73.2 19.3 73.92 68.2 21.2
2 77.9 73.2 19.7 73.92 68.2 21.3
3 72.3 69.3 20.5 73.5 68.0 21.5
4 63.8 60.3 21.5 67.7 62.8 21.6
5 -- -- 23.2 59.4 55.0 21.6
6 -- -- 24.5 -- -- 21.6
7 -- -- 24.4 -- -- 21.6
8 -- -- 23.6 -- -- 20.7
9 -- -- 20.4 -- -- 18.0
Texas Tech University, Yiqing Wei, May 2013

118
REFERENCES Alhabshi, A. (2006). “Finite Element Based Design Procedures for MES/Soil-Nail
Hybrid Retaining Wall Systems.” PhD Dissertation, Department of Civil and
Environmental Engineering, Texas Tech University.
Babu, G. L. S., Vikas Pratap Singh, V. P. (2007), “Stabilization of Vertical Cut Using
Soil Nailing.” PLAXIS Bulletin, Issue 22, pp 6-9.
Babu, G. L. S., Vikas Pratap Singh, V. P. (2009), “Simulation of Soil Nail Structures
Using PLAXIS 2D.” PLAXIS Bulletin, Sprin Issue 2007, pp 16-21.
Banerjee, S., Finney, A., Wentworth, T. and Bahiradhan, M. (1998). “Evaluation of
Design Methodologies for Soil-Nailed Walls, Volume 3: An Evaluation of Soil-
Nailing Analysis Packages.” FHWA Publication, No. WA-RD 371.1.
Barrows, R. J. (1994). “Two Dimensional Finite Element Modeling of Swift Delta
Soil Nail Wall by ABAQUS,” Master Thesis Submitted to the Portland State
University.
Bonita, G. A., Tarquinio, F. S., Wagner, L. (2006). “Soil Nail Support of Eexcavation
System for the Embassy of the Peoples Republic of China in the United States”
DFI’s 31st Annual Conference on Deep Foundations , Washington, D.C. October,
2006.
Byrne, R. J., Cotton, D., Porterfield, J., Wolschlag, C., and Ueblacker, G. (1998).
“Manual for Design and Construction Monitoring of Soil Nail Walls.” Report
FHWA-SA-96-69R, Federal Highway Administration, Washington, D.C..
CALTRANS (1991). “A User’s Manual for the SNAIL Program, Version 5.01 –
Updated PC Version,” California Department of Transportation, Division of New
Technology, Material and Research, Office of Geotechnical Engineering,
Sacramento, California.
Carlstedt, E. (2008). “Soil-Structure Interaction for Bridges with Backwalls, FE-
Analysis Using PLAXIS” TRITA-BKN master thesis 270, ISSN1103-4297, ISRN
KTN/BKN/Ex—270—SE, Sweden.
Cheng, S. S., Hansen, L. A. (1994). “Design, Construction and Performance of A Soil
Nailed Wall in Puerto Rico.” Proceeding of the ASCE National Convention,
Geotechincal Special Publication No. 42. Atlanta, USA, 9-13 Oct., pp 1-16.
Texas Tech University, Yiqing Wei, May 2013
119
Coduto, D. P. (2001). “Foundation Design Principles and Practices.” Part E, Prentice
Hall, INC, pp: 735-842.
Duncan, J. M., Wright, S. G. (2005). “Soil Strength and Slope Stability.” Chapter 6,
John Wiley & Sons, INC, pp 55-102.
Elias, V., Christopher, B. R., and Berg, R. (2001). “Mechanically Stabilized Earth
Walls and Reinforced Soil Slopes Design and Construction Guidelines.”
Publication FHWA-NHI-00-043, Federal Highway Administration, Washington,
D.C..
FHWA (1993). “French National Research Project CLOUTERRE, 1991-
Recomandations CLOUTERRE 1991,” (English Translation) Soil Nailing
Recommendations, Publication FHWA-SA-93-026, Federal Highway
Administration, Washington, D.C..
Golder (1993). “GOLDNAIL Soil Nailing Design Program,” Golder Associates,
Seattle,Washington.
Hong, Y. S., Chen, R. H., Wu, C. S. (2001). “Numerical Modeling of Nailed Soil
Walls in Vertical Excavation.” Proceeding of the Eighth International Conference
on Civil & Structural Engineering Computing, B. H. V. Topping, ed., Civil-Comp
Press, Stirling, Scotland, pp 261-262.
Jayawickrama, P. W., Wood, T., Wei, Y., Alhabshi, A. (2009) “Design Procedures for
MSE/Soil Nail Hybrid Wall Systems,” Final Research Report (draft) Submitted to Texas
Department of Transportation, Report No. FHWA/TX-08-0-5205-1, September 2009.
Juran, I., Baudrand, G., Farrag, K., and Elias, V. (1990). “Kinematical Limit Analysis
for Design of Nailed Structures,” Journal of Geotechnical Engineering, American
Society of Civil Engineers, Vol. 116, No. 1, pp. 54-72.
Juran, I., Elias, V. (1991). “Ground Anchors and Soil Nails in Retaining Structures.”
Chap. 26 in Foundation engineering handbook, 2nd Ed., H.Y. Fang, ed., Van
Nostrand Reinhold, New York, 868–905.
Juran, I., Farrag, K., Elias, V. (1990). “Design of Soil Nailed Retaining Structures.”
Geotechnical Special Publication No. 25, American Society of Civil Engineers,
New York, pp. 644-659.
Krabbenhoft, S., Andersen, A., Damkilde, L. (2008). “The tensile Capacity of bored
Texas Tech University, Yiqing Wei, May 2013

120
piles in frictional soils.” Can. Geotech. J. 45:1715-1722.
Lazarte, C. A., Elias, V., Espinoza, R. D. and Sabatini, P. J. (2003). “Geotechnical
Engineering Circular No.7: Soil Nail Walls,” Report No. FHWA0-IF-017,
Washington, D.C..
Li, J., Tham, L. G., Junaideen, S. M., Yue, Z. Q., Lee, C. F. (2008). “Loose Fill Slope
Stabilization with Soil Nails: Full-scale Test.”, Journal of Geotechnical and
Geoenvironmental Engineering, American Society of Civil Engineers, Vol.134, No.
3, pp. 277-288.
Liew, S. S. (2005) “Soil Nailing for Slope Strenthening” Geotechnical engineering
2005, 30-31 May 2005,
http://www.gnpgeo.com.my/download/publication/L2005_02.pdf
Long, J. H., Sieczkowski Jr, W. F., Chow, E., Cording, E. J. (1990). “Stability
Analysis for Soil Nailed Walls.” Geotechnical Special Publication No. 25,
American Society of Civil Engineers, New York, pp. 676-691.
Mahmood, T. (2009). “Failure Analysis of A Mechanically Stabilized Earth (MSE)
Wall Using Finite Element Program” Master thesis, The University of Texas at
Arlington.
Mitchell, J. and Villet, W. (1987). “Reinforcement of Earth Slopes and Embankments,”
NCHRP Report 290, Transportation Research Board, Washington, DC., pp: 258-
269
Morrison K., Harrison, F., Collin, J., Dodds, A. and Arndt, B. (2006). “Shored
Mechanically Stabilized Earth (SMSE) Wall Systems Design Guidelines.” Report
No. FHWA-CFL/TD-06-001, FHWA, Lakewood, CO.
Ooi, P. H. (2006). “Rapid Pullout Test of Soil Nail.” PhD Dissertation, Department of
Civil Engineering, National University of Singapore.
PLAXIS 2D Reference Manual (2011).
Plumelle, C., Schlosser, F., Oclage, P., and Knochenmus, G. (1990). “French
National Research Project on Soil Nailing: CLOUTERRE.” Geotechnical Special
Publication No. 25, American Society of Civil Engineers, New York, pp. 660-675.
Popa, H., Batali, L. (2010). “Using Finite Element Method in Geotechnical Design.
Texas Tech University, Yiqing Wei, May 2013

121
Soil Constitutive Laws and Calibration of the Parameter. Retaining Wall Case
Study.” WSEAS Transactions on Applied and Theoretical Mechanics, Issue 3,
Volume 5, pp. 177-186.
Sabatini, P. J., Elias, V., Schmertmann, G. R., Bonaparte, R. (1997). “Geotechnical
Engineering Circular No. 2, Earth Retaining Systems” Report FHWA-SA-96-038,
Federal Highway Administration, Washington, D.C..
Sakr, C. T. (1991) “Soil Nailing of A Bridge Fill Embankment” Construction Report,
Federal Highway Administration Experimental Features, OR 89-07, Oregon
Department of Transportation, Highway Division, Bridge Section, August 1991.
Senanayake, A. I. M. J. (2011). “Pullout Resistance of Mechanically Stabilized Earth
Reinforcements Embedded in Sandy Backfill and Measured in A Large Scale Test
System.” Master Thesis, Department of Civil and Environmental Engineering,
Texas Tech University.
Shen, C., Bang, S. and Herrman, M. (1981). “Ground Movement Analysis of Earth
Support System,” Journal of Geotechnical Engineering, ASC, Vol. 118, pp 1609-
1624.
Shen, C., Herrman, M., Romstad, K. M., Bang, S., Kim, Y. S., DeNatale, J. S. (1981).
“An in situ earth reinforcement lateral support system” Report No.81-03,
Department of Civil Engineering, University of California, Davis.
Shen, C., Bang, S., Herrman, M., Kulchin, L., DeNatale, J. S. (1981). “Field
Measurement of an Earth Support System,” Journal of Geotechnical Engineering
Dvision, Vol. 107, Issue 12. pp 1625-1642.
Stocker, F. and Riedinger G. (1990). “The Bearing Behaviour of Nailed Retaining
Structures,” Geotechnical Special Publication, ASCE, No 25, New York, pp. 612-
628.
Su, L. J., Chan, T. C. F., Yin, J. H., Shiu, Y. K., Chiu, S. L. (2008). “Influence of
Overburden Pressure on Soil-Nail Pullout Resistance in a Compacted fill.”, Journal
of Geotechnical and Geoenvironmental Engineering, American Society of Civil
Engineers, Vol.134, No. 9, pp. 1339-1347.
Tan, S. A., Cheang, W., Ooi, P., Tan, D. (2004). “Finite Element Analysis of a Soil
Nailed Slope-Some Recent Experience” 3rd Asian Regional Conference on
Texas Tech University, Yiqing Wei, May 2013

122
Geosynthetics : Now and Future of Geosynthetics in Civil Engineering, Seoul,
Korea, June 2004.
Tan, S. A., Ooi, P. H., Park, T. S., Cheang, W. L. (2008) “Rapid Pullout Test of Soil
Nail.”, Journal of Geotechnical and Geoenvironmental Engineering, American
Society of Civil Engineers, Vol.134, No. 9, pp. 1327-1338.
Terezinha Cassia de Brito, Pereira,A. R., Parizzi, M. G., Humberto Alves da Silva
(2010) “Bioengineering Techniques Associated with Soil Nailing Applied to Slope
Stabilization and Erosion Control” Natural Hazards Review, Vol. 11, No. 2, May
2010, pp: 43-48.
Terzaghi, k., Peck,R. B., Mesri, G. (1996). “Soil Mechanics in Engineering Practice
(third edition).” Chapter 8, John Wiley & Sons, INC, page 327-344.
Texas Department of Transportation (2006). “Geotechnical Manal”.
Thompson, S.R. and I.R. Miller (1990). “Design, Construction and Performance of a
SoilNailed Wall in Seattle, Washington.” Geotechnical Special Publication No. 25,
American Society of Civil Engineers, New York, pp. 629-643.
Turner, J., Jensen, W. (2005). “Landslide Stabilization Using Soil Nail and
MechanicallyStabilized Earth Walls: Case Study.” Journal of Geotechnical and
Geoenvironmental Engineering, ASCE, 131(2), 141-150.
Wei, W. B., Cheng, Y. M. (2010). “Soil Nailed Slope by Strength Reduction and Limit
Equilibrium Methods.” Computers and Goetechnics, 37(2010) 602-618.
Yin, J. h., Zhou, W. H. (2009). “Influence of Grouting Pressure and Overburden
Stress on the Interface Resistance of a Soil Nail.” Journal of Geotechnical and
Geoenvironmental Engineering, American Society of Civil Engineers, Vol.135, No.
9, pp. 1198-1208.
Zevgolis, I., Bourdeau, P. (2007). “Mechanically Stabilized Earth Wall Abutments for
Bridge Support.” FHWA/IN/JYRP-2006/38.
Zhang, L. L., Zhang, L. M., Tang, W. H., Hon, M. (2009). “Uncertainties of field
pullout resistance of soil nails.” Journal of Geotechnical and Geoenvironmental
Engineering, American Society of Civil Engineers, Vol.135, No. 7, pp. 966-972.
Texas Tech University, Yiqing Wei, May 2013
123
Zhou, Y. D., Cheuk, C. Y., Tham, L. G. (2009). “Numerical Modeling of Soil Nails in
Loose Fill Slope under Surcharge Loading” Computers and Goetechnics, 36(2009)
837-850.
Texas Tech University, Yiqing Wei, May 2013