cooperative innovation: the case of team marketing...
TRANSCRIPT

Cooperative Innovation: The Case of Team Marketing Alliance
Brian Briggeman * [email protected]
Aleksan Shanoyan †
Ben Harmon ‡ Kelsey Harris
Jacob Haverkamp Russell Heier Jordan Holder Cassie Kniebel Kellie Jackson
Trevor Lutz Tyler Warta
Alisa Wendelburg
Selected Paper prepared for presentation at the Agricultural & Applied Economics Association’s 2013 AAEA & CAES Joint Annual Meeting, Washington, DC, August 4-6,
2013.
Copyright 2013 by Briggeman, Shanoyan, Harmon, Harris, Haverkamp, Heier, Holder, Kniebel, Jackson, Lutz, Warta, Wendelburg. All rights reserved. Readers may make verbatim copies of this document for non-commercial purposes by any means, provided that this copyright notice appears on all such copies.
* Associate Professor, Director of Arthur Capper Cooperative Center, Department of Agricultural Economics Kansas State University † Assistant Professor, Department of Agricultural Economics, Kansas State University ‡ Undergraduate students, Department of Agricultural Economics Kansas State University

2
Cooperative Innovation: The Case of Team Marketing Alliance
Introduction
Volatility in agricultural commodity markets has surged. Before 2008,
commodity price movements were fairly calm. However since 2008, commodity prices
have skyrocketed to historic highs and then, in a short amount of time, experienced a
sharp correction. These steep changes were especially acute in 2008, when the price of
corn, for example, shot up from $5 per bushel in January, 2008 to nearly $8 per bushel in
June, 2008, and then plummeted to below $4 per bushel in December, 2008. Many other
steep price swings in other commodities and crop inputs were also experienced, which
was largely driven by the U.S. and global economic and financial crisis. Volatility
persists in commodity markets and is likely not going away anytime soon because of
numerous developments like globalization of the agri-food system, exceptionally low
interest rates and extreme weather events. As a result, U.S. farmers will likely have to
continue to manage this volatility.
Risk analysis and risk management are now receiving growing attention of
participants at every stage of the agri-food supply chain. This is particularly true for
farmers of various sizes who now must add yet another skill to their repertoire, risk
management. While certainly some farmers have an excellent grasp of how to manage
their operation’s risk, there are likely plenty who need help in this area of rising
importance.

3
Some farmer cooperatives have recognized the rising demand for these risk
management services. The ability of cooperatives to mitigate farmers’ risks becomes an
increasingly important aspect of the overall value proposition to their farmer-owners.
Consequently, progressive cooperatives are in continuous search for new and unique
ways to assist producers in decision making through offering innovative tools and
services in risk analysis and risk management.
Coupling rising volatility and the opportunity to provide risk management
services to farmers encapsulates the ultimate question this case study aims to answer;
how can farmer cooperatives enhance value to today’s producer? It illustrates the
experience of a group of Kansas cooperatives who joined their efforts in developing risk
management tools and services for their members through a company they wholly own
together, Team Marketing Alliance, LLC (TMA). TMA helps farmer-members of the
four cooperatives mitigate output price risk, lock in input purchases and ensure
revenue coverage through crop insurance. The primary objectives of this case study
are: i) to discuss the evolution of TMA from creation to its current status today, ii) to
examine the benefits to farmers and to the four co-ops that wholly own TMA, and iii) to
identify and discuss strategic issues facing TMA today and in the future. The case is
based on the information from interviews and personal interactions with TMA
management as well as TMA reports, presentations, and web-based material.
Background and overview of TMA

4
In the mid-1990s managers of four cooperatives in central Kansas joined around
the concept of centralized grain marketing for gaining efficiencies through economies of
scope and scale. At the start, the cooperatives found that the concept of marketing grain
as a team proved beneficial to partner co-ops. Through sharing labor and knowledge in
working together, these cooperatives enjoyed increased selling power, operational
efficiencies, diversification of territory, increased patron opportunities due to larger
size, risk management programs, and patronage. With the success and growth of this
concept, a separate company, wholly owned by the four cooperatives, was formed
called Team Marketing Alliance, LLC (TMA).
Today, TMA is wholly owned by four central Kansas cooperatives: Farmers
Cooperative Elevator Co, Halstead, KS., Cooperative Grain and Supply, Hillsboro, KS.,
Mid-Kansas Cooperative (majority owner), Moundridge, KS., and Farmers Cooperative,
Nickerson, KS. Together, these cooperatives own 52 country elevator facilities for the
handling of bulk grain and one ethanol plant. TMA is exclusively utilized as a
consolidated grain marketing division for these four local cooperatives handling all
merchandising, logistics, accounting and e-commerce through its office. Farm-
marketing programs are initiated by a team of origination specialists on TMA staff. All
profits earned by TMA during the year are passed back to the four local cooperatives at
year-end. During the year a put thru charge is paid to each elevator for bushels handled
along with storage. A four-member board made up of the local cooperative managers
makes all board decisions. An associate board member is also assigned from each
cooperative's own board.

5
TMA mission statement is: "To provide a grain marketing service that links the Producer to
the End User giving the greatest value to both parties."
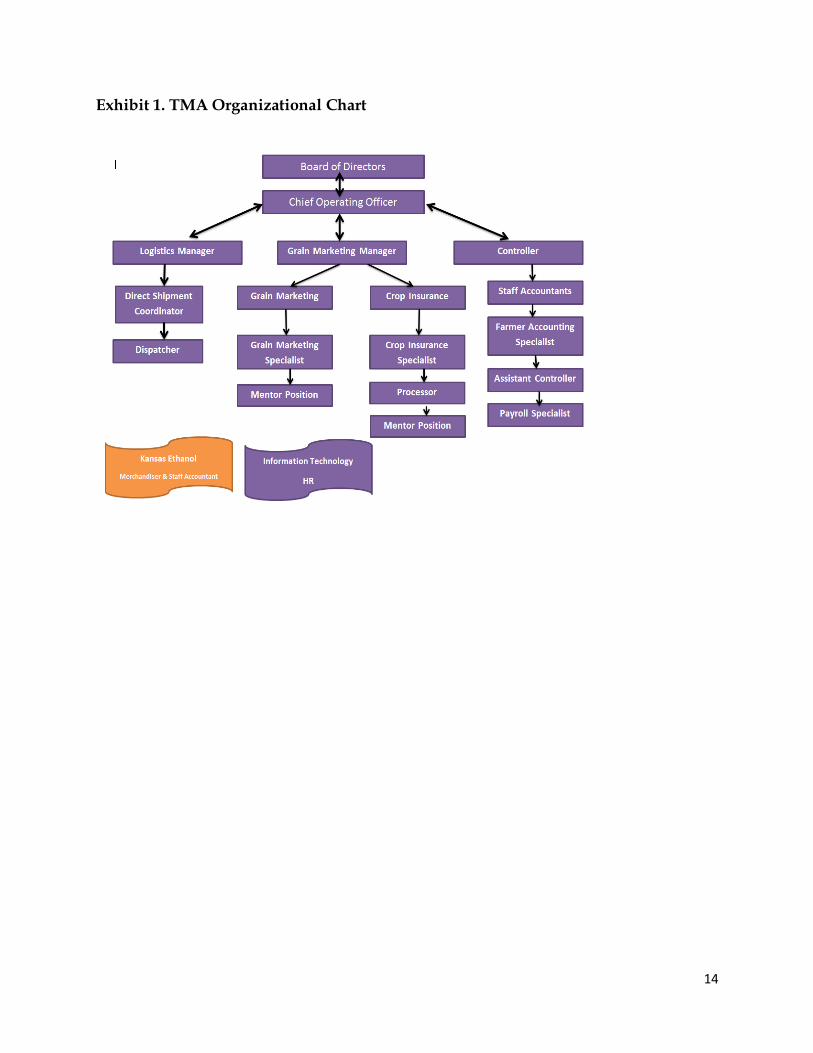
TMA’s organizational chart is shown in exhibit 1. TMA has 20 employees which
include: a C.O.O, a grain marketing manager, four grain marketing specialists, four crop
Insurance specialists, a crop insurance processor, a person in charge of logistics and
transportation, six support and accounting staff, and two TMA employees at Kansas
Ethanol. Responsibilities and activities of employees include: marketing and hedging of
grain inventories, providing warehouse licensing for elevators, providing financing for
grain receivables and inventories, providing uniform patron grain contracts and
programs, arranging logistics and transportation for local elevators, overseeing training
for grain grading and customer programs, providing grain origination assistance and
programs, and maintaining separate accounting and financial statements.
The geographic footprint of TMA covers ten counties in central Kansas (Exhibit
2). In 2012 TMA insured over 260,000 acres, gross crop insurance premiums of 10
million dollars, and contracted over 9 million bushels of fee based contracts. TMA’s
warehouse licensing and close relationships with farmers in central Kansas allow them
to manage inbound logistics effectively.
While TMA has done a fair job managing outbound logistics to date, their
expanding geographic footprint has put pressure on TMA’s ability to manage these
logistics effectively and efficiently. The primary reason is because TMA relies solely on
trucking as a means of transporting grain. Running over hundred trucks per day has

6
proved inefficient. To address this problem, one of TMA’s owners, Mid-Kansas
Cooperative, has partnered with CHS to provide the equity capital to build and operate
a high-speed shuttle loading facility which upon completion will load 110-car trains
bound for export facilities. This facility will be operated as its own LLC, and this newly
created LLC will become the fifth member of TMA.
TMA’s Approach to Creating Value in a Turbulent Time
TMA creates value for their member-farmers through a unique risk management
tool. With heightened volatility in the agricultural marketplace, farmers need ways to
lay off many types of risks. TMA’s unique approach to risk management helps farmers’
control their production risks by locking profits. More specifically, the value
proposition for farmers is through a profit based, risk management approach that
utilizes contracts to lock in (1) input purchases; (2) grain sales; and (3) crop insurance.
The best way to illustrate TMA’s approach to risk management is through their
profit matrix. An advantage of the profit matrix is that it is a straightforward way to
show a producer what type of profit per acre they can lock in based on their input,
grain and crop insurance decisions. While different types of crops can be shown in the
profit matrix, for explanation purposes a hypothetical wheat farm profit matrix is
shown in Exhibit 3.
The profit matrix has two axis of information that helps determine the realized
profit per acre, which is reported in the middle of the matrix. The vertical axis shows
various cash price levels. Across the top horizontal axis are varying levels of farm

7
yields. In addition, the farm yield as a percentage of the farm’s APH (actual production
history) is shown at the top (so in the case of this hypothetical farm, 45 bushels per acre
of wheat is 100% of the farm’s APH). Finally, along the bottom is the cash price needed
to breakeven at the associated farm yield (so at 68 bushels per acre, the farmer needs a
wheat price of $4.32 to breakeven).
The breakeven prices along with the profits per acre reported in the matrix are all
dependent upon the specific profit based decisions made by a farmer. These decisions
create a tailored profit matrix for a farmer. Of course, there are many different decisions
that could be made that would result in very different profit per acre figures. To keep
things tractable for the purposes of this case study, the hypothetical wheat farmer is
used again. So, Exhibit 3 reflects three key decisions: (1) reporting and locking in input
costs; (2) locking in their revenues through grain contracts; and (3) minimum revenues
from production through crop insurance.
The first decision pertains to input costs and purchase commitments. Step 1 in
the upper left-hand corner of Exhibit 3 shows the cost per acre figures that a farmer
must provide from their own records. In addition, the farmer may be able to lock-in
input prices and input quantities purchased through contracts with their local grain,
oilseed and farm supply cooperative. For example, 12-month fertilizer contracts can be
agreed upon between the farmer-member and their local cooperative to lock in fertilizer
prices. TMA can provide this unique benefit because of their unique business structure
as an LLC wholly owned by four cooperatives. All other input costs are assumed to be
incurred by the farmer.

8
After entering their input cost information, next is to market their grain. Step 2 in
the upper right hand part of Exhibit 3 shows multiple ways in which farmers can
market their grain through TMA. These options include hedging, using the options
market, minimum price contracts or forward contracts. One advantage for farmers
using futures to hedge or lock in grain prices is the farmer does not pay for any margin
calls as TMA handles all margin calls. To easily illustrate the impact of step 2 on the
profit matrix, cash forward contracts are used.
The final and third step is to determine their crop insurance coverage. Numerous
crop insurance options, such as crop revenue coverage to multiple production insurance
policy to catastrophic risk protection, are available to the farmer. It is up to the farmer to
decide how much they are willing to spend for the insurance, and how much coverage
and protection that they need. In exhibit 3, the hypothetical wheat farmer’s APH is 45
bushels per acre and the wheat farmer decides to purchase an 80 percent revenue
protection policy, which insures 36 bushels per acre. With this amount of the wheat
crop insured, 36 bushels per acre is also the amount of grain that is forward contracted
in step 2.
Following all of these steps helps the farmer realize the value of TMA’s profit
based risk management approach. Being able to lock in profits is clearly valuable in
today’s volatile times, but there is another advantage of TMA’s risk management
approach. Producers have to process a lot of information when making farm level
decisions and the profit matrix allows producers, along with TMA’s guidance, to
quickly synthesize this information and make the most profitable decisions possible.
9
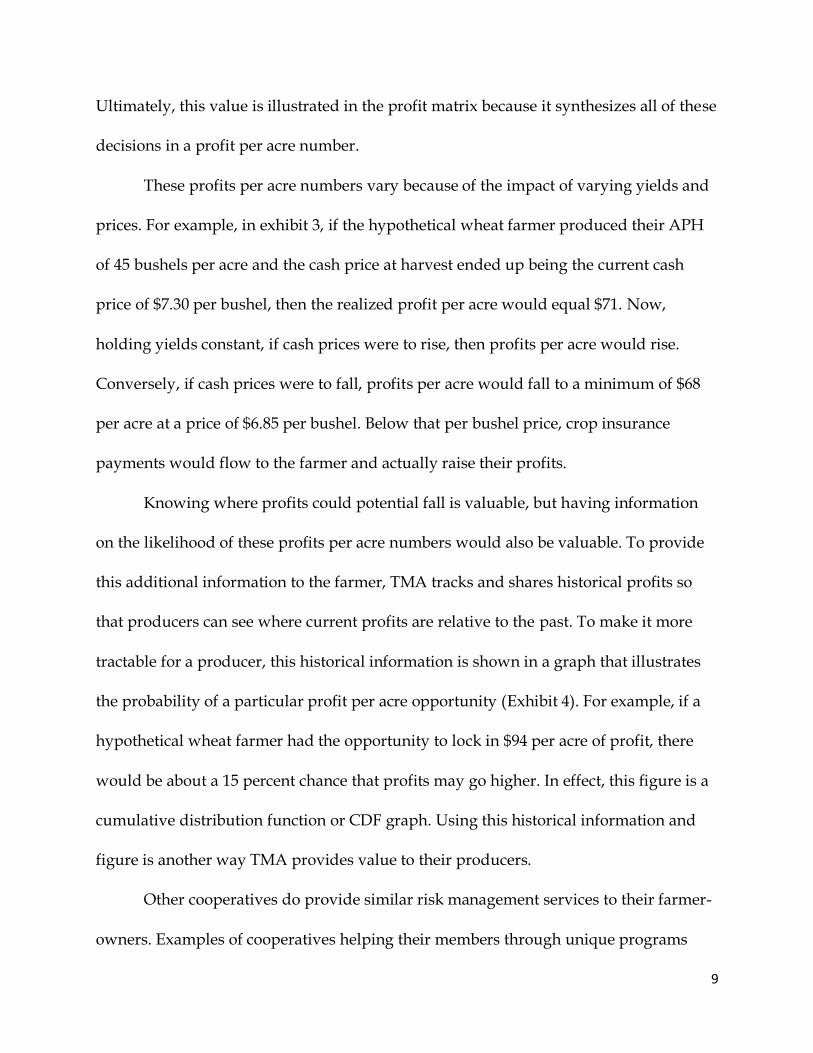
Ultimately, this value is illustrated in the profit matrix because it synthesizes all of these
decisions in a profit per acre number.
These profits per acre numbers vary because of the impact of varying yields and
prices. For example, in exhibit 3, if the hypothetical wheat farmer produced their APH
of 45 bushels per acre and the cash price at harvest ended up being the current cash
price of $7.30 per bushel, then the realized profit per acre would equal $71. Now,
holding yields constant, if cash prices were to rise, then profits per acre would rise.
Conversely, if cash prices were to fall, profits per acre would fall to a minimum of $68
per acre at a price of $6.85 per bushel. Below that per bushel price, crop insurance
payments would flow to the farmer and actually raise their profits.
Knowing where profits could potential fall is valuable, but having information
on the likelihood of these profits per acre numbers would also be valuable. To provide
this additional information to the farmer, TMA tracks and shares historical profits so
that producers can see where current profits are relative to the past. To make it more
tractable for a producer, this historical information is shown in a graph that illustrates
the probability of a particular profit per acre opportunity (Exhibit 4). For example, if a
hypothetical wheat farmer had the opportunity to lock in $94 per acre of profit, there
would be about a 15 percent chance that profits may go higher. In effect, this figure is a
cumulative distribution function or CDF graph. Using this historical information and
figure is another way TMA provides value to their producers.
Other cooperatives do provide similar risk management services to their farmer-
owners. Examples of cooperatives helping their members through unique programs

10
include Key Cooperative in Iowa with their AgroMetrix program and Harvest Land
Cooperative in Minnesota who link crop input purchasing decisions with grain
marketing decisions. While these as well other cooperatives approach to risk
management is different than TMA, the motivation is still the same, providing value to
farmers.
Value Proposition for Producers of Varying Size
The value proposition TMA brings to producers does vary across producers.
Namely, producers of differing sizes do receive a set of different value. For purposes
here, producers are segmented by total number acres tied to TMA’s risk management
approach of purchasing inputs, selling grain and purchasing crop insurance. In
particular small to medium sized producers, 2,000 acres or less, and very large
producers, 7,500 acres or more, can extract similar values as discussed above. Medium
sized producers primarily gain value from TMA’s ability to absorb margin calls, while
very large producers primarily gain from TMA’s expertise in the cash market, and both
gain from economies of scale in the purchasing and selling of products.
Challenges and forward looking strategic issues
Through its progressive and comprehensive producer risk management programs TMA
was able to enhance the value to the members of four partner cooperatives. Its unique
approach to locking in profits combined with exceptional one-on-one client service
helped the company to develop a strong relationship with farmers. The company is
known widely throughout central Kansas and is well revered for the value they offer to

11
its clients. While TMA has enjoyed much business success to this point, there are a
number of strategic issues that they must address. Below are a set of strategic issues that
have been identified as well as an explanation of each issue.
Strategic Issue #1: In central Kansas, TMA was the first to employ a profit based risk
management approach for their farmers. So, how do they leverage momentum from
this first-mover advantage?
Over the 12 years of operation TMA has achieved learning curve advantages in risk
management. In turn, they were able to gain a strong position in their geographic area
due to cooperative structure and reputation which gives them a competitive advantage
over others in the industry. However, the competitive landscape is intense as other local
elevators and large multinationals such as ADM, Cargill, Scoular, and Gavilon are
expanding their geographic presence.
Even though TMA was able to differentiate itself through its comprehensive risk
management approach and personalized customer service, the profit matrix approach
could eventually be replicated by competitors or will be outdone as new technology
and risk management tools become available. Additionally the dynamics of driving
forces behind market volatility such as global macroeconomic situation, agricultural
policies, growing demand for food and biofuel, and extreme whether events suggest
that volatility in agricultural markets will continue to escalate. The question then
becomes: how to leverage the momentum from the first-mover advantage gained
through the profit matrix approach to risk management and to develop long-term

12
sustainable competitive advantage? Furthermore, how does TMA maintain the
innovative edge in creating value for farmers when both industry competition and
market volatility are increasing?
Strategic Issue #2: While TMA is not a cooperative, they operate on a cooperative basis
because they are wholly owned by four cooperatives. So, how does TMA continue to
grow but maintain the benefits of cooperative structure?
The cooperative structure undoubtedly provides important benefits in terms of supplier
relationships and asset footprint giving TMA a strong position in central Kansas. In
addition, paying patronage is another advantage of the cooperative structure.
However, it also poses challenges for growth.
TMA’s Board of Directors is comprised of the four cooperatives and in their
decision making will be guided by the best interest of their respective constituents. A
challenge with this governance structure is that each cooperative could have their own
interest in mind when making decisions. While the growth may provide additional
efficiencies for TMA through economies of scale, the implications for each cooperative
and their members should be considered. What are the possible avenues for growth?
Should partnerships be extended to other co-ops outside? How to grow without being
perceived too big by current clients?
Strategic Issue #3: From 2008 to 2012, U.S agricultural producers have been exposed to
highly volatile commodity markets, but these fluctuations have provided opportunities

13
to capture sizable net farm incomes. Farmers themselves as well as their needs have
changed significantly, and this change is not expected to end anytime soon. So, how
will TMA continue to create value for a customer base that is ever-changing?
As TMA grows it has to deal with not only new clients but also changing
demographics of current clients. There is a growing number of younger more business
minded farmers who are characterized as being well-educated and willing to adopt new
technology and risk management practices. Also, even though in grain origination
industry, suppliers are much less concentrated than the buyers, there has been an
increasing farm consolidation over the last several decades. These changes in farm
demographics will have important implications for the TMA’s value proposition
moving forward. What kind of opportunities and threats these change in farm size and
farmer demographics will create for TMA? How to extend the value proposition to
make it appealing to new demographic of farmers while continuing to serve the needs
of traditional clients?
14
Exhibit 1. TMA Organizational Chart

15
Exhibit 2. TMA Locations

16
Exhibit 3. Screenshot of TMA’s Profit Matrix

17
Exhibit 4. Cumulative Distribution Function (CDF) Graph of Historical Profits:
Dryland Wheat Example