converting blind spots into cash & profit - bcca chicago 2012 - coverting blind spots....pdf ·...
TRANSCRIPT

Converting Blind Spots into Cash & Profit
Speaker:John G. Salek, VP Business Services, Genpact USA

© 2012 Copyright Genpact. All Rights Reserved.
Date: July 19, 2012Chicago, Illinois
Converting Blind Spots into Cash and Profit

© 32012 Copyright Genpact. All Rights Reserved.
Table of Contents
1. Introduction and Objectives
2. Metrics
3. Case Study
4. Conclusion

© 42012 Copyright Genpact. All Rights Reserved.
Introduction and Objectives
Good to be back!
Objectives for this meeting:Objectives for this meeting:
Demonstrate that your Order to Cash (OTC) and Accounts Receivable (AR) metrics should be evolving as your business evolves
Explore how an excellent performing company identified “blind spots” in its metrics reporting package

© 52012 Copyright Genpact. All Rights Reserved.
A High Level Look at Metrics
• To measure the performance of the management of the revenue stream:• Effectiveness• Efficiency
• To provide a level of insight into operations and challenges• To minimize the time and cost of reporting
You cannot manage what you don’t measure
Objectives of Metrics/Key Performance Indicators (KPIs)Objectives of Metrics/Key Performance Indicators (KPIs)
© 62012 Copyright Genpact. All Rights Reserved.
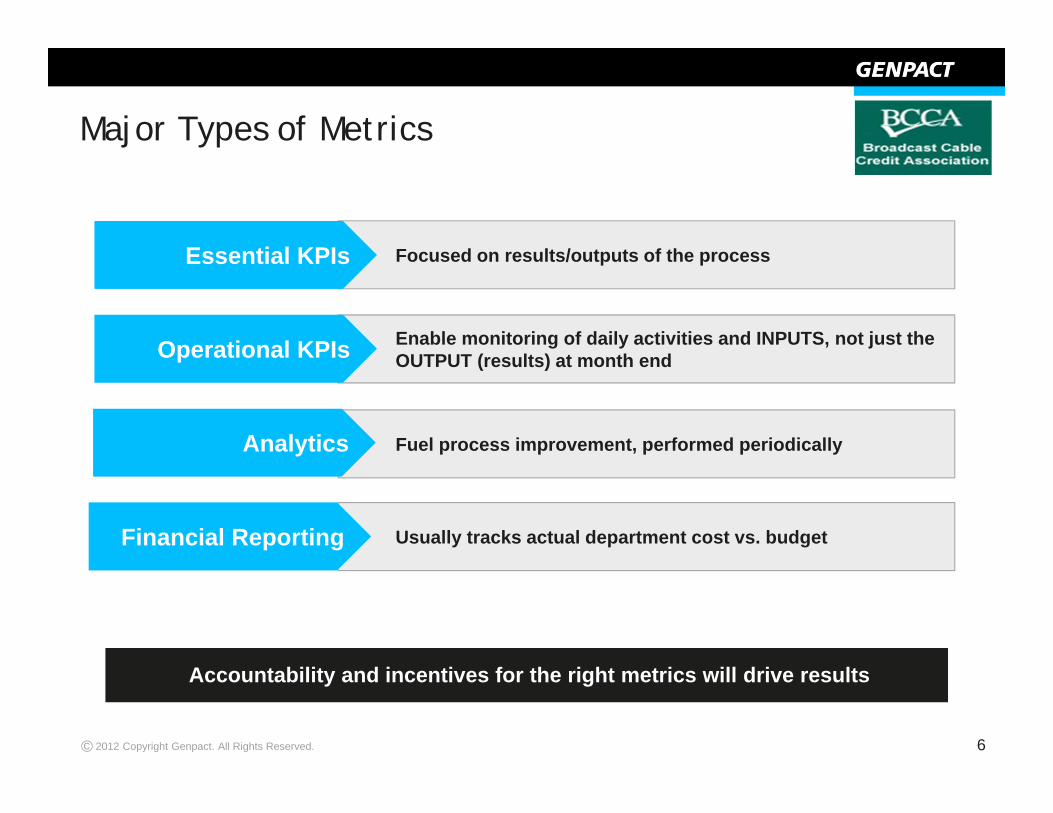
Usually tracks actual department cost vs. budget
Fuel process improvement, performed periodically
Enable monitoring of daily activities and INPUTS, not just the OUTPUT (results) at month end
Focused on results/outputs of the process
Major Types of Metrics
Accountability and incentives for the right metrics will drive results
Essential KPIsEssential KPIs
Operational KPIsOperational KPIs
AnalyticsAnalytics
Financial ReportingFinancial Reporting
© 72012 Copyright Genpact. All Rights Reserved.
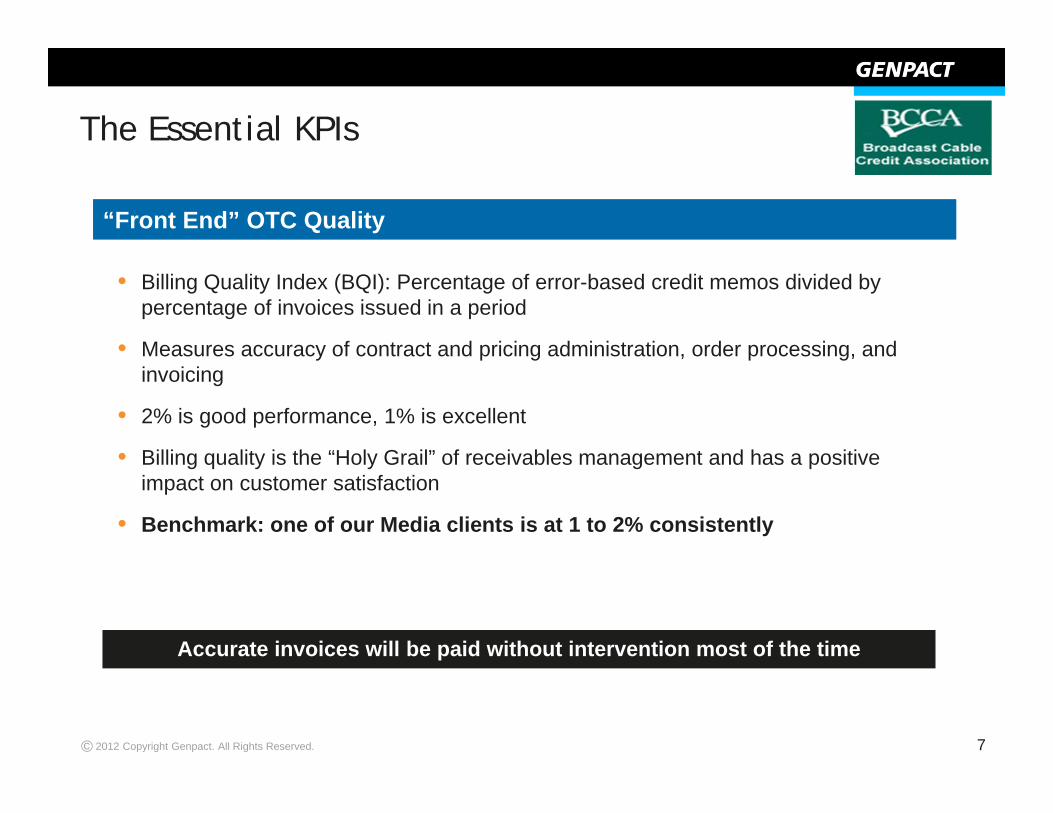
The Essential KPIs
• Billing Quality Index (BQI): Percentage of error-based credit memos divided by percentage of invoices issued in a period
• Measures accuracy of contract and pricing administration, order processing, and invoicing
• 2% is good performance, 1% is excellent
• Billing quality is the “Holy Grail” of receivables management and has a positive impact on customer satisfaction
• Benchmark: one of our Media clients is at 1 to 2% consistently
Accurate invoices will be paid without intervention most of the time
“Front End” OTC Quality “Front End” OTC Quality

© 82012 Copyright Genpact. All Rights Reserved.
The Essential KPIs
• Actual DSO vs. best possible DSO gap• Benchmark: Media clients range from 39 to 70 depending on mix of direct vs. agency. Credit
Research Foundation shows industry Median of 74.
• Aging percentage, especially the 11-30 (and greater) days past due amounts • Benchmark: Media clients range from 22 to 40%
• Cash collected vs. target
Asset Turnover Asset Turnover
• Risk profile/credit rating of AR portfolio (D&B or bond ratings)• Aging percentage, especially the over 90 days past due amounts • Bad debt charge-offs as percentage of revenue
Asset RiskAsset Risk
• How collectible is the asset? • Prevalence of disputes, billing errors, deductions (AKA dilution/”clutter”)• Beware overstatement of asset value (and overstatement of revenue)
Asset QualityAsset Quality

© 92012 Copyright Genpact. All Rights Reserved.
Operational KPIs
Key attributes to be measured are:
• Throughput volumes
• Backlogs: number, value, and age• Benchmark: Media clients Unapplied Cash is 3-5% of total AR
• Timeliness• Benchmark: Media clients Service Delivery to Invoice cycle time is 7to 9 days, Dispute Resolution cycle
time is 22 to 26 days
• Accuracy • Benchmark: Media clients Cash Application accuracy is over 99%
Operational KPIs enable management to monitor the daily work of a functionOperational KPIs enable management to monitor the daily work of a function
Operations teams often have service standards such as Service Level Agreements (SLAs) they must achieve
© 102012 Copyright Genpact. All Rights Reserved.
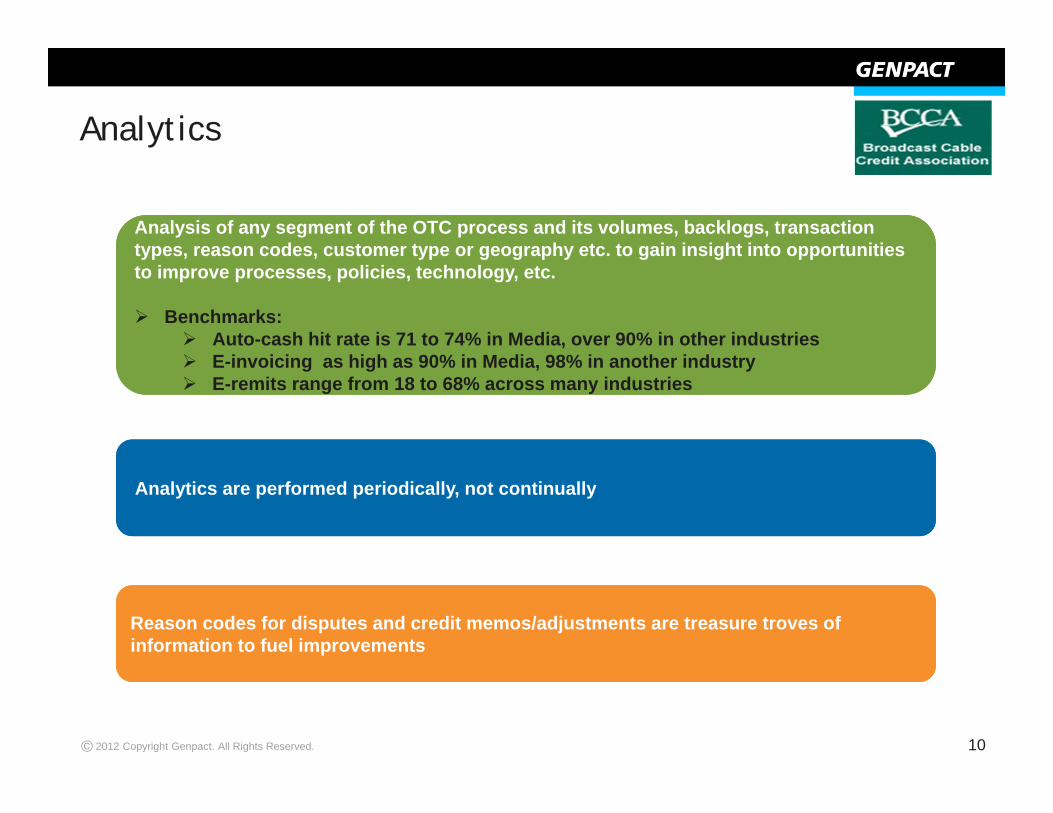
Analytics
Analysis of any segment of the OTC process and its volumes, backlogs, transaction types, reason codes, customer type or geography etc. to gain insight into opportunities to improve processes, policies, technology, etc.
Benchmarks: Auto-cash hit rate is 71 to 74% in Media, over 90% in other industries E-invoicing as high as 90% in Media, 98% in another industry E-remits range from 18 to 68% across many industries
Analytics are performed periodically, not continuallyAnalytics are performed periodically, not continually
Reason codes for disputes and credit memos/adjustments are treasure troves of information to fuel improvementsReason codes for disputes and credit memos/adjustments are treasure troves of information to fuel improvements

© 112012 Copyright Genpact. All Rights Reserved.
Case Study: Introduction
The Client: $5 billion provider of transportation and logistics solutions
Over the past decade, the OTC process improved substantially via Lean and Six Sigma-driven continuous improvement
Cash Application - Timing
Unapplied Cash
Customer Experience:• Fewer calls• Accurate calls
Delinquency 14% 8.0%
Bad Debt - % of Revenue 1.1% 0.5%
• $55M increased cash flow• $16M lower bad debt

© 122012 Copyright Genpact. All Rights Reserved.
Customer Master Setup
How to take performance to the next level?
From where is the future improvement coming?
Case Study: The Challenge
CreditCheck
ContractAdmin
OrderMgmt Billing Collections Cash
AppsExceptions
Mgmt
End-to-End Perspective: Where are the opportunities?End-to-End Perspective: Where are the opportunities?
CURRENT METRICSHow do we really know we’re doing well?
© 132012 Copyright Genpact. All Rights Reserved.
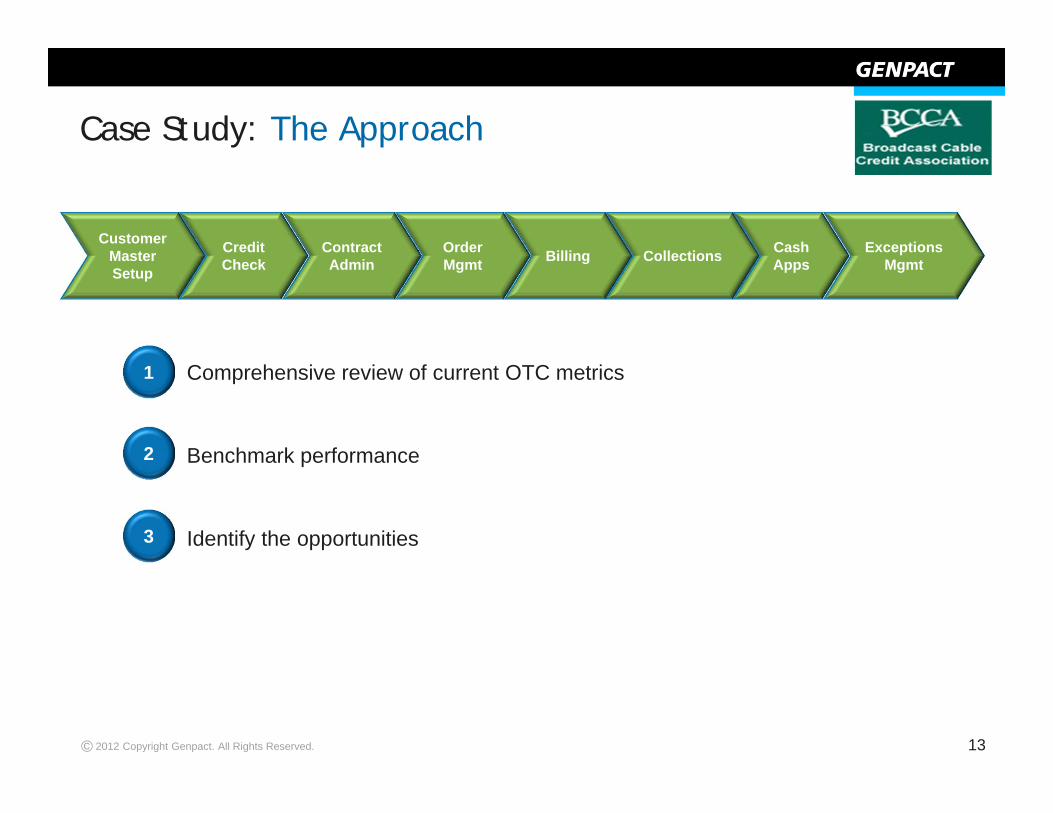
Comprehensive review of current OTC metrics
Benchmark performance
Identify the opportunities
Customer Master Setup
CreditCheck
ContractAdmin
OrderMgmt Billing Collections Cash
AppsExceptions
Mgmt
Case Study: The Approach
1
2
3

© 142012 Copyright Genpact. All Rights Reserved.
Seven metrics that were not previously tracked provided valuable insight into OTC process health:
1. Cost of OTC process as percentage of revenue2. Service delivery to invoice cycle time3. Percentage of electronic invoices dispatched4. Visibility to disputes and deductions combined5. Rollover6. Total unapplied cash visibility7. Percentage of electronic payments received
Case Study: Results
For most OTC benchmarks, the company compared very favorably
© 152012 Copyright Genpact. All Rights Reserved.
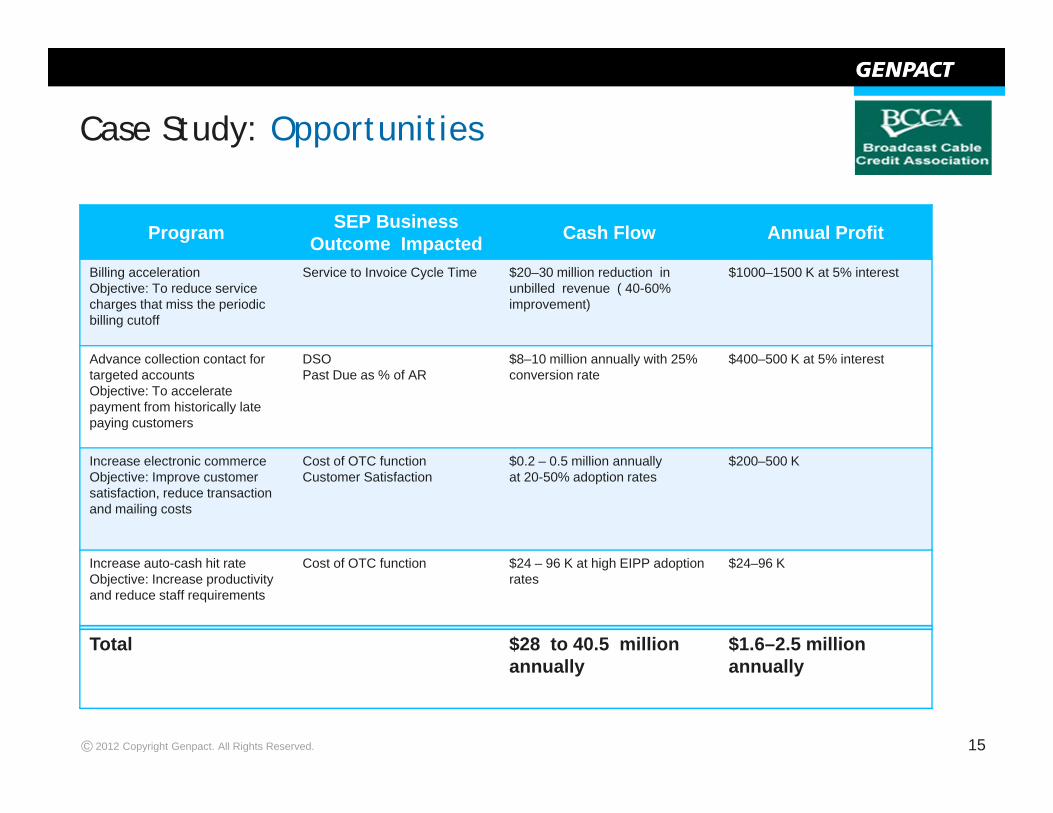
Program SEP Business Outcome Impacted Cash Flow Annual Profit
Billing accelerationObjective: To reduce service charges that miss the periodic billing cutoff
Service to Invoice Cycle Time $20–30 million reduction in unbilled revenue ( 40-60% improvement)
$1000–1500 K at 5% interest
Advance collection contact for targeted accountsObjective: To accelerate payment from historically late paying customers
DSOPast Due as % of AR
$8–10 million annually with 25% conversion rate
$400–500 K at 5% interest
Increase electronic commerceObjective: Improve customer satisfaction, reduce transaction and mailing costs
Cost of OTC functionCustomer Satisfaction
$0.2 – 0.5 million annually at 20-50% adoption rates
$200–500 K
Increase auto-cash hit rateObjective: Increase productivity and reduce staff requirements
Cost of OTC function $24 – 96 K at high EIPP adoption rates
$24–96 K
Total $28 to 40.5 million annually
$1.6–2.5 million annually
Case Study: Opportunities
© 162012 Copyright Genpact. All Rights Reserved.
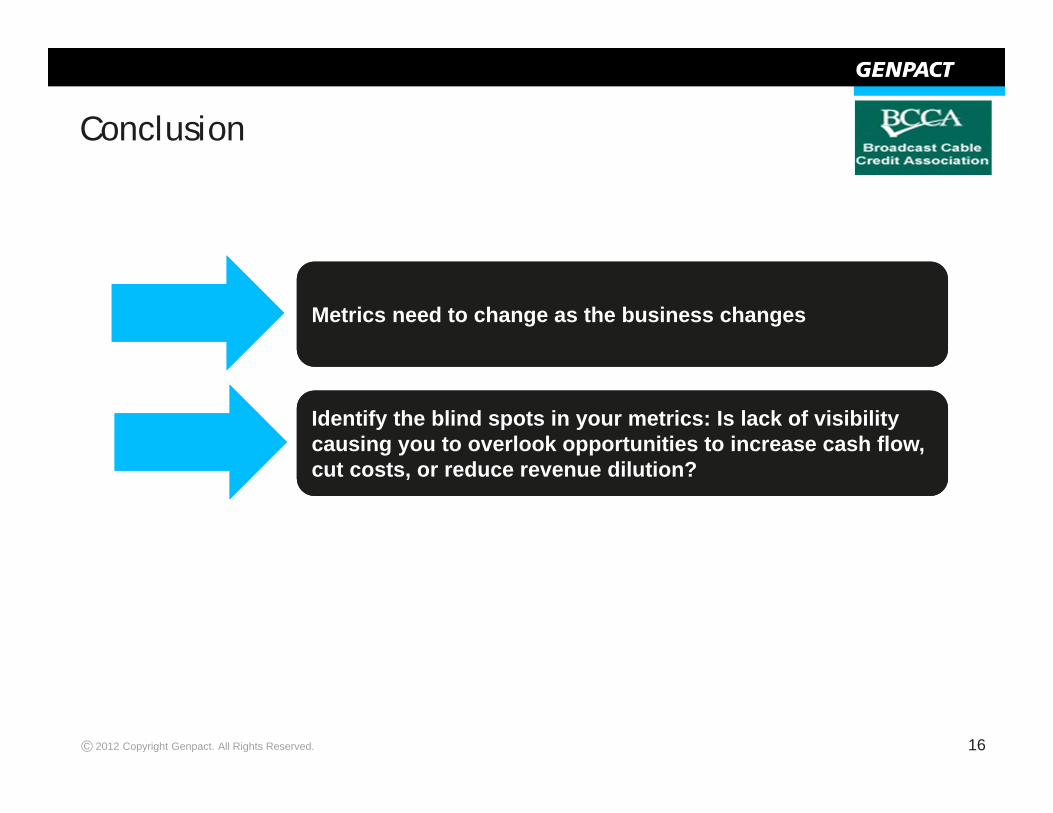
Identify the blind spots in your metrics: Is lack of visibility causing you to overlook opportunities to increase cash flow, cut costs, or reduce revenue dilution?
Identify the blind spots in your metrics: Is lack of visibility causing you to overlook opportunities to increase cash flow, cut costs, or reduce revenue dilution?
Conclusion
Metrics need to change as the business changesMetrics need to change as the business changes

© 2012 Copyright Genpact. All Rights Reserved.
Your Questions
