conv heding explained
TRANSCRIPT
8/6/2019 Conv Heding Explained
http://slidepdf.com/reader/full/conv-heding-explained 1/16
Please refer to terms relating to the provision of this research at the end of the document.ABN AMRO Bank NV
250 Bishopsgate
London
EC2M 4AA
United Kingdom
Fixed IncomeRates Strategy - Global
Convexity hedging explainedThe latest dip in the housing numbers suggests residential activity
could be slowing. However, this will have little effect on the degree
of mortgage hedging which will continue to be a significant
influence until yields have risen at least a further 125bp.
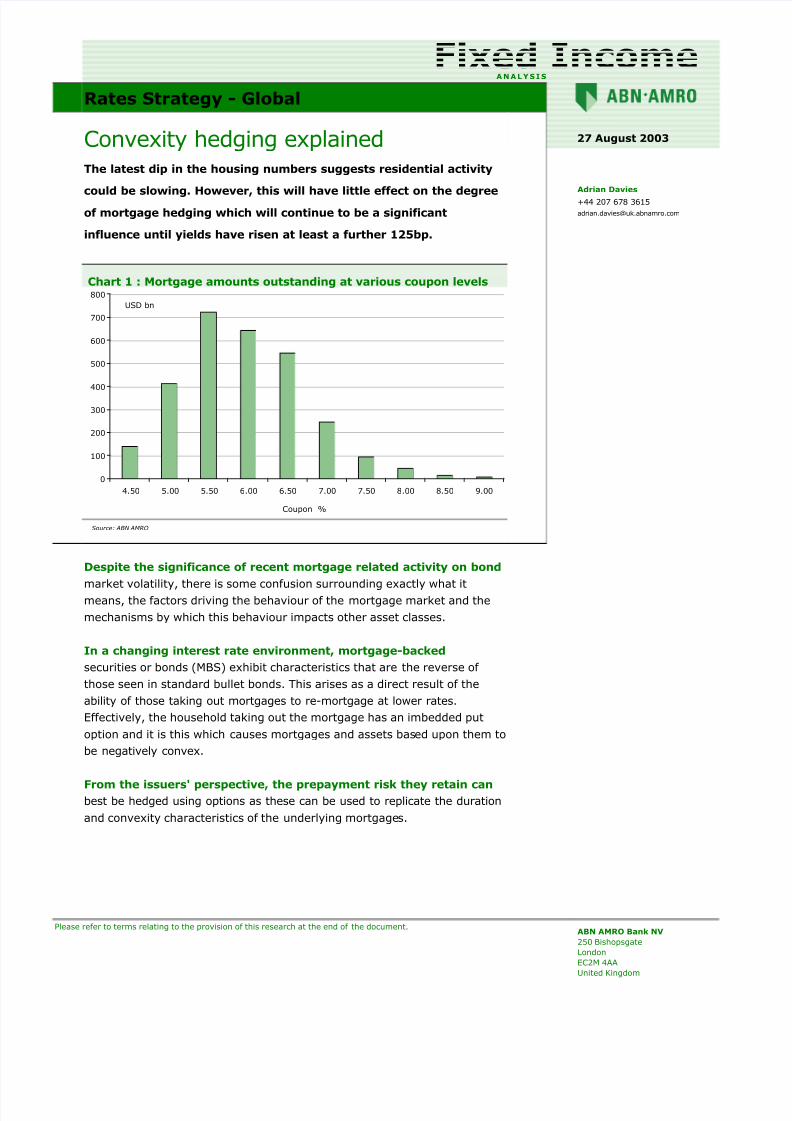
Chart 1 : Mortgage amounts outstanding at various coupon levels
0
100
200
300
400
500
600
700
800
4.50 5.00 5.50 6.00 6.50 7.00 7.50 8.00 8.50 9.00
USD bn
Coupon %
Source: ABN AMRO
Despite the significance of recent mortgage related activity on bond
market volatility, there is some confusion surrounding exactly what it
means, the factors driving the behaviour of the mortgage market and the
mechanisms by which this behaviour impacts other asset classes.
In a changing interest rate environment, mortgage-backed
securities or bonds (MBS) exhibit characteristics that are the reverse of
those seen in standard bullet bonds. This arises as a direct result of the
ability of those taking out mortgages to re-mortgage at lower rates.
Effectively, the household taking out the mortgage has an imbedded put
option and it is this which causes mortgages and assets based upon them to
be negatively convex.
From the issuers' perspective, the prepayment risk they retain canbest be hedged using options as these can be used to replicate the duration
and convexity characteristics of the underlying mortgages.
27 August 2003
Adrian Davies
+44 207 678 3615
A N A LYSIS
8/6/2019 Conv Heding Explained
http://slidepdf.com/reader/full/conv-heding-explained 2/16
R A T E S S T R A T E G Y - G L O B A L 2 7 A U G U S T 2 0 0 3 2
R A T E S S T R A T E G Y
Convexity hedging explained
Introduction
The past quarter has seen bond market volatility reach record levels exacerbated
by mortgage related activity. However, despite the significance of this activity there
is some confusion surrounding exactly what it means, the factors driving the
behaviour of the mortgage market and the mechanisms by which this behaviour
impacts on other asset classes. This note is designed to answer these questions. It
is aimed at a broad range of investors with most definitions, details and
corroborating evidence contained in the appendix for brevity. To understand the
factors which underlie the behaviour of mortgage players it is best to start from
first principles in regard to mortgage bond price characteristics.1
Convexity
The relationship between a bond’s yield and price is not constant (linear) it changes
with the level of yields. The rate at which the relationship between changes in yield
and changes in price evolves is termed convexity. It is the second derivative
between yield and price. Thus, if a bond has positive convexity, if yields fall in
10bp steps its price will rise at an increasing rate for each 10bp fall in yields. Most
bonds exhibit positive convexity. The main exceptions are mortgage bonds which,
for each 10bp fall in yields the price of the bond rises at a decreasing rate.
Negative convexity1
In a changing interest rate environment mortgage-backed securities or bonds(MBS) exhibit characteristics that are the reverse of those seen in standard bullet
bonds and so the term negative convexity is applied to them. This arises as a
direct result of the ability of those taking out mortgages to close an existing
mortgage on their property and open a new one as and when its beneficial. In the
US over 85% of mortgages are fixed rate – most are 30-year mortgages with the
interest rate tied to the long bond.2
Thus, if the long bond yield declines sufficiently
the savings made from refinancing will exceed the costs of re-mortgaging leading
to a flood of refinancing. The mortgagee will repay the existing mortgage early and
take out a new one. If this mortgage forms part of a pool of mortgages against
which an MBS has been issued then the early repayment will mean the holder of
the associated MBS will receive the pre-prepayment. (The exact routing for the
pre-payments will be determined by the structure of individual bonds the mortgageissuer creates from the pool of underlying mortgages.)
Effectively, the household taking out the mortgage has an embedded put option
and it is this which causes mortgages and assets based upon them to be negatively
convex. Increased competition in the home loan market have caused re-mortgaging
costs to plunge over recent years and as a result the break-even change in yield
1 A more detailed explanation of duration and convexity is contained in the appendix.2 Note, that although the mortgage rate is tied to the long bond most hedging activity is done using either 5- or 10-year Treasuries or derivative based upon
them.

8/6/2019 Conv Heding Explained
http://slidepdf.com/reader/full/conv-heding-explained 3/16
R A T E S S T R A T E G Y
R A T E S S T R A T E G Y - G L O B A L 2 7 A U G U S T 2 0 0 3 3
required to make refinancing worthwhile has fallen towards 75bp or less.
Households have become a lot more aware of the potential savings to be made
from re-financing. The main issuers assume 50% of mortgages will be refinanced if
yields fall by 75bp for one month or more. This is illustrated by the annualised
liquidation rates published by FreddieMac for the period up to June 2003. (Note not
all outstanding mortgages are re-financed as yields fall below this level. Mortgage
backed securities can trade with prices in excess of 110 suggesting the remaining
households in the pool face transaction costs of 10% to refinance which is highlyunlikely. This implies a strong sense of inertia exists in the mortgage market.)
Table 1 : Liquidation rates
Annualised
Liquidation Rate
Mth avg
10yr yld
Annualised
Liquidation Rate
Mth avg
10yr yld
Mar 2002 27.2% 5.35 Jan 2003 51.1% 4.00
Apr 24.2% 5.15 Feb 51.0% 3.90
May 21.6% 5.15 Mar 57.2% 3.85
June 23.5% 4.85 Apr 70.4% 3.95
Jul 28.5% 4.60 May 62.6% 3.45
Aug 38.2% 4.25 Jun 67.3% 3.35
Sep 45.4% 3.85
Oct 62.0% 3.90
Nov 57.9% 4.05
Dec 57.2% 4.00
Source: ABN AMRO
Pre-payments
There are many models designed to capture the pre-payment effect with the most
widely used prepayment assumption being The Bond Market Association Standard
Prepayment Model . Developed by the Bond Market Association to standardise the
measurement of prepayment risk, it assumes that, for new mortgage loans, theprobability of prepayment increases as rates decline or the mortgage “seasons,” or
ages. Both projected and historical prepayment rates are expressed or quoted as a
percentage of The Bond Market Association Standard Prepayment (PSA). Large
shifts in payment patterns has a big impact on the duration of the associated MBS
and the level of prepayments is primarily determined by the prevailing level of
interest rates relative to the pool of mortgages underlying the MBS. It is therefore
possible to calculate the relationship between yield changes and their effect on the
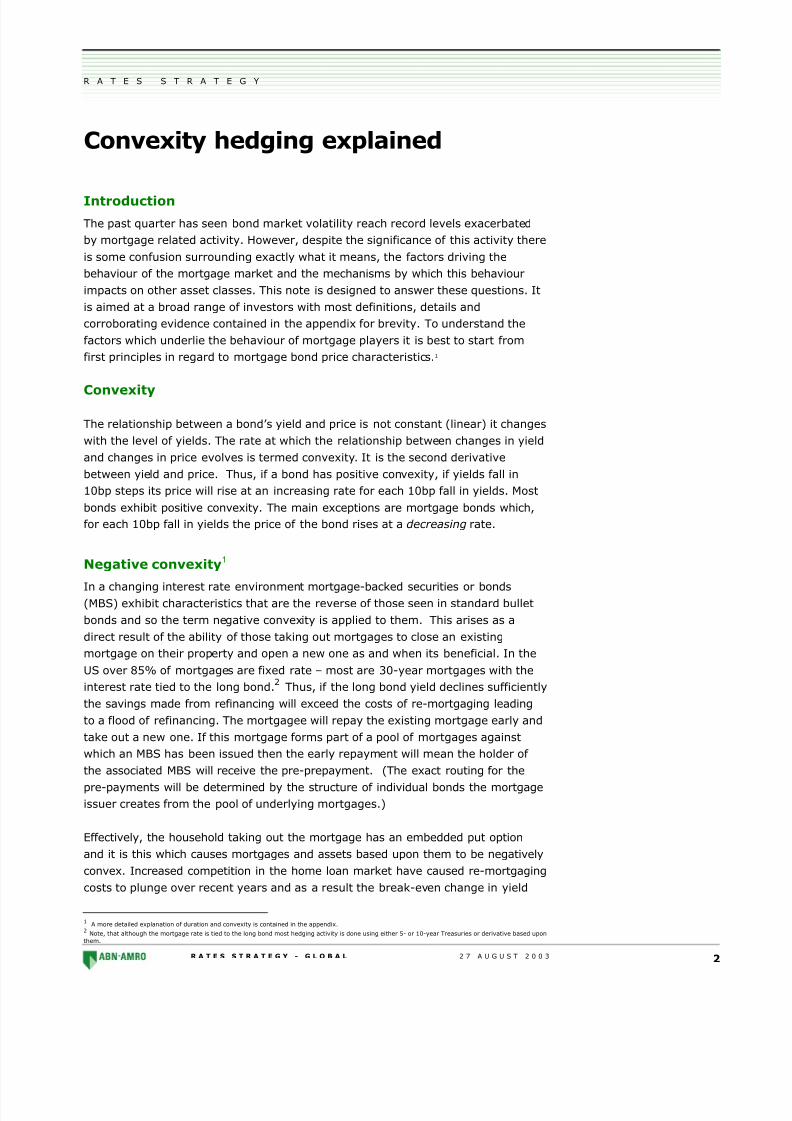
duration of a MBS. This is done in the chart below for the FreddieMac 4.5% 30
year. The effect is dramatic for yield declines of up to 200bp from the original
coupon level. At that point all those who will re-finance have normally done so
leaving those who through inertia or inability ignore the opportunity to re-finance at
cheaper levels. This leaves duration relatively unaffected for yield declines in excessof 200bp. The impact of a rise in yields from the MBS coupon level is less dramatic
as higher yields do not encourage pre-payments and so cash flows remain closely
tied to that envisaged by the MBS structure.
8/6/2019 Conv Heding Explained
http://slidepdf.com/reader/full/conv-heding-explained 4/16
R A T E S S T R A T E G Y
R A T E S S T R A T E G Y - G L O B A L 2 7 A U G U S T 2 0 0 3 4
Chart 2 : Duration of the FreddieMac 4.5% 30yr for various yield changes
0
1
2
3
4
5
6
7
8
-400 -300 -200 -100 0 100 200 300 400
Duration
Change in yield in bp
Source: Bloomberg
An alternative way of looking at this is to see how the weighted average life of a
30-year MBS from the same issuer changes depending upon the coupon level. Thewider the positive spread between the MBS’s coupon and prevailing yield levels, the
shorter the average life of the MBS.
Table 2 : Impact of falling yields on average life
Coupon PSA2222 Price YieldWeighted
average life
4.5 136 93-10 5.53 9.4
5.0 159 96-27 5.52 8.6
5.5 203 99-18 5.58 7.2
6.0 343 101-22 5.49 4.5
6.5 445 103-8 5.26 3.3
7.0 618 105-3 4.35 2.3
7.5 608 106-3 4.97 2.8
8.0 617 107-24 3.91 2.2
Source: ABN AMRO
Implications of negative convexity for the mortgage market
If MBS were structured in the same manner as the underlying mortgages there
would be little need for the issuers to manage their asset and liabilities. The
agencies concerned would merely act as a conduit to pass through any cash flows
as and when they occur. All the risk of pre-payment would be borne by the investor
buying the MBS. However, this is not the case, MBS issuers create instruments of
varying structures offering different levels of exposure to pre-payment risk to
broaden the appeal of the asset class. Thus, the issuer takes on the pre-payment
risk for some of the MBS they issue. The literature from the main issuing agencies
suggests that MBS issuers take on roughly 50% of the pre-payment risk and pass
the other 50% to the market by issuing callable debt across a broad spectrum of
final maturities. The duration of callable debt, like that of a mortgage, shortens
when interest rates decrease and lengthens when interest rates increase.
8/6/2019 Conv Heding Explained
http://slidepdf.com/reader/full/conv-heding-explained 5/16
R A T E S S T R A T E G Y
R A T E S S T R A T E G Y - G L O B A L 2 7 A U G U S T 2 0 0 3 5
It is important to remember that although the various structures allow the MBS
issuer to apportion some of the pre-payment risk between themselves and various
investor classes it does not diminish the overall pre-payment risk associated with
MBS securities. This risk has to be managed by either the issuer of MBS (if the MBS
has been stripped of the some of its pre-payment characteristics) or the investor (if
the MBS retains pre-payment risk).
End investors have a greater propensity to hedge their positions directly in cashmarkets such as the Treasury market but standard swaps are also used
extensively. For example, when yields are rising these investors tend to sell
Treasuries or pay fixed thus compounding the effect of the hedging being
implemented by the mortgage issuers. It is interesting to note that the bond rally
witnessed since the start of 2002 has shortened the duration of many outstanding
MBS to the degree that the duration characteristic of the 5-year Treasury is a closer
match than that of the 10-year Treasury the traditional hedging tool. As a result
more of the recent hedging activity has been conducted in the 5 year than
previously leading to heightened volatility in this area of the curve.
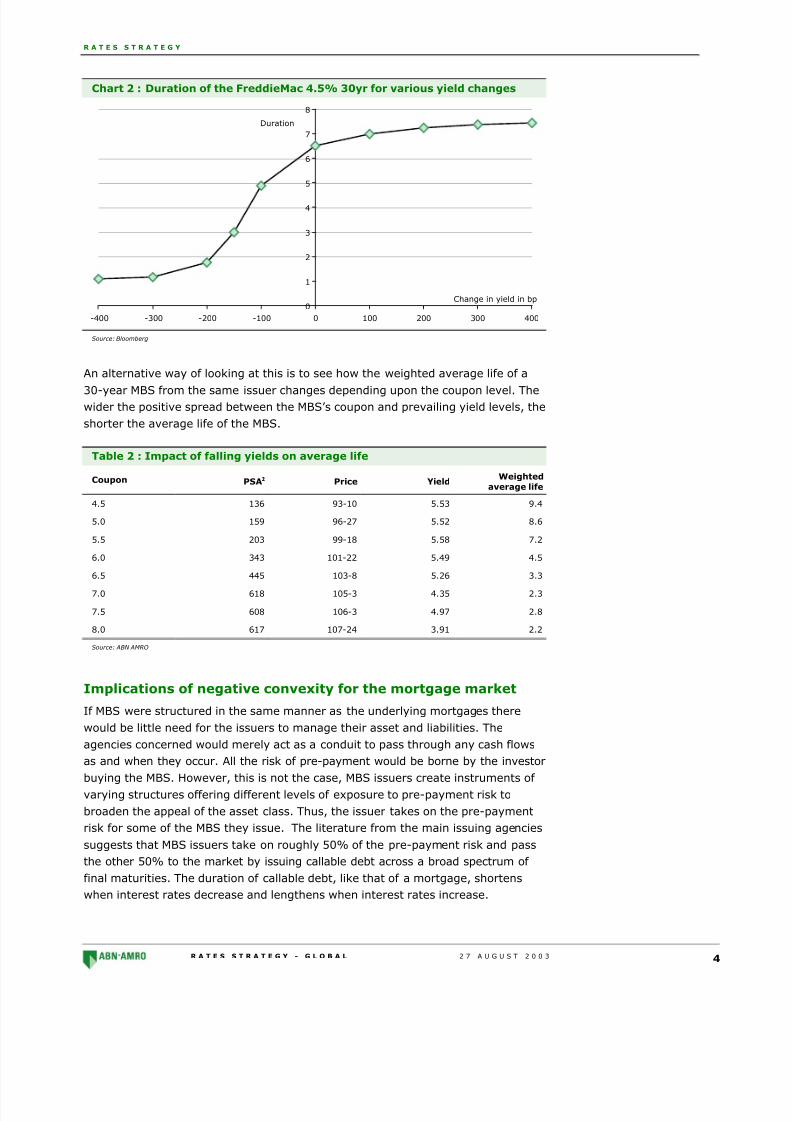
Mortgage market expansion
The ramifications of mortgage issuers hedging activities have been further
intensified by the growth in the size of the overall mortgage market. The MBS
market is one of the largest as the chart below illustrates and the effect of hedging
activity has grown with it.
Chart 3 : Relative bond market sizes
0
1000
2000
3000
4000
5000
6000
1 9 8 5
1 9 8 6
1 9 8 7
1 9 8 8
1 9 8 9
1 9 9 0
1 9 9 1
1 9 9 2
1 9 9 3
1 9 9 4
1 9 9 5
1 9 9 6
1 9 9 7
1 9 9 8
1 9 9 9
2 0 0 0
2 0 0 1
2 0 0 2
2 0 0 3
Treasury Mortgage Corporate
Bil
Source: ABN AMRO
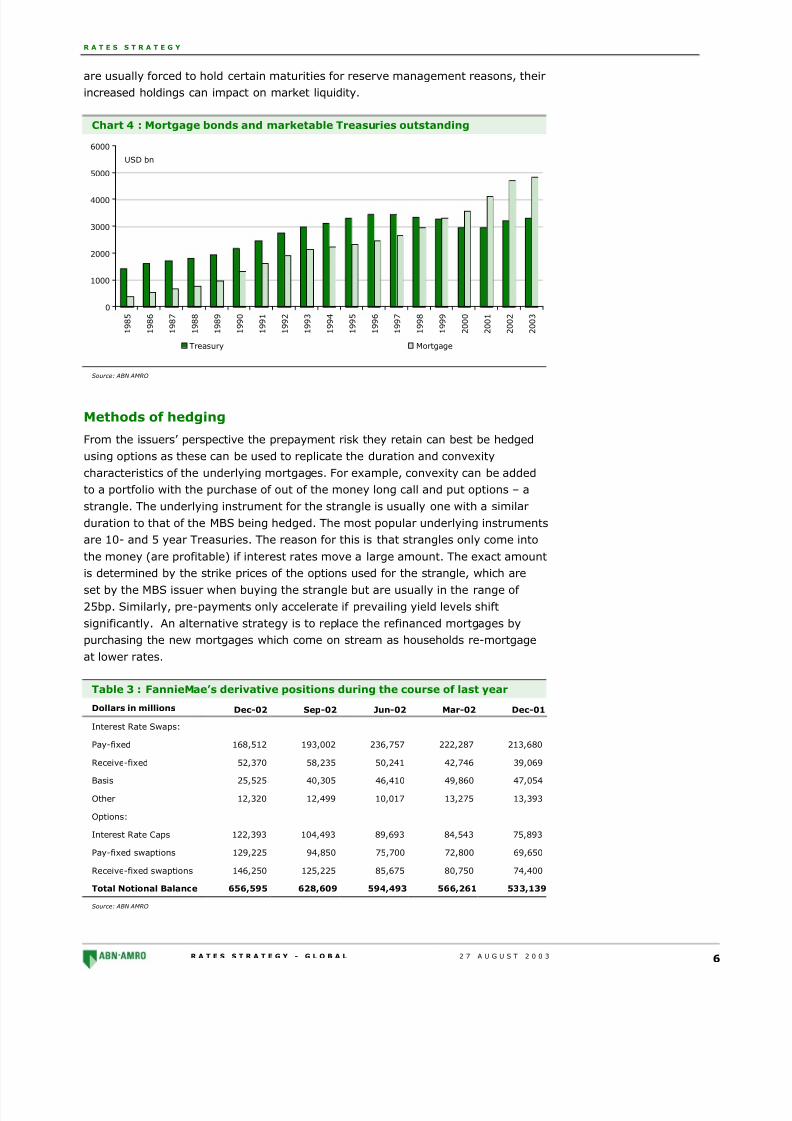
The increases of MBS outstanding relative to the Treasury market has been
especially marked despite the recent rise in the federal government deficit. This
relative expansion of MBS is even more extreme once the effect of the increase in
central bank holdings of Treasuries are taken into account. Large scale intervention
in the foreign exchange markets means as of 1st July $1347bn of Treasury
securities are held by foreign investors, of this $713bn is held by foreign official
bodies with $502 held in Treasury bonds – some 16% of the total marketable
Treasuries outstanding. The majority of these holdings are concentrated in the
short and belly areas of the curve. As the rationale for the investment decision by
central banks is markedly divergent from that of the private sector, central banks
8/6/2019 Conv Heding Explained
http://slidepdf.com/reader/full/conv-heding-explained 6/16
R A T E S S T R A T E G Y
R A T E S S T R A T E G Y - G L O B A L 2 7 A U G U S T 2 0 0 3 6
are usually forced to hold certain maturities for reserve management reasons, their
increased holdings can impact on market liquidity.
Chart 4 : Mortgage bonds and marketable Treasuries outstanding
0
1000
2000
3000
4000
5000
6000
1 9 8 5
1 9 8 6
1 9 8 7
1 9 8 8
1 9 8 9
1 9 9 0
1 9 9 1
1 9 9 2
1 9 9 3
1 9 9 4
1 9 9 5
1 9 9 6
1 9 9 7
1 9 9 8
1 9 9 9
2 0 0 0
2 0 0 1
2 0 0 2
2 0 0 3
Treasury Mortgage
USD bn
Source: ABN AMRO
Methods of hedging
From the issuers’ perspective the prepayment risk they retain can best be hedged
using options as these can be used to replicate the duration and convexity
characteristics of the underlying mortgages. For example, convexity can be added
to a portfolio with the purchase of out of the money long call and put options – a
strangle. The underlying instrument for the strangle is usually one with a similar
duration to that of the MBS being hedged. The most popular underlying instruments
are 10- and 5 year Treasuries. The reason for this is that strangles only come into
the money (are profitable) if interest rates move a large amount. The exact amount
is determined by the strike prices of the options used for the strangle, which are
set by the MBS issuer when buying the strangle but are usually in the range of 25bp. Similarly, pre-payments only accelerate if prevailing yield levels shift
significantly. An alternative strategy is to replace the refinanced mortgages by
purchasing the new mortgages which come on stream as households re-mortgage
at lower rates.
Table 3 : FannieMae’s derivative positions during the course of last year
Dollars in millions Dec-02 Sep-02 Jun-02 Mar-02 Dec-01
Interest Rate Swaps:
Pay-fixed 168,512 193,002 236,757 222,287 213,680
Receive-fixed 52,370 58,235 50,241 42,746 39,069
Basis 25,525 40,305 46,410 49,860 47,054
Other 12,320 12,499 10,017 13,275 13,393
Options:
Interest Rate Caps 122,393 104,493 89,693 84,543 75,893
Pay-fixed swaptions 129,225 94,850 75,700 72,800 69,650
Receive-fixed swaptions 146,250 125,225 85,675 80,750 74,400
Total Notional Balance 656,595 628,609 594,493 566,261 533,139
Source: ABN AMRO
8/6/2019 Conv Heding Explained
http://slidepdf.com/reader/full/conv-heding-explained 7/16
R A T E S S T R A T E G Y
R A T E S S T R A T E G Y - G L O B A L 2 7 A U G U S T 2 0 0 3 7
Impact of liability management in a rising interest rate
environment
One of the main avenues for hedging their risk in a falling interest rate environment
is not available to issuers when rates are rising. Redemption payments are not a
continuous function, especially if yields have risen by more than the cost of re-
mortgaging in a short period of time as they have done in the latest sell-off.
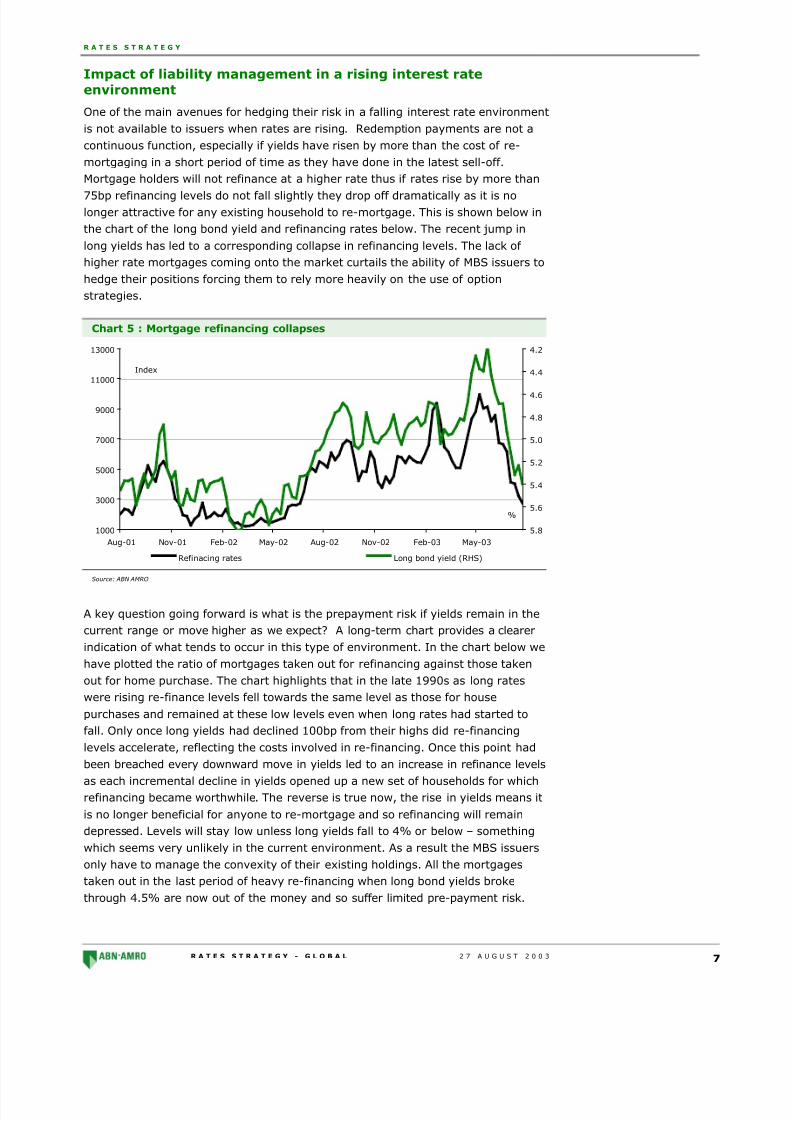
Mortgage holders will not refinance at a higher rate thus if rates rise by more than
75bp refinancing levels do not fall slightly they drop off dramatically as it is nolonger attractive for any existing household to re-mortgage. This is shown below in
the chart of the long bond yield and refinancing rates below. The recent jump in
long yields has led to a corresponding collapse in refinancing levels. The lack of
higher rate mortgages coming onto the market curtails the ability of MBS issuers to
hedge their positions forcing them to rely more heavily on the use of option
strategies.
Chart 5 : Mortgage refinancing collapses
1000
3000
5000
7000
9000
11000
13000
Aug-01 Nov-01 Feb-02 May-02 Aug-02 Nov-02 Feb-03 May-03
4.2
4.4
4.6
4.8
5.0
5.2
5.4
5.6
5.8
Refinacing rates Long bond yield (RHS)
Index
%
Source: ABN AMRO
A key question going forward is what is the prepayment risk if yields remain in the
current range or move higher as we expect? A long-term chart provides a clearer
indication of what tends to occur in this type of environment. In the chart below we
have plotted the ratio of mortgages taken out for refinancing against those taken
out for home purchase. The chart highlights that in the late 1990s as long rates
were rising re-finance levels fell towards the same level as those for house
purchases and remained at these low levels even when long rates had started to
fall. Only once long yields had declined 100bp from their highs did re-financing
levels accelerate, reflecting the costs involved in re-financing. Once this point had
been breached every downward move in yields led to an increase in refinance levels
as each incremental decline in yields opened up a new set of households for whichrefinancing became worthwhile. The reverse is true now, the rise in yields means it
is no longer beneficial for anyone to re-mortgage and so refinancing will remain
depressed. Levels will stay low unless long yields fall to 4% or below – something
which seems very unlikely in the current environment. As a result the MBS issuers
only have to manage the convexity of their existing holdings. All the mortgages
taken out in the last period of heavy re-financing when long bond yields broke
through 4.5% are now out of the money and so suffer limited pre-payment risk.

8/6/2019 Conv Heding Explained
http://slidepdf.com/reader/full/conv-heding-explained 8/16
R A T E S S T R A T E G Y
R A T E S S T R A T E G Y - G L O B A L 2 7 A U G U S T 2 0 0 3 8
Chart 6 : Mortgage refinancing over the longer term
0
5
10
15
20
25
Aug-98 Aug-99 Aug-00 Aug-01 Aug-02 Aug-03
4.0
4.5
5.0
5.5
6.0
6.5
Proportion LHS Long bond yield RHS
Remortgaging collapses
as yields rise and stay low
even as yields start to
decline. Remortgaging
only increase once yileds
have fallen 100bp from
their peak, the level
needed for refinancing to
become worthwhile.
100bp
refinancing remains elevated even during short
upward blips in yields
Inverse %
IndexMost of the mortgages taken out when
long bond yields were 5.5% are re-
mortgaged at 5% or below
Source: ABN AMRO
This being the case, convexity hedging of MBS based on these mortgages will also
slow at an increasing rate as yields rise. Chart 1 at the start of this piece and thetable below illustrate that the need to hedge for negative convexity as yields move
above the coupon level of the MBS is much lower as compared to when yields fall
below the coupon level. For example the duration of the FreddieMac 4.5% 30yr
increases 0.5 years from 6.5 years to 7.0 year if yields rise by 100bp. The
corresponding fall in duration for a 100bp yield decline is over three times as much
at 1.6 years from 6.5 to 4.9 years. Thus all outstanding mortgages that were
refinanced when long bond yields were in the 5.00 - 4.80 % range will require
much less hedging as yields rise above 5.50%.
Table 4 : Duration of the FreddieMac 4.5% 30yr for various yield changes
Duration 7.45 7.4 7.3 7.0 6.5 4.9 3 1.8 1.2 1.1
Yield change 400 300 200 100 0 -100 -150 -200 -300 -400
Source: ABN AMRO
However, this is only part of the story. The rise in yields will bring many more
mortgages which had coupon levels that were well above current market levels
closer to prevailing market yields as the table and chart below illustrate. Thus,
although mortgage hedging levels will decline for those mortgages which were
taken out during the recent spate of re-financing the effect of this will be swamped
by the volume of mortgages that are moving towards having coupons at current
market levels. The 5.5 to 6.0% coupon levels have particularly large amounts
outstanding suggesting that hedging activity will continue to weigh heavily on the
market for an extended time. Only once yields rise above 6.5% is hedging activitylikely to fall markedly from current levels.

8/6/2019 Conv Heding Explained
http://slidepdf.com/reader/full/conv-heding-explained 9/16
R A T E S S T R A T E G Y
R A T E S S T R A T E G Y - G L O B A L 2 7 A U G U S T 2 0 0 3 9
Table 5 : Amounts outstanding for each issuer per coupon level (USD bn)
Coupon FNMA FHLMC GNMA-1 GNMA-2 Total
4.50 71.9 67.1 2 0.1 141.1
5.00 228.5 156.8 19.5 8 412.8
5.50 412.4 226.9 58.3 26 723.6
6.00 330.4 215.5 64.9 34.8 645.6
6.50 256.2 181.4 75.5 35.4 548.5
7.00 108.6 65.2 52.9 21.4 248.1
7.50 41 25.2 22.5 6 94.7
8.00 17.8 12.1 15.2 2.7 47.8
8.50 5.6 4.1 4.5 0.5 14.7
9.00 2.7 2.2 4.2 0.2 9.3
Source: ABN AMRO
Chart 7 : Mortgage amounts outstanding
0
100
200
300
400
500
600
700
800
4.50 5.00 5.50 6.00 6.50 7.00 7.50 8.00 8.50 9.00
USD bn
Coupon %
Source: ABN AMRO

8/6/2019 Conv Heding Explained
http://slidepdf.com/reader/full/conv-heding-explained 10/16
R A T E S S T R A T E G Y
R A T E S S T R A T E G Y - G L O B A L 2 7 A U G U S T 2 0 0 3 10
Appendix
MBS issuers
The main agencies for this are The Federal National Mortgage Association (Fannie
Mae), the Federal Home Loan Mortgage Corporation (Freddie Mac), though the
Federal Home Loan Bank System, the Federal Farm Credit Bank System are also
important players. They accomplishes their mission by operating in the secondary
rather than the primary mortgage market purchasing mortgage loans from
mortgage lenders such as mortgage companies, savings institutions, credit unions,
and commercial banks, thereby replenishing those institutions' supply of mortgage
funds. They then either package these loans into Mortgage-Backed Securities
(MBS), which they guarantees for full and timely payment of principal and interest,
or purchase the loans for cash and retain them in their portfolio. The agencies
obtain the funds to finance its mortgage purchases and other business activities by
selling debt securities in the international capital markets.
Duration (or Macaulay duration): The weighted average maturity of all a bond’s
remaining cash flows. It is calculated by multiplying the present value of each cash
flow by the length of time in years until those cash flows are received. These values
are then summed together and divided by the sum of the present value of all the
cash flows. Thus, if a cash flow comes in earlier or later than implied by the bonds
structure the change in the payment date will have a direct impact on the duration
of the bond. Duration is closely related to modified duration which gives an
approximation of the relationship between price and yield. (MD is the first
derivative of price with respect to yield). Thus, any change in payment dates will
also impact modified duration and so the relationship between the effect of a
change in yield on price.
Convexity: Even if a bond’s cash flows do not deviate from those scheduled in itsterms and conditions the relationship between changes in yield and the impact on
prices is not constant (linear) it changes with the level of yields. The rate at which
the relationship between a given change in yield and its effect on price evolves is
termed convexity. It is the second derivative between yield and price. Thus, if a
bond has positive convexity, if yields fall in 10bp steps its price will rise at an
increasing rate for each 10bp fall in yields. Most bonds exhibit positive convexity.
The main exception to this are mortgage bonds.
Structuring issues: Mortgage securities represent an ownership interest in
mortgage loans made by financial institutions (savings and loans, commercial
banks or mortgage companies) to finance the borrower’s purchase of a home or
other real estate. Mortgage securities are created when these loans are packaged,or “pooled,” by issuers or servicers for sale to investors.
As the underlying mortgage loans are paid off by the homeowners, the investors
receive payments of interest and principal. The most basic mortgage securities,
known as “pass throughs,” or participation certificates (PCs), represent a direct
ownership interest in a pool of mortgage loans. More complex type of mortgage
security known as a Collateralised Mortgage Obligation (CMO) allow cash flows to
be directed so that different classes of securities with different maturities and

8/6/2019 Conv Heding Explained
http://slidepdf.com/reader/full/conv-heding-explained 11/16
R A T E S S T R A T E G Y
R A T E S S T R A T E G Y - G L O B A L 2 7 A U G U S T 2 0 0 3 11
coupons can be created. They may be collateralised by mortgage loans as well as
securitised pools of loans.
Pass-throughs or Participation Certificates (PCs): As the name suggests, the
issuer or servicer of pass-through securities collects the monthly payments from
the homeowners whose loans are in a given pool and “passes through” the cash
flow to investors in monthly payments which represent both interest and
repayment of principal. The payments of principal and interest on passthroughs areconsidered secure; however, the cash flow on these investments may vary from
month to month, depending on the actual prepayment rate of the underlying
mortgage loans. At issuance, the stated maturity of pass-through securities is
generally 30 years, although an increasing number may have 15-, seven- or five-
year stated maturities.
Most pass-throughs are backed by fixed-rate mortgage loans; however, adjustable-
rate mortgage loans (ARMs) are also pooled to create the securities. Most ARMs
have caps and floors limiting the extent of interest-rate changes, and these option-
like characteristics require that pass-throughs backed by ARMs have higher yields
than pure floating-rate debt securities. The market for ARMS is largely an
institutional market.
CMOs or REMICs (Real Estate Mortgage Investment Conduit): The CMO is a
multiclass bond backed by a pool of mortgage pass-throughs or mortgage loans. In
structuring a CMO, an issuer distributes cash flow from the underlying collateral
over a series of classes (called tranches) which constitute the bond issue. Each
CMO is a set of two or more tranches, each having average lives and cash-flow
patterns designed to meet specific investment objectives. The average life
expectancies of the different tranches in a four-part deal, for example, might be
two, five, seven and 20 years. Some CMOs issued have had more than 50 tranches.
As the payments on the underlying mortgage loans are collected, typically the CMO
issuer first pays the coupon rate of interest to the bondholders in each tranche. All
scheduled and unscheduled principal payments generated by the collateral, as
loans are repaid or prepaid, go first to investors in the first tranches. Investors in
later tranches do not start receiving principal payments until the prior tranches are
paid off. This basic type of CMO is known as a sequential pay or plain vanilla CMO.
Any collateral remaining after the final tranche has been paid is known as the
residual.
The final tranche of a CMO often takes the form of a Z-bond, also known as an
accrual bond or accretion bond. Holders of these securities receive no cash until the
earlier tranches are paid in full. During the period that the other tranches are
outstanding, the periodic interest accruals are added to the initial face amount of
the bond but are not paid to investors. When the prior tranches are retired, the Z-
bond receives coupon payments on its higher principal balance, plus any principal
prepayments from the underlying mortgage loans. The existence of a Z-bond
tranche helps stabilise the cashflow patterns in the other tranches. In a changing
interest rate environment, however, the value of the Z-bond itself tends to be more
volatile. As the CMO has evolved, some modifications in the classes of bonds have
become more prevalent. The planned amortisation class (PAC) and targeted
amortisation class (TAC), for example, were designed to reduce investors’
prepayment risk by establishing a sinking-fund structure. PAC and TAC bonds
assure to varying degrees that their investors will receive payments over a
8/6/2019 Conv Heding Explained
http://slidepdf.com/reader/full/conv-heding-explained 12/16
R A T E S S T R A T E G Y
R A T E S S T R A T E G Y - G L O B A L 2 7 A U G U S T 2 0 0 3 12
predetermined time period under various prepayment scenarios. Although PAC and
TAC bonds are similar, PAC bonds tend to provide more stable cash flow under a
greater number of prepayment scenarios than TAC bonds.
The existence of a PAC or TAC tranche can create higher levels of risk for other
tranches in the CMO because the stability of the PAC or TAC tranche is achieved by
creating at least one other tranche—known as a companion bond or a support or
non-PAC bond—which absorbs the variability of collateral principal cash flows.Because companion bonds have a high degree of average life variability, they
generally pay a higher yield. Companion bonds are not always labelled as such,
however. Moreover, a TAC bond can have some of the prepayment variability of a
companion bond if there is also a PAC bond in the issue.
A Principal Only (PO) is created by stripping the coupon interest from the
underlying mortgages. Because it carries no coupon, a PO is extremely sensitive to
prepayments. Higher prepayments lead to a higher yield. In contrast, an Interest
Only (IO) is the coupon payments from the underlying mortgages. IOs are usually
sold at a deep discount relative to a notional principal amount. IOs increase in
value when prepayment rates decline. Finally, the floating-rate tranche has all the
attributes of multiclass securities except that coupon rates are periodically reset toa margin over the index. The key to analyzing a floating-rate CMO is understanding
the interaction between rate caps and prepayments. Another variation of the CMO
structure is the inverse floater, which has a coupon rate that moves inversely with
the index rate.
Callable Pass-throughs: One of the newest developments in the MBS market is
the Callable Pass-through. A Callable Pass-through is created by splitting a
passthrough into two classes: a “Callable Class” and a “Call Class.” The Callable
Class receives all of the principal and interest from the underlying collateral. The
Call Class receives no principal or interest. The holder of the Call Class has a right
to call the underlying pass-through at a stated price (usually par plus accrued
interest) from the Callable Class holders after a specified period of time has passed
from issuance of the two classes. The Callable Class holder is still long a bond and
short a call option, as is any MBS investor. But rather than just being short a series
of call options to a number of underlying borrowers who may or may not exercise
their option, the holder is also short one call option to one other investor. This
other investor, given his/her economic incentive, will call the underlying pass
through from the Callable Class holder in a much more efficient manner than the
mortgage borrower will. Thus, the Callable Class holder will have reduced
performance relative to pass-through holders if rates fall. For the more limited
upside performance potential, the investor is usually paid more in yield.
Callable Pass-throughs in CMOs. Callable Passthroughs can be used as collateral
to back CMOs or REMICs. Investors need to pay attention to this, as a call of the
underlying Callable Pass-throughs would result in a call of all the outstanding
tranches in a deal. This can be particularly important to holders of long-term
classes.
8/6/2019 Conv Heding Explained
http://slidepdf.com/reader/full/conv-heding-explained 13/16
R A T E S S T R A T E G Y
R A T E S S T R A T E G Y - G L O B A L 2 7 A U G U S T 2 0 0 3 13
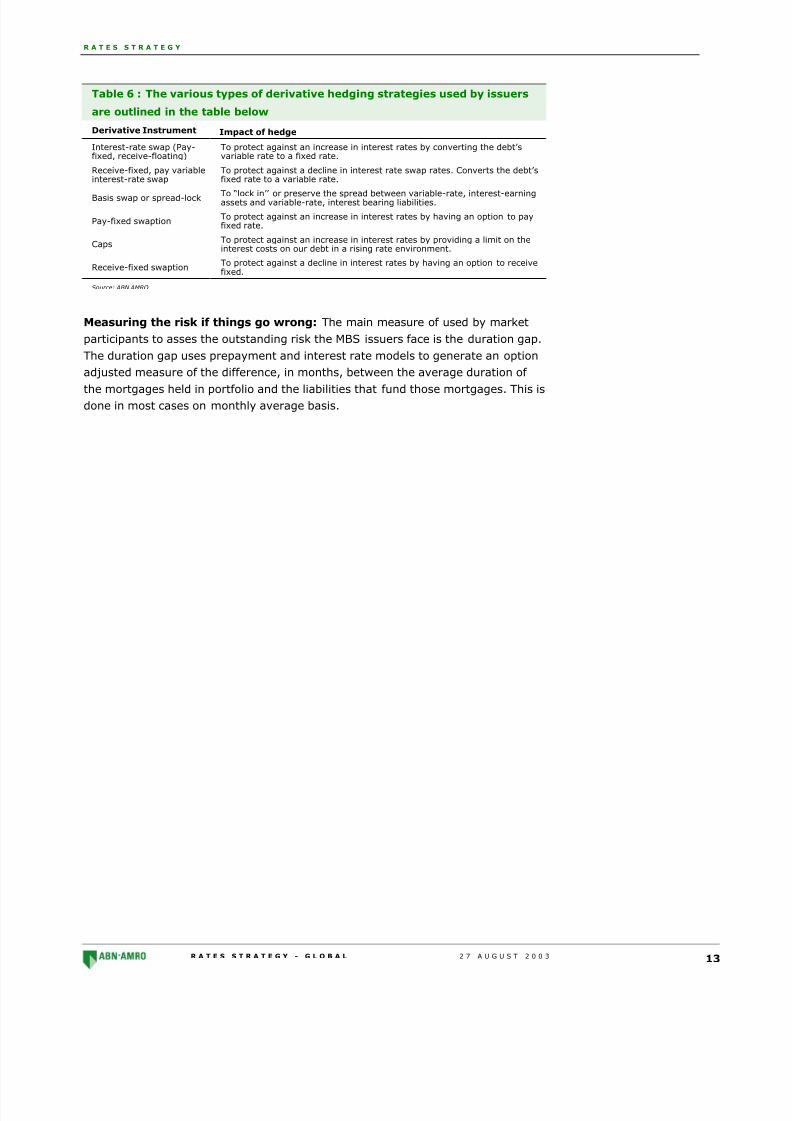
Table 6 : The various types of derivative hedging strategies used by issuers
are outlined in the table below
Derivative Instrument Impact of hedge
Interest-rate swap (Pay-fixed, receive-floating)
To protect against an increase in interest rates by converting the debt’svariable rate to a fixed rate.
Receive-fixed, pay variableinterest-rate swap
To protect against a decline in interest rate swap rates. Converts the debt’sfixed rate to a variable rate.
Basis swap or spread-lock To “lock in’’ or preserve the spread between variable-rate, interest-earningassets and variable-rate, interest bearing liabilities.
Pay-fixed swaptionTo protect against an increase in interest rates by having an option to payfixed rate.
CapsTo protect against an increase in interest rates by providing a limit on theinterest costs on our debt in a rising rate environment.
Receive-fixed swaptionTo protect against a decline in interest rates by having an option to receivefixed.
Source: ABN AMRO
Measuring the risk if things go wrong: The main measure of used by market
participants to asses the outstanding risk the MBS issuers face is the duration gap.
The duration gap uses prepayment and interest rate models to generate an option
adjusted measure of the difference, in months, between the average duration of
the mortgages held in portfolio and the liabilities that fund those mortgages. This isdone in most cases on monthly average basis.
8/6/2019 Conv Heding Explained
http://slidepdf.com/reader/full/conv-heding-explained 14/16
R A T E S S T R A T E G Y - G L O B A L 2 7 A U G U S T 2 0 0 3 14
Companies mentioned:
_____________________________________________________________________________________________________
The research analyst or analysts responsible for the content of this research report certify that: (1) the views expressed andattributed to the research analyst or analysts in the research report accurately reflect their personal opinion(s) about thesubject securities and issuers and/or other subject matter as appropriate; and, (2) no part of his or her compensation was, isor will be directly or indirectly related to the specific recommendations or views contained in this research report. On a generalbasis, the efficacy of recommendations is a factor in the performance appraisals of analysts.
_____________________________________________________________________________________________________
Copyright 2003 ABN AMRO Bank N.V. and affiliated companies ("ABN AMRO"). All rights reserved.
This material was prepared by the ABN AMRO affiliate named on the cover or inside cover page. It is provided for informationalpurposes only and does not constitute an offer to sell or a solicitation to buy any security or other financial instrument. Whilebased on information believed to be reliable, no guarantee is given that it is accurate or complete. While we endeavour toupdate on a reasonable basis the information and opinions contained herein, there may be regulatory, compliance or otherreasons that prevent us from doing so. The opinions, forecasts, assumptions, estimates, derived valuations and target price(s)contained in this material are as of the date indicated and are subject to change at any time without prior notice. Theinvestments referred to may not be suitable for the specific investment objectives, financial situation or individual needs of recipients and should not be relied upon in substitution for the exercise of independent judgement. ABN AMRO may from timeto time act as market maker, where permissible under applicable laws, or, as an agent or principal, buy or sell securities,warrants, futures, options, derivatives or other financial instruments referred to herein. ABN AMRO or its officers, directors,employee benefit programmes or employees, including persons involved in the preparation or issuance of this material, mayfrom time to time have long or short positions in securities, warrants, futures, options, derivatives or other financialinstruments referred to in this material. ABN AMRO may at any time solicit or provide investment banking, commercial banking,credit, advisory or other services to the issuer of any security referred to herein. Accordingly, information may be available to
ABN AMRO, which is not reflected in this material, and ABN AMRO may have acted upon or used the information prior to orimmediately following its publication. Within the last three years, ABN AMRO may also have acted as manager or co-managerfor a public offering of securities of issuers referred to herein. The stated price of any securities mentioned herein is as of thedate indicated and is not a representation that any transaction can be effected at this price. Neither ABN AMRO nor otherpersons shall be liable for any direct, indirect, special, incidental, consequential, punitive or exemplary damages, including lostprofits arising in any way from the information contained in this material. This material is for the use of intended recipients onlyand the contents may not be reproduced, redistributed, or copied in whole or in part for any purpose without ABN AMRO's priorexpress consent. In any jurisdiction in which distribution to private/retail customers would require registration or licensing of the distributor which the distributor does not currently have, this document is intended solely for distribution to professionaland institutional investors.
Should you require additional information please contact your local ABN AMRO account representative, unless governing lawsdictate otherwise.
Australia: Any report referring to equity securities is distributed in Australia by ABN AMRO Equities Australia Ltd (ABN 84 002768 701), a participating organisation of the Australian Stock Exchange Ltd. Any report referring to fixed income securities isdistributed in Australia by ABN AMRO Bank NV (Australia Branch) (ARBN 079 478 612). Australian investors should note thatthis document was prepared for wholesale investors only.
Canada: The securities mentioned in this material are available only in accordance with applicable securities laws and may notbe eligible for sale in all jurisdictions. Persons in Canada requiring further information should contact ABN AMRO Incorporated.
Hong Kong: This document is being distributed in Hong Kong by, and is attributable to, ABN AMRO Asia Limited which isregulated by the Securities and Futures Commission of Hong Kong.
India: Shares traded on stock exchanges within the Republic of India may only be purchased by different categories of residentIndian investors, Foreign Institutional Investors registered with The Securities and Exchange Board of India ("SEBI") orindividuals of Indian national origin resident outside India called Non Resident Indians ("NRIs") and Overseas Corporate Bodies("OCBs"), predominantly owned by such persons or Persons of Indian Origin (PIO). Any recipient of this document wantingadditional information or to effect any transaction in Indian securities or financial instrument mentioned herein must do so bycontacting a representative of ABN AMRO Asia Equities (India) limited.
Italy: Persons in Italy requiring further information should contact ABN AMRO Bank N.V. Milan Branch.
Japan: This report is being distributed in Japan by ABN AMRO Securities Japan Ltd to institutional investors only.
New Zealand: This document is distributed in New Zealand by ABN AMRO Equities NZ Limited a New Zealand Stock ExchangeFirm.
Russia: The Russian securities market is associated with several substantial risks, legal, economic and political, and highvolatility. There is a relatively high measure of legal uncertainty concerning rights, duties and legal remedies in the RussianFederation. Russian laws and regulations governing investments in securities markets may not be sufficiently developed or maybe subject to inconsistent or arbitrary interpretation or application. Russian securities are often not i ssued in physical form andregistration of ownership may not be subject to a centralised system. Registration of ownership of certain types of securitiesmay not be subject to standardised procedures and may even be effected on an ad hoc basis. The value of investments inRussian securities may be affected by fluctuations in available currency rates and exchange control regulations.
Singapore: This document is distributed in Singapore by ABN AMRO Asia Securities (Singapore) Private Limited to clients who
fall within the description of persons in Regulation 49(5) of the Securities and Futures (Licensing and Conduct of Business)Regulations 2002. Investors should note that this material was prepared for professional investors only.
United Kingdom: Equity research is distributed in the United Kingdom by ABN AMRO Equities (UK) Limited, which is registeredin England (No 2475694), and is authorised and regulated by the Financial Services Authority. All other research is distributedin the United Kingdom by ABN AMRO Bank NV, London Branch, which is authorised by the Dutch Central Bank and by theFinancial Services Authority; and regulated by the Financial Services Authority for the conduct of UK business. The investmentsand services contained herein are not available to private customers in the United Kingdom.
United States: Distribution of this document in the United States or to US persons is intended to be solely to major institutionalinvestors as defined in Rule 15a-6(a)(2) under the US Securities Act of 1934. All US persons that receive this document bytheir acceptance thereof represent and agree that they are a major institutional investor and understand the risks involved inexecuting transactions in securities. Any US recipient of this document wanting additional information or to effect anytransaction in any security or financial instrument mentioned herein, must do so by contacting a registered representative of ABN AMRO Incorporated, Park Avenue Plaza, 55 East 52nd Street, New York, N.Y. 10055, US, tel + 1 212 409 1000, fax +1212 409 5222.
1 Material means all research information contained in any form including but not limited to hard copy, electronic form,presentations, e-mail, SMS or WAP.

8/6/2019 Conv Heding Explained
http://slidepdf.com/reader/full/conv-heding-explained 15/16
R A T E S S T R A T E G Y - G L O B A L 2 7 A U G U S T 2 0 0 3 15

8/6/2019 Conv Heding Explained
http://slidepdf.com/reader/full/conv-heding-explained 16/16
R A T E S S T R A T E G Y - G L O B A L 2 7 A U G U S T 2 0 0 3 16