contributions regarding transylvania's ethnic and...
TRANSCRIPT

Contributions Regarding Transylvania's Ethnic and Religious Structure in 20 t h Century
Sorina & loan Bolovan Center for Transylvanian Studies
The 20 t h century has been one of the most dynamic and complex stages in the history of Central and South-Eastern Europe. First of all, this period has been under the sign of two world wars and of the geo-political changes that followed. Then again, both the setting up of the totalitarian regimes after 1945 and the collapse of the communist block at the end of the ninth decade have given the historical evolution of the states in this area a distinctive feature. Under such circumstances, significant changes have affected the geographical distribution of the population, and mainly its ethnic and religious composition.
Within the rather narrow limits of this study we shall try to sketch some of the most important aspects in the evolution of the ethno-religious structures in 20 t h century Transylvania. We should mention that we use the wide meaning of the term Transylvania, which refers to a larger area including the Banat, Crişana, Maramureş and the former Great Principality of Transylvania. In order to investigate demographic dynamics and the ethnic and religious composition, we chose from among the censuses carried out by Hungarian and then by Romanian authorities those which we considered the most relevant: 1900, 1930, 1956, 1977 and 1992.
First, we should make a brief presentation of the political administrative history of Transylvania between 1900-1992. As it is widely known, the province was part of the multinational Austro-Hungarian empire till 1918. At the end of World War I, when the dualist monarchy broke down, the Romanians - who were the majority in the province - put the principle of national self-determination into operation at Alba Iulia on 1 December. The 1288 elected representatives of all Transylvanian Romanians present at Alba Iulia decided on the complete union of Transylvania with Romania. The peace
During the period when this study was being prepared, loan Bolovan was invited in Great Britain by the British Association for Central and Eastern Europe and the British Academy. The authors express their gratitude to Mr. Alan Brooke Turner, Mr. Peter Brown and Dr. Dennis Deletant for their generous help.

Table no. 1. The Evolution of Population in Transylvania between 1900-1992
Year Number of
people Population size as compared to: Reale rowth
Year Number of
people 1900 previous census Period Number Percent 1900 4,872,021 100% - - - -1930 5,548,363 113.9% 113.9% 1901-1930 676,342 13.9% 1956 6,232,312 127.9% 112.3% 1931-1956 683,949 12.3% 1977 7,500,223 153.9% 120.3% 1957-1977 1,267,911 20.3% 1992 7,709,944 158.8% 102.8% 1978-1992 209,721 2.8%
. - 1900-1992 2,837,923 . 58.8% Sources: I.I. Adam, I. Puşcaş, Izvoare de demografìe istorică, voi. Il, sec. al X1X-tea - 1914. Transilvania, Bucureşti, 1987;
Recensământul general al populaţiei României din 29 decembrie 1930, Bucureşti, vol. Il, 1938; Recensământul populaţiei din 21 februarie 1956. Rezultate generale, Bucureşti, 1959; Recensământul populaţiei şi locuinţelor din 7 ianuarie 1992. Rezultate preliminare. Bucureşti, 1992.
Regarding the events related to the union of Transylvania with Romania and its integration into the Romanian national state, see Transylvanian Review, vol. II, no. 3,1993, pp. 5-62. 2 S. ManuilS, Studies on the Historical Demography of Romania, edited by Sorina and loan Bolovan, Cluj-Napoca, 1992, p. 144.
conference in Paris, the treaty of Trianon in 1920 sanctioned on an international level a political reality which corrected the centuries of suffering and injustice endured by the Romanians after Transylvania was conquered by the Magyar kingdom at the beginning of the Middle Ages. Between the two world wars, Transylvania integrated normally into the unitary Romanian state 1, whose legislation allowed the full economical, political and cultural assertion of all minorities.
The ascent of the fascist states in the fourth decade represented a serious danger for the security and integrity of the new national states in the South-East and the Center of the continent. In the summer of 1940, in Vienna, the representatives of Germany and Italy forced Romania to cede North-Western Transylvania to Hungary. This dictate was imposed despite ethnic realities, as Romanians represented 49.2% of the entire population, while Magyars represented only 38 .1% 2 . In the fall of 1944, the Romanian army fighting together with the allied Russian army against Germany liberated North-Western Transylvania. Later, the territory became again part of Romania, a reality that was sanctioned by the peace treaty signed in Paris in 1947. Since then, the entire Transylvanian territory has been part of the Romanian state, which is a logical and normal state of things due to the fact that over two thirds of the province's population is Romanian (see table no. 2).
o
1900 . 1930 1956 1977 1992
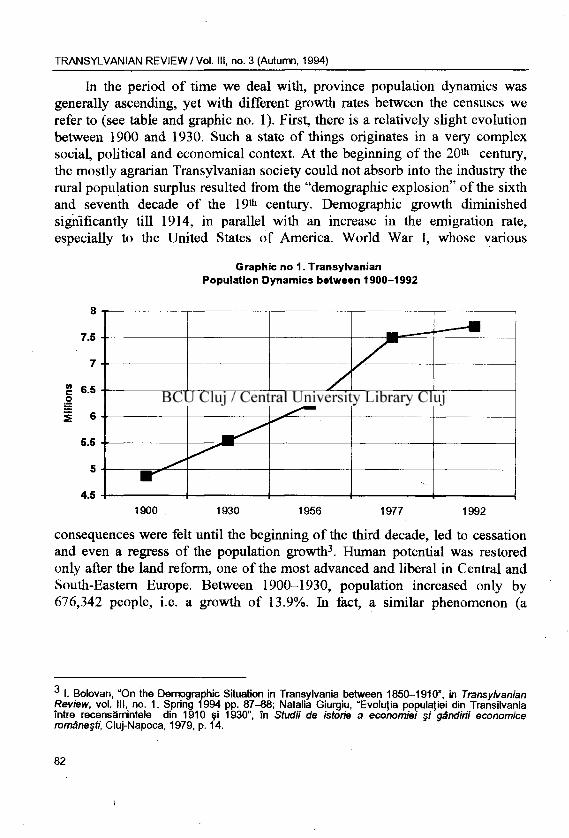
consequences were felt until the beginning of the third decade, led to cessation and even a regress of the population growth 3. Human potential was restored only after the land reform, one of the most advanced and liberal in Central and South-Eastern Europe. Between 1900-1930, population increased only by 676,342 people, i.e. a growth of 13.9%. In fact, a similar phenomenon (a
J I. Bolovan, "On the Demographic Situation in Transylvania between 1850-1910", in Transylvanian Review, vol. Ill, no. 1, Spring 1994 pp. 87-88; Natalia Giurgiu, "Evoluţia populaţiei din Transilvania între recensămintele din 1910 şi 1930", în Studii de istorie a economiei şi gândirii economice româneşti, Cluj-Napoca, 1979, p. 14.
In the period of time we deal with, province population dynamics was generally ascending, yet with different growth rates between the censuses we refer to (see table and graphic no. 1 ). First, there is a relatively slight evolution between 1900 and 1930. Such a state of things originates in a very complex social, political and economical context. At the beginning of the 20 t h century, the mostly agrarian Transylvanian society could not absorb into the industry the rural population surplus resulted from the "demographic explosion" of the sixth and seventh decade of the 19 t h century. Demographic growth diminished significantly till 1914, in parallel with an increase in the emigration rate, especially to the United States of America. World War I, whose various
Graphic no 1. Transylvanian Population Dynamics between 1900-1992
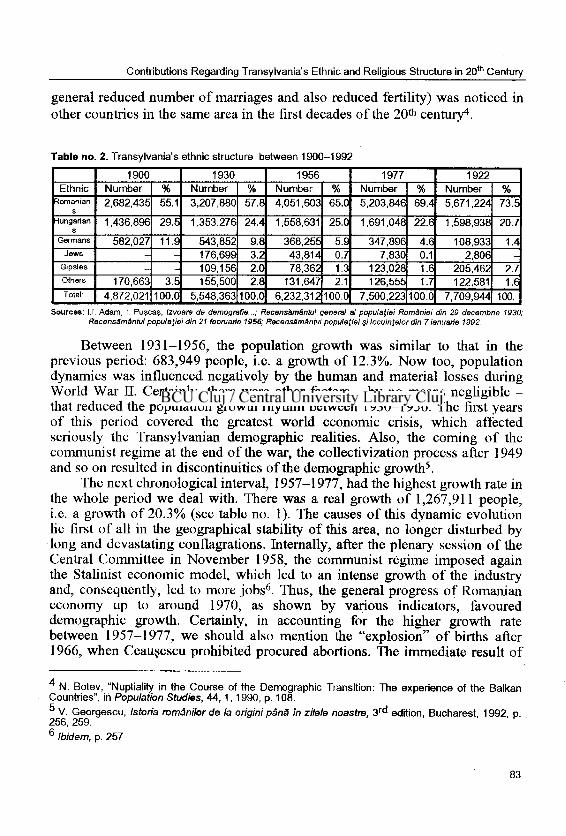
Table no. 2. Transylvania's ethnic structure between 1900-1992
1900 1930 1956 1977 1922 Ethnic Number % Number % Number % Number % Number %
Romanian s
2,682,435 55.1 3,207,880 57.8 4,051,603 65.0 5,203,846 69.4 5,671,224 73.5 Hungarian
s 1,436,896 29.5 1,353,276 24.4 1,558,631 25.0 1,691,048 22.6 1,598,938 20.7
Germans 582,027 11.9 543,852 9.8 368,255 5.9 347,896 4.6 108,933 1.4 Jews - 176,699 3.2 43,814 0.7 7,830 0.1 2,806 -Gipsies - 109,156 2.0 78,362 1.3 123,028 1.6 205,462 2.7
Others 170,663 3.5 155,500 2.8 131,647 2.1 126,555 1.7 122,581 1.6 Total: 4,872,021 100.0 5,548,363 100.0 6,232,312 100.0 7,500,223 100.0 7,709,944 100.
Sources: I.I. Adam, I Puşcaş, Izvoare de demografie...; Recensământul general al populaţiei României din 29 decembrie 1930; Recensământul populaţiei din 21 februarie 1956; Recensământul populaţiei şi locuinţelor din 7 ianuarie 1992.
Between 1931-1956, the population growth was similar to that in the previous period: 683,949 people, i.e. a growth of 12.3%. Now too, population dynamics was influenced negatively by the human and material losses during World War II. Certainly, there were other factors - by no means negligible -that reduced the population growth rhythm between 1930-1956. The first years of this period covered the greatest world economic crisis, which affected seriously the Transylvanian demographic realities. Also, the coming of the communist regime at the end of the war, the collectivization process after 1949 and so on resulted in discontinuities of the demographic growth 5.
The next chronological interval, 1957-1977, had the highest growth rate in the whole period we deal with. There was a real growth of 1,267,911 people, i.e. a growth of 20.3% (see table no. 1). The causes of this dynamic evolution lie first of all in the geographical stability of this area, no longer disturbed by long and devastating conflagrations. Internally, after the plenary session of the Central Committee in November 1958, the communist regime imposed again the Stalinist economic model, which led to an intense growth of the industry and, consequently, led to more jobs 6 . Thus, the general progress of Romanian economy up to around 1970, as shown by various indicators, favoured demographic growth. Certainly, in accounting for the higher growth rate between 1957-1977, we should also mention the "explosion" of births after 1966, when Ceauşescu prohibited procured abortions. The immediate result of
4 N. Botev, "Nuptiality in the Course of the Demographic Transition: The experience of the Balkan Countries", in Population Studies, 44, 1, 1990, p. 108. 5 V. Georgescu, Istoria românilor de la origini până in zilele noastre, 3 r d edition, Bucharest, 1992 p. 256, 259. 6 Ibidem, p. 257
general reduced number of marriages and also reduced fertility) was noticed in other countries in the same area in the first decades of the 20 t h century 4.

— + — Romanians — • — Hungarians — £ — Germans
# — Other ethnic groups
— + — Romanians — • — Hungarians — £ — Germans
# — Other ethnic groups
— + — Romanians — • — Hungarians — £ — Germans
# — Other ethnic groups
. •- g • A
I — 1 I — m 1900 1930 1956 1977 1992
VI. Trebici, Demografia, Bucureşti, 1979, p. 231. V. Georgescu, op. cit., p. 290.
this aberrant demographic policy resulted in a gross birth rate of 14.3%o in 1966, and as high as 27.4%o in 1967 in entire Romania. However, in a short while, there was a tendency to return to previous values, the gross birth rate being of 19.5%oin 1976 7.
The period between the censuses of 1977 and 1992 had the lowest growth rate in the entire period of time we deal with (see table no. 1). There was a real growth of only 209,721 people, i.e. a growth of 2.8% (in fact, in Romania as a whole, the growth between 1978-1992 was 5.6%). The dramatic diminishing of the Romanian populations's living standard in the ninth decade greatly influenced, we believe, the normal demographic evolution 8. The use of ration cards for the main foods beginning with 1981, the program of "reasonable nourishment", the higher inflation rate, the lack of social protection, etc., all led to the diminishing of the birth rate despite the pro-life policy of the Communist Party. In this period, there is also a tendency in families of all social strata to have only one child. We shouldn't overlook the effects of constant emigration either, since between 1977 and 1992 this phenomenon increased ceaselessly. After the fall of Ceauşescu's regime in December 1989, emigration persisted, political reasons being replaced by economical ones.
Therefore, for over a century, between 1901-1992, Transylvania's real growth was 2,837,923 people, i.e. a growth of 58.8%. Certainly, the factors that influenced, positively or negatively, the province's population dynamics
Graphic no 2. The Evolution of Transylvania's Ethnic Structure between 1900-1992
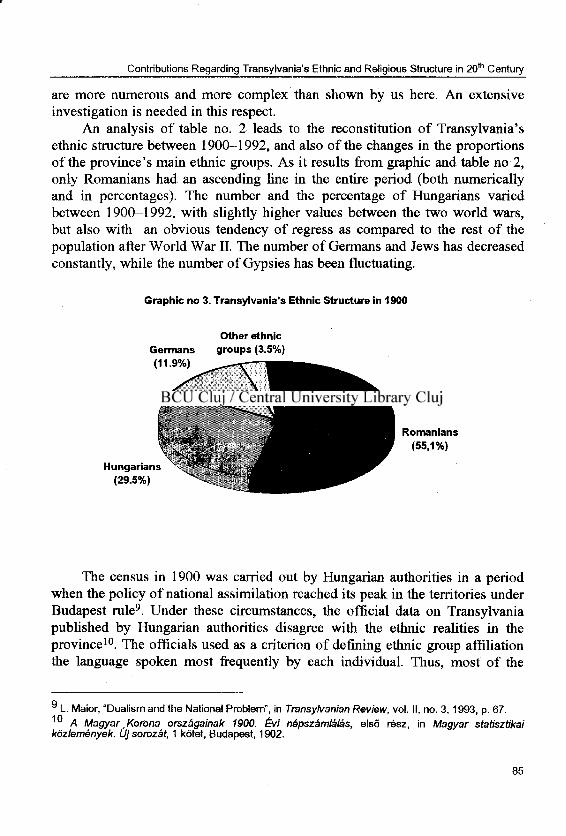
Graphic no 3. Transylvania's Ethnic Structure in 1900
The census in 1900 was carried out by Hungarian authorities in a period when the policy of national assimilation reached its peak in the territories under Budapest rule 9. Under these circumstances, the official data on Transylvania published by Hungarian authorities disagree with the ethnic realities in the province 1 0 . The officials used as a criterion of defining ethnic group affiliation the language spoken most frequently by each individual. Thus, most of the
9 L. Maior, "Dualism and the National Problem", in Transylvanian Review, vol. II, no. 3,1993, p. 67. 1 0 A Magyar Korona orszâgainak 1900. Évi népszâmlàlâs, elsô rész, in Magyar statisztikai kôzlemények. Ojsorozât, 1 kòtet, Budapest, 1902.
are more numerous and more complex than shown by us here. An extensive investigation is needed in this respect.
An analysis of table no. 2 leads to the reconstitution of Transylvania's ethnic structure between 1900-1992, and also of the changes in the proportions of the province's main ethnic groups. As it results from graphic and table no 2, only Romanians had an ascending line in the entire period (both numerically and in percentages). The number and the percentage of Hungarians varied between 1900-1992, with slightly higher values between the two world wars, but also with an obvious tendency of regress as compared to the rest of the population after World War II. The number of Germans and Jews has decreased constantly, while the number of Gypsies has been fluctuating.

Table no. 3. The Ethnic Structure of the Transylvanian Rural and Urban Population
Year Area Romanians Hungarians Germans Jews Other
Year Area Number % Number % Number % Number % Number % 1900 Rural 2,578,487 60.2 893,083 22.9 481,380 11.2 99,839 2.3 143,104 3.4 1900
Urban 103,948 17.7 294,229 50.2 100,647 17.1 56,745 10.2 27,559 4.8 1930 Rural 2,871,124 62.6 988,268 21.5 416,916 9.1 78,286 1 8 231,396 5.0 1930
Urban 336,756 34.9 365,008 37.9 126,936 13.2 100,413 10.4 33,260 3.6 1956 Rural 2,789,412 68.6 919,483 22.6 186,750 4.6 3,783 0.1 167,831 4.1 1956
Urban 1,262,191 58.3 639,148 29.5 181,505 8.4 40,031 1.8 42,178 2.0 1992 Rural 2,208,113 69.9 704,872 22.3 37,727 1.2 103 - 205,755 6.5 1992
Urban 3,463,111 76.0 894,066 19.6 71,206 1.6 2,703 0.06 122,288 2.7
Sources: I.I Adam, Ì. Puşcaş, Izvoare de demografie..., Recensământul general al populaţiei României din 29 decembrie 1930; Recensământul populaţiei din 21 februarie 1956; Recensământul populaţiei şi locuitorilor din 7 ianuarie 1992.
As it results from table no. 3, the distribution of the main ethnic groups in Transylvania according to areas (urban and rural) shows obvious inequalities. The small number of Romanians in urban areas is surprising: only 17.7% of the entire urban population, while Hungarians represented 50.2%. The explanation of this state of things lies in the Transylvanian Romanian's status in previous centuries. Thus, up to the end of the 18 t h century, Romanians were forbidden to settle in towns 1 2 . Actually, after the revolution of 1848-1849, the last political and economic barriers that stopped Romanians from settling in Transylvanian towns were removed. In the second half of the 19 t h century, after feudal relations were abolished, but mainly after 1880, there was a clear tendency of the rural population to migrate towards towns, which were at that time at the beginning of the industrialization process. As a result, a numerical increase of the Romanian population in urban areas was noticed (mainly in small towns), although they still represented a disproportionately low percentage as compared
I. Bolovan, "On the Demographic Situation...". The State Archives, Bucharest, Sabin Manuilă Personal Fund, XII/60, 1.2.
Jews, Gypsies, Armenians, etc., were registered as speakers of Hungarian, and therefore Hungarians. It is consequently easy to explain the 29.5% Hungarians in Transylvania, because of the biased way of carrying out the census (in 1880, Hungarians represented 25.2%, and such a natural growth in just 20 years wouldn't have been possible) 1 1 . Romanians, 55.1% of the province population, represented numerically and in percentages the majority, although they were quasi-excluded from political life by the Hungarian government. The Germans represented 11.9% of the population total, the 3.8% that was left consisted of other ethnic groups (Ruthenians, Serbs, Croats, Czechs, Slovaks, etc.).

Graphic no 4. Transylvania's Ethnic Structure in 1930
The figures revealed by the census of 1930 show the changes that occurred in the ethnic structure of the Transylvanian population after the union with Romania in 1918 (see table no. 2 and graphic no. 4). An increase of the Romanian population to 57.8% of the entire population between 1900-1930 is only natural, and it shows a normal evolution. The decrease of the Magyar population ratio by almost 5% was not the result of a brutal and direct
1 J A Magyar orszàgainak 1900... ^ 4 I. Russu-Şirianu, Românii din statul ungar (statistică, etnografie), published by the author, 1904, p. 255.
to their total number in Transylvania. For instance, in towns like Lugoj, Caransebeş, Braşov, Turda, Bistriţa, Baia Mare and so on, Romanians represented between 20% and 50%, while in Satu Mare, Cărei, Oradea, Târgu Mureş, Cluj, Arad, Timişoara and so on, they represented under 20%, and sometimes even under 10% 1 3 . We should mention that peasants were somehow reluctant at that time to let their sons study in towns or work in factories, for fear they might become denationalized and alienated in a strange environment 1 4. In fact, towns were considered at that time "strongholds" of forced magyarization, which emphasized the reluctance of the Romanian rural population to migrate to town.

Graphic no 5. The Evolution of the Transylvanian Jewish Population between 1900-1992
1900 1930 1956 1977 1992
1 0 Sândor Biro, The Nationalities Problem in Transylvania 1867-1940. A Social History of the Romanian Minority under Hungarian Rule 1867-1918 and of the Hungarian Minority under Romanian Rule 1918-1940, New York, 1992, p. 431; Elemer Wyes, National Minorities in Romania. Change in Transylvania, New York, 1982, p. 58-69. 1 fi I D S. Manuilă, "Evoluţia demografică a oraşelor şi minorităţile etnice din Transilvania", in Arhiva pentru ştiinţa şi reforma socială, VIII, 1929, no. 1-3, p. 129. ^ ' ldem,"Stmcture et évolution de la population rurale", in Studies on the Historical Demography..., p. 115; E. Illyés, National Minorities..., p. 23.
intervention of the Romanian authorities, as certain studies try to suggest 1 5
There were numerous causes for this decrease, but we shall enumerate only two of the most important: the ethnic groups as well as all those who were registered in 1900 as Magyars - because they had declared they used Hungarian most frequently - underwent a process of national identity revigoration after the union of Transylvania with Romania. The case of the Swabians in the Satu Mare area is quite famous, also of the Jews, Armenians, Slovaks, and so on 1 0 . On the other hand, a great part of the military officers and of the administration - consisting mostly of Hungarians - left Transylvania after 1918. They were accompanied by that part of the civilian population whose interests were closely linked to the Hungarian state. Thus, the number of Magyars who repatriaed to Hungary between 1918-1924 was as high as around 200,000 people 1 7 .

1 0 In Bistriţa, Târnava Mare, Sibiu and Braşov areas, the percentage of Saxons went down from 33% in 1880 to 31.5% in 1900; likewise, in the main Transylvanian towns the percentage of Saxons went down from 49.9% to 41.7% between 1880-1900. According to S. Manuilă, "Evoluţia demografică a oraşelor...", p. 199. Also, between 1899-1913, Germans represented 22.8% of the Transylvanian emigrants, which is well over their percentage of the entire province population. Acc. to I. Bolovan, "On the Demographic Situation...", p. 88.
The German population decreased from 11.9% in 1900 to 9.8% in 1930. The diminution of the German population is not characteristic only for the inter-war period. It can be noticed in Transylvania as early as the last decades of the 19 t h century. The dissolving of guilds, the economic decline of the Saxons at that time, and also these massive emigration led to the decline of the German population 1 8 , a decline that went on, as we can see, even after the union of Transylvania with Romania. The Jews were another important minority. In 1930, they represented 3.2%. We should say that they increased in number between 1900-1930, as shown by graphic no. 5 (although in 1900 Hungarian authorities did not register the Jews as a separate ethnic group, we could estimate their number using as a criterion the Mosaic religion). From among other ethnic groups, we should also mention the Gypsies, who represented 2%. The remaining 2.8% were Slovaks, Czechs, Poles, Serbs, Armenians, Croats, etc.
Table no. 3 reveals the changes in Transylvania's ethnic structure in urban and rural areas between 1900-1930. The most remarkable is undoubtedly the doubling of the Romanian population in urban areas from 17.7% in 1900 to 34.9% in 1930. As a result of industrialization, the entire urban population in Transylvania increased by 65% between 1900-1930. This was a direct consequence of the emigration of the extra rural population towards towns. Since in rural areas Romanians were predominant, it was only natural that the number of Romanians migrating from villages to towns should be higher than that of the minorities. Thus, especially after 1918, a considerable number of Romanians - mostly young, with a high reproductive potential - settled in urban areas. The census of 1930 revealed that around 54% of the population of Cluj came either from Cluj County or from the rest of Transylvania. We cannot deny that after the Union there was a certain tendency towards emigration from the old [Romanian] kingdom to Transylvania. The setting up of the Romanian administration after 1918 implied bringing an adequate number of civil servants and military officers (as well as their families). They had to cover all domains of public activity in the province. We should mention that Transylvanian Romanians could not develop their own administrative and military élite during the dualist regime, and most Hungarian civil servants did not take the oath of

loyalty to the Romanian state, sabotaging the new Romanian administration. Thus, 5250 people from over the Carpathians were recorded in Cluj in 1930 1 9 .
If the weight of the Hungarian population in rural areas decreased very little between 1900-1930, a substantial diminishing was however recorded in urban areas (see table no. 3). Many of the Magyars repatriated to Hungary after 1918 were former civil servants in the town administrations. The spectacular growth of the Romanian urban population by massive immigration from the rural areas led to the diminution of the weight of the Hungarian urban population, which was not counterbalanced by a significant immigration of the Magyars from rural Transylvania.
Graphic no. 6. Transilvania's Ethnic Structure in 1956
Hungari: (25.0%
World War II and the setting up of the communist regime led to substantial changes in Transylvania's ethnic structure (see table no. 2). First, the Romanian population increased up to 65% of the entire province population. This growth would seem unnatural if we didn't take into account the proportional decrease in the weight of the German and Jewish population. They were replaced after the war by numerous immigrants from Moldavia, where living conditions worsened considerably at that time (drought, famine, etc.). The new-comers from over the mountains settled either in the plain
S. Manuilă, "Les problèmes démographiques en Transylvanie", in Studies on the Historical demography..., p. 37.

D. Şandru, Populaţia rurală a României între cele două războaie mondiale, laşi, 1980, p. 57. ^ Z. A. B. Zeman, The Making and Breaking of Communist Europe, Oxford and Cambridge Massachusetts, 1991, p. 211-212; E. Illyés, National Minorities..., p. 25.
regions of Western Transylvania and the Banat, or in the towns, which were at that time in a full forced industrialization process (Braşov is significant in this respect). In fact, the statistics regarding the natural movement of the Transylvanian population during the fourth decade reveal the greatest natural surplus among the Romanian population. The vitality analysis according to nationality showed that the Romanian population increased annually by 0.2% over its proportion with the ethnic structure of the country 2 0.
The Hungarian population growth rate was poor between 1931-1956, leading to a ratio of 25% of the entire province population. Besides the poor birth rate of this ethnic group in the inter-war period, between 1944-1945 part of the Magyar population in Transylvania emigrated to Hungary. They were mostly those who had collaborated between 1940-1944 with Horthyst authorities in Northern Transylvania and were responsible for atrocities against the Romanians, but also some of the land owners expropriated by the land reform of 1945.
Certainly, the greatest demographic deficit was recorded by the German population: from 543,852 in 1930 to 368,255 in 1956 (see table no. 2 and graphic no. 6). Besides the gradual diminishing, noticeable since the end of the 19 t h century, there are several social and political factors responsible for the 5.9% of the entire population the Germans represented in 1956. The voluntary enlisting of tens of thousands of young Transylvanian Saxons and Swabians in Hitler's army during the war, the retreat - following Berlin orders - of part of the German civilian population form Ukraine and Romania into German territory in parallel with the advance of the Red Army in 1944, the deportation by the communist officials in Bucharest of around 40,000 Swabians from the Banat to the Bărăgan Plain in 1951, and so on, are just a few of the causes that led to the numerical and percentage diminishing of the German population in Transylvania 2 1.
The diminishing of the Transylvanian Jewish population between 1930-1956 was also dramatic (see graphic no. 5 too). Thus, the census of 1956 recorded 43,814 Jews, i.e. 0.7% of the entire population. As it is well known, the Jews in Northern Transylvanian (under Hungarian rule after the Vienna dictate) were deported by the Szalasi government to the German camps after March 1944. Some of them were subjected to the final solution of the Nazis. It has been estimated by those entitled to do so that around 90,295 Jews from the

^ Apud S. Manuilă, W. Filderman, The Jewish Population in Romania during Worid War II, The Romanian Cultural Foundation, laşi, 1994, p. 58; M. Carmilly-Weinberger, "The Tragedy of Transylvanian Jewry", in Memorial Volume for the Jews of Cluj-Kolozsvâr, edited by Moshe Carmilly-Weinberger, New York, 1988, pp. 287 sqq. 2 3 E. Illyes, National Minorities..., p. 27. 2 4 Ibidem, p. 59. 2^ Ibidem, G. D. Satmarescu, "The Changing Demographic Structure of the Population of Transylvania", in East European Quarterly, vol. VIII, no. 4, January 1975, p. 433.
territory incorporated by Hungary were killed or died in camps. In Southern Transylvania, as well as in all other territories under the authority of the Romanian state, the number of Jews who lost their lives did not exceed 15,000, which made Dr. W. Filderman (former President of the Jewish Community in Romania) say: "... no other country that has at any time been subject to Nazi domination can show so large a proportion of survivors as does Romania" 2 2 . On the other hand, the massive emigrations towards the state of Israel after 1948 led to an accentuated diminishing of the Jewish population in Romania, Transylvania included 2 3.
So far as the ethnic distribution of urban and rural population is concerned, essential changes have been recorded only in the ethnic structure of towns (see table no. 3). As a result of the continuous industrialization process, urban population increased considerably trough constant immigration from rural areas, both in Transylvania and in the Romanian provinces over the mountains. The increase of the Romanian urban population up to 58.3% was only normal since Romanians were predominant in rural areas. The rural population afflux towards towns is generally accepted as a natural side of urbanization and industrialization, and therefore the increase of the Romanian population in urban areas was the result of a natural process 2 4 . However, the idea of a "Romanianization" of Transylvanian towns by state policy was also suggested, implying that rural ethnic minorities were prevented from emigrating to towns, and that discriminating measures regarding the allocation of housing facilities and jobs were taken 2 5 . Such an interpretation does not reflect social-political realities in post-war Romania, and especially Transylvania. As recent researches show, most of the Romanian Communist Party and the state administration cadres in Transylvania were Hungarian and Jewish in the first decades of the communist regime. Thus, out of 377 underground communists in inter-war Cluj, 248 were Magyars, 69 Jews and 60 Romanians. After the setting up of the communist regime, 241 of the 377 we have mentioned "took up political career within the party, the administration,
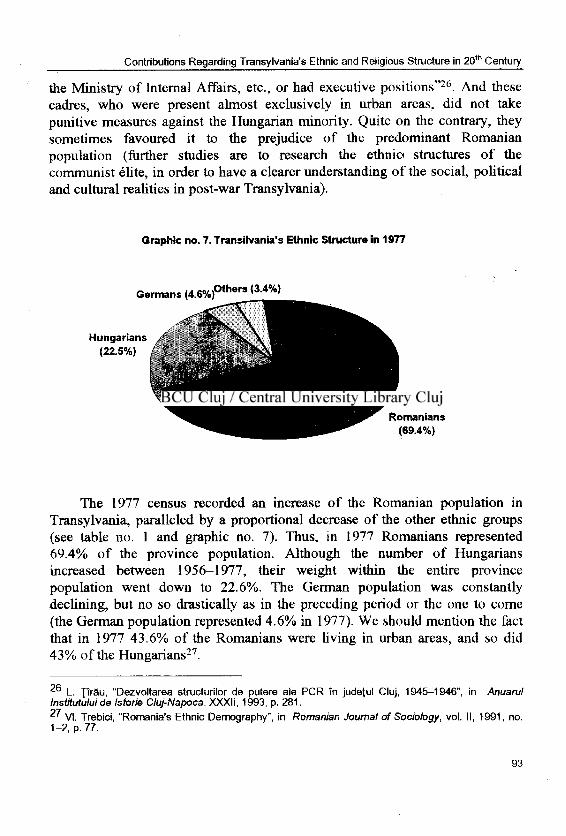
Graphic no. 7. Transilvania's Ethnic Structure in 1977
The 1977 census recorded an increase of the Romanian population in Transylvania, paralleled by a proportional decrease of the other ethnic groups (see table no. 1 and graphic no. 7). Thus, in 1977 Romanians represented 69.4% of the province population. Although the number of Hungarians increased between 1956 1977, their weight within the entire province population went down to 22.6%. The German population was constantly declining, but no so drastically as in the preceding period or the one to come (the German population represented 4.6% in 1977). We should mention the fact that in 1977 43.6% of the Romanians were living in urban areas, and so did 43% of the Hungarians 2 7 .
L. Ţîrău, "Dezvoltarea structurilor de putere aie PCR în judeţul Cluj, 1945-1946", in Anuarul Institutului de Istorie Cluj-Napoca, XXXII, 1993, p. 281. ^ VI. Trebici, "Romania's Ethnic Demography", in Romanian Journal of Sociology, vol. II, 1991, no. 1-2, p. 77.
the Ministry of Internal Affairs, etc., or had executive positions" 2 6 . And these cadres, who were present almost exclusively in urban areas, did not take punitive measures against the Hungarian minority. Quite on the contrary, they sometimes favoured it to the prejudice of the predominant Romanian population (further studies are to research the ethnio structures of the communist élite, in order to have a clearer understanding of the social, political and cultural realities in post-war Transylvania).

Germans (1.4%) Others 4.3%)
immigrants from over the mountains. It would seem that the state co-ordinated this income of population from Moldavia and Oltenia towards Transylvania. In reality, material interests prevailed, and they periodically attracted masses of people from the extra-Carpathian provinces into Transylvania. The idea that authorities gave the latter priority in terms of jobs, housing and other facilities to the prejudice of Transylvanian ethnic minorities is not acceptable 2 9. A thorough analysis of this matter needs to be made, and assertions like the one we have just mentioned can be made only if historical reality confirms such a global discrimination and not just isolated cases.
The migration of the German population to Germany and Austria was particularly extensive. Thus, from 347,896 people in 1977 (4.6%),
V. Georgescu, op. cit., p. 317; E. Wyes, National Minorities..., p. 59. G. D. Satmarescu, "The Changing Demographic...", p. 433.
The census of 1992, the first one after the fall of the communist regime, reveals the ethnic and religious composition of the Transylvanian population after several decades of totalitarian regime, which also influenced the demographic evolution. Romanians came to 73.5% of the entire population. This percentage has objective, natural causes, but one cannot overlook the consequences of Ceauşescu's policy of social and national homogenization he insistently carried out for the last few decades 2 8 . While other ethnic groups were diminishing in number or in percentages, they were replaced by
Graphic no. 8. Transylvania's Ethnic Structure in 1992

Table no. 4. Transylvania's religious structure between 1900-1992
Religion 1900 1930 1992
Religion No. % No. % No. % Orthodox 1,701,234 34.9 1,932,356 34.8 5,358,798 69.5
Greek-Catholic 1,145,576 23.5 1,385,445 25.1 209,174 2.7 Roman-Catholic 915,493 18.8 947,351 17.0 842,259 10.9
Protestant 631,306 13 696,320 12.6 794,632 10.3 Lutheran 251,494 5.2 274,415 4.9 36,249 0.5 Unitarian 64,988 1.3 68,330 1.2 75,846 1.0 Mosaic 159,584 3.2 192,833 3.5 2,857 -
Other religions 2,346 0.1 51,313 0.9 390,129 5.1 Total: 4,872,021 100.0 5,548,363 100.0 7,709,944 100.0
Sources: I. I. Adam, I. Puşcaş, izvoare de demografie...; Recensământul general al populaţiei României din 29 decembrie 1930; Recensământul populaţiei şi locuinţelor din 7 ianuarie 1992.
Eia Cosma, "Die ansiedlung der Siebenbùrger Sachsen: der anfang einer sterbenden geschichte", in Transylvanian Review, vol. Ill, no. 1, Spring 1994, p.73-74.
Transylvanian Germans went down to only 108,933 (1.4%) in 1992. The 1978 unwritten agreement between the German chancellor Schmidt and Ceauşescu was the starting point for increasing the number of German emigrants in exchange for certain sums of money. From around 10,000 people annually in 1977, the number of Germans emigrants went up to 16,000 in 1984. The emigration of the German population was also encouraged by the associations of the Transylvanian Saxons and Swabians from abroad, which drew general attention to the danger that the Germans in Romania may lose their identity 3 0. Therefore, they favoured the idea of emigration. After the fall of the communist regime in Romania in December 1989, tens of thousands of Hungarians left Transylvania and settled in Hungary, where they were given housing and jobs. This explains to a great extent the diminishing of the Transylvanian Hungarian population between 1977-1992. However, we should take into account the general low birth rate in the province, especially of the Hungarian minority, which led to the numerical decline of this ethnic group.
Transylvania's religious structure in the 20 t h century underwent very few significant changes. First, after the communist government banned the Uniate (Greek-Catholic) Church, in 1948, the number of people who declared themselves of this religion was very small in 1992: 2.7% (see table no. 4). After the events in 1989, which also led to the re-officialization of the Greek-Catholic Church, most of the former Greek-Catholic (including their descendants) declared themselves Orthodox in 1992. Also, the percentage diminution of the Lutheran, Protestant and Mosaic religions is related to the decrease of the German, Hungarian and Jewish population between 1900-1992. At the same time, a constant percentage increase in other religions - mainly Neo-Protestant (Baptist, Pentecostal etc.) - has been noticed (from 0.1 to 5.1%).

As a conclusion, we should say that the first thing to be noted is the preponderance of the Romanians in Transylvania. In fact, this made the union of Transylvania with Romania in 1918 possible. During the entire 20 t h century, the Romanian population has constantly increased, while the weight of the ethnic minorities has decreased. They have been replaced, mainly during the industrialization era of the communist regime, by immigrants from over the mountains. The change of the ethnic character of Transylvanian towns after the Union was part of a natural demographic process, not the result of a discriminating policy aimed at the national minorities in the province. Obviously, we should also accept the possible impact of the "homogenizing aberrations" of the last communist decades, which, however, were not the causes, but enhanced the natural demographic tendencies.