contrast enhancement in second ha rmonic imaging ... enhancement in second ha rmonic imaging:...
TRANSCRIPT
Contrast enhancement in second harmonic imaging: Discriminating between muscle and collagen
Sotiris Psilodimitrakopoulosa, David Artigasa,b, Guadalupe Soriac, Ivan Amat-Roldana,d, Iratxe
Torred, Eduard Gratacosd, Anna M. Planasc and Pablo Loza-Alvarez*a aICFO-Institut de Ciències Fotòniques, Mediterranean Technology Park, Av. Canal Olímpic, s/n,
08860, Castelldefels (Barcelona), Spain bUPC- Universitat Politècnica de Catalunya,Department of signal theory and communications,
Campus Nord, 08034, Barcelona, Spain cIIBB-Institut d’Investigacions Biomèdiques de Barcelona, CSIC- Consejo Superior de
Investigaciones Científicas, IDIBAPS-Institut d'Investigacions Biomèdiques August Pi-Sunyer, Rossello 161, 08036, Barcelona, Spain
dDepartment of Maternal-Fetal Medicine, ICGON, Hospital Clinic-IDIBAPS, and CIBER-ER, 08029, Barcelona, Spain
ABSTRACT
In this study, polarization second harmonic generation (SHG) imaging is used and data analysis is developed to gain contrast and to discriminate with pixel resolution, in the same image, SHG source architectures. We use mammalian tissue in which both skeletal muscle and fibrilar collagen can be found. The images are fitted point by point using an algorithm based on a biophysical model, where the coefficient of determination is utilized as a filtering mechanism. For the whole image we retrieve for every pixel, the effective orientation, θe, of the SHG active structures. As a result a new image is formed which its contrast depends on the values of θe. Collagen presented in the forward direction for a predefined region of interest (ROI), peak distribution of angles θe centered in the region of ~45°, while muscle in the region of ~65º. Consequently, collagen and muscle are represented in different colors in the same image. Thus, here we show that it is possible to gain contrast and to discriminate between collagen and muscle without the use of any exogenous labeling or any co-localization with fluorescence imaging.
Keywords: Polarization second harmonic generation, discrimination, helical pitch angles, collagen, muscle
1. INTRODUCTION The evolution of high resolution microscopy for biological applications over the past years has been driven by the desire to improve the image contrast with the goal to achieve better characterization of specimens. Numerous techniques such as confocal [1], two photon excited fluorescence (TPEF) [2], second [3] and third harmonic generation [4], sum frequency generation and coherent anti-Stokes Raman scattering (CARS) [5] microscopies have emerge as improvements towards this purpose. In particular, genetically modified markers have been developed and used to categorize the different structures present in a fluorescence image. Moreover, new techniques like fluorescence lifetime imaging (FLIM) [6] or spectral imaging [7] have advanced the identification of autofluorescence and the discrimination of even dyes having the same fluorescent color. On the other hand, in CARS microscopy the interpretation and classification of the species in the image is achieved by the intrinsic ability of the technique to characterize chemically the contrast. In biology such optical microscopy schemes have been successfully applied to the study of a wide range of complex biological systems.
On the same context, second harmonic generation (SHG) microscopy possesses several advantages that makes it also attractive for biological imaging. It can be easily implemented in a typical two photon laser scanning microscope [8] and it has the potential to provide structural information in a minimally invasive way.
*[email protected]; phone +34 93 55 34 075; fax +34 93 55 34 000; icfo.es
Advanced Microscopy Techniques, edited by Paul J. Campagnola, Ernst H. K. Stelzer, Gert von Bally, Proc. of SPIE-OSABiomedical Optics, SPIE Vol. 7367, 73670S · © 2009 SPIE-OSA · CCC code: 1605-7422/09/$18 · doi: 10.1117/12.831487
SPIE-OSA/ Vol. 7367 73670S-1
Downloaded From: http://proceedings.spiedigitallibrary.org/ on 05/07/2013 Terms of Use: http://spiedl.org/terms
SHG is a nonlinear scattering phenomenon and, hence, in principle there is no deposition of energy to the interacted matters. Its strength is fully determined by the second-order susceptibility tensor ( )2χ of the nonlinear medium [9]. This tensor is non-vanishing only for non-centrosymmetric media. Under this symmetry constraint it is obvious that SHG can be mainly produced from structures with high degree of orientation and organization, but without inversion symmetry - such as endogenous arrays of structural proteins in biological systems [10]. Thus, the SHG contrast in tissue can be endogenous, meaning that no labeling is required.
The most common molecular architectures that induce SHG in tissue are myosin, collagen and microtubule-based assemblies [10-14]. The phenomenon of the harmonic up conversion on those organizations can be attributed to coherently excited dipolar moments, which generate hyper Rayleigh scattering analogous to phase array antennas [8]. Constructive interference from an entire population of such structures (called harmonophores) results on the final harmonic signal. Additionally, their quaternary chirality further enhances the second-order efficiency [15]. Due to the geometric characteristics of local arrangement of the harmonophores, by rotating the incoming linear polarization (or the sample), the detected SHG signal intensity from every point provides a characteristic modulation [16]. This “fingerprint/signature” intensity anisotropy curve has been observed in SHG imaging microscopy of collagen and muscle [11, 17-19]. Further microscopic analysis of this polarization dependency has led to the calculation of the effective harmonophore orientation angle for both myosin and collagen assemblies [11, 19, 20]. By inserting an analyzer before the forward collected PMT, PSHG microscopy has recently presented selectivity between muscle and collagen in the same image [21]. PSHG has also been practiced in normal and diseased cartilage (collagen) [22]. In similar works on collagen, PSHG data has been analyzed with signal processing algorithms and quantitative identification and analysis of structural disorder has proposed. [23, 24]. In another study PSHG has been used to determine structural properties of tumor collagen [25].
We have lately presented that by rotating the axis of linear polarization reaching the sample and by fitting the intensity variation of the SHG signal in a biophysical model, it is possible to gain structural inside into muscles, without any predefined sample alignment nor the use of any analyzer [26]. We performed PSHG experiments in living C. elegans. The information offered by the technique is the effective orientation of the source molecules and the orientation of their supporting filaments (sarcomere thick filaments) [26]. In other recent publications, methodologies for the calculation of the orientation of the main symmetry axis of the supporting filaments/cylinders [20], as well as the effective orientation of the harmonophores, have also been proposed for characterizing both collagen and muscle. Nevertheless, the above methodologies were based on cases in which only muscle or only collagen was present in the SHG image.
In general, when imaging mammalian tissue, a great variety of different species can be found simultaneously in the same image. In this case, their characterization and classification is not straightforward. For that, usually TPEF is accompanying SHG imaging. The identification is accomplished after labeling the different structures and co localizing the TPEF signals with the SHG signals. Nevertheless in this case, the main advantage of SHG, being a non invasive technique, is lost, since labeling is synonymous to invasiveness.
There are approaches recently published in SHG imaging which are using the characteristic striation pattern of muscles, for quantitative interpretation and extraction of information. In particular, it has been reported that analysis of sarcomere pattern can be used for the study of rare disease like muscular dystrophy [27]. In the same context SHG studies on collagen also include the rare disease of osteogenesis imperfecta [28].
In SHG imaging of tissue, collagen based structures can be often found almost everywhere in an organism. Because of the complexity and variety of tissues is not paralogous to expect both collagen and muscle to be present in the same SHG image. In this case, paradigms show that their identification and characterization is usually problematic, even for the most experienced eye. It is possible to locate muscle in a complex SHG image by identifying a regular striation pattern, characteristic of striated muscle. Nevertheless, in cases of non skeletal muscle or in high magnifications, there might be present an uncertainly in identification, especially when the sample is complex or damaged. Moreover, the sample might need to be parallel aligned to the sample plane to correctly access and accurately interpret the sarcomere pattern. Thus, there is need in SHG microscopy for quantitative means of characterization and categorization of the different harmonophores seen in the same image, independently of the SHG intensity contrast [20].
In the present study we use the polarization dependency of SHG, we provide the methodology and we demonstrate quantitative discrimination with pixel resolution in the same image between the two main sources of contrast in SHG imaging: collagen and muscle.
SPIE-OSA/ Vol. 7367 73670S-2
Downloaded From: http://proceedings.spiedigitallibrary.org/ on 05/07/2013 Terms of Use: http://spiedl.org/terms

In particular, we use fresh temporalis muscle and fixed tongue myocytes in which both skeletal muscle and fibrilar collagen can be found. The images are fitted pixel by pixel using an algorithm based on a biophysical model. A parameter, indicating the quality of the fitting to the model, called “coefficient of determination” (r2), is further utilized as a filtering mechanism. We assume that each harmonophore is described by a single-axis molecule and for the whole image we retrieve the effective orientation, θe, of the SHG active structures. As a result a new image is formed which its contrast depends on the values of θe. Then, from a pre-defined region of interest (ROI), we retrieve the distribution of the angles, and we calculate its full width at half maximum (FWHM).
2. MATERIALS AND METHODS 2.1 Experimental setup
The experimental setup is based on an adapted inverted microscope (TE2000-U, Nikon, Japan) with the y-z line scanning unit composed of a pair of galvanometric mirrors (galvos) (Cambridge Technology, UK). Two 60x oil-immersion objectives [numerical aperture, (NA)=1.4, Plain Apo-Achromatic, Nikon, Japan] were used for excitation and collection of the nonlinear signals. For the excitation source, we used a typical Kerr lens modelocked Ti:sapphire laser (MIRA 900f–Verdi5 combination, Coherent, France), which delivers pulses of 160 fs at the sample plane [29] and tuned to operate at a central wavelength of 810 nm with a repetition rate of 76 MHz. We placed a linear polarizer after the galvos to reduce any introduced ellipticity. This was followed by a zero order half- retardation motorized (AG-PR100, Newport Corporation) wave plate (QWPO, CVI Melles Griot) centered at 810nm to change the linear polarization at the sample plane, and a short-wave-pass dichroic beamsplitter (FF720, Semrock Inc).
In the forward direction, a proper mount and detection unit was implemented. This unit contained the collecting objective, a long-wave-pass dichroic beamsplitter (FF665, Semrock Inc), a BG39 filter, a 15-nm FWHM band-pass filter centered at 406 nm (FF01, Semrock Inc) and an appropriate for the visible PMT (H9305-04, Hamamatsu, France). The objective lens was mounted on a micrometric 3D translational stage with tilt correction, and the whole unit was enclosed to minimize stray or spurious light into the PMT.
2.2 The biophysical model and fitting method
Analytical description of the theoretical model we use here can be found in [11, 18-20, 26, 30]. Briefly, we assume that the local hexagonal arrangement of SHG source structures in muscle and collagen is traduced in a C6 crystal class system and that Kleinmann’s symmetry holds. Under these constrains the non vanishing elements of the χ(2) tensor are χ31= χ15 and χ33. We further assume that the long axis of the collagen and myosin rods is parallel to the sample plane (y-z), while the laser propagates in the x direction. The incoming linear polarization is rotated clockwise with an angle α measured with respect to the z-axis. The long symmetry axis of the χ(2) tensor is in an inclination angle φ. If we further assume that no axial field components are introduced by the excitation objective, the total SHG intensity can be obtained using the following formula:
{ }2 2 2 2 2sin 2( ) [sin ( ) cos ( )]I E bω φ α φ α φ α= − + − + − + Δ ,
where E is a proportionality factor indicating the amplitude of the PSHG modulation, b= 33
15
χχ
and Δ has introduced to
include any model errors (tilted off plane filaments) and deviations from the perfect C6 crystal class. The parameters E, b, φ and Δ are retrieved using a fitting algorithm, based on a nonlinear least-squares fitting routine. Then by assuming that the harmonophores are single axis molecules with permanent dominant molecular hyperpolarizability β and random molecular distribution in the azimuth angle, the χ33 and χ15 components for one pixel can be expressed as:
333 cosχ β θ= and 2
15 cos sin / 2χ β θ θ= , where θ is the SHG effective orientation. Finally, the harmonophores’
orientation inside one pixel can be estimated using: 2cos2e
bb
θ =+
.
2.3 Sample
In the present study experiments were performed in fresh temporalis tissue of adult male Wistar rats and in fixed tongue muscle from New-Zealand rabbits. Rats were sacrificed under deep isofluorane anesthesia by transcardial perfusion with heparinised saline. The left temporalis muscle was dissected and immediately frozen at -80 ºC. Coronal sections (30 μm
(1)
SPIE-OSA/ Vol. 7367 73670S-3
Downloaded From: http://proceedings.spiedigitallibrary.org/ on 05/07/2013 Terms of Use: http://spiedl.org/terms
thick) were cut on a cryostat (HM 500 Microm, Germany). All sections were on-air mounted between two cover glasses (Marienfeld 24 x 36 mm No. 1, Germany). Tongues obtained from the rabbits were fixed by immersion in 4% paraformaldehyde in phosphate-buffered saline (PBS), for 24 hours at 4ºC. This tissue was then dehydrated and embedded in paraffin, and 10µm sections were cut in a microtome. Finally, sections were mounted onto thin slides. Collagen is present in both samples and serves as the necessary medium to transmit the force generated by the muscle. All experiments were performed in accordance with the National Institutes of Health animal protection guidelines and were approved by the local governmental authorities.
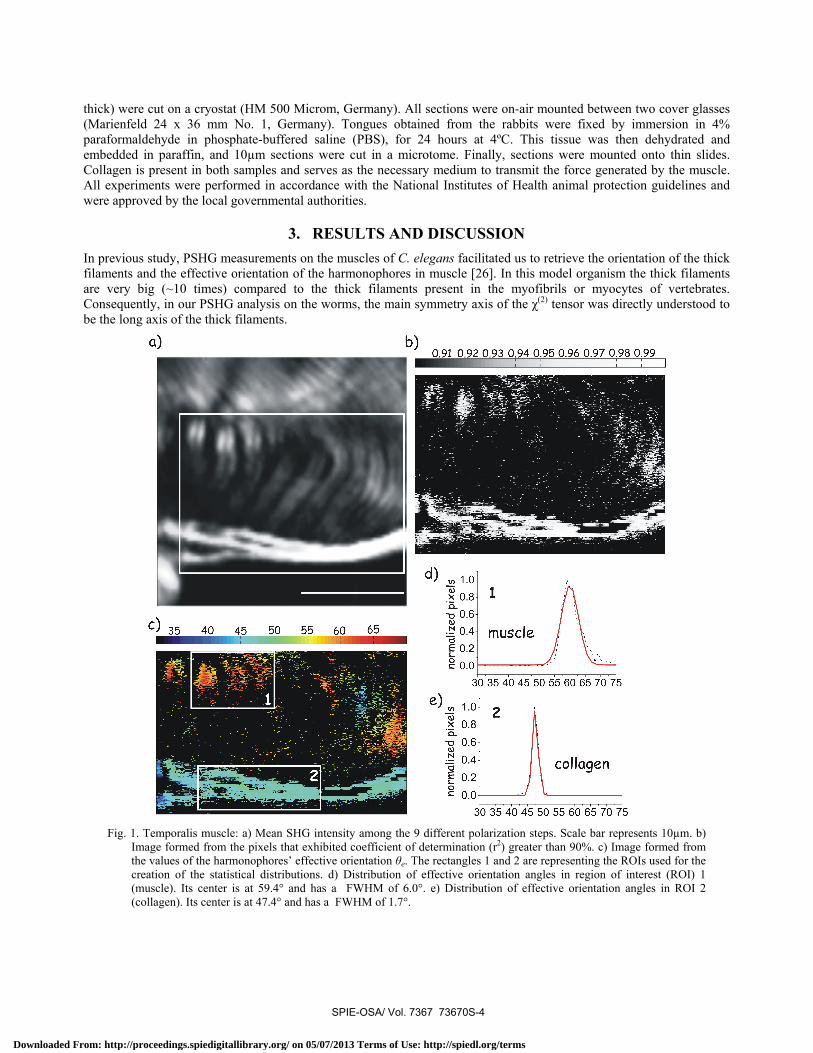
3. RESULTS AND DISCUSSION In previous study, PSHG measurements on the muscles of C. elegans facilitated us to retrieve the orientation of the thick filaments and the effective orientation of the harmonophores in muscle [26]. In this model organism the thick filaments are very big (~10 times) compared to the thick filaments present in the myofibrils or myocytes of vertebrates. Consequently, in our PSHG analysis on the worms, the main symmetry axis of the χ(2) tensor was directly understood to be the long axis of the thick filaments.
Fig. 1. Temporalis muscle: a) Mean SHG intensity among the 9 different polarization steps. Scale bar represents 10µm. b)
Image formed from the pixels that exhibited coefficient of determination (r2) greater than 90%. c) Image formed from the values of the harmonophores’ effective orientation θe. The rectangles 1 and 2 are representing the ROIs used for the creation of the statistical distributions. d) Distribution of effective orientation angles in region of interest (ROI) 1 (muscle). Its center is at 59.4° and has a FWHM of 6.0°. e) Distribution of effective orientation angles in ROI 2 (collagen). Its center is at 47.4° and has a FWHM of 1.7°.
SPIE-OSA/ Vol. 7367 73670S-4
Downloaded From: http://proceedings.spiedigitallibrary.org/ on 05/07/2013 Terms of Use: http://spiedl.org/terms
The above assumption is not so obvious when imaging skeletal muscle, in which the thick filaments have a length of 1-2μm. Nevertheless and in that case the angle ϕ of Eq. (1) represents again the orientation of the thick filaments. In collagen angle ϕ is referring to the orientation of the collagen fibrils [17, 20].
Here, we further validate our methodology and algorithm on mammals, by first performing PSHG analysis in fresh temporalis muscle of rats. In figure 1(a) (showing intensity only SHG imaging) we can recognize the characteristic of muscle striation pattern. We can also note collagen fibrils which are significantly brighter than muscle. We used our algorithm and we performed the fitting of the PSHG data to Eq. (1), using nine different polarization steps. The results are seen in Fig. 1(b) and 1(c). We mark that the intensity only Fig. 1(a) and the quality of fitting Fig. 1(b) cannot discriminate between muscle and collagen. This is not the case for the θe parameter (nor for the E and b parameters, data not shown), since it provides a new image which its contrast depends on the effective orientation of the harmonophores. This orientation for collagen is different for the muscle orientation. Accordingly, collagen and muscle are represented with different colors in the same image, (Fig. 1(c)). For the muscle the effective angular orientation of the harmonophores, inside the region of interest (ROI) 1 (Fig. 1(c)), showed a highly peaked distribution of angles centered at 59.4° with a FWHM of 6.0° (Fig 1(d)). While for collagen the distribution was centered at 47.4° with a FWHM of 1.7° (Fig 1(e)). Values of θe in the region of ~45° are indicative of the helical pitch angle of one polypeptide collagen helix [11, 19, 31], while angles (θe) in the region of ~65° are originating from the helical pitch angle of myosins’ α-helix [11, 19, 31]. Thus Fig. 1(c) shows a clear discrimination between the two SHG sources.
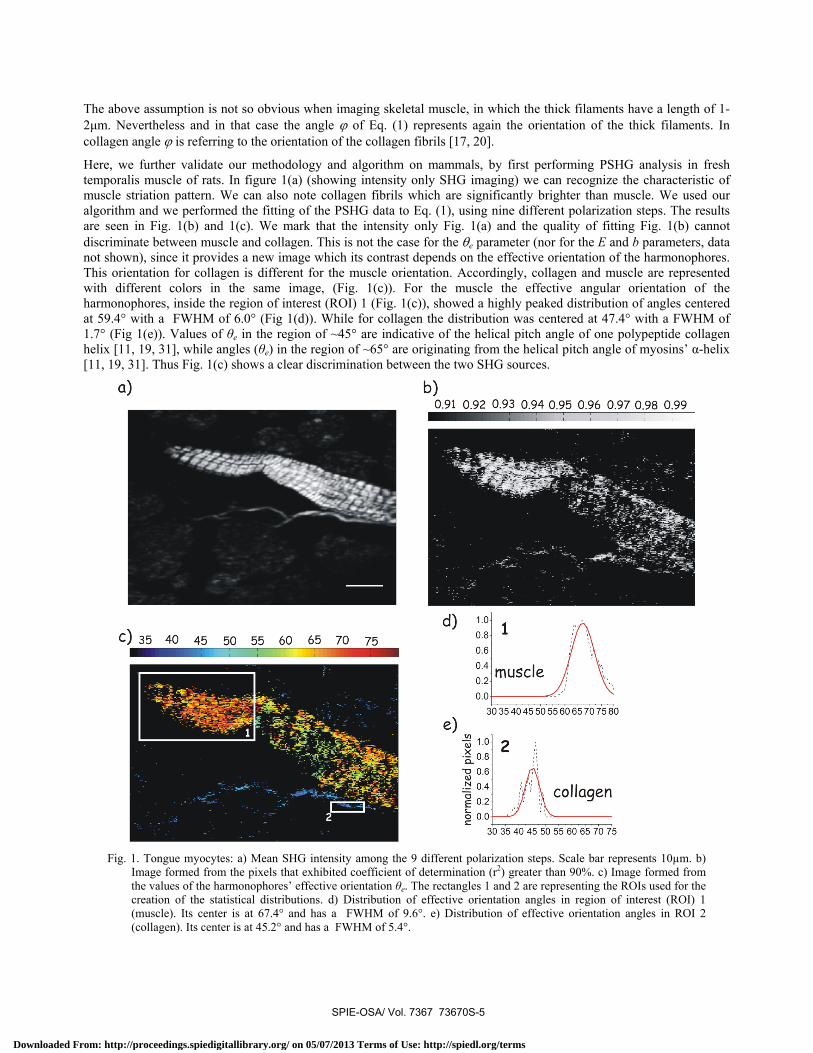
Fig. 1. Tongue myocytes: a) Mean SHG intensity among the 9 different polarization steps. Scale bar represents 10µm. b)
Image formed from the pixels that exhibited coefficient of determination (r2) greater than 90%. c) Image formed from the values of the harmonophores’ effective orientation θe. The rectangles 1 and 2 are representing the ROIs used for the creation of the statistical distributions. d) Distribution of effective orientation angles in region of interest (ROI) 1 (muscle). Its center is at 67.4° and has a FWHM of 9.6°. e) Distribution of effective orientation angles in ROI 2 (collagen). Its center is at 45.2° and has a FWHM of 5.4°.
SPIE-OSA/ Vol. 7367 73670S-5
Downloaded From: http://proceedings.spiedigitallibrary.org/ on 05/07/2013 Terms of Use: http://spiedl.org/terms
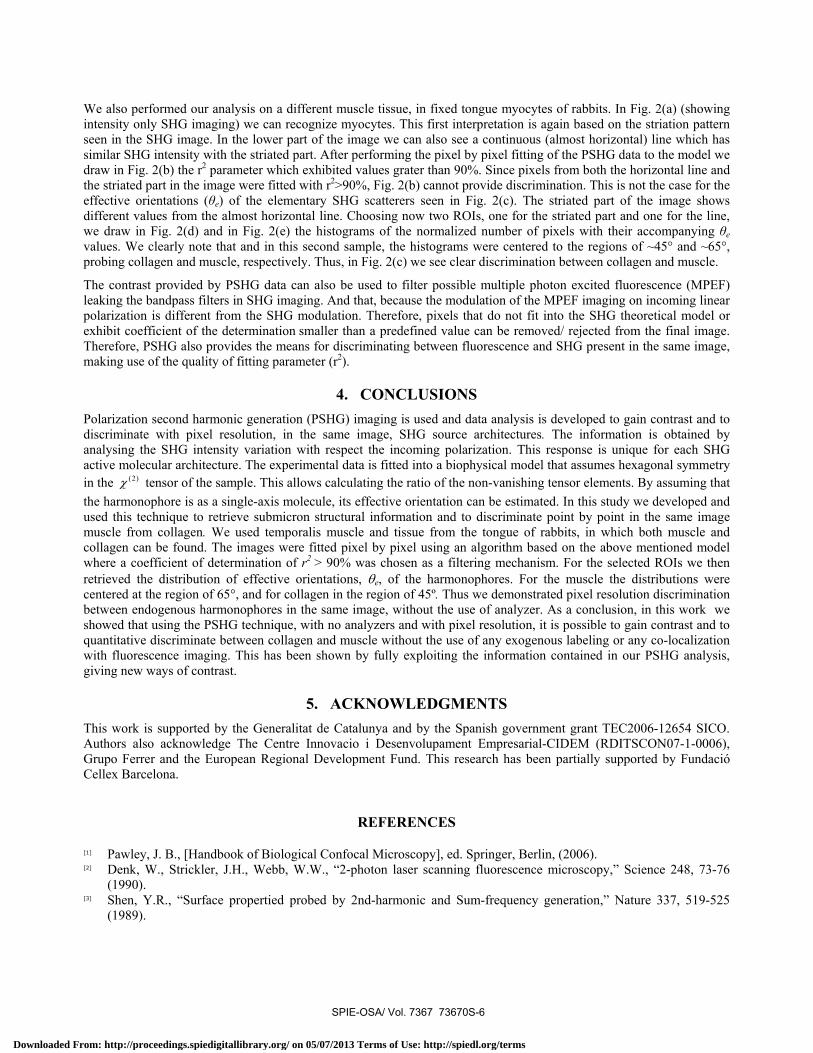
We also performed our analysis on a different muscle tissue, in fixed tongue myocytes of rabbits. In Fig. 2(a) (showing intensity only SHG imaging) we can recognize myocytes. This first interpretation is again based on the striation pattern seen in the SHG image. In the lower part of the image we can also see a continuous (almost horizontal) line which has similar SHG intensity with the striated part. After performing the pixel by pixel fitting of the PSHG data to the model we draw in Fig. 2(b) the r2 parameter which exhibited values grater than 90%. Since pixels from both the horizontal line and the striated part in the image were fitted with r2>90%, Fig. 2(b) cannot provide discrimination. This is not the case for the effective orientations (θe) of the elementary SHG scatterers seen in Fig. 2(c). The striated part of the image shows different values from the almost horizontal line. Choosing now two ROIs, one for the striated part and one for the line, we draw in Fig. 2(d) and in Fig. 2(e) the histograms of the normalized number of pixels with their accompanying θe values. We clearly note that and in this second sample, the histograms were centered to the regions of ~45° and ~65°, probing collagen and muscle, respectively. Thus, in Fig. 2(c) we see clear discrimination between collagen and muscle.
The contrast provided by PSHG data can also be used to filter possible multiple photon excited fluorescence (MPEF) leaking the bandpass filters in SHG imaging. And that, because the modulation of the MPEF imaging on incoming linear polarization is different from the SHG modulation. Therefore, pixels that do not fit into the SHG theoretical model or exhibit coefficient of the determination smaller than a predefined value can be removed/ rejected from the final image. Therefore, PSHG also provides the means for discriminating between fluorescence and SHG present in the same image, making use of the quality of fitting parameter (r2).
4. CONCLUSIONS Polarization second harmonic generation (PSHG) imaging is used and data analysis is developed to gain contrast and to discriminate with pixel resolution, in the same image, SHG source architectures. The information is obtained by analysing the SHG intensity variation with respect the incoming polarization. This response is unique for each SHG active molecular architecture. The experimental data is fitted into a biophysical model that assumes hexagonal symmetry in the (2)χ tensor of the sample. This allows calculating the ratio of the non-vanishing tensor elements. By assuming that the harmonophore is as a single-axis molecule, its effective orientation can be estimated. In this study we developed and used this technique to retrieve submicron structural information and to discriminate point by point in the same image muscle from collagen. We used temporalis muscle and tissue from the tongue of rabbits, in which both muscle and collagen can be found. The images were fitted pixel by pixel using an algorithm based on the above mentioned model where a coefficient of determination of r2 > 90% was chosen as a filtering mechanism. For the selected ROIs we then retrieved the distribution of effective orientations, θe, of the harmonophores. For the muscle the distributions were centered at the region of 65°, and for collagen in the region of 45º. Thus we demonstrated pixel resolution discrimination between endogenous harmonophores in the same image, without the use of analyzer. As a conclusion, in this work we showed that using the PSHG technique, with no analyzers and with pixel resolution, it is possible to gain contrast and to quantitative discriminate between collagen and muscle without the use of any exogenous labeling or any co-localization with fluorescence imaging. This has been shown by fully exploiting the information contained in our PSHG analysis, giving new ways of contrast.
5. ACKNOWLEDGMENTS This work is supported by the Generalitat de Catalunya and by the Spanish government grant TEC2006-12654 SICO. Authors also acknowledge The Centre Innovacio i Desenvolupament Empresarial-CIDEM (RDITSCON07-1-0006), Grupo Ferrer and the European Regional Development Fund. This research has been partially supported by Fundació Cellex Barcelona.
REFERENCES
[1] Pawley, J. B., [Handbook of Biological Confocal Microscopy], ed. Springer, Berlin, (2006). [2] Denk, W., Strickler, J.H., Webb, W.W., “2-photon laser scanning fluorescence microscopy,” Science 248, 73-76
(1990). [3] Shen, Y.R., “Surface propertied probed by 2nd-harmonic and Sum-frequency generation,” Nature 337, 519-525
(1989).
SPIE-OSA/ Vol. 7367 73670S-6
Downloaded From: http://proceedings.spiedigitallibrary.org/ on 05/07/2013 Terms of Use: http://spiedl.org/terms

[4] Barad, Y., Eisenberg, H., Horowitz, M., Silberberg, Y., “Nonlinear scanning laser microscopy by third harmonic generation,” Applied Physics Letters 70, 922-924 (1997).
[5] Zumbusch, A., Holtom, G. R., Xie, X.S., “Three-dimensional vibrational imaging by coherent anti-stokes raman scattering,” Physical review letters 82, 4142-4145 (1999).
[6] Lacovicz, J.R., Szmacinski, H., Nowaczyk, K., Berndt, K. W., Johnson, M. , “Fluorescence lifetime imaging,” Analytical biochemistry 202, 316-330 (1992).
[7] Palero, J. A., de Bruijn, H. S., van der Ploeg-van den Heuvel, A., Sterenborg, H. J. C. M., Gerritsen, H. C., “In vivo nonlinear spectral imaging in mouse skin,” Optics Express 14(10), 4395-4402 (2006).
[8] Moreaux, L., Sandre, O., Charpak, S., Blanchard-Desce, M., Mertz, J., “Coherent scattering in multi-harmonic light microscopy,” Biophys. J. 80, 1568-1574 (2001).
[9] Boyd, R. W., [Nonlinear Optics], ed. Academic, San Diego, CA. (1992). [10] Campagnola, P. J., Millard, A. C., Terasaki, M., Hoppe, P. E., Malone, C. J., Mohler, W. A., “Three – dimensional
high-resolution second harmonic generation imaging of endogenous structural proteins in biological tissues,” Biophys. J. 81, 493-508 (2002).
[11] Plotnikov, S. V., Millard, A. C., Campagnola, P. J., Mohler, W. A., “Characterization of the myosin-based source for second harmonic generation from muscle sarcomeres,” Biophys. J. 90, 328–339 (2006).
[12] Mendoza, I. R., Yankelevich, D. R., Wang, M., Reiser, K. M., Frank, C. W., Knoesen, A., “Sum Frequency Vibrational Spectroscopy: The Molecular Origins of the Optical Second-Order Nonlinearity of Collagen,” Biophys. J. 93, 4433-4444 (2007).
[13] Dombeck, D. A., Kasischke, K. A., Vishwasrao, H. D., Ingelsson, M., Hyman, B. T., Webb, W. W., “Uniform polarity microtubule assemblies imaged in native brain tissue by second-harmonic generation microscopy,” Proc. Natl. Acad. Sci. USA 100, 7081-7086 (2003).
[14] Kwan, A. C., Dombeck, D. A., Webb, W. W., “Polarized microtubule arrays in apical dendrites and axons,” Proc. Natl. Acad. Sci. USA 105, 11370-11375 (2008).
[15] Pena, A.-M., Boulesteix, T., Dartigalongue, T., Schanne-Klein, M.-C., “Chiroptical effects in the second harmonic signal of collagens I and IV,” J. Am. Chem. Soc. 127 (29), 10314–10322 (2005).
[16] Roth, S., Freund, I., “Second harmonic generation in collagen,” J. Chem. Phys. 70, 1637-1643 (1979). [17] Stoller, P., Reiser, K.M., Celliers, P.M., Rubenchik, A.M., “Polarization-modulated second harmonic generation in
collagen,” Biophys. J. 82, 3330-3342 (2002). [18] Chu, S. W., Chen, S.Y., Chern, G. W., Tsai, T. H., Chen, Y. C., Lin, B. L., Sun, C. K., “Studies of χ(2)/χ(3) Tensors
in Submicron-Scaled Bio-Tissues by polarization harmonics optical microscopy,” Biophys. J 86, 3914-3922 (2004). [19] Tiaho, F., Recher, G., Rouede, D., “Estimation of helical angles of myosin and collagen by second harmonic
generation imaging microscopy,” Opt. Express 15, 12286-12295 (2007). [20] Odin, C., Guilbert, Alkilani, T. A., Boryskina, O. P., Fleury, V., Le Grand, Y., “Collagen and myosin
characterization by orientation field second harmonic microscopy,” Opt. Express 16, 16151-16165 (2008). [21] Chu, S.W., Tai, S.P., Sun, C.K., Lin, C.H., “Selective imaging in second-harmonic generation microscopy by
polarization manipulation,” Appl.Phys. Lett. 91, 103903 (2007). [22] Mansfield, J. C., Winlove, C.P., Moger, J., Matcher, S.J., “Collagen fiber arrangement in normal and diseased
cartilage studied by polarization sensitive nonlinear microscopy,” Journal of Biomedical Optics 13, 044020 (2008). [23] Reiser, K. M., Bratton, C., Yankelevich, D. R., Knoesen, A., Rocha-Mendoza, I., Lotz, J., “Quantitative analysis of
structural disorder in intervertebral disks using second harmonic generation imaging: comparison with morphometric analysis,” Journal of Biomedical Optics 12(6), 064019 (2007).
[24] Wang, M., Reiser, K. M., Knoesen, A., “Spectral moment invariant analysis of disorder in polarization-modulated second-harmonic-generation images obtained from collagen assemblies,” J. Opt. Soc. Am. A 24, 3573-3586 (2007).
[25] Han, X., Burke, R. M., Zettel, M. L., Tang, P., Brown, E. B., “Second harmonic properties of tumor collagen: determining the structural relationship between reactive stroma and healthy stroma,” Optics Express 16, 1846-1859 (2008).
[26] Psilodimitrakopoulos, S., Santos, S., Amat-Roldan, I., Thayil A. K. N, Artigas D., Loza-Alvarez, P., “In vivo, pixel resolution mapping of thick Filaments’ orientation in non-fibrilar muscle using polarization sensitive second harmonic generation microscopy,” Journal of Biomedical Optics 14(1), 014001 (2009).
[27] Plotnikov S.V., Kenny A.M., Walsh S.J., Zubrowski B., Joseph C., Scranton V.L., Kuchel G.A., Dauser D., Xu M., Pilbeam C.C., Adams D.J., Dougherty R.P., Campagnola P.J., Mohler W.A., “Measurement of muscle disease by quantitative second-harmonic generation imaging,” J. Biomed. Opt. 13(4), 044018 (2008).
SPIE-OSA/ Vol. 7367 73670S-7
Downloaded From: http://proceedings.spiedigitallibrary.org/ on 05/07/2013 Terms of Use: http://spiedl.org/terms

[28] LaComb, R., Nadiarnykh, O., Campagnola, P.J., “Quantitative Second Harmonic Generation Imaging of the Diseased State Osteogenesis Imperfecta: Experiment and Simulation,” Biophysical Journal 94(11), 4504-4514 (2008).
[29] Thayil, A. K. N., Gualda, E. J., Psilodimitrakopoulos, S., Cormack, I. G., Amat- Roldan, I., Mathew, M., Artigas, D., Loza-Alvarez, P., “Starch-based backwards SHG for in- situ MEFISTO pulse characterization in multiphoton microscopy,” J. Microscopy 230, (2008).
[30] Vogel, M., Schurmann, S., Friedrich, O., Wegner, F., Both, M., Fink, R. H. A., “Scanning multi photon microscopy of SHG signals from single myofibrils of mammalian skeletal muscle,” Proc. of SPIE 6089, (2006).
[31] Beck, K., Brodsky, B., “Supercoiled protein motifs: the collagen triple-helix and the a-helical coiled coil,” J.Struct. Biol. 122, 17–29 (1998).
SPIE-OSA/ Vol. 7367 73670S-8
Downloaded From: http://proceedings.spiedigitallibrary.org/ on 05/07/2013 Terms of Use: http://spiedl.org/terms