consumer perceptions of store image: a study of ikea...
TRANSCRIPT

Consumer Perceptions of Store Image: A study of Ikea and Ilva in Sweden and Denmark
Authors
Emeli RanelidFabiola Rivera Bello
Supervisor
Ulf Johansson
International Marketing and Brand Management
BUS 809 Master Thesis
Spring 2006

Consumer Perception of Store Image: A study of Ikea and Ilva in Sweden and Denmark
Abstract Title Consumer perceptions of store image: A study of Ikea and Ilva in Sweden and Denmark Date of seminar 1 June 2005
Course International Marketing and Brand Management, BUS 809 10 Swedish credits (15 ECTS)
Supervisor Ulf Johansson
Authors Emeli Ranelid, Fabiola Rivera Bello
Keywords Store Image, Hofstede, Sweden, Denmark, Ikea, Ilva
Purpose The aim of this study is to inquire into the congruency of store image perceptions, projected by Ikea and Ilva, and how Danish and Swedish consumers perceive the aforementioned stores’ images in their respective domestic market. Also, the aim sets out to evaluate the success of these stores’ images on consumers and on transference to host markets. Further, the aim is to discern specific store image attributes captivating Swedish and Danish consumers.
Methodology A quantitative approach based on questionnaires was used. The data was analysed using SPSS and compared between the two countries and Ikea and Ilva. Further the data was compared to the store image portrayed by Ikea and Ilva based on secondary data and two semi-structured interviews.
Theoretical perspective In order to analyse consumer’s perceptions of store image, a theoretical framework based on store image by McGoldrick among others, and culture represented mainly by Hofstede were used along with the Country-of-Design perspective.
Empirical foundation The empirical data is based on 300 questionnaires containing answers from Danish and Swedish consumers about store image perception. The store image portrayed by Ikea and Ilva derives from each company’s webpage and interviews.
Conclusions The study found that there is congruence in how Ikea and Ilva want to portray themselves and how the consumers perceive their store image. In the case of Ikea the results provided evidence for a successful transfer of store image to Denmark, where the store image is perceived in a very similar way among Swedes and Danes. However, in the case of Ilva, and its store image transfer to Sweden, the results showed somewhat divergent perception between Danes and Swedes. Further, the principal components analysis helped to discover and prioritize the store components that Ikea and Ilva should reflect on when capturing image perceptions among consumers.
2

Consumer Perception of Store Image: A study of Ikea and Ilva in Sweden and Denmark
Acknowledgements The authors of this master thesis would like to thank Ulf Johansson, Johan Anselmsson, Mauricio, families and friends for supporting us throughout this very interesting project. Also thanks to Eva Stål and Charlotte Melbelle at Ilva for taking part in the interviews and thanks to Fredrik Wahrolen at Ikea.
3

Consumer Perception of Store Image: A study of Ikea and Ilva in Sweden and Denmark
Table of Contents
1. INTRODUCTION________________________________________________________ 7 1.1 BACKGROUND _________________________________________________________ 7 1.2 AIM ________________________________________________________________ 10 1.3 DELIMITATIONS _______________________________________________________ 10 1.4 CHAPTERS OUTLINE ____________________________________________________ 11
2. THEORETICAL FRAMEWORK - IMAGE_________________________________ 12 2.1 IMAGE CONCEPTS______________________________________________________ 12
2.1.1 Corporate Image __________________________________________________ 12 2.1.2 Store Image ______________________________________________________ 12 2.1.3 Brand Image and Product Image______________________________________ 13
2.2 CONSUMER PERCEPTIONS________________________________________________ 13 2.3 RETAIL IMAGE DIMENSIONS AND STORE ATTRIBUTES __________________________ 14
2.3.1 Dimensions_______________________________________________________ 14 2.3.2 Attributes ________________________________________________________ 15 2.3.3 Areas to be Considered in Retail Store Image ____________________________ 15
2.3.3.1 Merchandise __________________________________________________ 15 2.3.3.2 Price_________________________________________________________ 15 2.3.3.3 Location______________________________________________________ 16 2.3.3.4 Advertising and Promotion _______________________________________ 16 2.3.3.5 The Selling Environment ________________________________________ 16 2.3.3.6 Personal Service _______________________________________________ 16
2.4 AGE, GENDER AND EDUCATION IN RETAIL STORE IMAGE _______________________ 17 2.5 SUMMARY OF THE THEORETICAL FRAMEWORK FOR IMAGE ______________________ 17
3. THEORETICAL FRAMEWORK – CULTURE______________________________ 18 3.1 CONCEPTUAL FRAMEWORK: CULTURE DESCRIBED AS AN ONION _________________ 18 3.2 CONCEPTUAL MODEL: CULTURE AS A LENS METAPHOR ________________________ 19 3.3 HOFSTEDE’S FIVE DIMENSIONS OF CULTURE IN DENMARK AND SWEDEN ___________ 19 3.4 COUNTRY-OF-DESIGN __________________________________________________ 23 3.5 INTERNATIONALIZATION AND STORE IMAGE _________________________________ 23 3.6 SUMMING UP THE THEORETICAL FRAMEWORK OF CULTURE _____________________ 24 3.7 OWN THEORETICAL RESEARCH MODEL _____________________________________ 24
4. SCANDINAVIA’S FELLOW RETAILERS: IKEA AND ILVA_________________ 25 4.1 THE FURNITURE RETAIL COMPANY IKEA ____________________________________ 25
4.1.1 Marketing Communication___________________________________________ 25 4.1.2 The Store ________________________________________________________ 25 4.1.3 The Products _____________________________________________________ 26
4.2 THE FURNITURE RETAIL COMPANY ILVA ____________________________________ 26 4.2.1 Marketing Communication___________________________________________ 26 4.2.2 The Store ________________________________________________________ 26 4.2.3 The Products _____________________________________________________ 27
5. METHOD______________________________________________________________ 28 5.1 OVERALL APPROACH ___________________________________________________ 28
5.1.1 Scientific Stance and Overall Approach ________________________________ 28
4

Consumer Perception of Store Image: A study of Ikea and Ilva in Sweden and Denmark
5.1.2 Quantitative Method________________________________________________ 29 5.2 DATA COLLECTION ____________________________________________________ 29
5.2.1 The Operationalization _____________________________________________ 29 5.2.2 The Questionnaire _________________________________________________ 32 5.2.3 Sample and Realization _____________________________________________ 32 5.2.4 Information about Ikea and Ilva_______________________________________ 33 5.2.5 Analyse Method ___________________________________________________ 33 5.2.6 Data Processing ___________________________________________________ 34
5.2.6.1 Comparing Image Attributes using Statistical Significances Measurements _ 34 5.2.6.2 Principal Component Analysis ____________________________________ 35 5.2.6.3 Extracting the most Important Components __________________________ 35 5.2.6.4 Interpreting the Meaning of the Principal Components _________________ 35
5.3 METHODOLOGICAL REFLECTIONS _________________________________________ 35
6. RESULTS AND DATA ANALYSIS ________________________________________ 38 6.1 DESCRIPTIVE STATISTICS ________________________________________________ 38
6.1.1 Gender Differences in Sweden ________________________________________ 38 6.1.2 Gender Differences in Denmark ______________________________________ 39 6.1.3 Age Distribution of Respondents ______________________________________ 40 6.1.4 Highlights Sweden _________________________________________________ 41 6.1.5 Highlights Denmark ________________________________________________ 41
6.2 COMPARE MEANS ANALYSIS IKEA - ILVA IN SWEDEN __________________________ 42 6.3 COMPARE MEANS ANALYSIS IKEA - ILVA IN DENMARK_________________________ 44 6.4 IKEA ATTRIBUTE STATEMENTS: DIFFERENCES IN MEANS FOR SWEDISH AND DANISH RESPONDENTS ___________________________________________________________ 46 6.5 ILVA ATTRIBUTE STATEMENTS: DIFFERENCES IN MEANS FOR SWEDISH AND DANISH RESPONDENTS ___________________________________________________________ 48 6.6 MODELLING THE PRINCIPAL COMPONENTS THAT CHARACTERIZE TWO RETAIL FURNITURE COMPANIES _____________________________________________________________ 50
6.6.1 Ikea Sweden ______________________________________________________ 50 6.6.2 Ilva Sweden ______________________________________________________ 52 6.6.3 Ikea Denmark _____________________________________________________ 54 6.6.4 Ilva Denmark _____________________________________________________ 56
7. DISCUSSION __________________________________________________________ 58 7.1 GENERAL FINDINGS ____________________________________________________ 58
7.1.1 Age, Gender and Education __________________________________________ 58 7.2 CONSUMER PERCEPTION VS. COMPANY’S DESIRED STORE IMAGE _________________ 59
7.2.1 Swedes vs. Ikea____________________________________________________ 59 7.2.2 Danes vs. Ilva _____________________________________________________ 60
7.3 INTERNATIONAL TRANSFER OF STORE IMAGE ________________________________ 60 7.3.1 Danes vs. Ikea ____________________________________________________ 61 7.3.2 Swedes vs. Ilva ____________________________________________________ 61
7.4 IKEA VS. ILVA AMONG SWEDES AND DANES__________________________________ 62 7.4.1 Swedes Perception of Ikea vs. Ilva _____________________________________ 62 7.4.2 Danes Perception of Ikea vs. Ilva______________________________________ 62
7.5 STORE ATTRIBUTES WITHIN THE FURNITURE SECTOR __________________________ 63 7.6 FUTURE RESEARCH ____________________________________________________ 64
8. CONCLUDING REMARKS ______________________________________________ 65
9. REFERENCES _________________________________________________________ 66
5

Consumer Perception of Store Image: A study of Ikea and Ilva in Sweden and Denmark
APPENDIX ___________________________________________________________ 72-78
Appendix 1____________________________________________________________ 72Appendix 2a ___________________________________________________________ 73Appendix 2b___________________________________________________________ 74A ppendix 3a __________________________________________________________ 75Appendix 3b___________________________________________________________ 76Appendix 4a___________________________________________________________ 77A ppendix 4b __________________________________________________________ 78
FIGURES, GRAPHS AND TABLES ______________________________________ 14-56
Figure 1. Retail Purchase Conflict Model ___________________________________ 14Figure 2. Three Levels of Human Mental Programming ________________________ 18Figure 3. Onion Diagram, Culture Manifestation on Different Levels _____________ 18Figure 4. Conceptual Model ______________________________________________ 19Figure 5. An overview of Hosftede’s five dimensions: Sweden and Denmark ________ 23Figure 6. Own Theoretical Research Model _________________________________ 24Figure 7. Ikea’s Pyramid of the Marketing Mix _______________________________ 25Figure 8. An Illustration of the Operationalization Process _____________________ 31Figure 9. Total Respondents in Sweden and Denmark __________________________ 38Figure10. Perceptions of Ikea and Ilva store image among Swedes _______________ 42Figure 11. Perceptions of Ikea and Ilva store image among Danes________________ 44 Figure 12. Perceptions of Ikea among Swedes and Danes ______________________ 46Figure 13. Perceptions of Ilva among Swedes and Danes _______________________ 48 Graph 1. Statements Distribution by Gender Sweden___________________________ 39Graph 2. Statements Distribution by Gender Denmark _________________________ 39Graph 3. Histrogram Age by Country_______________________________________ 40
Table 1. Swedish Respondents, Attribute Statements: Differences in means _________ 43Table 2. Danish Respondents, Attribute Statements: Differences in means __________ 45Table 3. Ikea t-test for Equality of Means between Swedes and Danes _____________ 47Table 4. Perceptions of Ilva among Swedes and Danes _________________________ 49Table 5. Principal Component Analysis Ikea Sweden___________________________ 50Table 6. Principal Component Analysis Ilva Sweden ___________________________ 53Table 7. Principal Component Analysis Ikea Denmark _________________________ 54Table 8. Principal Component Analysis Ilva Denmark__________________________ 56
6

Consumer Perception of Store Image: A study of Ikea and Ilva in Sweden and Denmark
1. Introduction
The introduction presents a background to the research area and a problem discussion leads up to the aim of this thesis. The chapter ends with a disposition of the following chapters.
1.1 Background
On July 1, 2000 the Øresund Bridge, between Denmark and Sweden, was opened with a vision to “establish the Øresund Region as a new European force - culturally as well as economically” and a mission to “build - economic, cultural and spiritual bridges across the Øresund Region” (Øresundsbro Konsortiet, 2005a). The aim and expectations of the bridge was to create a stronger commercial and cultural region, based on similarities such as in culture, stage of economic development and membership in the European Union (Havaleschka, 2002). Some similarities may be attributable to the fact that Skåne and Denmark have shared history as one nation, ending in 1658 (Øresundsbro Konsortiet, 2005b). Yet, despite the similarities between the two countries, there are several differences that may complicate the integration (Havaleschka 2002; Sidelmann et al., 2005). As a recent study1, conducted in May 2005, found differences in the administration of border issues were a bigger hindrance to integration than cultural differences, language and traditions (Øresundsbro Konsortiet, 2005a) as such, indicating that fundamental similarities were currently complicated by bureaucratic difficulties. The thriving Øresund region provides a favorable climate for companies to establish their operations, and there is an aim, among Danish and Swedish local authorities, to attract new investments (Øresundsbro Konsortiet, 2005b). Several Danish companies have already established subsidiaries and partnerships in Sweden2. Internationalization is today considered to be a natural expansion process, and the number of companies going abroad is increasing as the lure of potential new consumers in new markets is significant. Retail companies have been competing in the international market for more than twenty years, trying to steal market share from local competitors, according to Gauri and Cateora (2005). To succeed in a new market environment the following variables need to be considered: creating awareness whether the company is creating recognition inside the community through the quality of the products (Corporate Social Responsibility) and is adapting its business to the local arena (Ibid). “When moving abroad, countries geographically close and/or with a similar culture are more likely to be the first target” mainly because of similarities which will speed up the process (Ibid). An ongoing debate within internationalization is if the company should continue with the same concepts and ideas as in the domestic market or adapt to suit local consumers’ needs and wants on new markets (Burt and Mavrommatis, 2005). One company that has chosen to go abroad, by first entering neighbouring countries Norway in 1963, and Denmark in 1969, is the Swedish retailer Ikea3. Ikea is today operating in 34 countries/territories4 and is the leading furniture retailer in the world with a 3.4 % of the furniture sector’s overall value (Datamonitor, 2005). Part of Ikea’s success derives from a “radical business innovation” (Edvardsson and Enquist, 2002) where competitive advantages
1 Telephone interviews made by marketing research company Norstat with 2000 customers of the Øresundsbro. 500 private customers living in Denmark + 500 private customers living in Sweden + 500 company customer with residence in Denmark + 500 company customer with residence in Sweden 2 http://www.realtid.se/ArticlePages/200604/26/20060426151354_Realtid479/20060426151354_Realtid479.dbp.asp3 http://www.ikea.com/ms/sv_SE/about_ikea/timeline/full_story.html4 http://www.ikea.com/ms/sv_SE/about_ikea/facts_figures/ikea_group_stores.html
7

Consumer Perception of Store Image: A study of Ikea and Ilva in Sweden and Denmark
are achieved by doing things in a new and different way compared to competitors, or, what Kumar et al., (2000) refers to as, a market driving company. The business idea of Ikea is simply “to offer a wide range of well-designed, functional home furnishing products at prices so low that as many people as possible will be able to afford them”5. In order to keep prices low, Ikea uses economics of scale and moreover the low price idea permeates the whole organisation (Edvardsson and Enquist, 2002). Although Ikea is a global retailer the product range and overall concept is standardized rather than adapted to every country. However, in several markets, such as for instance Canada and the U.S, some small product adaptations have been made to target new consumers more effectively. Ikea’s concept of standardization is supported by Levitt’s (1983) argument that due to the rise of new technology and today’s increasingly globalized society would make consumers more alike in terms of their needs and wants. However, few empirical findings support the idea of a ‘global consumer’ (Keillor et al., 2001). De Mooij (2003) stresses that “the convergence of income, media and technology” do not lead homogeneous behaviour. Even though consumers buy similar products, the usages of the products diverge (Ibid). These differences can be explained through culture, according to De Mooij (2003) and Hofstede and Hofstede (2005) and “consumer behaviour will become more heterogeneous because of cultural differences” (Ibid). Overby et al. (2005) also state that the perception of value from buying and using products differ across cultures. On the other hand, a cross-cultural study made by Keillor et al. (2001) shows that a ‘global consumer’ is beginning to emerge. However, the success of the internationalization will largely depend on the amount of knowledge that is obtained regarding consumers’ preferences. Another retailer that recently started their internationalization process is Ikea’s competitor, Danish Retailer Ilva, founded in Denmark 19506. Ilva is following what could be considered as a point out approach (Gauri and Cateora, 2002), which means opening their first store abroad in a geographically and culturally close country, and was hence done in Sweden. Ilva already had several Swedish consumers visiting their stores in Denmark. In June 2005, Ilva opened a store outside the city of Malmö and followed by Göteborg and Stockholm7. England will then be the next country in the internationalization process where the goal is to have 20 stores within 10 years8. Ilva has presented themselves as the ‘Ikea for grownups’9, which could be seen as a threat to Ikea who is dominating the market. According to Varley (2005), image is a determinant factor to the consumer when choosing a retailer over another, and as such it becomes pivotal in the case of Ikea and Ilva to gain consumers. “Retail image is generally described as a combination of a store’s functional qualities and the psychological attributes consumers link to these” (Porter and Claycomb, 1997). Consumers are influenced by the image, as interpreted through the products but also through the more holistic image of the company (Ibid). Thus consumer perceptions related to the retail store would be the most appropriate factor to measure when comparing Ikea and Ilva, since store image is of great importance in retailing business when it comes to attract consumers (Thang and Tan, 2003). “Research has indicated that perceived store image positively influences perceived product quality and purchase intention” (Wu et al., 2004). Furthermore, “a positive store image has been identified as one
5 http://www.ikea-group.ikea.com/corporate/about_ikea/index.html6 http://www.ilva.dk/historie7 http://di.se/Nyheter/?page=%2fAvdelningar%2fArtikel.aspx%3fO%3dIndex%26ArticleId%3d2002%5c06%5c 08%5c51613%26src%3ddi8 http://www.edmondshipway.co.uk/News_Item.asp?ID=17&level2=2&node=09 http://www.yorkshiretoday.co.uk/ViewArticle2.aspx?SectionID=1472&ArticleID=1477496
8
Consumer Perception of Store Image: A study of Ikea and Ilva in Sweden and Denmark
of the important determinants of economic success in retailing” (Burt and Mavrommatis, 2005). Several studies have been made about the concepts and measurement of retail store image (Samli et al., 1998). However, a review of the literature reveals that a majority of the studies are made within the grocery and clothes- or fashion sectors. Attributes related to store image may vary by type of store (Mitchell and Kiral, 1998) but also do “store image attribute importance vary across store type” (Amirani and Gates, 1993) It would therefore be of interest to apply attributes that are identified as important when measuring store image to the furniture sector, in this case, Ikea and Ilva. The global home furnishing retail sector is a growing sector and is forecast to have a value of $625.4 billion in 2009, which is an increase of 33.8 % since 2004 (Datamonitor, 2005). Furniture stores accounts for 54.3 % of this revenue and Europe is the main market for global home furnishing retail sector accounting for 54.3 % of the global retail sector (Ibid). An increasing amount of TV programs and books about home- decorating, renovation and makeover are some factors which contribute to the increased sales in the home furnishing retail sector. The reviewed literature revealed no store image studies related to the Swedish or Danish market so in addition to apply store image to the furniture sector, store image research will also be assessed in the Swedish and Danish market. Although there are much research explaining the “critical influence of store image” little attempt has been “made to examine its impact on the outcome of consumers’ decision which is reflected by their choice of the store” (Thang and Tan, 2003). This study strives to compare store image of two competitive retail companies with the object to provide insights about consumers’ choices and preferences. An understanding of store image related to the furniture sector might also give managerial inputs to help “managers in store differentiation and at establishing a desired market position for their retail brands” (Uusitalo, 2001). As “Ikea is the leading player in the global home furnishing retail sector” (Datamonitor, 2005) their retail store image perceived by consumer might provide insights for other retail companies. However, the perceptions that consumers have of a company’s store image might not be the same as the company intended. If there is congruence between consumers’ and management perceptions, this is “recognized as a major strength for the retailer and can be capitalized upon in the creation of the retail establishment’s differential advantage” (Samli et al., 1998). It is therefore of interest to study if there is congruence between the image Ikea and Ilva are trying to portray to consumers and the image that consumers actually have of Ikea and Ilva. Do consumers’ perceptions of store image derive and depend on cultural norms and experiences, in this case Swedish and Danish norms and experiences? Burt and Mavrommatis (2005) conclude that “consumers’ perceptions of store image vary across countries, geographical regions, market sectors, store formats and relative to existing competition”. However, Usunier (2005) found that “respondents from countries that are geographically close tend to perceive a similar brand image”. Several studies (Bucken-Knapp, 2001; Havaleschka, 2002; Øresundsbro Konsortiet, 2005a, Sidelmann et al., 2005) have been made about cultural differences between Danes and Swedes influence, however these have focused on workplace or management issues and therefore a study examining cultural differences between Danish and Swedish consumers would also be overlapping a gap. Further, there is a somewhat neglected area of store image with regard to the affect/relevance of the country-of-origin-issues (Usunier, 2002), which as such requires further investigation. “Do consumers have strong preferences for their national products?” (Usunier, 2005)
9

Consumer Perception of Store Image: A study of Ikea and Ilva in Sweden and Denmark
1.2 Aim
The aim of this study is to inquire into the congruency of store image perceptions, projected by Ikea and Ilva, and how Danish and Swedish consumers perceive the aforementioned stores’ images in their respective domestic market. Also, the aim sets out to evaluate the success of these stores’ images on consumers and on transference to host markets. Further, the aim is to discern specific store image attributes captivating Swedish and Danish consumers.
1.3 Delimitations
One of the aims with this study is to capture consumers’ perception of store image related to Ikea and Ilva. Therefore, a criterion was that the respondents participating in this study had visited the stores of both Ikea and Ilva. Since Ikea is very well known, the respondents were first asked if they had visited Ilva and it is therefore likely that the group of respondents in this study to a greater extend reflect the main costumer groups of Ilva than of Ikea.
10
Consumer Perception of Store Image: A study of Ikea and Ilva in Sweden and Denmark
1.4 Chapters outline
Chapter 2 – Theoretical Framework - Image This chapter will start with definitions of the concepts if image, followed by a presentation of retail store dimensions and attributes that influence store image perception based on McGoldrick’s retail marketing mix. A summary can be found in the end of the chapter. Chapter 3 – Theoretical Framework - Culture This chapter will give the theoretical framework of culture based mainly on Hofstede’s five dimensions. Country-of-Design and internationalization is discussed in the end of the chapter where a model combining the theoretical framework of image and culture in relation to consumers’ image perception of the retail store also will be illustrated. Chapter 4 – Scandinavia’s Fellow Retailers: Ikea and Ilva This chapter will provide a short overview of Ikea and Ilva, based on interviews with employees from each marketing department and respectively company’s webpage. Chapter 5 - Method This chapter will describe the process of collecting and analyzing the empirical data needed in order to fulfil the aim of this thesis. The overall approach and quantitative strategy is described and argued for, followed by the actual data collection and data processing and data analyzes. The chapter ends with methodological reflections. Chapter 6 – Results and Data Analysis In this chapter are the results from the study presented starting with a descriptive analysis, followed by means analysis and ending with the principal components analysis. Chapter 7 - Discussion In this chapter, the results are discussed in relation to the theoretical framework structured and based on the aim of this thesis. Further, managerial implications and suggestions for future research are found at the end. Chapter 8 – Concluding Remarks This chapter provides a short summary of the findings in this study in relation to the aim of the thesis.
11

Consumer Perception of Store Image: A study of Ikea and Ilva in Sweden and Denmark
2. Theoretical Framework - Image
This chapter will start with definitions of the concepts if image, followed by a presentation of retail store dimensions and attributes that influence store image perception based on McGoldrick’s retail marketing mix. A summary can be found in the end of the chapter.
2.1 Image Concepts
When companies’ “vision, culture and image are developed in isolation from each other”, they are exposed to failure in the strategic positioning (Hatch and Schultz, 2003). These three key elements are the focus of this thesis when it examines consumers’ image perception of Ikea and Ilva. However, image is a term that has many different definitions, as Grunig (1993) writes “image has almost as many meanings as the number of people who use it” or Stern et al. (2001) writes “the term is used so inconsistently that no two researchers are necessarily talking about the same phenomenon”. The following sections will describe image in terms of three different concepts, corporate image, store image and brand- and product image. However, a general definition of image is “the outcome of a transaction whereby signals emitted by a marketing unit are received by a receptor and organized into a mental perception of the sending unit” (Ibid).
2.1.1 Corporate Image
Hatch and Schultz (2003) define corporate images as the “views of the organisation developed by its stakeholders; the outside world’s overall impression of the company including the view of consumers, shareholders, the media, the general public and so on”. The main focus of a retail company should be to attain congruence between the communicated corporate image via the store and the image understood “in the minds of the consumers” (Burt, 2000). In order to succeed with the corporate image communication towards the consumers, as many communication channels as possible should be used, such as the most common ones are corporative webs and store web pages, advertising, catalogues (Markwick and Fill, 1997).
2.1.2 Store Image
Keaveney and Hunt (1992) defined the retail store image as “the overall impression of a store as perceived by consumers”. Feelings and first impressions are considered to be fundamental when meeting new people but also when e.g. visiting a new store (Kupke, 2002) thus, people’s first reactions and feelings are able to affect the shopping behaviours (Porter and Claycomb, 1997). “The customers’ perception of the store is formed by their perceived importance of store attributes moderated by their past purchase behaviour” (Osman, 1993). Back in 1958, Martineu wrote “…there is a force…the way in which the store is defined in the shopper’s mind, partly by its functional qualities and partly by an aura of psychological attributes”. Martieneu (1958) argued that a legitimate way to explain image in relation to a retail store, is to use a human description which he labelled “the personality of the store”. Several authors (Martineu 1958; Downs, 1970; Linquist, 1974; Zimmer and Golden, 1988; Kupke, 2002; McGoldrick, 2002) have, in order to better characterize different kinds of retail stores, defined the retail store image with focus on different dimensions with the help of attributes. Porter and Claycomb (1997) suggest that retail image “is a combination of a store’s functional qualities and the psychological attributes consumers” linked to these. The different attributes belong to a multidimensional process which facilitates to define the retail store images based on consumers’ evaluation of their feelings and impressions (Kupke, 2002).
12

Consumer Perception of Store Image: A study of Ikea and Ilva in Sweden and Denmark
2.1.3 Brand Image and Product Image
Brand image can be defined as “the meanings consumers’ associate with the product” where meanings are consumers’ perceptions of e.g. advertising and other brand related activities (Roth, 1992). Porter and Claycomb (1997) claim that “a well-recognized and accepted brand image is one of the most valuable assets a firm possesses” since brands can “influence patronage decisions and purchase behaviours”. “Product image refers to attributes associated with a given product or service”, and this is interpreted through e.g. price, channel of distribution and advertising (Quester et al., 2000). The three concepts of image explained above are all linked to each other in one way or another (Porter and Claycomb, 1997; Stern et al., 2001), however, this study will focus on store image since “for most customers, the store is the prime contact point with the organisation and the major means of communicating brand values” (Burt and Mavrommatis, 2005). Further, “a store’s image has been considered an important means of managing store positioning” (Uusitalo, 2001) and is important for economic success (Burt and Mavrommatis, 2005). Hartman and Spiro (2005) claims that store image can be seen as a function of consumer behaviour and store performance.
2.2 Consumer Perceptions Consumers’ perceptions can be described as a process of the three stages: sensing, selecting and interpreting (Uusitalo, 2001). These three stages can be described as consumers’ motivations in the purchasing process and these motivations can be affected by various dimensions of the retail store (Gilmore et al., 2001). The following dimensions represent the stimuli which best characterize how consumers make their purchase decisions according to Gilmore et al. (2001):
Internal Retail Stimuli reflect all the internal elements controlled by the retailer and offered to the consumers in the store. The retailer is able to transfer a determined store image with the internal environment, characteristics such as merchandise assortment and availability, service personnel that could be modified to reach the retailers image goals.
External Retail Stimuli are those situations occurrence outside the store that can be
controlled by the retailer or not, for instance advertising and sales promotions.
Consumer Stimuli is a unique ‘behavioural and psychological’ dimension controlled by the consumers themselves based on personal experiences. Some characteristics that belong to this category are values and cultures.
As a response to these stimulus consumers’ creates mental images of the retail store i.e. is the result of the interaction of these stimulus (Stern et al., 2001). According to Thang et al., (2002) consumers transform these stimuli and get relevant information to perceive the stores. In the Retail Purchase Conflict Model in Figure 1, the three stimuli explained above are illustrated as part of the context of the purchase process.
13

Consumer Perception of Store Image: A study of Ikea and Ilva in Sweden and Denmark
External Retail Stimuli Consumer Perceptions Noise
Behavioral&
Psychological Conflict
Resolution
Avoidance
STORE
CHOICE
SEEK
ALTERNATIVES
PURCHASE
Internal Retail Stimuli
Consumer Stimuli
Environmental Conflict
Figure 1. Retail Purchase Conflict Model by Gilmore et al., (2001) The model by Gilmore et al. (2001) presents all the factors that retailers should consider in order to offer consumers the most suitable environment to encourage purchases. If there is no match between consumers’ expectations and the environment provided by the retailer, consumers will look for other alternatives that fit better with their preferences and expectations.
2.3 Retail Image Dimensions and Store Attributes
McGoldrick (2002) stresses the fact that there is a connection between store image and repeat purchase and that this is also affecting the level of satisfaction among consumers. In the forthcoming section, the components of store image in terms of dimensions and attributes will be revealed and established by several authors (Martineu, 1958; Downs, 1970; Lindquist, 1974; Manolis et al., 1994; Ditcher, 1985; Korgaonkar et al., 1985; Joyce and Lambert, 1996; Zimmer and Golden, 1988; Chowdhury et al., 1998; Stern et al., 2001; Kupke, 2002; Thang et al., 2002; McGoldrick, 2002).
2.3.1 Dimensions
To explain store image, a two correlated dimension system may be applied, where the relevant attributes of a retail store could be analysed focusing on elements of tangible and intangible nature (Downs, 1970; Kupke, 2002). Martineu (1958) has for instance identified two dimensions, the functional and psychological to determine the personality of the store; reflecting the retail store image perception from the consumers’ point of view. Tangible dimensions (Lindquist, 1974; Manolis et al., 1994; Thang et al., 2002) or functional dimensions as termed by Kupke (2002) include attributes such as product range, price or layout. According to Stern et al., (2001), the most general characteristics related to the functional dimension are merchandise selection, service quality and price range i.e. “the things you can objectively compare with the competitors...and are controlled by the management” (Ibid ).
14

Consumer Perception of Store Image: A study of Ikea and Ilva in Sweden and Denmark
On the other hand, the intangible dimension (Manolis et al., 1994; Thang et al., 2002) or psychological dimension is directly related to e.g. atmosphere (Kupke, 2002). Moreover, Linquist (1974) concluded that measuring store image should include both tangible and intangible factors. According to Stern et al., (2001), the intangible dimension of the store image is controlled by the consumer.
2.3.2 Attributes
Store image plays a significant role in the store choice decision among consumers (Joyce and Lambert, 1996) and therefore several authors have examined the area of attributes suitable to analyse and measure the image of a retail store; individual store attributes (Arons, 1961), attitudes and behaviours (Korgaonkar et al., 1985; Zimmer and Golden, 1988) or overall impressions (Martineu, 1958; Ditcher, 1985). McGoldrick (1998) argues that price and quality, for instance, are attributes of “critical importance”. According to Zimmer and Golden (1988) consumers tend to associate the store with ‘one or two’ components that make more impact on them, those attributes reflect the image of the store. Store attributes are essential when analysing the marketing mix of a retail company.
2.3.3 Areas to be Considered in Retail Store Image
Among the most contemporary authors in the retail store area is McGoldrick (2002), who has compiled several image dimensions and attributes from different scholars into overall general elements of store image (Appendix 1). McGoldrick (2002) also points out important parts of the retail marketing mix, which are pivotal when adding value to store image. Six key factors that are related to store image, and used in this thesis, are summarized below.
2.3.3.1 Merchandise Lindquist (1974) is one of the first authors to describe merchandise in relation to store image. He found that goods and services are a part of what is defined as merchandise, which was characterized by its quality, price, assortment and service. The merchandise attribute was found to be a key image factor, and have a positive impact on the consumer, and is therefore important when analysing store image (Ibid). In a later study, Zimmer and Golden (1988) found that merchandise (service not included) products are very much related to the retail store, i.e. if the products are accepted and attractive to the consumers, the store will also be perceived as attractive. Moreover, Zimmer and Golden (1988) found that “there is a tendency for consumers to think in terms of attributes related to merchandise”. Quality within merchandise is also considered to be an important image category in relation to retail stores (Ibid). Chowdhury et al. (1998) also refer to product quality e.g. high quality and large variety. Another important part of merchandise is range or selection (Zimmer and Golden, 1988).
2.3.3.2 Price Price is also considered to be a part of merchandise. For instance Lindquist (1974) and Zimmer and Golden (1988) have included price as an important attribute of retail stores. Chowdhury et al. (1998) defined prices/value in terms of e.g. fair prices and value for money. According to McGoldrick (2002) there are four main dimensions to be reflected upon when considering price and these are; the price position towards competitors, different geographical market conditions, price differentials between products in the retailer’s assortment and strategies related to the time dimension e.g. high-low-pricing strategies or everyday-low-pricing strategy.
15

Consumer Perception of Store Image: A study of Ikea and Ilva in Sweden and Denmark
2.3.3.3 Location Chowdhury et al. (1998) found that convenience, in terms of a location being accessible, is positively related to store image. McGoldrick (2002) stresses that location has to be seen as a long-term investment and it plays a significant role for succeeding through being visible and located in sectors, which facilitate consumer flow. Public transportation and free parking are other factors to consider when deciding on location. Thus, one important factor in the location analysis is accessibility (Ibid).
2.3.3.4 Advertising and Promotion According to Martineau (1958), advertisements are symbolic extensions of the store. Through words, consumers create abstractions of the stores’. Consumers create a conceptual image of the store via advertising and it is the retailers’ responsibility to transfer the desired image. McGoldrick (2002) states that advertising and promotion serve as a way for the retailer to attempt to portray a certain image, increase sales, win new consumers’ and so on. The message is controlled by the retailer and it is likely to reach a broad group of consumers (Ibid). There are other ways than advertising that can give the retailer publicity, such as public relations and corporate social responsibilities, and the choice of media is dependent on what specific target groups the retailer wants to reach (Ibid).
2.3.3.5 The Selling Environment Martineau (1958) created one of the first classifications of the selling environment and labelled it layout and architecture. This refers to the relationship between the physical part of the store and the atmosphere when transmitting impressions such as elegance or exoticness (Ibid). Also, symbols and colours, design and shape are related in people’s minds to positive or negative associations of the store (Ibid). Atmosphere could be determined by looking at the appeal of the store and feeling comfortable (Chowdhury et al., 1998). McGoldrick (2002) refers to the selling environment in terms of key elements that influence the process of creating an image, and this can be ‘seen as an extension of the retailers advertising and promotion’. Many retailers search for individuality since store environment is proven to have an influence on consumer’s long- and short-term behaviour and decisions, and this is an important aspect when displaying furniture goods (Ibid). Flexibility and change in store exteriors are important factors in differentiating towards competitors (Ibid). McGoldrick (2002) describes store atmosphere in terms of ‘sensory channels’ such as visual, aural and olfactory and are all considered to effect consumers. Further, it is evident that these attributes correlate with the overall image of the retail store (Ibid).
2.3.3.6 Personal Service Already in 1958 Martineau stated that sales personnel despite the rise of technology are an important factor in influencing consumers’ image perception. The attitudes of sale personnel also contribute to build impressions among consumers, making consumers feel for instance like at home. Based on their impressions, consumers will end up classifying the store in a positive or negative way. Lindquist (1974) found that one attribute that should be considered when studying image should be service e.g. service in general and e.g. salesclerk service. Moreover, Zimmer and Golden (1988) included service as an important image category, and Chowdhury et al. (1998) makes references to employee service, which includes for instance friendly and honest employees. Furthermore, personal service defined by McGoldrick (2002) is an important factor when influencing consumer’s perception of store image. Personnel can be seen as an extension of the store image and the retailer, and can play a significant role for repeat purchase and increasing satisfaction (Ibid).
16

Consumer Perception of Store Image: A study of Ikea and Ilva in Sweden and Denmark
2.4 Age, Gender and Education in Retail Store Image
Martineau (1958) found that consumers have a tendency to like retail stores that reflected their own perceived social standing. And therefore would it be of interest to add demographic aspects such as age, gender and education when analysing consumers’ perception of the retail store. Previous research has found that demographic characteristics such as age, gender and education have an impact on consumer behaviour (Hyllegard et al., 2005). According to Joyce and Lambert (1996) shoppers’ age significantly affects perceptions of store image’. Life-stage-ages-analysis could be used to analyse the different evaluations of the store consumers make throughout their lives. Gender is an area that lack research in relation to retail stores despite the fact that ‘certain retail sectors are gendered’ according to Foster (2004). The level of education of the consumers affects how advertising is interpreted and how consumers behave in society (Gauri and Cateora, 2006). Further, aesthetic preferences influence age, gender and education and affect the image perception of the store and these are also related to age (Joyce and Lambert, 1996). Aesthetic preferences vary among people as they are searching to satisfy their personal needs. Retail environment can be one aspect in which aesthetic preferences can be satisfied according to Holbrook and Schindler (1982).
2.5 Summary of the Theoretical Framework for Image
This chapter has given an overview of different elements in relation to image of a retail store. Image in this thesis, are all the perceptions consumers have related to the store but also include the corporate image. When stores are ascribed a personality, two dimensions, intangible and tangible, can be identified. Each of these dimensions can be decomposed into several attributes which have been studied by many authors throughout the years. Furthermore, several aspects related to the retail marketing mix, could be reflected on since they also affect the image of the retail store. Finally, consumers buying decisions should also be considered through factors such as age, gender, education. In the following chapter, culture and Country-of-Design will be looked into to add value to understanding the process of consumer perceptions of the retail store in Sweden and Denmark.
17

Consumer Perception of Store Image: A study of Ikea and Ilva in Sweden and Denmark
3. Theoretical Framework – Culture
This chapter will give the theoretical framework of culture based mainly on Hofstede’s five dimensions. Country-of-Design and internationalization is discussed in the end of the chapter where a model combining the theoretical framework of image and culture in relation to consumers’ image perception of the retail store also will be illustrated.
3.1 Conceptual Framework: Culture Described as an Onion
There is a close relationship between culture and retailing and local culture “affects the how and the wherefore of retailing” (McGoldrick, 2002). Culture influences all human behaviour and is an important variable in order to understand the differences and similarities between people in general and people with different nationalities. Hofstede (2005) defines culture as the ‘software of the mind’, that is patterns of thinking, feeling and acting that has been learned throughout life through family, people in the immediate surroundings, school, workplace and society in general. Culture could be explained as a ‘shared system of meanings’ (Trompenaars and Hampden-Turner, 1997) or as a ‘social construct’ since culture emerges from interaction with other people (Hofstede and Hofstede, 2005). It is something you learn, and not something you are born with (Ibid). Moreover, Hofstede (2005) refers to ‘Three levels of Human Mental Programming’, illustrated below in Figure 2. The collective programming of the mind is what distinguishes people of a certain group or category from people in other groups or categories and culture is essential in distinguishing these characteristics (Ibid). Overby et al., 2005 state how cultural characteristics among groups of people are different and can influence consumer behaviours and values. These differences should be within the acceptable standards accepted by your social group (Fischer and Ackerman, 1998). According to Usunier (2000), another way of understanding social groups is through their motivations to buy, spend, consume etcetera. In general, peoples motivation to purchase depends on how their culture influence the idea about material possessions and the purchasing power they have (Ibid).
Figure 2. Three Levels of Human Mental Programming (Hofstede and Hofstede, 2005)
Hofstede (2005) utilize an onion as a metaphor to describe and understand culture, where different cultural aspects are to be found in the different layers. This is illustrated in Figure 3 to the left. The heart of onion, ‘Culture Manifestation’, is values. Values are general tendencies to prefer certain relations over others; it could be relationships such as normal-abnormal, ugly-beautiful, and clean-dirty. These values are created early in life and have a strong influence on behaviour. Symbols, heroes and rituals are practices that are observable and visible, nevertheless, their cultural meaning is invisible and depends on how they are interpreted. The metaphor of the onion symbolizes that practices can change fast (e.g. retail consumption) while
Figure 3. Onion Diagram, Culture Manifestation on Different Levels (Hofstede and Hofstede, 2005)
18

Consumer Perception of Store Image: A study of Ikea and Ilva in Sweden and Denmark
the core of the onion, values, are more stable and change very slowly (Hofstede and Hofstede, 2005). According to Overby et al. (2005) is the subjective culture (intangible aspects of a society) what “influence consumer values and beliefs”. Values are unconsciously manifested and Hofstede (2005) argues that when evaluating peoples behaviour, it is evident to notice the difference between the desirable – how people think the world should be (e.g. what is right and wrong), and what is desired –what people want for themselves. The difference between the desirable and the desired are dependent on the norms and rules of behaviours (Ibid). Values are difficult to measure since there might be a contradiction between the desirable and the desired and therefore the practices play a significant role when measuring national cultural differences and consumer values (Overby et al., 2005; Hofstede and Hofstede, 2005).
3.2 Conceptual Model: Culture as a Lens Metaphor Derived from Hofstede’s analysis of values and culture, Overby et al., (2005) presented a model with a further analysis of culture and values within the consumption process (see Figure 4). The process starts when the information about the product or service is received by the customer to unconsciously being evaluated and influenced by his/her cultural background based on values acquired throughout life. According to Overby et al. (2005) “culture shape individual perceptions, dispositions and behaviours”. Before deciding to buy a product or service or not, attributes, consequences and desires are evaluated in the consumers mind; depending on the consumers ‘cultural values’ and the hierarchy of this three differs (Ibid).
The hierarchy attained to attributes will depend on the individual’s characteristics deriving from culture. Thus, means-end is another important factor depending on culture differences. While some cultures buy products based on characteristics such as romanticism, hedonism others chose their product or services based on self satisfaction and prestige. Cultural values vary among countries as well as values connected to quality, comfort, warmth and appearance.
Figure 4. Conceptual Model by Overby et al., 2005
3.3 Hofstede’s Five Dimensions of Culture in Denmark and Sweden n
enmark and Sweden have a shared history which has created a special bond between the two
better understand differences in values and customs among different cultures.
This section will describe the differences between the Danish and Swedish culture based oHofstede’s five dimensions. Dcountries. However, Danes seems to have a ‘big-brother-complex’ towards Swedes, founded during the grand era of Sweden 1945-1990 and tend to define their national identity in relation to Swedes (Mouritzed, 1999). It is an asymmetric relationship where Danes tend to describe Swedes in terms of negative or neutral judgements while Swedes tend to describe Danes in terms of positive or neutral judgements (Ibid). Several similarities and differences can be found among Danes and Swedes and Hofstede’s five dimensions provide a framework to
19

Consumer Perception of Store Image: A study of Ikea and Ilva in Sweden and Denmark
Based on extensive quantitative research, Hofstede (2005) came to the conclusion that despite
e similarities in what was interpreted as problems among the countries, the solutions varied
ranked the 74 countries (1-74) which was examined based n the opposite poles of the five dimensions mentioned above, where each country was given
ocuses on how to handle inequality in the society. Societies with high Power Distance Index are characterized by inequality in wealth
thdue to diverse cultural characteristic. Hofstede’s research resulted in four dimensions named; Power Distance Index (PDI), Individualism/Collectivism (IDV), Masculinity/Femininity (MAS) and Uncertainty Avoidance Index (UAI). A fifth dimension, Short- vs. Long-term Orientation (LTO), has occurred later on in order to make up for the missing perspective of eastern way of thinking. Each of the dimensions are seen as extreme contrasts and most countries score somewhere in between. The five dimensions can be used to measure and compare different cultures (Ibid). From the results Hofstede (2005) orelative points as well 0-100. A general description of the dimensions linked to Denmark and Sweden could be described as follows:
Power Distance Index (PDI) f
and power compared to societies with low Power Distance Index where the goal is equality among all citizens (Hofstede and Hofstede, 2005).
(Rank.1-74) Power Distance Index (PDI)
Point Ranking Sweden 67/68 31 Denmark 72 18
Both nd Swed cored low on the Power Distance Index. Denmark got 18 points ranking 72 and Sweden got 31 points ranking 67/68 (Ibid). One characteristic,
V) refers to society’s support of individual or
collective achievement and interpersonal relationships (Hofstede and Hofstede, 2005).
Denmark a en s
which can be explained by Power Distance Index, is the dependency relationship between employees and their managers. Related to this Swedish and Danish employees are known as less dependent on their managers than employees in countries with high Power Distance Index (Ibid). In the case of Sweden, the Power Distance Index is low and is represented in that ‘everyone should be equal and approachable’ (Trompenaars and Hampden-Turner, 1997). Another feature of Power Distance Index is visualized in the organizational structures of both countries, and show a flat structure with a tendency of a wish to work independently (Ibid). This can be related to the fact that countries with low Power Distance have a tendency to, in an early stage in the family, treat children as equal encouraging them to experiment and take control (Hofstede and Hofstede, 2005).
Individualism/Collectivism (ID
Individualistic societies indicate a culture with loose ties between individuals and where individuals are expected to look after themselves. On the other hand, in a collectivistic society, the interest of the group e.g. family is more important than the interest of the individual (Ibid). An Individualistic society stresses the importance of freedom in front of equality according to Hofstede (2005).
20

Consumer Perception of Store Image: A study of Ikea and Ilva in Sweden and Denmark
(Rank. 1-74) Individualism/Collectivism ( Rank. 74-1) (IDV)
Ranking Point Denmark 10 74 Sweden 13/14 71
ofstede’s (2005) analysis of Individualism/Collectivism showed that there is a link
he rank difference between Denmark and Sweden could be explained by Swedes’
asculinity/Femininity (MAS) refers to how gender roles are spread in society
(Rank.1-74) Masculinity/Femininity (Rank.74-1) (MAS)
Hbetween a low score on Power Distance Index and an Individualistic society. That Denmark obtained 74 points, ranking 10 and Sweden 71 points ranking 13/14 confirm this. According to Hofstede (2005), this could be explained by the cold climate in Scandinavia stressing the importance of being able to take care of your self. Furthermore, individualistic societies tend to be more focused on self-sufficiency, and confrontation is considered positive (Ibid). Hofstede (2005) also argue that societies with a high individualism score tend to consist of people who are more willing to practice Do-It-Your-self (DIY) activities related to the home. Ttendency to score higher than Danes on social factors such as social contact, showing understanding, more supportive and seeking consensus (Havaleschka, 2002; Sidelmann et al., 2005). Another explanation could be that in Sweden ‘divergent views and actions are well tolerated’ (Trompenaars and Hampden-Turner, 1997) and that Danes are more individually oriented and not afraid of conflicts (Havaleschka, 2002; Sidelmann et al., 2005). M(Hofstede and Hofstede, 2005). A country ranking high on masculinity tends to have a high degree of gender differentiation where males dominate the society and the structures of power (Ibid). For a country ranking high on femininity, gender roles tend to overlap (Ibid). There are findings that show a connection between masculine countries and a consumption of luxury articles since these can be used as indicators of success which is important to show in masculine countries (de Mooij and Hofstede, 2002).
Ranking Point Denmark 71 16 Sweden 74 5
On the Masculinity/Femininity Index, Denmark scored 16 and Sweden 5 which rank
the home according to Hofstede (2005).
them as respectively 71 and 74. Relevant is that Sweden is seen as the most feminine country among all 74 countries. The ‘Jante Law’ that is ‘don't think you're special or that you're better than us’ (Usunier, 2000), can be seen as a cultural code that partly explains the norms that influences the femininity in Denmark and Sweden. The variation in scores for Denmark and Sweden can be partly explained by how Swedes have a tendency to a social ability, to compromise and seek consensus which fit very well with a feminine society while Danes for instance have better analytical skills which fit better with a masculine culture (Hofstede and Hofstede, 2005, Sidelmann et al., 2005). Interesting is that people in feminine cultures tend to spend more money on
21
Consumer Perception of Store Image: A study of Ikea and Ilva in Sweden and Denmark
cuses on the ability to handle uncertainty and
ambiguity in the society (Hofstede and Hofstede, 2005). A country with low tolerance Uncertainty Avoidance Index (UAI) fo
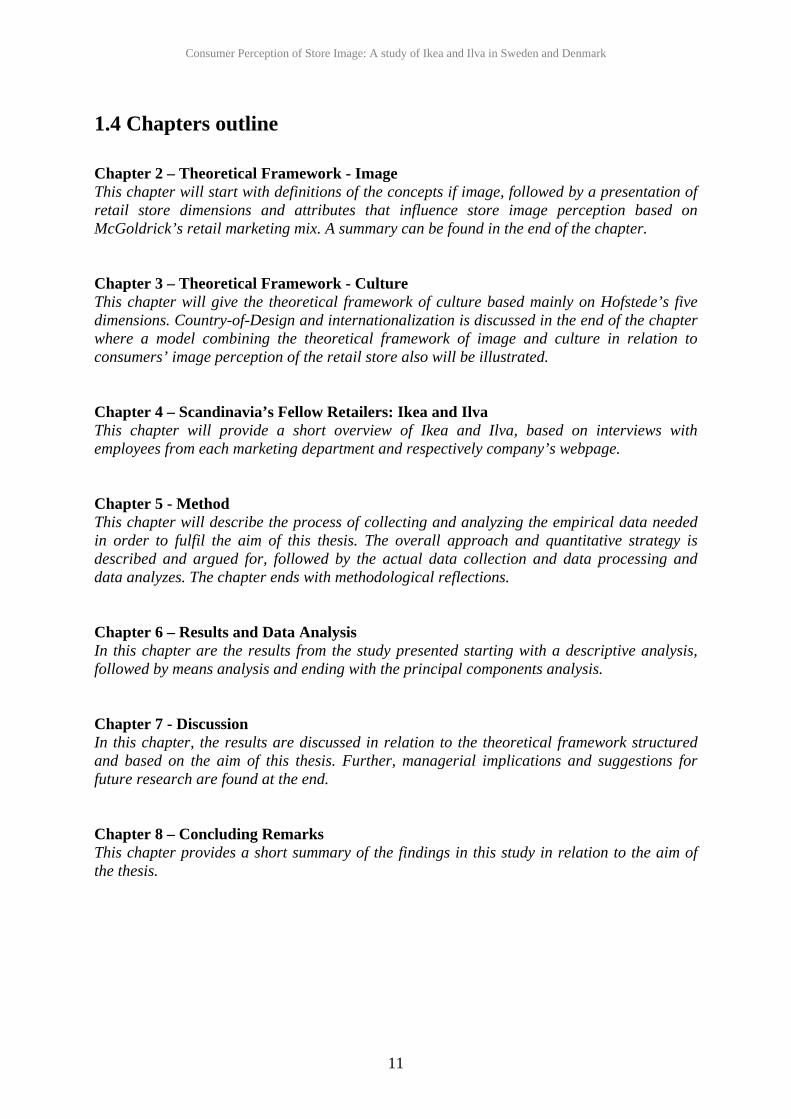
for uncertainty and ambiguity scores high in Uncertainty Avoidance and in order to reduce the level of uncertainty technology, law and religion are used (Ibid). A country that scores low in Uncertainty Avoidance tends to care less about uncertainty and ambiguity which foster people to be more flexible and less rule-oriented (Ibid). Countries with low Uncertainty Avoidance Index also tend to foster people that adapt fast to new products but also, as in the case of a high individualism score, a tendency to a DIY-attitude within the home area (Ibid). Also, a correlation between a low Uncertainty Avoidance Index and high spending on furniture and household equipment, have been found by de Mooij and Hofstede (2002). Furthermore, an innovative- and entrepreneurial behaviour tend to foster countries with a low Uncertainty Avoidance Index according to de Mooij and Hofstede (2002).
(Rank.1-74) low –Uncertainty/ Avoidance - high (UAI)
Ranking Point Sweden 70/71 29 Denmark 72 23
Denm points a anked 72 compared to Sweden which got 29 points and
nked 70/71 which indicates that both countries do not feel much unsecured by
O), this dimension is described by values.
Values associated with Long-term Orientation such as respect for traditions, fulfilling
t- vs Long-term Orientation (Rank.74-1) (LTO)
ark got 23 nd rrauncertain situation. These dimensions can be used to measure and compare different cultures (Hofstede and Hofstede, 2005).
Short- vs. Long-term Orientation (LT
of social obligations, social pressure on spending money and an opinion that today’s hard work lead to long-term rewards (Hofstede and Hofstede, 2005). Furthermore, values associated with Short-term Orientation are endurance, thrift, personal adaptation, respect for circumstances and the ability to feel shame (Ibid). De Mooij and Hofstede (2002) also show that there is a correlation between countries with Short-term Orientation and a high consumption of private labels. Other behaviours related to Short-term Orientation is a more frequent use of credit cards and e-commerce and a tendency to prefer single discount offers instead of saving stamps for future refunds (Ibid).
(Rank.1-74) Shor
Ranking Point Denmark 12 12 Sweden 23 33
In thi on Denma ot 12 points and ranked 12 while Sweden got 33 points nd ranked 23 which show that both countries tend to be more Short-term Orientated.
s dimensi rk ga
22

Consumer Perception of Store Image: A study of Ikea and Ilva in Sweden and Denmark
In the graph below, Hofstede’s five dimensions are summarized for Denmark and Sweden.
0
10
20
30
40
50
60
70
80
PDI IDV MAS UAI LTO
Sco
res Sweden
Denmark
Figure 5. An overview of Hosftede’s five dimensions: Sweden and Denmark
3.4 Country-of-Design According to Usunier (2005) does Country-of-Origin refer to the brands ‘made in’ and “elicit the image…commonly attached to products from a specific country” according to Thorelli et al. (1988). However in the case of Ikea and Ilva, the products are manufactured in multiple countries and the label Country-of-Design is therefore more relevant in this case, although similar to the concept of Country-of-Origin. D’Astous and Ahmed (1999) stress that several studies show the importance of a product’s origin; whether other studies show that consumers themselves give low importance to a product’s origin when purchasing. Nevertheless, in a recent study, when analyzing over 400 academic articles, Usunier states that consumers do not use the origin information solely as an evaluation when purchasing but “in conjunction with a number of other information cues such as price, brand, retail store image etcetera”. Furthermore, Usunier (2005) found that there is a relatively small connection between “knowledge about a product’s origin and its influence on preference for local products. Moreover, McGoldrick (1998) refers to perceptions of country of origin (or design) and the way how some companies decide ‘to promote their country of origin’ as a part of the company strategy abroad
3.5 Internationalization and Store Image There is an endless ongoing debate within academic research whether to standardise, adapt or do something in between, when going international (McGoldrick, 2002; Burt and Mavrommatis 2005). However, in the case of Ikea and Ilva is standardisation the most proper term to use. Even though some adaptation to the domestic market is made, a similar product line, price level, store design/décor and communication in the different countries refers to what McGoldrick (2002) label a global or standardised approach. Nevertheless, success in retail markets is “not predicted on cultural proximity, but on sound knowledge of national culture, including perceptions and behaviour that influence consumer decision making and impact acceptance of retailers’ products and services” (Hyllegard, et al., 2005). Retail internationalization in this study refers to the transfer of store image.
23

Consumer Perception of Store Image: A study of Ikea and Ilva in Sweden and Denmark
The company’s image and how this image is perceived among consumers is one evident factor that “provides the source of differentiation in the domestic marketplace” (McGoldrick, 2002) When aiming for competitive advantages in the domestic market, image is pivotal as “many other functional aspects of a retail operation can be imitated” (Burt and Carralero-Encinas, 2000). Image is something that is “built up over time with exposure to the retail company” and as store image contains of both tangible and intangible dimensions, there might be difficulties to transfer the intangible dimensions since these are more experience-related (Burt and Carralero-Encinas, 2000). Further, Burt and Mavrommatis (2005) stress that “store image is likely to be viewed more positively in the domestic market than in the host market”.
3.6 Summing up the Theoretical Framework of Culture Culture, values and practice, is something underlying that which is learned throughout life and influenced and supported in the interaction with other people. It is evident to consider culture due to the fact that it has a great influence on behaviour. Consumers make purchasing decisions based on what is labelled ‘The cultural lens’ and this will affect the decision the consumer make in the end in terms of how the consumer evaluate factors such as attributes, consequences and desires in relation to the product/service. In order to understand why the consumer act in a certain way it is therefore crucial to understand the impact of culture and this can be made by identifying the consumers underlying values with the help of Hofstede’s five dimensions. Country-of-Design was also discussed in relation to being a factor that can influence consumer preferences. When going abroad, companies should identify the store image in the domestic market first in order to find out competitive or differential advantage that then can be transferred successfully to the host market.
3.7 Own Theoretical Research Model In the next page is the conceptual framework of image and culture are composed in one model that will give further explanation to the process of consumers’ perception of retail store image. The model gives an overview of what has been discussed in the chapters of theoretical framework and should be seen as a summary of this.
Figure 6. Own Theoretical Research Model
24
Consumer Perception of Store Image: A study of Ikea and Ilva in Sweden and Denmark
4. Scandinavia’s Fellow Retailers: Ikea and Ilva
This chapter will provide a short overview of Ikea and Ilva, based on interviews with employees from each marketing department and respectively company’s webpage.
4.1 The Furniture Retail Company Ikea Ikea, founded in 1943 in Sweden, is a specialist retailer within the furniture industry, present in 34 countries/territories with 220 stores10. The Ikea vision is “to create a better everyday life for the many people” and their business concept is “to offer a wide range of well-designed, functional home furnishing products at prices so low that as many people as possible will be able to buy them”11. The price should not only be perceived as low but definitely low, a ‘fantastically low price’ and should also be lower than the price of a comparable product from another retailer12. Since the target group of Ikea is ‘the many people’ the price is considered pivotal13. The low-price-strategy permeates the whole organization, e.g. Ikea designers cooperating with manufacturers, and buying in bulk on a global scale14 and also involve “a partnership with the customer” where the customer e.g. transport and assemble the products themselves15. The concept of Ikea is standardized and is transferred to all countries16.
4.1.1 Marketing Communication
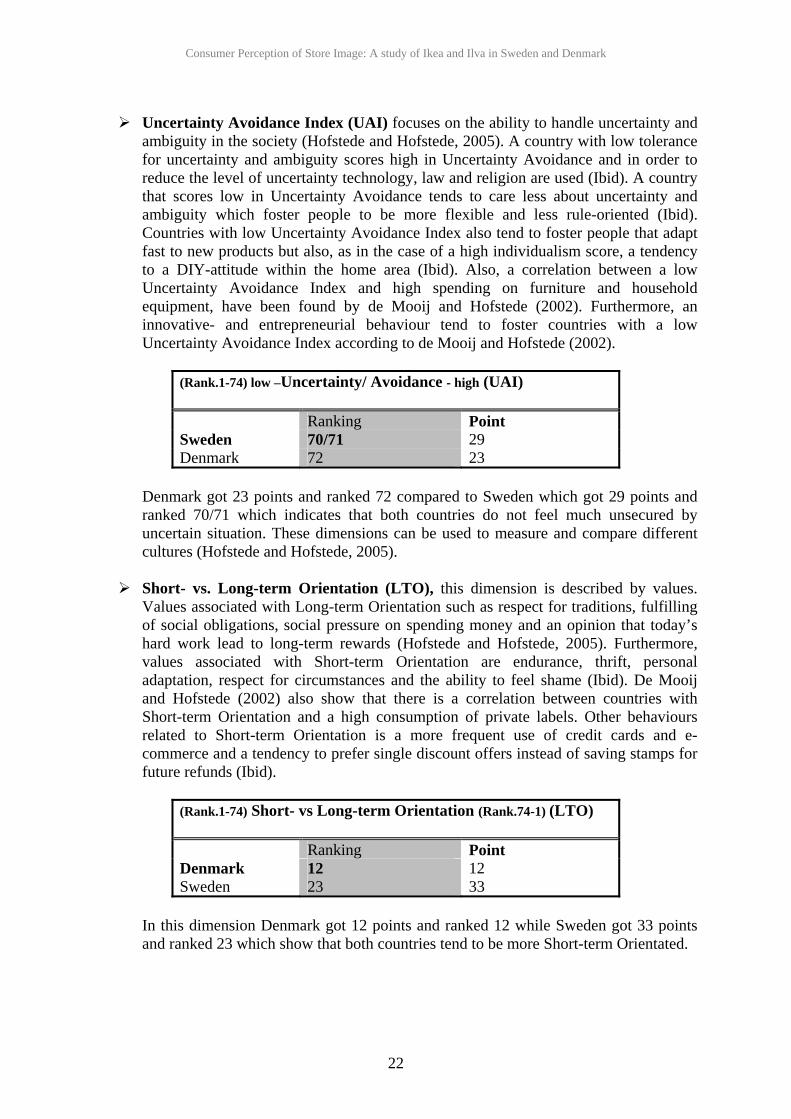
Figure 7. Ikea’s Pyramid of the Marketing Mix
The catalogue, ‘a printed version of the store’, is the most important marketing channel for Ikea17 and is also known for having a big impact among the consumers18. Other important marketing tools of Ikea are shown in the figure to the right.
4.1.2 The Store Ikea wants their stores to communicate ‘young and modern’, where the products could be seen as carriers of this message. These two attributes are also related to how Ikea wants the store personnel to be perceived19. Even though the consumers are considered as part time employees the sales personnel are important when communicating to the market20. The personnel should be nice, fast, accommodating, service minded and so on21. The store should be considered as an exciting ‘destination for a trip’. The visit should be associated with fun, surprises and inspiration22.
Merchandise
The Store
The Catalogue
Ikea Family
Adver-tisement*
* TV, newspapers, radio and brochures
10 http://www.ikea.com/ms/sv_SE/about_ikea/facts_figures/ikea_group_stores.html 11 http://www.ikea-group.ikea.com/corporate/about_ikea/index.html 12 Interview with Eva Stål, Head of Communication, Ikea 13 Ibid 14 http://www.ikea-group.ikea.com/PDF/IKEA_SaER.pdf 15 http://www.ikea.us 16 Interview with Eva Stål, Head of Communication, Ikea 17 http://www.ikea.com/ms/sv_SE/about_ikea/facts_figures/ikea_in_the_world.html 18 Interview with Eva Stål, Head of Communication, Ikea 19 Ibid 20 Ibid 21 Ibid 22 Ibid
25
Consumer Perception of Store Image: A study of Ikea and Ilva in Sweden and Denmark
4.1.3 The Products Ikea offers a wide range of products consisting of 9,500 articles, but also has a wide range of styles23 categorized such as Country, Swedish, Young Swede and Modern24. The Swedish heritage is very well communicated for instance in the logo where the blue and yellow colour represent the colour of the Swedish flag25. There is a clear description over the design of Ikea’s products and what is considered as typical Ikea, such as e.g. functional, brightly-coloured, uncomplicated, modern, Swedish, Scandinavian, light, unpretentious, restrained and multifunctional26. When it comes to quality, Ikea claims that the products in terms of price have good quality. Ikea also refers to necessary quality which means that everything that is not considered as necessary e.g. varnish underside of a table, is not done in order to avoid unnecessary costs for the consumers. Ilva is considered a competitor to Ikea with the strongest pressure existing in the south of Sweden27.
4.2 The Furniture Retail Company Ilva The furniture retail company Ilva was founded in 1950 in Denmark and is today present with three stores in Denmark, one in Sweden and in the summer of 2006 will the first store open in UK28. The Ilva vision is about offering involved and competent employees and to create the best stores for home furnishing through consumer experience29. ”We think that furniture should look good, cost less and last for years. We think buying it should be a pleasure instead of a headache” Ilva also state that they “offer an eclectic range of design styles at prices that are dramatically lower than you would expect30. The concept and marketing of Ilva is standardized in Denmark, Sweden and the UK31.
4.2.1 Marketing Communication The catalogue is the most important marketing tool for Ilva along with advertisements in newspapers and the company web page32. Ilva does not have a specific target group, yet the typical consumer is already settled and in the age of 45 and older33.
4.2.2 The Store Ilva states that their stores are “clean, spacious, modern and elegant, actually that’s an understatement, they’re amazing”34. Ilva does not sell hot dogs and does not have a playroom for children35. The service and the sales personnel should be perceived as better than at the competitors by being service minded and giving consumers guidance36.
23 http://www.ikea.com/ms/sv_SE/about_ikea/our_vision/how.html + http://www.ikea.us 24 Interview with Eva Stål, Head of Communication, Ikea 25 http://www.ikea.com/ms/sv_SE/about_ikea/our_vision/heritage.html 26 Interview with Eva Stål, Head of Communication, Ikea 27 Ibid 28 http://www.ilva.se/historie/32.3/historia/ 29 http://www.ilva.se/omilva 30 http://www.ilva.co.uk/31 Charlotte Mellbelle, Marketingdepartment, Ilva 32 Ibid 33 Ibid 34 http://www.ilva.co.uk/ 35 Charlotte Mellbelle, Marketingdepartment, Ilva 36 Ibid
26
Consumer Perception of Store Image: A study of Ikea and Ilva in Sweden and Denmark
4.2.3 The Products Ilva offers a wide range of products and a wide range of styles, such as Romantic, Modern, Country and Danish design37. The design is considered classic, as such does not suffer from the flaws of super modern products that only last for one season38. The products of Ilva are quality products at fair prices and the Danish heritage is communicated through ‘Danish design’ and Danes designing the stores39. Ilva does not consider Ikea to be the main competitor since they are so different40.
37 Charlotte Mellbelle, Marketingdepartment, Ilva 38 Ibid 39 http://www.ilva.co.uk/ 40 Charlotte Mellbelle, Marketingdepartment, Ilva
27

Consumer Perception of Store Image: A study of Ikea and Ilva in Sweden and Denmark
5. Method
This chapter will describe the process of collecting and analyzing the empirical data needed in order to fulfil the aim of this thesis. The overall approach and quantitative strategy is described and argued for, followed by the actual data collection and data processing and data analyzes. The chapter ends with methodological reflections.
5.1 Overall Approach The aim of this thesis is to investigate Danish and Swedish consumers’ image perception of Ikea and Ilva. By using existing theory of store image and concepts about culture can this study be seen as descriptive where the research is pre-planned and structured (Malhotra and Birks, 2003). To a certain point the research is also, what Malhotra and Birks (2003) refers to as, explanatory since there is also an aim to find out possible differences between the existing theory and the empirical result.
5.1.1 Scientific Stance and Overall Approach It is necessary to identify the philosophical issues which consciously or unconsciously influence the way the research is designed and conducted (Easterby-Smith et al., 2002). The philosophical issues consist of ontological and epistemological questions where ontology is “assumptions that we make about the nature of reality” and epistemology is a “general set of assumption about the best ways of inquiring into the nature of the world” (Ibid). In this case, the ontological position could be resembled to what Easterby-Smith et al., (2002) labels representationalism where the question is “whether the research results are an accurate reflection of reality” (Ibid). The results obtained in this study will contain concrete facts derived from theory that are tested empirically. The epistemological position in this case will therefore be what Easterby-Smith et al., (2002) refers to as positivism where the social world is considered to exist externally independently from us as observers and where the aim is to identify the knowledge about the social world. Reality in this case is determined by “objective and external factors” unlike the epistemological stance of social constructionism that see reality as determined by people (Ibid). The difference is that this research aims, among other things, to find out “external causes and fundamental laws” (Ibid) to explain possible differences between Danish and Swedish respondents, not to try to understand why there are possible differences. The positivistic stance in this research means that we assume that, for instance image and culture is something that exists as it is and is not something which is created. We are investigating differences which can be seen and measured and this will also facilitate the issues connected with equivalence in cross-cultural studies. Also, as one of the authors of this thesis is from Chile a more objective view of the Danish and Swedish culture may have been possible. The positivistic stance has several advantages such as its ability to “be fast and economical”, “provide a range of situations” and “be of considerable relevance” (Ibid). Based on the ontological and epistemological stance stated above, a conclusion can be made that this study is based on theory that is evaluated through empirically data. The theory does therefore to some extent control and form the empirical collection, what Bryman and Bell (2003) refers to as a deductive approach.
28

Consumer Perception of Store Image: A study of Ikea and Ilva in Sweden and Denmark
Emic and etic are two different approaches that need to be considered when studying two different cultures (Usunier, 2000). The emic approach “holds that attitudinal or behavioural phenomena are expressed in a unique way in each culture” and the etic approach is more about identifying universal measures (Usunier, 2000). This study can be seen as having both an emic and an etic approach since to be ‘cultural’ requires the emic viewpoint, and ‘cross’ requires the etic perspective (Malhotra et al., 1996). However, the emic adaptation can be seen as less due to the fact that there is a convergence between the Danish and Swedish culture and language.
5.1.2 Quantitative Method The ontological and epistemological position stated above and the deductive approach indicates that a quantitative strategy would be a logical method in this study. A questionnaire was considered to be the best alternative since this is an easy, flexible and quick way to collect empirical data (Bryman and Bell, 2003). A questionnaire with fixed answers also seemed to be the best way of avoiding response bias since this study is cross-cultural. Questionnaires send via traditional mail are costly and receiving the answers are time consuming, and questionnaires send by e-mail are known for having a low response rate and could also be time consuming in the sense of people not answering immediately (Malhotra and Birks, 2003). A face-to-face questionnaire was therefore chosen since it is known for a high response rate and also because lengthy, complex and varied questions can be asked since the respondents interact with the interviewer and at the same time can see the questionnaire (Ibid). A common drawback with questionnaires, in comparison with for instance regular unstructured interviews, is that the respondents tend to become tired of answering too many questions (Bryman and Bell, 2003). This can be overcome by not having too many questions in the questionnaire and having an uncomplicated structure (Ibid). A nice and professional layout and straightforward instructions will also lower the number of missing values (Ibid). An advantage with quantitative methods is that the level of what is considered to be sensitive information (e.g. age, level of education) given by the respondents can be increased (Malhotra and Birks, 2003). Since the respondents were approached face-to-face in the street, this might not be the case. However, to increase the level of trust from the respondents, anonymity of the answers was assured up front. The insurance of anonymity could also have increased the probability for the respondents to feel free to reveal their true opinions without any kind of reservations (Ibid). In order to obtain trust from the respondents the authors of thesis also wore sweaters with the logo of Lund University and a nametag with our whole name and the logo of Lund University.
5.2 Data Collection The concept of image cannot be measured directly (it is not a quantitative variable like temperature or speed), therefore “different aspects or components associated to this concept should be measured” (Bryman and Bell, 2003). However, the image perception of a company can be studied using indicators and indirect measurement (Ibid) that are related to the components of store image, that is, its attributes. The attributes presented in the previous theory chapters have therefore been operationalized in order to be measured quantitatively (Easterby-Smith et al., 2002).
5.2.1 The Operationalization The starting point for the operationalization in this survey was the overall attributes shared by several authors, summarized at the end of the previous theory chapter of image. These in total
29
Consumer Perception of Store Image: A study of Ikea and Ilva in Sweden and Denmark
18, were written down on different cards with connected key words, see Appendix 1. The key words were selected on the basis of how relevant they were to this study. Nine respondents (four Danes and five Swedes) of varying age, gender, professions, and backgrounds etcetera, where then asked to pick out and rank what they thought were the seven most important attributes when they were buying furniture and home décor in a store, a method also used by Usunier (2000) and Burt and Mavrommatis (2005). The seven most important overall attributes were then identified to form the basis for the questions that will measure the importance of these among consumers. Since the attributes are general and overall definitions, three questions have been formulated in order to capture and measure each attribute. These questions are based on McGoldric (2005) concepts relating to these seven attributes. The exact formulation of the questions is based on McGoldric’s concepts and studies by, Westbrook (1981) Chowdhury et al. (2001), Burt and Carralero-Encinas (2000) and Burt and Mavrommatis (2005) on measuring store image. Questions from these previous studies have been selected and sometimes modified, on the basis of how well they would measure the seven overall attributes and how relevant they are to the furniture sector and Ikea and Ilva. The selection of seven attributes with each three questions was chosen due to keeping the questionnaire at a reasonable length in order for respondents to be willing to respond. The operationalization and the structure of the questionnaire are illustrated in Figure 8. As this thesis is written in English, it seems natural to have the questionnaire in English, also this may eliminate the bias that may occur during a possible translation. However, to have it in English might increase misunderstandings given that a majority of Swedes and Danes, despite being known for speaking rather good English, are not fluent in the language. Even though knowledge in a second language is good, for instance English for a Swede does text in a second language take longer to asses and is assessed less well according to a study by Hansen and Karlgren (2005). Moreover, the language differences are small between Danish and Swedish (Nielsen et al., 2003). Several respondents in the pilot test of this study where also tested for a questionnaire in English, and although the answers were the same as in the Swedish questionnaire, did the fact that it was in English meet a strong resistance among the respondents. It is however pivotal to obtain translation equivalence in cross-cultural research to facilitate achieve reliability and validity and to ensure comparability. In order to develop equivalent questionnaires several persons fluent in either Swedish, Danish, English or all three, have been involved in the process of translation at the same time, discussing and modifying until consensus was reached, what is labelled parallel translation (Malhotra and Birks, 2003; Usunier, 2000) or multilingual panel analysis (Cavusgil and Das, 1997). To some extent the concept of back-translation (Cavusgil and Das, 1997; Usunier, 2000; van Herk et al., 2005) has also been used where for instance the Danish questions first have been translated from Swedish and then translated back again from Danish to Swedish. These methods of obtaining equivalent questionnaires are used in several studies concerning respondents from different countries (Cavusgil and Das, 1997; Keillor et al., 2001; Bucken-Knapp, 2001; Jin and Sternquist, 2004; Burt and Mavrommatis, 2005; Cunningham et al., 2006). The questions in English, Danish and Swedish can be seen in Appendix 2a and 2b. The authors somewhat limited Danish linguistic skills were to some extent offset by allowing the respondents to view the question as it was read to them. This should not create any bias in our results as the same procedure was conducted among the Swedish respondents.
30
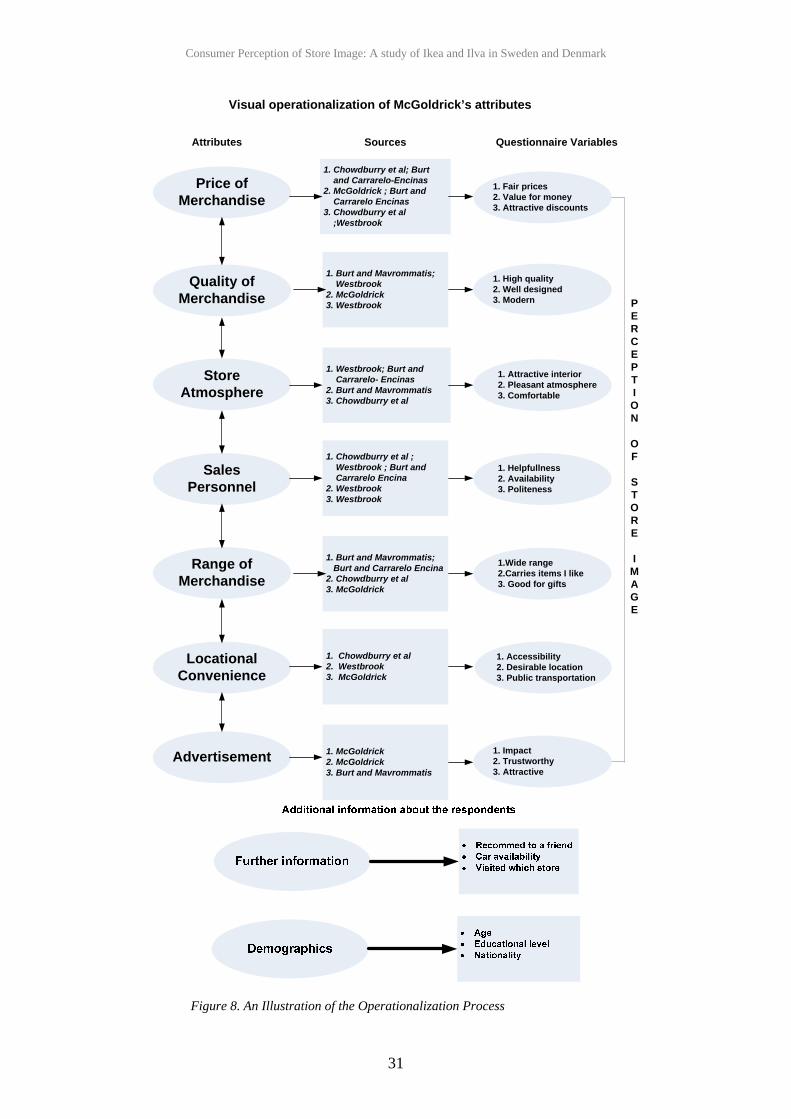
Consumer Perception of Store Image: A study of Ikea and Ilva in Sweden and Denmark
Price of Merchandise
Quality of Merchandise
Store Atmosphere
Sales Personnel
Range ofMerchandise
Locational Convenience
Advertisement
PERCEPTION
OF
STORE
IMAGE
1. Fair prices 2. Value for money 3. Attractive discounts
1. Chowdburry et al; Burt and Carrarelo-Encinas2. McGoldrick ; Burt and Carrarelo Encinas3. Chowdburry et al ;Westbrook
1. Burt and Mavrommatis; Westbrook2. McGoldrick 3. Westbrook
1. High quality 2. Well designed 3. Modern
1. Attractive interior 2. Pleasant atmosphere 3. Comfortable
1. Helpfullness 2. Availability 3. Politeness
1.Wide range 2.Carries items I like 3. Good for gifts
1. Accessibility 2. Desirable location 3. Public transportation
1. Impact 2. Trustworthy 3. Attractive
1. Westbrook; Burt and Carrarelo- Encinas2. Burt and Mavrommatis3. Chowdburry et al
1. Chowdburry et al ; Westbrook ; Burt and Carrarelo Encina2. Westbrook3. Westbrook
1. Burt and Mavrommatis; Burt and Carrarelo Encina2. Chowdburry et al 3. McGoldrick
1. Chowdburry et al2. Westbrook3. McGoldrick
1. McGoldrick2. McGoldrick3. Burt and Mavrommatis
Attributes Sources Questionnaire Variables
Visual operationalization of McGoldrick’s attributes
Figure 8. An Illustration of the Operationalization Process
31

Consumer Perception of Store Image: A study of Ikea and Ilva in Sweden and Denmark
5.2.2 The Questionnaire The questionnaire utilize the attribute-based approach (Pinkley et al., 2005) where the respondent assess stimuli on a pre-defined set of attributes, in this case the image attributes described in the theory chapter. The in total 21 close ended questions that deal with store image are measured through a five-point Likert scale, which is a common instrument when measuring attitude and persons feelings about something (Bryman and Bell, 2003). The respondent was asked to rate each statement on a scale from 1 - ‘strongly disagree’ to 5 -‘strongly agree’. The Likert scale was selected mainly because research show that when measuring store image, respondents prefer the Likert scale over semantic differential and staple scales and they find that the Likert scale is easy to understand (Menezes and Elbert, 1979). Further, a five-point Likert scale where chosen as it has been used in several studies of store image (Wheately and Chiu, 1977; Porter and Claycomb, 1997; Wong and Teas, 2001; Thang and Tan 2003) and in several studies conducted in Sweden and Denmark (Eriksson et al., 2000; Bucken-Knapp, 2001; Nielsen et al., 2003) and as the Likert scale is a five-point scale in its most common forms (Menezes and Elbert, 1979). Advantages with the Likert scale is that it is quick and easy to complete for the respondent and the answers allows comparability, is easy to compare and find out correlations between other variables plus it is easy to compile (Bryman and Bell, 2003). A disadvantage with closed questions like this could be the lack of spontaneity in the respondents’ answers (Ibid). However, since this questionnaire is based on previous research from several authors explained in previous sections, applying both quantitative and qualitative methods, it is likely that most areas have already been covered. As the findings from the study of Chowdhury et al. (2001) showed, there are few differences between the results from the two methods. Another drawback could be that words or concepts can be understood differently among the respondents (Bryman and Bell, 2003) and it is therefore important to make the questions as straightforward as possible by e.g. using common and easy words. A benefit has been that one of the authors to this thesis does not have Swedish as her native tongue, and therefore, questions that she had a hard time to understand were redrafted or deleted. A small convenience sampling pilot test has been carried out before the actual data collection (Bryan and Bell, 2003) in order to investigate the perception and the responsiveness of the respondents towards the questionnaire, testing variables such as time spent and clarity of the questions. Friends, family and friends friends have been asked to answer the questionnaire in several rounds, to comment on any strange formulated statement or indistinct instruction. In order to analyze the seven attributes each of the 21 questions will represent how respondents perceive both companies. An illustration of how the questionnaire is constructed can be seen in Figure 8. The questionnaire is the result of the operationalisation of the theory and can be seen entirely in Swedish, Danish and English in Appendix 3a, 3b, 4a and 4b. In order to get an overall picture over age, gender and education these questions were also added to the questionnaire as illustrated in Figure 8.
5.2.3 Sample and Realization It is essential to select samples of sufficient size in order to generalize and draw inferences about the wider population (Bryman and Bell, 2003) and according to Jacobsen (2002) the sample should consist of at least 100 respondents. As this study is dealing with respondents from two different countries, did a sample of 150 Danes and 150 Swedes seem reasonable due to the time- and cost limitations of the study, this is also the same amount of respondents as
32
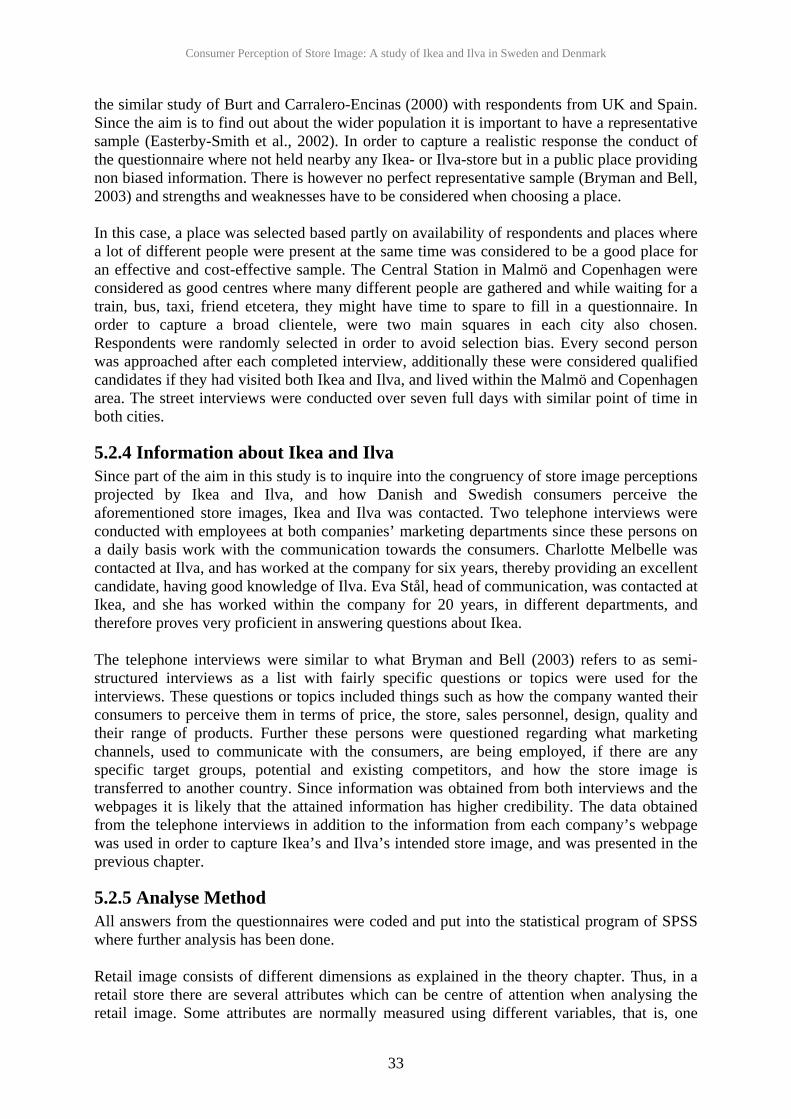
Consumer Perception of Store Image: A study of Ikea and Ilva in Sweden and Denmark
the similar study of Burt and Carralero-Encinas (2000) with respondents from UK and Spain. Since the aim is to find out about the wider population it is important to have a representative sample (Easterby-Smith et al., 2002). In order to capture a realistic response the conduct of the questionnaire where not held nearby any Ikea- or Ilva-store but in a public place providing non biased information. There is however no perfect representative sample (Bryman and Bell, 2003) and strengths and weaknesses have to be considered when choosing a place. In this case, a place was selected based partly on availability of respondents and places where a lot of different people were present at the same time was considered to be a good place for an effective and cost-effective sample. The Central Station in Malmö and Copenhagen were considered as good centres where many different people are gathered and while waiting for a train, bus, taxi, friend etcetera, they might have time to spare to fill in a questionnaire. In order to capture a broad clientele, were two main squares in each city also chosen. Respondents were randomly selected in order to avoid selection bias. Every second person was approached after each completed interview, additionally these were considered qualified candidates if they had visited both Ikea and Ilva, and lived within the Malmö and Copenhagen area. The street interviews were conducted over seven full days with similar point of time in both cities.
5.2.4 Information about Ikea and Ilva Since part of the aim in this study is to inquire into the congruency of store image perceptions projected by Ikea and Ilva, and how Danish and Swedish consumers perceive the aforementioned store images, Ikea and Ilva was contacted. Two telephone interviews were conducted with employees at both companies’ marketing departments since these persons on a daily basis work with the communication towards the consumers. Charlotte Melbelle was contacted at Ilva, and has worked at the company for six years, thereby providing an excellent candidate, having good knowledge of Ilva. Eva Stål, head of communication, was contacted at Ikea, and she has worked within the company for 20 years, in different departments, and therefore proves very proficient in answering questions about Ikea. The telephone interviews were similar to what Bryman and Bell (2003) refers to as semi-structured interviews as a list with fairly specific questions or topics were used for the interviews. These questions or topics included things such as how the company wanted their consumers to perceive them in terms of price, the store, sales personnel, design, quality and their range of products. Further these persons were questioned regarding what marketing channels, used to communicate with the consumers, are being employed, if there are any specific target groups, potential and existing competitors, and how the store image is transferred to another country. Since information was obtained from both interviews and the webpages it is likely that the attained information has higher credibility. The data obtained from the telephone interviews in addition to the information from each company’s webpage was used in order to capture Ikea’s and Ilva’s intended store image, and was presented in the previous chapter.
5.2.5 Analyse Method All answers from the questionnaires were coded and put into the statistical program of SPSS where further analysis has been done. Retail image consists of different dimensions as explained in the theory chapter. Thus, in a retail store there are several attributes which can be centre of attention when analysing the retail image. Some attributes are normally measured using different variables, that is, one
33

Consumer Perception of Store Image: A study of Ikea and Ilva in Sweden and Denmark
attribute can be measured in different ways, for instance by asking two or more question related to this attribute. As mentioned before, 7 attributes were chosen and measured by 3 statements each, which account of total 21 statements/variables. It is important to notice that given the high number of variables, it is very likely that they will show some degree of dependency between each other, i.e. a certain amount of correlation. Therefore, there is a risk that many variables could measure the same information (e.g. using two variables to measure the size of a box, 1 variable measure the size in centimetres and the other measure the size in inches), making it difficult to assess which variable measure best a specific attribute, besides the extra time spent on trying to measure too many variables that are, in fact, redundant in information. Hence, it would be interesting to have independent variables to measure the different attributes. To overcome this issue, will the multivariate method of principal component analysis be used. Principal Component Analysis is a procedure to reduce the number of variables into a smaller set of indicators, called ‘principal components’ that are linear combinations of the original variables (Manly, 1986). The advantage of the principal component analysis is that the principal components are uncorrelated which means that each principal component will measure different dimensions in the data. Another useful feature is that all the principal components are sorted in a way were the first one account for the largest amount of variation, the second one less and so on. The main application of this feature is that there is always a chance to model the most of the variation in the data set by using few of this components (Ibid), (note that the maximum number of components possible to be calculated in a data set will be the total number of original variables). In other words, the idea behind the principal components analysis is to try to reduce the dimensionality of the space that represents the data into a smaller one, which attempts to represent the variation in the data as much as possible by reducing the number of components. The data analysis of the survey consists of two parts; the former performs an aggregate analysis of the different attributes in order to calculate if there are statistical differences in the means of the attributes. The latter is to perform a principal components analysis for reducing the number of variables to convey an analysis of which attributes are more important in furniture retail image by analysing the first principal components. The quantitative data analysis will include analysis of frequency tables for the dichotomous variables (yes/no questions) and making some dispersion measurement (e.g. variance, standard deviation, etc.) for the variables with interval e.g. age (Bryan and Bell, 2003). Moreover, it will be achievable to extract information related to the role of gender in attribute perception. Furthermore, it will be possible to contrast the results in a general context and draw conclusions in the case that the study shows any significant difference between sexes or how attributes are perceived for each sex.
5.2.6 Data Processing In the following section the data processing is explained based on the different sections in the questionnaire.
5.2.6.1 Comparing Image Attributes using Statistical Significances Measurements In order to compare the differences among attributes between the two retail companies, a
mean is calculated for each variable e.g. Swedes evaluation for Ikea and Ilva, and Danes evaluation for Ikea and Ilva. From these combinations, it will be estimated if the differences
34
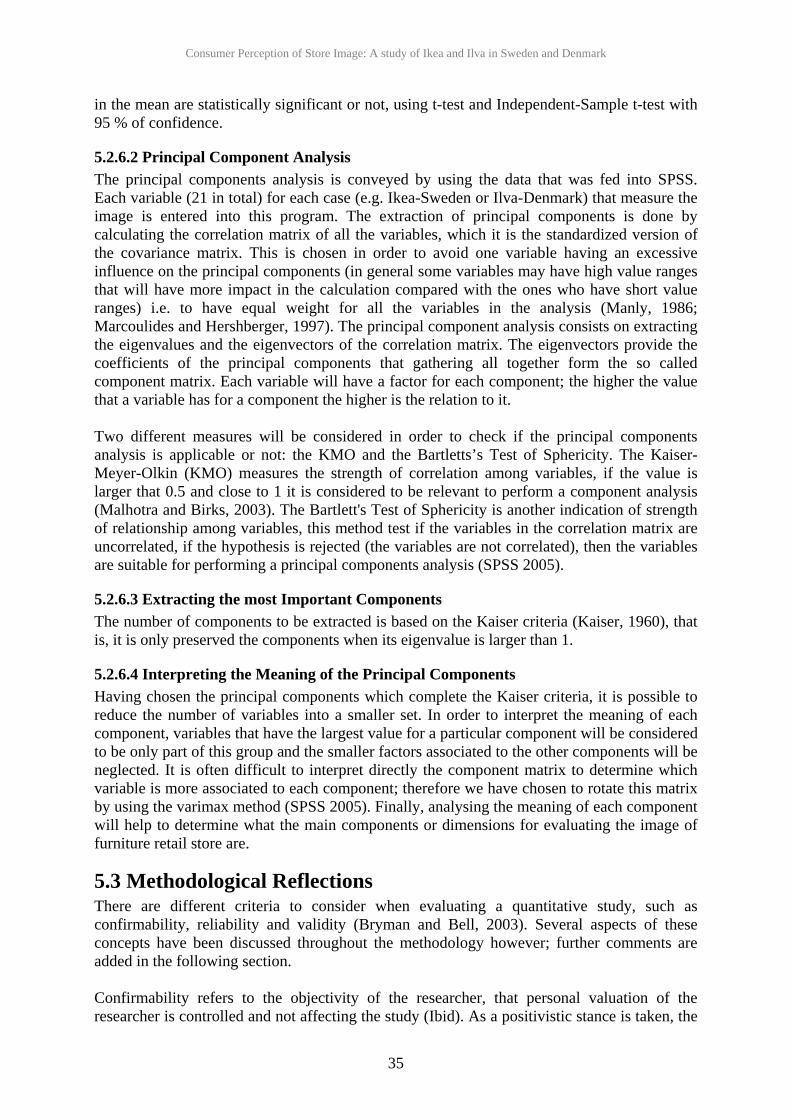
Consumer Perception of Store Image: A study of Ikea and Ilva in Sweden and Denmark
in the mean are statistically significant or not, using t-test and Independent-Sample t-test with 95 % of confidence.
5.2.6.2 Principal Component Analysis The principal components analysis is conveyed by using the data that was fed into SPSS. Each variable (21 in total) for each case (e.g. Ikea-Sweden or Ilva-Denmark) that measure the image is entered into this program. The extraction of principal components is done by calculating the correlation matrix of all the variables, which it is the standardized version of the covariance matrix. This is chosen in order to avoid one variable having an excessive influence on the principal components (in general some variables may have high value ranges that will have more impact in the calculation compared with the ones who have short value ranges) i.e. to have equal weight for all the variables in the analysis (Manly, 1986; Marcoulides and Hershberger, 1997). The principal component analysis consists on extracting the eigenvalues and the eigenvectors of the correlation matrix. The eigenvectors provide the coefficients of the principal components that gathering all together form the so called component matrix. Each variable will have a factor for each component; the higher the value that a variable has for a component the higher is the relation to it. Two different measures will be considered in order to check if the principal components analysis is applicable or not: the KMO and the Bartletts’s Test of Sphericity. The Kaiser-Meyer-Olkin (KMO) measures the strength of correlation among variables, if the value is larger that 0.5 and close to 1 it is considered to be relevant to perform a component analysis (Malhotra and Birks, 2003). The Bartlett's Test of Sphericity is another indication of strength of relationship among variables, this method test if the variables in the correlation matrix are uncorrelated, if the hypothesis is rejected (the variables are not correlated), then the variables are suitable for performing a principal components analysis (SPSS 2005).
5.2.6.3 Extracting the most Important Components The number of components to be extracted is based on the Kaiser criteria (Kaiser, 1960), that is, it is only preserved the components when its eigenvalue is larger than 1.
5.2.6.4 Interpreting the Meaning of the Principal Components Having chosen the principal components which complete the Kaiser criteria, it is possible to reduce the number of variables into a smaller set. In order to interpret the meaning of each component, variables that have the largest value for a particular component will be considered to be only part of this group and the smaller factors associated to the other components will be neglected. It is often difficult to interpret directly the component matrix to determine which variable is more associated to each component; therefore we have chosen to rotate this matrix by using the varimax method (SPSS 2005). Finally, analysing the meaning of each component will help to determine what the main components or dimensions for evaluating the image of furniture retail store are.
5.3 Methodological Reflections There are different criteria to consider when evaluating a quantitative study, such as confirmability, reliability and validity (Bryman and Bell, 2003). Several aspects of these concepts have been discussed throughout the methodology however; further comments are added in the following section. Confirmability refers to the objectivity of the researcher, that personal valuation of the researcher is controlled and not affecting the study (Ibid). As a positivistic stance is taken, the
35

Consumer Perception of Store Image: A study of Ikea and Ilva in Sweden and Denmark
confirmability is confirmed since reality is seen as determined by “objective and external factors” and the researcher is detached from what is studied. Still, the authors of this thesis have certain pre-understandings, such as a mental luggage consisting of preconceived notions, experiences, different backgrounds and interests that might have affected the study. However, the quantitative method, in-street-interviews with questionnaires should have decreased the influence from the authors of this thesis on the respondents. Reliability is determining whether “the measures yield the same results on other occasions” (Easterby-Smith et al., 2002). Since the result, presented in the analysis, had a 95 % of confidence the result are statistically significant, meaning that there is only a 5 % chance that the results from the overall study are not reliable. In order to obtain reliability and increase credibility has the authors of this thesis strived to make the study as transparent (Ibid) as possible, meaning that the methods of this study, e.g. the operationalization, how the empirical data was collected and the tools used to analyze the data, has been explained. Since two authors have been involved in this study, a more objective view has been obtained and mistakes when feeding the results from the questionnaires into the computer has decreased. However, the fact that two researchers conducted the street-interviews brings up the question if two different researchers can conduct and get the same result. One of the authors of this thesis is not fluent in Danish and Swedish but before the street-interviews the author practiced the pronunciation of the questions in Danish and Swedish. Since the interviews where based on the questionnaire with fixed questions and answers was the probability of the same result but with two different researchers increased. The face-to-face interview also allowed clarifying any doubts or queries for the respondents. The validity of the study measure if “the measures correspond closely to reality” (Easterby-Smith et al., 2002), and this can be seen as the most important criteria to evaluate the study through, according to Bryman and Bell (2003). As the criteria for a respondent to be asked to participate in this study was he/she had visited both Ilva and Ikea, this might have increased the validity since the respondent had knowledge about what they are asked. The Likert scale is also, as mentioned before, a good instrument for capturing consumers’ attitude. Further, the questions in the questionnaire are in conformity with what is examined, store image, since the questions are based on previous research on store image. The pilot-tests of the questionnaire has also increased the validity since obscurities has been avoided. A way of testing validity for the principal components analysis for finding the main dimension of retail image store, the principal components analysis will be compared among four different cases i.e. using two furniture retail stores, Ikea and Ilva, for both Sweden and Denmark. If each case shows similar interpretation of the components, then it can be established that these similar principal components are the ones that are more important for furniture retail stores in general. The total sample, presented in the next chapter, will show that there is somewhat an imbalance between ages, in particular within the Danish sample. This could be due to the fact that the authors of this thesis not are fluently in Danish which sometimes was a problem with the older Danish respondents. The few older people among the Swedish respondents depend on that many older people in Sweden did not know about Ilva. Personal interviews always create a risk for social desirability, that is “the tendency of respondents to give answers that may not be accurate but may be desirable from a social standpoint” (Malhotra and Birks, 2003). However, “methodologically, personal interviews have been shown to be less susceptible to social desirability and haloing biases than other
36

Consumer Perception of Store Image: A study of Ikea and Ilva in Sweden and Denmark
popular forms of data collection” (Keillor et al., 2001). In this case, were the questions about age and especially education perceived as sensitive questions by some respondents and the authors of this thesis felt that several respondents were not frank in this question.
37

Consumer Perception of Store Image: A study of Ikea and Ilva in Sweden and Denmark
6. Results and Data Analysis
In this chapter are the results from the study presented starting with a descriptive analysis, followed by means analysis and ending with the principal components analysis.
6.1 Descriptive Statistics In this study seven retail store attributes were used to measure the image perception among Danish and Swedish consumers of Ilva and Ikea. Each attribute was compound of three statements where each statement was rated using a five-point Likert scale, from 1 - strongly disagree to 5 - strongly agree. Respondents for each country are represented in the figures below. In Sweden, from a total of 773 individuals, 367 claimed that they had never heard of or visited Ilva. One group of 178 individuals e.g. said they had no time to answer, spoke another language or simply were not willing to answer the questionnaire. A small group of 11 respondents were not able to finish the survey due to e.g. the train was leaving. Since another criterion for participating in the study was to live in the region, 67 individuals where not qualified as respondents. The valid respondent group for Sweden was 150 individuals.
Sweden
48%
19%
23%
9% 1%Did not know Ilva
Qualified respondents
Did not want to fill questionnaire
Did not live in the region
Did not complete the questionarie
Denmark
18%
23%
45%
13%1%
Figure 9. Total Respondents in Sweden and Denmark In Denmark from a total of 655 individuals, 117 respondents claimed that they had never visited or heard of Ilva. A group of 292 individuals did not want to fill the questionnaire; a reduced group of 9 individuals could not finish the survey and 87 individuals did not qualified as valid respondents. The total of valid respondents was 150. The total number of approached individuals in both countries was 1428.
6.1.1 Gender Differences in Sweden Sweden Female Male Total
Frequency 89 61 150Percent 59,3 40,7 100,0
Among the Swedish respondents 89 of the 150 individuals were female, which corresponds to 59.3 %. The male respondents were 61, which corresponds 40.7 % of the total population.
38
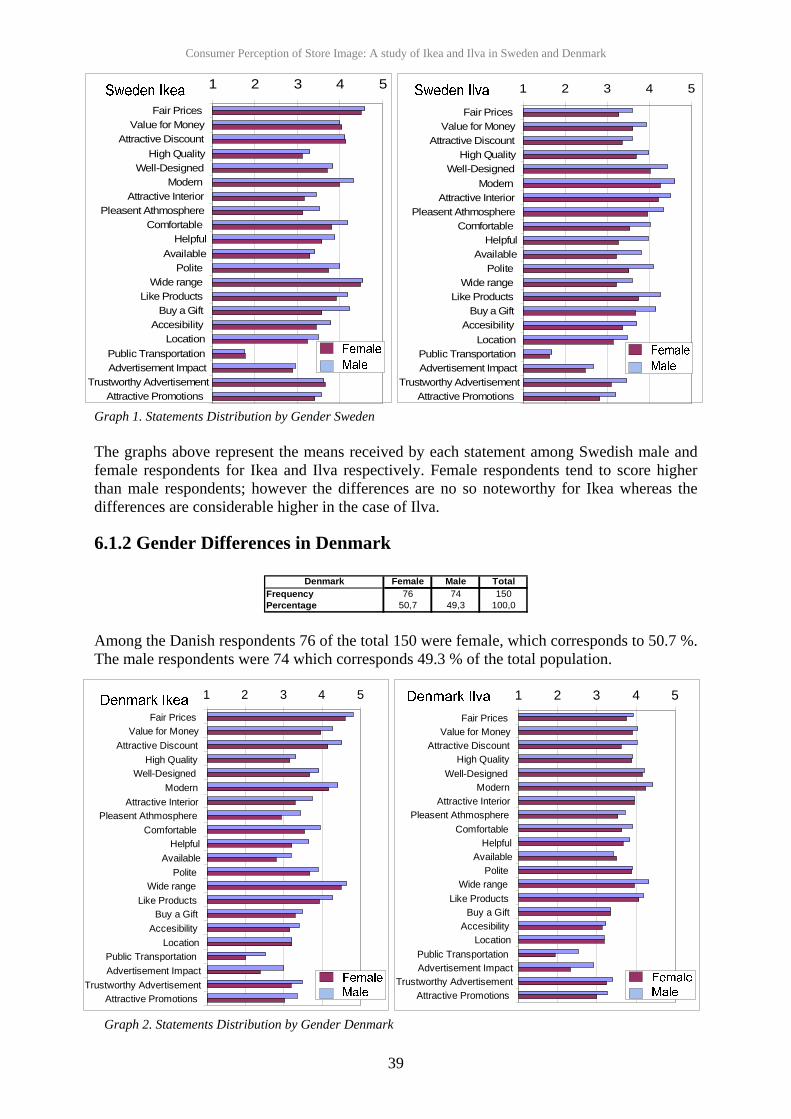
Consumer Perception of Store Image: A study of Ikea and Ilva in Sweden and Denmark
Graph 1. Statements Distribution by Gender Sweden The graphs above represent the means received by each statement among Swedish male and female respondents for Ikea and Ilva respectively. Female respondents tend to score higher than male respondents; however the differences are no so noteworthy for Ikea whereas the differences are considerable higher in the case of Ilva.
6.1.2 Gender Differences in Denmark
Denmark Female Male TotalFrequency 76 74 150Percentage 50,7 49,3 100,0
Among the Danish respondents 76 of the total 150 were female, which corresponds to 50.7 %. The male respondents were 74 which corresponds 49.3 % of the total population. Graph 2. Statements Distribution by Gender Denmark
1 2 3 4 5
Fair Prices Value for Money
Attractive Discount High Quality
Well-Designed Modern
Attractive Interior Pleasent Athmosphere
Comfortable Helpful
AvailablePolite
Wide range Like Products
Buy a Gift Accesibility
LocationPublic Transportation Advertisement Impact
Trustworthy AdvertisementAttractive Promotions
1 2 3 4 5Fair Prices
Value for Money Attractive Discount
High Quality Well-Designed
Modern Attractive Interior
Pleasent Athmosphere Comfortable
HelpfulAvailable
Polite Wide range
Like Products Buy a Gift
Accesibility Location
Public Transportation Advertisement Impact
Trustworthy AdvertisementAttractive Promotions
1 2 3 4 5
Fair Prices Value for Money
Attractive Discount High Quality
Well-Designed Modern
Attractive Interior Pleasent Athmosphere
Comfortable Helpful
AvailablePolite
Wide range Like Products
Buy a Gift Accesibility
LocationPublic Transportation Advertisement Impact
Trustworthy AdvertisementAttractive Promotions
39

Consumer Perception of Store Image: A study of Ikea and Ilva in Sweden and Denmark
The graphs above visualize the means by statements received by Ikea and Ilva in Denmark. Even though females scored higher in both companies, the tendencies show a similar perception for each company among genders, no considerable differences can be noticed.
6.1.3 Age Distribution of Respondents
The figures below display age distribution founded among Swedes and Danes who had visited Ilva and Ikea and applied as valid respondents for the survey.
Graph 3. Histogram Age by Country The average age of the Swedish respondents was 36 years old and the largest group of respondents was situated between 23 and 49 years old.
20 25 30 35 40 45 50 55 60 65 70 75 80Age
0
5
10
15
20
25
30
Fre
qu
ency
Mean = 32,84Std. Dev. = 10,985N = 150
Age Distribution of Danish Respondents
20 25 30 35 40 45 50 55 60 65 70 75 80Age
0
5
10
15
20
25
30
Fre
qu
ency
Mean = 36,33Std. Dev. = 12,87N = 150
Age Distribution of Swedish Respondents
In Denmark, the age factor reflects that the average age of the respondents was 33 years old. The respondent group was between 21 and 43 years old was mainly characterized by their accessibility to be asked and answered the questionnaire. The age factor appears in the questionnaire as a numeric variable but to visualize this in a better way were the results transformed to an ordinal variable by establishing four main groups’ variables.
Age Sweden 16-24 25-44 45-64 65-84 Total
Age Denmark 16-24 25-44 45-64 65-84 Total
Frequency 37 90 21 2 150 Frequency 27 86 34 3 150Percent 24,7 60,0 14,0 1,3 100,0 Percent 18,0 57,3 22,7 2,0 100,0
In both, Sweden and Denmark the age distribution is more concentrated between the 25-44 years corresponding to 60 % for Swedes and 57.3% for the Danes.
40

Consumer Perception of Store Image: A study of Ikea and Ilva in Sweden and Denmark
The amount of data per age segment is not uniformly distributed; therefore, the analysis will be based on the total amount of respondents regardless the age segment, this in order to avoid statistical error when doing a statistic analysis for each age segment (due to insufficient number of samples in some age segments).
6.1.4 Highlights Sweden
From the total of 150 Swedish respondents 75.3% claimed having higher educational studies, 24 % high school and 0.7% elementary school. As much as 91.3 % of Swedes had never visited an Ikea store in Denmark while 72 % had never visited an Ilva store in Denmark. 86 % of the respondents claimed to have access to a car. Swedes answer to the question which company they would recommend to a friend was slightly exclusive to Ikea, 16%, and 76% recommending both companies. Only a 8 % would recommend just Ilva. The Swedish respondents (60 % ) ‘strongly agreed’ in the statement that Ikea has fair prices, and 54.7 % ‘strongly agreed’ a wide range of products. Further did 52 % of the Swedes ‘agreed’ on the statement value for money and 52.7 % that the personnel is polite. On the other hand, the Swedish respondent (55.3 %) did ‘strongly agree’ to the statement ‘the company offers modern products’ and ‘the store has an attractive interior’. Half of the Swedes ‘agreed’ with the statement that Ilva gives value for money and 54.7 % ‘agreed’ also to that Ilva offers products of high quality. The statement I like the products of Ilva did 53.3 % of the Swedish respondents ‘agree’ on.
6.1.5 Highlights Denmark
From the total of Danish respondents a 75.3% claimed they had higher educational studies, 20 % high school and 4.7% elementary school. In relation to Ikea, 77.3 % of the respondents scored ‘strongly agree’ to fair price, 54% scored ‘strongly agree’ to attractive discount and 66 % scored ‘strongly agree’ to the wide range statement. In the case of Ilva, only one statement concerning to offering modern products was perceived among 52.7 % as ‘strongly agree’. Further, did 50.7 % of the Danes ‘neither agree or disagree’ to Ilva having trustworthy advertisement. Among the Danish respondents had 8 % visited Ilva and 14 % Ikea in Sweden. Despite the fact that Ilva has operated less than one year in the south of Sweden can 8% be considered as a good indication of future Danish consumers. A majority of 62.7% of the Danes claimed they would recommend both Ikea and Ilva to a friend, while 27.3 % would recommend only Ikea and 10 % would only recommend Ilva. Among the Danish respondents 77.3 % claimed having availability to a car.
41

Consumer Perception of Store Image: A study of Ikea and Ilva in Sweden and Denmark
6.2 Compare Means Analysis Ikea - Ilva in Sweden Figure 10 below represents the seven retail store attributes and their three variables scored by Swedes to get their perceptions of both companies. The statements where Ilva is perceived as superior by Swedish customers are several. Many of these attributes can be considered crucial to the success of any furniture retail company. High quality, well designed, modern, attractive interior and pleasant atmosphere were greatly appreciated by the Swedish respondents. For Ilva, the lower scores were found concerning fair prices, attractive discounts and wide range. 1 2 3 4 5
Fair Prices
Value for Money
Attractive Discount
High Quality
Well-Designed
Modern
Attractive Interior
Pleasent Athmosphere
Comfortable
Helpful
Available
Polite
Wide range
Like Products
Buy a Gift
Accesibility
Location
Public Transportation
Advertisement Impact
Trustworthy Advertisement
Attractive Promotions
Fig
ure10. Perceptions of Ikea and Ilva store image among Swedes
ea on the other hand, is mostly recognized as having fair prices, wide range, trustworthy Ikadvertisement, attractive discounts and promotions. Lower outcomes for Ikea were related to a perception of lower high quality, less attractive interior and less pleasant atmosphere compared to Ilva.
42
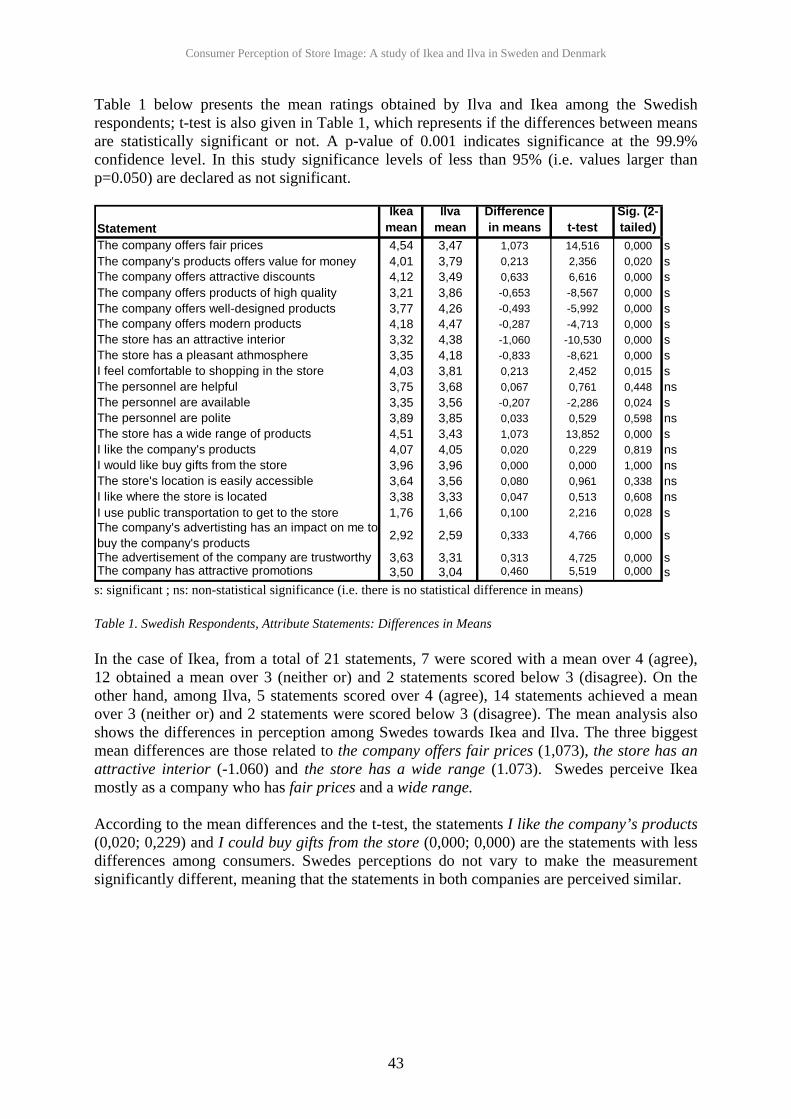
Consumer Perception of Store Image: A study of Ikea and Ilva in Sweden and Denmark
Table 1 below presents the mean ratings obtained by Ilva and Ikea among the Swedish respondents; t-test is also given in Table 1, which represents if the differences between means are statistically significant or not. A p-value of 0.001 indicates significance at the 99.9% confidence level. In this study significance levels of less than 95% (i.e. values larger than p=0.050) are declared as not significant.
StatementIkea
meanIlva
meanDifference in means t-test
Sig. (2-tailed)
The company offers fair prices 4,54 3,47 1,073 14,516 0,000 sThe company's products offers value for money 4,01 3,79 0,213 2,356 0,020 sThe company offers attractive discounts 4,12 3,49 0,633 6,616 0,000 sThe company offers products of high quality 3,21 3,86 -0,653 -8,567 0,000 sThe company offers well-designed products 3,77 4,26 -0,493 -5,992 0,000 sThe company offers modern products 4,18 4,47 -0,287 -4,713 0,000 sThe store has an attractive interior 3,32 4,38 -1,060 -10,530 0,000 sThe store has a pleasant athmosphere 3,35 4,18 -0,833 -8,621 0,000 sI feel comfortable to shopping in the store 4,03 3,81 0,213 2,452 0,015 sThe personnel are helpful 3,75 3,68 0,067 0,761 0,448 nsThe personnel are available 3,35 3,56 -0,207 -2,286 0,024 sThe personnel are polite 3,89 3,85 0,033 0,529 0,598 nsThe store has a wide range of products 4,51 3,43 1,073 13,852 0,000 sI like the company's products 4,07 4,05 0,020 0,229 0,819 nsI would like buy gifts from the store 3,96 3,96 0,000 0,000 1,000 nsThe store's location is easily accessible 3,64 3,56 0,080 0,961 0,338 nsI like where the store is located 3,38 3,33 0,047 0,513 0,608 nsI use public transportation to get to the store 1,76 1,66 0,100 2,216 0,028 sThe company's advertisting has an impact on me to buy the company's products 2,92 2,59 0,333 4,766 0,000 s
The advertisement of the company are trustworthy 3,63 3,31 0,313 4,725 0,000 sThe company has attractive promotions 3,50 3,04 0,460 5,519 0,000 s s: significant ; ns: non-statistical significance (i.e. there is no statistical difference in means)
able 1. Swedish Respondents, Attribute Statements: Differences in Means
the case of Ikea, from a total of 21 statements, 7 were scored with a mean over 4 (agree),
ccording to the mean differences and the t-test, the statements I like the company’s products
T In12 obtained a mean over 3 (neither or) and 2 statements scored below 3 (disagree). On the other hand, among Ilva, 5 statements scored over 4 (agree), 14 statements achieved a mean over 3 (neither or) and 2 statements were scored below 3 (disagree). The mean analysis also shows the differences in perception among Swedes towards Ikea and Ilva. The three biggest mean differences are those related to the company offers fair prices (1,073), the store has an attractive interior (-1.060) and the store has a wide range (1.073). Swedes perceive Ikea mostly as a company who has fair prices and a wide range. A(0,020; 0,229) and I could buy gifts from the store (0,000; 0,000) are the statements with less differences among consumers. Swedes perceptions do not vary to make the measurement significantly different, meaning that the statements in both companies are perceived similar.
43

Consumer Perception of Store Image: A study of Ikea and Ilva in Sweden and Denmark
6.3 Compare Means Analysis Ikea - Ilva in Denmark The Figure 11 below represents the scores given by Danes in their perceptions of Ikea and Ilva. Some statements where Ilva is perceived as superior are those related to high quality, well designed, attractive interior and pleasant atmosphere which are similar to what the Swedes answered. However, Ikea is recognized by fair prices, attractive discounts and wide range. A perception of a lower quality is scored by Ikea and less availability of sales personnel compared with Ilva. Moreover, Ilva is not considered to have fair prices or attractive discounts. 1 2 3 4 5
Fair Prices
Value for Money
Attractive Discount
High Quality
Well-Designed
Modern
Attractive Interior
Pleasent Athmosphere
Comfortable
Helpful
Available
Polite
Wide range
Like Products
Buy a Gift
Accesibility
Location
Public Transportation
Advertisement Impact
Trustworthy Advertisement
Attractive Promotions
Figure 11. Perceptions of Ikea and Ilva store image among Danes
44

Consumer Perception of Store Image: A study of Ikea and Ilva in Sweden and Denmark
Table 2 below presents the mean ratings obtained by the two companies among the Danish respondents. T-test is also given in table 1, which represents if the differences between means are statistically significant, a p-value of 0.001 indicates significance at the 99.9% confidence level. In this study significance levels of less than 95% (i.e. values larger than p=0.050) are declared not significant.
StatementIkea
meanIlva
meanDifference in means t-test
Sig. (2-tailed)
The company offers fair prices 4,69 3,83 0,860 10,566 0,000 sThe company's products offers value for money 4,11 3,97 0,140 1,808 0,073 nsThe company offers attractive discounts 4,33 3,81 0,513 6,593 0,000 sThe company offers products of high quality 3,23 3,89 -0,660 -8,665 0,000 sThe company offers well-designed products 3,79 4,19 -0,400 -5,205 0,000 sThe company offers modern products 4,29 4,34 -0,053 -0,930 0,354 nsThe store has an attractive interior 3,51 3,95 -0,433 -5,046 0,000 sThe store has a pleasant athmosphere 3,19 3,62 -0,433 -5,173 0,000 sI feel comfortable to shopping in the store 3,73 3,77 -0,033 -0,450 0,654 nsThe personnel are helpful 3,43 3,75 -0,320 -4,468 0,000 sThe personnel are available 2,99 3,45 -0,460 -5,349 0,000 sThe personnel are polite 3,77 3,89 -0,120 -2,211 0,029 sThe store has a wide range of products 4,56 4,15 0,413 5,936 0,000 sI like the company's products 4,09 4,13 -0,040 -0,533 0,595 nsI would like buy gifts from the store 3,39 3,34 0,047 0,615 0,539 nsThe store's location is easily accessible 3,27 3,17 0,100 1,563 0,120 nsI like where the store is located 3,20 3,18 0,020 0,295 0,769 nsI use public transportation to get to the store 2,27 2,23 0,033 0,897 0,371 nsThe company's advertisting has an impact on me to buy the company's products 2,70 2,61 0,087 1,204 0,231 ns
The advertisement of the company are trustworthy 3,33 3,32 0,013 0,253 0,800 nsThe company has attractive promotions 3,13 3,13 0,047 0,944 0,347 ns s: significant ; ns: non-statistical significance (i.e. there is no statistical difference in means) Table 2. Danish Respondents. Attribute Statements: Differences in Means The mean analysis for Danish customers showed that 6 of the Ikea statements scored over 4 (agree), 12 statement had a mean of 3 or over (neither or) while 3 statements scored lower 3 (disagree). In the case of Ilva 4 statements scored a mean of 4 or over (agree), 15 scored 3 or over (agree) and 2 statements got a mean of less than 3 (disagree). Among Danes, the biggest mean differences are presented in the company offers fair prices (0,860) for Ikea and the company offers products with high quality (-0,660) in favour of Ilva. In general Danes, as well as the Swedes, perceived Ikea as a fair prices company with a wide range. Ilva is considered among Danes as mostly modern and with well designed products. For both companies, the advertisement trustworthiness was considered not statistically different as well as the other two statements measuring advertisement and promotions.
45

Consumer Perception of Store Image: A study of Ikea and Ilva in Sweden and Denmark
6.4 Ikea Attribute Statements: Differences in Means for Swedish and Danish Respondents
The Figure 12 below represents the 21 statements related to retail store attributes and the scores given by Swedes and Danes about their perceptions about Ikea. Ikea is perceived as superior mostly by the Swedes, scoring highest in the statements related to comfortable, helpful, available, like products, buy a gift, accessibility, trustworthy advertisement and attractive promotions. The statements were Ikea is perceived in the same way among both Swedes and Danes are value for money, high quality, well-designed, modern, like products and wide range.
1 2 3 4 5
Fair Prices Value for Money
Attractive Discount High Quality
Well-Designed Modern
Attractive Interior Pleasent Athmosphere
Comfortable Helpful
AvailablePolite
Wide range Like Products
Buy a Gift Accesibility
LocationPublic Transportation Advertisement Impact
Trustworthy AdvertisementAttractive Promotions
Figure 12. Perceptions of Ikea among Swedes and Danes
46
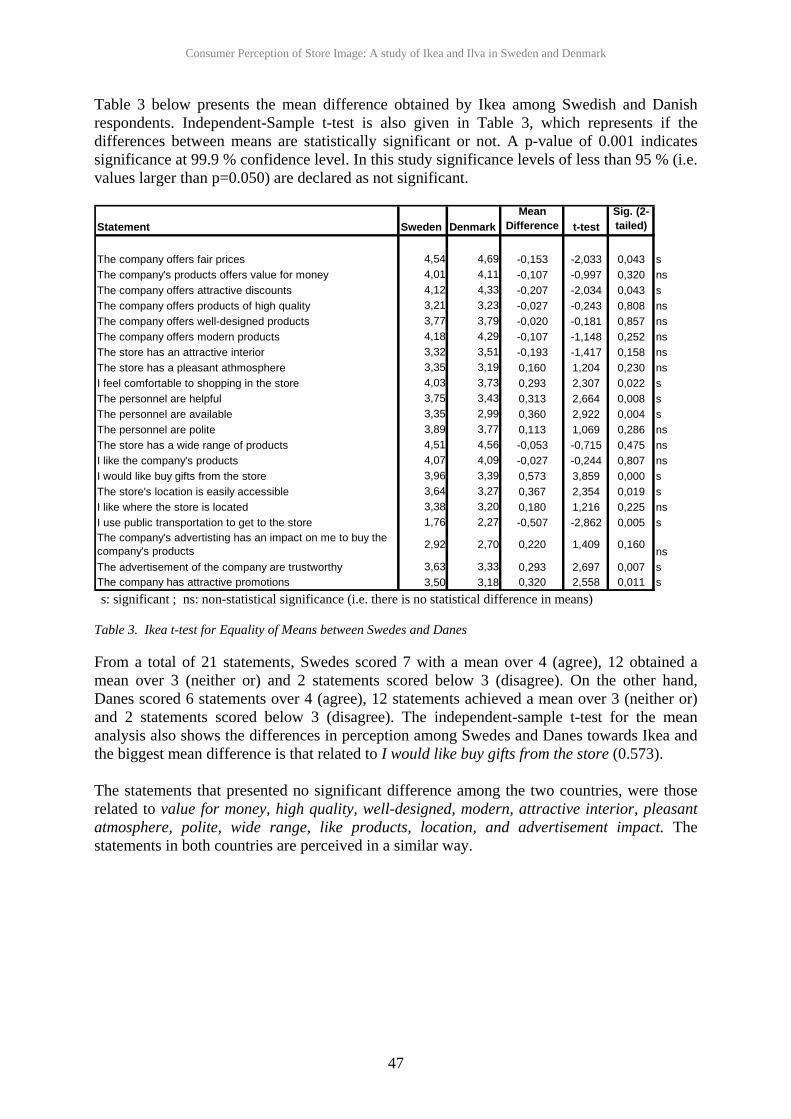
Consumer Perception of Store Image: A study of Ikea and Ilva in Sweden and Denmark
Table 3 below presents the mean difference obtained by Ikea among Swedish and Danish respondents. Independent-Sample t-test is also given in Table 3, which represents if the differences between means are statistically significant or not. A p-value of 0.001 indicates significance at 99.9 % confidence level. In this study significance levels of less than 95 % (i.e. values larger than p=0.050) are declared as not significant.
Statement Sweden DenmarkMean
Difference t-testSig. (2-tailed)
The company offers fair prices 4,54 4,69 -0,153 -2,033 0,043 sThe company's products offers value for money 4,01 4,11 -0,107 -0,997 0,320 nsThe company offers attractive discounts 4,12 4,33 -0,207 -2,034 0,043 sThe company offers products of high quality 3,21 3,23 -0,027 -0,243 0,808 nsThe company offers well-designed products 3,77 3,79 -0,020 -0,181 0,857 nsThe company offers modern products 4,18 4,29 -0,107 -1,148 0,252 nsThe store has an attractive interior 3,32 3,51 -0,193 -1,417 0,158 nsThe store has a pleasant athmosphere 3,35 3,19 0,160 1,204 0,230 nsI feel comfortable to shopping in the store 4,03 3,73 0,293 2,307 0,022 sThe personnel are helpful 3,75 3,43 0,313 2,664 0,008 sThe personnel are available 3,35 2,99 0,360 2,922 0,004 sThe personnel are polite 3,89 3,77 0,113 1,069 0,286 nsThe store has a wide range of products 4,51 4,56 -0,053 -0,715 0,475 nsI like the company's products 4,07 4,09 -0,027 -0,244 0,807 nsI would like buy gifts from the store 3,96 3,39 0,573 3,859 0,000 sThe store's location is easily accessible 3,64 3,27 0,367 2,354 0,019 sI like where the store is located 3,38 3,20 0,180 1,216 0,225 nsI use public transportation to get to the store 1,76 2,27 -0,507 -2,862 0,005 sThe company's advertisting has an impact on me to buy the company's products 2,92 2,70 0,220 1,409 0,160
nsThe advertisement of the company are trustworthy 3,63 3,33 0,293 2,697 0,007 sThe company has attractive promotions 3,50 3,18 0,320 2,558 0,011 s s: significant ; ns: non-statistical significance (i.e. there is no statistical difference in means) Table 3. Ikea t-test for Equality of Means between Swedes and Danes From a total of 21 statements, Swedes scored 7 with a mean over 4 (agree), 12 obtained a mean over 3 (neither or) and 2 statements scored below 3 (disagree). On the other hand, Danes scored 6 statements over 4 (agree), 12 statements achieved a mean over 3 (neither or) and 2 statements scored below 3 (disagree). The independent-sample t-test for the mean analysis also shows the differences in perception among Swedes and Danes towards Ikea and the biggest mean difference is that related to I would like buy gifts from the store (0.573). The statements that presented no significant difference among the two countries, were those related to value for money, high quality, well-designed, modern, attractive interior, pleasant atmosphere, polite, wide range, like products, location, and advertisement impact. The statements in both countries are perceived in a similar way.
47

Consumer Perception of Store Image: A study of Ikea and Ilva in Sweden and Denmark
6.5 Ilva Attribute Statements: Differences in Means for Swedish and Danish Respondents Figure 13 below represents the 21 statements related to store attributes and the scores given by Swedes and Danes about their perceptions about Ilva. Ilva is perceived as superior mostly by the Swedes, scoring highest in the statements related to modern, attractive interior, pleasant atmosphere, buy a gift and accessibility. On the other hand, Ilva is perceived by Danes mostly by fair prices, value for money, attractive discount and wide range. The statements were Ilva is perceived in the same way among both Swedes and Danes are high quality, comfortable, helpful, polite, like products, advertisement impact, trustworthy advertisement and attractive promotion.
1 2 3 4
Fair Prices Value for Money
Attractive Discount High Quality
Well-Designed Modern
Attractive Interior Pleasent Athmosphere
Comfortable Helpful
AvailablePolite
Wide range Like Products
Buy a Gift Accesibility
LocationPublic Transportation Advertisement Impact
Trustworthy AdvertisementAttractive Promotions
5 Figure 13. Perceptions of Ilva among Swedes and Danes Table 4 below presents the mean difference obtained by Ilva among Swedish and Danish respondents. Independent-Sample t-test is also given in Table 4, which represents if the differences between means are statistically significant or not. A p-value of 0.001 indicates significance at 99.9 % confidence level. In this study significance levels of less than 95 % (i.e. values larger than p=0.050) are declared as not significant.
48

Consumer Perception of Store Image: A study of Ikea and Ilva in Sweden and Denmark
Statement Swedes DanesMean
Difference t-testSig. (2-tailed)
The company offers fair prices 3,47 3,83 -0,367 -3,175 0,002 sThe company's products offers value for money 3,79 3,97 -0,180 -1,796 0,074 nsThe company offers attractive discounts 3,49 3,81 -0,327 -2,938 0,004 sThe company offers products of high quality 3,86 3,89 -0,033 -0,323 0,747 nsThe company offers well-designed products 4,26 4,19 0,073 0,800 0,424 nsThe company offers modern products 4,47 4,34 0,127 1,431 0,153 nsThe store has an attractive interior 4,38 3,95 0,433 3,865 0,000 sThe store has a pleasant athmosphere 4,18 3,62 0,560 4,870 0,000 sI feel comfortable to shopping in the store 3,81 3,77 0,047 0,398 0,691 nsThe personnel are helpful 3,68 3,75 -0,073 -0,657 0,512 nsThe personnel are available 3,56 3,45 0,107 1,038 0,300 nsThe personnel are polite 3,85 3,89 -0,040 -0,395 0,693 nsThe store has a wide range of products 3,43 4,15 -0,713 -7,100 0,000 sI like the company's products 4,05 4,13 -0,087 -0,826 0,409 nsI would like buy gifts from the store 3,96 3,34 0,620 4,287 0,000 sThe store's location is easily accessible 3,56 3,17 0,387 2,534 0,012 sI like where the store is located 3,33 3,18 0,153 1,049 0,295 nsI use public transportation to get to the store 1,66 2,23 -0,573 -3,366 0,001 sThe company's advertisting has an impact on me to buy the company's products 2,59 2,61 -0,027 -0,184 0,855
nsThe advertisement of the company are trustworthy 3,31 3,32 -0,007 -0,060 0,952 nsThe company has attractive promotions 3,04 3,13 -0,093 -0,767 0,444 ns Table 4. Perceptions of Ilva among Swedes and Danes From a total of 21 statements, Swedes scored 5 with a mean over 4 (agree), 14 obtained a mean over 3 (neither or) and 2 statements scored below 3 (disagree). On the other hand, Danes scored 4 statements over 4 (agree), 15 statements achieved a mean over 3 (neither or) and 2 statements scored below 3 (disagree). The mean analysis also shows the differences in perception among Swedes and Danes towards Ilva and the biggest mean difference is that related to the store has wide range of products (0.713). The statements that presented no statistical significant difference among the two countries, were those related to value for money, high quality, well-designed, modern, comfortable, helpful, availability, polite, like products, location, advertisement impact, trustworthy, attractive promotions. The statements in both countries are perceived in a similar way.
49
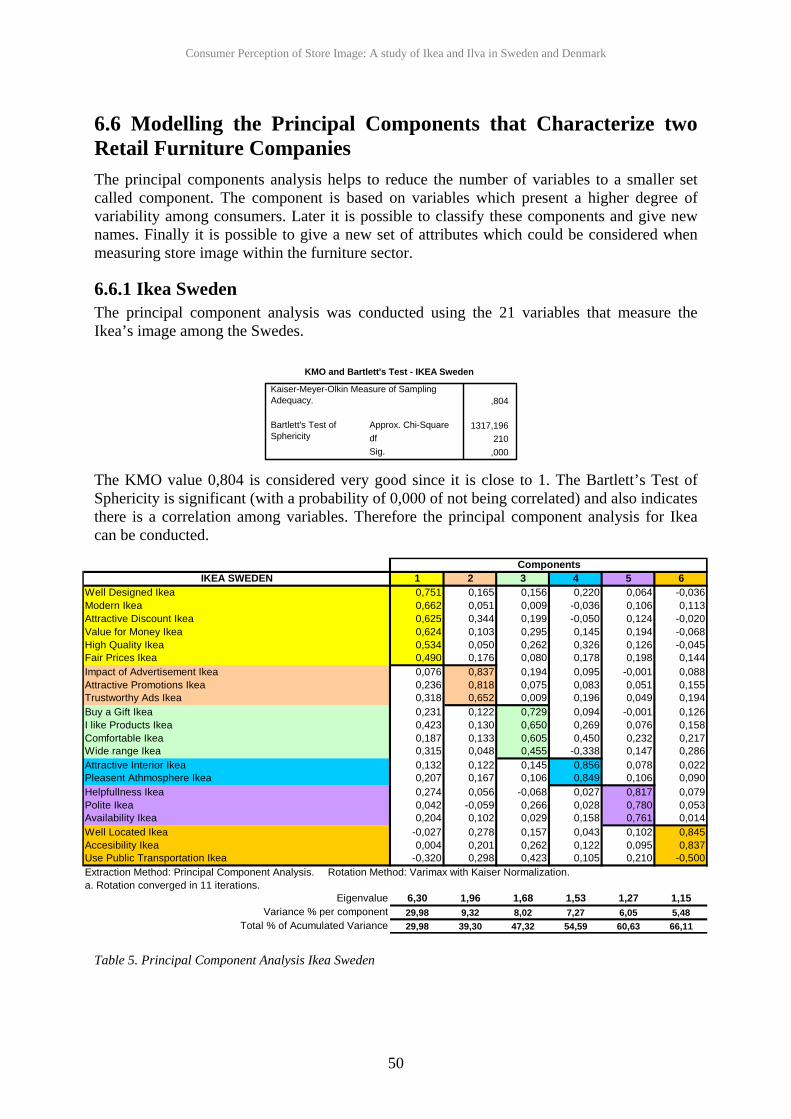
Consumer Perception of Store Image: A study of Ikea and Ilva in Sweden and Denmark
6.6 Modelling the Principal Components that Characterize two Retail Furniture Companies
The principal components analysis helps to reduce the number of variables to a smaller set called component. The component is based on variables which present a higher degree of variability among consumers. Later it is possible to classify these components and give new names. Finally it is possible to give a new set of attributes which could be considered when measuring store image within the furniture sector.
6.6.1 Ikea Sweden The principal component analysis was conducted using the 21 variables that measure the Ikea’s image among the Swedes.
KMO and Bartlett's Test - IKEA Sweden
,804
1317,196210
,000
Kaiser-Meyer-Olkin Measure of SamplingAdequacy.
Approx. Chi-SquaredfSig.
Bartlett's Test ofSphericity
The KMO value 0,804 is considered very good since it is close to 1. The Bartlett’s Test of Sphericity is significant (with a probability of 0,000 of not being correlated) and also indicates there is a correlation among variables. Therefore the principal component analysis for Ikea can be conducted.
IKEA SWEDEN 1 2 3 4 5 6
Well Designed Ikea 0,751 0,165 0,156 0,220 0,064 -0,036Modern Ikea 0,662 0,051 0,009 -0,036 0,106 0,113Attractive Discount Ikea 0,625 0,344 0,199 -0,050 0,124 -0,020Value for Money Ikea 0,624 0,103 0,295 0,145 0,194 -0,068High Quality Ikea 0,534 0,050 0,262 0,326 0,126 -0,045Fair Prices Ikea 0,490 0,176 0,080 0,178 0,198 0,144Impact of Advertisement Ikea 0,076 0,837 0,194 0,095 -0,001 0,088Attractive Promotions Ikea 0,236 0,818 0,075 0,083 0,051 0,155Trustworthy Ads Ikea 0,318 0,652 0,009 0,196 0,049 0,194Buy a Gift Ikea 0,231 0,122 0,729 0,094 -0,001 0,126I like Products Ikea 0,423 0,130 0,650 0,269 0,076 0,158Comfortable Ikea 0,187 0,133 0,605 0,450 0,232 0,217Wide range Ikea 0,315 0,048 0,455 -0,338 0,147 0,286Attractive Interior Ikea 0,132 0,122 0,145 0,856 0,078 0,022Pleasent Athmosphere Ikea 0,207 0,167 0,106 0,849 0,106 0,090Helpfullness Ikea 0,274 0,056 -0,068 0,027 0,817 0,079Polite Ikea 0,042 -0,059 0,266 0,028 0,780 0,053Availability Ikea 0,204 0,102 0,029 0,158 0,761 0,014Well Located Ikea -0,027 0,278 0,157 0,043 0,102 0,845Accesibility Ikea 0,004 0,201 0,262 0,122 0,095 0,837Use Public Transportation Ikea -0,320 0,298 0,423 0,105 0,210 -0,500
Extraction Method: Principal Component Analysis. Rotation Method: Varimax with Kaiser Normalization.a. Rotation converged in 11 iterations.
Eigenvalue 6,30 1,96 1,68 1,53 1,27 1,15Variance % per component 29,98 9,32 8,02 7,27 6,05 5,48
Total % of Acumulated Variance 29,98 39,30 47,32 54,59 60,63 66,11
Components
Table 5. Principal Component Analysis Ikea Sweden
50

Consumer Perception of Store Image: A study of Ikea and Ilva in Sweden and Denmark
Principal Components Interpretation This section will give an overview of the 6 components obtained by Ikea in Sweden. The rotated component matrixes are shown in Table 5. The rows of the matrix were sorted in groups of variables that have the highest value for each principal component. In the bottom of each table is the eigenvalues shown. The variance accounted for by each component to the total variance in all of the variables and the total accumulated variance accounted for by the first “n” components. Component 1: Price-quality factor This component gathers a great number of the variables that were represented in the survey, statements related to products and its characteristics such as design and quality and price of merchandise. Based on the components main elements it will be suitable to call it: Price-quality factor. The Price-quality factor is an important variable due to the fact that it represents 29.98 % of the total variance (see Figure 5). The eigenvalue is 6.30 and due to the fact that this value is greater than 1.0 it explains more variance than a single variable, i.e. 6.30 times as much. Component 2: Advertisement factor This component is built of three main variables, and these are related to advertisement and how consumers perceive Ikea’s efforts on attracting consumers and generate purchases. Due to its direct relationship with advertisement and promotions, this component will receive the name Advertisement factor. Advertisement factor is the second most important component according to the Swedish consumers and represents 9.32% of the total variance for all the variables. This component has an eigenvalue of 1.96 which is greater than 1.0 and hence explains more variance than a single variable. Component 3: Range factor Component three includes a mix of four characteristics. Three of the variables are related to feelings, and how consumers enjoy the idea of ‘buying gifts’, ‘like the products’ and feel comfortable buying in the store. The other variable is linked to the previous ones and expresses the wide range of products in Ikea. Component number 3 will be renamed to Range factor. Range factor is the third most important component for Swedes related to Ikea and represents 8.02 % of the total variance. Component 4: Store atmosphere factor Only two variables form the component number four. These variables are totally connected with each other and reflect the impact of the interior décor perceived by Swedes. How Swedes feel when buying and perceiving the stores is consider a key component. This component will be named Store atmosphere factor. Store atmosphere factor represents 7.27 % of the total variance.
51

Consumer Perception of Store Image: A study of Ikea and Ilva in Sweden and Denmark
Component 5: Sales personnel factor Three variables characterize this component and these are related to sales personnel. However the importance of the human factor in sales, it seems that for Swedes, is no the main priority. This component will receive the name: Sales personnel factor. Sales personnel factor represents 6.05 % of the total variance of all the variables. Component 6: Locational convenience The variables for this component are related to the store location. According to the principal components analysis, location plays a significant role in people’s perception of the store. This perception could be positive or negative depending on how well the store is located in general terms. This component will receive a name including two of its variables: Locational convenience factor. Locational convenience factor is the last of the 6 components and represents 5.48% of the total variance. The six components represent 66.11% of the total variance among the 21 variables i.e. 66.11 % of the common variance shared by the 21 variables can be accounted by the six factors.
6.6.2 Ilva Sweden The principal component analysis was conducted using the 21 variables that measure the Ilva image among the Swedes.
KMO and Bartlett's Test - ILVA Sweden
,805
1213,046210
,000
Kaiser-Meyer-Olkin Measure of SamplingAdequacy.
Approx. Chi-SquaredfSig.
Bartlett's Test ofSphericity
The KMO value 0,805 is considered very good since it is close to 1. The Bartlett’s Test of Sphericity is significant (with a probability of 0,000 of not being correlated) and also indicates there is a correlation among variables. Therefore the principal component analysis for Ilva can be conducted.
52

Consumer Perception of Store Image: A study of Ikea and Ilva in Sweden and Denmark
Table 6. Principal Component Analysis Ilva Sweden
ILVA SWEDEN 1 2 3 4 5 6
Well Designed Ilva 0,815 0,004 0,232 0,084 0,033 -0,067Modern Ilva 0,756 0,111 0,174 0,040 0,103 0,055I like Products Ilva 0,733 0,177 0,205 0,165 0,017 0,172Attractive Discount Ilva 0,578 0,161 0,104 0,118 -0,022 -0,023Value for Money Ilva 0,561 0,111 0,308 0,189 -0,102 0,420Wide range Ilva 0,482 0,474 -0,121 0,110 -0,056 0,208Helpfullness Ilva 0,205 0,849 0,118 0,026 0,066 0,054Polite Ilva 0,045 0,835 0,240 0,025 0,067 -0,012Availability Ilva 0,133 0,750 0,248 0,100 0,072 0,073Pleasent Athmosphere Ilva 0,191 0,267 0,743 -0,037 -0,042 -0,018Attractive Interior Ilva 0,197 0,194 0,741 0,018 -0,047 0,043High Quality Ilva 0,420 0,096 0,517 0,105 0,170 -0,125Comfortable Ilva 0,198 0,422 0,481 0,199 -0,165 0,339Buy a Gift Ilva 0,194 0,010 0,383 0,351 0,095 0,273Attractive Promotions Ilva 0,194 0,172 0,103 0,806 0,046 0,076Impact of Advertisement Ilva 0,038 0,031 -0,158 0,798 0,172 -0,050Trustworthy Ads Ilva 0,125 0,002 0,144 0,687 0,072 -0,001Accesibility Ilva 0,003 0,024 0,016 0,151 0,909 0,097Well Located Ilva 0,088 0,113 -0,041 0,155 0,893 0,080Use Public Transportation Ilva 0,249 0,029 -0,068 0,151 -0,323 -0,719Fair Prices Ilva 0,340 0,188 -0,065 0,112 0,007 0,699
Extraction Method: Principal Component Analysis. Rotation Method: Varimax with Kaiser Normalization.a. Rotation converged in 8 iterations.
Eigenvalue 5,92 2,23 1,81 1,38 1,20 1,10Variance % per component 28,20 10,60 8,62 6,57 5,73 5,24
Total % of Acumulated Variance 28,20 38,80 47,42 53,99 59,72 64,96
Components
Principal Components Interpretation
This section will give an overview of the 6 components obtained by Ilva in Sweden. The rotated component matrixes are shown in Table 6. Component 1: Price-product quality-range factor This component contains similar variables with those related to component number one in the case of Ikea. Variables related to products and characteristics such as design, modern and range are the main components here. The other group of variables makes reference to price and discounts. The price-quality product-range factor is the most important component and represents the 28.20 % of the total variance (see table above). The eigenvalue is 5.92 and due to the fact that this value is greater than 1.0 it explains more variance than a single variable, i.e. 5.92 times as much. Component 2: Sales personnel factor Three variables characterize this component yet again, sales personnel. This component was given the same name as in the principal component analysis for Ikea in Sweden. Sales personnel factor represents 10.60 % of the total variance of all the variables, being of great importance for Ilva. This component has an eigenvalue of 2.23 which is greater than 1.0 and hence explains more variance than a single variable. Component 3: Store- atmosphere- product quality factor Interior décor and high quality products are highly related in the case of Ilva in Sweden. In general, Swedes perceive Ilva as having an attractive interior and they feel comfortable in the store. How Swedes perceived the atmosphere showed to be a key component when measuring perceptions. Store- atmosphere- product quality factor represents 8.62 % of the total variance. Component 4: Advertisement factor The main variables here are related to advertisement and how consumers perceive Ilva’s efforts to generate products purchase e.g. gifts. Advertisement factor is an important
53
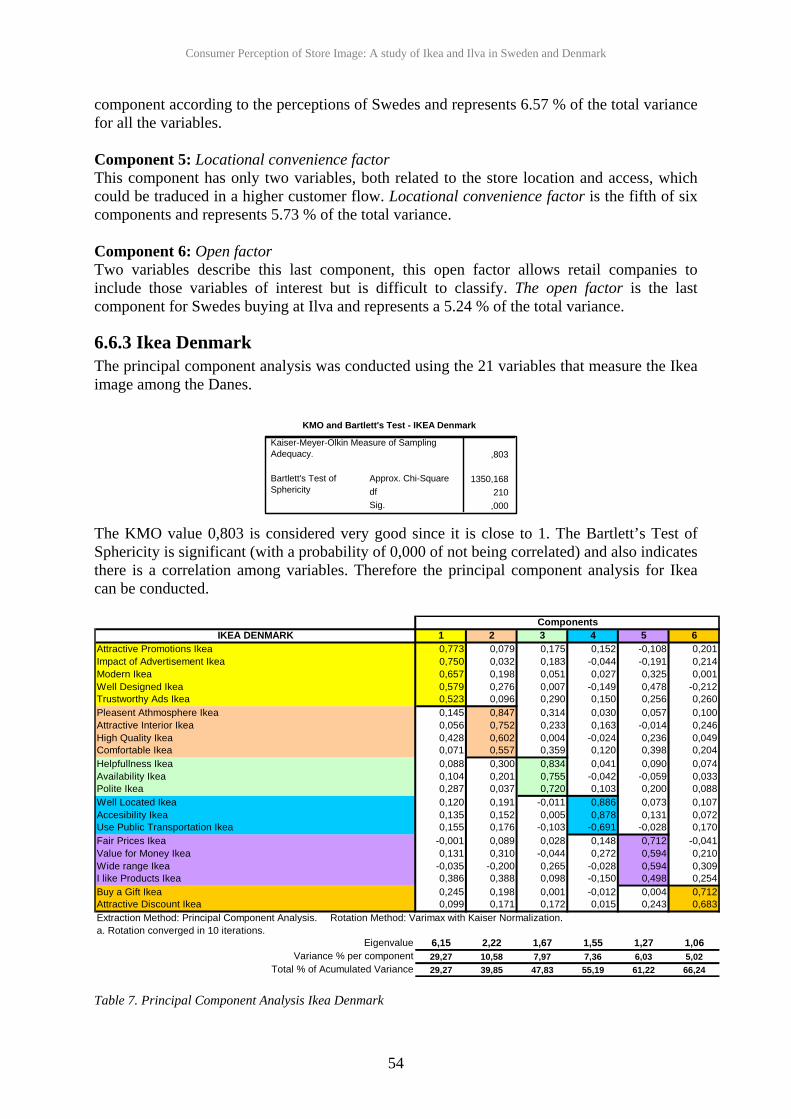
Consumer Perception of Store Image: A study of Ikea and Ilva in Sweden and Denmark
component according to the perceptions of Swedes and represents 6.57 % of the total variance for all the variables. Component 5: Locational convenience factor This component has only two variables, both related to the store location and access, which could be traduced in a higher customer flow. Locational convenience factor is the fifth of six components and represents 5.73 % of the total variance. Component 6: Open factor Two variables describe this last component, this open factor allows retail companies to include those variables of interest but is difficult to classify. The open factor is the last component for Swedes buying at Ilva and represents a 5.24 % of the total variance.
6.6.3 Ikea Denmark The principal component analysis was conducted using the 21 variables that measure the Ikea image among the Danes.
KMO and Bartlett's Test - IKEA Denmark
,803
1350,168210
,000
Kaiser-Meyer-Olkin Measure of SamplingAdequacy.
Approx. Chi-SquaredfSig.
Bartlett's Test ofSphericity
The KMO value 0,803 is considered very good since it is close to 1. The Bartlett’s Test of Sphericity is significant (with a probability of 0,000 of not being correlated) and also indicates there is a correlation among variables. Therefore the principal component analysis for Ikea can be conducted.
IKEA DENMARK 1 2 3 4 5 6Attractive Promotions Ikea 0,773 0,079 0,175 0,152 -0,108 0,201Impact of Advertisement Ikea 0,750 0,032 0,183 -0,044 -0,191 0,214Modern Ikea 0,657 0,198 0,051 0,027 0,325 0,001Well Designed Ikea 0,579 0,276 0,007 -0,149 0,478 -0,212Trustworthy Ads Ikea 0,523 0,096 0,290 0,150 0,256 0,260Pleasent Athmosphere Ikea 0,145 0,847 0,314 0,030 0,057 0,100Attractive Interior Ikea 0,056 0,752 0,233 0,163 -0,014 0,246High Quality Ikea 0,428 0,602 0,004 -0,024 0,236 0,049Comfortable Ikea 0,071 0,557 0,359 0,120 0,398 0,204Helpfullness Ikea 0,088 0,300 0,834 0,041 0,090 0,074Availability Ikea 0,104 0,201 0,755 -0,042 -0,059 0,033Polite Ikea 0,287 0,037 0,720 0,103 0,200 0,088Well Located Ikea 0,120 0,191 -0,011 0,886 0,073 0,107Accesibility Ikea 0,135 0,152 0,005 0,878 0,131 0,072Use Public Transportation Ikea 0,155 0,176 -0,103 -0,691 -0,028 0,170Fair Prices Ikea -0,001 0,089 0,028 0,148 0,712 -0,041Value for Money Ikea 0,131 0,310 -0,044 0,272 0,594 0,210Wide range Ikea -0,035 -0,200 0,265 -0,028 0,594 0,309I like Products Ikea 0,386 0,388 0,098 -0,150 0,498 0,254Buy a Gift Ikea 0,245 0,198 0,001 -0,012 0,004 0,712Attractive Discount Ikea 0,099 0,171 0,172 0,015 0,243 0,683
Extraction Method: Principal Component Analysis. Rotation Method: Varimax with Kaiser Normalization.a. Rotation converged in 10 iterations.
Eigenvalue 6,15 2,22 1,67 1,55 1,27 1,06Variance % per component 29,27 10,58 7,97 7,36 6,03 5,02
Total % of Acumulated Variance 29,27 39,85 47,83 55,19 61,22 66,24
Components
Table 7. Principal Component Analysis Ikea Denmark
54

Consumer Perception of Store Image: A study of Ikea and Ilva in Sweden and Denmark
Principal Components Interpretation
This section will give an overview of the 6 components obtained by Ikea in Denmark. The rotated component matrixes are shown in Table 7. Component 1: Advertisement-product quality factor This component contains all the three variables related to advertisement and two variables related to product design i.e. well designed and modern. In the case of Ikea-Denmark the first component will be labelled: Advertisement-product quality factor. Advertisement-product quality factor reflects 29.27 % of the total variance (see table X3). The eigenvalue is 6.15 and due to the fact that this value is greater than 1.0 it explains more variance than a single variable, i.e. 6.15 times as much. Component 2: Store Atmosphere and product quality factor This component is compound by variables linked to the perceptions about attractive interior, pleasant atmosphere and comfortable to shop in the store. However, a variable was found related to products (high quality) which can be associated to the in-store perception. Store Atmosphere and product quality factor represents 10.58 % of the total variance. This component has an eigenvalue of 2.22 which is greater than 1.0 and hence explains more variance than a single variable. Component 3: Sales personnel factor Once more the three variables are together to describe a component related to the attitudes of the Sales personnel. This factor represents 7.97 % of the total variance of all the variables. Component 4: Locational convenience factor The variables related to the store location and access and the use of public transportation are part of this component. Accessibility-location factor represents 7.36% of the total variance. Component 5: Price-range factor The two first variables in this component are related to price fair prices and value for money, while the other two represent characteristics linked to the products such as range and how much Danes like Ikea’s products. Price-product range factor represents 6.03 % of the total variance of all the variables. Component 6: Open factor Two variables describe this component; the fact of ‘buying gifts’ from the store and attractive discounts. Due to the unclearness of component six is this component left as an open factor. This open factor represents 5.02 % of the total variance.
55

Consumer Perception of Store Image: A study of Ikea and Ilva in Sweden and Denmark
6.6.4 Ilva Denmark The principal component analysis was conducted using the 21 variables that measure the Ilva image among the Danes.
KMO and Bartlett's Test - Ilva Denmark
,807
1399,616210
,000
Kaiser-Meyer-Olkin Measure of SamplingAdequacy.
Approx. Chi-SquaredfSig.
Bartlett's Test ofSphericity
The KMO value 0,807 is considered very good since it is close to 1. The Bartlett’s Test of Sphericity is significant (with a probability of 0,000 of not being correlated) and also indicates there is a correlation among variables. Therefore the principal component analysis for Ilva can be conducted.
ILVA DENMARK 1 2 3 4 5 6High Quality Ilva 0,759 -0,011 0,030 0,196 0,000 0,164Pleasent Athmosphere Ilva 0,757 0,389 0,219 0,026 0,091 -0,042Attractive Interior Ilva 0,694 0,243 0,269 -0,035 0,250 -0,019Well Designed Ilva 0,640 -0,003 -0,103 0,272 -0,046 0,321I like Products Ilva 0,623 -0,012 0,029 0,115 0,185 0,533Comfortable Ilva 0,611 0,355 0,121 0,083 0,267 0,260Modern Ilva 0,439 0,128 0,052 0,410 -0,053 0,319Helpfullness Ilva 0,237 0,822 0,116 0,047 0,045 0,117Polite Ilva 0,134 0,780 -0,024 0,117 0,068 0,221Availability Ilva -0,002 0,769 0,148 0,176 0,041 -0,015Well Located Ilva 0,250 0,048 0,872 0,145 -0,013 0,003Accesibility Ilva 0,258 0,136 0,849 0,130 0,094 0,062Use Public Transportation Ilva 0,303 -0,126 -0,607 0,103 -0,277 -0,114Attractive Promotions Ilva 0,122 0,069 0,154 0,825 0,101 0,114Impact of Advertisement Ilva 0,102 0,195 -0,020 0,811 0,109 -0,007Fair Prices Ilva -0,023 0,118 0,129 0,029 0,813 0,054Attractive Discount Ilva 0,113 0,048 -0,041 0,327 0,715 0,006Value for Money Ilva 0,388 -0,040 0,213 -0,083 0,602 0,220Wide range Ilva 0,128 0,215 -0,001 -0,030 0,116 0,793Trustworthy Ads Ilva 0,202 0,175 0,139 0,463 0,189 0,525Buy a Gift Ilva 0,338 0,017 0,200 0,274 -0,071 0,431
Extraction Method: Principal Component Analysis. Rotation Method: Varimax with Kaiser Normalization.a. Rotation converged in 8 iterations.
Eigenvalue 6,44 2,03 1,68 1,53 1,41 1,00Variance % per component 30,66 9,68 8,02 7,30 6,69 4,69
Total % of Acumulated Variance 30,66 40,34 48,37 55,67 62,36 67,05
Component
Table 8. Principal Component Analysis Ilva Denmark Principal Components Interpretation
This section will give an overview of the 6 components obtained by Ilva in Denmark. The rotated component matrixes are shown in Table 7. Component 1: Product quality- store atmosphere factor This component contains two main groups of variables. The first group is related to the attractive interior, pleasant atmosphere and comfortable feelings whereas the second group is related to the products. This component is labelled Product quality- store atmosphere factor and represents 30.66 % of the total variance. The eigenvalue is 6.44 and due to the fact that this value is greater than 1.0 it explains more variance than a single variable, i.e. 6.44 times as much.
56

Consumer Perception of Store Image: A study of Ikea and Ilva in Sweden and Denmark
Component 2: Sales personnel factor Helpfulness, politeness, and availability of the personnel characterize this component. Sales personnel factor is the name of this component and represents 9.68 % of the total variance of all the variables. This component has an eigenvalue of 2.03 which is greater than 1.0 and hence explains more variance than a single variable. Component 3: Locational convenience factor For the first time in this analysis the locational factors got a third place. Well located, accessibility and use of public transportation represent 8.02 % of the total variance. Component 4: Advertisement factor Only two variables form the component number 4. These variables are connected each other through the impact of marketing strategies in Danes. This component represents a 7.30 % of the total variance. Component 5: Price factor All the three variables related to the price characterize this component and it will receive the name: Price factor and represents 6.69 % of the total variance of all the variables. Component 6: Range-Advertisement factor Two of the variables of this component are related to product, while the third one represents perceptions about the trustworthiness of Ilva’s ads. Range-advertisement factor is the last of the 6 components and represents 4.69 % of the total variance. The six components represent 67.05 % of the total variance among the 21 variables.
57

Consumer Perception of Store Image: A study of Ikea and Ilva in Sweden and Denmark
7. Discussion
In this chapter, the results are discussed in relation to the theoretical framework structured and based on the aim of this thesis. Further, managerial implications and suggestions for future research are found at the end.
7.1 General Findings The aim of this study is to inquire into the congruency of store image perceptions, projected by Ikea and Ilva, and how Danish and Swedish consumers perceive the aforementioned stores’ images. Also, the aim sets out to evaluate the success of these stores’ images on consumers and on transference to host markets. Further, the aim is to discern specific store image attributes captivating Swedish and Danish consumers. The structure in this chapter is based on these sections within the aim. To start with, however, some general findings from results of this study are presented. Some of the first findings of this study was somewhat surprising, due to that almost half of the Swedes claimed that they had never visited either/or heard of the furniture retail Ilva. This could possibly be explained by the fact that Ilva has operated in the Swedish market for less than a year. As one could expect, a lower number of Danes, one fifth, claimed that they had never visited or heard of Ilva. Yet, this could be considered a high number since the company was founded in Denmark already in 1950. The Swedish Ikea, on the other hand, was well known among respondents from both countries.
7.1.1 Age, Gender and Education The Swedish respondents were roughly divided into males and females. Even so, the answers were very similar between the groups in the matter of Ikea. Regarding Ilva, in general the females tend to perceive Ilva in a more favourable way than the males. Thus, in some way, Ilva reflects the taste of the Swedish females. On the other hand the gender division amongst the Danish respondents was more or less equal, yet the females tend to perceive both Ikea and Ilva in more positive way than the males. For both Swedes and Danes, the largest group, somewhat more than half of the respondents, was within the ages of 25 to 44. One might think that people in this age group were approached more frequently but since the respondents were chosen at random the dominance of this age group might be due to the fact that they actually visit Ikea and Ilva more frequently than other group of respondents. As a part of the life stages (Joyce and Lambert, 2001) people in this age group, usually, starts a family and get children which often also include moving and purchasing new furniture. This is nearly congruent with Ikea’s largest target group which consists of families with children still living at home but only somewhat congruent with Ilva’s target group that is considered to be slightly older and already settled. Since a great majority of the Danish and Swedish respondents claimed to have a higher education, the finding could be an indicator of how Ilva’s consumers are in terms of high level of education. A criterion to participate in this study was that the respondents had previously visited both Ikea and Ilva. Since Ikea is a well known company in Sweden and abroad, the respondents were first asked if they had visited Ilva, thus, it is likely that the group of the respondents to a higher extent reflect the main costumer groups of Ilva than of Ikea.
58
Consumer Perception of Store Image: A study of Ikea and Ilva in Sweden and Denmark
When comparing the answers of Swedes and Danes, it was noticeable that the Swedes had a tendency to avoid the lowest level of agreement when answering the statements. Danes, on the other hand, answered with the lowest level of agreement to several statements. One possible explanation of this finding is that Swedes are known to strive for equality and consensus which might affect the answers being more neutral while Danes are less like this. This finding is supported by Hofstede (2005) in the explanation of the Power Distance Index. Further, Danes are considered to be more self-sufficient and not avoiding confrontations according to Hofstede (2005), who also argues that Danes are more individualistic than Swedes. Uncertainty Avoidance can also explain this difference between Swedes and Danes where Swedes are more controlled by fulfilling living up to social obligations and pressure than the Danes (Hofstede, 2005).
7.2 Consumer perception vs. Company’s Desired Store Image As the corporate image is communicated via the store it becomes pivotal to seek the image understood in the consumers minds in order to attain congruence between these two (Burt, 2000). In order to capture the differences and similarities of Swedish and Danish consumers’ perception of Ikea and Ilva, absolute and relative measurements have been carried out. This section will describe the absolute scores in the case of Swedes’ perception of Ikea and Danes’ perception of Ilva, i.e. store image in each company’s domestic market.
7.2.1 Swedes vs. Ikea According to the results from the data concerning the degree of agreement with the statements, it was assessed that somewhat more than half of the Swedes have a very positive impression of Ikea in terms of the company having fair prices and a wide range of products i.e. tangible attributes according to Stern et al., (2001) and Kupke (2002). These perceptions match very well with how Ikea wants to be perceived, i.e. as a company that offers ‘fantastically low prices’, much lower than the competitors. Other remarkable feature of Ikea that appear to be important for the consumers is that in addition to having a wide range of physical products, Ikea has a wide range of different styles that appeal to many different consumers. Hence, many different group segments can be reached. Among the different group of consumers, value for money and polite personnel are also strongly associated with Ikea (half of the Swedish respondents). The perceptions of the consumers and the way Ikea wants to be perceived match very well, for instance for Ikea value for money signifies that ‘the product you buy for that price is of a good quality’. When it comes to the intangible dimension service (Stern et al., 2001), even if the Swedes think that the personnel at Ikea are polite, one third are neutral or disagree about the statement that the personnel are helpful and nearly half of the respondents feel the same way about the personnel being available. Such findings are not totally unexpected since the concept of the Ikea stores is to see the consumer as a part-time-employee who for instance is self-taught when it comes to certain aspects of the purchasing process, i.e. transportation and assembling the products. As Martineu (1958) and McGoldrick (2002) claimed, sales personnel also contribute to a great extent to build consumers’ impressions and Ikea is somewhat using this as they are striving for their employees working in the store to be perceived as ‘young and modern’, thus Ikea is also perceived as highly modern by the Swedish consumers. Moreover, modern is one of the key words that Ikea wants their products to communicate and four out of five Swedes agree with this. On the other hand, three out of four Swedes do not consider Ikea to have products of high quality, this could be somehow explained by Ikea’s concept of ‘to not do what is unnecessary’
59
Consumer Perception of Store Image: A study of Ikea and Ilva in Sweden and Denmark
which according to the company means that everything that is not considered as necessary e.g. varnish underside of a table, is not done in order to avoid unnecessary costs for the consumers. Even though there is a perception among the Swede that Ikea does not have high quality products, Ikea has been able to success and establish several stores around the world. According to Gilmore et al., (2001), advertisement is one of the external dimension or retail stimuli where the retailers can influence consumers’ perception of a company. However, even though, the fact that more than one third of the Swedes do not consider that Ikea’s advertisement have an impact on them to buy, could be due to what Chowdhury et al., (1998) refers to as self-reported character, this means that it is not truly measurable if advertisement really have an impact but whether the individual thinks it has an impact. For instance, the catalogue is one important marketing tool for Ikea and it is known to have a great impact on consumers. At the same time, half of the Swedes consider Ikea to have attractive promotions and trustworthy advertisement, where the former might be explained by the fact that Ikea e.g. reproduce common family settings and the latter could be explained by Ikea offering fair prices and then actually fulfilling this promise.
7.2.2 Danes vs. Ilva The results from the Danes were more scattered than the results from the Swedes. This can be explained by Danes being more individualistic (Hofstede, 2005) than Swedes. For instance, only one statement was found to have a high level of agreement among somewhat more than half of the group and that was that Ilva offers modern products. However, Ilva is promoting itself as offering furniture that ‘look good’ or classic Ilva products that will last longer than modern products. Ilva wants to be perceived as a company that offers high quality with fair prices, this statement of Ilva is somewhat confirmed by this study since almost three out of four Danes agree or strongly agree on this. The store itself is also considered as very important for Ilva in terms of attracting consumers and communicating the company image and a lot of effort is put to the building and the interior. More than half of the Danish consumers agree or strongly agree with Ilva providing an attractive interior and pleasant atmosphere, as McGoldrick (2002) stated that when the products are considered to be attractive to the consumers the store will be considered attractive as well. Two out of five Danes do not consider that Ilva’s advertisement have an impact on them to buy. However this could be explain by the same phenomena as in the case of Swedes and Ikea, it is a self-report question, meaning that it measures the consumers’ opinion on the impact rather than the actual impact itself. Notable was that around half of the Danes where very neutral to the statement that Ilva has attractive promotions or trustworthy advertisement. The catalogues is the main marketing tool for Ilva, except from the store, yet advertisement in the newspaper and on the web page are also important marketing tools.
7.3 International Transfer of Store Image When going abroad, it is pivotal to identify how consumers perceive the store image in the domestic market in order to find out competitive or differential advantage that then can be transferred successfully to the host market (McGoldrick, 2002). Both Ikea and Ilva operate in countries other than the domestic country by implementing a standardized concept. In order to determine whether Ikea respectively Ilva has been able to successfully transfer the store image from the domestic market to the host markets, Sweden and Denmark in this case, the Danes’ perception of Ikea and the Swedes’ perception of Ilva are presented below.
60

Consumer Perception of Store Image: A study of Ikea and Ilva in Sweden and Denmark
7.3.1 Danes vs. Ikea In the host market, Ikea is very strongly associated with fair prices, this to an even higher extent than among the Swedes. Attractive discounts and a wide range of products are other characteristic that one out of two Danes associated with Ikea. That attractive discounts were strongly associated with Ikea was somewhat unexpected since Ikea has an every-day-low-pricing-strategy (McGoldrick, 2002) and even though they have discounts is the low price strategy pivotal in Ikea’s marketing communication. A small divergence of opinion between the Swedes and Danes was found in the attributes related to store personnel and advertisement where Danes tend to perceive the Ikea personnel and Ikea’s advertisement in a less favourable way than the Swedes do. This is probably due to cultural differences where, for instance, the Danes see the standardized concept of Ikea through what Overby et al. (2005) refers to as the cultural lens. The receiver (Danes) perceives the message from the sender (Ikea) different than from the intention based on different cultural values. Nevertheless, from the results it was possible to assess that the overall perception of Ikea in general is perceived as very similar in the minds of Swedes and Danes and this provides some evidence that Ikea has succeeded in transferring the store image from Sweden to Denmark.
7.3.2 Swedes vs. Ilva Approximately one third of the Swedish respondents have visited Ilva in Denmark and this has possibly facilitated the entrance for Ilva in Sweden since several respondents are already familiar with the company and its products. The Swedes strongly associate Ilva with modern products and an attractive interior but to a somewhat lower degree also associate Ilva with offering value for money and high quality in addition to the respondents liking the products. The Danes also associate Ilva with offering modern products. It is surprising that half of both the Swedish and the Danish respondents associate Ilva with offering modern products since, as mentioned before, Ilva focuses on products that might not be as modern but instead are more classic and long-lasting. In general, Swedes have a high level of agreement concerning Ilva and the variables related to quality of merchandise. Since the Swedes perceive the product of Ilva as attractive, it is also likely that the Swedes transfer this likings from the products to the store that is the company (Zimmer and Golden, 1988). Furthermore, the outcomes show a high degree of uniformity in how the Swedes and the Danes perceived the store personnel The divergences between the perception of Ilva among Swedes and Danes are firstly related to how Danes tend to perceive Ilva in a more favourable way when it comes to price of merchandise and secondly to how Swedes more strongly than de Danes, associate atmosphere with Ilva. Since Ilva has operated in Sweden for a short time of period, it is likely that a majority of the consumers have based their perceptions on first feelings and first impressions. As Kupke (2002) and Porter and Claycomb (1997) stress, first impressions are important and influence shopping behaviour which is good for Ilva since the Swedes’ impressions, described above, are positive in the areas of atmosphere, quality and merchandise. Image is built over time (Burt and Carralero-Encinas, 2000) and the intangible dimensions of the retail store image is also considered as more difficult to transfer since these are more experience-related according to McGoldrick (2002). It is therefore somewhat surprising to find out that Ilva has succeeded in the transfer of image related to store atmosphere among Swedes since they have not operated in Sweden very long.
61

Consumer Perception of Store Image: A study of Ikea and Ilva in Sweden and Denmark
7.4 Ikea vs. Ilva among Swedes and Danes The relative variables were attained by comparing the differences in means, which revealed Swedish and Danish respondents’ average perception of Ikea and Ilva.
7.4.1 Swedes Perception of Ikea vs. Ilva Swedes are expected to be more familiar with Ikea than Ilva due to the length of time that Ikea has operated in Sweden. As one could expect Swedes perceive Ikea in a more favourable way than Ilva when it comes to fair prices. This could be explained by Swedes having more experience about how Ikea’s ‘value for money’. All the variables related to price are interpreted as superior in favour of Ikea which also very well illustrates the congruency with how Ikea want to portray themselves. Wide range is another variable that shows differences in perception among the Swedes where Ikea clearly is seen as the conqueror. Swedes’ opinions on Ikea’s advertisement are slightly more attractive and trustworthy than Ilva could be explained by Ikea being more aggressive in their advertising also use many different channels simultaneously. There is however two areas where Ilva is perceived as greater than Ikea among the Swedes. The former area is related to quality of merchandise and the latter one concerns the store atmosphere being this the most important intangible attribute when it comes to control store image (Stern et al., 2001). These two areas are also the ones where Ilva makes the most effort and also succeed in the transfer. Swedes appreciate the store atmosphere at Ilva to a higher extent than the Danes and this could be related to different cultural values that are connected to how i.e. quality, comfort, warmth and appearance are interpreted in different ways (Overby, et al., 2005). This could explain that Swedes perceive the store atmosphere at Ilva different from the Danes. More or less, three out of four Swedes answered that they would recommend both Ikea and Ilva to a friend. When almost one fourth of the respondents chose to recommend only one of the companies, Ikea received double amount of votes compared to Ilva. Although Ilva is perceived more favourable in the sense of store atmosphere and quality of merchandise, Swedes appreciate range and price of merchandise in favour of Ikea.
7.4.2 Danes Perception of Ikea vs. Ilva In general, Danes perceive Ikea and Ilva in a more similar way than the Swedes do, that is, while Ikea is mostly associated with fair prices and a wide range of products, Ilva is mainly associated with offering modern and well design products. These differences are however less substantial among the Danes compared to the Swedes, except when it comes to wide range, were the Danes consider the difference between Ikea and Ilva smaller than the Swedes do. As in the case of the Swedes, somewhat more than half of the Danes would recommend both Ikea and Ilva to a friend. However, it was surprisingly some respondents only recommended one of the companies where about one third of the Danes would recommend exclusively Ikea compared to only one tenth exclusively recommending Ilva. That Ikea is using ‘Sweden’ and Ilva is using ‘Denmark’ as a key element in their market communication strategy, could increase the possibility for Swedes and Danes to have stronger preferences (Usunier, 2005) or feel more attached (Thorelli et al., 1988) to the company originating from respectively country. However, since several Danes are recommending Ikea exclusively, this might not be the general case.
62
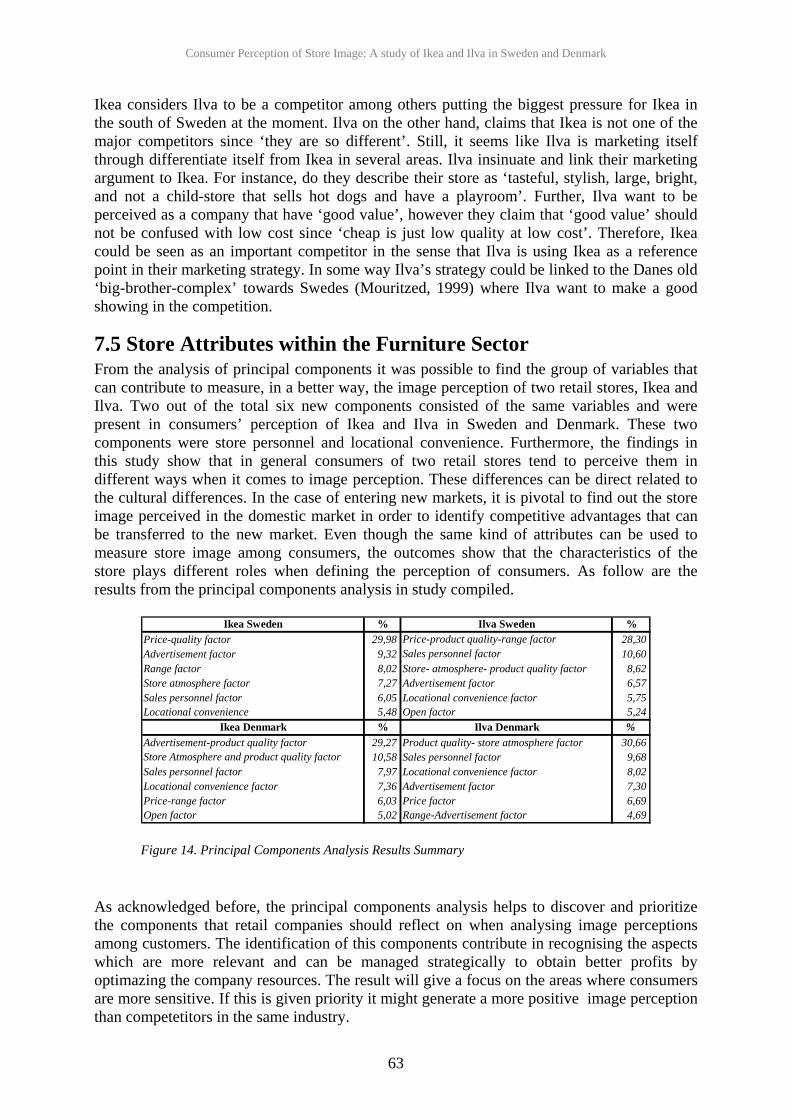
Consumer Perception of Store Image: A study of Ikea and Ilva in Sweden and Denmark
Ikea considers Ilva to be a competitor among others putting the biggest pressure for Ikea in the south of Sweden at the moment. Ilva on the other hand, claims that Ikea is not one of the major competitors since ‘they are so different’. Still, it seems like Ilva is marketing itself through differentiate itself from Ikea in several areas. Ilva insinuate and link their marketing argument to Ikea. For instance, do they describe their store as ‘tasteful, stylish, large, bright, and not a child-store that sells hot dogs and have a playroom’. Further, Ilva want to be perceived as a company that have ‘good value’, however they claim that ‘good value’ should not be confused with low cost since ‘cheap is just low quality at low cost’. Therefore, Ikea could be seen as an important competitor in the sense that Ilva is using Ikea as a reference point in their marketing strategy. In some way Ilva’s strategy could be linked to the Danes old ‘big-brother-complex’ towards Swedes (Mouritzed, 1999) where Ilva want to make a good showing in the competition.
7.5 Store Attributes within the Furniture Sector From the analysis of principal components it was possible to find the group of variables that can contribute to measure, in a better way, the image perception of two retail stores, Ikea and Ilva. Two out of the total six new components consisted of the same variables and were present in consumers’ perception of Ikea and Ilva in Sweden and Denmark. These two components were store personnel and locational convenience. Furthermore, the findings in this study show that in general consumers of two retail stores tend to perceive them in different ways when it comes to image perception. These differences can be direct related to the cultural differences. In the case of entering new markets, it is pivotal to find out the store image perceived in the domestic market in order to identify competitive advantages that can be transferred to the new market. Even though the same kind of attributes can be used to measure store image among consumers, the outcomes show that the characteristics of the store plays different roles when defining the perception of consumers. As follow are the results from the principal components analysis in study compiled.
Ikea Sweden % Ilva Sweden %Price-quality factor 29,98 Price-product quality-range factor 28,30Advertisement factor 9,32 Sales personnel factor 10,60Range factor 8,02 Store- atmosphere- product quality factor 8,62Store atmosphere factor 7,27 Advertisement factor 6,57Sales personnel factor 6,05 Locational convenience factor 5,75Locational convenience 5,48 Open factor 5,24
Ikea Denmark % Ilva Denmark %Advertisement-product quality factor 29,27 Product quality- store atmosphere factor 30,66Store Atmosphere and product quality factor 10,58 Sales personnel factor 9,68Sales personnel factor 7,97 Locational convenience factor 8,02Locational convenience factor 7,36 Advertisement factor 7,30Price-range factor 6,03 Price factor 6,69Open factor 5,02 Range-Advertisement factor 4,69
Figure 14. Principal Components Analysis Results Summary
As acknowledged before, the principal components analysis helps to discover and prioritize the components that retail companies should reflect on when analysing image perceptions among customers. The identification of this components contribute in recognising the aspects which are more relevant and can be managed strategically to obtain better profits by optimazing the company resources. The result will give a focus on the areas where consumers are more sensitive. If this is given priority it might generate a more positive image perception than competetitors in the same industry.
63
Consumer Perception of Store Image: A study of Ikea and Ilva in Sweden and Denmark
7.6 Future Research Since the ambition of this study was to investigate consumers perceptions of two companies in two countries, several ideas was identified that was not viable in this study due to cost- and time limitations. The methodology in this thesis along with the design of the questionnaire and the results from this can be used as frameworks for future researchers investigating other furniture retail stores and might also be used in settings other than the furniture sector. Additionally the groups of variables that were identified by the principal components analysis could be used as a basis for creating new attributes to measure image within one new setting. Further analysis concerning human factors such as gender, age, and educational level would be of great interest in order to further define and understand different consumers’ perceptions along with focusing on one of the companies only in order to deepen the analysis. The methodology and concepts in this study could also be used as a framework to analyse Ikea and Ilva in the UK market as Ilva is planning a very aggressive entrance in that market and Ikea wants to expand in the UK.
64

Consumer Perception of Store Image: A study of Ikea and Ilva in Sweden and Denmark
8. Concluding Remarks
This chapter provides a short summary of the findings in this study in relation to the aim of the thesis. Store image is the overall impression of a store as perceived by consumers, tangibly and intangibly, and becomes pivotal to ascertain as it may be used as a competitive advantage by retailers to evaluate the success of their marketing efforts and establish, through similar efforts, a competitive advantage in comparable host markets overseas. The aim of this study was to inquire into the congruency of store image perceptions, projected by Ikea and Ilva, and how Danish and Swedish consumers perceive the aforementioned stores’ images in their respective home markets. Attributes related to merchandise, such as price, value for money and wide range of products are identified as some of the key factors in how Ikea wants to be portrayed. The findings in this study show that there is a great congruence in Ikea’s intended store image and the store image perceived by the Swedes. However, findings showed that Swedes do not perceive the personnel at Ikea as very helpful or available. This could be explained by Ikea’s low-price strategy. In the case of Ilva, wanting to be perceived as having beautiful store environments and stylish quality products at fair prices were the two main projections at which marketing efforts were aimed. These attributes related to store image are also confirmed among a majority of the Danes, as such also proves highly congruent. Furthermore, the aim was to evaluate the success of Ikea’s and Ilva’s stores’ images on consumers and on transference to host markets. In the case of Ikea the results provided evidence for a successful transfer of store image to Denmark, where the store image is perceived in a very similar way among Swedes and Danes. However, in the case of Ilva, and its store image transfer to Sweden, the results showed a somewhat divergent perception between Danes and Swedes. The Swedes on the one hand tended to perceive Ilva in a more favourable way when it came to attributes related to store atmosphere, whereas the Danes on the other hand perceived Ilva favourably in terms of attributes related to merchandise of price. This somewhat divergent view could attributable to Ilva’s short presence in the Swedish market. Somewhat surprisingly, the intangible attributes were successfully and favourably perceived in the host market, whereas the tangible attributes were of limited success, hence finds no support from previous theory, which suggests that intangible attributes are harder to transfer. Further, the aim was to discern specific store image attributes captivating Swedish and Danish consumers. Findings showed that the importance of attributes vary depending on retailers store image, and retailers should therefore be aware of how consumers perceive their specific store attributes in order to fulfil consumers wants and needs, thereby being viewed in a favourable light compared to its competitors.
65

Consumer Perception of Store Image: A study of Ikea and Ilva in Sweden and Denmark
9. References Amirani, Shahrzad and Gates, Roger (1993) An attribute-anchored conjoint approach to measuring store image, International Journal of Retail and Distribution, Vol. 21, No. 5, pp. 30-40 Arons, Leon (1961) Does television viewing influence store image and shopping frequency? Journal of Retailing, Vol. 37, No. 1, pp. 1-13 Bryman, Alan and Bell, Emma (2003) Business research methods, Oxford University Press, Oxford Bucken-Knapp, Gregg (2001) Just a train-ride away, but still worlds apart: Prospects for the Øresund region as a binational city, GeoJournal, Vol. 54, No. 51-60, pp. 51-60 Burt, Steve (2000) The strategic role of retail brands in British grocery retailing, European Journal of Marketing, Vol. 34, No. 8, pp. 875-890 Burt, Steve and Carralero-Encinas (2000) The role of store image in retail internationalisation, International Marketing Review, Vol. 17, No. 4/5, pp. 433-453 Burt, Steve and Mavrommatis, Alexis (2005) The international transfer of store brand image Cavusgil, S. Tamer and Das, Ajay (1997) Methodology issues in cross-cultural sourcing research – a primer, Marketing Intelligence & Planning, Vol. 1, No. 5, pp. 213-220 Chowdhury, Jhinuk; Reardon, James and Srivastava, Rajesh (1998) Alternatives modes of measuring store image: An empirical assessment of structured versus unstructured measures, Journal of Marketing Theory and Practice, Vol. 6, No. 2, pp. 72-86 Cunningham, Lawrence F.; Young, Clifford E., Lee, Moonkyu and Ulaga, Wolfgang (2006) Customer perceptions of service dimensions: cross-cultural analysis and perspective, International Marketing Review, Vol. 23, No. 2, pp. 192-210 d’Astous, Alain and Ahmed, Sadrudin A. (1998) The importance of country images in the formation of consumer product perceptions, International Marketing Review, Vol. 16, No. 2, pp. 108-125 Datamonitor, (2005) Global Home Furnishing Retail, Industry Profile De Mooij, Marieke (2003) Convergence and divergence in consumer behaviour: implications for global advertising, International Journal of Advertising, Vol. 22, No. 2, pp. 183-202 De Mooij, Marieke and Hostede, Geert (2002) Convergence and divergence in consumer behaviour: implications for international retailing, Journal of Retailing, Vol. 78, No. 1, pp. 61-69 Ditcher, Ernest (1985) Commentary: What’s in an image? Journal of Consumer Marketing, Vol 2, No. 1, pp. 75-81
66
Consumer Perception of Store Image: A study of Ikea and Ilva in Sweden and Denmark
Downs, Roger M. (1970) The cognitive structure of an urban shopping centre, Environment & Behaviour, Vol 2, pp. 13-39 Easterby-Smith, Mark; Thorpe, Richard and Lowe, Andy (2002) Management Research: an introduction, Sage, London Edvardson, Bo and Enquist Bo (2002) The IKEA Saga: How Service Culture Drives Service Strategy, The Service Industry Journal, Vol. 22, No. 4, pp. 153-186 Eriksson, Kent; Johansson, Jan; Majkgård, Anders and Sharma, Deo D. (2000) Effect of Variation on Knowledge Accumulation in the Internationalization Process, International Studies of Management and Organization, Vol. 30, No, 1, pp. 26-44 Fisher, Robert J. and Ackerman, David (1998) The effects of recognition and group need on volunteerism: A social norm perspective, Journal of Consumer Research, Vol. 25, No. 3, pp. 262-275 Foster, Carely (2004) Gendered Retailer: a study of customer perceptions, International Journal of Retail and Distribution Management, Vol. 42, No. 9, pp. 442-447 Gauri, Pervez and Cateoria, Philip (2005) International marketing, second edition, McGraw-Hill Education, Dubai Gilmore, Robert; Margulis, William and Rauch, Richard A. (2001) Consumer’s Attitude and Retailers’ Images in Creating Store Choice. A study of Two Different Sides of the Same Story, International Journal of Value-Based Management, Vol. 14, No. 3, pp. 205-221 Grunig, James (1993) Image and Substance: from symbolic to behavioural relationships, Public Relations Review, Vol. 19, No. 2, pp. 121-139 Hansen, Preben and Karlgren, Jussi (2005) Effects of foreign language and task scenario on relevance assessments, Journal of Documentation, Vol. 61, No. 5, pp. 623-639 Hartman, Katherine B. and Spiro, Rosann L. (2005) Recapturisng store image in customer-based store equity: a construct conceptualization, Journal of Business Research, Vol. 58, No. 8, pp. 1112-1120 Hatch, Mary Jo, Shultz, Majken (2003) Bringing the corporation into corporate branding, European Journal of Marketing, Vol. 37, No. 7/8, pp. 1041-1064 Havaleschka, Finn (2002) Differences between Danish and Swedish management, Leadership & Organisation Development Journal, Vol. 23, No. 6, pp. 323-332 Hofstede, Geert & Hofstede, Gert, Jan (2005) Organisationer och kulturer, Studentlitteratur, Lund Holbrook, M and Schindler, R. (1982) The Experimental Aspects of Consumption: Consumer Fantasies, Feelings and Fun. Journal of Consumer Research, Vol. 9, No. 2, pp. 412- 422
67
Consumer Perception of Store Image: A study of Ikea and Ilva in Sweden and Denmark
Hyllegard, Karen; Eckman, Molly; Descals, Alejandro Molla and Borja, Miguel Angel Gomez (2005) Spanish consumers’ perceptions of US apparel speciality retailers’ products and services, Journal of Consumer Behaviour, Vol. 4, No. 5, pp. 345-362 Jacobsen, Dag Ingvar (2002) Vad, hur och varför? Om metodval i företagsekonomi och andra samhällsvetenskapliga ämnen, Studentlitteratur, Lund Jin, Byoungho and Sternquist, Brenda (2004) Shopping is a Truly Joy, The Service Industries Journal, Vol. 24, No. 6, pp. 1-18
Joyce, M. and Lambert, D. (1996) Memories of the way stores were and retail store image, International Journal of Retail & Distribution Management, Vol. 24, No. 1, pp. 24-33
Kaiser, H.F. (1961) A note on Guttman's Lower Bound for the Number of Common Factors, British Journal of Statistical Psychology, Vol. 14, No. 1, pp. 249-276 Keaveney, Susan M. and Hunt, Kenneth A. (1992) Conceptualization and operationalization of retail store image: a case of rival middle-level theories, Journal of Academy of Marketing Science, Vol. 20, No. 2, pp. 165-75 Keillor, Bruce, D.; D’Amico, Michael and Horton, Veronica (2001) Global Consumer Tendencies, Psychology & Marketing, Vol. 18, No. 1, pp. 1-19 Korgaonkar, P.; Lund, D. and Price, B. (1985) A structural equations approach toward examination of store attitude and store patronage behaviour, Journal of Retailing, Vol 61, No. 2, pp. 39-60 Kumar, Nirmalya, Scheer, Lisa and Kotler, Philip (2000) From Market Driven to Market Driving, European Management Journal, Vol. 18, No. 2, pp. 129-142 Kupke, Valerie (2002) Identifying the dimensions to retail centre image, Journal of Property Investment and Finance, Vol. 22, No. 4, pp. 298- 306 Levitt, Theodore (1983) The Globalization of Markets, Harvard Business Review, Vol. 61, No. 3, pp. 99-102 Lindquist, Jay D. (1974) Meaning of Image, Journal of Retailing, Vol. 50, No. 4, pp. 29-38
Malhotra, Naresh K. And Birks, David F (2003) Marketing research: an applied approach, Pearson Education, cop., New York
Manly, F. J. Bryan (1986) Multivariate Statistical Methods: a Primer, Chapman & Hall, London
Manolis, Chris and Keep, William W. (1994) Testing the underlying structure of a storage image scale, Educational & Psychological measurement, Vol. 54, No. 3, pp. 628-646
Marcoulides, George A. and Hershberger, Scott L. (1997) Multivariate Statistical Methods: a First Course, N.J.: Lawrence Erlbaum Associates, cop., Mahwah
68

Consumer Perception of Store Image: A study of Ikea and Ilva in Sweden and Denmark
Markwick, Nigel and Fill, Chris (1997) Towards a framework for managing corporate identity, European Journal of Marketing, Vol 31, No. 5/6, pp. 396-409 Martineau, Pierre (1958) The personality of the retail store, Harvard Business Review, Vol. 36, pp. 47-55 McGoldrick, Peter (2002) Retail Marketing, second edition, McGraw-Hill, London
McGoldrick, Peter J. (1998) Spatial and Temporal Shifts in the Development of International Retail Images, Journal of Business Research, Vol. 42, No. 2, pp. 189-196
Menezes, Dennis and Elbert, Norbert F. (1979) Alternative Semantic Scaling Formats for Measuring Store Image: An Evaluation, Journal of Marketing Research, Vol. 16, No. 1, pp. 80-87 Mitchell, Vincent-Wayne and Kiral, R. H. (1998) Primary and secondary store-loyal customer perceptions of grocery retailers, British Food Journal, Vol. 100, No. 7, pp. 312-319 Mouritzen, Hans (1999) Öresundsbron: Dansk-svenska myter, Internationella studier, Nr 4 Utrikespolitiska Institutet, Abrahamsons Tryckeri AB, Karlskrona Nielsen, Jørn Flohr, Høst, Viggo, Jaensson, Jan-Erik, Kock, Sören, Selnes, Fred (2003) Market orientation in Nordic banks: does nationality matter?, European Journal of Marketing, Vol. 37, No. 11/12, pp. 1818-1841 Öresunds Øresundsbro konsortiet (a), June 2005, Øresundsbrons kunder om initiativ och barriärer Øresundsbro konsortiet 2006 (b), January 2005, Facts worth knowing about the Øresund, Published by Øresundsbro Konsortiet, Printing: Arco Øresundsbro Konsortiet, January 2005, Crossing the Øresund, Published by, Printing: Arco Grafisk A/S Osman, Zain M. (1993) A conceptual model of retail image influences on loyalty patronage behaviour, The international Review of Retail, Distribution and Consumer Research, Vol. 31, No. 2, pp. 133-148 Overby, Jeffrey, Woodruff, Robert and Fisher Sarah (2005) The influence of culture upon consumer’s desired valued perceptions: A research agenda, Marketing Theory, Vol. 5 No. 2 pp. 139-163 Pinkley, Robin L.; Gelfand, Michele J. And Duan, Lili (2005) When, where and how: the use of multideimensional scaling methods in the study of negotiation and social conflict, International Negotiation, Vol. 10, No. 1, pp. 79-96 Porter, Stephen S. and Claycomb, Cindy (1997) The influence of brand recognition on retail store image, The Journal of Product and Brand Management, Vol. 6, Vol. 6, pp. 373 -387
69

Consumer Perception of Store Image: A study of Ikea and Ilva in Sweden and Denmark
Quester, Pascale G.; Karunaratna, Amal and Goh, Li Kee (2000) Self-congruity and product evaluation: a cross cultural study, Journal of Consumer Marketing, Vol. 17, No. 6, pp. 525-537 Roth, Martin S. (1992) Depth Versus Breadth Strategies for Global Brand Image Management, Journal of Advertising, Vol. 21, No. 2, pp. 25-35 Samli, Coskun A.; Kelly, Patrick J. and Hunt, Keith H. (1998) Improving the Retail Performance by Contrasting Management- and Customer-Perceived Store Images: A diagnostic Tool for Corrective Action, Journal of Business Research, Vol. 43, No. 1, pp. 27-38 Sidelmann, Peter, Jensen, Kistine Sandø and Michelsen, Eva, Grosman (2005) Arbejdspladskulturer i Øresundsregionen – Forskelle og ligheder mellm danske og svenske arbejdspladser, Mentor på tværs, Helsingborg Stad & Reva Trollesbro Stern, Barbara; Zinkhan, George M. and Jaju, Anupam (2001) Marketing images: Construct definition, measurement issues, and theory development, Marketing Theory, Vol. 1, No. 2, pp. 201-224 Thang, Doreen, Chze Lin and Tan, Benjamin, Lin, Boon (2003) Linking consumer perception to preference of retail stores: an empirical assessment of the multi-attributes of store image, Journal of Retailing and Consumer Services, Vol. 10, No. 4, pp. 193-200 Thorelli, Hans B.; Lim, Jeen-Su and Ye, Jongsuk (1988) Relative Importance of Country of Origin, Warranty and Retail Store Image on Product Evaluations, International Marketing Review, Vol. 6, No. 1, pp. 35-47 Trompenaars, Fons and Hampden-Turner, Charles (1997) Riding the Waves of Culture – Understanding Cultural Diversity in Business, Second Edition, Brealy, London Usunier, Jean-Claude (2000) Marketing Across Cultures, Third Edition, Financial Times Prentice Hall, Hempel Hempstead Usunier, Jean-Claude (2005) Marketing Across Cultures, Financial Times Prentice Hall, Hempel Hempstead Uusitalo, Outi (2001) Consumer perceptions of grocery retail formats and brands, International Journal of Retail & Distribution Management, Vol. 29, No. 5, pp. 214-225 van Herk, Hester; Poortinga, Ype H. and Verhallen, Theo M. M. (2005) Equivalence of survey data: relevance for international marketing, European Journal of Marketing, Vol. 39, No. 3, pp. 351-364
Varley, Rosemary (2005) Store Image as the Key Differentiator, European Retail Digest, No. 46, pp. 18-21
Westbrook, Robert A. (1981) Sources of Consumer Satisfaction with Retail Outlets, Sources of Retail Satisfaction, Vol. 57, No. 3, pp. 68-83
70

Consumer Perception of Store Image: A study of Ikea and Ilva in Sweden and Denmark
Wheately, John J. and Chiu, John S. Y. (1977) The Effects of Price, Store Image, and Product and Respondent Characteristics on Perceptions of Quality, Journal of Marketing Research, Vol. 14, No. 2, pp. 181-186 Wong, John K. and Teas, Kenneth (2001) A test of the stability of retail store image mapping based on multientity scaling data, Journal of Retailing and Consumer Services, Vol. 8, No.2, pp. 61-70 Wu, Bob; Petroshius, Susan and Newell, Stephen (2004) The impact of store image, frequency of discount, and discount magnitude on consumers’ value perception and search intention, Marketing Management Journal, Vol. 14, No. 1, pp. 14-29 Zimmer, Mary R. and Golden, Linda L. (1988) Impressions of Retail Stores: A Content Analysis of Consumer Images, Journal of Retailing, Vol. 64, No. 3,3 pp. 265-293
71

Consumer Perception of Store Image: A study of Ikea and Ilva in Sweden and Denmark
72
Appendix 1

Consumer Perception of Store Image: A study of Ikea and Ilva in Sweden and Denmark
Appendix 2a
The company offers fair pricesFöretaget erbjuder rimliga priserFirmaet tilbyder rimelige priser
The company's products offer value for moneyFöretagets produkter ger valuta för pengarnaFirmaets produkter giver valuta for pengene
The company offers attractive discountsFöretaget har attraktiva erbjudandeFirmaet har attraktive tilbud
The company offers products of high quality Företaget erbjuder produkter med hög kvalitetFirmaet tilbyder produkter af høj kvalitet
The company offers well-designed productsFöretaget erbjuder väldesignade produkterFirmaet tilbyder produkter i godt design
The company offers modern productsFöretaget erbjuder moderna produkterFirmaet tilbyder moderne produkter
The store has an attractive interior Varuhuset har en attraktiv inomhusmiljöVarehuset har et attraktivt inde miljø
The store has a pleasant athmosphereVaruhuset har en trevlig atmosfär Varehuset har en hyggelig atmosfære
I feel comfortable shopping in the storeJag känner mig bekväm att handla i varuhusetJeg føler mig bekvem ved at handle i varehuset
The personnel are helpfullPersonalen är hjälpsamPersonalet er hjælpsomt
The personnel are availablePersonalen är tillgängligPersonalet er tilgængeligt
The personnel are politePersonalen är artiga Personalet er høfligt
73

Consumer Perception of Store Image: A study of Ikea and Ilva in Sweden and Denmark
74
Appendix 2b
The store has a wide range of productsVaruhuset har ett brett sortiment av produkterVarehuset har et bredt sortiment af produkter
I like the company's productsJag tycker om företagets produkterJeg kan godt lide firmaets produkter
I would like to buy gifts from the storeJag kan gärna tänka mig att köpa presenter från varuhusetJeg vil gerne købe gaver fra varehuset
The store's location is easily accessibleVaruhuset är beläget på en lättillgänglig platsVarehuset ligger på et let tilgængeligt sted
I like the location of the storeJag tycker om var varuhuset är beläget Jeg kan godt lide hvor varehuset ligger
I use public transportation to get to the storeJag använder allmänna kommunikationsmedel för att åka till varuhusetJeg bruger offentlig transport til varehuset
The company's advertisting has an impact on me to buy the company's productsFöretagets reklam påverkar mig till att köpa deras produkterFirmaets reklamer påvirker mig til at købe deres produkter
The advertisements of the company are trustworthyFöretaget har trovärdig reklamFirmaet har troværdig reklame
The company has attractive promotionsFöretaget har lockande reklamFirmaet har lokkende reklamer

Consumer Perception of Store Image: A study of Ikea and Ilva in Sweden and Denmark
75
Appendix 3a
Instämmer Instämmer Värken Instämmer Instämmer inte alls inte eller helt
Instämmer Instämmer Varken Instämmer Instämmer inte alls inte eller helt
Företaget erbjuder rimliga priser Ikea 1 2 3 4 5Ilva 1 2 3 4 5
Företagets produkter ger valuta för pengarna Ikea 1 2 3 4 5Ilva 1 2 3 4 5
Företaget har attraktiva erbjudande Ikea 1 2 3 4 5Ilva 1 2 3 4 5
Företaget erbjuder produkter med hög kvalitet Ikea 1 2 3 4 5Ilva 1 2 3 4 5
Företaget erbjuder väldesignade produkter Ikea 1 2 3 4 5Ilva 1 2 3 4 5
Företaget erbjuder moderna produkter Ikea 1 2 3 4 5Ilva 1 2 3 4 5
Varuhuset har en attraktiv inomhusmiljö Ikea 1 2 3 4 5Ilva 1 2 3 4 5
Varuhuset har en trivsam atmosfär Ikea 1 2 3 4 5Ilva 1 2 3 4 5
Jag känner mig bekväm att handla i varuhuset Ikea 1 2 3 4 5Ilva 1 2 3 4 5
Personalen är hjälpsam Ikea 1 2 3 4 5Ilva 1 2 3 4 5
Personalen är tillgänglig Ikea 1 2 3 4 5Ilva 1 2 3 4 5
Personalen är artig Ikea 1 2 3 4 5Ilva 1 2 3 4 5
Varuhuset har ett brett sortiment Ikea 1 2 3 4 5Ilva 1 2 3 4 5
Jag tycker om företagets produkter Ikea 1 2 3 4 5Ilva 1 2 3 4 5
Jag skulle kunna tänka mig att köpa presenter från varuhuset Ikea 1 2 3 4 5Ilva 1 2 3 4 5
Varuhuset är beläget på en lättillgänglig plats Ikea 1 2 3 4 5Ilva 1 2 3 4 5
Jag tycker om var varuhuset är beläget Ikea 1 2 3 4 5Ilva 1 2 3 4 5
Jag använder allmänna kommunikationsmedel för att åka Ikea 1 2 3 4 5till varuhuset Ilva 1 2 3 4 5
Företagets reklam påverkar mig till att köpa deras produkter Ikea 1 2 3 4 5Ilva 1 2 3 4 5
Företaget har trovärdig reklam Ikea 1 2 3 4 5Ilva 1 2 3 4 5
Företaget har lockande reklam Ikea 1 2 3 4 5Ilva 1 2 3 4 5

Consumer Perception of Store Image: A study of Ikea and Ilva in Sweden and Denmark
76
Appendix 3b
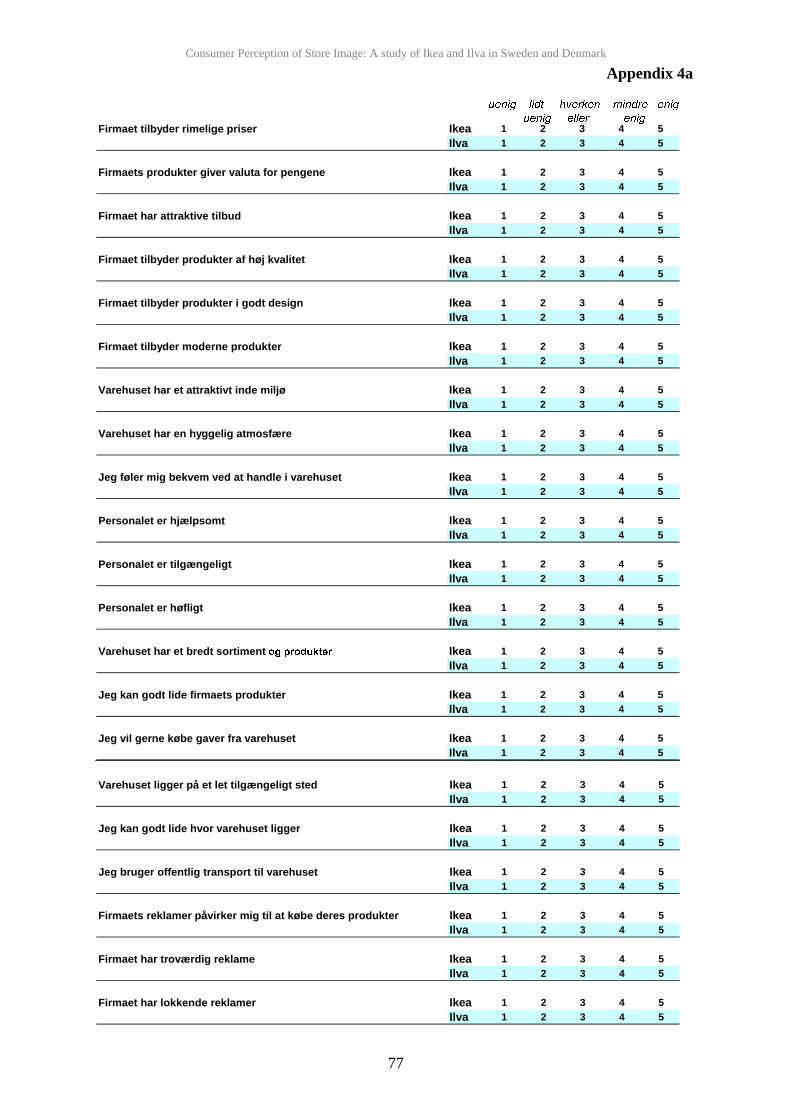
Consumer Perception of Store Image: A study of Ikea and Ilva in Sweden and Denmark
77
Appendix 4a
Varehuset ligger på et let tilgængeligt sted Ikea 1 2 3 4 5Ilva 1 2 3 4 5
Jeg kan godt lide hvor varehuset ligger Ikea 1 2 3 4 5Ilva 1 2 3 4 5
Jeg bruger offentlig transport til varehuset Ikea 1 2 3 4 5Ilva 1 2 3 4 5
Firmaets reklamer påvirker mig til at købe deres produkter Ikea 1 2 3 4 5Ilva 1 2 3 4 5
Firmaet har troværdig reklame Ikea 1 2 3 4 5Ilva 1 2 3 4 5
Firmaet har lokkende reklamer Ikea 1 2 3 4 5Ilva 1 2 3 4 5
Firmaet tilbyder rimelige priser Ikea 1 2 3 4 5Ilva 1 2 3 4 5
Firmaets produkter giver valuta for pengene Ikea 1 2 3 4 5Ilva 1 2 3 4 5
Firmaet har attraktive tilbud Ikea 1 2 3 4 5Ilva 1 2 3 4 5
Firmaet tilbyder produkter af høj kvalitet Ikea 1 2 3 4 5Ilva 1 2 3 4 5
Firmaet tilbyder produkter i godt design Ikea 1 2 3 4 5Ilva 1 2 3 4 5
Firmaet tilbyder moderne produkter Ikea 1 2 3 4 5Ilva 1 2 3 4 5
Varehuset har et attraktivt inde miljø Ikea 1 2 3 4 5Ilva 1 2 3 4 5
Varehuset har en hyggelig atmosfære Ikea 1 2 3 4 5Ilva 1 2 3 4 5
Jeg føler mig bekvem ved at handle i varehuset Ikea 1 2 3 4 5Ilva 1 2 3 4 5
Personalet er hjælpsomt Ikea 1 2 3 4 5Ilva 1 2 3 4 5
Personalet er tilgængeligt Ikea 1 2 3 4 5Ilva 1 2 3 4 5
Personalet er høfligt Ikea 1 2 3 4 5Ilva 1 2 3 4 5
Varehuset har et bredt sortiment Ikea 1 2 3 4 5Ilva 1 2 3 4 5
Jeg kan godt lide firmaets produkter Ikea 1 2 3 4 5Ilva 1 2 3 4 5
Jeg vil gerne købe gaver fra varehuset Ikea 1 2 3 4 5Ilva 1 2 3 4 5

Consumer Perception of Store Image: A study of Ikea and Ilva in Sweden and Denmark
78
Appendix 4b