consumer perception on branded garments -...
TRANSCRIPT
IJRFM Volume 2, Issue 2 (February 2012) ISSN: 2231-5985
International Journal of Research in Finance & Marketing 566
http://www.mairec.org
CONSUMER PERCEPTION TOWARD BRANDED GARMENTS:
A STUDY OF JAIPUR
Parul Mittal *
Sandeep Aggarwal *
ABSTRACT
Analyzing and understanding the consumer and his behaviour is the cornerstone of success in
marketing. It includes all the physical, mental and emotional processes and concerned
behaviour which are observable before, during and after each and every purchase of goods
and services. This make us compelling to understand, observe, record and react to such
behaviour in case we want to have win-win strategy that matter for marketer and the
customer both. The research report presented is based on the “Consumer Perception
towards Branded Garments”. Through this study an attempt has been made to practically
understand those emotional or rational appeals, which drive the purchase decision toward
the branded garments. Also certain demographic and psychographic profiles have been
studied and certain relation has been developed. Branded readymade garment is supposed to
have 21% share in the Rs. 20,000 Cr garment industry which is having vertical growth rate
of around 20%.
Key Words: Brand, Garments, Perception, Purchase, Consumer.
* Assistant Professor, Indira Gandhi P.G. Regional Center –Mirpur, Maharshi Dayanand
University, Rohtak.

IJRFM Volume 2, Issue 2 (February 2012) ISSN: 2231-5985
International Journal of Research in Finance & Marketing 567
http://www.mairec.org
1. INTRODUCTION
Within the current marketing environment, the competition between products and services is
becoming increasingly tough. Each producer of goods and services attempts to obtain a
potential market share by making consumers believe that they have the answer to all their
personal needs and desires. Branding was introduced to differentiate homogenous products
such as clothing. Clothing items (products) can now be bought according to the psychological
elements that they represent and not only for their physical characteristics and need-satisfying
properties. Due to this psychological nature of purchasing, which is increasingly becoming a
part of consumer behaviour; it is crucial that manufacturers in the clothing industry become
familiar with the perceptions and attitudes of the consumer.
Clothing is likely to form an integral part in the enactment of social encounters and it is also
seen as a very important channel of non-verbal communication. Clothing is therefore used as
a code, which allows messages to be created and understood selectively (Auty & Elliott,
1998:109). They state further that perceptions of brand users have been found to differ for
identical brands within a product category. Within the context of this study, perceptions
regarding branded clothing were tested. The need for information about the symbolic nature
of clothing is crucial to demonstrating how perceptions are formed and interpreted in society.
2. OBJECTIVE:
The primary research objective of the study is to determine whether the branding of garments
influence the perceptions of consumer. Study is divided in 4 major section based on the
objectives to obtain accurate and specific results. The primary objective of study is to
analyze weather the population of Jaipur does prefer to wear brands or not. Other objectives
are as follows:-
a) To study the awareness of branded clothes among consumers in Jaipur city only.
b) To study the major factors responsible for buying branded clothes among consumers
in Jaipur city.
c) To study the demographic factors affecting branded clothes buying behavior in Jaipur
city only.
d) To study the most popular brand among various age groups in branded clothes market
in Jaipur city.
3. RESEARCH METHOD:
A self-administered questionnaire was used. The questionnaire consisted of four sections and
52 individual statements and/or questions. A non-probability sampling design, more
IJRFM Volume 2, Issue 2 (February 2012) ISSN: 2231-5985
International Journal of Research in Finance & Marketing 568
http://www.mairec.org
specifically, convenience sample was used to draw the sample. The questionnaires were
disseminated amongst the Jaipurites in places like Gaurav Tower, Mcdo nalds near Raj
Mandir, Crystal Palm and Lifestyle. The objective of the study was explained to the
respondents. The questionnaire was based on the possible problems or questions regarding
the process of completing of the questionnaires. After completion, a ll the questionnaires were
personally distributed and collected by the researcher.
4. DATA ANALYSIS & INTERPRETATION:
A total of 120 questionnaires were handed out at different malls in Jaipur, and a sample of 96
was realized. The remaining 24 questionnaires were discarded for one of the following
reasons:
Non-compliance with the set age parameters.
Incorrect completion of questionnaire.
Too many fields of data missing.
SECTION A:
Based on the objective 1, and to prove H1, SECTION A includes two main statements to
analyze the awareness of consumers about branded clothes by means of nominal and constant
sub scale. The questions posed were adapted taking the basic knowledge of the sample into
consideration. Study was conducted investigating consumer awareness about the brands in
the processes of product consumption, purchase decision involvement, advertising
involvement and involvement with the product itself. The first statement is to know that if the
consumer often recognizes brands and how, where as second statement is used to know how
much consumer is aware about brand.
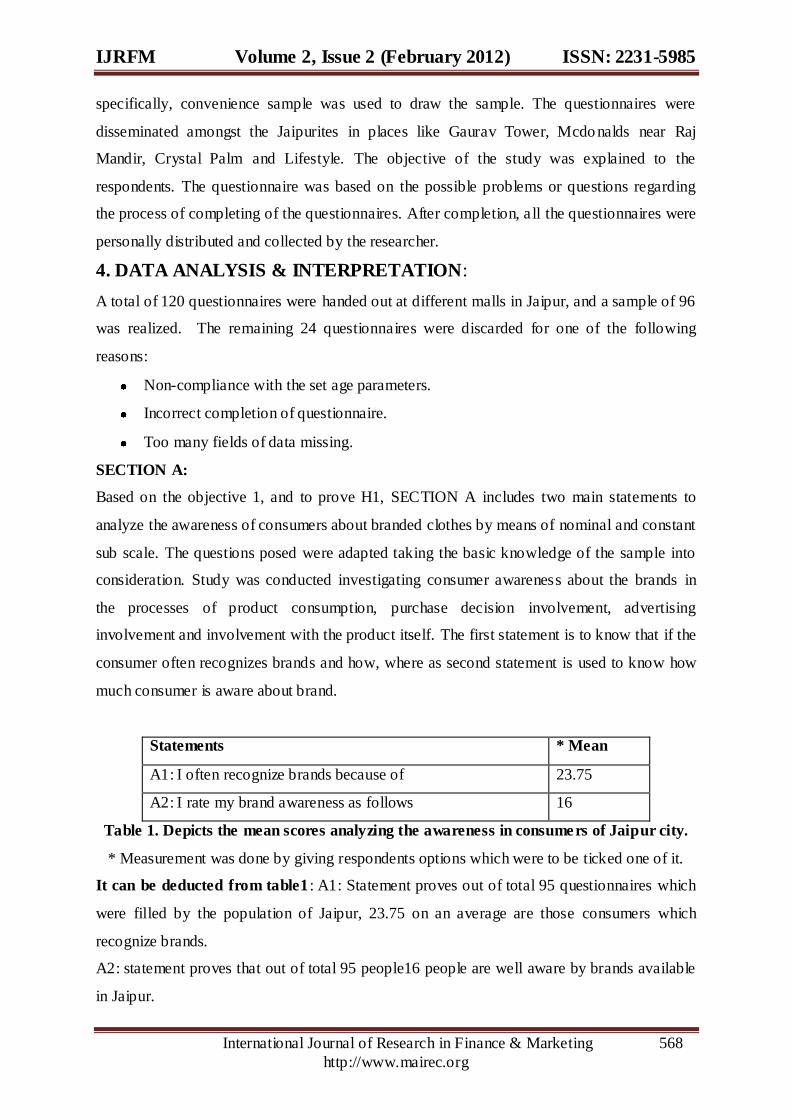
Statements * Mean
A1: I often recognize brands because of 23.75
A2: I rate my brand awareness as follows 16
Table 1. Depicts the mean scores analyzing the awareness in consumers of Jaipur city.
* Measurement was done by giving respondents options which were to be ticked one of it.
It can be deducted from table1 : A1: Statement proves out of total 95 questionnaires which
were filled by the population of Jaipur, 23.75 on an average are those consumers which
recognize brands.
A2: statement proves that out of total 95 people16 people are well aware by brands available
in Jaipur.

IJRFM Volume 2, Issue 2 (February 2012) ISSN: 2231-5985
International Journal of Research in Finance & Marketing 569
http://www.mairec.org
SECTION B:
In this section to study the major factors responsible for buying branded clothes among
consumes in Jaipur city is taken in consideration. To analyze it, key motivators, brand factors
and purchase decision factors were compared by means of a ordinal scale.
STATEMENT B1: What are the key motivators when you purchase branded cloths mean
1.Product 15.47
2.Stlye 11.25
3.Design 11.25
4.Brand name 10.34
5.Price 9.18
6.Comfort 13.5
7.Availability 9.12
8.Discounts 7.5
Table 2. Depicts the mean scores for above mentioned factors.
*Measurement was done on a 10-point ordinal scale, where 1 = strongly disagree and 10 =
strongly agree with the statement.
It can be deduced collectively from Table 2: That out of total 95 people, 15.47 purchase
branded clothes on an average sue to its product quality. Similarly, 11.25 on an average
people purchase clothes because of its styling. 11.25 on an average purchase branded clothes
because of its design. And so on.
Statement B2:What does your brand gives you MEAN
1. Recognition 10.07
2. Satisfaction 9.125
3. Value for money 9.125
4. Praise from friend 8.93
5. Social capability 10.14
6. Any others 7.5
Table 3. Depicts the mean scores for above mentioned factors
* = Measurement was done on a 10-point ordinal scale, where 1 = strongly disagree with the
statement and 10 = strongly agree with the statement.
It can be deduced collectively from Table 3: That out of total 95 people, 10.07 on an
average purchase because of its recognition in youth. Similarly, 9.125 on an average because
of its satisfaction achieved by the amount paid and so on.
IJRFM Volume 2, Issue 2 (February 2012) ISSN: 2231-5985
International Journal of Research in Finance & Marketing 570
http://www.mairec.org
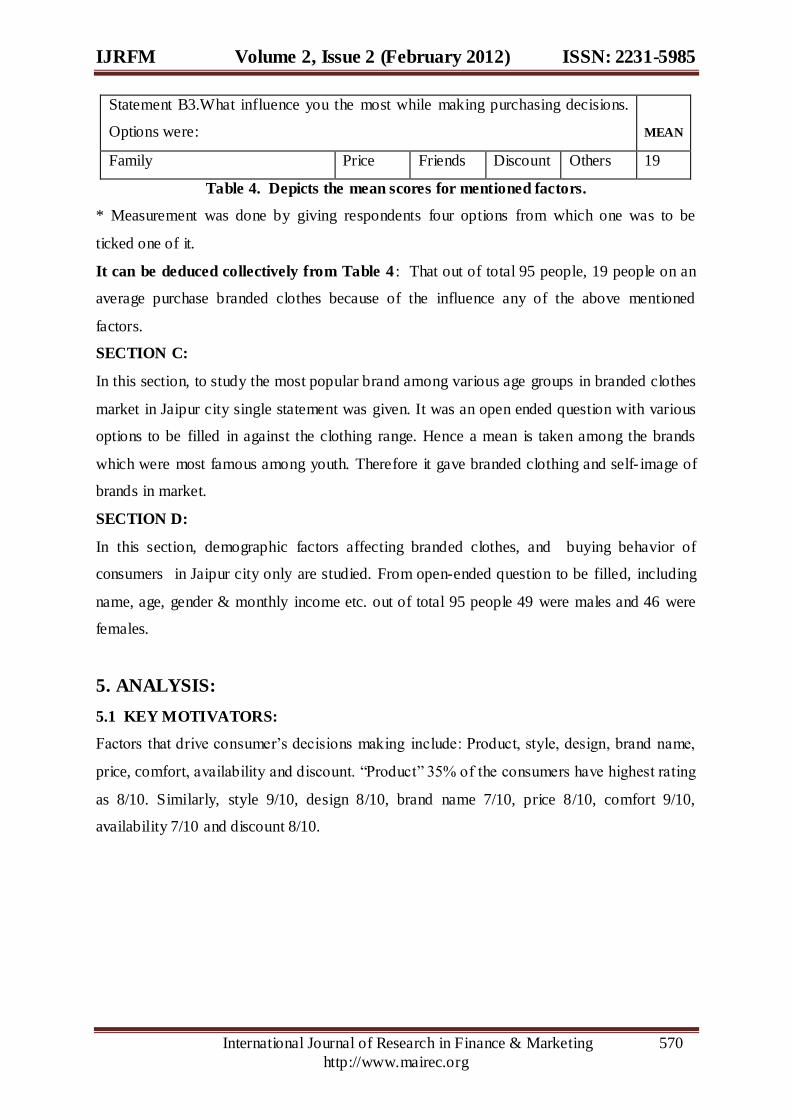
Statement B3.What influence you the most while making purchasing decisions.
Options were:
MEAN
Family Price Friends Discount Others 19
Table 4. Depicts the mean scores for mentioned factors.
* Measurement was done by giving respondents four options from which one was to be
ticked one of it.
It can be deduced collectively from Table 4 : That out of total 95 people, 19 people on an
average purchase branded clothes because of the influence any of the above mentioned
factors.
SECTION C:
In this section, to study the most popular brand among various age groups in branded clothes
market in Jaipur city single statement was given. It was an open ended question with various
options to be filled in against the clothing range. Hence a mean is taken among the brands
which were most famous among youth. Therefore it gave branded clothing and self- image of
brands in market.
SECTION D:
In this section, demographic factors affecting branded clothes, and buying behavior of
consumers in Jaipur city only are studied. From open-ended question to be filled, including
name, age, gender & monthly income etc. out of total 95 people 49 were males and 46 were
females.
5. ANALYSIS:
5.1 KEY MOTIVATORS:
Factors that drive consumer’s decisions making include: Product, style, design, brand name,
price, comfort, availability and discount. “Product” 35% of the consumers have highest rating
as 8/10. Similarly, style 9/10, design 8/10, brand name 7/10, price 8/10, comfort 9/10,
availability 7/10 and discount 8/10.

IJRFM Volume 2, Issue 2 (February 2012) ISSN: 2231-5985
International Journal of Research in Finance & Marketing 571
http://www.mairec.org
Figure 1. (Key motivator for branded garments)
5.2 NEED FOR BRAND:
Figure 2. (Why branded garments are demanded)
The above chart reveals that people of Jaipur rates themselves on 7 or 8 out of 10 in the
rankings answering why they prefer a brand based on the above factors.
IJRFM Volume 2, Issue 2 (February 2012) ISSN: 2231-5985
International Journal of Research in Finance & Marketing 572
http://www.mairec.org
5.3 BRAND INFLUENCE:
Figure 3. (What Influences the brand choice)
Price is influencer for brand and always a key motivator or decliner for any purchasing
decision and unsurprisingly so the result of the survey rationalises this phenomenon.
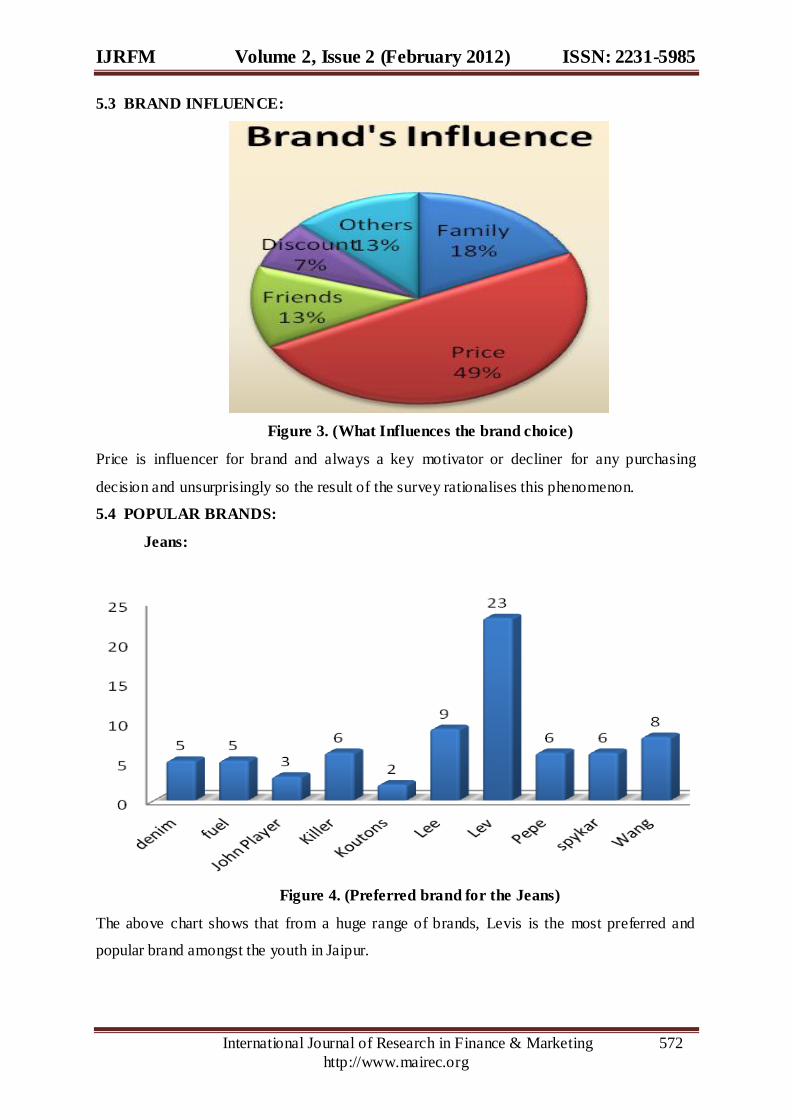
5.4 POPULAR BRANDS:
Jeans:
Figure 4. (Preferred brand for the Jeans)
The above chart shows that from a huge range of brands, Levis is the most preferred and
popular brand amongst the youth in Jaipur.

IJRFM Volume 2, Issue 2 (February 2012) ISSN: 2231-5985
International Journal of Research in Finance & Marketing 573
http://www.mairec.org
T-Shirts:
Figure 5. (Preferred T-shirt brands)
With the above, we interpret that Levis and Pepe are the more popular brands in the T- shirts
segment.
Shirts:
Figure 6. (Demanded branded shirts)
Having a huge range of formal Shirting we can see in the above pie chart is that the people
have a scattered choice of brands in this segment. Amongst them Kuttons is rated as the most
popular brand but a ranking of meagre 12% doesn’t make it a best brand or something that it
needs recognition.
IJRFM Volume 2, Issue 2 (February 2012) ISSN: 2231-5985
International Journal of Research in Finance & Marketing 574
http://www.mairec.org
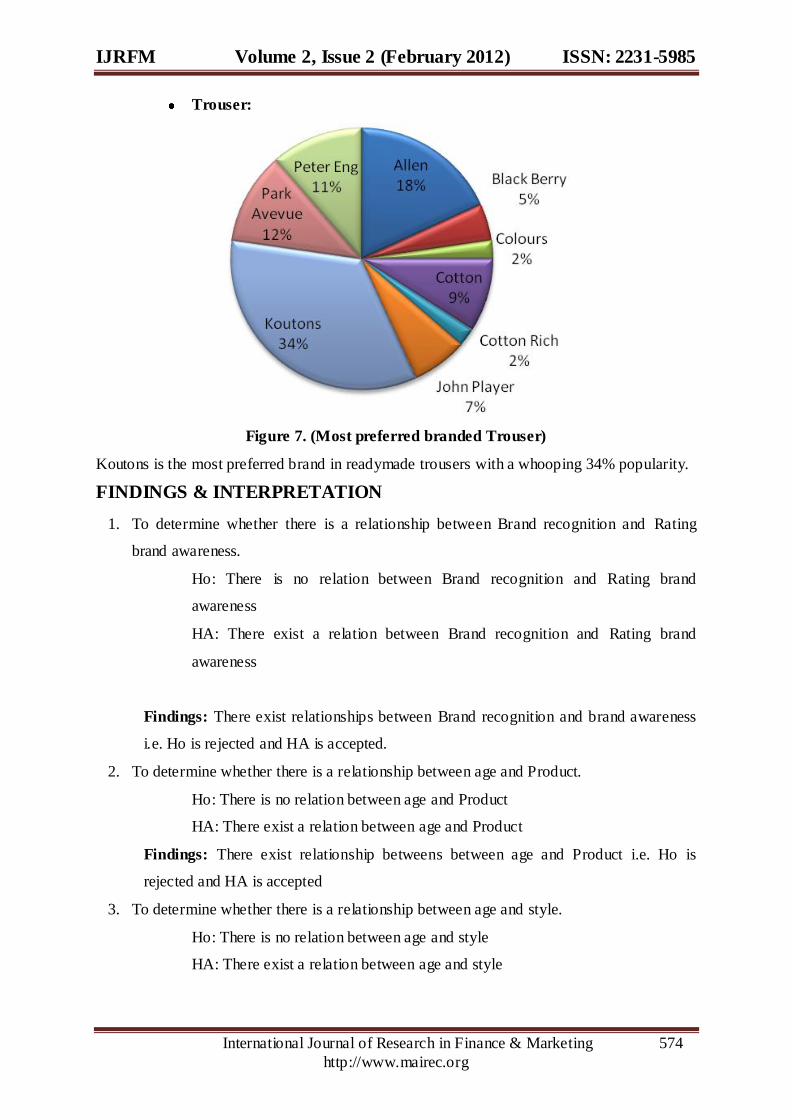
Trouser:
Figure 7. (Most preferred branded Trouser)
Koutons is the most preferred brand in readymade trousers with a whooping 34% popularity.
FINDINGS & INTERPRETATION
1. To determine whether there is a relationship between Brand recognition and Rating
brand awareness.
Ho: There is no relation between Brand recognition and Rating brand
awareness
HA: There exist a relation between Brand recognition and Rating brand
awareness
Findings: There exist relationships between Brand recognition and brand awareness
i.e. Ho is rejected and HA is accepted.
2. To determine whether there is a relationship between age and Product.
Ho: There is no relation between age and Product
HA: There exist a relation between age and Product
Findings: There exist relationship betweens between age and Product i.e. Ho is
rejected and HA is accepted
3. To determine whether there is a relationship between age and style.
Ho: There is no relation between age and style
HA: There exist a relation between age and style

IJRFM Volume 2, Issue 2 (February 2012) ISSN: 2231-5985
International Journal of Research in Finance & Marketing 575
http://www.mairec.org
Findings: There exist relationship betweens between age and style i.e. Ho is rejected
and HA is accepted
4. To determine whether there is a relationship between age and Brand name.
Ho: There is no relation between age and Brand name
HA: There exist a relation between age and Brand name
Findings: There exist relationship betweens between age and Brand name i.e. Ho is
rejected and HA is accepted
5. To determine whether there is a relationship between age and price.
Ho: There is no relation between age and price
HA: There exist a relation between age and price
Findings: There exist relationship betweens between age and price i.e. Ho is rejected
and HA is accepted
6. To determine whether there is a relationship between age and discount.
Ho: There is no relation between age and discount
HA: There exist a relation between age and discount
Findings: There exist relationship betweens between age and discount i.e. Ho is
rejected and HA is accepted
7. To determine whether there is a relationship between age and Recognition.
Ho: There is no relation between age and Recognition.
HA: There exist a relation between age and Recognition.
Findings: There exist relationship betweens between age and Recognition i.e. Ho is
rejected and HA is accepted.
8. To determine whether there is a relationship between age and satisfaction.
Ho: There is no relation between age and satisfaction.
HA: There exist a relation between age and satisfaction.
Findings: There exist relationship betweens between age and Recognition i.e. Ho is
rejected and HA is accepted.
9. To determine whether there is a relationship between age and value for money.
Ho: There is no relation between age and value for money.
HA: There exist a relation between age and value for money.
Findings: There exist relationship betweens between age and value for money i.e. Ho
is rejected and HA is accepted.
10. To determine whether there is a relationship between Income and Brand name.
Ho: There is no relation between Income and Brand name.

IJRFM Volume 2, Issue 2 (February 2012) ISSN: 2231-5985
International Journal of Research in Finance & Marketing 576
http://www.mairec.org
HA: There exist a relation between Income and Brand name.
Findings: There exist relationship betweens between Income and Brand name i.e. Ho
is rejected and HA is accepted.
11. To determine whether there is a relationship between Income and price.
Ho: There is no relation between Income and price.
HA: There exist a relation between Income and price.
Findings: There exist relationship betweens between Income and price i.e. Ho is
rejected and HA is accepted.
12. To determine whether there is a relationship between Income and comfort.
Ho: There is no relation between Income and comfort.
HA: There exist a relation between Income and comfort.
Findings: There exist relationship betweens between Income and comfort i.e. Ho is
rejected and HA is accepted.
13. To determine whether there is a relationship between Income and discount.
Ho: There is no relation between Income and discount.
HA: There exist a relation between Income and discount.
Findings: There exist relationship betweens between Income and discount i.e. Ho is
rejected and HA is accepted.
14. To determine whether there is a relationship between Income and satisfaction.
Ho: There is no relation between Income and satisfaction.
HA: There exist a relation between Income and satisfaction.
Findings: There exist relationship betweens between Income and satisfaction i.e. Ho
is rejected and HA is accepted.
15. To determine whether there is a relationship between Income and value for money.
Ho: There is no relation between Income and value for money.
HA: There exist a relation between Income and value for money.
Findings: There exist relationship betweens between Income and value for money i.e.
Ho is rejected and HA is accepted.
16. To determine whether there is a relationship between Income and praise from friends.
Ho: There is no relation between Income and praise from friends.
HA: There exist a relation between Income and praise from friends.
Findings: There exist relationship betweens between Income and praise from friends
i.e. Ho is rejected and HA is accepted.
IJRFM Volume 2, Issue 2 (February 2012) ISSN: 2231-5985
International Journal of Research in Finance & Marketing 577
http://www.mairec.org
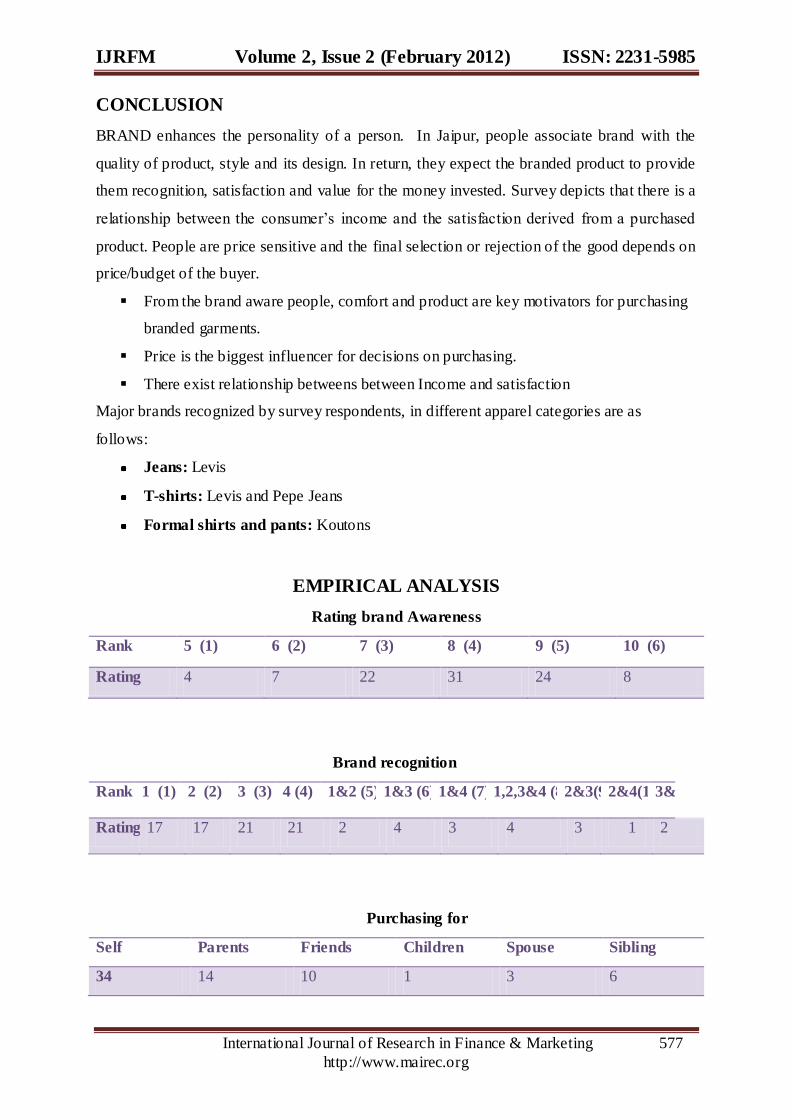
CONCLUSION
BRAND enhances the personality of a person. In Jaipur, people associate brand with the
quality of product, style and its design. In return, they expect the branded product to provide
them recognition, satisfaction and value for the money invested. Survey depicts that there is a
relationship between the consumer’s income and the satisfaction derived from a purchased
product. People are price sensitive and the final selection or rejection of the good depends on
price/budget of the buyer.
From the brand aware people, comfort and product are key motivators for purchasing
branded garments.
Price is the biggest influencer for decisions on purchasing.
There exist relationship betweens between Income and satisfaction
Major brands recognized by survey respondents, in different apparel categories are as
follows:
Jeans: Levis
T-shirts: Levis and Pepe Jeans
Formal shirts and pants: Koutons
EMPIRICAL ANALYSIS
Rating brand Awareness
Rank 5 (1) 6 (2) 7 (3) 8 (4) 9 (5) 10 (6)
Rating 4 7 22 31 24 8
Brand recognition
Rank 1 (1) 2 (2) 3 (3) 4 (4) 1&2 (5) 1&3 (6) 1&4 (7) 1,2,3&4 (8) 2&3(9) 2&4(10) 3&4
Rating 17 17 21 21 2 4 3 4 3 1 2
Purchasing for
Self Parents Friends Children Spouse Sibling
34 14 10 1 3 6
IJRFM Volume 2, Issue 2 (February 2012) ISSN: 2231-5985
International Journal of Research in Finance & Marketing 578
http://www.mairec.org
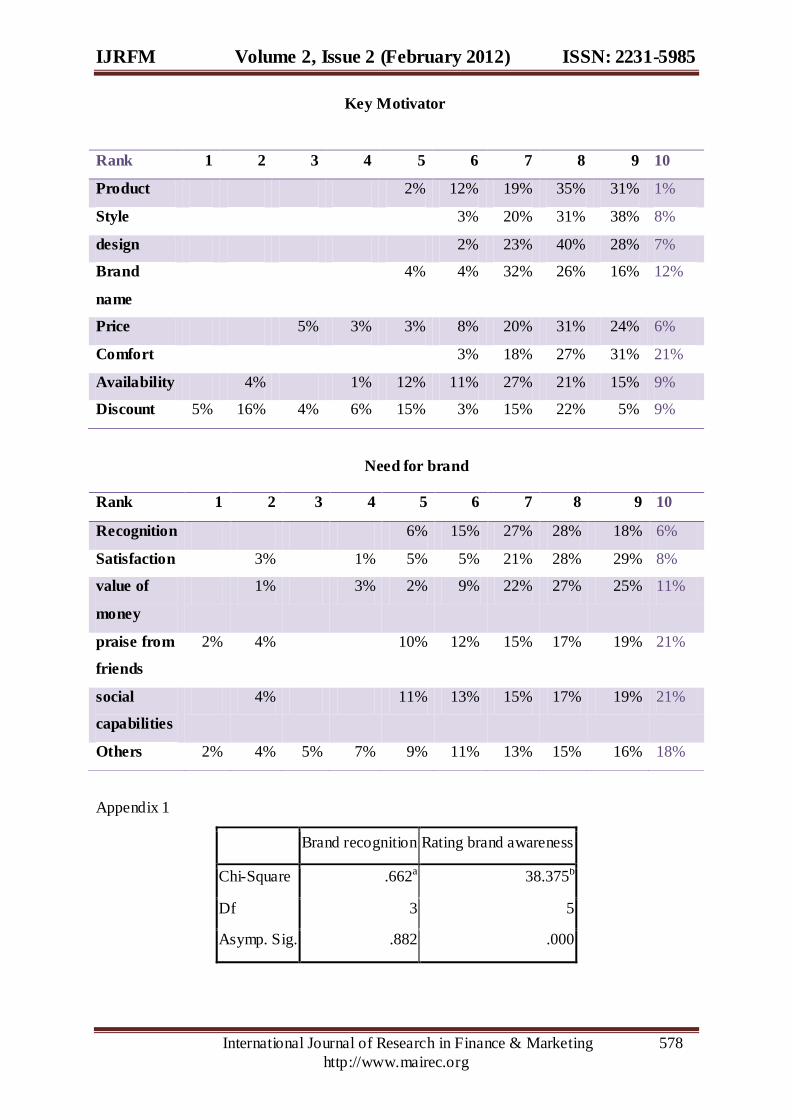
Key Motivator
Need for brand
Appendix 1
Brand recognition Rating brand awareness
Chi-Square .662a 38.375b
Df 3 5
Asymp. Sig. .882 .000
Rank 1 2 3 4 5 6 7 8 9 10
Product 2% 12% 19% 35% 31% 1%
Style 3% 20% 31% 38% 8%
design 2% 23% 40% 28% 7%
Brand
name
4% 4% 32% 26% 16% 12%
Price 5% 3% 3% 8% 20% 31% 24% 6%
Comfort 3% 18% 27% 31% 21%
Availability 4% 1% 12% 11% 27% 21% 15% 9%
Discount 5% 16% 4% 6% 15% 3% 15% 22% 5% 9%
Rank 1 2 3 4 5 6 7 8 9 10
Recognition 6% 15% 27% 28% 18% 6%
Satisfaction 3% 1% 5% 5% 21% 28% 29% 8%
value of
money
1% 3% 2% 9% 22% 27% 25% 11%
praise from
friends
2% 4% 10% 12% 15% 17% 19% 21%
social
capabilities
4% 11% 13% 15% 17% 19% 21%
Others 2% 4% 5% 7% 9% 11% 13% 15% 16% 18%

IJRFM Volume 2, Issue 2 (February 2012) ISSN: 2231-5985
International Journal of Research in Finance & Marketing 579
http://www.mairec.org
Appendix 2
V4 Age
Chi-Square 57.875a 40.500b
Df 5 8
Asymp. Sig. .000 .000
Appendix 3
Age V5
Chi-Square 40.500a 38.792b
Df 8 4
Asymp. Sig. .000 .000
Appendix 4
Age V7
Chi-Square 40.500a 47.063b
Df 8 6
Asymp. Sig. .000 .000
Appendix 5
Age key motivators
Chi-Square 40.500a 62.833b
Df 8 7
Asymp. Sig. .000 .000
Appendix 6
Age V11
Chi-Square 40.500a 34.208b
Df 8 9
Asymp. Sig. .000 .000

IJRFM Volume 2, Issue 2 (February 2012) ISSN: 2231-5985
International Journal of Research in Finance & Marketing 580
http://www.mairec.org
Appendix 7
Age V13
Chi-Square 40.500a 46.333b
Df 8 6
Asymp. Sig. .000 .000
Appendix 8
Age V14
Chi-Square 40.500a 72.500b
Df 8 7
Asymp. Sig. .000 .000
Appendix 9
Age Need for brand
Chi-Square 40.500a 61.333b
df 8 7
Asymp. Sig. .000 .000
Appendix 10
Income V7
Chi-Square 131.813a 47.063b
df 2 6
Asymp. Sig. .000 .000
Appendix 11
Income key motivators
Chi-Square 131.813a 62.833b
df 2 7
Asymp. Sig. .000 .000

IJRFM Volume 2, Issue 2 (February 2012) ISSN: 2231-5985
International Journal of Research in Finance & Marketing 581
http://www.mairec.org
Appendix 12
Income V9
Chi-Square 131.813a 21.500b
df 2 4
Asymp. Sig. .000 .000
Appendix 13
Income V11
Chi-Square 131.813a 34.208b
Df 2 9
Asymp. Sig. .000 .000
Appendix 14
Income V14
Chi-Square 131.813a 72.500b
Df 2 7
Asymp. Sig. .000 .000
Appendix 15
Income Need for brand
Chi-Square 131.813a 61.333b
df 2 7
Asymp. Sig. .000 .000
Appendix 16
Income V16
Chi-Square 131.813a 57.938b
df 2 8
Asymp. Sig. .000 .000
IJRFM Volume 2, Issue 2 (February 2012) ISSN: 2231-5985
International Journal of Research in Finance & Marketing 582
http://www.mairec.org
REFERENCES:
1. ALI, Sadia Samar. Some statistical methods of studying consumer buying behaviour.
Aligarh: Aligarh Muslim University, 2003. (Ph.D. Thesis).
2. ATKIN, Douglas. Culting of brands: when customers become true believers.
Portfolio, 2004. 256p.
3. BALAJI, U. Factors in consumer confusion in purchase process.Hyderabad: Osmania
University, 1992. (Ph.D. Thesis).
4. BANO, Vaseem. Factors influencing consumer buying decisions. Hyderabad:
Osmania University, 2000. (Ph.D. Thesis).
5. BASET, Abdel and Hasouneh, I.M. Consumer behaviour. Jaipur: Sublime, 2003.
178p
6. BUCKLIN, Randolph E., Gupta, Sunil and Han, Sangman. Brand’s eye view of
reponse segmentation in consumer brand choice behavior. Journal of Marketing
Research. 32(1); 1995, p.66-74.
7. CONSUMER behaviour and consumer protection in India, edited by Meenu Agrawal.
Delhi: Eastern Book, 2006. 309p.
8. CONSUMER-orientation: premises and perspectives, edited by Ramesh K. Arora and
Anuja Gulati. Jaipur: Arihant, 1996. 159p.
9. GANDHI, Sudesh M. Exploratory study on consumer behaviour and rationality in
consumer decision process. Nagpur: Nagpur University, 1994. (Ph.D. Thesis).
10. HANDBOOK for the teaching of economic and consumer psychology, edited by Paul
Webley and Catherine M. Walker. Exeter: Washington Singer, 1999. 254p.
11. KAUR, Pavleen. Dynamics of purchase decision making in families: a study of
consumer durables. Amritsar: Guru Nanak Dev University, 2004. (Ph.D. Thesis).
12. KHAN, Mohammad Naved. Dimensions of family decision making in the purchase of
consumer products. Aligarh: Aligarh Muslim University, 2000. 213p. (Ph.D. Thesis).
13. MURTY, K.N. Effects of changes in household size, consumer taste and preferences
on demand pattern in India. Journal of Quantitative Economics. 3(2); Jul 2005, p.110-
36.
14. SHARAN, A.K. Consumer psychology. New Delhi: Rajat Publication, 2000. 324p.
15. SHARMA, S.S. Consumer behaviour: study of consumer interest. Jaipur:Jaipur
Publishing House, 1995. 158p

IJRFM Volume 2, Issue 2 (February 2012) ISSN: 2231-5985
International Journal of Research in Finance & Marketing 583
http://www.mairec.org
16. SUMATHI, S. and Saravanavel, P. Marketing research and consumer behaviour. New
Delhi: D.K., 2003
17. SUBIN IM, Bayus, Barry L. and Mason, Charlotte H. Empirical study of innate
consumer innovativeness, personal characteristics and newproduct adoption behavior.
Journal of the Academy of Marketing Science. 31; Jan 2003, p.61-73.
18. WESLEY, S., Lehew, M. and Woodside, A.G. Consumer decision-making styles and
mall shopping behavior: building theory using exploratory data analysis and the
comparative method. Journal of Business Research. 59(5); 2006, p.535-48.