consulting geotechnical engineers 439 western avenue
TRANSCRIPT
www.geoteq.com
November 7, 2017 File Number 21494 Jefferson Boulevard Associates, LLC 10877 Wilshire Boulevard, Suite 1105 Los Angeles, California 90024 Attention: David Garcia
Subject: Geotechnical Engineering Investigation Proposed Hotel Development 11469 Jefferson Boulevard, Culver City, California Ladies and Gentlemen: This letter transmits the Geotechnical Engineering Investigation for the subject property prepared by Geotechnologies, Inc. This report provides geotechnical recommendations for the development of the site, including earthwork, seismic design, retaining walls, excavations, shoring and foundation design. Engineering for the proposed project should not begin until approval of the geotechnical investigation is granted by the local building official. Significant changes in the geotechnical recommendations may result due to the building department review process. The validity of the recommendations presented herein is dependent upon review of the geotechnical aspects of the project during construction by this firm. The subsurface conditions described herein have been projected from limited subsurface exploration and laboratory testing. The exploration and testing presented in this report should in no way be construed to reflect any variations which may occur between the exploration locations or which may result from changes in subsurface conditions. Should you have any questions please contact this office. Respectfully submitted, GEOTECHNOLOGIES, INC. STANLEY S. TANG R.C.E. 56178 SST:km Distribution: (5) Addressee Email to: [[email protected]]
Geotechnolouies, Inc. Consulting Geotechnical Engineers
439 Western Avenue Glendale, California 91201-2837 818.240.9600 • Fax 818.240.9675
.,.-/
No. 56178
xp.l2/3l/ l
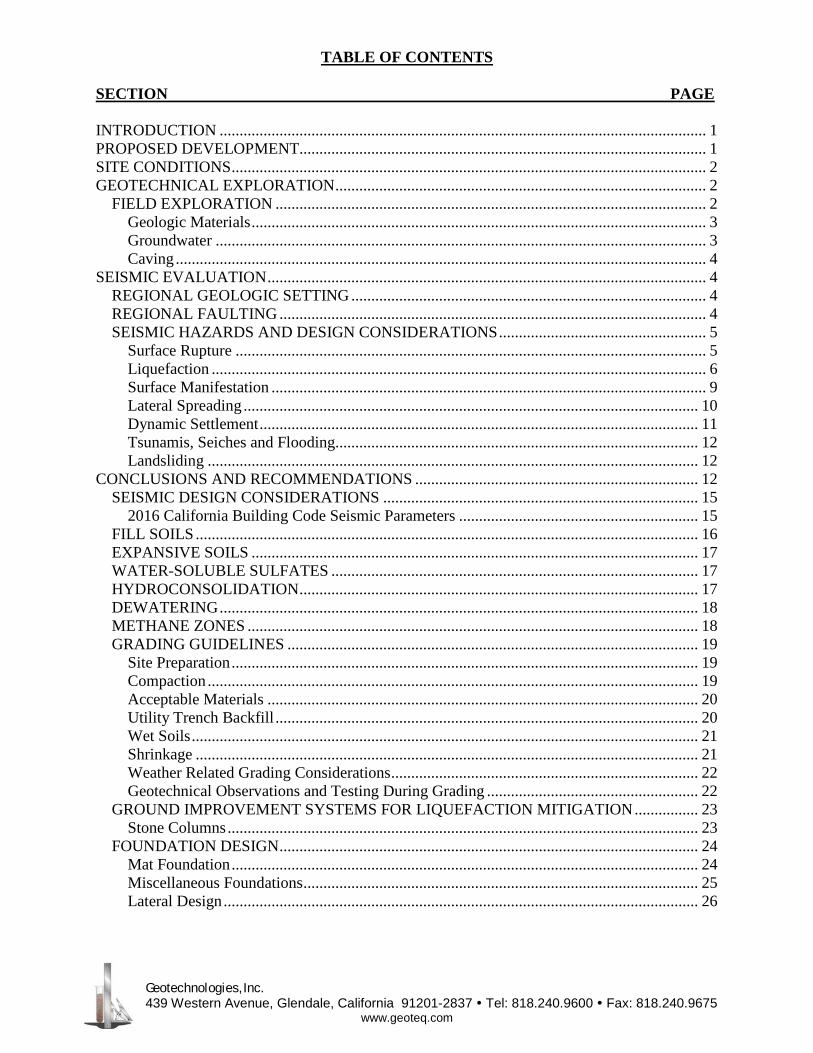
TABLE OF CONTENTS SECTION PAGE
Geotechnologies, Inc. 439 Western Avenue, Glendale, California 91201-2837 Tel: 818.240.9600 Fax: 818.240.9675
www.geoteq.com
INTRODUCTION .......................................................................................................................... 1 PROPOSED DEVELOPMENT...................................................................................................... 1 SITE CONDITIONS ....................................................................................................................... 2 GEOTECHNICAL EXPLORATION ............................................................................................. 2
FIELD EXPLORATION ............................................................................................................ 2 Geologic Materials .................................................................................................................. 3 Groundwater ........................................................................................................................... 3 Caving ..................................................................................................................................... 4
SEISMIC EVALUATION .............................................................................................................. 4 REGIONAL GEOLOGIC SETTING ......................................................................................... 4 REGIONAL FAULTING ........................................................................................................... 4 SEISMIC HAZARDS AND DESIGN CONSIDERATIONS .................................................... 5
Surface Rupture ...................................................................................................................... 5 Liquefaction ............................................................................................................................ 6 Surface Manifestation ............................................................................................................. 9 Lateral Spreading .................................................................................................................. 10 Dynamic Settlement .............................................................................................................. 11 Tsunamis, Seiches and Flooding........................................................................................... 12 Landsliding ........................................................................................................................... 12
CONCLUSIONS AND RECOMMENDATIONS ....................................................................... 12 SEISMIC DESIGN CONSIDERATIONS ............................................................................... 15
2016 California Building Code Seismic Parameters ............................................................ 15 FILL SOILS .............................................................................................................................. 16 EXPANSIVE SOILS ................................................................................................................ 17 WATER-SOLUBLE SULFATES ............................................................................................ 17 HYDROCONSOLIDATION .................................................................................................... 17 DEWATERING ........................................................................................................................ 18 METHANE ZONES ................................................................................................................. 18 GRADING GUIDELINES ....................................................................................................... 19
Site Preparation ..................................................................................................................... 19 Compaction ........................................................................................................................... 19 Acceptable Materials ............................................................................................................ 20 Utility Trench Backfill .......................................................................................................... 20 Wet Soils ............................................................................................................................... 21 Shrinkage .............................................................................................................................. 21 Weather Related Grading Considerations ............................................................................. 22 Geotechnical Observations and Testing During Grading ..................................................... 22
GROUND IMPROVEMENT SYSTEMS FOR LIQUEFACTION MITIGATION ................ 23 Stone Columns ...................................................................................................................... 23
FOUNDATION DESIGN ......................................................................................................... 24 Mat Foundation ..................................................................................................................... 24 Miscellaneous Foundations ................................................................................................... 25 Lateral Design ....................................................................................................................... 26
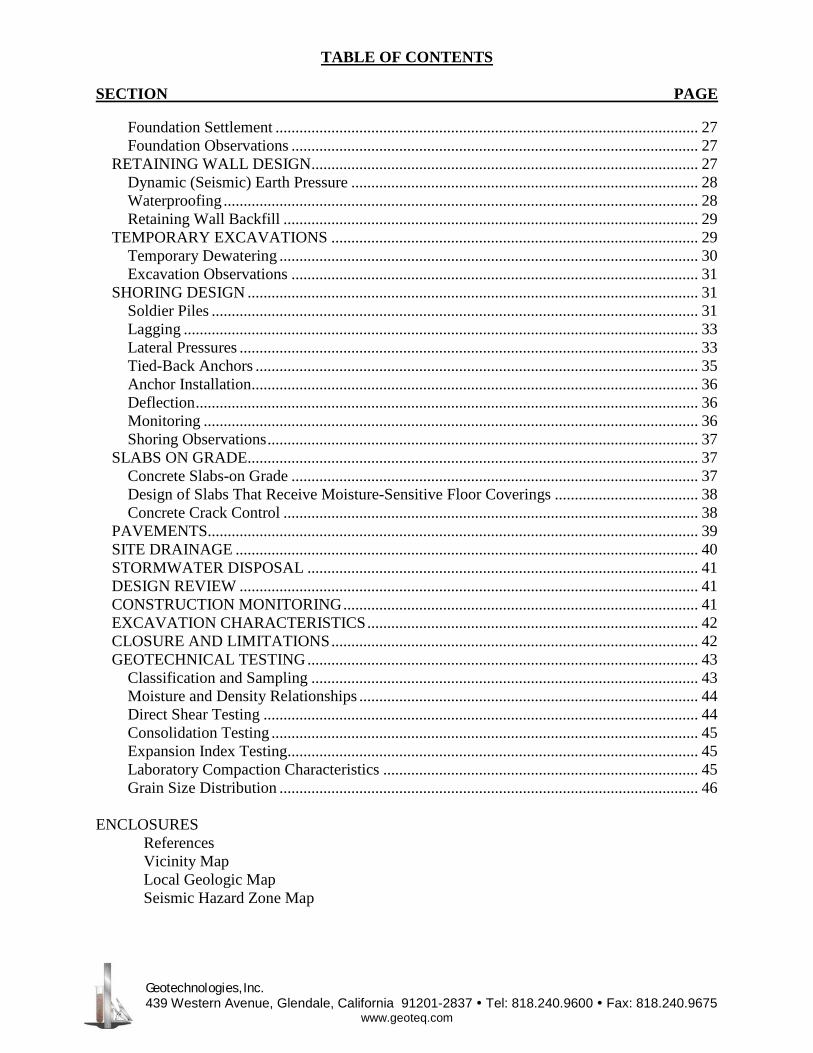
TABLE OF CONTENTS SECTION PAGE
Geotechnologies, Inc. 439 Western Avenue, Glendale, California 91201-2837 Tel: 818.240.9600 Fax: 818.240.9675
www.geoteq.com
Foundation Settlement .......................................................................................................... 27 Foundation Observations ...................................................................................................... 27
RETAINING WALL DESIGN ................................................................................................. 27 Dynamic (Seismic) Earth Pressure ....................................................................................... 28 Waterproofing ....................................................................................................................... 28 Retaining Wall Backfill ........................................................................................................ 29
TEMPORARY EXCAVATIONS ............................................................................................ 29 Temporary Dewatering ......................................................................................................... 30 Excavation Observations ...................................................................................................... 31
SHORING DESIGN ................................................................................................................. 31 Soldier Piles .......................................................................................................................... 31 Lagging ................................................................................................................................. 33 Lateral Pressures ................................................................................................................... 33 Tied-Back Anchors ............................................................................................................... 35 Anchor Installation................................................................................................................ 36 Deflection .............................................................................................................................. 36 Monitoring ............................................................................................................................ 36 Shoring Observations ............................................................................................................ 37
SLABS ON GRADE................................................................................................................. 37 Concrete Slabs-on Grade ...................................................................................................... 37 Design of Slabs That Receive Moisture-Sensitive Floor Coverings .................................... 38 Concrete Crack Control ........................................................................................................ 38
PAVEMENTS........................................................................................................................... 39 SITE DRAINAGE .................................................................................................................... 40 STORMWATER DISPOSAL .................................................................................................. 41 DESIGN REVIEW ................................................................................................................... 41 CONSTRUCTION MONITORING ......................................................................................... 41 EXCAVATION CHARACTERISTICS ................................................................................... 42 CLOSURE AND LIMITATIONS ............................................................................................ 42 GEOTECHNICAL TESTING .................................................................................................. 43
Classification and Sampling ................................................................................................. 43 Moisture and Density Relationships ..................................................................................... 44 Direct Shear Testing ............................................................................................................. 44 Consolidation Testing ........................................................................................................... 45 Expansion Index Testing....................................................................................................... 45 Laboratory Compaction Characteristics ............................................................................... 45 Grain Size Distribution ......................................................................................................... 46
ENCLOSURES
References Vicinity Map Local Geologic Map Seismic Hazard Zone Map
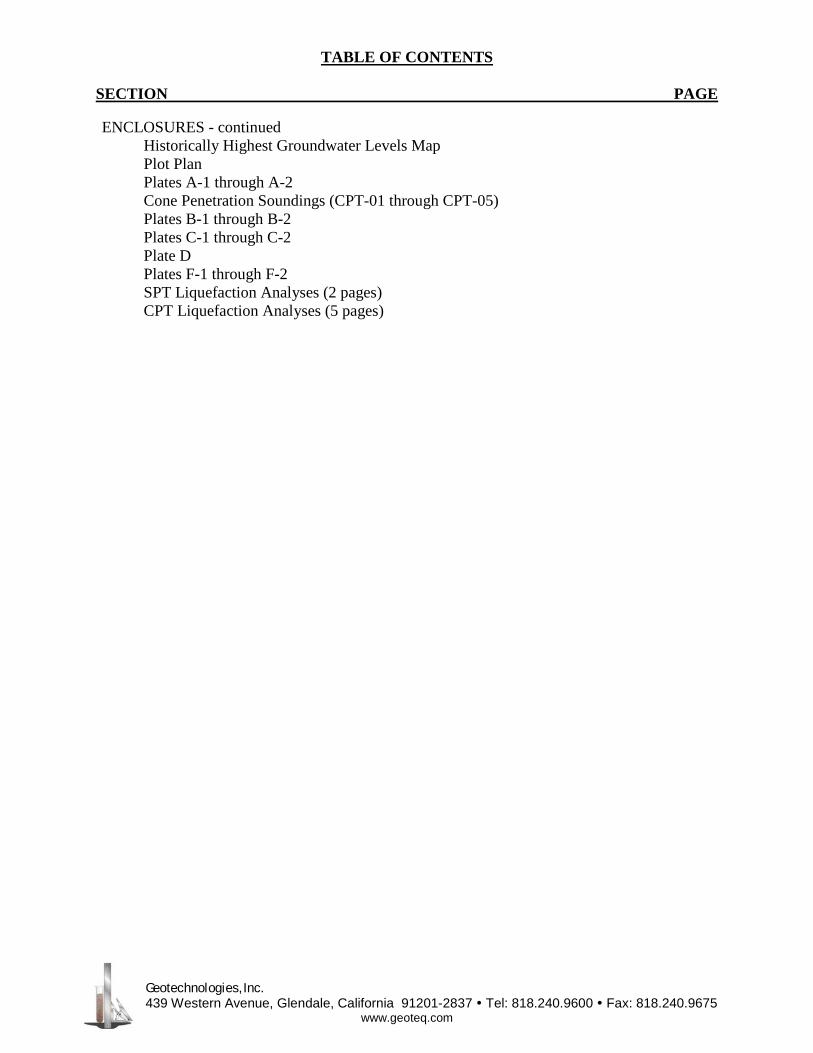
TABLE OF CONTENTS SECTION PAGE
Geotechnologies, Inc. 439 Western Avenue, Glendale, California 91201-2837 Tel: 818.240.9600 Fax: 818.240.9675
www.geoteq.com
ENCLOSURES - continued Historically Highest Groundwater Levels Map Plot Plan Plates A-1 through A-2 Cone Penetration Soundings (CPT-01 through CPT-05) Plates B-1 through B-2 Plates C-1 through C-2 Plate D Plates F-1 through F-2 SPT Liquefaction Analyses (2 pages) CPT Liquefaction Analyses (5 pages)
Geotechnologies, Inc. 439 Western Avenue, Glendale, California 91201-2837 Tel: 818.240.9600 Fax: 818.240.9675
www.geoteq.com
GEOTECHNICAL ENGINEERING INVESTIGATION
PROPOSED HOTEL DEVELOPMENT
11469 JEFFERSON BOULEVARD
CULVER CITY, CALIFORNIA
INTRODUCTION
This report presents the results of the geotechnical engineering investigation performed on the
subject property. The purpose of this investigation was to identify the distribution and
engineering properties of the earth materials underlying the site, and to provide geotechnical
recommendations for the design of the proposed development.
This investigation included excavation of two exploratory borings, performance of five Cone
Penetration Test soundings (CPTs), collection of representative samples, laboratory testing,
engineering analysis, review of published geologic data, review of available geotechnical
engineering information and the preparation of this report. The exploratory excavation locations
are shown on the enclosed Plot Plan. The results of the exploration and the laboratory testing are
presented in the Appendix of this report.
PROPOSED DEVELOPMENT
Information concerning the proposed development was furnished by Nakada+. The site is
proposed to be developed with a five-story, 180-key, boutique hotel. The proposed development
will be constructed over two subterranean parking levels, extending on the order of 20 feet below
the existing site grade. Column loads are estimated to be between 500 and 1,000 kips. Wall
loads are estimated to be between 6 and 8 kips per lineal foot. Grading will consist of
excavations on the order of 25 feet in depth for the proposed subterranean parking levels and
foundation elements.
November 7, 2017 File No. 21494 Page 2
Geotechnologies, Inc. 439 Western Avenue, Glendale, California 91201-2837 Tel: 818.240.9600 Fax: 818.240.9675
www.geoteq.com
Any changes in the design of the project or location of any structure, as outlined in this report,
should be reviewed by this office. The recommendations contained in this report should not be
considered valid until reviewed and modified or reaffirmed, in writing, subsequent to such
review.
SITE CONDITIONS
The property is located at 1469 Jefferson Boulevard, in the City of Culver City, California. The
project site consists of an irregularly shaped lot, and is bounded by an alleyway to the north, by
an adjacent commercial development to the east, by Jefferson Boulevard to the south, and by
Slauson Avenue to the west. The site is currently developed with a one-story shopping center and
surface parking lot.
The site is relatively level with approximately 1 to 2 feet of elevation change. Drainage across
the site is by sheetflow to the area drains and to the city streets. The vegetation on the site
consists of isolated trees and planters. The neighboring development consists primarily of
commercial and residential development.
GEOTECHNICAL EXPLORATION
FIELD EXPLORATION
The site was explored between September 15, 2017, and October 2, 2017, by excavating two
exploratory borings, and performing five Cone Penetration Test Soundings (CPTs). The
exploratory borings were excavated to depths of 70 feet below the existing site grade. The
borings were excavated with the aid of a truck-mounted drilling machine, equipped with an
automatic hammer, and using 8-inch diameter hollowstem augers.
November 7, 2017 File No. 21494 Page 3
Geotechnologies, Inc. 439 Western Avenue, Glendale, California 91201-2837 Tel: 818.240.9600 Fax: 818.240.9675
www.geoteq.com
The CPT soundings were advanced to refusal, which occurred at depths between 32 and 38 feet
below the existing site grade. The exploratory borings and the CPT sounding locations are
shown on the Plot Plan and interpretations of the geologic materials encountered are provided in
the enclosed Boring Logs and CPT Sounding Data Logs in the Appendix.
Geologic Materials
Fill materials underlying the subject site consist of sandy to silty clays, which are dark brown in
color, moist to very moist, medium firm to stiff, fine grained. Fill thickness on the order of 3 feet
was encountered in the exploratory borings.
Native soils consist of younger alluvial deposits to depths between 30 and 35 feet. The younger
alluvial deposits consist primarily of sandy to silty clays, with occasional thin layers of silty and
clayey sands, and sands, which are yellowish brown, and gray to dark gray in color, very moist
to wet, medium firm to medium dense, fine grained.
Older alluvium was generally encountered below a depth of 35 feet. The older alluvium consist
of sands to gravelly sands, which are gray in color, wet, dense to very dense, fine to coarse
grained, with occasional gravel. The native soils consist predominantly of sediments deposited
by river and stream action typical to this area of Los Angeles County. More detailed soil profiles
may be obtained from individual boring and CPT logs presented in the Appendix of this report.
Groundwater
Groundwater was encountered at depths between 24 and 24½ feet below the existing site grade
during exploration. The historically highest groundwater level was established by review of
California Geological Survey Seismic Hazard Zone Report of the Venice Quadrangle. Review
of this report indicates that the historically highest groundwater level is on the order of 10 feet
below the existing site grade.

November 7, 2017 File No. 21494 Page 4
Geotechnologies, Inc. 439 Western Avenue, Glendale, California 91201-2837 Tel: 818.240.9600 Fax: 818.240.9675
www.geoteq.com
Fluctuations in the level of groundwater may occur due to variations in rainfall, temperature, and
other factors not evident at the time of the measurements reported herein. Fluctuations also may
occur across the site. High groundwater levels can result in changed conditions.
Caving
Caving could not be directly observed during exploration due to the type of excavation
equipment utilized. Based on the experience of this firm, large diameter excavations,
excavations that encounter granular, cohesionless soils and excavations below the groundwater
table will most likely experience caving.
SEISMIC EVALUATION
REGIONAL GEOLOGIC SETTING
The subject property is located in the northern portion of the Peninsular Ranges Geomorphic
Province. The Peninsular Ranges are characterized by northwest-trending blocks of mountain
ridges and sediment-floored valleys. The dominant geologic structural features are northwest
trending fault zones that either die out to the northwest or terminate at east-trending reverse
faults that form the southern margin of the Transverse Ranges.
REGIONAL FAULTING
Based on criteria established by the California Division of Mines and Geology (CDMG) now
called California Geologic Survey (CGS), faults may be categorized as active, potentially active,
or inactive. Active faults are those which show evidence of surface displacement within the last
11,000 years (Holocene-age). Potentially-active faults are those that show evidence of most
recent surface displacement within the last 1.6 million years (Quaternary-age). Faults showing
no evidence of surface displacement within the last 1.6 million years are considered inactive for
most purposes, with the exception of design of some critical structures.

November 7, 2017 File No. 21494 Page 5
Geotechnologies, Inc. 439 Western Avenue, Glendale, California 91201-2837 Tel: 818.240.9600 Fax: 818.240.9675
www.geoteq.com
Buried thrust faults are faults without a surface expression but are a significant source of seismic
activity. They are typically broadly defined based on the analysis of seismic wave recordings of
hundreds of small and large earthquakes in the southern California area. Due to the buried
nature of these thrust faults, their existence is usually not known until they produce an
earthquake. The risk for surface rupture potential of these buried thrust faults is inferred to be
low (Leighton, 1990). However, the seismic risk of these buried structures in terms of
recurrence and maximum potential magnitude is not well established. Therefore, the potential
for surface rupture on these surface-verging splays at magnitudes higher than 6.0 cannot be
precluded.
SEISMIC HAZARDS AND DESIGN CONSIDERATIONS
The primary geologic hazard at the site is moderate to strong ground motion (acceleration)
caused by an earthquake on any of the local or regional faults. The potential for other
earthquake-induced hazards was also evaluated including surface rupture, liquefaction, dynamic
settlement, inundation and landsliding.
Surface Rupture
In 1972, the Alquist-Priolo Special Studies Zones Act (now known as the Alquist-Priolo
Earthquake Fault Zoning Act) was passed into law. The Act defines “active” and “potentially
active” faults utilizing the same aging criteria as that used by California Geological Survey
(CGS). However, established state policy has been to zone only those faults which have direct
evidence of movement within the last 11,000 years. It is this recency of fault movement that the
CGS considers as a characteristic for faults that have a relatively high potential for ground
rupture in the future.
CGS policy is to delineate a boundary from 200 to 500 feet wide on each side of the known fault
trace based on the location precision, the complexity, or the regional significance of the fault. If
November 7, 2017 File No. 21494 Page 6
Geotechnologies, Inc. 439 Western Avenue, Glendale, California 91201-2837 Tel: 818.240.9600 Fax: 818.240.9675
www.geoteq.com
a site lies within an Earthquake Fault Zone, a geologic fault rupture investigation must be
performed that demonstrates that the proposed building site is not threatened by surface
displacement from the fault before development permits may be issued.
Ground rupture is defined as surface displacement which occurs along the surface trace of the
causative fault during an earthquake. Based on research of available literature and results of site
reconnaissance, no known active faults, or potentially active faults underlie the subject site. In
addition, the subject site is not located within an Alquist-Priolo Earthquake Fault Zone. Based
on these considerations, the potential for surface ground rupture at the subject site is considered
low.
Liquefaction
Liquefaction is a phenomenon in which saturated silty to cohesionless soils below the
groundwater table are subject to a temporary loss of strength due to the buildup of excess pore
pressure during cyclic loading conditions such as those induced by an earthquake. Liquefaction-
related effects include loss of bearing strength, amplified ground oscillations, lateral spreading,
and flow failures.
The Seismic Hazards Maps of the State of California (CDMG, 1999), classifies the site as part of
the potentially “Liquefiable” area. This determination is based on groundwater depth records,
soil type and distance to a fault capable of producing a substantial earthquake.
Site-specific liquefaction analyses were performed following the Recommended Procedures for
Implementation of the California Geologic Survey Special Publication 117A, Guidelines for
Analyzing and Mitigating Seismic Hazards in California (CGS, 2008), and the EERI Monograph
(MNO-12) by Idriss and Boulanger (2008).

November 7, 2017 File No. 21494 Page 7
Geotechnologies, Inc. 439 Western Avenue, Glendale, California 91201-2837 Tel: 818.240.9600 Fax: 818.240.9675
www.geoteq.com
Liquefaction analyses were performed utilizing the Standard Penetration Test data and the
laboratory testing of the soils samples collected from the exploratory borings, and supplemented
by the Cone Penetration Test (CPT) soundings data. CPT Sounding Number 1 was performed
adjacent to Boring Number 1 for the purpose of comparison and correlation of soil data.
The enclosed SPT liquefaction analyses were performed using a spreadsheet developed based on
Idriss and Boulanger (2008). This semi-empirical method is based on a correlation between
measured values of Standard Penetration Test (SPT) resistance and field performance data.
The Cone Penetration Test data was analyzed utilizing a spreadsheet program developed based
on the published article, “Evaluating Cyclic Liquefaction Potential Using the Cone Penetration
Test” (P.K. Robertson and C.E. Wride, 1998), to estimate the grain size characteristics directly
from the CPT data and to incorporate the interpreted results into evaluating the resistance to
cyclic loading.
The peak ground acceleration (PGAM) and modal magnitude were obtained from the USGS
websites, using the Probabilistic Seismic Hazard Deaggregation program (USGS, 2008) and the
U.S. Seismic Design Maps tool (USGS, 2013). A modal magnitude (MW) of 6.8 is obtained
using the USGS Probabilistic Seismic Hazard Deaggregation program (USGS, 2008). A peak
ground acceleration of 0.65g was obtained using the U.S. Seismic Design Maps tool. These
ground motion parameters are used in the enclosed liquefaction analyses.
Groundwater was encountered at depths between 24 and 24½ feet below the existing site grade
during exploration. According to the Seismic Hazard Zone Report of the Venice 7½-Minute
Quadrangle (CDMG, 1998, Revised 2006), the historic-high groundwater level for the site was
10 feet below the ground surface. The historic highest groundwater level was conservatively
utilized for the enclosed liquefaction analysis.

November 7, 2017 File No. 21494 Page 8
Geotechnologies, Inc. 439 Western Avenue, Glendale, California 91201-2837 Tel: 818.240.9600 Fax: 818.240.9675
www.geoteq.com
The enclosed SPT liquefaction analyses were performed based on blowcount data collected from
borings, B1 and B2. Standard Penetration Test (SPT) data were collected at 5-foot intervals for
these two borings. Alternating California Modified Ring Samples were collected in between the
SPT data in order to collect relatively undisturbed soil samples for testing and analyses. Samples
of the collected materials were conveyed to the laboratory for testing and analysis. Fines content,
as defined by percentage passing the #200 sieve, were utilized for the fines correction factor in
computing the corrected blowcount. In addition, Atterberg Limit tests were performed for the
underlying samples and the results are presented in Plates F-1 and F-2 of this report.
According to the SP117A (which referenced papers by Bray and Sancio, 2006), soils having a
Plastic Index greater than 18, or a moisture content not greater than 80% of the liquid limit, are
considered to be not susceptible to liquefaction. Therefore, where the results of Atterberg Limits
testing showed a Plastic Index greater than 18, the soils would be considered non-liquefiable, and
the analysis of these clayey soil layers was turned off in the liquefaction susceptibility column.
The enclosed SPT liquefaction analyses indicate that the underlying soils would not be
considered liquefiable. However, it should be noted, due to the inherent limitation of the
borehole sampling methodology (which the SPT blowcount data were collected at 5-foot
intervals), numerous thin, granular, liquefiable layers could be mischaracterized or missed by the
sampling procedure. Therefore, it is the opinion of this firm that the CPT liquefaction analyses
would provide a more accurate liquefaction assessment of the site.
Liquefaction analyses were also performed using the data from the five CPT soundings. One of
the advantages of the Cone Penetration Test (CPT) is its repeatability and reliability, and its
ability to provide a relatively continuous profiling of the underlying soils. The CPT method is
extremely helpful especially in highly stratified soil conditions. Based on correlations between
cone tip resistance and friction ratio, the CPT liquefaction analyses indicate that factor of safeties
of thin cohesionless soil layers underlying the site are below 1.0, and are, therefore, considered
to be potentially liquefiable. A summary of the liquefaction analyses is presented in the
“Dynamic Settlement” section below.
November 7, 2017 File No. 21494 Page 9
Geotechnologies, Inc. 439 Western Avenue, Glendale, California 91201-2837 Tel: 818.240.9600 Fax: 818.240.9675
www.geoteq.com
Surface Manifestation
It has been shown in recent studies by O’Rourke and Pease (1997) and Youd and Garris (1995),
building upon work by Ishihara (1985), that the visible effects of liquefaction on the ground
surface are only manifested if the relative and absolute thicknesses of liquefiable soils to
overlying non-liquefiable surface material fall within a certain range.
The study by Ishihara (1985) presents data from three separate earthquakes where subsurface
information was available regarding the absolute and relative thicknesses of liquefiable earth
materials and overlying non-liquefiable materials. Information was obtained from sites where
the surface effects of liquefaction were observed, and from sites where there were no visible
surface effects. From this data, Ishihara (1985) graphs the liquefiable soil thickness vs. the
overlying non-liquefiable thickness, and presents bounds identifying a zone within which surface
effects of liquefaction were observed.
Youd and Garris (1995) build upon the work by Ishihara (1985), compiling data from 308
borings taken at sites shaken by 15 different earthquakes, ranging in magnitude from 5.3 to 8.0.
They find that the boundaries presented by Ishihara relating the thicknesses of non-liquefiable
surface layers to underlying potentially liquefiable layers remain valid for this extensive set of
data, with very few exceptions. The particular site conditions which contributed to the few
exceptional cases are not present on the subject site.
O’Rourke and Pease (1997) also compare the liquefiable versus non-liquefiable thickness bounds
initially proposed by Ishihara (1985) with data obtained from areas of San Francisco where the
surface effects of liquefaction were observed during the 1989 Loma Prieta earthquake. They
find general agreement with the previous findings of Ishihara (1985) and Youd and Garris
(1995).
November 7, 2017 File No. 21494 Page 10
Geotechnologies, Inc. 439 Western Avenue, Glendale, California 91201-2837 Tel: 818.240.9600 Fax: 818.240.9675
www.geoteq.com
On the subject site, given the relatively thin stratified, potentially liquefiable layers, the relative
thicknesses of liquefiable soils to overlying non-liquefiable surface material fall outside the
bounds within which surface effects of liquefaction have been observed during past earthquakes.
Furthermore, the proposed development will be constructed over 2 subterranean levels extending
on the order of 25 feet below the existing site grade. In addition, it is the recommendation of this
firm that ground improvements be utilized for liquefaction mitigation and densification of the
underlying soils below the proposed structure. As a result, the likelihood that surface effects of
liquefaction would occur on the subject site would be considered very low to non-existent.
Lateral Spreading
Lateral spreading is the most pervasive type of liquefaction-induced ground failure. During
lateral spread, blocks of mostly intact, surficial soil displace downslope or towards a free face
along a shear zone that has formed within the liquefied sediment. According to the procedure
provided by Bartlett, Hansen, and Youd, “Revised Multilinear Regression Equations for
Prediction of Lateral Spread Displacement”, ASCE, Journal of Geotechnical Engineering, Vol.
128, No. 12, December 2002, when the saturated cohesionless sediments with (N1)60 > 15,
significant displacement is not likely for M < 8 earthquakes.
The proposed development will be constructed over 2 subterranean levels extending on the order
of 25 feet below the existing site grade. In addition, it is the recommendation of this firm that
ground improvements be utilized for liquefaction mitigation and densification of the underlying
soils below the proposed structure. Therefore, the potential for lateral spread is considered to be
remote for the subject site.
November 7, 2017 File No. 21494 Page 11
Geotechnologies, Inc. 439 Western Avenue, Glendale, California 91201-2837 Tel: 818.240.9600 Fax: 818.240.9675
www.geoteq.com
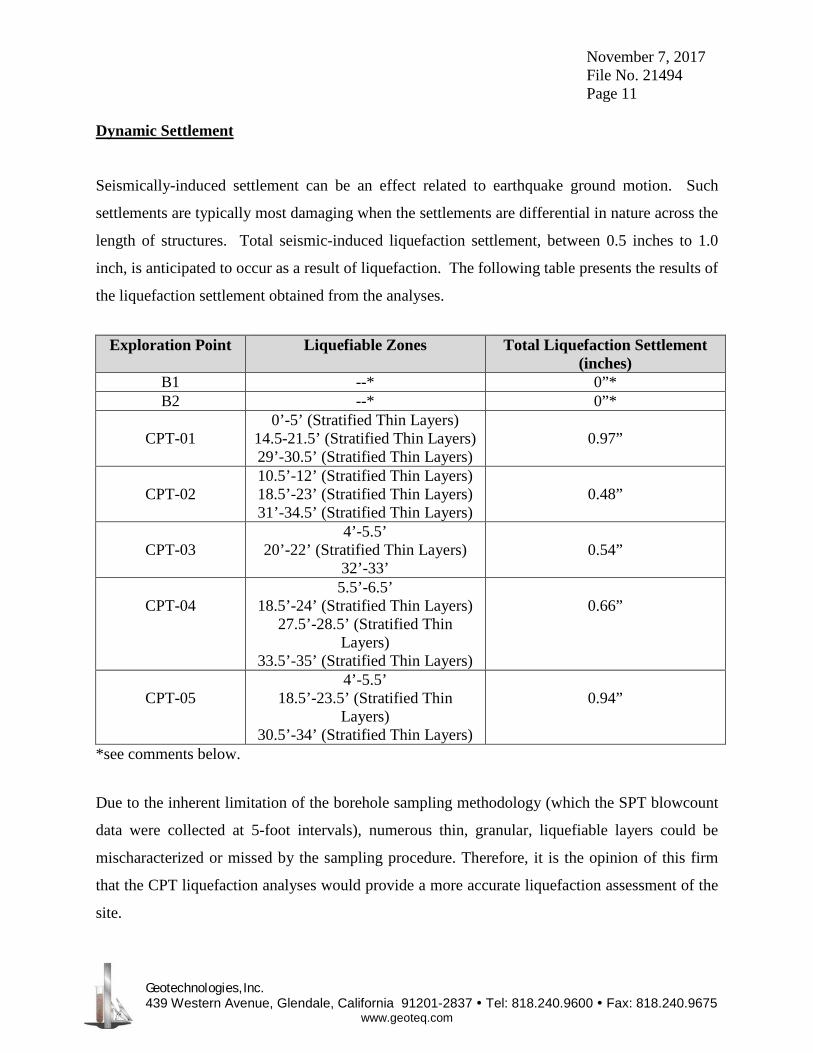
Dynamic Settlement
Seismically-induced settlement can be an effect related to earthquake ground motion. Such
settlements are typically most damaging when the settlements are differential in nature across the
length of structures. Total seismic-induced liquefaction settlement, between 0.5 inches to 1.0
inch, is anticipated to occur as a result of liquefaction. The following table presents the results of
the liquefaction settlement obtained from the analyses.
Exploration Point Liquefiable Zones Total Liquefaction Settlement
(inches) B1 --* 0”* B2 --* 0”*
CPT-01
0’-5’ (Stratified Thin Layers) 14.5-21.5’ (Stratified Thin Layers) 29’-30.5’ (Stratified Thin Layers)
0.97”
CPT-02
10.5’-12’ (Stratified Thin Layers) 18.5’-23’ (Stratified Thin Layers) 31’-34.5’ (Stratified Thin Layers)
0.48”
CPT-03
4’-5.5’ 20’-22’ (Stratified Thin Layers)
32’-33’
0.54”
CPT-04
5.5’-6.5’ 18.5’-24’ (Stratified Thin Layers)
27.5’-28.5’ (Stratified Thin Layers)
33.5’-35’ (Stratified Thin Layers)
0.66”
CPT-05
4’-5.5’ 18.5’-23.5’ (Stratified Thin
Layers) 30.5’-34’ (Stratified Thin Layers)
0.94”
*see comments below.
Due to the inherent limitation of the borehole sampling methodology (which the SPT blowcount
data were collected at 5-foot intervals), numerous thin, granular, liquefiable layers could be
mischaracterized or missed by the sampling procedure. Therefore, it is the opinion of this firm
that the CPT liquefaction analyses would provide a more accurate liquefaction assessment of the
site.
November 7, 2017 File No. 21494 Page 12
Geotechnologies, Inc. 439 Western Avenue, Glendale, California 91201-2837 Tel: 818.240.9600 Fax: 818.240.9675
www.geoteq.com
Tsunamis, Seiches and Flooding
Tsunamis are large ocean waves generated by sudden water displacement caused by a submarine
earthquake, landslide, or volcanic eruption. Review of the County of Los Angeles Flood and
Inundation Hazards Map, Leighton (1990), indicates the site does not lie within the mapped
tsunami inundation boundaries.
Seiches are oscillations generated in enclosed bodies of water which can be caused by ground
shaking associated with an earthquake. No major water-retaining structures are located
immediately up gradient from the project site. Therefore, the risk of flooding from a seismically-
induced seiche is considered to be remote.
According to the County of Los Angeles General Plan, the site is within the potential inundation
boundary of several upgradient reservoirs, should any of the dams retaining these reservoirs fail
during a major earthquake. A determination of whether a higher site elevation would remove the
site from the potential inundation zones is beyond the scope of this investigation.
Landsliding
The probability of seismically-induced landslides occurring on the site is considered to be low
due to the general lack of elevation difference slope geometry across or adjacent to the site.
CONCLUSIONS AND RECOMMENDATIONS
Based upon the exploration, laboratory testing, and research, it is the finding of Geotechnologies,
Inc. that construction of the proposed hotel is considered feasible from a geotechnical
engineering standpoint provided the advice and recommendations presented herein are followed
and implemented during construction.
November 7, 2017 File No. 21494 Page 13
Geotechnologies, Inc. 439 Western Avenue, Glendale, California 91201-2837 Tel: 818.240.9600 Fax: 818.240.9675
www.geoteq.com
Approximately 3 feet of existing fill materials was encountered in the exploratory borings.
Groundwater was encountered at depths between 24 to 24½ feet below the existing site grade
during exploration. The upper native soils consist of younger alluvial deposits to approximate
depths between 32½ and 35 feet. The younger alluvial deposits comprise primarily of highly
expansive clay soils with thin stratified layers of medium dense silty sands to sands. Based on
the enclosed liquefaction analyses, these thin granular younger alluvial deposits vary between 2
and 24 inches in thickness, and are subject to liquefaction during the MCE level ground motion
with estimated total seismic settlement between 0.5 to 1.0 inches. Very dense Older Alluvium
was encountered generally below a depth of 35 feet below the existing site grade. The Older
Alluvium consists of gravelly sands and sands with cobbles, and is not considered to be
liquefiable.
The proposed structure will be constructed over 2 subterranean levels, extending on the order of
25 feet below the existing site grade. It is anticipated that excavation of the proposed
subterranean levels will remove some of the potentially liquefiable layers. However, some of the
thin potentially liquefiable layers will remain immediately below the base of the proposed
structure. These thin liquefiable layers will experience loss of bearing strength during a major
seismic event, and will adversely impact the structure supported thereon. In addition, highly
saturated and soft clay soils are expected to be exposed at the base of the structure.
Due to the liquefaction potential of the younger alluvial deposits and the highly saturated nature
of the underlying clay soils, it is the recommended that ground improvement methods (such as
stone columns) be employed to mitigate the effects of liquefaction and to improve the underlying
soft and saturated soils for support of the proposed foundation system.
These ground improvements are designed and installed by design-build foundation contractors,
specializing and experienced with these mitigation methods. The design of the ground
improvement mitigation method will be an iterative process between the ground improvement
specialty contractor, the geotechnical engineer, and the structural engineer. The specialty

November 7, 2017 File No. 21494 Page 14
Geotechnologies, Inc. 439 Western Avenue, Glendale, California 91201-2837 Tel: 818.240.9600 Fax: 818.240.9675
www.geoteq.com
contractor shall provide material requirements, preliminary spacing, and other design
information.
For performance and design purposes, it is recommended that the proposed ground
improvements be installed to a minimum depth of 35 feet below the existing site grade,
extending into the underlying dense Older Alluvium. In addition, the proposed ground
improvements shall be designed to reduce the total settlement (static and seismic) to 1½ inches.
Since the proposed structure will be supported uniformly on the stone columns, the static
differential settlement is expected to be negligible. For structural design purposes, total
differential settlement (static and seismic) on the order of ½ inch may be utilized.
According to the Seismic Hazard Zone Report of the Venice 7½-Minute Quadrangle (CDMG,
1998, Revised 2006), the historically highest groundwater level for the site is on the order of 10
feet below the ground surface. Since the proposed subterranean levels will extend below the
historically highest groundwater level, it is recommended that the proposed structure be designed
for hydrostatic pressure and be supported on a mat foundation, subsequent to installation of the
stone columns. The proposed mat foundation shall be designed for hydrostatic uplift pressure
based on the historically highest groundwater level. In addition, the proposed subterranean walls
shall be designed for full hydrostatic pressure based on the ground surface.
Excavation of the proposed subterranean level will require shoring and dewatering measures to
provide a stable and dry excavation due to the depth of the excavation, the presence of
groundwater, and the proximity of adjacent structures or public right of ways.
Foundations for small outlying at-grade structures, such as property line walls, canopies, and
trash enclosures, which will not be tied-in to the proposed structure, may be supported on
conventional foundations bearing in properly compacted fill. Due to the liquefaction potential,
miscellaneous structures not supported by ground improvement systems will most likely be
damaged and will require repair or replacement.
November 7, 2017 File No. 21494 Page 15
Geotechnologies, Inc. 439 Western Avenue, Glendale, California 91201-2837 Tel: 818.240.9600 Fax: 818.240.9675
www.geoteq.com
Stormwater disposal at the site is not considered feasible due to the high groundwater level and
the depth of the proposed subterranean levels.
It is recommended all utilities, servicing the proposed structure, shall have flexible connections
to accommodate up to 1½ inches of lateral and vertical displacement in the event of a major
seismic event.
The validity of the conclusions and design recommendations presented herein is dependent upon
review of the geotechnical aspects of the proposed construction by this firm. The subsurface
conditions described herein have been projected from borings on the site as indicated and should
in no way be construed to reflect any variations which may occur between these borings or
which may result from changes in subsurface conditions. Any changes in the design or location
of any structure, as outlined in this report, should be reviewed by this office. The
recommendations contained herein should not be considered valid until reviewed and modified
or reaffirmed subsequent to such review.
SEISMIC DESIGN CONSIDERATIONS
2016 California Building Code Seismic Parameters
According to Table 20.3-1 presented in ASCE 7-10, the subject site is classified as Site Class F
due to the liquefiable nature of the underlying soils. According to Section 20.3.1 (site class
definition for Site Class F) found in Chapter 20, titled “Site Classification Procedure for Seismic
Design”, ASCE 7-10, Minimum Design Loads for Buildings and Other Structures, an exception
is provided under Site Classification F.
EXCEPTION: For structures having fundamental periods of vibration equal to or less than 0.5 s, site-response analysis is not required to determine spectral accelerations for liquefiable soils. Rather, a site class is may be determined in accordance with Section 20.3 and the corresponding values of Fa and Fv determined from Tables 11.4-1 and 11.4-2. (This can be C, D or E)

November 7, 2017 File No. 21494 Page 16
Geotechnologies, Inc. 439 Western Avenue, Glendale, California 91201-2837 Tel: 818.240.9600 Fax: 818.240.9675
www.geoteq.com
The proposed structure will be 5 stories in height. Based on preliminary discussion with the
project structural engineer, the fundamental period of vibration of the structure will be equal or
less than 0.5 second. In addition, the underlying liquefiable layers will be mitigated by the
recommended stone columns. Therefore, subsequent to the installation of the ground
improvements, it is the opinion of this firm that the subject site may be classified as Site Class D,
which corresponds to a “Stiff Soil” Profile, in accordance with the ASCE 7 standard.)
2016 CALIFORNIA BUILDING CODE SEISMIC PARAMETERS
Site Class D
Mapped Spectral Acceleration at Short Periods (SS) 1.806g
Site Coefficient (Fa) 1.0
Maximum Considered Earthquake Spectral Response for Short Periods (SMS)
1.806g
Five-Percent Damped Design Spectral Response Acceleration at Short Periods (SDS)
1.204g
Mapped Spectral Acceleration at One-Second Period (S1) 0.658g
Site Coefficient (Fv) 1.5
Maximum Considered Earthquake Spectral Response for One-Second Period (SM1)
0.988g
Five-Percent Damped Design Spectral Response Acceleration for One-Second Period (SD1)
0.658g
FILL SOILS
The maximum depth of fill encountered during site exploration was 3 feet. This material and
any fill generated during demolition should be removed during the excavation of the
subterranean levels and wasted from the site.
November 7, 2017 File No. 21494 Page 17
Geotechnologies, Inc. 439 Western Avenue, Glendale, California 91201-2837 Tel: 818.240.9600 Fax: 818.240.9675
www.geoteq.com
EXPANSIVE SOILS
The onsite geologic materials are in the moderate to high expansion range. The Expansion Index
was found to be between 58 and 90 for bulk samples remolded to 90 percent of the laboratory
maximum density. Recommended reinforcing is noted in the “Slabs on Grade" section of this
report.
WATER-SOLUBLE SULFATES
The Portland cement portion of concrete is subject to attack when exposed to water-soluble
sulfates. Usually the two most common sources of exposure are from soil and marine
environments. The source of natural sulfate minerals in soils includes the sulfates of calcium,
magnesium, sodium, and potassium. When these minerals interact and dissolve in subsurface
water, a sulfate concentration is created, which will react with exposed concrete. Over time
sulfate attack will destroy improperly proportioned concrete well before the end of its intended
service life.
The water-soluble sulfate content of the onsite geologic materials was tested by California Test
417. The water-soluble sulfate content was determined to be between 0.2 and 2.0 percent by
weight for the soils tested. Based on American Concrete Institute (ACI) Standard 318-08, the
sulfate exposure is considered to be severe for geologic materials within this range, and Type V
cement, with a maximum water-cement ratio of 0.45 and a minimum compressive strength of
4,500 psi, shall be utilized for concrete in contact with the site soils.
HYDROCONSOLIDATION
Hydroconsolidation is a phenomenon in which the underlying soils collapse when wetted.
Hydroconsolidation could potentially result in significant foundation movements, over a long
period of time of wetting.

November 7, 2017 File No. 21494 Page 18
Geotechnologies, Inc. 439 Western Avenue, Glendale, California 91201-2837 Tel: 818.240.9600 Fax: 818.240.9675
www.geoteq.com
The underlying native soils are very dense, and contain abundant slate fragments. Soil samples
collected from the underlying native soils are subject to a very minor degree of
hydroconsolidation strains, on the order of 0 to 0.1 percent. The property owner shall maintain
proper drainage of the subject site throughout the life of the structure. All utility and irrigation
lines and drainage devices should be checked periodically and maintained. In addition,
landscape irrigation should be properly controlled, in order to reduce the amount of water
infiltration into the underlying soils, which provide support to the proposed structure. The Site
Drainage section below should be followed and implemented into the final construction
documents.
DEWATERING
Groundwater was encountered at depths between 24 to 24½ feet below the existing site grade
during exploration. According to the Seismic Hazard Zone Report of the Venice 7½-Minute
Quadrangle (CDMG, 1998, Revised 2006), the historically highest groundwater level for the site
is on the order of 10 feet below the ground surface. Since the proposed subterranean levels will
extend below the historically highest groundwater level, it is recommended that the proposed
structure be designed for hydrostatic pressure and be supported on a mat foundation, subsequent
to installation of the stone columns. Therefore, installation of a permanent dewatering system is
not required if the proposed structure is structurally designed for the hydrostatic pressure.
METHANE ZONES
Based on review of the Navigate LA (http://navigatela.lacity.org/NavigateLA/) website,
maintained by the City of Los Angeles, the subject property is located within a Methane Buffer
Zone as designated by the City of Los Angeles. A qualified methane consultant should be
retained to consider the potential methane impact and requirements of the City of Los Angeles’s
Methane Buffer Zone designation.
November 7, 2017 File No. 21494 Page 19
Geotechnologies, Inc. 439 Western Avenue, Glendale, California 91201-2837 Tel: 818.240.9600 Fax: 818.240.9675
www.geoteq.com
GRADING GUIDELINES
The following grading guidelines may be utilized for any miscellaneous site grading which may
be required as part of the proposed development.
Site Preparation
A thorough search should be made for possible underground utilities and/or structures. Any existing or abandoned utilities or structures located within the footprint of the proposed grading should be removed or relocated as appropriate.
All vegetation, existing fill, and soft or disturbed geologic materials should be removed
from the areas to receive controlled fill. All existing fill materials and any disturbed geologic materials resulting from grading operations shall be completely removed and properly recompacted prior to foundation excavation.
Any vegetation or associated root system located within the footprint of the proposed
structures should be removed during grading.
Subsequent to the indicated removals, the exposed grade shall be scarified to a depth of six inches, moistened to optimum moisture content, and recompacted in excess of the minimum required comparative density.
The excavated areas shall be observed by the geotechnical engineer prior to placing
compacted fill.
Compaction
All fill should be mechanically compacted in layers not more than 8 inches thick. All fill shall
be compacted to at least 90 percent of the maximum laboratory density for the materials used.
The maximum density shall be determined by the laboratory operated by Geotechnologies, Inc.
using the test method described in the most recent revision of ASTM D 1557.
November 7, 2017 File No. 21494 Page 20
Geotechnologies, Inc. 439 Western Avenue, Glendale, California 91201-2837 Tel: 818.240.9600 Fax: 818.240.9675
www.geoteq.com
Field observation and testing shall be performed by a representative of the geotechnical engineer
during grading to assist the contractor in obtaining the required degree of compaction and the
proper moisture content. Where compaction is less than required, additional compactive effort
shall be made with adjustment of the moisture content, as necessary, until a minimum of 90
percent compaction is obtained.
Acceptable Materials
The excavated onsite materials are considered satisfactory for reuse in the controlled fills as long
as any debris and/or organic matter is removed. Any imported materials shall be observed and
tested by the representative of the geotechnical engineer prior to use in fill areas. Imported
materials should contain sufficient fines so as to be relatively impermeable and result in a stable
subgrade when compacted. Any required import materials should consist of geologic materials
with an expansion index of less than 50. The water-soluble sulfate content of the import
materials should be less than 0.1% percentage by weight.
Imported materials should be free from chemical or organic substances which could affect the
proposed development. A competent professional should be retained in order to test imported
materials and address environmental issues and organic substances which might affect the
proposed development.
Utility Trench Backfill
Utility trenches should be backfilled with controlled fill. The utility should be bedded with clean
sands at least one foot over the crown. The remainder of the backfill may be onsite soil
compacted to 90 percent of the laboratory maximum density. Utility trench backfill should be
tested by representatives of this firm in accordance with the most recent revision of ASTM D-
1557.

November 7, 2017 File No. 21494 Page 21
Geotechnologies, Inc. 439 Western Avenue, Glendale, California 91201-2837 Tel: 818.240.9600 Fax: 818.240.9675
www.geoteq.com
Wet Soils
At the time of exploration, the soils which will be exposed during excavation and at the bottom
of the excavation were well above optimum moisture content. It is anticipated that the excavated
material to be placed as compacted fill, and the materials exposed at the bottom of excavated
plane will require significant drying and aeration prior to recompaction.
Pumping (yielding or vertical deflection) of the high-moisture content soils at the bottom of the
excavation is expected to occur during operation of heavy equipment. Where pumping is
encountered, angular minimum 1 to 3-inch crushed rocks should be placed and worked into the
subgrade. The exact thickness of the gravel would be a trial and error procedure, and would be
determined in the field. It would likely be on the order of 1 to 2 feet thick.
The crushed rocks will help to densify the subgrade as well as function as a stabilization material
upon which heavy equipment may operate. It is not recommended that rubber tire construction
equipment attempt to operate directly on the pumping subgrade soils prior to placing the gravel.
Direct operation of rubber tire equipment on the soft subgrade soils will likely result in excessive
disturbance to the soils, and will result in a delay to the construction schedule since those
disturbed soils would then have to be removed and properly recompacted. Extreme care should
be utilized to place gravel as the subgrade becomes exposed.
Shrinkage
Shrinkage results when a volume of soil removed at one density is compacted to a higher
density. A shrinkage factor between 5 and 15 percent should be anticipated when excavating and
recompacting the existing fill and underlying native geologic materials on the site to an average
comparative compaction of 92 percent.

November 7, 2017 File No. 21494 Page 22
Geotechnologies, Inc. 439 Western Avenue, Glendale, California 91201-2837 Tel: 818.240.9600 Fax: 818.240.9675
www.geoteq.com
Weather Related Grading Considerations
When rain is forecast all fill that has been spread and awaits compaction shall be properly
compacted prior to stopping work for the day or prior to stopping due to inclement weather.
These fills, once compacted, shall have the surface sloped to drain to an area where water can be
removed.
Temporary drainage devices should be installed to collect and transfer excess water to the street
in non-erosive drainage devices. Drainage should not be allowed to pond anywhere on the site,
and especially not against any foundation or retaining wall. Drainage should not be allowed to
flow uncontrolled over any descending slope.
Work may start again, after a period of rainfall, once the site has been reviewed by a
representative of this office. Any soils saturated by the rain shall be removed and aerated so that
the moisture content will fall within three percent of the optimum moisture content.
Surface materials previously compacted before the rain shall be scarified, brought to the proper
moisture content and recompacted prior to placing additional fill, if considered necessary by a
representative of this firm.
Geotechnical Observations and Testing During Grading
Geotechnical observations and testing during grading are considered to be a continuation of the
geotechnical investigation. It is critical that the geotechnical aspects of the project be reviewed
by representatives of Geotechnologies, Inc. during the construction process. Compliance with
the design concepts, specifications or recommendations during construction requires review by
this firm during the course of construction. Any fill which is placed should be observed, tested,
and verified if used for engineered purposes. Please advise this office at least twenty-four hours
prior to any required site visit.

November 7, 2017 File No. 21494 Page 23
Geotechnologies, Inc. 439 Western Avenue, Glendale, California 91201-2837 Tel: 818.240.9600 Fax: 818.240.9675
www.geoteq.com
GROUND IMPROVEMENT SYSTEMS FOR LIQUEFACTION MITIGATION
It is recommended that ground improvement methods be employed for mitigation of liquefaction
and densification of the underlying younger alluvial deposits. Stone columns may be installed
below the proposed structure to mitigate the effects of liquefaction and to improve the underlying
soft and saturated soils for support of the proposed foundation system. In general, ground
improvement design should meet the following performance criteria:
1. Installed to a minimum depth of 35 feet below the existing site grade; 2. Maximum total post-improvement settlement (including static and seismic settlement)
shall not exceed 1½ inches. Total differential settlement shall be ½ inches or less in 30 feet span;
3. Minimum allowable bearing pressure of 5,000 psf for foundation support. Stone Columns
Stone Columns may be utilized for support of the proposed building. Vibro-replacement stone
columns is a ground improvement technique capable of substantially reducing the effects of
liquefaction and seismic deformation, and to densify and improve the underlying soft and
saturated younger alluvial deposits.
To install Stone Columns, a mechanical probe is utilized to advance into the ground by means of
vibration to the design treatment depth. The mechanical probe is then lifted several feet, and
gravel is fed into the resulting void at the tip of the probe, through a delivery tube attached to the
probe. The vibrating probe is then advanced back into the deposited gravel, displacing it, and
compacting it. The probe is lifted and lowered repeatedly until a densified stone column is
installed to the ground surface. Ground improvement is achieved by the formation of these stone
columns within the ground and by densifying the soil adjacent to the stone columns. The stiffer
stone column matrix also helps to redistribute the shear stresses in the soil. In addition, due to
the granular nature of the gravel, stone columns also provide additional drainage, and therefore,
assist in relieving the excess pore pressures generated during an earthquake, and reducing the
extent of liquefaction.

November 7, 2017 File No. 21494 Page 24
Geotechnologies, Inc. 439 Western Avenue, Glendale, California 91201-2837 Tel: 818.240.9600 Fax: 818.240.9675
www.geoteq.com
The design of a Stone Column foundation system is also performed by a design-build contractor
specializing and experienced with this mitigation method. The specialty contractor shall provide
material requirements, preliminary spacing, and other design information. Preliminarily, it is
anticipated that an allowable bearing pressure of 5,000 psf may be utilized for the design of the
conventional foundations, supported on the stone columns. Cone Penetration Tests shall be
performed after the installation of the soil mixing to verify the effectiveness of the ground
improvement method.
FOUNDATION DESIGN
According to the Seismic Hazard Zone Report of the Venice 7½-Minute Quadrangle (CDMG,
1998, Revised 2006), the historically highest groundwater level for the site is on the order of 10
feet below the ground surface. Since the proposed subterranean levels will extend below the
historically highest groundwater level, it is recommended that the proposed structure be designed
for hydrostatic pressure and be supported on a mat foundation, subsequent to installation of the
stone columns. The proposed mat foundation shall be designed for hydrostatic uplift pressure
based on the historically highest groundwater level. In addition, the proposed subterranean walls
shall be designed for full hydrostatic pressure based on the ground surface.
Mat Foundation
The proposed tower will be constructed over 2 subterranean parking levels extending on the
order of 25 feet below the existing site grade. Preliminarily, it is estimated that the proposed mat
foundation will have an average bearing pressure of 2,000 to 3,000 pounds per square foot.
Foundation bearing pressure will vary across the mat footings, with the highest concentrated
loads located at the central cores of the mat foundations.

November 7, 2017 File No. 21494 Page 25
Geotechnologies, Inc. 439 Western Avenue, Glendale, California 91201-2837 Tel: 818.240.9600 Fax: 818.240.9675
www.geoteq.com
Given the size of the proposed mat foundation, the average bearing pressure is well below the
allowable bearing pressures, with factor of safety well exceeding 3. For design purposes, an
average bearing pressure of 5,000 pounds per square foot, with locally higher pressures up to
7,000 pounds per square foot may be utilized in the mat foundation design.
The proposed mat foundation will extend below the historically highest groundwater level, and
shall be designed for the potential hydrostatic uplift pressure. The hydrostatic uplift pressure
acting on the mat footing shall be equivalent to 62.4(H) psf, where H is the depth of the bottom
of the mat footing from the historically highest groundwater level.
The mat foundation may be designed utilizing a modulus of subgrade reaction of 250 pounds per
cubic inch. This value is a unit value for use with a one-foot square footing. The modulus should
be reduced in accordance with the following equation when used with larger foundations.
K = K1 * [ (B + 1) / (2 * B) ]2 where K = Reduced Subgrade Modulus
K1 = Unit Subgrade Modulus B = Foundation Width (feet)
The bearing values indicated above are for the total of dead and frequently applied live loads,
and may be increased by one third for short duration loading, which includes the effects of wind
or seismic forces. Since the recommended bearing value is a net value, the weight of concrete in
the foundations may be taken as 50 pounds per cubic foot and the weight of the soil backfill may
be neglected when determining the downward load on the foundations.
Miscellaneous Foundations
Foundations for small miscellaneous outlying at-grade structures, such as property line fence
walls, planters, exterior canopies, and trash enclosures, which will not be tied-in to the proposed
structure, may be supported on conventional foundations bearing in properly compacted fill.
November 7, 2017 File No. 21494 Page 26
Geotechnologies, Inc. 439 Western Avenue, Glendale, California 91201-2837 Tel: 818.240.9600 Fax: 818.240.9675
www.geoteq.com
Wall footings may be designed for a bearing value of 1,500 pounds per square foot, and should
be a minimum of 12 inches in width, 18 inches in depth below the lowest adjacent grade and 18
inches into the recommended bearing material. No bearing value increases are recommended.
Due to the liquefaction potential, miscellaneous structures not supported by ground improvement
systems will most likely be damaged and will require repair or replacement.
Since the recommended bearing capacity is a net value, the weight of concrete in the foundations
may be taken as 50 pounds per cubic foot and the weight of the soil backfill may be neglected
when determining the downward load on the foundations.
Due to the high expansion potential for the onsite geologic materials, all continuous foundations
should be reinforced with a minimum of four #4 steel bars. Two should be placed near the top of
the foundation, and two should be placed near the bottom.
Lateral Design
Resistance to lateral loading may be provided by friction acting at the base of foundations and by
passive earth pressure. An allowable coefficient of friction of 0.3 may be used with the dead
load forces between footings and the underlying supporting soils.
Passive earth pressure for the sides of foundations poured against undisturbed or recompacted
soil may be computed as an equivalent fluid having a density of 250 pounds per cubic foot, with
a maximum earth pressure of 2,500 pounds per square foot. The passive and friction components
may be combined for lateral resistance without reduction. A one-third increase in the passive
value may be used for short duration loading such as wind or seismic forces. A minimum safety
factor of 2 has been utilized in determining the allowable passive pressure.

November 7, 2017 File No. 21494 Page 27
Geotechnologies, Inc. 439 Western Avenue, Glendale, California 91201-2837 Tel: 818.240.9600 Fax: 818.240.9675
www.geoteq.com
Foundation Settlement
The majority of the foundation settlement is expected to occur on initial application of loading.
It is anticipated that total settlement between 1 and 1½ inches will occur below the more heavily
loaded central core portions of the mat foundation beneath the building. Settlement on the edges
of the mat foundation is expected to be between ¾ to 1 inches.
Foundation Observations
It is critical that all foundation excavations are observed by a representative of this firm to verify
penetration into the recommended bearing materials. The observation should be performed prior
to the placement of reinforcement. Foundations should be deepened to extend into satisfactory
geologic materials, if necessary. Foundation excavations should be cleaned of all loose soils
prior to placing steel and concrete. Any required foundation backfill should be mechanically
compacted, flooding is not permitted.
RETAINING WALL DESIGN
Retaining walls up to 15 feet in height may be designed utilizing the following table. Cantilever
retaining walls supporting a level backslope may be designed utilizing a triangular distribution of
active earth pressure. Restrained retaining walls may be designed utilizing a triangular
distribution of at-rest earth pressure.
Height of Retaining Wall
(feet)
Cantilever Retaining Wall Triangular Distribution of Active Earth Pressure with Hydrostatic Pressure (pcf)
Restrained Retaining Wall Triangular Distribution of
At-Rest Earth Pressure with Hydrostatic Pressure (pcf)
25 feet 80 pcf 100 pcf

November 7, 2017 File No. 21494 Page 28
Geotechnologies, Inc. 439 Western Avenue, Glendale, California 91201-2837 Tel: 818.240.9600 Fax: 818.240.9675
www.geoteq.com
The lateral earth pressures recommended above for retaining walls assume that the proposed
retaining walls will be designed for full hydrostatic pressure based on the ground surface, and a
permanent drainage system behind the retaining walls will be eliminated. Additional active
pressure should be added for a surcharge condition due to sloping ground, vehicular traffic or
adjacent structures.
The upper ten feet of the retaining wall adjacent to streets, driveways or parking areas should be
designed to resist a uniform lateral pressure of 100 pounds per square foot, acting as a result of
an assumed 300 pounds per square foot surcharge behind the walls due to normal street traffic.
If the traffic is kept back at least ten feet from the retaining walls, the traffic surcharge may be
neglected. Foundations may be designed using the allowable bearing capacities, friction, and
passive earth pressure found in the “Foundation Design” section above.
Dynamic (Seismic) Earth Pressure
Retaining walls exceeding 6 feet in height shall be designed to resist the additional earth pressure
caused by seismic ground shaking. A triangular pressure distribution should be utilized for the
additional seismic loads, with an equivalent fluid pressure of 18½ pounds per cubic foot. When
using the code load combination equations, the seismic earth pressure should be combined with
the lateral active earth pressure for analyses of restrained basement walls under seismic loading
condition.
Waterproofing
Moisture effecting retaining walls is one of the most common post construction complaints.
Poorly applied or omitted waterproofing can lead to efflorescence or standing water inside the
building. Efflorescence is a process in which a powdery substance is produced on the surface of
the concrete by the evaporation of water. The white powder usually consists of soluble salts
November 7, 2017 File No. 21494 Page 29
Geotechnologies, Inc. 439 Western Avenue, Glendale, California 91201-2837 Tel: 818.240.9600 Fax: 818.240.9675
www.geoteq.com
such as gypsum, calcite, or common salt. Efflorescence is common to retaining walls and does
not affect their strength or integrity.
It is recommended that retaining walls be waterproofed. Waterproofing design and inspection of
its installation is not the responsibility of the geotechnical engineer. A qualified waterproofing
consultant should be retained in order to recommend a product or method which would provide
protection to below grade walls.
Retaining Wall Backfill
Any required backfill should be mechanically compacted in layers not more than 8 inches thick,
to at least 90 percent of the maximum density obtainable by the most recent revision of ASTM D
1557. Flooding should not be permitted. Proper compaction of the backfill will be necessary to
reduce settlement of overlying walks and paving. Some settlement of required backfill should be
anticipated, and any utilities supported therein should be designed to accept differential
settlement, particularly at the points of entry to the structure.
Proper compaction of the backfill will be necessary to reduce settlement of overlying walks and
paving. Some settlement of required backfill should be anticipated, and any utilities supported
therein should be designed to accept differential settlement, particularly at the points of entry to
the structure.
TEMPORARY EXCAVATIONS
It is anticipated that excavations on the order of 25 feet in vertical height will be required for the
proposed subterranean levels and foundation elements. The excavations are expected to expose
fill and dense native soils, which are suitable for vertical excavations up to 5 feet where not
surcharged by adjacent traffic or structures. Excavations which will be surcharged by adjacent
traffic, public way, properties, or structures should be shored.

November 7, 2017 File No. 21494 Page 30
Geotechnologies, Inc. 439 Western Avenue, Glendale, California 91201-2837 Tel: 818.240.9600 Fax: 818.240.9675
www.geoteq.com
Where sufficient space is available, temporary unsurcharged embankments could be sloped back
without shoring. Excavations over 5 feet in height should may be excavated at a uniform 1:1
(h:v) slope gradient in its entirety to a maximum height of 15 feet. A uniform sloped excavation
does not have a vertical component.
Where sloped embankments are utilized, the tops of the slopes should be barricaded to prevent
vehicles and storage loads within seven feet of the tops of the slopes. If the temporary
construction embankments are to be maintained during the rainy season, berms are suggested
along the tops of the slopes where necessary to prevent runoff water from entering the
excavation and eroding the slope faces. The soils exposed in the cut slopes should be inspected
during excavation by personnel from this office so that modifications of the slopes can be made
if variations in the soil conditions occur.
It is critical that the soils exposed in the cut slopes are observed by a representative of this office
during excavation so that modifications of the slopes can be made if variations in the earth
material conditions occur. All excavations should be stabilized within 30 days of initial
excavation. Water should not be allowed to pond on top of the excavation or to flow towards it.
Temporary Dewatering
Groundwater was encountered during exploration at depths between 24 and 24½ feet below the
existing site grade. It is anticipated that the proposed subterranean structure and mat foundation
will extend to a depth of 25 feet below grade.
Since the proposed subterranean level will extend below the current groundwater level, it is
recommended that a qualified dewatering consultant should be retained during the design phase
of the project. The expected number and depths of well-points, expected flow rates, and
expected pre-pumping time frames should be determined during a dewatering test program
conducted by a qualified dewatering consultant.
November 7, 2017 File No. 21494 Page 31
Geotechnologies, Inc. 439 Western Avenue, Glendale, California 91201-2837 Tel: 818.240.9600 Fax: 818.240.9675
www.geoteq.com
It is anticipated that the well points will collect the majority of the water, however, even after
pre-pumping, some free water may be encountered during excavation due to entrapment within
cohesive lenses. Such water may be collected within the excavation through the use of french
drains and sump pumps.
Excavation Observations
It is critical that the soils exposed in the cut slopes are observed by a representative of
Geotechnologies, Inc. during excavation so that modifications of the slopes can be made if
variations in the geologic material conditions occur. Many building officials require that
temporary excavations should be made during the continuous observations of the geotechnical
engineer. All excavations should be stabilized within 30 days of initial excavation.
SHORING DESIGN
The following information on the design and installation of the shoring is as complete as possible
at this time. It is suggested that a review of the final shoring plans and specifications be made by
this office prior to bidding or negotiating with a shoring contractor be made.
One method of shoring would consist of steel soldier piles, placed in drilled holes and backfilled
with concrete. The soldier piles may be designed as cantilevers or laterally braced utilizing
drilled tie-back anchors or raker braces.
Soldier Piles
Drilled cast-in-place soldier piles should be placed no closer than 2 diameters on center. The
minimum diameter of the piles is 18 inches. Structural concrete should be used for the soldier
piles below the excavation; lean-mix concrete may be employed above that level. As an
alternative, lean-mix concrete may be used throughout the pile where the reinforcing consists of

November 7, 2017 File No. 21494 Page 32
Geotechnologies, Inc. 439 Western Avenue, Glendale, California 91201-2837 Tel: 818.240.9600 Fax: 818.240.9675
www.geoteq.com
a wideflange section. The slurry must be of sufficient strength to impart the lateral bearing
pressure developed by the wideflange section to the earth materials. For design purposes, an
allowable passive value for the earth materials below the bottom plane of excavation may be
assumed to be 600 pounds per square foot per foot. To develop the full lateral value, provisions
should be implemented to assure firm contact between the soldier piles and the undisturbed earth
materials.
The frictional resistance between the soldier piles and retained earth material may be used to
resist the vertical component of the anchor load. The coefficient of friction may be taken as 0.30
based on uniform contact between the steel beam and lean-mix concrete and retained earth. The
portion of soldier piles below the plane of excavation may also be employed to resist the
downward loads. The downward capacity may be determined using a frictional resistance of 450
pounds per square foot. The minimum depth of embedment for shoring piles is 5 feet below the
bottom of the footing excavation, or 7 feet below the bottom of excavated plane, whichever is
deeper.
Casing may be required should caving be experienced in the saturated earth materials. If casing
is used, extreme care should be employed so that the pile is not pulled apart as the casing is
withdrawn. At no time should the distance between the surface of the concrete and the bottom of
the casing be less than 5 feet.
Piles placed below the water level will require the use of a tremie to place the concrete into the
bottom of the hole. A tremie shall consist of a water-tight tube having a diameter of not less than
10 inches with a hopper at the top. The tube shall be equipped with a device that will close the
discharge end and prevent water from entering the tube while it is being charged with concrete.
The tremie shall be supported so as to permit free movement of the discharge end over the entire
top surface of the work and to permit rapid lowering when necessary to retard or stop the flow of
concrete. The discharge end shall be closed at the start of the work to prevent water entering the
tube and shall be entirely sealed at all times, except when the concrete is being placed. The
November 7, 2017 File No. 21494 Page 33
Geotechnologies, Inc. 439 Western Avenue, Glendale, California 91201-2837 Tel: 818.240.9600 Fax: 818.240.9675
www.geoteq.com
tremie tube shall be kept full of concrete. The flow shall be continuous until the work is
completed and the resulting concrete seal shall be monolithic and homogeneous. The tip of the
tremie tube shall always be kept about five feet below the surface of the concrete and definite
steps and safeguards should be taken to insure that the tip of the tremie tube is never raised above
the surface of the concrete.
A special concrete mix should be used for concrete to be placed below water. The design shall
provide for concrete with a strength of 1,000 psi over the initial job specification. An admixture
that reduces the problem of segregation of paste/aggregates and dilution of paste shall be
included. The slump shall be commensurate to any research report for the admixture, provided
that it shall also be the minimum for a reasonable consistency for placing when water is present.
Lagging
Soldier piles and anchors should be designed for the full anticipated pressures. Due to the
cohesionless nature of the underlying earth materials, lagging will be required throughout the
entire depth of the excavation. Due to arching in the geologic materials, the pressure on the
lagging will be less. It is recommended that the lagging should be designed for the full design
pressure but be limited to a maximum of 400 pounds per square foot. It is recommended that a
representative of this firm observe the installation of lagging to insure uniform support of the
excavated embankment.
Lateral Pressures
A triangular distribution of lateral earth pressure should be utilized for the design of cantilevered
shoring system. A trapezoidal distribution of lateral earth pressure would be appropriate where
shoring is to be restrained at the top by bracing or tie backs. The design of trapezoidal
distribution of pressure is shown in the diagram below. Equivalent fluid pressures for the design
of cantilevered and restrained shoring are presented in the following table:

November 7, 2017 File No. 21494 Page 34
Geotechnologies, Inc. 439 Western Avenue, Glendale, California 91201-2837 Tel: 818.240.9600 Fax: 818.240.9675
www.geoteq.com
Height of Shoring
(feet)
Cantilever Shoring System Equivalent Fluid Pressure (pcf)
Triangular Distribution of Pressure
Restrained Shoring System Lateral Earth Pressure (psf)*
Trapezoidal Distribution of Pressure
25 feet 40 pcf 26H psf *Where H is the height of the shoring in feet.
Where a combination of sloped embankment and shoring is utilized, the pressure will be greater
and must be determined for each combination. Additional active pressures should be applied
where the shoring will be surcharged by adjacent traffic or structures.
The upper ten feet of the retaining wall adjacent to streets, driveways or parking areas should be
designed to resist a uniform lateral pressure of 100 pounds per square foot, acting as a result of
an assumed 300 pounds per square foot surcharge behind the walls due to normal street traffic.
If the traffic is kept back at least ten feet from the retaining walls, the traffic surcharge may be
neglected. Foundations may be designed using the allowable bearing capacities, friction, and
passive earth pressure found in the “Foundation Design” section above.
TRAPEZO IDAL DISTRIBUTION OF PR ESSU R E
~ 0 . 2 H
H 0.6 H
/'
0.2 H ~

November 7, 2017 File No. 21494 Page 35
Geotechnologies, Inc. 439 Western Avenue, Glendale, California 91201-2837 Tel: 818.240.9600 Fax: 818.240.9675
www.geoteq.com
Tied-Back Anchors
Tied-back anchors may be used to resist lateral loads. Friction anchors are recommended. For
design purposes, it may be assumed that the active wedge adjacent to the shoring is defined by a
plane drawn 35 degrees with the vertical through the bottom plane of the excavation. Friction
anchors should extend a minimum of 20 feet beyond the potentially active wedge.
Drilled friction anchors may be designed for a skin friction of 300 pounds per square foot.
Pressure grouted anchor may be designed for a skin friction of 2,000 pounds per square foot.
Where belled anchors are utilized, the capacity of belled anchors may be designed by assuming
the diameter of the bonded zone is equivalent to the diameter of the bell. Only the frictional
resistance developed beyond the active wedge would be effective in resisting lateral loads.
It is recommended that at least 3 of the initial anchors have their capacities tested to 200 percent
of their design capacities for a 24-hour period to verify their design capacity. The total
deflection during this test should not exceed 12 inches. The anchor deflection should not exceed
0.75 inches during the 24 hour period, measured after the 200 percent load has been applied.
All anchors should be tested to at least 150 percent of design load. The total deflection during
this test should not exceed 12 inches. The rate of creep under the 150 percent test load should
not exceed 0.1 inch over a 15 minute period in order for the anchor to be approved for the design
loading.
After a satisfactory test, each anchor should be locked-off at the design load. This should be
verified by rechecking the load in the anchor. The load should be within 10 percent of the design
load. Where satisfactory tests are not attained, the anchor diameter and/or length should be
increased or additional anchors installed until satisfactory test results are obtained. The
installation and testing of the anchors should be observed by the geotechnical engineer. Minor
caving during drilling of the anchors should be anticipated.
November 7, 2017 File No. 21494 Page 36
Geotechnologies, Inc. 439 Western Avenue, Glendale, California 91201-2837 Tel: 818.240.9600 Fax: 818.240.9675
www.geoteq.com
Anchor Installation
Tied-back anchors may be installed between 20 and 40 degrees below the horizontal. Caving of
the anchor shafts, particularly within sand deposits, should be anticipated and the following
provisions should be implemented in order to minimize such caving. The anchor shafts should
be filled with concrete by pumping from the tip out, and the concrete should extend from the tip
of the anchor to the active wedge. In order to minimize the chances of caving, it is
recommended that the portion of the anchor shaft within the active wedge be backfilled with
sand before testing the anchor. This portion of the shaft should be filled tightly and flush with
the face of the excavation. The sand backfill should be placed by pumping; the sand may contain
a small amount of cement to facilitate pumping.
Deflection
It is difficult to accurately predict the amount of deflection of a shored embankment. It should
be realized that some deflection will occur. It is estimated that the deflection could be on the
order of one inch at the top of the shored embankment. If greater deflection occurs during
construction, additional bracing may be necessary to minimize settlement of adjacent buildings
and utilities in adjacent street and alleys. If desired to reduce the deflection, a greater active
pressure could be used in the shoring design. Where internal bracing is used, the rakers should
be tightly wedged to minimize deflection. The proper installation of the raker braces and the
wedging will be critical to the performance of the shoring.
Monitoring
Because of the depth of the excavation, some mean of monitoring the performance of the shoring
system is suggested. The monitoring should consist of periodic surveying of the lateral and
vertical locations of the tops of all soldier piles and the lateral movement along the entire lengths
of selected soldier piles. Also, some means of periodically checking the load on selected anchors
will be necessary, where applicable.

November 7, 2017 File No. 21494 Page 37
Geotechnologies, Inc. 439 Western Avenue, Glendale, California 91201-2837 Tel: 818.240.9600 Fax: 818.240.9675
www.geoteq.com
Some movement of the shored embankments should be anticipated as a result of the relatively
deep excavation. It is recommended that photographs of the existing buildings on the adjacent
properties be made during construction to record any movements for use in the event of a
dispute.
Shoring Observations
It is critical that the installation of shoring is observed by a representative of Geotechnologies,
Inc. Many building officials require that shoring installation should be performed during
continuous observation of a representative of the geotechnical engineer. The observations insure
that the recommendations of the geotechnical report are implemented and so that modifications
of the recommendations can be made if variations in the geologic material or groundwater
conditions warrant. The observations will allow for a report to be prepared on the installation of
shoring for the use of the local building official, where necessary.
SLABS ON GRADE
Concrete Slabs-on Grade
Concrete floor slabs should be a minimum of 5 inches in thickness, and should be reinforced
with a minimum of #4 steel bars on 16-inch centers each way. Slabs-on-grade should be cast
over undisturbed natural geologic materials or properly controlled fill materials. Any geologic
materials loosened or over-excavated should be wasted from the site or properly compacted to 90
percent of the maximum dry density.
Outdoor concrete flatwork should be a minimum of 4 inches in thickness, and should be
reinforced with a minimum of #3 steel bars on 12-inch centers each way. Outdoor concrete
flatwork should be cast over undisturbed natural geologic materials or properly controlled fill
materials. Any geologic materials loosened or over-excavated should be wasted from the site or
November 7, 2017 File No. 21494 Page 38
Geotechnologies, Inc. 439 Western Avenue, Glendale, California 91201-2837 Tel: 818.240.9600 Fax: 818.240.9675
www.geoteq.com
properly compacted to 90 percent (or 95 percent for cohesionless soils having less than 15
percent finer than 0.005 millimeters) of the maximum dry density.
Design of Slabs That Receive Moisture-Sensitive Floor Coverings
Geotechnologies, Inc. does not practice in the field of moisture vapor transmission evaluation
and mitigation. Therefore it is recommended that a qualified consultant be engaged to evaluate
the general and specific moisture vapor transmission paths and any impact on the proposed
construction. The qualified consultant should provide recommendations for mitigation of
potential adverse impacts of moisture vapor transmission on various components of the structure.
Where dampness would be objectionable, it is recommended that the floor slabs should be
waterproofed. A qualified waterproofing consultant should be retained in order to recommend a
product or method which would provide protection for concrete slabs-on-grade.
All concrete slabs-on-grade should be supported on vapor retarder. The design of the slab and
the installation of the vapor retarder should comply with the most recent revisions of ASTM E
1643 and ASTM E 1745. The vapor retarder should comply with ASTM E 1745 Class A
requirements.
Where a vapor retarder is used, a low-slump concrete should be used to minimize possible
curling of the slabs. The barrier can be covered with a layer of trimable, compactible, granular
fill, where it is thought to be beneficial. See ACI 302.2R-32, Chapter 7 for information on the
placement of vapor retarders and the use of a fill layer.
Concrete Crack Control
The recommendations presented in this report are intended to reduce the potential for cracking of
concrete slabs-on-grade due to settlement. However even where these recommendations have
November 7, 2017 File No. 21494 Page 39
Geotechnologies, Inc. 439 Western Avenue, Glendale, California 91201-2837 Tel: 818.240.9600 Fax: 818.240.9675
www.geoteq.com
been implemented, foundations, stucco walls and concrete slabs-on-grade may display some
cracking due to minor soil movement and/or concrete shrinkage. The occurrence of concrete
cracking may be reduced and/or controlled by limiting the slump of the concrete used, proper
concrete placement and curing, and by placement of crack control joints at reasonable intervals,
in particular, where re-entrant slab corners occur.
For standard control of concrete cracking, a maximum crack control joint spacing of 10 feet
should not be exceeded. Lesser spacing would provide greater crack control. Joints at curves and
angle points are recommended. The crack control joints should be installed as soon as practical
following concrete placement. Crack control joints should extend a minimum depth of one-
fourth the slab thickness. Construction joints should be designed by a structural engineer.
Complete removal of the existing fill soils beneath outdoor flatwork such as walkways or patio
areas, is not required, however, due to the rigid nature of concrete, some cracking, a shorter
design life and increased maintenance costs should be anticipated. In order to provide uniform
support beneath the flatwork it is recommended that a minimum of 12 inches of the exposed
subgrade beneath the flatwork be scarified and recompacted to 90 percent relative compaction.
PAVEMENTS
Prior to placing paving, the existing grade should be scarified to a depth of 12 inches, moistened
as required to obtain optimum moisture content, and recompacted to 90 percent of the maximum
density as determined by the most recent revision of ASTM D 1557. The client should be aware
that removal of all existing fill in the area of new paving is not required, however, pavement
constructed in this manner will most likely have a shorter design life and increased maintenance
costs. The following pavement sections are recommended:
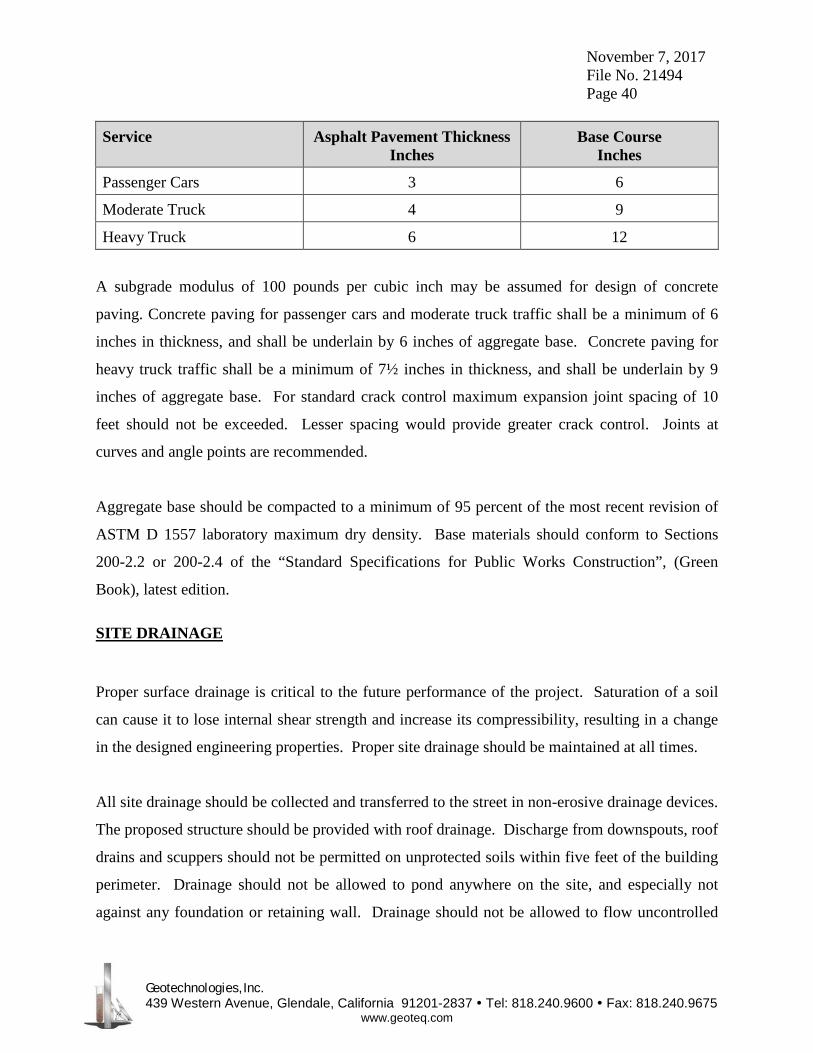
November 7, 2017 File No. 21494 Page 40
Geotechnologies, Inc. 439 Western Avenue, Glendale, California 91201-2837 Tel: 818.240.9600 Fax: 818.240.9675
www.geoteq.com
Service Asphalt Pavement Thickness Inches
Base Course Inches
Passenger Cars 3 6
Moderate Truck 4 9
Heavy Truck 6 12
A subgrade modulus of 100 pounds per cubic inch may be assumed for design of concrete
paving. Concrete paving for passenger cars and moderate truck traffic shall be a minimum of 6
inches in thickness, and shall be underlain by 6 inches of aggregate base. Concrete paving for
heavy truck traffic shall be a minimum of 7½ inches in thickness, and shall be underlain by 9
inches of aggregate base. For standard crack control maximum expansion joint spacing of 10
feet should not be exceeded. Lesser spacing would provide greater crack control. Joints at
curves and angle points are recommended.
Aggregate base should be compacted to a minimum of 95 percent of the most recent revision of
ASTM D 1557 laboratory maximum dry density. Base materials should conform to Sections
200-2.2 or 200-2.4 of the “Standard Specifications for Public Works Construction”, (Green
Book), latest edition.
SITE DRAINAGE
Proper surface drainage is critical to the future performance of the project. Saturation of a soil
can cause it to lose internal shear strength and increase its compressibility, resulting in a change
in the designed engineering properties. Proper site drainage should be maintained at all times.
All site drainage should be collected and transferred to the street in non-erosive drainage devices.
The proposed structure should be provided with roof drainage. Discharge from downspouts, roof
drains and scuppers should not be permitted on unprotected soils within five feet of the building
perimeter. Drainage should not be allowed to pond anywhere on the site, and especially not
against any foundation or retaining wall. Drainage should not be allowed to flow uncontrolled

November 7, 2017 File No. 21494 Page 41
Geotechnologies, Inc. 439 Western Avenue, Glendale, California 91201-2837 Tel: 818.240.9600 Fax: 818.240.9675
www.geoteq.com
over any descending slope. Planters which are located within a distance equal to the depth of a
retaining wall should be sealed to prevent moisture adversely affecting the wall. Planters which
are located within five feet of a foundation should be sealed to prevent moisture affecting the
earth materials supporting the foundation.
STORMWATER DISPOSAL
Stormwater disposal at the site is not considered feasible due to the high groundwater level and
the depth of the proposed subterranean levels.
DESIGN REVIEW
Engineering of the proposed project should not begin until approval of the geotechnical report by
the Building Official is obtained in writing. Significant changes in the geotechnical
recommendations may result during the building department review process.
It is recommended that the geotechnical aspects of the project be reviewed by this firm during
the design process. This review provides assistance to the design team by providing specific
recommendations for particular cases, as well as review of the proposed construction to evaluate
whether the intent of the recommendations presented herein are satisfied.
CONSTRUCTION MONITORING
Geotechnical observations and testing during construction are considered to be a continuation of
the geotechnical investigation. It is critical that this firm review the geotechnical aspects of the
project during the construction process. Compliance with the design concepts, specifications or
recommendations during construction requires review by this firm during the course of
construction. All foundations should be observed by a representative of this firm prior to placing
concrete or steel. Any fill which is placed should be observed, tested, and verified if used for
engineered purposes. Please advise Geotechnologies, Inc. at least twenty-four hours prior to any
required site visit.
November 7, 2017 File No. 21494 Page 42
Geotechnologies, Inc. 439 Western Avenue, Glendale, California 91201-2837 Tel: 818.240.9600 Fax: 818.240.9675
www.geoteq.com
If conditions encountered during construction appear to differ from those disclosed herein, notify
Geotechnologies, Inc. immediately so the need for modifications may be considered in a timely
manner.
It is the responsibility of the contractor to ensure that all excavations and trenches are properly
sloped or shored. All temporary excavations should be cut and maintained in accordance with
applicable OSHA rules and regulations.
EXCAVATION CHARACTERISTICS
The exploration performed for this investigation is limited to the geotechnical excavations
described. Direct exploration of the entire site would not be economically feasible. The owner,
design team and contractor must understand that differing excavation and drilling conditions may
be encountered based on boulders, gravel, oversize materials, groundwater and many other
conditions. Fill materials, especially when they were placed without benefit of modern grading
codes, regularly contain materials which could impede efficient grading and drilling. Southern
California sedimentary bedrock is known to contain variable layers which reflect differences in
depositional environment. Such layers may include abundant gravel, cobbles and boulders.
Similarly bedrock can contain concretions. Concretions are typically lenticular and follow the
bedding. They are formed by mineral deposits. Concretions can be very hard. Excavation and
drilling in these areas may require full size equipment and coring capability. The contractor
should be familiar with the site and the geologic materials in the vicinity.
CLOSURE AND LIMITATIONS
The purpose of this report is to aid in the design and completion of the described project.
Implementation of the advice presented in this report is intended to reduce certain risks
associated with construction projects. The professional opinions and geotechnical advice
contained in this report are sought because of special skill in engineering and geology and were
prepared in accordance with generally accepted geotechnical engineering practice.

November 7, 2017 File No. 21494 Page 43
Geotechnologies, Inc. 439 Western Avenue, Glendale, California 91201-2837 Tel: 818.240.9600 Fax: 818.240.9675
www.geoteq.com
Geotechnologies, Inc. has a duty to exercise the ordinary skill and competence of members of the
engineering profession. Those who hire Geotechnologies, Inc. are not justified in expecting
infallibility, but can expect reasonable professional care and competence.
The scope of the geotechnical services provided did not include any environmental site
assessment for the presence or absence of organic substances, hazardous/toxic materials in the
soil, surface water, groundwater, or atmosphere, or the presence of wetlands.
Proper compaction is necessary to reduce settlement of overlying improvements. Some
settlement of compacted fill should be anticipated. Any utilities supported therein should be
designed to accept differential settlement. Differential settlement should also be considered at
the points of entry to the structure.
GEOTECHNICAL TESTING
Classification and Sampling
The soil is continuously logged by a representative of this firm and classified by visual
examination in accordance with the Unified Soil Classification system. The field classification is
verified in the laboratory, also in accordance with the Unified Soil Classification System.
Laboratory classification may include visual examination, Atterberg Limit Tests and grain size
distribution. The final classification is shown on the excavation logs.
Samples of the geologic materials encountered in the exploratory excavations were collected and
transported to the laboratory. Undisturbed samples of soil are obtained at frequent intervals.
Unless noted on the excavation logs as an SPT sample, samples acquired while utilizing a
hollow-stem auger drill rig are obtained by driving a thin-walled, California Modified Sampler
with successive 30-inch drops of a 140-pound hammer. The soil is retained in brass rings of 2.50
inches outside diameter and 1.00 inch in height. The central portion of the samples are stored in
November 7, 2017 File No. 21494 Page 44
Geotechnologies, Inc. 439 Western Avenue, Glendale, California 91201-2837 Tel: 818.240.9600 Fax: 818.240.9675
www.geoteq.com
close fitting, waterproof containers for transportation to the laboratory. Samples noted on the
excavation logs as SPT samples are obtained in accordance with the most recent revision of
ASTM D 1586. Samples are retained for 30 days after the date of the geotechnical report.
Moisture and Density Relationships
The field moisture content and dry unit weight are determined for each of the undisturbed soil
samples, and the moisture content is determined for SPT samples by the most recent revision of
ASTM D 4959 or ASTM D 4643. This information is useful in providing a gross picture of the
soil consistency between exploration locations and any local variations. The dry unit weight is
determined in pounds per cubic foot and shown on the “Excavation Logs”, A-Plates. The field
moisture content is determined as a percentage of the dry unit weight.
Direct Shear Testing
Shear tests are performed by the most recent revision of ASTM D 3080 with a strain controlled,
direct shear machine manufactured by Soil Test, Inc. or a Direct Shear Apparatus manufactured
by GeoMatic, Inc. The rate of deformation is approximately 0.025 inches per minute. Each
sample is sheared under varying confining pressures in order to determine the Mohr-Coulomb
shear strength parameters of the cohesion intercept and the angle of internal friction. Samples
are generally tested in an artificially saturated condition. Depending upon the sample location
and future site conditions, samples may be tested at field moisture content. The results are
plotted on the "Shear Test Diagram," B-Plates.
The most recent revision of ASTM 3080 limits the particle size to 10 percent of the diameter of
the direct shear test specimen. The sheared sample is inspected by the laboratory technician
running the test. The inspection is performed by splitting the sample along the sheared plane and
observing the soils exposed on both sides. Where oversize particles are observed in the shear
plane, the results are discarded and the test run again with a fresh sample.

November 7, 2017 File No. 21494 Page 45
Geotechnologies, Inc. 439 Western Avenue, Glendale, California 91201-2837 Tel: 818.240.9600 Fax: 818.240.9675
www.geoteq.com
Consolidation Testing
Settlement predictions of the soil's behavior under load are made on the basis of the
consolidation tests using the most recent revision of ASTM D 2435. The consolidation
apparatus is designed to receive a single one-inch high ring. Loads are applied in several
increments in a geometric progression, and the resulting deformations are recorded at selected
time intervals. Porous stones are placed in contact with the top and bottom of each specimen to
permit addition and release of pore fluid. Samples are generally tested at increased moisture
content to determine the effects of water on the bearing soil. The normal pressure at which the
water is added is noted on the drawing. Results are plotted on the "Consolidation Test," C-
Plates.
Expansion Index Testing
The expansion tests performed on the remolded samples are in accordance with the Expansion
Index testing procedures, as described in the most recent revision of ASTM D4829. The soil
sample is compacted into a metal ring at a saturation degree of 50 percent. The ring sample is
then placed in a consolidometer, under a vertical confining pressure of 1 lbf/square inch and
inundated with distilled water. The deformation of the specimen is recorded for a period of 24
hour or until the rate of deformation becomes less than 0.0002 inches/hour, whichever occurs
first. The expansion index, EI, is determined by dividing the difference between final and initial
height of the ring sample by the initial height, and multiplied by 1,000.
Laboratory Compaction Characteristics
The maximum dry unit weight and optimum moisture content of a soil are determined by use of
the most recent revision of ASTM D 1557. A soil at a selected moisture content is placed in five
layers into a mold of given dimensions, with each layer compacted by 25 blows of a 10 pound
hammer dropped from a distance of 18 inches subjecting the soil to a total compactive effort of

November 7, 2017 File No. 21494 Page 46
Geotechnologies, Inc. 439 Western Avenue, Glendale, California 91201-2837 Tel: 818.240.9600 Fax: 818.240.9675
www.geoteq.com
about 56,000 pounds per cubic foot. The resulting dry unit weight is determined. The procedure
is repeated for a sufficient number of moisture contents to establish a relationship between the
dry unit weight and the water content of the soil. The data when plotted represent a curvilinear
relationship known as the compaction curve. The values of optimum moisture content and
modified maximum dry unit weight are determined from the compaction curve.
Grain Size Distribution
These tests cover the quantitative determination of the distribution of particle sizes in soils.
Sieve analysis is used to determine the grain size distribution of the soil larger than the Number
200 sieve. The most recent revision of ASTM D 422 is used to determine particle sizes smaller
than the Number 200 sieve. A hydrometer is used to determine the distribution of particle sizes
by a sedimentation process. The grain size distributions are plotted on the E-Plates presented in
the Appendix of this report.

Geotechnologies, Inc. 439 Western Avenue, Glendale, California 91201-2837 Tel: 818.240.9600 Fax: 818.240.9675
www.geoteq.com
REFERENCES
1. American Society of Civil Engineers, 1994, “Settlement Analysis,” Technical Engineering and Design Guides, as adapted from the U.S. Army Corps of Engineers, No. 9.
2. Bartlett, S.F. and Youd, T.L., 1992, “Empirical Analysis of Horizontal Ground Displacement Generated by Liquefaction-Induced Lateral Spreads,” Technical Report NCEER-92-0021, National Center for Earthquake Engineering Research, SUNY-Buffalo, Buffalo, NY.
3. Bartlett, S.F. and Youd, T.L., 1995, “Empirical Prediction of Liquefaction-Induced lateral Spread,” Journal of Geotechnical Engineering, Vol. 121, No.4, April.
4. Bowles, Joseph E., 1977, “Foundation Analysis and Design,” 2nd Edition, McGraw-Hill, New York.
5. California Division of Mines and Geology, 1997, Seismic Hazard Zone Map, map scale 1:24,000.
6. California Division of Mines and Geology, 1998, Seismic Hazard Evaluation Report for the Venice 7.5-Minute Quadrangle, Los Angeles County, California, Seismic Hazard Zone Report SHZR 036.
7. California Geological Survey, 2008, “Guidelines for Evaluation and Mitigation of Seismic Hazards in California,” CDMG Special Publication 117A.
8. City of Los Angeles, Department of Public Works, 2003, Methane and Methane Buffer Zones Map, Map Number A-20960.
9. Department of the Navy, NAVFAC Design Manual 7.1, 1982, “Soil Mechanics,” Naval Facilities Engineering Command, May.
10. Department of the Navy, NAVFAC Design Manual 7.02, 1986, “Foundations and Earth Structures,” Naval Facilities Engineering Command, September.
11. Leighton and Associates, Inc. (1990), Technical Appendix to the Safety Element of the Los Angeles County General Plan: Hazard Reduction in Los Angeles County.
12. Robertson, P.K., and Wride, C.E., 1998, “Evaluating Cyclic Liquefaction Potential Using the Cone Penetration Test”, Canadian Geotechnical Journal, Ottawa, 35(3), 442-459.
13. Seed, H.B. , Idriss, I.M., and Arango, I., 1983, Evaluation of Liquefaction Potential Using Field Performance Data, Journal of the Geotechnical Engineering Division, American Society of Civil Engineers, vol. 109, no. 3, pp. 458-482.
14. Southern California Earthquake Center, 1999, “Recommended Procedures for Implementation of DMG Special Publication 117 - Guidelines for Analyzing and Mitigating Liquefaction in California,” March.

Geotechnologies, Inc. 439 Western Avenue, Glendale, California 91201-2837 Tel: 818.240.9600 Fax: 818.240.9675
www.geoteq.com
REFERENCES - continued
15. Tinsley, J.C., Youd, T.L, Perkins, D.M., and Chen, A.T.F., 1985, Evaluating Liquefaction Potential: in Evaluating Earthquake Hazards in the Los Angeles Region-An earth Science Perspective, U.S. Geological Survey Professional Paper 1360, edited by J.I. Ziony, U.S. Government Printing Office, pp. 263-315.
16. Tokimatsu, K., and Yoshimi, Y., 1983, Empirical Correlation of Soil Liquefaction Based on SPT N-Value and Fines Content, Soils and Foundations, Japanese Society of Soil Mechanics and Foundation Engineering, vol. 23, no. 4, pp. 56-74.
17. Tokimatsu, K. and Seed, H. B., 1987, “Evaluation of Settlements in Sands Due to Earthquake Shaking,” Journal of Geotechnical Engineering, ASCE, Vol. 113, No. 8, August.
18. United States Geological Survey, 2011, U.S.G.S. Ground Motion Parameter Calculator (Version 5.0.9a). http://earthquake.usgs.gov/hazards/designmaps/.
19. Youd, T.L., Hansen, C.M., and Bartlett, S.F., 2002, “Revised Multilinear Regression Equations for Prediction of Lateral Spread Displacement”, Journal of Geotechnical Engineering, Vol. 128, No. 12, December.
20. Zhang, G., Robertson, P.K., and Brachman, R.W.I., 2002, “Estimating Liquefaction-Induced Ground Settlements From CPT for Level Ground”, Canadian Geotechnical Journal, Ottawa, 39, 1168-1180.
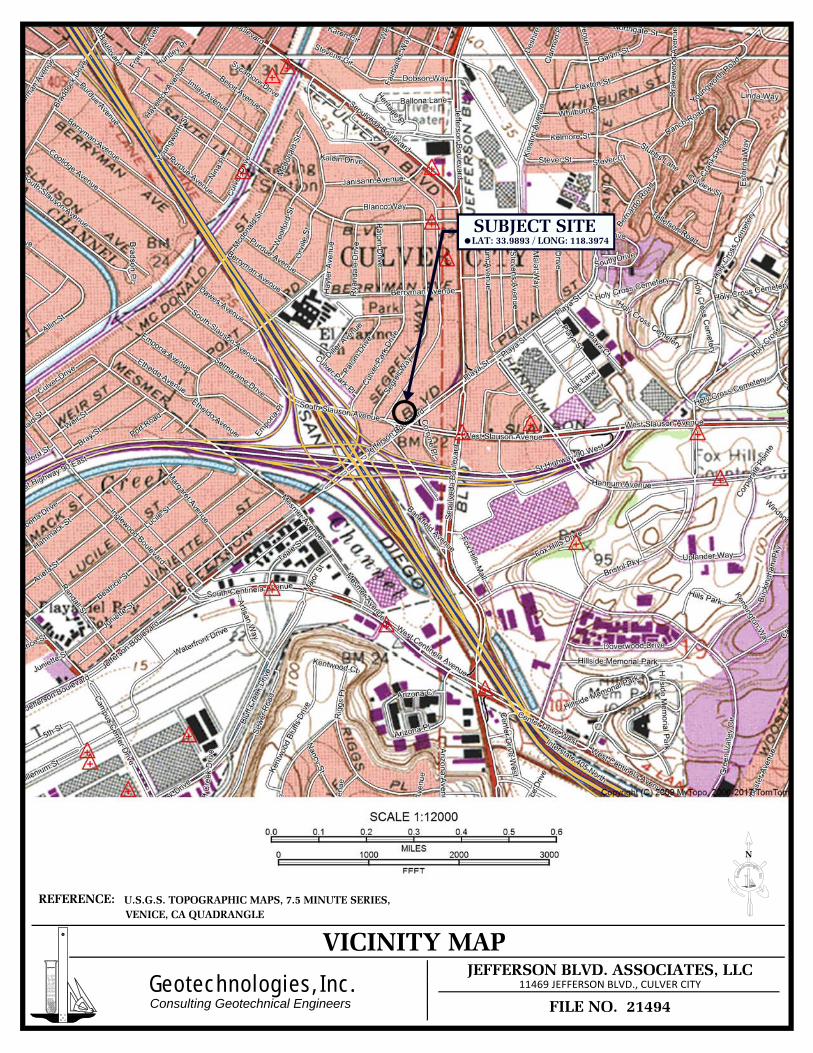
REFERENCE:
VICINITY MAP
FILE NO. 21494
U.S.G.S. TOPOGRAPHIC MAPS, 7.5 MINUTE SERIES,
Geotechnologies, Inc.Consulting Geotechnical Engineers
JEFFERSON BLVD. ASSOCIATES, LLC
VENICE, CA QUADRANGLE
SUBJECT SITELAT: 33.9893 / LONG: 118.3974
N
11469 JEFFERSON BLVD., CULVER CITY
SCALE 1 : 12000 0.0 0.1
0
0.5 0.6
◊ 0.2 0.3 0.4
MILES 2000 3000 , 1000
FFFT

LEGEND
LOCAL GEOLOGIC MAP - DIBBLEE
REFERENCE: DIBBLEE, T.W., (2007) GEOLOGIC MAP OF THE LOS ANGELES QUADRANGLE (#DF-322)
Qa: Surficial Sediments - alluvial gravel, sand and clayQop: Older Surficial Sediments - Paleosol in Baldwin Hills, gray to rusty brown, sandy, locally pebbly, moderately indurated "hardpan"Qoa: Older Surficial Sediments - older alluvium to gray to light brown pebble-gravel, sand and silt-clayQsp:
af: Surficial Sediments - artificial cut and fill
Shallow Marine Sediments - San Pedro Sand; light gray to light brown sand, light to coarse gray, locally pebbly
? Fault - dashed where indefinite or inferred, dotted where concealed, queried where existence is doubtfulFolds - arrow on axial trace of fold indicates direction of plunge
JEFFERSON BLVD. ASSOCIATES, LLC
FILE NO. 21494
11469 JEFFERSON BLVD., CULVER CITY
N
Geotechnologies, Inc.Consulting Geotechnical Engineers
SUBJECT SITE

SEISMIC HAZARD ZONE MAP
N
SUBJECT SITE
LIQUEFACTION AREA
REFERENCE: SEISMIC HAZARD ZONES, VENICE QUADRANGLE OFFICIAL MAP (CDMG, 1998)
FILE NO. 21494
JEFFERSON BLVD. ASSOCIATES, LLC11469 JEFFERSON BLVD., CULVER CITYGeotechnologies, Inc.
Consulting Geotechnical Engineers
.s
1000S:::::E3::Eot::===1jOOO~EE~2000:::c::===3000EEEaa<40003:===5000=e~E~'50003::===70005 FEET
E3::::::E3::::JE.sCE3:::::I3C:EEEEEEEEEEEE31 ~LOMrnR
1MILE
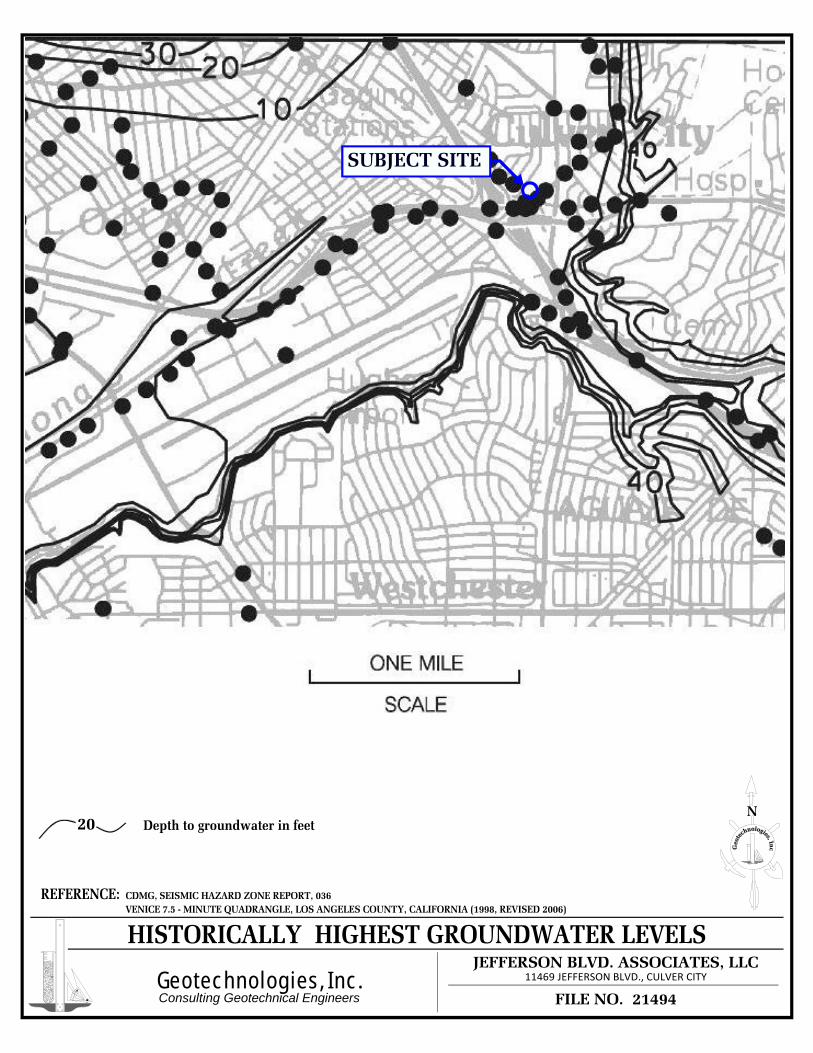
HISTORICALLY HIGHEST GROUNDWATER LEVELS
CDMG, SEISMIC HAZARD ZONE REPORT, 036REFERENCE:VENICE 7.5 - MINUTE QUADRANGLE, LOS ANGELES COUNTY, CALIFORNIA (1998, REVISED 2006)
SUBJECT SITE
N20 Depth to groundwater in feet
Geotechnologies, Inc.Consulting Geotechnical Engineers FILE NO. 21494
JEFFERSON BLVD. ASSOCIATES, LLC11469 JEFFERSON BLVD., CULVER CITY
ONE MILE
SCALE
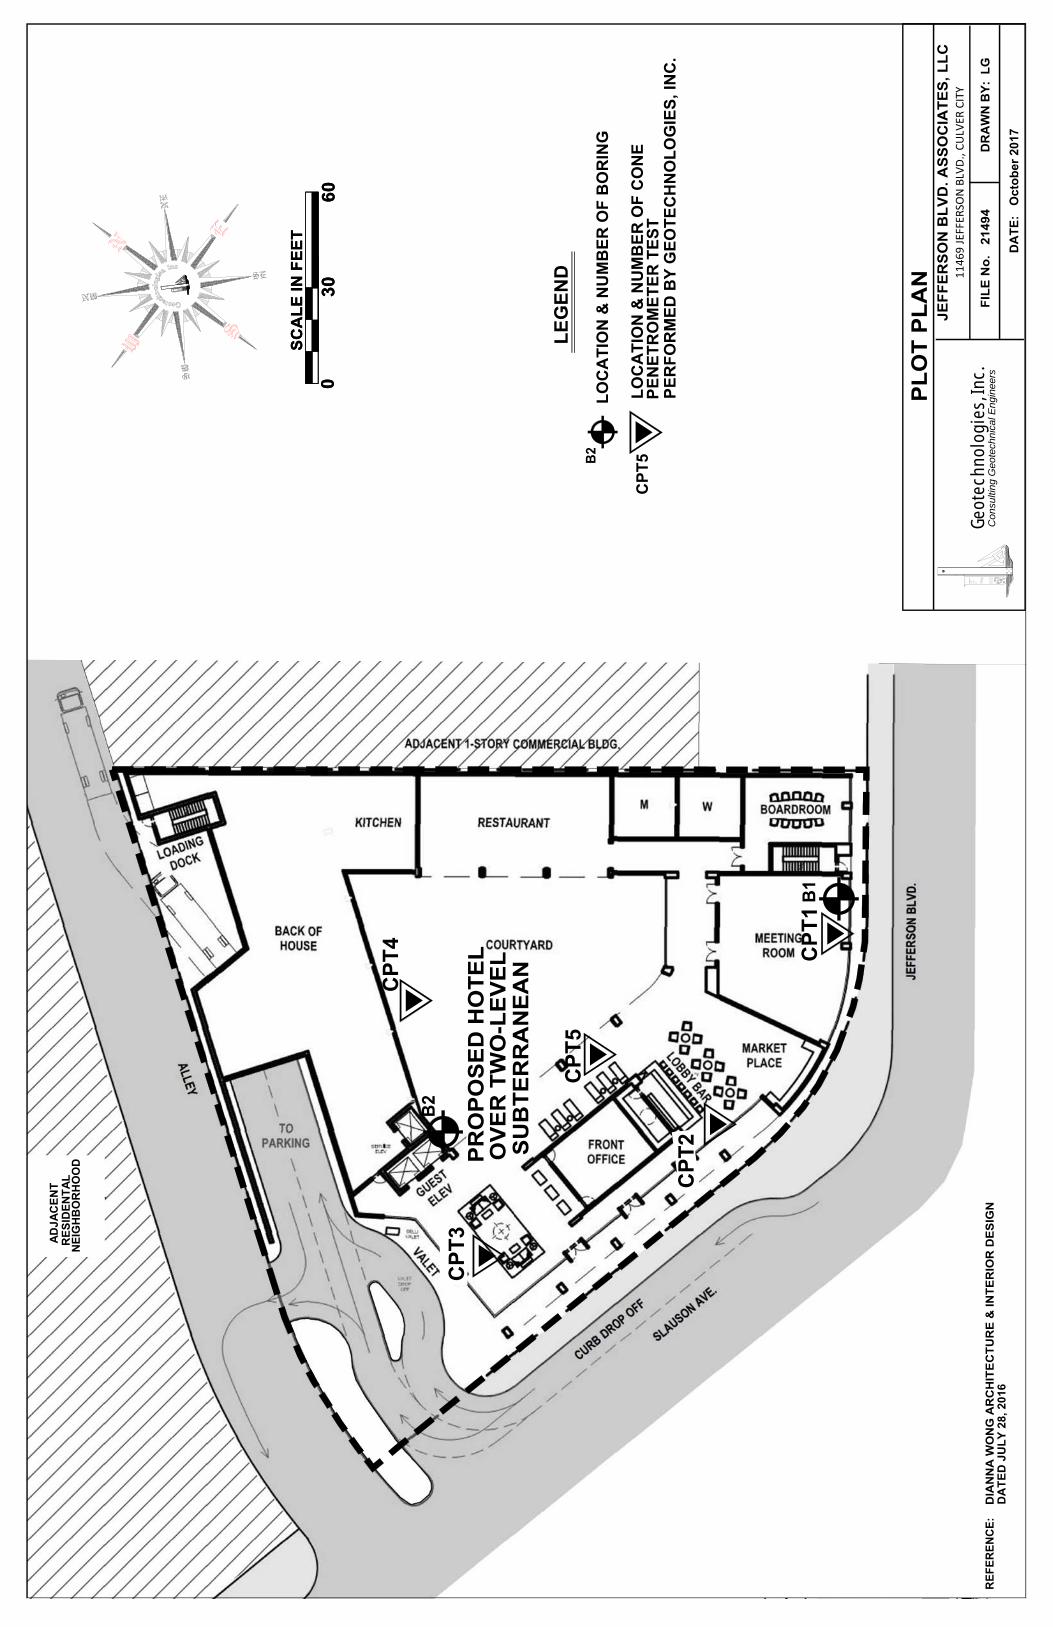
LE
GE
ND
B2
LO
CA
TIO
N &
NU
MB
ER
OF
BO
RIN
G
PL
OT
PL
AN
JE
FF
ER
SO
N B
LV
D.
AS
SO
CIA
TE
S,
LL
C
FIL
E N
o. 21494
DR
AW
N B
Y:
LG
Geot
echn
olog
ies,
Inc.
DA
TE
:
Oc
tob
er
20
17
11469 JEFFERSO
N BLV
D., CULV
ER CITY
Co
nsu
lting
Geo
tech
nica
l Eng
inee
rs
CP
T5
PE
RF
OR
ME
D B
Y G
EO
TE
CH
NO
LO
GIE
S, IN
C.
PE
NE
TR
OM
ET
ER
TE
ST
LO
CA
TIO
N &
NU
MB
ER
OF
CO
NE
60
30
0
SC
AL
E I
N F
EE
T
60
30
0
SC
AL
E I
N F
EE
T
B2
B1
CP
T1
CP
T4
CP
T5
AD
JA
CE
NT
R
ES
IDE
NT
AL
NE
IGH
BO
RH
OO
D PR
OP
OS
ED
HO
TE
LO
VE
R T
WO
-LE
VE
LS
UB
TE
RR
AN
EA
N
CP
T2
CP
T3
RE
FE
RE
NC
E:
DIA
NN
A W
ON
G A
RC
HIT
EC
TU
RE
& IN
TE
RIO
R D
ES
IGN
DA
TE
D J
UL
Y 2
8, 2016
BACK OF HOUSE
KITCHEN
~
~~
RESTAURANT __ _.
COURTYARD
A
fl~
~ / ,# ~
\
~ _. ~ /4~(;)<1.o / -<!
.i t-: '
0 000
D CJ aoc,
MEETING ROOM
~ m z i a:: ~ LL. w -,
~ I .
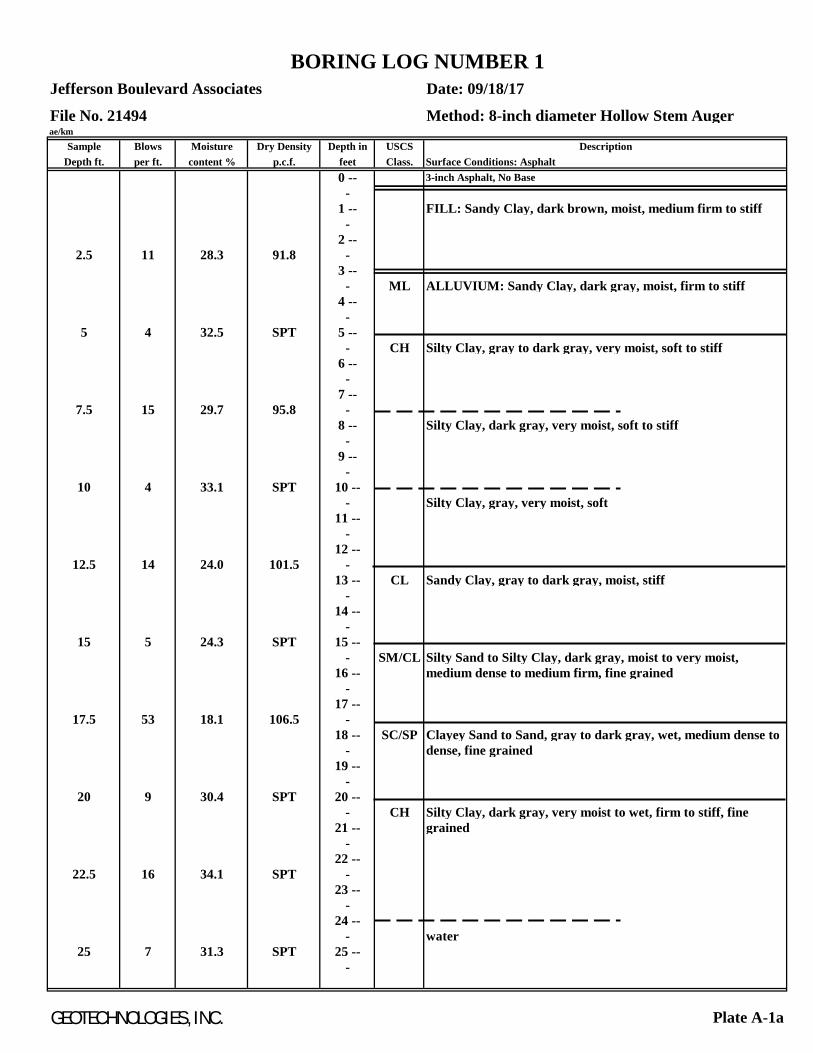
Jefferson Boulevard Associates Date: 09/18/17
File No. 21494 Method: 8-inch diameter Hollow Stem Augerae/km
Sample Blows Moisture Dry Density Depth in USCS DescriptionDepth ft. per ft. content % p.c.f. feet Class. Surface Conditions: Asphalt
0 -- 3-inch Asphalt, No Base-
1 -- FILL: Sandy Clay, dark brown, moist, medium firm to stiff-
2 --2.5 11 28.3 91.8 -
3 --- ML ALLUVIUM: Sandy Clay, dark gray, moist, firm to stiff
4 ---
5 4 32.5 SPT 5 --- CH Silty Clay, gray to dark gray, very moist, soft to stiff
6 ---
7 --7.5 15 29.7 95.8 -
8 -- Silty Clay, dark gray, very moist, soft to stiff-
9 ---
10 4 33.1 SPT 10 --- Silty Clay, gray, very moist, soft
11 ---
12 --12.5 14 24.0 101.5 -
13 -- CL Sandy Clay, gray to dark gray, moist, stiff-
14 ---
15 5 24.3 SPT 15 --- SM/CL Silty Sand to Silty Clay, dark gray, moist to very moist,
16 -- medium dense to medium firm, fine grained-
17 --17.5 53 18.1 106.5 -
18 -- SC/SP Clayey Sand to Sand, gray to dark gray, wet, medium dense to- dense, fine grained
19 ---
20 9 30.4 SPT 20 --- CH Silty Clay, dark gray, very moist to wet, firm to stiff, fine
21 -- grained-
22 --22.5 16 34.1 SPT -
23 ---
24 --- water
25 7 31.3 SPT 25 ---
GEOTECHNOLOGIES, INC. Plate A-1a
BORING LOG NUMBER 1
--- ------------------
--- ---- -- -- -- -- -- -- -- -
--- ---- -- -- -- -- -- -- -- -
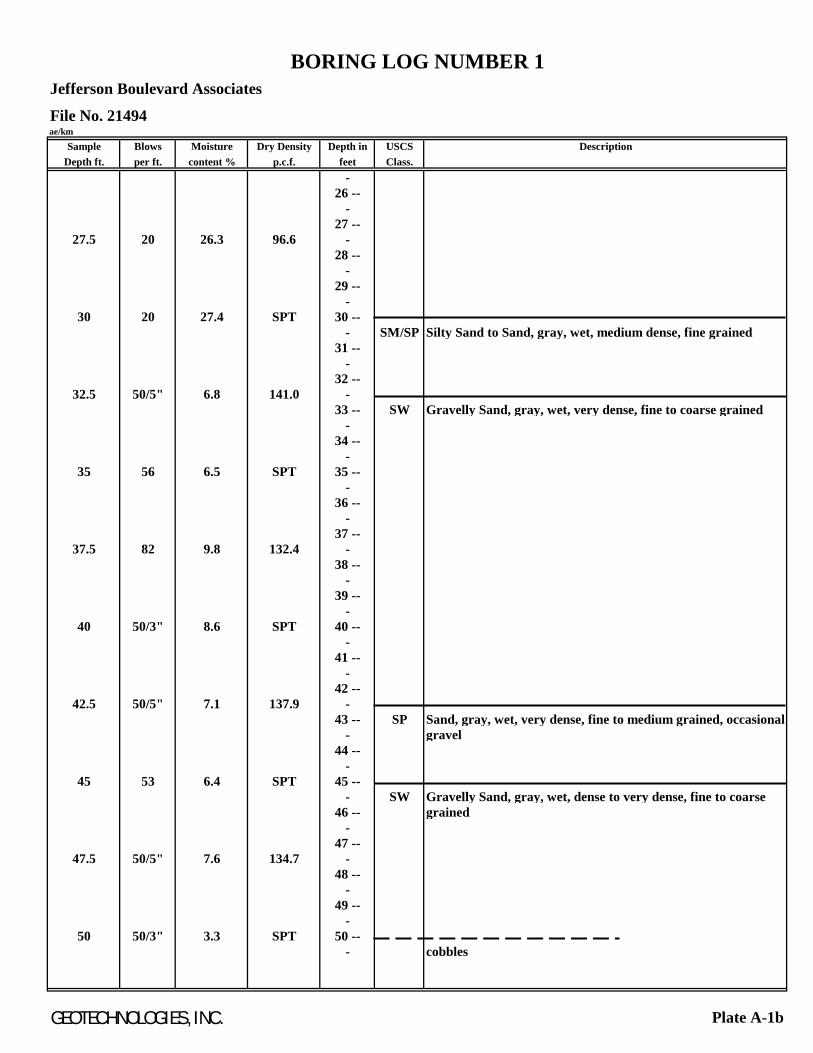
Jefferson Boulevard Associates
File No. 21494ae/km
Sample Blows Moisture Dry Density Depth in USCS DescriptionDepth ft. per ft. content % p.c.f. feet Class.
-26 --
-27 --
27.5 20 26.3 96.6 -28 --
-29 --
-30 20 27.4 SPT 30 --
- SM/SP Silty Sand to Sand, gray, wet, medium dense, fine grained31 --
-32 --
32.5 50/5" 6.8 141.0 -33 -- SW Gravelly Sand, gray, wet, very dense, fine to coarse grained
-34 --
-35 56 6.5 SPT 35 --
-36 --
-37 --
37.5 82 9.8 132.4 -38 --
-39 --
-40 50/3" 8.6 SPT 40 --
-41 --
-42 --
42.5 50/5" 7.1 137.9 -43 -- SP Sand, gray, wet, very dense, fine to medium grained, occasional
- gravel44 --
-45 53 6.4 SPT 45 --
- SW Gravelly Sand, gray, wet, dense to very dense, fine to coarse46 -- grained
-47 --
47.5 50/5" 7.6 134.7 -48 --
-49 --
-50 50/3" 3.3 SPT 50 --
- cobbles
GEOTECHNOLOGIES, INC. Plate A-1b
BORING LOG NUMBER 1
--- ---- -- -- -- -- -- -- -- -

Jefferson Boulevard Associates
File No. 21494ae/km
Sample Blows Moisture Dry Density Depth in USCS DescriptionDepth ft. per ft. content % p.c.f. feet Class.
-51 --
-52 --
52.5 100/4" 21.3 106.4 -53 -- SP Sand, gray, wet, very dense, fine grained, occasional cobbles
-54 --
-55 50/4" 21.6 SPT 55 --
-56 --
-57 --
57.5 50/4" 23.3 102.9 -58 --
-59 --
-60 50/5" 20.9 SPT 60 --
-61 --
-62 --
62.5 100/9" 24.7 99.7 -63 --
-64 --
-65 50/3" 18.9 SPT 65 --
-66 --
-67 --
67.5 100/10" 21.3 106.2 -68 --
-69 --
-70 50/5" 22.7 SPT 70 --
- Total Depth 70 feet71 -- Water at 24 feet
- Fill to 3 feet72 --
-73 -- NOTE: The stratification lines represent the approximate
- boundary between earth types; the transition may be gradual.74 --
- Used 8-inch diameter Hollow-Stem Auger75 -- 140-lb. Automatic Hammer, 30-inch drop
- Modified California Sampler used unless otherwise noted
SPT=Standard Penetration Test
GEOTECHNOLOGIES, INC. Plate A-1c
BORING LOG NUMBER 1

Jefferson Boulevard Associates Date: 09/15/17
File No. 21494 Method: 8-inch diameter Hollow Stem Augerae/km
Sample Blows Moisture Dry Density Depth in USCS DescriptionDepth ft. per ft. content % p.c.f. feet Class. Surface Conditions: Asphalt
0 -- 4.5-inch Asphalt, No Base-
1 -- FILL: Sandy Clay to Clayey Sand, dark brown, moist, stiff to- medium dense
2 --2.5 25 26.0 84.8 -
3 --- SM/ML ALLUVIUM: Silty Sand to Sandy Clay, dark gray, moist,
4 -- medium dense to stiff, fine grained-
5 7 29.1 SPT 5 --- CH Silty Clay, dark brown to yellowish brown, moist, medium firm
6 -- to stiff-
7 --7.5 15 32.8 90.1 -
8 ---
9 ---
10 6 29.1 SPT 10 ---
11 ---
12 --12.5 17 21.1 105.5 -
13 ---
14 ---
15 8 27.6 SPT 15 --- CL Sandy Clay, dark to yellowish brown, moist, medium firm to
16 -- stiff-
17 --17.5 15 30.7 95.8 -
18 -- SM/SP Silty Sand to Sand, dark gray, moist, medium dense, fine- grained
19 ---
20 6 34.1 SPT 20 --- CL Sandy Clay, dark gray, very moist, medium firm to stiff
21 ---
22 --22.5 20 33.5 91.6 -
23 ---
24 ---
25 6 32.3 SPT 25 ---
GEOTECHNOLOGIES, INC. Plate A-2a
BORING LOG NUMBER 2

Jefferson Boulevard Associates
File No. 21494ae/km
Sample Blows Moisture Dry Density Depth in USCS DescriptionDepth ft. per ft. content % p.c.f. feet Class.
-26 --
-27 --
27.5 17 36.9 84.9 -28 -- Sandy Clay, gray to dark gray, moist, stiff
-29 --
-30 8 37.6 SPT 30 --
- SM/CL Silty Sand to Silty Clay, gray, wet, medium dense to firm, fine31 -- grained
-32 --
32.5 50/3.5" 7.6 120.4 -33 -- CL/SW Sandy Clay to Gravelly Sand, gray to dark gray, wet, very dense
- to stiff, fine to coarse grained34 --
-35 42 8.7 SPT 35 --
- SW Gravelly Sand, gray, wet, dense, fine to coarse36 -- grained
-37 --
37.5 50/3.5" 7.8 138.5 -38 -- very dense
-39 --
-40 80 7.4 SPT 40 --
-41 --
-42 --
42.5 50/3" 22.9 99.3 -43 -- SP Sand, gray, wet, very dense, fine grained
-44 --
-45 92 19.2 SPT 45 --
-46 --
-47 --
47.5 50/5" 30.2 93.6 -48 --
-49 --
-50 82 29.7 SPT 50 --
-
GEOTECHNOLOGIES, INC. Plate A-2b
BORING LOG NUMBER 2
- -- -- -- -- -- -- -- -- -- -- -
- -- -- -- -- -- -- -- -- -- -- -
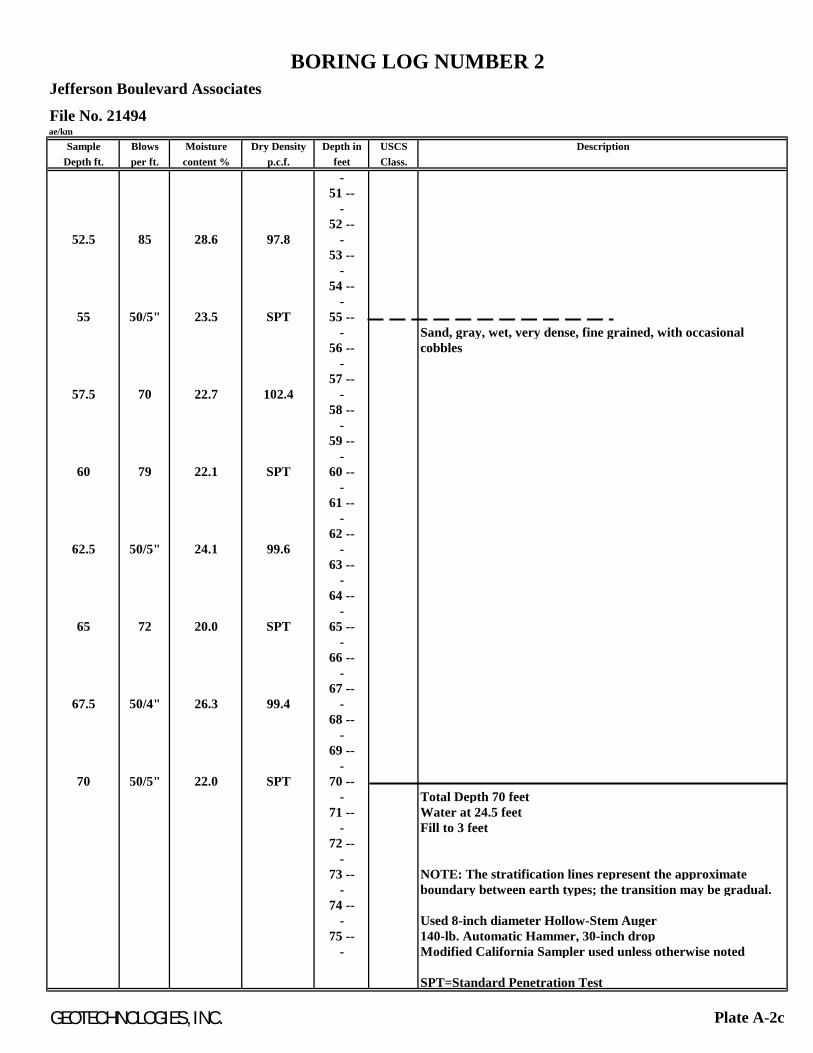
Jefferson Boulevard Associates
File No. 21494ae/km
Sample Blows Moisture Dry Density Depth in USCS DescriptionDepth ft. per ft. content % p.c.f. feet Class.
-51 --
-52 --
52.5 85 28.6 97.8 -53 --
-54 --
-55 50/5" 23.5 SPT 55 --
- Sand, gray, wet, very dense, fine grained, with occasional 56 -- cobbles
-57 --
57.5 70 22.7 102.4 -58 --
-59 --
-60 79 22.1 SPT 60 --
-61 --
-62 --
62.5 50/5" 24.1 99.6 -63 --
-64 --
-65 72 20.0 SPT 65 --
-66 --
-67 --
67.5 50/4" 26.3 99.4 -68 --
-69 --
-70 50/5" 22.0 SPT 70 --
- Total Depth 70 feet71 -- Water at 24.5 feet
- Fill to 3 feet72 --
-73 -- NOTE: The stratification lines represent the approximate
- boundary between earth types; the transition may be gradual.74 --
- Used 8-inch diameter Hollow-Stem Auger75 -- 140-lb. Automatic Hammer, 30-inch drop
- Modified California Sampler used unless otherwise noted
SPT=Standard Penetration Test
GEOTECHNOLOGIES, INC. Plate A-2c
BORING LOG NUMBER 2
- -- --- -- -- -- -- -- -- -- -- -

Geotechnologies, Inc. CPT Sounding No.: CPT-01Client: Jeferson Boulevard Associates Magnitude (Mw) = 6.8 Cumulative Liquefaction Settlement = 0.97 inches
File No.: 21494 Peak Ground Acceleration (g) = 0.65 g Depth to Historic High Water (feet) = 10.0 feet
0
5
10
15
20
25
30
35
0.0 20.0 40.0 60.0 80.0 100.0
N1(60)cs
0
5
10
15
20
25
30
35
0 100 200 300 400 500
Dep
th (f
eet)
Tip Resistance (tsf)
0
5
10
15
20
25
30
35
0.0 0.5 1.0 1.5 2.0 2.5
Frictional Ratio (%)
0
5
10
15
20
25
30
35
0 1 2 3 4 5
Ic
Ic
sands
silts
clays
0
5
10
15
20
25
30
35
0 20 40 60 80 100
Fines Content - FC (%)
Fines Content - FC (%)
Lab Fines Content
0
5
10
15
20
25
30
35
0.0 0.5 1.0 1.5 2.0 2.5
Factor of Safety
0
5
10
15
20
25
30
35
0 1 2 3
Settlement (in)
I\ ,,,...
...... ......... J
,...-
~ ,/ ,....., ,.,. ..... -- --1-c -~ _u ~-~
,-..- 3. ( ) =- ( - ,_ I<..
,, )
> / . ( v_,
I I l ' ( >
-i-,_., C:,,
«---~ ,, 'I / c:, r-r--,_
'\ ")
--= ) !?, ~-r--- 1'-- r-, - ·r--
'\ --
...-'"" I'--,-. -- ,...._ v '--~
L , .... J _.-U ;
'-.: I> r,, R ,-..._
l l) I).
' /
~ ) '
....
( )
(
( -=== < ( r--. i:::: r---::,.
I'\. ,-.. ..... _ -<C-
lj I 'i--. ,.,,,
"~- .J / ~ / ( ~1 I'\
~- - - -- ~
I I
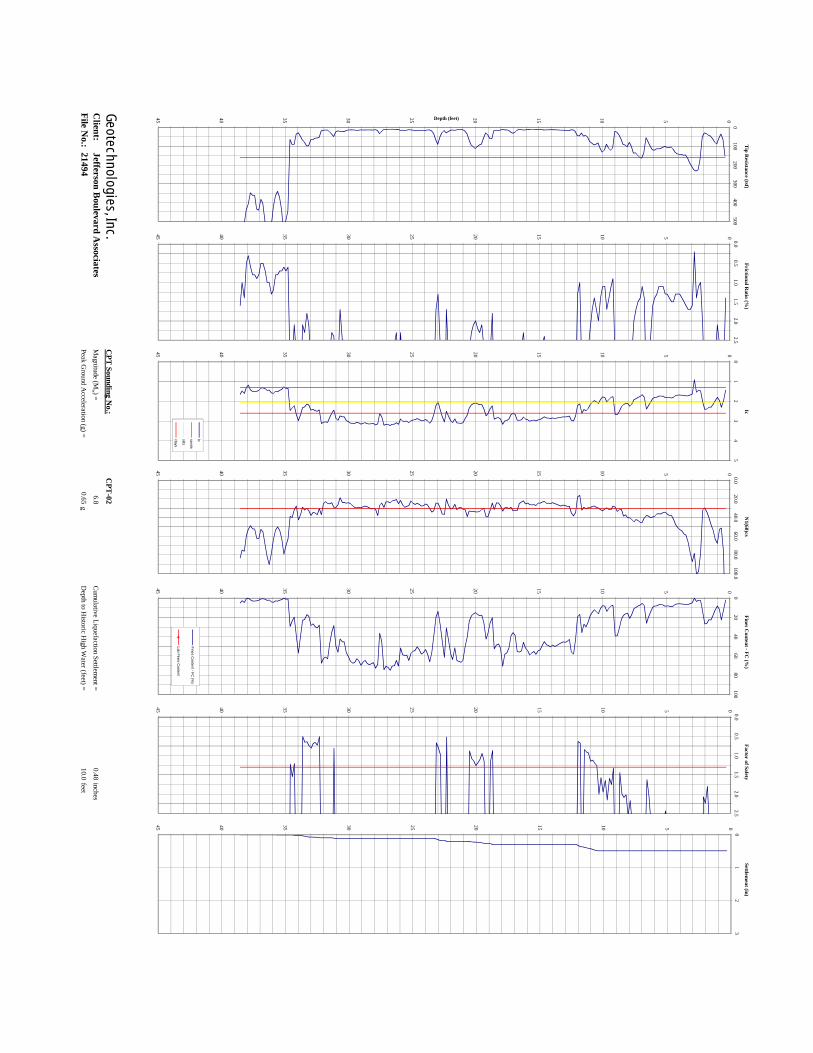
Geotechnologies, Inc.C
PT Sounding N
o.:C
PT-02
Client:
Jefferson Boulevard A
ssociatesM
agnitude (Mw ) =
6.8C
umulative Liquefaction Settlem
ent =0.48
inches
File No.:
21494Peak G
round Acceleration (g) =
0.65g
Depth to H
istoric High W
ater (feet) = 10.0
feet
051015202530354045
0.020.0
40.060.0
80.0100.0
N1(60)cs
051015202530354045
0100
200300
400500
Depth (feet)
Tip R
esistance (tsf)
051015202530354045
0.00.5
1.01.5
2.02.5
Frictional Ratio (%
)
051015202530354045
01
23
45
Ic
Icsands
silts
clays
051015202530354045
020
4060
80100
Fines Content -FC
(%)
Fines Content - FC
(%)
Lab Fines Content
051015202530354045
0.00.5
1.01.5
2.02.5
Factor of Safety
051015202530354045
01
23
Settlement (in)
,, V ' /v r\
u '\ \ J "' \. I\ I V I... I ' I
IV
l \ I I I
I I
I I 11 fi ll II I 0111 I I !I I I 111111 I I I 1111 I I 11 I • I I II I I i I I 111 1 I I I II II II
,..~ - 1 ,..I\ - ''1 I V1 r"~ I '~ \,_,1 ' V /Y
, - " ' ~ I" \,. I
I 111 - - -
-
~ I I I I I I I I I I I I I I I I I I I I I I I I I I I I I I I I I I I I I I I I I I I I I
I I ,, I "'\ I I I I A
1/'Jv Al \t I \I I I V1 ( I \ I\ I.I I V ✓
=' I I I I II I I V I
I r-, I\ I \I I I A ,.-1-'\
I I II ~ /\, / V .A J V ,A, \J -~ AA I \ A, V V '- I/
-
-
I I
H I 11 1111 111

Geotechnologies, Inc. CPT Sounding No.: CPT-03Client: Jefferson Boulevard Associates Magnitude (Mw) = 6.8 Cumulative Liquefaction Settlement = 0.54 inches
File No.: 21494 Peak Ground Acceleration (g) = 0.65 g Depth to Historic High Water (feet) = 10.0 feet
0
5
10
15
20
25
30
35
40
0.0 20.0 40.0 60.0 80.0 100.0
N1(60)cs
0
5
10
15
20
25
30
35
40
0 100 200 300 400 500
Dep
th (f
eet)
Tip Resistance (tsf)
0
5
10
15
20
25
30
35
40
0.0 0.5 1.0 1.5 2.0 2.5
Frictional Ratio (%)
0
5
10
15
20
25
30
35
40
0 1 2 3 4 5
Ic
Ic
sands
silts
clays
0
5
10
15
20
25
30
35
40
0 20 40 60 80 100
Fines Content - FC (%)
Fines Content - FC (%)
Lab Fines Content
0
5
10
15
20
25
30
35
40
0.0 0.5 1.0 1.5 2.0 2.5
Factor of Safety
0
5
10
15
20
25
30
35
40
0 1 2 3
Settlement (in)
---- ---- -') - r--- , 1(.,
,., / -- Lr-
_ ) --- " -'--" J I.I ,)
----r- ( ( ( I 1'-\.. I"--
1 ~l'I
.I
'l r---
/ __ .,
I.! {
I) IJ r---.._
( C ( <-'
l ',,- ---
I I ' k::, --=~ < '✓
~ -=== E:, J
--,_ '- :-, I'- "r-,.._ "-
I< ~ :-,
r -r-z, ,J Ir s::::--D
I) '7 ,.... ..... '-
(
11 ...,
\ '\
> I /'
~==~ ( '-
c~ r...
-2:,_ I~
' -~
,, --r--- \.. <, <
---'r,.
( ,,.,-
17 ---~
- F --- ~ - ~ -

Geotechnologies, Inc. CPT Sounding No.: CPT-04Client: Jefferson Boulevard Associates Magnitude (Mw) = 6.8 Cumulative Liquefaction Settlement = 0.66 inches
File No.: 21494 Peak Ground Acceleration (g) = 0.65 g Depth to Historic High Water (feet) = 10.0 feet
0
5
10
15
20
25
30
35
40
0.0 20.0 40.0 60.0 80.0 100.0
N1(60)cs
0
5
10
15
20
25
30
35
40
0 100 200 300 400 500
Dep
th (f
eet)
Tip Resistance (tsf)
0
5
10
15
20
25
30
35
40
0.0 0.5 1.0 1.5 2.0 2.5
Frictional Ratio (%)
0
5
10
15
20
25
30
35
40
0 1 2 3 4 5
Ic
Ic
sands
silts
clays
0
5
10
15
20
25
30
35
40
0 20 40 60 80 100
Fines Content - FC (%)
Fines Content - FC (%)
Lab Fines Content
0
5
10
15
20
25
30
35
40
0.0 0.5 1.0 1.5 2.0 2.5
Factor of Safety
0
5
10
15
20
25
30
35
40
0 1 2 3
Settlement (in)
' - ---I I\ .,,.-' " .....:;i:=-
_ ) _L:: r:;; _C::s > ? ;;,
'\ ' ' ,...- c.----
/-~
I ~
---- ' 1'- r---- :::, _I'--_
I
\ r > f
I I (p
) s I
I '-
\ < 7
' .. v < < --
) ,...- -...... I<:~ ·- '
") ·~ ---,- <:: I< <-- -I > > ' _a..
1(- ~ i\ I<'.> -r--..., c ':> \ , r-:::...., '--
I< " _... ) ~- t:::=-,..., ', ,~
r-- ( r---\ ' ':! -- ,_. :,. I> l
/ -i== <. ,._ <,_ -,-_
> I ) . IC lc: t-ca cf;~
'/ :::>
-- -- _!:l ri _ ..... -~ (. ;;
---__:::p- c---r---_ 1,.- j ", j
_j 1..-J ,f ,, ,_ __
.., - F ---- ~~- -
~ -

Geotechnologies, Inc. CPT Sounding No.: CPT-05Client: Jefferson Boulevard Associates Magnitude (Mw) = 6.8 Cumulative Liquefaction Settlement = 0.94 inches
File No.: 21494 Peak Ground Acceleration (g) = 0.65 g Depth to Historic High Water (feet) = 10.0 feet
0
5
10
15
20
25
30
35
40
0.0 20.0 40.0 60.0 80.0 100.0
N1(60)cs
0
5
10
15
20
25
30
35
40
0 100 200 300 400 500
Dep
th (f
eet)
Tip Resistance (tsf)
0
5
10
15
20
25
30
35
40
0.0 0.5 1.0 1.5 2.0 2.5
Frictional Ratio (%)
0
5
10
15
20
25
30
35
40
0 1 2 3 4 5
Ic
Ic
sands
silts
clays
0
5
10
15
20
25
30
35
40
0 20 40 60 80 100
Fines Content - FC (%)
Fines Content - FC (%)
Lab Fines Content
0
5
10
15
20
25
30
35
40
0.0 0.5 1.0 1.5 2.0 2.5
Factor of Safety
0
5
10
15
20
25
30
35
40
0 1 2 3
Settlement (in)
-- ,...._ '\ -- ...... It / l be-"-~-
- ,_ __ ..__ _C:::,
- <> -::::I-- I l / ..... I
I ..... ,_ ,._ (
"' J ...,, <,__
L5
I J I'\ I I<
;I' , ..... I ~
I«:: / ' < 1----
I f, I ' ) I /_, :-- ,.., 11... t> 1'--,__ (
' --= <e--~ I<: ~ ,.-- ...,_::= ) -., (_ ;, 11 1----
_,....~ ', J
- ,,, I> -,_ - 11....
"'> \I,
) ' \
{
/ ~ ;<. - 1"; -,-
I< ~>--- IC 1.- -;::i:,.
I 1-===1> \ ) )
I< -- ,_ < -- 1:::~ -1-=-
r---,-_ s:::: -== ~- '- ~------- ,___ :::::- r
.., _____ )
- F --- ~- ~ -

:24
.0de
gree
sc:
285.
0ps
f
PR
OJE
CT:
JEF
FER
SON
BLV
D A
SSO
CIA
TES
FIL
E N
O.:
214
94 P
LATE
: B
-1C
onsu
lting
Geo
tech
nica
l Eng
inee
rs
SHE
AR
TE
ST D
IAG
RA
M
Geot
echn
olog
ies,
Inc.
B1
@ 7
.5'
B1
@ 7
.5'
B1
@ 7
.5'
B2
@ 2
.5'
B2
@ 2
.5'
B2
@ 2
.5'
B2
@ 1
2.5'
B2
@ 1
2.5'
B2
@ 1
2.5'
B2
@ 2
2.5'
B2
@ 2
2.5'
B2
@ 2
2.5'
0.0
0.5
1.0
1.5
2.0
2.5
3.0
3.5
0.0
0.5
1.0
1.5
2.0
2.5
3.0
Shear Strength (KSF)
Nor
mal
Pres
sure
(KSF
)
Satu
rate
d Sh
ear
- - --\ \
- --- -- \ \
- -- -
\

:35
.0de
gree
sc:
125.
0ps
f
PR
OJE
CT:
JEF
FER
SON
BLV
D A
SSO
CIA
TES
FIL
E N
O.:
214
94 P
LATE
: B
-2C
onsu
lting
Geo
tech
nica
l Eng
inee
rs
SHE
AR
TE
ST D
IAG
RA
M
Geot
echn
olog
ies,
Inc.
B1
@ 3
2.5'
B1
@ 3
2.5'
B1
@ 3
2.5'
B1
@ 4
7.5'
B1
@ 4
7.5'
B1
@ 4
7.5'
B2
@ 3
7.5'
B2
@ 3
7.5'
B2
@ 3
7.5'
B2
@ 5
2.5'
B2
@ 5
2.5'
B2
@ 5
2.5'
0.0
0.5
1.0
1.5
2.0
2.5
3.0
3.5
0.0
0.5
1.0
1.5
2.0
2.5
3.0
Shear Strength (KSF)
Nor
mal
Pres
sure
(KSF
)
Satu
rate
d Sh
ear
- -- --
\ \
- -- - ...
\ I\ -
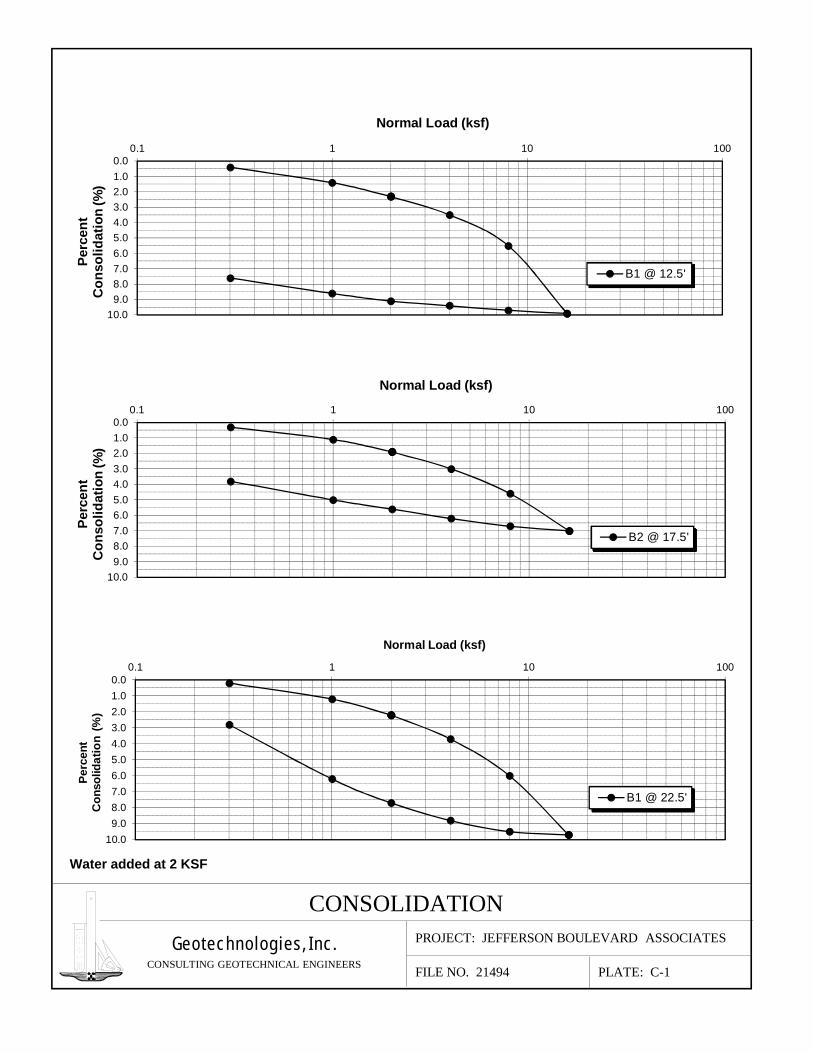
Water added at 2 KSF
PLATE: C-1
Geotechnologies, Inc.CONSULTING GEOTECHNICAL ENGINEERS
PROJECT: JEFFERSON BOULEVARD ASSOCIATES
CONSOLIDATION
FILE NO. 21494
0.01.02.03.04.05.06.07.08.09.0
10.0
0.1 1 10 100
Per
cen
tC
on
soli
dat
ion
(%)
Normal Load (ksf)
B1 @ 12.5'
0.01.02.03.04.05.06.07.08.09.0
10.0
0.1 1 10 100
Per
cen
tC
on
soli
dat
ion
(%)
Normal Load (ksf)
B2 @ 17.5'
0.01.02.03.04.05.06.07.08.09.0
10.0
0.1 1 10 100
Per
cen
tC
on
solid
ati
on
(%
)
Normal Load (ksf)
B1 @ 22.5'
- - -~ - - - ......
' ' " " " " - 1=~~
~~
' ' ' --
.. - - - - - -- - ... ~ ' ' ' -- I
I
~-~ - ~-~
-- - -•• -....... -r-...
"'" .... - ..... .... ' r-... ' IL. r-.. - I"-
-~~ - " -' -~~
- ' ~ ' ~~ '
-
-
-
•.•
-, -.-~ .....

Water added at 2 KSF
PLATE: C-2
Geotechnologies, Inc.CONSULTING GEOTECHNICAL ENGINEERS
PROJECT: JEFFERSON BOULEVARD ASSOCIATES
CONSOLIDATION
FILE NO. 21494
0.01.02.03.04.05.06.07.08.09.0
10.0
0.1 1 10 100
Per
cen
tC
on
soli
dat
ion
(%)
Normal Load (ksf)
B2 @ 27.5'
0.01.02.03.04.05.06.07.08.09.0
10.0
0.1 1 10 100
Per
cen
tC
on
soli
dat
ion
(%)
Normal Load (ksf)
B1 @ 37.5'
0.01.02.03.04.05.06.07.08.09.0
10.0
0.1 1 10 100
Per
cen
tC
on
solid
ati
on
(%
)
Normal Load (ksf)
B2 @ 42.5'
-- - -~ - -- -....... ,_ - r-,,.
~ ..... ... " - 1=~~ - " - ~~ - " ....
.... .... -
- -- - -
I -I
~-~
~-~
~-
-~~ - -~~
-
-
-
•.•
-,-.-~ .....

Jefferson Boulevard Associates, LLC File No. 21494
www.geoteq.com
COMPACTION/EXPANSION/SULFATE DATA SHEET
ASTM D-1557 Sample B1 @ 1’-5’ B2 @ 1’-5’
Soil Type CH SC
Maximum Density (pcf) 118.5 123.5
Optimum Moisture Content (percent) 13.0 11.5
EXPANSION INDEX Sample B1 @ 1’-5’ B2 @ 1’-5’
Soil Type CH SC
Expansion Index – UBC Standard 18-2 90 58
Expansion Characteristic High Moderate
SULFATE CONTENT Sample B1 @ 1’-5’ B2 @ 1’-5’
Sulfate Content (ppm) 2000 <250
PLATE D
Geotechnologies, Inc. Consulting Geotechnical Engineers
439 Western Avenue Glendale, California 91201-2837 818.240.9600 • Fax 818.240.9675
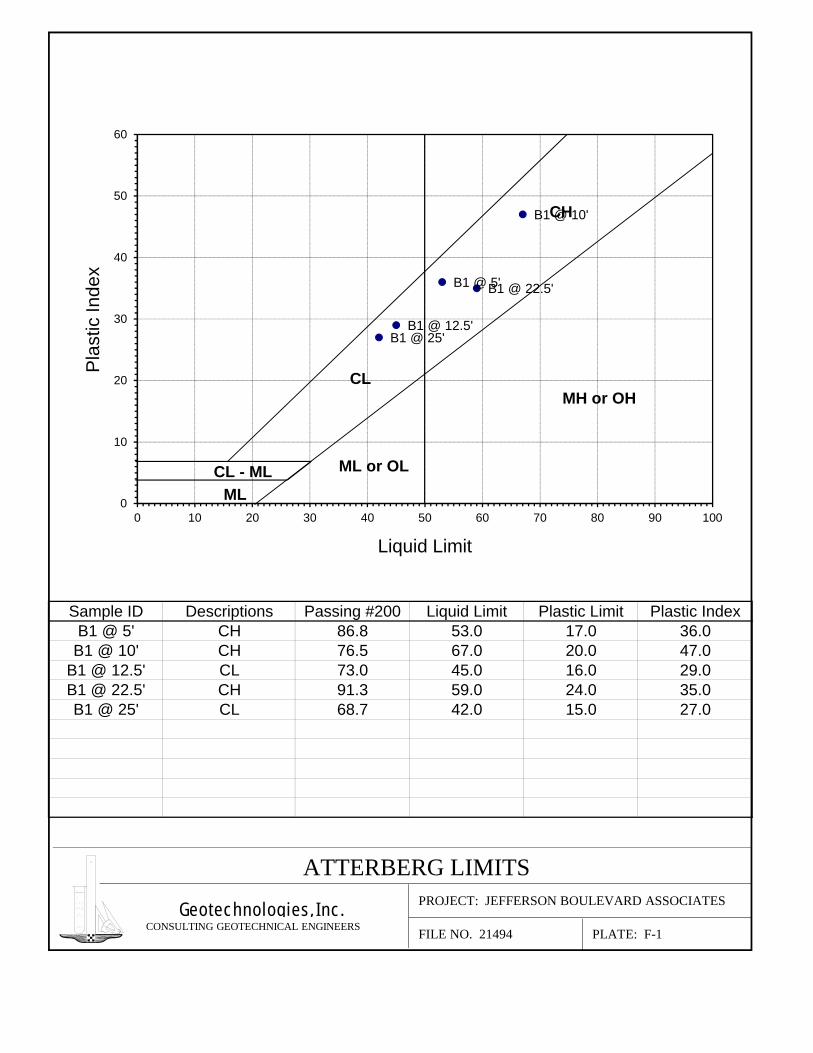
Sample ID Descriptions Passing #200 Liquid Limit Plastic Limit Plastic IndexB1 @ 5' CH 86.8 53.0 17.0 36.0
B1 @ 10' CH 76.5 67.0 20.0 47.0B1 @ 12.5' CL 73.0 45.0 16.0 29.0B1 @ 22.5' CH 91.3 59.0 24.0 35.0B1 @ 25' CL 68.7 42.0 15.0 27.0
PLATE: F-1
Geotechnologies, Inc.CONSULTING GEOTECHNICAL ENGINEERS
PROJECT: JEFFERSON BOULEVARD ASSOCIATES
ATTERBERG LIMITS
FILE NO. 21494
B1 @ 5'
B1 @ 10'
B1 @ 12.5'
B1 @ 22.5'
B1 @ 25'
0
10
20
30
40
50
60
0 10 20 30 40 50 60 70 80 90 100
Pla
stic
Inde
x
Liquid Limit
ML
ML or OL
CLMH or OH
CH
CL - ML
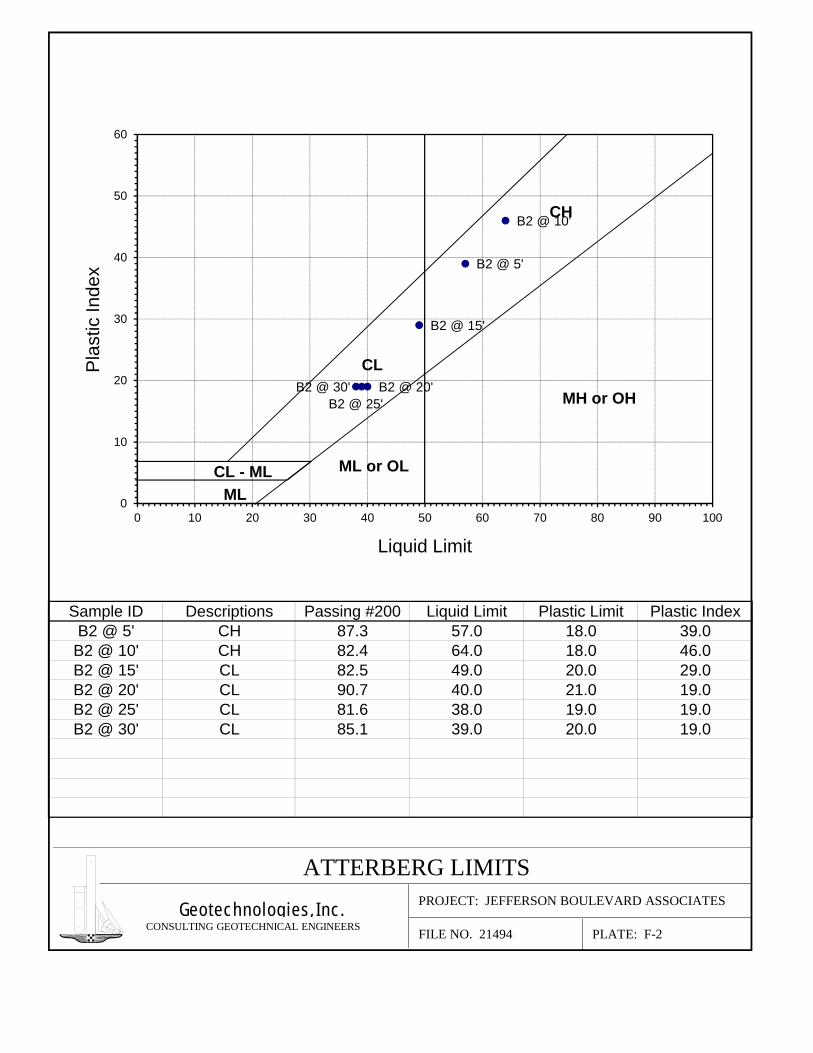
Sample ID Descriptions Passing #200 Liquid Limit Plastic Limit Plastic IndexB2 @ 5' CH 87.3 57.0 18.0 39.0
B2 @ 10' CH 82.4 64.0 18.0 46.0B2 @ 15' CL 82.5 49.0 20.0 29.0B2 @ 20' CL 90.7 40.0 21.0 19.0B2 @ 25' CL 81.6 38.0 19.0 19.0B2 @ 30' CL 85.1 39.0 20.0 19.0
PLATE: F-2
Geotechnologies, Inc.CONSULTING GEOTECHNICAL ENGINEERS
PROJECT: JEFFERSON BOULEVARD ASSOCIATES
ATTERBERG LIMITS
FILE NO. 21494
B2 @ 5'
B2 @ 10'
B2 @ 15'
B2 @ 20'B2 @ 25'
B2 @ 30'
0
10
20
30
40
50
60
0 10 20 30 40 50 60 70 80 90 100
Pla
stic
Inde
x
Liquid Limit
ML
ML or OL
CL
MH or OH
CH
CL - ML
/ / /
V V / • /
V • / / / /v ~v V
V -V /
/ / /
/
--
-
· ~ .......... = I

Geotechnologies, Inc.Project:Jefferson Boulevard AssociatesFile No.:21494Description:Liquefaction AnalysisBoring Numbe1
EARTHQUAKE INFORMATION:BOREHOLE AND SAMPLER INFORMATION:Earthquake Magnitude (M):6.8Borehole Diameter (inches):8Peak Ground Horizontal Acceleration, PGA (g):0.65SPT Sampler with room for Liner (Y/N):YCalculated Mag.Wtg.Factor:1.203LIQUEFACTION BOUNDARY:GROUNDWATER INFORMATION:Plastic Index Cut Off (PI):18Current Groundwater Level (ft):24.0Minimum Liquefaction FS:1.3Historically Highest Groundwater Level* (ft):10.0Unit Weight of Water (pcf):62.4* Based on California Geological Survey Seismic Hazard Evaluation Report
Depth toTotal UnitCurrentHistoricalField SPTDepth of SPTPlasticVeticalEffectiveFinesStressCyclic ShearCyclicFactor of SafetyLiquefactionBase LayerWeightWater LevelWater LevelBlowcountBlowcount#200 SieveIndexStressVert. StressCorrectedReductionRatioResistanceCRR/CSRSettlment
(feet)(pcf)(feet)(feet)N(feet)(%)(PI)vc, (psf)vc', (psf)(N1)60-csCoeff, rdCSRRatio (CRR)(F.S.)Si(inches)
1117.7UnsaturatedUnsaturated4586.836117.7117.713.61.000.4240.191Non-Liq.0.002117.7UnsaturatedUnsaturated4586.836235.4235.413.61.000.4230.191Non-Liq.0.003117.7UnsaturatedUnsaturated4586.836353.1353.113.61.000.4220.191Non-Liq.0.004117.7UnsaturatedUnsaturated4586.836470.8470.813.60.990.4200.191Non-Liq.0.005117.7UnsaturatedUnsaturated4586.836588.5588.514.10.990.4190.197Non-Liq.0.006117.7UnsaturatedUnsaturated4586.836706.2706.214.10.990.4170.197Non-Liq.0.007117.7UnsaturatedUnsaturated4586.836823.9823.914.10.980.4150.197Non-Liq.0.008124.4UnsaturatedUnsaturated4586.836948.3948.313.80.980.4140.191Non-Liq.0.009124.4UnsaturatedUnsaturated4586.8361072.71072.713.60.970.4120.187Non-Liq.0.0010124.4UnsaturatedUnsaturated4586.8361197.11197.113.10.970.4100.179Non-Liq.0.0011124.4UnsaturatedSaturated4576.5471321.51259.112.90.970.4280.176Non-Liq.0.0012124.4UnsaturatedSaturated4576.5471445.91321.112.70.960.4450.173Non-Liq.0.0013125.8UnsaturatedSaturated1412.573.0291571.71384.530.40.960.4590.671Non-Liq.0.0014125.8UnsaturatedSaturated1412.573.0291697.51447.929.90.950.4720.617Non-Liq.0.0015125.8UnsaturatedSaturated1412.573.0291823.31511.332.50.950.4830.896Non-Liq.0.0016125.8UnsaturatedSaturated1412.573.0291949.11574.731.90.940.4930.813Non-Liq.0.0017125.8UnsaturatedSaturated1412.573.0292074.91638.131.40.940.5020.745Non-Liq.0.0018125.7UnsaturatedSaturated5317.50.002200.61701.499.60.930.5102.0003.90.0019125.7UnsaturatedSaturated5317.50.002326.31764.798.60.930.5172.0003.90.0020125.7UnsaturatedSaturated5317.50.002452.01828.097.70.920.5232.0003.80.0021125.7UnsaturatedSaturated5317.50.002577.71891.396.80.920.5282.0003.80.0022125.7UnsaturatedSaturated5317.50.002703.41954.696.00.910.5332.0003.80.0023116.6UnsaturatedSaturated1622.591.3352820.02008.832.80.910.5370.886Non-Liq.0.0024116.6UnsaturatedSaturated1622.591.3352936.62063.032.40.900.5420.832Non-Liq.0.0025116.6SaturatedSaturated1622.591.3353053.22117.232.10.890.5450.785Non-Liq.0.0026116.6SaturatedSaturated72568.7273169.82171.415.90.890.5480.197Non-Liq.0.0027116.6SaturatedSaturated72568.7273286.42225.615.80.880.5510.195Non-Liq.0.0028122.0SaturatedSaturated72568.7273408.42285.216.20.880.5530.198Non-Liq.0.0029122.0SaturatedSaturated72568.7273530.42344.816.00.870.5550.196Non-Liq.0.0030122.0SaturatedSaturated72568.7273652.42404.415.90.870.5560.194Non-Liq.0.0031122.0SaturatedSaturated203068.703774.42464.040.30.860.5572.0003.60.0032122.0SaturatedSaturated203068.703896.42523.639.90.850.5572.0003.60.0033150.6SaturatedSaturated203068.704047.02611.839.40.850.5552.0003.60.0034150.6SaturatedSaturated203068.704197.62700.039.00.840.5532.0003.60.0035150.6SaturatedSaturated203068.704348.22788.238.50.840.5512.0003.60.0036150.6SaturatedSaturated563568.704498.82876.4102.00.830.5492.0003.60.0037150.6SaturatedSaturated563568.704649.42964.6101.30.820.5462.0003.70.0038145.3SaturatedSaturated563568.704794.73047.5100.60.820.5442.0003.70.0039145.3SaturatedSaturated563568.704940.03130.499.90.810.5422.0003.70.0040145.3SaturatedSaturated563568.705085.33213.399.30.810.5392.0003.70.0041145.3SaturatedSaturated1004068.705230.63296.2171.70.800.5372.0003.70.0042145.3SaturatedSaturated1004068.705375.93379.1170.70.790.5342.0003.70.0043147.7SaturatedSaturated1004068.705523.63464.4169.60.790.5312.0003.80.0044147.7SaturatedSaturated1004068.705671.33549.7168.50.780.5282.0003.80.0045147.7SaturatedSaturated1004068.705819.03635.0167.50.780.5252.0003.80.0046147.7SaturatedSaturated534568.705966.73720.390.90.770.5222.0003.80.0047147.7SaturatedSaturated534568.706114.43805.690.40.760.5191.9863.80.0048144.9SaturatedSaturated534568.706259.33888.189.90.760.5161.9713.80.0049144.9SaturatedSaturated534568.706404.23970.689.40.750.5131.9563.80.0050144.9SaturatedSaturated534568.706549.14053.189.00.750.5101.9423.80.0051144.9SaturatedSaturated1005068.706694.04135.6162.10.740.5071.9273.80.0052144.9SaturatedSaturated1005068.706838.94218.1161.30.740.5041.9133.80.0053144.9SaturatedSaturated1005068.706983.84300.6160.50.730.5011.9003.80.0054144.9SaturatedSaturated1005068.707128.74383.1159.70.720.4981.8863.80.0055144.9SaturatedSaturated1005068.707273.64465.6159.00.720.4951.8733.80.0056144.9SaturatedSaturated1005568.707418.54548.1158.30.710.4921.8603.80.0057144.9SaturatedSaturated1005568.707563.44630.6157.50.710.4891.8473.80.0058144.9SaturatedSaturated1005568.707708.34713.1156.80.700.4851.8353.80.0059144.9SaturatedSaturated1005568.707853.24795.6156.10.700.4821.8223.80.0060144.9SaturatedSaturated1005568.707998.14878.1155.50.690.4791.8103.80.0061144.9SaturatedSaturated1006068.708143.04960.6154.80.690.4761.7983.80.0062144.9SaturatedSaturated1006068.708287.95043.1154.20.680.4731.7863.80.0063144.9SaturatedSaturated1006068.708432.85125.6153.50.680.4701.7753.80.0064144.9SaturatedSaturated1006068.708577.75208.1152.90.670.4671.7643.80.0065144.9SaturatedSaturated1006068.708722.65290.6152.30.670.4641.7523.80.0066144.9SaturatedSaturated1006568.708867.55373.1151.70.660.4611.7423.80.0067144.9SaturatedSaturated1006568.709012.45455.6151.10.660.4581.7313.80.0068144.9SaturatedSaturated1006568.709157.35538.1150.50.650.4551.7203.80.0069144.9SaturatedSaturated1006568.709302.25620.6150.00.650.4531.7103.80.0070144.9SaturatedSaturated1006568.709447.15703.1149.40.640.4501.6993.80.00
Total Liquefaction Settlement, S =0.00inches
LIQUEFACTION EVALUATION (Idriss & Boulanger, EERI NO 12)
'

Geotechnologies, Inc.Project:Jefferson Boulevard AssociatesFile No.:21494Description:Liquefaction AnalysisBoring Numbe2
EARTHQUAKE INFORMATION:BOREHOLE AND SAMPLER INFORMATION:Earthquake Magnitude (M):6.8Borehole Diameter (inches):8Peak Ground Horizontal Acceleration, PGA (g):0.65SPT Sampler with room for Liner (Y/N):YCalculated Mag.Wtg.Factor:1.203LIQUEFACTION BOUNDARY:GROUNDWATER INFORMATION:Plastic Index Cut Off (PI):18Current Groundwater Level (ft):24.5Minimum Liquefaction FS:1.3Historically Highest Groundwater Level* (ft):10.0Unit Weight of Water (pcf):62.4* Based on California Geological Survey Seismic Hazard Evaluation Report
Depth toTotal UnitCurrentHistoricalField SPTDepth of SPTFines ContentPlasticVeticalEffectiveFinesStressCyclic ShearCyclicFactor of SafetyLiquefactionBase LayerWeightWater LevelWater LevelBlowcountBlowcount#200 SieveIndexStressVert. StressCorrectedReductionRatioResistanceCRR/CSRSettlment
(feet)(pcf)(feet)(feet)N(feet)(%)(PI)vc, (psf)vc', (psf)(N1)60-csCoeff, rdCSRRatio (CRR)(F.S.)Si(inches)
1106.8UnsaturatedUnsaturated7587.339106.8106.820.01.000.4240.272Non-Liq.0.002106.8UnsaturatedUnsaturated7587.339213.6213.620.01.000.4230.272Non-Liq.0.003106.8UnsaturatedUnsaturated7587.339320.4320.420.01.000.4220.272Non-Liq.0.004106.8UnsaturatedUnsaturated7587.339427.2427.220.00.990.4200.272Non-Liq.0.005106.8UnsaturatedUnsaturated7587.339534.0534.021.10.990.4190.291Non-Liq.0.006106.8UnsaturatedUnsaturated7587.339640.8640.821.10.990.4170.291Non-Liq.0.007106.8UnsaturatedUnsaturated7587.339747.6747.621.10.980.4150.291Non-Liq.0.008119.7UnsaturatedUnsaturated7587.339867.3867.320.40.980.4140.280Non-Liq.0.009119.7UnsaturatedUnsaturated7587.339987.0987.020.20.970.4120.275Non-Liq.0.0010119.7UnsaturatedUnsaturated7587.3391106.71106.719.20.970.4100.256Non-Liq.0.0011119.7UnsaturatedSaturated61082.4461226.41164.016.90.970.4300.222Non-Liq.0.0012119.7UnsaturatedSaturated61082.4461346.11221.316.50.960.4480.217Non-Liq.0.0013127.7UnsaturatedSaturated61082.4461473.81286.616.20.960.4630.212Non-Liq.0.0014127.7UnsaturatedSaturated61082.4461601.51351.915.90.950.4770.207Non-Liq.0.0015127.7UnsaturatedSaturated61082.4461729.21417.216.80.950.4890.217Non-Liq.0.0016127.7UnsaturatedSaturated81582.5291856.91482.520.40.940.4990.265Non-Liq.0.0017127.7UnsaturatedSaturated81582.5291984.61547.820.00.940.5080.258Non-Liq.0.0018125.2UnsaturatedSaturated81582.5292109.81610.619.70.930.5160.252Non-Liq.0.0019125.2UnsaturatedSaturated81582.5292235.01673.419.40.930.5230.246Non-Liq.0.0020125.2UnsaturatedSaturated81582.5292360.21736.219.10.920.5300.241Non-Liq.0.0021125.2UnsaturatedSaturated62090.7192485.41799.015.40.920.5350.195Non-Liq.0.0022125.2UnsaturatedSaturated62090.7192610.61861.815.20.910.5400.192Non-Liq.0.0023122.4UnsaturatedSaturated62090.7192733.01921.815.00.910.5440.190Non-Liq.0.0024122.4UnsaturatedSaturated62090.7192855.41981.814.80.900.5480.187Non-Liq.0.0025122.4SaturatedSaturated62090.7192977.82041.814.70.890.5510.185Non-Liq.0.0026122.4SaturatedSaturated62581.6193100.22101.814.60.890.5540.184Non-Liq.0.0027122.4SaturatedSaturated62581.6193222.62161.814.40.880.5560.182Non-Liq.0.0028116.2SaturatedSaturated62581.6193338.82215.614.80.880.5590.184Non-Liq.0.0029116.2SaturatedSaturated62581.6193455.02269.414.70.870.5610.183Non-Liq.0.0030116.2SaturatedSaturated62581.6193571.22323.214.50.870.5620.181Non-Liq.0.0031116.2SaturatedSaturated83085.1193687.42377.017.50.860.5640.212Non-Liq.0.0032116.2SaturatedSaturated83085.1193803.62430.817.40.850.5650.210Non-Liq.0.0033129.6SaturatedSaturated83085.1193933.22498.017.20.850.5640.207Non-Liq.0.0034129.6SaturatedSaturated83085.1194062.82565.217.00.840.5640.204Non-Liq.0.0035129.6SaturatedSaturated83085.1194192.42632.416.80.840.5630.202Non-Liq.0.0036129.6SaturatedSaturated42350.004322.02699.673.60.830.5622.0003.60.0037129.6SaturatedSaturated42350.004451.62766.873.10.820.5602.0003.60.0038149.3SaturatedSaturated42350.004600.92853.772.50.820.5582.0003.60.0039149.3SaturatedSaturated42350.004750.22940.671.90.810.5552.0003.60.0040149.3SaturatedSaturated42350.004899.53027.571.40.810.5512.0003.60.0041149.3SaturatedSaturated80400.005048.83114.4134.90.800.5482.0003.60.0042149.3SaturatedSaturated80400.005198.13201.3134.00.790.5452.0003.70.0043118.6SaturatedSaturated80400.005316.73257.5133.30.790.5442.0003.70.0044118.6SaturatedSaturated80400.005435.33313.7132.70.780.5422.0003.70.0045118.6SaturatedSaturated80400.005553.93369.9132.20.780.5412.0003.70.0046118.6SaturatedSaturated92450.005672.53426.1151.30.770.5392.0003.70.0047118.6SaturatedSaturated92450.005791.13482.3150.70.760.5372.0003.70.0048121.8SaturatedSaturated92450.005912.93541.7150.00.760.5352.0003.70.0049121.8SaturatedSaturated92450.006034.73601.1149.40.750.5332.0003.80.0050121.8SaturatedSaturated92450.006156.53660.5148.70.750.5312.0003.80.0051121.8SaturatedSaturated82500.006278.33719.9132.00.740.5292.0003.80.0052121.8SaturatedSaturated82500.006400.13779.3131.40.740.5271.9913.80.0053125.8SaturatedSaturated82500.006525.93842.7130.90.730.5241.9793.80.0054125.8SaturatedSaturated82500.006651.73906.1130.30.720.5211.9683.80.0055125.8SaturatedSaturated82500.006777.53969.5129.80.720.5191.9563.80.0056125.8SaturatedSaturated78550.006903.34032.9122.90.710.5161.9453.80.0057125.8SaturatedSaturated78550.007029.14096.3122.40.710.5131.9343.80.0058125.6SaturatedSaturated78550.007154.74159.5121.90.700.5111.9233.80.0059125.6SaturatedSaturated78550.007280.34222.7121.40.700.5081.9123.80.0060125.6SaturatedSaturated78550.007405.94285.9121.00.690.5051.9023.80.0061125.6SaturatedSaturated79600.007531.54349.1122.00.690.5021.8923.80.0062125.6SaturatedSaturated79600.007657.14412.3121.60.680.5001.8813.80.0063123.5SaturatedSaturated79600.007780.64473.4121.10.680.4971.8723.80.0064123.5SaturatedSaturated79600.007904.14534.5120.70.670.4941.8623.80.0065123.5SaturatedSaturated79600.008027.64595.6120.30.670.4921.8523.80.0066123.5SaturatedSaturated72650.008151.14656.7109.20.660.4891.8433.80.0067123.5SaturatedSaturated72650.008274.64717.8108.90.660.4871.8343.80.0068125.5SaturatedSaturated72650.008400.14780.9108.50.650.4841.8243.80.0069125.5SaturatedSaturated72650.008525.64844.0108.10.650.4811.8153.80.0070125.5SaturatedSaturated72650.008651.14907.1107.70.640.4791.8063.80.00
Total Liquefaction Settlement, S =0.00inches
LIQUEFACTION EVALUATION (Idriss & Boulanger, EERI NO 12)
'
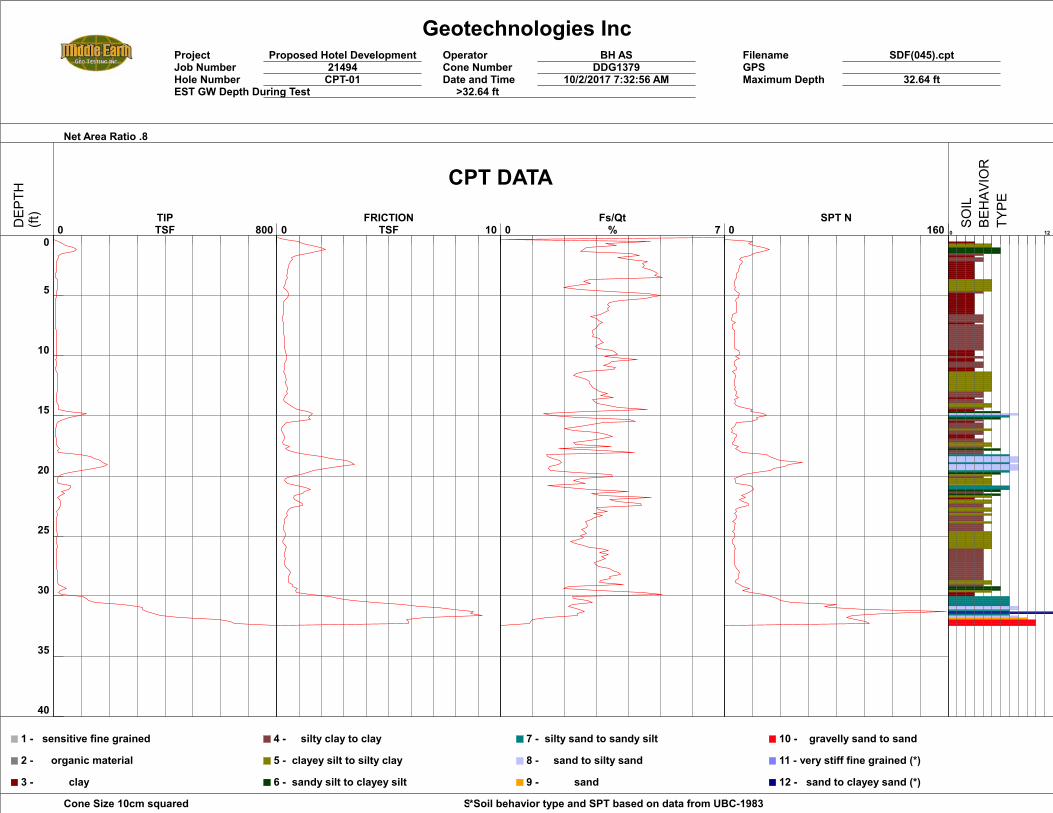
Geotechnologies IncProject Proposed Hotel Development Operator BH AS Filename SDF(045).cptJob Number 21494 Cone Number DDG1379 GPSHole Number CPT-01 Date and Time 10/2/2017 7:32:56 AM Maximum Depth 32.64 ftEST GW Depth During Test >32.64 ft
Net Area Ratio .8
Cone Size 10cm squared Soil Behavior Referance*Soil behavior type and SPT based on data from UBC-1983
0
5
10
15
20
25
30
35
40
0 800 TIPTSF 0 10
FRICTIONTSF 0 7
Fs/Qt% 0 160
SPT N0 12
1 - sensitive fine grained
2 - organic material
3 - clay
4 - silty clay to clay
5 - clayey silt to silty clay
6 - sandy silt to clayey silt
7 - silty sand to sandy silt
8 - sand to silty sand
9 - sand
10 - gravelly sand to sand
11 - very stiff fine grained (*)
12 - sand to clayey sand (*)
CPT DATA
DEP
TH(ft)
SOIL
BEHAV
IOR
TYPE
-11 111 I Ill Iii iJ:11 in
-
r> - [:::::: --.,
,,--~ > ■
{ ~
~ ( ..---5-
<__r -
> ) >
---.... ~ - I
~ l 3-- i
L.___ "-- --- -------r---.
·"" r C
-C
__.
-==== L === ::::>
-D> ---------------
_,_ - ~ > :;:=,--- ----- ___,-""
( '--t> - ~ \.______ • C - - f r D
( ?
( <-_ ) -:;
\ > (_ > '--
~ Ill "'------ - -----,_ - -____,
■ ■ ■ ■
■ ■ ■ ■
■ ■ ■ ■
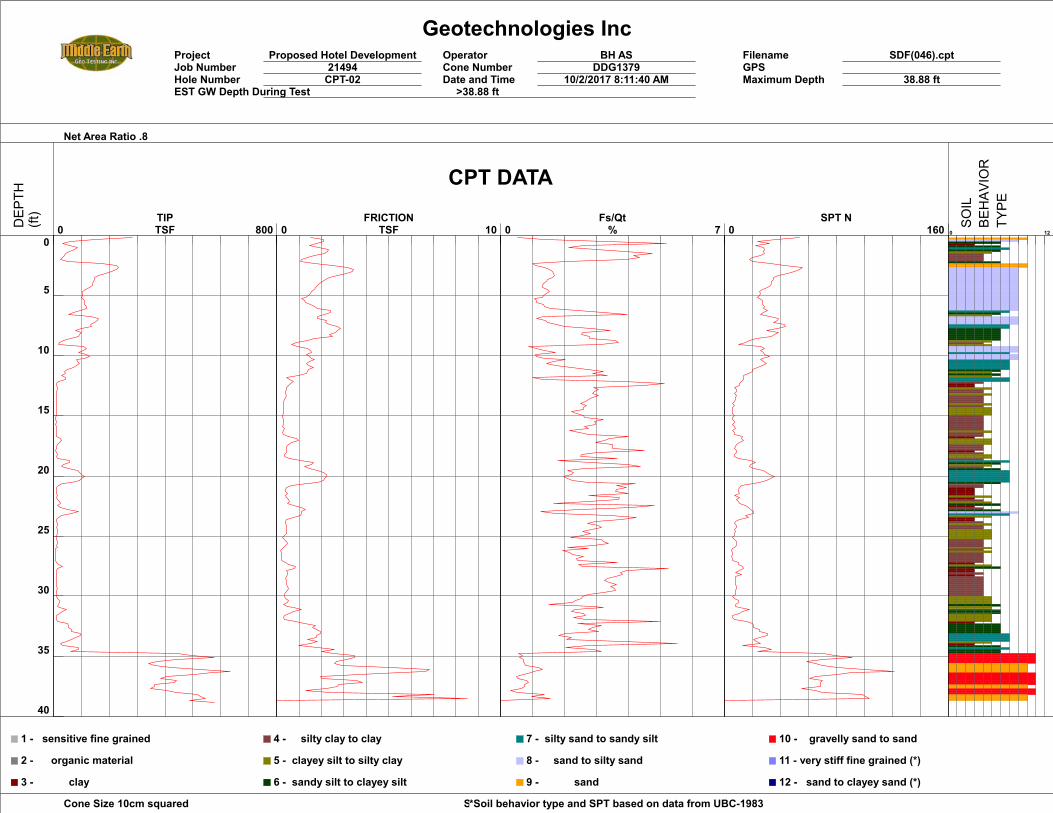
Geotechnologies IncProject Proposed Hotel Development Operator BH AS Filename SDF(046).cptJob Number 21494 Cone Number DDG1379 GPSHole Number CPT-02 Date and Time 10/2/2017 8:11:40 AM Maximum Depth 38.88 ftEST GW Depth During Test >38.88 ft
Net Area Ratio .8
Cone Size 10cm squared Soil Behavior Referance*Soil behavior type and SPT based on data from UBC-1983
0
5
10
15
20
25
30
35
40
0 800 TIPTSF 0 10
FRICTIONTSF 0 7
Fs/Qt% 0 160
SPT N0 12
1 - sensitive fine grained
2 - organic material
3 - clay
4 - silty clay to clay
5 - clayey silt to silty clay
6 - sandy silt to clayey silt
7 - silty sand to sandy silt
8 - sand to silty sand
9 - sand
10 - gravelly sand to sand
11 - very stiff fine grained (*)
12 - sand to clayey sand (*)
CPT DATA
DEP
TH(ft)
SOIL
BEHAV
IOR
TYPE
■
■
■
■
■
■
■
■
■
■
■
■
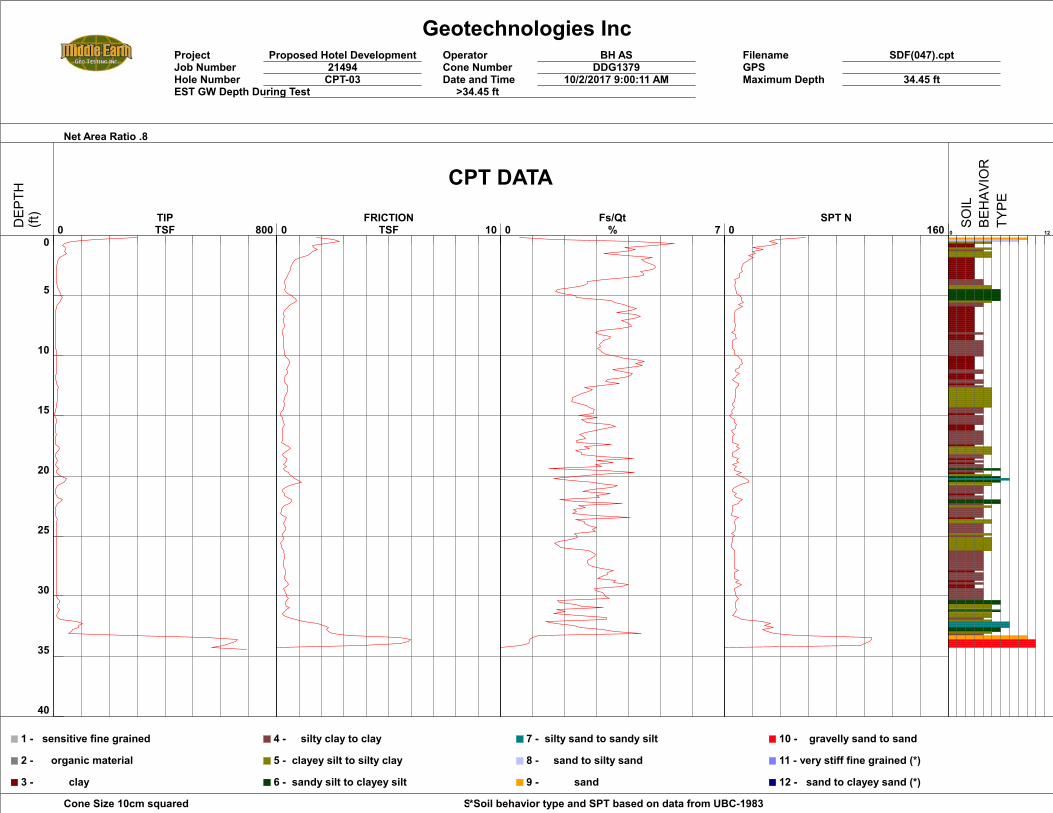
Geotechnologies IncProject Proposed Hotel Development Operator BH AS Filename SDF(047).cptJob Number 21494 Cone Number DDG1379 GPSHole Number CPT-03 Date and Time 10/2/2017 9:00:11 AM Maximum Depth 34.45 ftEST GW Depth During Test >34.45 ft
Net Area Ratio .8
Cone Size 10cm squared Soil Behavior Referance*Soil behavior type and SPT based on data from UBC-1983
0
5
10
15
20
25
30
35
40
0 800 TIPTSF 0 10
FRICTIONTSF 0 7
Fs/Qt% 0 160
SPT N0 12
1 - sensitive fine grained
2 - organic material
3 - clay
4 - silty clay to clay
5 - clayey silt to silty clay
6 - sandy silt to clayey silt
7 - silty sand to sandy silt
8 - sand to silty sand
9 - sand
10 - gravelly sand to sand
11 - very stiff fine grained (*)
12 - sand to clayey sand (*)
CPT DATA
DEP
TH(ft)
SOIL
BEHAV
IOR
TYPE
-11 111 I Ill Iii iJ:11 in
-
( v _;::::,-
~ --=---~
( i
{ ;s c___,-
I / ---------
> ; -=
< ::>
r ' ) I
? -.=::: 5
_s::- ~
< "- :::=>
~ t ~ ~ -:==--- -
~
f i-
--== :::=-;=-- -r-
~ I <;:
------( ~ } -._
~ -- l _;;,
'-----;, r----- <-- - ---- ~ • -----
--1 1--' -
■ ■ ■ ■
■ ■ ■ ■
■ ■ ■ ■
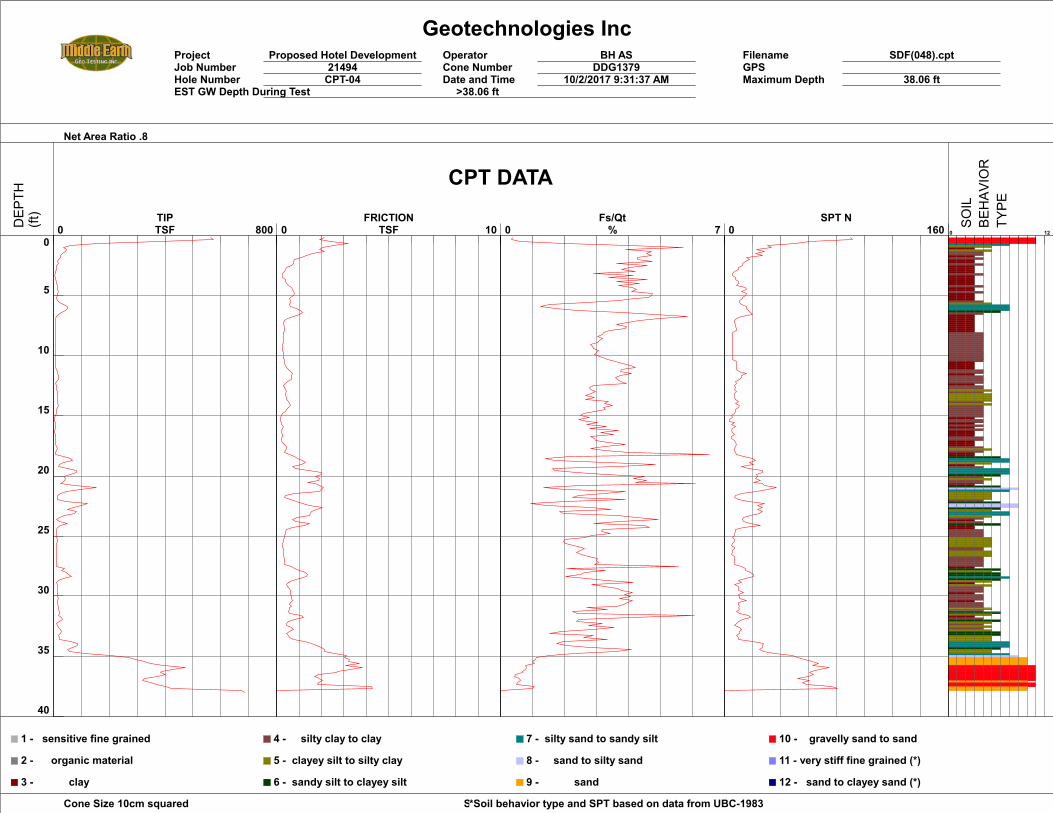
Geotechnologies IncProject Proposed Hotel Development Operator BH AS Filename SDF(048).cptJob Number 21494 Cone Number DDG1379 GPSHole Number CPT-04 Date and Time 10/2/2017 9:31:37 AM Maximum Depth 38.06 ftEST GW Depth During Test >38.06 ft
Net Area Ratio .8
Cone Size 10cm squared Soil Behavior Referance*Soil behavior type and SPT based on data from UBC-1983
0
5
10
15
20
25
30
35
40
0 800 TIPTSF 0 10
FRICTIONTSF 0 7
Fs/Qt% 0 160
SPT N0 12
1 - sensitive fine grained
2 - organic material
3 - clay
4 - silty clay to clay
5 - clayey silt to silty clay
6 - sandy silt to clayey silt
7 - silty sand to sandy silt
8 - sand to silty sand
9 - sand
10 - gravelly sand to sand
11 - very stiff fine grained (*)
12 - sand to clayey sand (*)
CPT DATA
DEP
TH(ft)
SOIL
BEHAV
IOR
TYPE
■
■
■
■
■
■
■
■
■
■
■
■

Geotechnologies IncProject Proposed Hotel Development Operator BH AS Filename SDF(049).cptJob Number 21494 Cone Number DDG1379 GPSHole Number CPT-05 Date and Time 10/2/2017 10:14:01 AM Maximum Depth 36.42 ftEST GW Depth During Test >36.42 ft
Net Area Ratio .8
Cone Size 10cm squared Soil Behavior Referance*Soil behavior type and SPT based on data from UBC-1983
0
5
10
15
20
25
30
35
40
0 800 TIPTSF 0 10
FRICTIONTSF 0 7
Fs/Qt% 0 160
SPT N0 12
1 - sensitive fine grained
2 - organic material
3 - clay
4 - silty clay to clay
5 - clayey silt to silty clay
6 - sandy silt to clayey silt
7 - silty sand to sandy silt
8 - sand to silty sand
9 - sand
10 - gravelly sand to sand
11 - very stiff fine grained (*)
12 - sand to clayey sand (*)
CPT DATA
DEP
TH(ft)
SOIL
BEHAV
IOR
TYPE
-11 111 I Ill Iii iJ:11 in
-
? ( ..s-
--=: -~ -
C '-------\ ~
/ / """2._ ! ;:>-
2 /
I
I - s
l ~ ./
I (
~ ?
~ '-z.._
~ ::e:
~ [) ...:::=-r -;>
IC <,. ~ > ,..
-------,__ -t::> ( "- 3 [>
,.. ,---f
,.. ) """' ---=
--:::,
~ ~ >
~ ~
~ l......._
;:>- "--> • c::::: ~ C r------ 7 i..---- c......
~ "'C ~1..
~
---- -r-----. <:,,._ ----- -,- ,- - - - - - ,-
■ ■ ■ ■
■ ■ ■ ■
■ ■ ■ ■