construction statistics, data users' conference · manufactured (mobile) ... 1997 construction...
TRANSCRIPT

U.S. Department of CommerceEconomics and Statistics Administration
BUREAU OF THE CENSUS
October 28, 1997
Data Users’Conference
Sta t i s t i csConstruction

October 28, 1997
Data Users’Conference
Sta t i s t i csConstruction
Issued March 1999
Department of CommerceWilliam M. Daley, Secretary
Robert L. Mallett, Deputy Secretary
Economics and Statistics AdministrationRobert J. Shapiro, Under Secretary for Economic Affairs
BUREAU OF THE CENSUSKenneth Prewitt, Director

BUREAU OF THE CENSUSKenneth Prewitt , DirectorBradford R. Huther , Deputy Director
Paula J. Schneider , Principal AssociateDirector for Programs
Frederick T. Knickerbocker , AssociateDirector for Economic Programs
Thomas L. Mesenbourg , Assistant Directorfor Economic Programs
MANUFACTURING AND CONSTRUCTIONDIVISION
William G. Bostic Jr., Chief
ECONOMICS
AND STATISTICS
ADMINISTRATION
Economics and StatisticsAdministration
Robert J. Shapiro , Under Secretaryfor Economic Affairs

Page
Preface . . . . . . . . . . . . . . . . . . . . . . . . . . . . . . . . . . . . . . . . . . . . . . . . . . . . . . . . . . . . . . . . . . . . . . . . . . . . . . . . . . . . . . . . . . . . . iv
Introduction . . . . . . . . . . . . . . . . . . . . . . . . . . . . . . . . . . . . . . . . . . . . . . . . . . . . . . . . . . . . . . . . . . . . . . . . . . . . . . . . . . . . . . . v
Section 1. Summary of Sessions
New Residential Construction . . . . . . . . . . . . . . . . . . . . . . . . . . . . . . . . . . . . . . . . . . . . . . . . . . . . . . . . . . . . . . . . . . 3Expenditures for Residential Improvements and Repairs. . . . . . . . . . . . . . . . . . . . . . . . . . . . . . . . . . . . . 7Value Put in Place Program . . . . . . . . . . . . . . . . . . . . . . . . . . . . . . . . . . . . . . . . . . . . . . . . . . . . . . . . . . . . . . . . . . . . 11Economic Census: Construction Sector . . . . . . . . . . . . . . . . . . . . . . . . . . . . . . . . . . . . . . . . . . . . . . . . . . . . . . . 15
Section 2. Overview of Construction Statistics Programs
Construction Statistics Program . . . . . . . . . . . . . . . . . . . . . . . . . . . . . . . . . . . . . . . . . . . . . . . . . . . . . . . . . . . . . . . . 21Brief Summary of Programs . . . . . . . . . . . . . . . . . . . . . . . . . . . . . . . . . . . . . . . . . . . . . . . . . . . . . . . . . . . . . . . . . . . . 23
Description of Individual Programs . . . . . . . . . . . . . . . . . . . . . . . . . . . . . . . . . . . . . . . . . . . . . . . . . . . . . . . . . . 23Summary Display of Construction Statistics Programs. . . . . . . . . . . . . . . . . . . . . . . . . . . . . . . . . . . . . 24
Program Details . . . . . . . . . . . . . . . . . . . . . . . . . . . . . . . . . . . . . . . . . . . . . . . . . . . . . . . . . . . . . . . . . . . . . . . . . . . . . . . . . 27Building Permits Program . . . . . . . . . . . . . . . . . . . . . . . . . . . . . . . . . . . . . . . . . . . . . . . . . . . . . . . . . . . . . . . . . . . . 27The Survey of Construction . . . . . . . . . . . . . . . . . . . . . . . . . . . . . . . . . . . . . . . . . . . . . . . . . . . . . . . . . . . . . . . . . . 28Value Put in Place Program. . . . . . . . . . . . . . . . . . . . . . . . . . . . . . . . . . . . . . . . . . . . . . . . . . . . . . . . . . . . . . . . . . 32Manufactured (Mobile) Home Program. . . . . . . . . . . . . . . . . . . . . . . . . . . . . . . . . . . . . . . . . . . . . . . . . . . . . . 36Economic Census: Construction Sector . . . . . . . . . . . . . . . . . . . . . . . . . . . . . . . . . . . . . . . . . . . . . . . . . . . . 37Construction Price Indexes. . . . . . . . . . . . . . . . . . . . . . . . . . . . . . . . . . . . . . . . . . . . . . . . . . . . . . . . . . . . . . . . . . . 37
Figures
1. Construction Statistics Programs . . . . . . . . . . . . . . . . . . . . . . . . . . . . . . . . . . . . . . . . . . . . . . . . . . . . . . . . . . . . . . 252. Survey of Construction and Related Activities . . . . . . . . . . . . . . . . . . . . . . . . . . . . . . . . . . . . . . . . . . . . . . . . 313. Summary of Value Put in Place Program . . . . . . . . . . . . . . . . . . . . . . . . . . . . . . . . . . . . . . . . . . . . . . . . . . . . . 33
Appendixes
A. Conference Agenda . . . . . . . . . . . . . . . . . . . . . . . . . . . . . . . . . . . . . . . . . . . . . . . . . . . . . . . . . . . . . . . . . . . . . . . . . . . . A-1B. Registered Participants. . . . . . . . . . . . . . . . . . . . . . . . . . . . . . . . . . . . . . . . . . . . . . . . . . . . . . . . . . . . . . . . . . . . . . . . . B-1C. Census Bureau Contacts . . . . . . . . . . . . . . . . . . . . . . . . . . . . . . . . . . . . . . . . . . . . . . . . . . . . . . . . . . . . . . . . . . . . . . C-1
iii
Contents
U.S. Census Bureau

Preface
The Census Bureau’s construction statistics programcommenced more than 30 years ago. In the years sincethen, the Bureau has tried to keep the program’s statisticssound and relevant by introducing specific improvements.Still, the program has not undergone an extensive reviewby a wide range of users during this whole period. The fall1997 Construction Statistics Data Users’ Conference rep-resented the Bureau’s attempt to remedy this oversight.
To conduct the review, the Bureau turned to data usersfor critique and guidance. After all, the proof of the puddinglies not in whether the cook thinks the recipe was followedscrupulously but in whether those served found the pud-ding suitable to their taste.
The format of the conference was perfectly straightfor-ward. We asked a good sized group of highly knowledge-able and expert users of our construction statistics threequestions:
• What are we doing right and what are we doing wrong?
• What data are we providing that you find useful and thatyou find of little use?
• What should we be doing differently?
The answers were many. Some were edged. Somewere provocative. All were useful. They made plain thatthere is a large, active, insightful user community thatrecognizes the common interest in better and more com-plete construction industry statistics. Users’ suggestionsand the Bureau’s responses occupy the pages that follow.
The views of the users define a work agenda that theBureau will try to pursue over the coming years. I say, try topursue because the abundance of worthwhile suggestionsfor improving construction statistics will almost certainlyoutrun the Bureau’s resources to implement the sugges-tions. Even statistical agencies must make tradeoffs amongopportunities, all of them good.
Still, the counsel of the data users will help the Bureaumake wiser choices than we might otherwise make. Theconference participants deserve our sincere thanks forthat. We give special thanks to our lead discussants:Michael Carliner, Kermit Baker, Robert Parker, and ManuelGutierrez. Each delivered a thoughtful and stimulatingintroduction to his session and provided an excellentjumping-off point for fruitful discussion.
Frederick T. Knickerbocker,Associate Director for Economic Programs
iv
U.S. Census Bureau

Introduction
The construction industry is continually undergoing changeand it is important that the Census Bureau provide users ofconstruction statistics a forum to discuss our programs andtheir needs as well as an opportunity to offer suggestionsfor change. In this spirit, the Census Bureau sponsored aConstruction Statistics Data Users’ Conference, held onOctober 28, 1997, at the Embassy Suites Hotel in Wash-ington, DC.
The goal of this conference was to generate suggestionsfor improving Census Bureau statistics on the constructionsector of the economy. The participants included statisti-cians and economists representing trade associations,government offices with diverse data needs, academia,trade unions, and industry. Participants discussed a broadvariety of perspectives and priorities, and topics includednew data items to collect, alternative data products, meth-odology issues, and product delivery options.
The conference was organized into four sessions corre-sponding to the four major areas of Census Bureauconstruction statistics: New Residential Construction, Expen-ditures for Residential Improvements and Repairs, ValuePut in Place Program, and the Economic Census: Con-struction Sector. For each session, a lead discussantintroduced the topic, described various highlights of ourprogram, and discussed unmet data needs and neededimprovements in data we are currently providing. Thepresentation by lead discussants was followed by a floordiscussion during which attendees had an opportunity tofollow up on issues already raised and to introducenew topics. The conference agenda is included in AppendixA and a list of registered participants is included in Appen-dix B.
In the first section of this report, we provide summariesof each of the conference’s four sessions, including a briefbackground on the subject, a summary of the lead discus-sant’s presentation and floor discussion, and Census Bureaucomments and responses.
In the second section, we present an overview of theConstruction Statistics Programs at the Census Bureau,describing our major surveys and related data collection
activities, and we show the relationship between theseactivities. Of particular interest are the flowcharts whichhelp trace out these relationships. Even though the over-view was prepared for this conference, it can serve as anindependent document providing an integrated descriptionof our programs.
For those wishing more detail on any of the surveysdiscussed in the overview, we recommend the technicalappendixes in the reports for each of the individual pro-grams. They provide detailed information on methodology,definitions, data limitations, and a wealth of other surveyspecific features. In Appendix C, we provide the name,telephone number, and E-mail address of a contact personfor each program as a source of more information.
We are gratified by the interest in our programs and theparticipation in each session. Many issues raised duringthe individual sessions were addressed by Census staffduring the floor discussions. In the sections entitled Cen-sus Bureau Comments and Responses, we attempt toaddress important issues not adequately covered in thediscussions. We appreciate the many comments and rec-ommendations offered and we apologize if any relevantremarks have been omitted from our summaries.
One recommendation that arose in each session focusedon the need for more cooperation among governmentagencies and between government agencies and the pri-vate sector. We heartily agree and in the individual ses-sions have indicated some of the cooperative work nowunder way. We are seeking more cooperative efforts withthe private sector and other agencies to take advantage ofexternal expertise and to increase consistency of ourprograms.
We are interested in hearing your needs and sugges-tions. Please use the Census Bureau contacts in AppendixC to provide feedback on our programs and products. OurInternet site, www.census.gov/conconf97, contains this docu-ment and paper copies are available from the Forms,Publications, and Customer Services Branch at 301-457-4769 or at [email protected].
v
U.S. Census Bureau

Summary of Sessions
Section 1

New Residential Construction
LEAD DISCUSSANT
Mr. Michael S. CarlinerStaff Vice PresidentNational Association of Home Builders1201 15th Street, N.W.Washington, DC 20005-2800
BACKGROUND
The Building Permits Survey (BPS) collects informationon building permits issued for private residential construc-tion. Information is collected from permit-issuing jurisdic-tions on number of permits issued, permit value, andnumber of units in new construction. Data are collectedmonthly from a sample of permit-issuing places and annu-ally from the remaining permit-issuing places. Monthlyestimates of Housing Units Authorized for the U.S. is aleading economic indicator. The Survey of Construction(SOC), which is sponsored in part by the Department ofHousing and Urban Development, collects and releasesinformation on residential units started, sold, and com-pleted each month. Every month field interviewers collectinformation directly from permit offices and builders. Inaddition to the monthly information, a variety of housingcharacteristics, such as unit price, number of bathrooms inunit, and size of unit, are released quarterly and annually.
LEAD DISCUSSANT
Mr. Carliner began by speaking very highly of theconstruction data series released by the Census Bureauand he had special praise for the new home authorizationsseries which he referred to as a premier data series interms of precision, timeliness, geographic detail, andrelevance. He also commented on the cooperativenessand responsiveness of Census staff working on construc-tion programs.
He described the National Association of Home Builders(NAHB) as a retailer of construction data, supplying infor-mation to its members and to other interested parties. Thisinformation is often based on statistics produced by theCensus Bureau. He observed that NAHB members useCensus data in business planning to decide on productmix, evaluate inventory, determine places to open newsales offices, and address a variety of other businessissues. He acknowledged the importance of this data to
government planners and to Federal offices, but cautionedthat we should not lose sight of the broad utility of our dataand should not focus our attention only on other govern-ment users. He observed that we should be more sensitiveto the needs of state and local government users indesigning our data products.
He discussed general areas in which he saw the needfor more attention on the part of the Bureau. He sees theneed for greater comparability in data released: compara-bility in time, over geographic areas and with other series.He also remarked that the Bureau can make better use ofdata already collected to make our products more valuable.For example, if the Bureau would develop local models fortime between permit and start, then users could better usepermit data to model starts from permits at the local level.If the Bureau were to collect permit value in SOC, then onecould model a relationship between permit value and salesprice which users could utilize with the extensive geo-graphic detail of the permit series. He also suggested wedo more to reconcile information between the SOC and thecensus of construction industries.
He asked that we provide more information about themethods we employ and their impact on our estimates. Forexample, he observed that in the SOC we occasionallyreclassify housing units to be different from their classifica-tion in the BPS. When we do so, we typically reclassifymultifamily houses (from BPS) to single family (in SOC).Accordingly, we produce higher estimates of new single-family construction in SOC than in the BPS. He feels that amore extensive discussion of this process should be readilyavailable.
Mr. Carliner also recommended that we prepare annualrevisions to our published monthly estimates when morecomplete information is available and he further suggestedthat we release more of our data on the Internet and makeit available in spreadsheet format so that it could bedownloaded directly.
Mr. Carliner ended his remarks with a list of specificrequests. He suggested that we:
• Collect and publish housing characteristics at time ofstart
• Obtain better information about type of financing
• Provide housing characteristics broken out by type offinancing
• Estimate starts on a state and/or metropolitan area basis
3
U.S. Census Bureau

• Publish county estimates for permits
• Publish manufactured (mobile) homes information bymetropolitan/nonmetropolitan
• Record and utilize information about canceled sales
FLOOR DISCUSSION
There was wide agreement that data from the BuildingPermits Survey (BPS) are of excellent quality, detail, andtimeliness. There were requests to resume collectingpermit information on nonresidential construction and onimprovements. These data were recently dropped from thesurvey as a cost-saving measure. One user commentedthat the BPS sample might be cut in order to direct moreresources elsewhere. Others were opposed to this sugges-tion because they did not want to reduce the very highquality of BPS estimates.
There was a lengthy discussion on the usefulness of thecompletions data. Some users did not find it useful whileothers did. One user suggested that we reduce the numberof single-family housing units in the SOC sample followedto completion. Others did not agree. It was noted that wecollect more complete information about characteristicsafter completion than at any earlier stage and reducing thenumber of cases followed to completion would have anadverse effect on characteristic estimates.
There was also a suggestion to reduce the number ofcases followed to completion for multifamily units. It wasnoted that doing so will have an adverse effect on multi-family absorption estimates produced from the Survey ofMarket Absorption. There were requests for more detailedinformation on multifamily housing, such as number ofunits constructed for senior housing, as well as informationabout other specialized uses of multifamily structures.
There were requests for more detailed geographic infor-mation from SOC. Several users said that regional esti-mates were not very useful and suggested that they bediscontinued. It was observed that housing and demo-graphic statistics from other programs are released byregion and by having regional information for constructionstatistics allowed for analysis and comparability acrossprograms. There was a consensus that regional informa-tion should not be discontinued unless they were replacedwith estimates at a lower level, such as Census division orstate.
Another topic discussed was the utility of the housevalue as recorded on the building permit. The permit valueof a house may not reflect what the house would sell forand is not comparably reported across geographic areas.One user observed that even though there is little utilityacross areas, for specific geographic areas the permitvalue of a house is useful for tracking change over time. Asuggestion was made to add the permit value of a house toall single-family houses in the SOC and to publish this
information. Doing so would enable data users to modelsales price from the permit value of a house and thus beable to estimate sales price at the levels of geography inthe BPS.
The Census Bureau raised the issue of delaying thepublication of preliminary sales estimates. Noting that asale under SOC is a contract signing rather than a closing,we discussed the problem in deriving preliminary estimatesbecause of contract signings prior to the issuance of apermit. Sales estimates sometimes have large revisions,due in part to sales before a permit is issued. Census staffexpressed the concern that releasing early estimates (whichare subject to significant revisions) may not be a service tothe user community. There was strong opposition to delay-ing preliminary sales estimates. Attendees noted that theyunderstand that preliminary estimates are revised and theyurged us to continue providing statistical information thatindicates the precision of the estimates and the limitationsof the data.
The Bureau raised the issue of unauthorized construc-tion in permit-issuing jurisdictions. The Census Bureaucurrently inflates estimates of single-family starts, salesand completions by 3.3 percent to account for unautho-rized (illegal) new home construction in permit-issuingareas. We believe that unauthorized building in permit-issuing areas is at a much lower level and we proposeeliminating the 3.3 percent adjustment factor.
Attendees agreed that there was little unauthorized newhome construction in permit-issuing areas and that the 3.3percent factor is not warranted. There was concern that inremoving the factor from our estimates we would introducea discontinuity in our series. Attendees requested that anyactions to remove the 3.3 percent factor be done in amanner to minimize the discontinuity in the starts, sales,and completions series. In particular, they suggested thatreductions in that adjustment factor be introduced gradu-ally over time or that adjustments be carried back as arevision to avoid sudden breaks in series.
CENSUS BUREAU COMMENTS ANDRESPONSES
We would like to take this opportunity to describe recentand ongoing activities for the SOC. One of the recent majorimprovements has been the introduction of data collectionusing laptop computers. The conversion to ComputerAssisted Personal Interviews (CAPI) has given us greatercontrol on the data collection activities and the ability toprocess data more quickly. Along with the introduction ofCAPI, we have instituted a recheck operation (verificationof a sample of interviewer data) as a quality control activity.We will move to a new processing system in the year 2000and are using the opportunity to introduce changes insurvey processing and products. We have revamped themonthly and quarterly report series to make the formatmore consistent across reports and to make them easier to
U.S. Census Bureau
4

use. We are investigating a proposal to eliminate the C21report—New Residential Construction in Selected Metro-politan Areas—because we believe the utility of this reportdoes not justify the resources to produce it. We will beeliminating the 3.3 percent upward adjustment to estimatesof starts, sales, and completions which compensated forunauthorized new home construction in permit-issuingareas in the past. There is very little evidence of significantunauthorized new home construction in permit-issuingareas at present. We plan to introduce annual revisions toall data series starting with data year 1999. Based on moreaccurate information, we will revise all monthly estimatesfor the year 2000 in May of 2001.
We agree with Mr. Carliner’s comments on the need forgreater comparability in estimates and improved dataaccessibility. We added a question on the 1997 EconomicCensus, Construction Sector about residential starts in aneffort to investigate comparability in data collection betweenthese programs. We are conducting an analysis of datacollected in the Value Put in Place (VIP) program with datacollected in the Census Bureau’s Annual Capital Expendi-ture Survey (ACES). (In fact, we use ACES data tobenchmark VIP estimates of new industrial construction.)This past summer we conducted an extensive comparisonof C50 estimates of residential improvements and repairexpenditures with remodeling estimates from the AmericanHousing Survey.
We currently release a large amount of data in electronicformat. Historic data for building permits, housing starts,new home completions, new home sales, and housingcharacteristics are all available on the Internet in spread-sheet format. In addition, the press releases for the aboveseries are also in spreadsheet format. Our more detailedstatistics, such as building permits by state, MSA, andindividual permit office are available in ASCII commadelimited files for purchase. These can be imported tospreadsheets or databases.
We provide microdata files from the SOC which includeall information we collect for new single-family houses inour sample. Household records are coded to CensusDivision which will allow smaller area estimation than ourpublished estimates. This file can be employed to obtaincross-classified detail breakouts beyond estimates releasedby the Census.
Mr. Carliner observed that we should not neglect theneeds of the private sector in designing our data releases.We are very mindful that our data are valuable well beyondthe government sector and we continue to work with a widerange of users in trade associations, businesses, andeconomic planners to meet their needs. To the extent thatour basic programs are funded by government agencies tomeet their data needs, these needs will continue to be aprimary program responsibility.
He also urged that we take care to provide informationon our methods and procedures. We do provide a consid-erable amount of information about our methods, assump-tions, and data quality as technical notes in our publication.These address the needs of most users. For those whowant more information on specific topics, we gladly provideinternal memorandum or other documentation and willinglymeet with them to detail our activities.
Mr. Carliner listed about ten areas in which he would liketo see us produce estimates and conduct more analysis.We appreciate his suggestions and do see how the analy-sis and models he is suggesting will provide more informa-tion from the data we already collect and process. Inevaluating the merits of his proposals, we will consider theexpected quality of estimates and how widely they will beused in determining whether resources and opportunitycosts in producing them justify the benefits.
There was a suggestion during the floor discussion forcutting the BPS sample as a money-saving measure,however, there was a strong consensus against doing so.The BPS estimates are among the finest produced by theCensus and we are not eager to reduce their quality. Notonly do permit estimates have very low relative standarderrors, they provide small area information monthly and weconduct an annual census of all permit-issuing areas in theNation. Since building permit information is based on publicdocuments, there are no confidentiality limitations on mak-ing this information broadly available.
In addition to the wide public use of permit information,data from BPS also are used in other construction statisticsprograms. We ratio adjust information collected in SOC topermit estimates to obtain more precise estimates of starts,sales, and completions and since new home starts andsales information is used in the VIP program, the permitestimates have an impact for that program as well. Fur-thermore, permit information is used by the Census Bureau’sdemographic area to develop intercensal household esti-mates and to augment samples for ongoing survey pro-grams.
In response to a question raised by Census staff as tothe utility of estimates of permit value for new single-familyconstruction in the BPS, attendees noted that estimates ofhouse value from permits are of value, especially formeasuring change over time. Based on these comments,we will continue to collect and publish permit value. Censusstaff also raised the question as to whether we shouldeliminate preliminary estimates because they are oftensubject to large revisions, especially new home sales.Attendees expressed the opinion that preliminary esti-mates are valuable to them, even though they are laterrevised, and suggested there be no changes in policy.Based on these comments, we will continue to releasepreliminary estimates.
U.S. Census Bureau
5

Expenditures for Residential Improvements and Repairs
LEAD DISCUSSANT
Dr. Kermit BakerDirector, Remodeling Futures ProgramJoint Center for Housing StudiesHarvard University79 John F. Kennedy StreetCambridge, MA 02138
BACKGROUND
An important component of the Census Bureau’s Con-struction Value Put in Place (VIP) program are the esti-mates for expenditures for residential improvements andrepairs. These estimates are released in the C50 report—Expenditures for Residential Improvements and Repairs—and are based on the sample selected for the ConsumerExpenditure Survey (CES). We derive estimates for owner-occupied units directly from information collected quarterlyon the CES. Owners of vacant units, rental units andvacation homes in the CES sample are mailed a question-naire from the Survey of Residential Alterations and Repairs(SORAR), through which we collect improvement andrepair information corresponding to information from theCES.
Information on residential improvements and repairsalso is collected in the American Housing Survey (AHS).The AHS is conducted by the Census Bureau every 2 yearsand is sponsored by the Department of Housing and UrbanDevelopment (HUD). Prior to 1996, Census collected infor-mation on residential improvements in the Building PermitsSurvey, however, that data collection ceased in 1996because of budget constraints.
LEAD DISCUSSANT
Dr. Baker began his discussion by observing that expen-ditures for improvements and repairs represent a majorcomponent of all construction spending and are a signifi-cant contributor to the gross domestic product. As such,there should be better coverage of activities in this areaand expenditures should be measured more completelyand in greater detail than is currently the case. He isconcerned that C50 estimates of residential expendituresfor improvements and repairs may be low and that belief issupported by observing that C50 estimates are lower thanthose derived from the AHS. Taking a broad view, Dr. Baker
proceeded to discuss five areas in which there needs to bemore work to improve our estimates and data utility, whichhe characterized as benchmarking, composition, tracking,geography, and seasonality.
Dr. Baker observed that he believes we underestimatethe level of activity in the C50, in part, because wesystematically miss some sources of expenditures forresidential improvements and repairs. In particular, heobserved that we are missing expense information onbuildings that convert from nonresidential to residentialuse.
He observed that because the sample for the CES isfairly small and not designed specifically for improvementsand repairs information, we have large weights which addvariability to our estimates. In addition, the Bureau intro-duces a downward bias in estimates because large expen-ditures when combined with large weights are viewed asoutlier observations, and their contribution to estimates issystematically diminished by reducing the weights.
He observed that the AHS recently started asking formore project detail and when homeowners are prodded fordetail, the level of expenditures increases. He suggestedthat pressing for details improves homeowners’ recall andrecommended that we do more to prompt respondents formore complete information on the CES.
Dr. Baker would like to see more detailed breakouts ofinformation in our reports. For example, large projects,such as totally remodeling a kitchen, are in the samecategories as small projects, such as installing a newfaucet in a sink. (Both are under kitchen improvements inthe C50.) In addition, different types of households aregrouped together. He would like to see information brokenout by type of household.
Dr. Baker discussed the need to place an expenditure inthe actual month in which it occurred. He also observedthat estimates are often not available until 6 or 9 monthsafter the reference period. Improvements in monthly allo-cations and timeliness will allow users to better measuretrends and detect changes in improvement and repairactivity. Given the way in which we collect the informationfor our improvement and repair estimates, he did not see asolution to this problem.
Dr. Baker observed that data users would like moredetailed geography. He feels it is difficult to do meaningfulanalysis with just data from the four Census regions and
7
U.S. Census Bureau

noted that information on improvements from the BuildingsPermits Survey was valuable because it was timely andhad small area information which could be used to tracklocal trends.
Dr. Baker said that the current estimates of improvementand repair activity do a poor job tracking seasonality. Oneproblem is that the variability of our quarterly estimatesobscures seasonality. Contractors would like to have abetter understanding of the seasonality of improvementand repair activity so they can better plan for labor demands.
After raising these issues, Dr. Baker asked where we gofrom here. He observed that completeness and detail arehard to achieve along with rapid data collection anddissemination. He raised the question of whether a single-data collection instrument can meet all current needs.
Dr. Baker discussed the potential of more cooperativeefforts among Federal agencies as well as between Fed-eral agencies and the private sector. In particular, he notedthe interest in improvement and repair statistics on the partof HUD and asked if HUD and Census can better coordi-nate efforts to produce estimates of residential improve-ments and repairs. He also mentioned the monthly home-owner study conducted by the National Association ofHome Builders (NAHB) and asked whether a joint effortbetween Census and the NAHB could be profitable. Henoted that the Joint Center for Housing Studies at Harvardis working with members of the remodeling industry inefforts to estimate improvement and repair activity and theytoo would be glad to cooperate with Census in a joint effort.
Dr. Baker concluded his remarks by asking if Censuscould make more microdata files on residential improve-ments and repairs available to the public.
FLOOR DISCUSSION
The Census Bureau recently stopped collecting informa-tion on authorizations for residential improvements on theBuilding Permits Survey (BPS). It was observed that esti-mates for residential improvements from permits werequite different from estimates in the C50. For one thing,many individuals (and contractors as well) often do not getpermits for remodeling jobs. In addition, there is littlecomparability in permit information across geographic areas.It was observed that within a single permit-issuing jurisdic-tion, monthly information on permit value for remodelingwas an indicator of movement in the industry and the localinformation was valuable.
A number of attendees expressed the belief that esti-mates in the C50 are low. Several made the observationthat the CES was not designed to collect information onresidential improvements and repairs and that is a sourceof many of the problems.
It was observed that the SORAR and CES have smallsample sizes (for the purpose of estimating improvementand repair expenditures), which results in high variabilityfor estimates of value, as well as for estimates of period to
period change. One attendee observed that difficultiesnotwithstanding, it is important to attempt to measuretrends and to develop seasonal information. Large sam-pling weights also lead to large outliers which, whenremoved from our quarterly estimates, cause a downwardbias. One person recommended we do an annual adjust-ment to add back the total value removed.
Estimates of residential improvements and repairs derivedfrom the AHS are higher than those published in the C50and there was a suggestion that we compare programsand try to understand why there are differences. Thedifferent manners in which these two surveys are con-ducted and the way questions are asked may account forsome differences in estimates. For example, the AHS asksrespondents about expenditures over a 2-year period andthere may be telescoping of information into that periodfrom an earlier time frame. The CES asks about activityover a 3-month period which may introduce recall problemsof a different nature. It was noted that the AHS is currentlyundergoing a review of methodology which may present anopportunity for increasing comparability between these twosurveys. Unfortunately, aside from these two programs,there is little reliable information available regarding expen-ditures for residential improvements and repairs to allow foradditional comparisons.
A discussant from the Bureau of Economic Analysisobserved that by examining the input/output tables one cansee that the residential improvement and repair estimatesare low. That is, there is more manufacturing output ofproducts that typically go into residential improvement andrepairs than is reflected in the residential improvement andrepair estimates. He also observed that more recently thematch has been closer. One attendee noted that produc-tion estimates of building products from the Vinyl SidingInstitute agree quite well with estimates from the C50.Another attendee stated that movements of building mate-rials do not track well with corresponding movements inimprovement and repair expenditures.
A periodic survey of remodelers or other constructionfirms to ask them to report on the amount of work done inresidential improvement and repairs was proposed. Mostattendees felt that such an approach is not realistic as itwould be very difficult to obtain cooperation. Furthermore,such a survey would not capture do-it-yourself projects.
Despite problems with AHS and CES estimates, attend-ees agreed that a household survey is the best way tocollect information about residential improvements andrepairs. The survey requires a sufficiently large sample sizeto avoid large weights and problems that arise from them.The suggestion was made to employ the American Com-munity Survey (to be instituted by the Census Bureau in thefuture) to collect information on residential improvementsand repairs.
There was some discussion of the level of detail pro-vided in the C50 and one discussant suggested that webreak out information in the C50 report by rental andvacant.
U.S. Census Bureau
8

CENSUS BUREAU COMMENTS ANDRESPONSES
One of the primary concerns voiced in this session wasthat the C50 estimates appear low and we at Census areworking on several fronts to evaluate them and introduceprogram improvements. One should note that there areremodeling expenditures that we do not include in ourestimates. For example, we do not include refrigerators(when costing out a kitchen remodeling job) and we do notinclude carpeting (when costing out a remodeling job inother areas of a house). Furthermore, we only include thecost of material for a do-it-yourself activity (in contrast to allcosts, including labor, when the job is done by a contrac-tor). These expenses are omitted by design and theprogram documentation makes this clear.
Since the CES is a household-based survey, nonresi-dential structures would never be subject to the question-naire, and accordingly, expenditures for a nonresidentialbuilding in the process of converting to a residentialstructure would not be captured. This is a gap in our datacollection and we are investigating options for addressingthis problem. We do not know of other residential improve-ment and repair data systematically missing from ourestimates.
We remove outliers from collected data when preparingestimates to reduce quarter-to-quarter variability and doingso is a source of downward bias in our estimates. We arereviewing our outlier procedures and investigating alterna-tive methods to avoid introducing a downward bias. Wealso are reviewing all our imputation procedures, whichcompensate for nonresponse. We anticipate that throughthe introduction of new procedures in both these areas, ourestimates of expenditures for residential improvementsand repairs will increase and we plan to revise historicalestimates reflecting this.
We have been working with staff in Housing and House-hold Economic Statistics Division who are responsible forthe American Housing Survey (AHS) to increase compara-bility between programs and to evaluate and account fordifferences in estimates. They have redefined some datacategories to encourage comparability between programsand have introduced a more extensive bounding procedurein the AHS to prevent expenses in earlier periods frombeing included in estimates for the current period. We planto continue working in this area and we will report on ourfindings.
Employing disclosure avoidance measures similar tothose employed for the CES and other household surveys,we have recently created and made available a microdatafile of expenditures based on housing units from the Surveyof Residential Alterations and Repairs (SORAR). Doing soprovides researchers the opportunity to conduct a varietyof analyses at various aggregation levels. We are currentlyinvestigating the possibility of creating a comparable micro-data file for the CES contribution to our estimate, whichconsists of expenditures for owner-occupied units.
We agree with the consensus that the best way to collectexpenditures for residential improvements and repairs isthrough a household survey. However, being dependent onthe CES for reasons of economy requires that our samplebe rather small for the purpose of collecting residentialimprovement and repair information. Two of the C50smajor limitations—the high variability of estimates and theinability to produce estimates at subnational levels—are a consequence of this design. In addition, the timing ofthe CES data availability prevents a more timely release ofour estimates.
U.S. Census Bureau
9

Value Put in Place Program
LEAD DISCUSSANT
Mr. Robert P. ParkerChief StatisticianBureau of Economic AnalysisU.S. Department of CommerceWashington, DC 20230
BACKGROUND
The Value Put in Place Program (VIP) publishes esti-mates of the value of all construction work performed eachmonth in the United States. Information is gathered from avariety of sources including a family of direct mail surveyscollectively referred to as the Construction Progress Report-ing Surveys (CPRS). The value of construction work forprivate nonresidential construction and for state and localgovernment construction are collected through the CPRSusing a frame of construction projects compiled by the F.W.Dodge company. The value of construction work performedfor single-family houses is derived from Survey of Con-struction (SOC) data and value of construction work formultifamily units is collected from builders through theCPRS.
Concerning other components of VIP, information onnonresidential farm construction is provided by the Depart-ment of Agriculture; information on federal construction isprovided by a variety of Federal agencies; and informationon public utilities is provided by regulatory agencies andprivate sources. Residential improvements and repairsdata for owner-occupied units are collected in the Con-sumer Expenditure Survey (CES), and information onresidential improvements and repairs for all other units iscollected in a followup to the CES. Estimates of VIP areadjusted to remove the affects of inflation using variousprice and cost indexes—each appropriate to the type ofconstruction under review. Indexes for residential construc-tion are calculated by the Census Bureau and the othersare obtained from private and federal sources.
LEAD DISCUSSANT
Mr. Parker began his discussion by explaining that theBureau of Economic Analysis (BEA) uses the VIP esti-mates as the basic source data to prepare estimates of thestructures component of the gross domestic product (GDP).The VIP estimates also are used to estimate the output of
the construction industry in the input-output tables, whichprovide the benchmarks for GDP, and also for estimates ofgross product originating and for gross state product. Indeveloping these measures, staff in BEA augment informa-tion from the VIP program with information from the Build-ing Permits Survey and regulatory reports.
Mr. Parker stated that one of the major weaknesses intheir structures estimates, which are prepared quarterly, isthe absence of a reliable, independent annual measure incurrent dollars which can serve as a benchmark for themonthly VIP estimates. He discussed other weaknesses ofthe program such as undercoverage of nonresidentialimprovements, lack of a good price index for nonresidentialconstruction, and delays in getting good benchmark infor-mation for state and local government construction. He didmention recent improvements in the program which allowedCensus to estimate $30-$50 billion additional nonresiden-tial construction and he advocated further program enhance-ments.
He then raised several classification issues that hewould like to see addressed in future work. He suggestedwe review the definition of equipment and structure andattempt to develop a clear demarcation between them. It isoften difficult to distinguish between equipment and struc-ture in nonresidential construction, for example: is anelevator in a building structure or equipment; is an oilrefinery all equipment? Construction activity is not alwaysclassified in the most appropriate category when compa-nies build structures for one purpose but convert them toanother purpose upon completion. There is the relatedclassification problem when buildings are converted topurposes different from their previous usage (for example,old warehouses being converted to residential units).Anotherclassification problem arises when a builder constructs aroad for a housing development and turns the road over tothe local government. There are inconsistencies whenclassifying such construction as either private or govern-ment construction.
Mr. Parker observed that we are likely to miss thecomponent of ‘‘force-account’’ construction activity (that is,a firm doing construction using its own employees) becauseour frame for nonresidential construction comes from listsof projects contracted to construction firms. This may resultin an underestimate of nonresidential improvements.
Mr. Parker observed that care must be exercised toexclude nonconstruction costs from the price of a housewhen developing VIP estimates of new residential construc-tion. For example, we do not want the price of a refrigerator
11
U.S. Census Bureau
(when sold along with a new house and included in thehouse price) to be included in the output of the constructionindustry. Commissions are included in the price of a house,but we would not want them to be included as output for theconstruction industry.
Mr. Parker observed that the VIP estimate for single-family housing is based on a model using informationcollected in SOC. He suggested that collecting single-family VIP through a direct measure would do a better jobat capturing the cyclical nature of residential single-familyconstruction. Under current practices, construction on asingle-family housing unit contributes to the VIP estimatewith phasing patterns used to allocate the total constructioncost over a 12-month period. Mr. Parker feels that thepatterns currently in use are dated and they tend to allocateconstruction costs incorrectly. Mr. Parker also reported thatinternational guidelines for compiling GDP treat construc-tion in progress as inventory and add it to investment forpurposes of the GDP only at the time of sale, as with othergoods.
Mr. Parker next raised the issue of price indexes. Heobserved that we use hedonic techniques for our single-family price index and that BEA has worked with Censusstaff to develop a multifamily index. He feels that its use todeflate multifamily construction has been a substantialimprovement over the previous practice of employing asingle-family index for that purpose. He observed that thereare no price index programs for nonresidential construc-tion. He suggested that the Bureau of Labor Statistics(BLS), as part of the newly expanded service industryproducer price index program, may provide new prices inthis area and that Census, BLS, and BEA should considerjoint work in this area. In the meantime the VIP programand BEA employ a variety of cost indexes to calculateinflation-adjusted values for nonresidential construction.
As a final issue, Mr. Parker discussed revisions to theGDP. He observed that VIP revisions cause GDP revisionsand suggested that we try to put procedures in place thatkeep our revisions as low as possible. He noted that recentimprovements have been good but more are needed andadded that the VIP program always needs attention.
FLOOR DISCUSSION
Several attendees remarked that our one-family phasingpatterns are dated and they suggested alternatives to theiruse. One attendee suggested that we collect monthlyconstruction costs from all single-family homes in theSurvey of Construction, from start through completion, toallocate construction costs in the month incurred. (Thiscorresponds to how we collect monthly construction costsfor multifamily structures as well as for private nonresiden-tial construction.) Others suggested that we update ourphasing patterns to more accurately reflect current buildingpractices. It was suggested that we might vary the patternto account for different stages of the business cycle.
One attendee asked if land development costs show upin our VIP estimates for new residential housing. A Censusrepresentative indicated that they are reflected in the priceof a house and contribute to the VIP estimate.
One attendee observed that there is geographic detail inthe annual report but none in the monthly and asked ifthere can be sub-annual geographic breakouts. For example,could there be monthly sub-national geographic estimatesfor total VIP or could the Census provide geographic detailquarterly? A Census staff member observed that oursample size does not support publishing further geographicdetail on a monthly basis.
One attendee asked if there would be advantages topublishing quarterly rather than monthly estimates andanother responded that he finds monthly data valuable anduses it for internal indexing. Mr. Parker observed that if VIPestimates came out quarterly it would delay BEA’s prepa-ration of GDP by about 2 months. He felt that this would notbe acceptable from a policy perspective.
One attendee stated that she would like to learn moreabout the employment picture on a monthly basis. Sheobserved that industry trends affect employment. Censusstaff observed that detailed employment information isavailable from the Bureau only in its census of constructionand that the BLS has found that their monthly contractconstruction employment and payroll track well with VIP.One attendee noted that even though BLS employment isgiven at the highest level of aggregation, it does provideinformation on employment in the construction industry.
In reference to indexes, one attendee stated that privatecompanies publish building costs by type of building andprovide costs broken down into labor and material costs.He stated that the government does not have to collectsuch data as they are available for sale from the privatesector. Mr. Parker observed that there have been attemptsto use private databases for computing indexes but thatsuch input-based cost indexes are not a substitute fordeflation, which requires price indexes. He noted that costindexes do not reflect changes in profit margins or in laboror capital productivity.
One attendee observed that private sector methodologyis often treated as a trade secret and accordingly users arenot as comfortable with their estimates as with estimatesfrom government sources. The discussant who raised theissue of private data sources observed that private esti-mates can be as reliable as government estimates andthey are widely used by those who require reliable infor-mation.
One attendee asked whether a separate estimate forsenior housing could be published. He observed that therehas been an increase in the type of multifamily residentialconstruction that provides more than just housing forresidents. For example, in some buildings, meals andvarious levels of care may be provided. Another attendeeobserved that housing for the disabled is also of interestand that there has been expanded activity in that area.
U.S. Census Bureau
12

One attendee observed that the VIP program providesthe main input for the Industrial Outlook and it would begood to have more detail by type of construction. Censusstaff noted that we will soon be publishing VIP for newtypes of construction and there will soon be more detail atthe annual level.
CENSUS BUREAU COMMENTS ANDRESPONSES
We agree with Mr. Parker’s comments that additionalreliable annual benchmarks for VIP are desirable. Wecurrently benchmark industrial buildings to estimates fromthe Annual Capital Expenditures Survey (ACES) and wewould like to expand the use of that survey into othercategories of nonresidential construction. A comprehensivereview of ACES estimates is currently underway. We alsobenchmark state and local government construction to thecensus of governments, but that information is availableonly several years after the annual reference period.
We agree with Mr. Parker on the need for indexes ofnonresidential building construction for use in preparing theGDP. Nonresidential indexes produced in the private sectorare essentially input indexes; that is, weighted averages ofconstruction material prices and hourly wages. Theseindexes are inadequate for deflating GDP estimates tocurrent dollars because they fail to reflect price changesbecause of changes in productivity and market conditions.We are currently working with BEA and BLS to developappropriate nonresidential price indexes.
As observed by Mr. Parker, we are missing someimprovement and repair information in the nonresidentialsector. Our sampling frame, which is based on contractawards, does tend to undercover the smaller nonresiden-tial improvement projects. We submitted an FY99 budgetinitiative for funds to conduct a survey of nonresidentialimprovements and repairs, but it was denied.
As Mr. Parker further noted, there are conceptual prob-lems in distinguishing between structure and equipment
expenditures, and we add that breaking out structure andequipment expenditures is often difficult for survey respon-dents. We provide respondents with extensive instructionsand examples on how to report expenditures. In fact, weask for equipment expenditures on the questionnaire tohave them separated out from structure expenditures.
Estimates for single-family VIP are based on a modelusing single-family sales and contract prices. Nonconstruc-tion costs are subtracted from the sales price (for example,cost of raw land, price of movable appliances, salescommissions, etc.) when determining construction costs.Factors for removing these costs are based on surveys ofbuilders conducted in the early 1980s, and we are in theprocess of preparing new factors from a 1998 survey.Phasing patterns used in allocating construction costs tomonths are based on information collected in 1974. We willinvestigate working with industry groups to make ourphasing patterns more current so, along with new noncon-struction cost factors, we will more accurately allocatemonthly single-family VIP.
In principle, we could estimate single-family VIP directlyby collecting the monthly VIP of a sample of single-familyhousing units in SOC. Providing monthly VIP informationfor individual housing units will likely prove difficult forbuilders. In addition, such a request will significantly increasethe response burden and costs in SOC. We feel thatemploying a model and keeping model parameters currentis the most cost effective method for estimating single-family VIP.
Several attendees asked that we provide more detailedestimates of VIP in our data releases. We will introduceannual estimates of private nonresidential construction bymore detailed type of construction categories in 1999. Wealso are investigating whether we can provide estimates oftotal nonresidential construction VIP by state. More detailedmonthly VIP estimates of private nonresidential construc-tion and state and local construction may be introduced inthe year 2000.
U.S. Census Bureau
13

Economic Census: Construction Sector
LEAD DISCUSSANT
Mr. Manuel D. GutierrezManager, Market ResearchKohler CompanyKohler, WI 53044
BACKGROUND
Data on the construction sector of the economy arecollected every 5 years as part of the Bureau’s economiccensus program. Data are actually collected from a repre-sentative sample of construction firms, including builders,general contractors, and special trade contractors repre-senting all facets of the construction industry. All largeestablishments are in our sample as well as a representa-tive sample of small establishments. Firms report businessreceipts, payroll, assets, and other economic informationas well as types of construction they were engaged induring the year of the census.
With each Census we produce reports in three publica-tion series. The Industry Series provides information oneach construction industry. Included in the reports arevalue of work by type of construction, statistics by sizeclasses, assets data, and selected industry ratios. TheGeographic Area Series provides information on eachCensus Division. Reports include the statistics mentionedabove by state. The Subject Series provides summary datafor 3-, 4-, and 6-digit NAICS codes and census regions.Estimates from the 1997 Economic Census will be pro-duced at the National and state levels. In the past, esti-mates also were produced for selected metropolitan areas.
LEAD DISCUSSANT
Mr. Gutierrez began by providing an overview of theCensus of Construction Industries1 (CCI), noting that it hasbeen conducted on a regular basis since 1967 and cur-rently provides estimates for employer establishments andcontains supplemental information for nonemployer estab-lishments. It provides break-outs for residential and non-residential builders, heavy construction, and general andspecial trade contractors. Information has been providedfor the total United States, for states, and for selectedmetropolitan areas.
He emphasized how the CCI provides valuable informa-tion on the structure of the construction industry. It providesinformation on: average number of employees by estab-lishment, average receipts of establishments, and percentof one-person establishments to total establishments, togive only a few examples. One is able to get the informa-tion by state by establishment size and one can observehow this information has changed over time.
Mr. Gutierrez observed that this information is valuableto companies that market products to the constructionindustry. Information from the CCI can be employed tounderstand the distribution of construction establishmentsby state, to study market penetration and to evaluatedemand for products and potential markets by state. Byproviding a national cross-section of the construction indus-try, the CCI is used in survey sample verification to weightthe results of private surveys. In addition, Mr. Gutierrezstated that his company compares total counts of estab-lishments on their mailing lists to counts from the CCI andis able to reduce costly mailing by looking for largediscrepancies.
Mr. Gutierrez discussed some improvements he wouldlike to see in the CCI program. He would like to haveannual data, even if on a smaller, less comprehensivescale, such as data on number of firms and number ofemployees. He also advocated a more timely release ofCCI information, especially an earlier preliminary release.He would like to see data released in a more easily usable,electronic format and he advocates reducing our paperoutput. For example, he recommended release through theInternet and in SAS downloadable files for CD-ROMS. Hewould like to see more comparability of information betweenthe CCI and other Bureau programs and with other datasources, such as National Association of Home Builderestimates.
Mr. Gutierrez recommended that we provide data atgreater geographic detail, such as by 3-digit ZIP Code, andthat we consider the release of microdata from the CCIthrough the use of data masking to avoid breachingconfidentiality. With the availability of ample computerresources, working with large data sets is no longer aproblem for data users.
FLOOR DISCUSSION
One attendee asked why there is an emphasis onestablishments as opposed to firms for data collection and
1This data collection and publication program is currently referred to asthe Economic Census: Construction Sector to highlight that it fits into theframework of the economic census.
15
U.S. Census Bureau

publication in the eonomic censuses. He observed thatusers are often interested in the business entity and notlocal establishment activities.
Census staff responded that we release information onan establishment basis in order to provide geographic dataand to provide detailed industry data. It is more difficult toplace a firm in an appropriate industry classification whenits establishments operate in more than one classificationarea.
Census staff observed that since we collect informationon an establishment basis and have links between estab-lishments belonging to the same firm, we are able to createfirm data based on our collection of establishment informa-tion. An attendee responded that it would be very helpful iffirm data were also broadly available from our data releaseprogram.
One attendee observed that microdata files are housedin the Census Bureau’s Center for Economic Studies andthey are extremely useful for special projects. He noted theproblem of ease of access and raised the issue of releaseof this microdata. Census staff observed that we have hadlittle success in creating public use economic microdatasets. The skewed distribution of economic establishmentsmakes it very difficult to mask data enough to protect theconfidentiality of respondents while simultaneously main-taining data utility.
One attendee asked about possibilities for the release ofmicrodata products from the CCI employing techniquescomparable to those used in the release of demographicmicrodata to protect confidentiality. Census staff respondedthat, whereas households are fairly homogenous, thepopulation of industrial establishments is highly skewedand individual establishments have unique characteristics.Efforts to effectively mask establishment data to preventidentification would seriously impinge on the utility of thedata. Another Census staff observed that we recognize theneed for microdata and have experimented with optionsand are very uncomfortable with the results. He noted thatthere is direct access to the CCI microdata through con-trolled conditions at the Center for Economic Studies atCensus headquarters and at satellite sites.
One attendee remarked that one major shortcoming ofthe data collected on the CCI is that it is available onlyevery 5 years. It is very difficult to measure trends and datausers resort to estimating information in the noncensusyears. Doing so makes it difficult to address many policyissues. The attendee advocated an annual program thatcollects information comparable to that collected in theCCI. A Census representative stated that we concur withthat need and that Census has requested funding for anAnnual Survey of Construction in our FY99 budget initia-tive.
One attendee observed that three delivery methods forconstruction projects are: design/bid/build, constructionmanagement, and design/build and noted that design/buildconstruction is an increasingly important component of theindustry. He stated that the CCI does not collect information
on the delivery methods for construction projects. Headvocated that the CCI collect information on deliverymethods and noted that the Design-Build Institute would beglad to work with Census to capture that information.
Census staff agreed that this is an important issue andstated the CCI includes information on design/bid/build andconstruction management methods of delivery. We alsoadded a question on percent of receipts for design/bid/buildwork and we will analyze the information we collect andassess the ability of establishments to report this informa-tion to us. We will publish information on method of deliveryif the data supports doing so.
One attendee asked that the CCI provide more informa-tion on employment by type of work stating that it would bevaluable to know this information to better understand laborissues in the construction industry. He went on to observethat it would be desirable to have percent of employmentby type of activity comparable to information on percent ofreceipts by type of activity. Right now, if a user wants toknow how many residential construction workers there are,one must prepare estimates based on the residentialconstruction receipts. He would be interested in a classifi-cation of establishments by type of work activity rather thanby source of receipts. He also inquired about the possibilityof obtaining worker hours by type of activity.
A representative of the Bureau of Economic Analysis(BEA) observed that classification of establishments byreceipts is important to the preparation of the NationalIncome and Product Accounts. Census staff noted that inour 1990 Record Keeping Practices Survey, we found thatemployee by function or worker-hours by type of activityare a problematic set of questions for respondents toanswer well. Adding a question of this sort would constitutea large increase in response burden to companies. It wasfurther noted that the CCI releases information on receiptsby specialization, which may provide information on employ-ment issues.
Census staff provided information on data products forthe CCI and noted that preliminary reports will be availablein early 1999 and the complete industry and geographicreports by the end of 1999. We will be using less paper andindustry reports will be available on CD-ROM and indownloadable data files on the Internet. We are developingnew data access software which will be easy to use andwhich will provide users with powerful capabilities.
Census staff further noted that employment and payrolldata for the Construction sector are available on an annualbasis through the County Business Patterns (CBP) pro-gram. One attendee noted that the 2-digit SIC levels on theCBP are acceptable, but information below that level is notuseful because they are incomplete as many cells aresuppressed due to confidentiality protection. It was sug-gested that we release all 4-digit SIC information at theMSA level, which should not require many suppressions. ACensus representative observed that if we were to publishmore MSA data we may have to suppress more countydata to avoid derivative complementary disclosures.
U.S. Census Bureau
16

CENSUS BUREAU COMMENTS ANDRESPONSES
Data on the construction sector of the economy arecollected as part of the 1997 Economic Census. Formswere mailed to respondents in January 1998 and respon-dents were requested to provide information for calenderyear 1997. The forms were due in February 1998, process-ing was closed-out in August 1998 and data review pro-ceeded from that time onward. The first data will bereleased as part of the Economic Census Advance Reportdue out the first part of 1999. Our first 1997 constructionindustry reports will be released in March 1999.
The reports will be released as portable data format(PDF) files and electronic data files on the Census BureauInternet site www.census.gov and also will be available onCD-ROM. The 1997 construction industry and state reportswill not be released in printed format, only the SubjectSeries, Industry, and Area U.S. summaries will be releasedas printed documents in addition to the electronic formatreleases.
Statistics on selected metropolitan areas have beendiscontinued as a cost saving measure to absorb cuts infunding. Information by state will continue to be released.We can produce tabulations for individual metropolitanareas or other suitable geographic areas on a cost reim-bursable basis.
As noted in the floor discussion, we find it very difficult torelease economic microdata because of confidentialityconcerns. We do invite those interested to advise us ofspecial tabulations needed that we may be able to provide.Another option is to take advantage of the microdata
housed in the Census Bureau’s Center of Economic Stud-ies for the conduct of special studies.
Several discussants indicated an interest in an annualconstruction survey to provide information between cen-suses, in particular, annual estimates of receipts whichwould prove valuable for the National Income and ProductAccounts. Realizing a demand for annual data, we requestedfunds for an annual construction survey in our FY99 budgetinitiative, however, our request was denied.
As discussed earlier, we collect information at the estab-lishment level (rather than the company level) because wecan clearly define an industry classification for each estab-lishment. Establishment information can be aggregatedacross states and other geographic areas to producegeographic based estimates. Furthermore, establishmentinformation can be aggregated to the company level toproduce company information and tabulations can becreated on a cost reimbursable basis.
An important issue for Census is comparability betweenestimates from different programs and we endeavor tocross-check information between programs. For example,we added a question on the 1997 construction censusreport forms about residential housing starts in an effort toinvestigate comparability in data collection between theeconomic census program for construction statistics andSurvey of Construction.
We also continually review data collected in all ourprograms to provide information that is useful and current.As an example, we added a question on the 1997 con-struction census report forms on receipts obtained underdesign/bid/build contracts to measure the emergence ofnew project delivery methods in construction.
U.S. Census Bureau
17

Overview of ConstructionStatistics Programs
Section 2

Construction Statistics Programs
The following sections describe in general terms and indetail the major programs conducted within the CensusBureau’s Manufacturing and Construction Division (MCD)for producing construction related statistics. Our programsprovide information on new construction, expenditures forresidential improvements and repairs for existing struc-tures, and manufactured homes. Even though this reportwas prepared in conjunction with the Construction Statis-tics Data Users’ Conference, held on October 28, 1997, itcan serve as an independent document providing anintegrated description of our programs. These programsare constantly changing and some methods used in thepast are no longer employed. We have noted some of thesignificant changes.
Our programs are complex, and data collected for oneprogram are often used by other programs. We have
included flowcharts to help make the program activitieseasier to understand and to show relationships betweenprograms.
Some statistics on construction are compiled by otherdivisions of the Census Bureau and by other governmentagencies. The programs that produce those statistics arenot described in this report .
In the Brief Summary of Programs of this report, weintroduce our programs, list their major products, andprovide a display showing the products, programs, anddata sources used in the estimates. In the next section, wepresent details of each of the programs and highlight howour programs are related to one another.
For those wishing more detail on any of our programs,we recommend the technical appendixes in our publishedreports. They provide detailed information on methodology,definitions, data limitations, and a wealth of other features.
21
U.S. Census Bureau

Brief Summary of Programs
DESCRIPTION OF INDIVIDUAL PROGRAMS
Building Permits Program
The Building Permits Program collects information onbuilding permits issued for new private residential construc-tion. Information is collected from permit-issuing jurisdic-tions on number of housing unit permits issued and theirpermit valuation. These statistics are a leading economicindicator.
Data are collected monthly from a sample of permit-issuing places and annually from the remaining permit-issuing places. Places not previously issuing permits arecontacted every few years to determine if they have begunissuing permits and the sample is periodically reselected tobetter represent the expanding universe of permit-issuingplaces.
Monthly and annual estimates of housing units autho-rized by building permits are available on the Internet bothunadjusted and seasonally adjusted for the United Statesand the four regions. Unadjusted estimates by states andmetropolitan areas are also available. Data for individualpermit offices are available from the Census Bureau.
Survey of Construction (SOC)
The Survey of Construction (SOC) collects and pub-lishes information on residential units started, sold, andcompleted each month. In addition, a variety of housingcharacteristics, such as unit price, number of bathrooms inunit, and size of unit, are published quarterly and annually.Information is collected directly from builders by fieldrepresentatives.
The publication series Housing Starts (C20) is publishedmonthly and provides information on the number of hous-ing starts throughout the United States. Information includesestimates of housing units authorized, started, and autho-rized but not yet started. The Housing Units Started seriesis a Cyclical Indicator of Fixed Capital Investment.
The publication series New One-Family Houses Sold(C25) consists of 12 monthly reports. Information includesestimates of units sold and for sale, average and mediansales prices, and price distributions of units sold. The PriceIndex of New One-Family Houses Sold also appears in thisreport.
The Characteristics of New Housing report (C25A) ispublished annually. It includes price and physical charac-teristics data for new houses completed, new houses sold,and new multifamily buildings completed. More than 25physical characteristics are shown—for example, size,number of bathrooms, type of heating system, and type ofexterior wall.
The series Housing Completions (C22) is publishedmonthly and provides information on the number of hous-ing units completed in a month and on those underconstruction.
The series New Residential Construction in SelectedMetropolitan Areas (C21) is published quarterly and pro-vides information by metropolitan area on units authorized,started, and completed. We are currently evaluating theneed for this publication and it may be soon discontinued ifwe find that it is not widely used.
Value Put in Place Program (VIP)
The Value Put in Place Program (VIP) publishes esti-mates of the value of construction work performed eachmonth. Information is gathered from a variety of sourcesincluding a family of direct mail surveys collectively referredto as the Construction Progress Reporting Surveys (CPRS).
The value of construction work performed for single-family houses is derived from Survey of Construction dataand value of construction work for multifamily units iscollected from builders through a CPRS survey. Informa-tion on improvements for owner occupied units is collectedin the Consumer Expenditure Survey (CES) and informa-tion on improvements for rental units is collected in afollowup to the Consumer Expenditure Survey.
The value of construction work for private nonresidentialconstruction and for state and local government construc-tion are collected through a CPRS using a frame ofconstruction projects compiled by the F.W. Dodge Com-pany. Information on nonresidential farm construction isprovided by the Department of Agriculture; information onFederal construction is provided by a variety of Federalagencies; and information on public utilities is provided byregulatory agencies and private sources.
The monthly publication series Value of ConstructionPut in Place (C30) provides information on the value ofconstruction work done. Included in the reports are nationalestimates by type of construction in current and constantdollars and price deflators. An annual revision is published
23
U.S. Census Bureau

as an expanded May report. The quarterly publicationseries Expenditures for Residential Improvements andRepairs (C50) provides information on residential improve-ments.
Manufactured (Mobile) Home Program
The Mobile Home Placement Survey collects informa-tion from mobile home dealers about inventories and saleseach month. The National Conference of States on Build-ing Codes and Standards (NCSBCS) acting as an inspec-tion agent for Department of Housing and Urban Develop-ment produces a frame of units shipped by manufacturersto dealers from which we sample. Information is collectedand estimates are published on the price of units sold andtheir characteristics. We also publish information on manu-facturers’ shipments of mobile homes compiled from manu-facturers’ reports to NCSBCS.
Both the NCSBCS’ shipments data and estimates pro-duced from the Mobile Homes Placement Survey appear inthe Housing Starts publication series. The monthly place-ments estimates include mobile homes in dealer’s inven-tories, mobile homes placed, and average sales price ofmobile homes. The Housing Starts publication in Junecontains annual estimates of characteristics and stateestimates of placements and sales prices.
Economic Census: Construction Sector
Data on the construction sector of the economy arecollected every 5 years as part of the Bureau’s economiccensus program. Data are actually collected from a repre-sentative sample of construction firms, including builders,general contractors, and special trade contractors repre-senting all facets of the construction industry. All large
establishments are in our sample, as well as a represen-tative sample of small establishments. Firms report busi-ness receipts, payroll, assets, and other economicinformation as well as types of construction they wereengaged in during the year of the census. The sampleincludes all larger establishments and a sample of smallerestablishments.
With each Census we produce reports in three publica-tion series. The Industry Series provides information oneach construction industry. Included in the reports arevalue of work by type of construction, statistics by sizeclasses, assets data, and selected industry ratios. TheGeographic Area Series provides information on eachCensus Division. Reports include the statistics mentionedabove by state. The Subject Series provides summary datafor 3-, 4-, and 6-digit NAICS codes and census regions.
Estimates from the 1997 Economic Census will beproduced at the National and state levels. In the past,estimates also were produced for selected metropolitanareas.
SUMMARY DISPLAY OF CONSTRUCTIONSTATISTICS PROGRAMS
The display on the next page presents a summary of themajor construction statistics programs. In the left column,we show the publications and products from each majorprogram. These are in a state of change at this time as wemove to increased electronic dissemination. In the secondcolumn are the surveys that provide estimates for the dataproducts in the first column. In the last column are addi-tional sources of data which also are used to provideinformation for our data products and contribute to ourestimates. The next section contains detailed informationabout these programs and highlights interrelationshipsbetween them.
U.S. Census Bureau
24

Figure 1.
Publications/Products Surveys
Sources Employed inProducing Estimates
Building Permits Program
Housing UnitsAuthorizedby Building
Permits
BuildingPermitsSurvey
Residential Starts, Sales, and Completions Program
C20 - Housing StartsC25 - New One-Family
Houses SoldC22 - HousingCompletions
C21 - New ResidentialConstruction in Selected
Metropolitan Areas
Survey ofConstruction
Value Put in Place Program
C30 - Value ofConstruction Put in
PlaceC25 - Expenditures
for ResidentialImprovements and
RepairsPrice Index Series
Multifamily Nonresi-dential
Stateand
Local
Progress Reporting Surveys
CE Mail
Manufactured Homes Program
Placements andshipments data
are in C20
ManufacturedHomesSurvey
ManufacturedHomes
Shipments
Value Put in Place Program
Advance ReportIndustry Report
SeriesGeographic Area
Report SeriesSubject Series
Economic Census: Construction
Sector
One-Family
PublicUtilities
CESurvey
FarmNonresi-dential
FederalGovernment
25
Construction Statistics Programs
Program Details
BUILDING PERMITS PROGRAM
The Building Permits Program consists of two surveys, amonthly and an annual survey of local government officesthat are responsible for recording and regulating newconstruction. In 1995, about 19,000 county, city, town,township, and village governments required permits fornew construction. These places are referred to collectivelyas the Building Permit Place Universe and constitute thesampling frame for this program. From estimates availablefrom the Survey of Construction (SOC), we know thatabout 97 percent of all residential construction in 1997occurred in places covered by this universe.
New permit places are constantly being identified. Places(cities, towns, counties, etc.) without permit systems couldbegin issuing permits at any time. These new places arenot immediately introduced into our sampling frame toavoid distorting estimates of month-to-month change. Beforea new monthly sample is selected, the new places areadded to the Building Permit Place Universe and our frameis updated at that time. The last time new places wereadded to the universe and a sample selected was 1994and the universe went from 17,000 permit offices to about19,000. The first time data was published for this samplewas January, 1995 with the publication of annual data for1994.
Monthly Survey
For the monthly Building Permits Survey we usuallyselect a new sample of permit-issuing places from theBuilding Permit Place Universe after a decennial census.The sample includes all permit places in all PrimaryMetropolitan Statistical Areas (large population centerslocated near other large population centers) and the 25largest Metropolitan Statistical Areas (large populationcenters not located near other large population centers),which provides for precise estimates for these areas. Theremainder of the Building Permit Place Universe is strati-fied by state to allow for good state estimates. In some ofthe small states, all permit-issuing places are in the sample.In other states there is a certainty stratum and a noncer-tainty stratum which is sampled at the rate of 1 in 10. Thetotal sample size is about 8,500 places. Each month permitoffices in sample are mailed a questionnaire which they areasked to return to our National Processing Center (NPC) inJeffersonville, Indiana, for data entry. On the questionnaire,
we ask how many residential buildings and units wereauthorized in the past month for single, two, three or four,and five-or-more-unit buildings and what was the totalpermit value. Data for additions and alterations, demoli-tions, and nonresidential structures were collected in thepast, but are no longer included in this program.
There are a number of permit offices which have specialarrangements with us and they send printouts or electronictransmissions of permit activity. There are also somespecial arrangements for joint data collection with stateagencies that want data from places in their state. Thearrangement might result in the state agency collecting thedata and providing it to us or vice versa. A variety ofarrangements have existed throughout the life of thissurvey.
After the data are entered in Jeffersonville, they aretransmitted to headquarters for computer editing, correc-tion, review, and tabulation. Since correlations among dataitems are small, there are few inter-item ratio edits and noextensive multivariate edits. Imputation for item nonre-sponse is performed during a computer edit at headquar-ters. Ratios of current period data to prior year’s annualdata for respondents are computed and these ratios areapplied to the prior year’s annual data for nonrespondentsto create imputes for the current time period. During theedit in Jeffersonville and at headquarters telephone callsmay be made to the respondents to confirm or correctreports.
Monthly estimates include totals of housing units autho-rized for one, two, three or four, and five-or-more-familybuildings at the National, regional, and state levels and formetropolitan areas. Sample data are weighted up by theinverse of their probability of selection and aggregated toprovide estimates. National and regional estimates ofauthorizations are seasonally adjusted, however, state andmetropolitan estimates are not adjusted.
A preliminary estimate is produced in the middle of themonth following the month covered by the data. At the endof that month a revised estimate is published. When theannual survey is complete, monthly estimates are revisedagain as they are benchmarked to the annual totals toensure that the sum of the 12 monthly estimates equals thetotal from the annual survey.
When the universe is increased to introduce new permit-issuing places, we estimate National and state totals ofauthorizations under both the old sample (representing theolder, smaller universe) and the new sample (representingthe new, larger universe). We conduct the overlap sampling
27
U.S. Census Bureau

for 12 months to observe the change in levels due to thenew expanded universe. Based on the overlap, a user canadjust the historical series so that comparisons with previ-ous year of rates of growth and level estimates can bemade on a common universe structure.
Annual Survey
All permit-issuing places in the Building Permit PlaceUniverse that are not in the monthly sample are canvassedannually by mail. Data from places in the monthly sampleare summed to provide annual values, which are combinedwith data from places in the annual survey to obtain annualtotals. Annual data are published for each permit-issuingplace and are aggregated to provide United States, state,and metropolitan area totals. Imputed data are included inthese totals for places that do not report.
After the annual totals become available, monthly esti-mates of residential authorizations are benchmarked to theannual totals by Census region and type of structure.Annual totals are used as the measures of size when themonthly sample of permit-issuing places is reselected. Inaddition, these data are employed in various demographicsurveys.
Special Features
Building Permits Survey (BPS) data are not confidential,so we are able to provide response data to users. Data forthe past 10 years are available for a fee. This includesadditions and alterations and nonresidential data collectedin the past but no longer collected.
SOC field representatives visiting permit offices haveobserved that some permits do not contain sufficientinformation to distinguish attached single units from multi-family units. Permit offices occasionally classify them incor-rectly when they report data to us. We do not adjust theBuilding Permits Survey’s estimates of authorization forthese errors. Such an adjustment would not affect esti-mates of total units, but would alter the distribution betweensingle family and multifamily.
Some states require permits for certain types of con-struction anywhere in the state, for example, buildings withmore than a specified number of units. If a local jurisdictiondoes not issue the permit, a state office will issue one. Thetype of state permit place that is created is different fromstate to state. We attempt to include these types of placesin the permit universe.
The highly reliable estimates of housing units authorizedthat are produced in the BPS are used to ratio-adjustestimates of units started from the SOC. This substantiallyreduces the variance of the SOC estimates. BuildingPermits Survey estimates also are used to ratio-adjustestimates from the American Housing Survey.
THE SURVEY OF CONSTRUCTION
The Survey of Construction (SOC) is one integratedoperation which provides estimates of starts, sales, andcompletions of residential buildings. For the purpose of thissurvey, a start is defined to be when excavation begins forthe footings or foundation of a building. A single-familyhousing unit is defined to be complete when it is occupiedor when the finished flooring is installed and a multifamilyresidential building is defined to be complete when at least50 percent of the units in the building are complete. A saleof a single-family house is defined to be when a contract issigned to purchase a unit and this can occur at any stageof the construction process: before a permit is taken out,after the unit is completed, or any time in between. Sales ofmultifamily units (condominiums) are not collected.
Sample Design
The name Survey Use of Permit (SUP) is given to theSOC activities in areas of the country where buildingpermits are required. The name Nonpermit Survey (NP) isgiven to SOC activities in areas of the country wherebuilding permits are not required. The only differencesbetween the two surveys is the sample design and theinitial data collection. The sample design for the SurveyUse of Permit will be described in the next section followedby the sample design for the Nonpermit Survey.
Survey Use of Permit (SUP) . Sampling for the SUP is afour stage design. The entire nation is divided into groupsof counties and New England towns which are collectivelyreferred to as Primary Sampling Units (PSUs) and they aresampled for the Current Population Survey (CPS). The firststage of sampling for the SUP is the same as the sampleselection of PSUs for the Current Population Survey. In thesecond stage of sampling for SOC we select a subsampleof the Primary Sampling Units selected for the CurrentPopulation Survey and in the third stage, a sample ofpermit-issuing places is selected in each PSU. The fourthand final stage of sampling is a selection of building permitsfrom each place included in the third stage sample.
The final sample of permits is produced by field repre-sentatives visiting permit issuing offices, preparing a list ofthe residential permits issued during the month and choos-ing a sample from the list (following a well-defined proce-dure). The final stage of sampling is repeated monthly.Each month field staff list new permits and select a sampleof them. The sampling weights on each sampled permitreflects all four stages of the process.
With the recent introduction of computer assisted per-sonal interviewing (CAPI) and collection of data with theuse of laptops, the field staff enters the list of new permitsinto a CAPI listing instrument and the CAPI system selectsthe sample of permits for interviewing. A process referredto as patterned sampling is used for this final stage of
U.S. Census Bureau
28

sampling under CAPI. As permit information is entered intoa laptop computer, the computer selects a sample. As morepermits are entered, the sample is adjusted so its size isapproximately constant. Certain patterns of selected andnonselected cases are preprogrammed to accomplish thisadjustment to a constant size sample.
Nonpermit (NP) Survey . Since a portion of the country isnot covered by permit-issuing places, the Nonpermit Sur-vey is conducted. The first and second stages of samplingare the same as for the SUP: a subsample of PSUs iscurrently employed in the CPS. All of the census enumera-tion districts that are in these PSUs and are not within thejurisdiction of a permit-issuing place become the frame forthe third stage of sampling. A sample of these districts isselected as the third stage. The selected districts arereferred to as area segments. Area segments are can-vassed each month for new residential construction and allunits identified are included in the SOC sample.
Before 1980, the NP Survey covered 15 percent or moreof the residential construction. Around 1980 the percentagedropped below 10. In 1995, following the most recentbuilding permit universe update, the amount of residentialconstruction in nonpermit areas fell to 3 percent of the total.
Processing and Estimation
Data are collected by field interviewers. For the SUP,each building permit selected in the sample contains theaddress of the proposed construction location and thename of the builder. For the NP Survey, the field represen-tative must locate a builder for the started housing unitobserved. Under either scenario, builders are contactedeach month to obtain start date and completion date for allsample units and sale date for single-family units built forsale. A permit or observed start address stays in sampleuntil the building is completed and sold (for those for sale)or until it is designated as ‘‘abandoned.’’
Most response data are collected via telephone callsfrom the interviewer’s home to the builders of the sampledunits. In order to collect all of the start, sale, and completioninformation, a respondent may be called in many months.If the builder or some other respondent is not available byphone to provide needed information, the interviewer isrequired to visit the building site for the information. A startis determined if excavation for a foundation is observed atthe site. If sale or completion information is required and norespondent is available by phone, we treat that as not soldor not completed and the next month we attempt tointerview.
For single-family houses, characteristics such as pres-ence of basement, number of bathrooms, square footage,and so on are collected. For multifamily houses, charac-teristics of the building are collected, for example, numberof efficiency units in the building and number of units with
two bathrooms. One use of these characteristics is todevelop price indexes for single-family and multifamilybuildings. Price indexes are described later in this report.
For many years, the SOC has been conducted usingforms to list permit information and two questionnaires torecord respondent information (a one-family version and amultifamily version). Forms were sent to Jeffersonville,keyed, and then sent to headquarters. After data arrive atheadquarters, the review, correction, and tabulation pro-cess begins. A computer assisted personal interviewing(CAPI) system has replaced these forms with laptop com-puter programs. In the permit listing program, the inter-viewer enters permit information. Builder addresses alreadyon file are copied by the computer to the questionnaire forsample cases and the interviewer enters builder addressinformation for the builders not on file, updating the builderfile. The computer selects the sample, a case managementsystem organizes the telephone interviews, and an auto-mated questionnaire guides the interview and edits theresponse data.
The system achieves a more rapid collection of data,fewer late reports, and better quality of data since ques-tionable responses are verified immediately. All data col-lected in the field are transmitted directly to headquartersfor review and tabulation.
Monthly estimates of starts, sales, and completions aremade at the National level and for regions, and starts andcompletions estimates are made for selected metropolitanareas for one, two, three or four, and five-or-more-familybuildings. The quarterly or annual estimates include unitsstarted, one-family units sold, units completed, and a widerange of characteristics of housing such as sales price,square footage of house, presence of garage, etc.
A large reduction in variance occurs from a ratio adjust-ment procedure using the BPS’s estimate of authorizationssince this estimate has a low variance. To ratio-adjust, wefirst estimate the ratio of some characteristic to housingunits authorized. For example, we may form the ratio ofunits started to total authorizations, where both compo-nents of the ratio are estimated from the SOC design.These ratios are multiplied by the Building Permits Sur-vey’s estimates of housing units authorized to yield a ‘‘ratioadjusted’’ SOC estimate of units started.
The major estimates from SOC (starts, sales, andcompletions) are highly seasonal. Seasonally adjustedannual rates (SAAR) are computed using the Bureau’sseasonal adjustment programs.
Starts and completions estimates are published aspreliminary, first, and second revisions. Since sales esti-mates are subject to greater numbers of late reports thanstarts and completions, they have a third revision. The firstestimates of starts are released about 2 weeks after thereference month as preliminary estimates. First and sec-ond revisions are issued in the subsequent 2 months. Thefirst estimates of sales and completions are issued about 4weeks after the reference as preliminary estimates. First
U.S. Census Bureau
29

and second revisions for completions and first, second,and third revisions for sales are issued in subsequentmonths.
Special Features
Survey of Construction data used in other programs .The SOC collects respondent name and address andbuilding location for multifamily buildings authorized in thepermit-issuing places in sample. This data becomes thesampling frame for the Multifamily Construction ProgressReporting Survey portion of the Value Put in Place Pro-gram. A sample of nonresidential building permit informa-tion collected in SOC is employed in an evaluation of theconstruction project frame used in the nonresidential ValuePut in Place Program.
The Value Put in Place Program derives one-familyconstruction value estimates from SOC. In addition, thesingle-family price deflator for single-family Value Put inPlace is computed from data collected in SOC. The BEAhas developed a multifamily price deflator for Value Put inPlace estimates which also uses data collected in SOC.
The Survey of Market Absorption (SOMA) uses com-pleted multifamily buildings as its sampling frame. The fieldinterviewers working on SOC usually collect the data forSOMA. The permit listings for the permit places visited bySOC interviewers are used in the Permit Address Listing(PAL) portion of CPS.
Survey of Construction estimation issues . Since a saleis defined to be when a sales contract is signed, salescontracts signed prior to an authorization are a particularproblem because they will not be recorded by a field
representative in the survey as a sale until a permit is takenout. We attempt to estimate for them and they are, in part,responsible for the large revisions in our preliminary esti-mates.
Attached housing units that are separated by a completeground to roof wall are considered one-family units forpurposes of SOC. Some permit places treat these types ofunits as multifamily. During the listing of the permits at thepermit office, the interviewer cannot tell if a multifamilybuilding is one-family by our definition. If it is listed asmultifamily and later turns out to be one-family, its status ischanged. The one-family units which have now been newlyidentified are treated as if they were part of the one familylist of permits and they are sampled as an extension of thatsample.
In order to account for housing units started in permit-issuing places without authorization, an adjustment factorof 1.033 is applied to SOC estimates. This factor wascomputed from an evaluation study conducted in the1960s. Due to the great expense involved in such a study,the operational difficulties with collecting the necessarydata, and the inability to accurately estimate for what ismost likely a small value, the evaluation study has not beenrepeated. The old factor is still in use even though there isconsiderable doubt that it is warranted, especially in urbanand metropolitan areas. Accordingly, we are planning toeliminate the 3.3 percent factor from our estimates.
Survey of Construction Flowchart
The flowchart on the next page shows how data in SOCare collected and employed in providing direct estimates oras input to other construction statistics programs.
U.S. Census Bureau
30
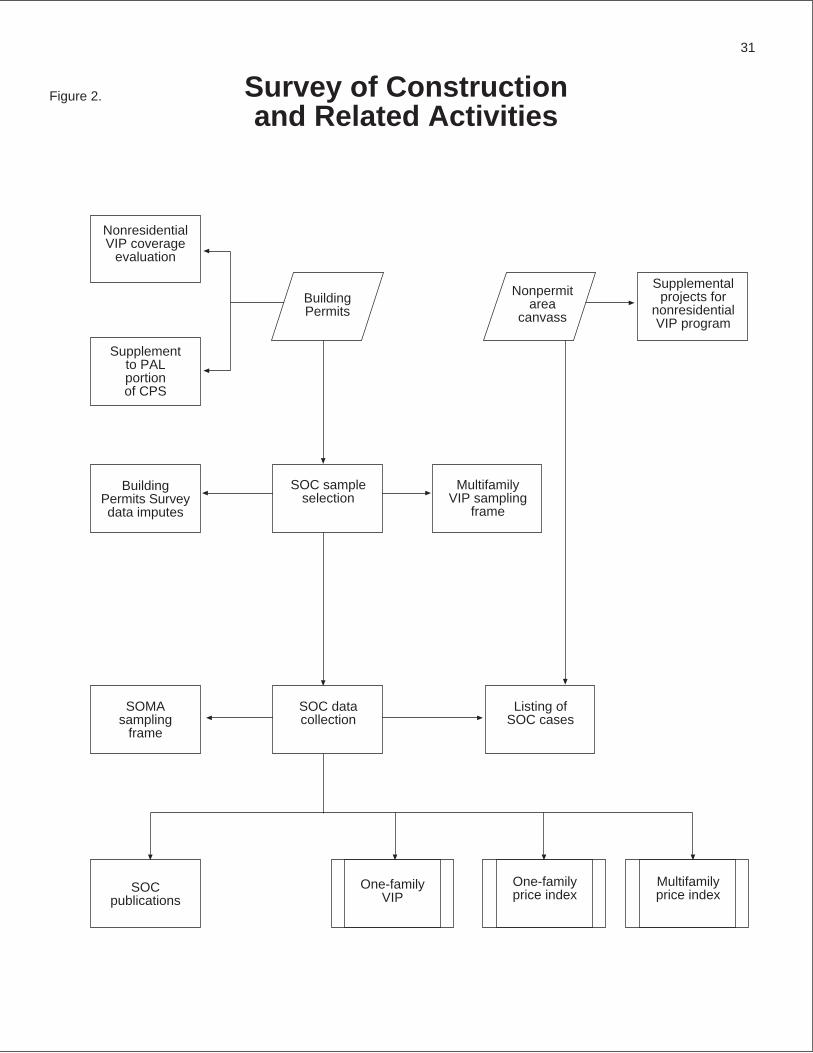
NonresidentialVIP coverage
evaluation
BuildingPermits
Supplementto PALportionof CPS
SOMAsampling
frame
SOCpublications
BuildingPermits Surveydata imputes
SOC sampleselection
MultifamilyVIP sampling
frame
SOC datacollection
Listing ofSOC cases
One-familyVIP
One-familyprice index
Multifamilyprice index
Nonpermitarea
canvass
Supplementalprojects for
nonresidentialVIP program
31
Figure 2. Survey of Constructionand Related Activities

VALUE PUT IN PLACE PROGRAM
The Value Put in Place Program is a complex collectionof data gathering activities with the purpose of estimatingthe total dollar value of construction work done each monthfor use in the National income and product accounts.Estimates of Value Put in Place (VIP) are produced at theNational level by type of construction and include newconstruction, additions and alterations to existing buildings,and major replacements of components of existing build-ings. The architectural, engineering, and miscellaneouscosts associated with construction are included in VIP.Maintenance and repair costs and the cost of land are outof scope and are not included. Current dollar and constantdollar series are produced and published as well as theindexes used to deflate the current dollar series. Estimatesfor the various components of VIP are derived from differ-ent sources and each component will be discussed sepa-rately below.
The Construction Progress Reporting Surveys (CPRS)refer to three monthly surveys that we conduct to directly
collect information on monthly expenditures on construc-tion projects for use in the VIP estimates. They collectinformation for 1) new multifamily construction, 2) privatenonresidential construction, and 3) state and local govern-ment construction. They all collect information on theprogress made on a sample of construction projects andare discussed in detail individually below. A project consistsof all buildings and other related items under constructionfor which construction costs can be provided jointly by arespondent.
The table below shows components of the VIP esti-mates, their percent of total VIP in 1997, and the source ofthe data used in producing the estimates. The total value ofconstruction work put in place in 1997 in current dollarswas $618.2 billion. The flowchart on the following pagehighlights the components of VIP estimates and datasources used in the production of the estimates, as describedin the table below. Each of these factors are discussed indetail in this section.
Components of the Value Put in Place Program Estimates
Percent of totalComponent of VIP VIP in 1997 Sources of data
Residential
New one family 27 Derived from SOC data
New multifamily 4 CPRS
Residential additions, alterationsand improvements
13 Consumer Expenditure Survey, Survey ofResidential Alterations and Repairs
Private Nonresidential
Nonfarm nonresidential 27 CPRS
Farm nonresidential 1 Department of Agriculture International TradeAdministration
Public utilities 6 U.S. Telephone AssociationEdison Electronic InstituteSurface Transportation BoardFederal Energy Regulatory CommissionAmerican Gas Association
Government Construction
State and local 21 CPRS
Federal 2 Government Agencies
Total percent does not add to 100 because of rounding.
U.S. Census Bureau
32

Multifamily
4%
ProgressReporting
Survey
Summary of ValuePut in Place Program
SOC
Model basedestimation
Multifamilysample
One family
27% 27%
Nonresidential
F. W.Dodge
State and LocalProgressReporting
Survey
NonresidentialProgressReporting
Survey
One family
21%
CESurvey
CE MailSurvey
Residentialimprovements
13%
Agriculturedata
Farmresidential
1%
Public utilityreports
Publicutilities
6%
Federalagencyreports
Federalgovernment
2%
33
Figure 3.

New One-Family Value Put in Place
Data to estimate one-family VIP are derived from infor-mation collected in SOC on the construction of one-familyhouses. VIP estimates are derived from estimates of thenumber of houses started, estimated sales price or con-tract value, estimated time to completion, and estimatednonconstruction costs which are included in sales (orcontract) price. Below we outline the steps in deriving anestimate of one family VIP from SOC information. Param-eters for the various procedures were estimated fromevaluation studies conducted in the past.
1. Each month the average price of houses started withthe intention of being sold and the average contractvalue of houses built by contractors are estimated fromSOC data.
2. The average construction cost of houses started iscomputed as the product of the averages above andthe proportion of those averages that is true construc-tion costs. Some costs included in the averages abovebut excluded from construction cost are land, market-ing, and appliances.
3. The total number of units started each month, asestimated from SOC, is multiplied by the averageconstruction cost and summed to arrive at total con-struction cost of houses started for each month.
4. Total construction cost for a month is multiplied by aphasing pattern factor to obtain the monthly contribu-tion to VIP. The phasing pattern is used to allocate aproportion of the total construction costs of an averagehouse to each month that a house is under construc-tion.
5. The VIP for 1 month is the sum of the monthlycontributions to VIP from houses started in the currentmonth and each of the 11 previous months.
New Multifamily Value Put in Place
Estimates of VIP for new multifamily buildings are obtainedthrough a Construction Progress Reporting Survey (CPRS)of the multifamily projects selected in the SOC sample.When multifamily activity is high, all large projects aretaken with certainty and smaller ones are subsampled.Otherwise all multifamily buildings in the SOC sample areincluded in the multifamily CPRS sample. Most projects arein permit places with only a very few in nonpermit seg-ments.
Questionnaires are mailed each month to owners ofprojects selected in the sample and respondents are askedto report the value put in place for that project for thecurrent month and succeeding months. Completed projectsare removed from the survey and projects not yet startedare held in an abeyance file until they start. The owner’s
estimate of total construction cost and the total architec-ture, engineering, and miscellaneous costs also is col-lected when the project becomes part of the sample.Telephone follow-up is conducted for nonrespondents.
Response data are keyed in NPC and sent to headquar-ters for tabulation. Edits are performed to ensure thatproject estimates are reasonable. If a respondent does notprovide an estimate of total construction cost for a project,one is imputed. If a respondent does not provide monthlyVIP, a value is imputed based on total project costs.
The probability of selecting a project into the sample isavailable from SOC and the inverse of this probability isused to compute the weighted VIP. The weighted VIP aresummed for all projects under construction in a month toobtain an estimate of total monthly VIP. A ratio adjustmentwith the Building Permits Survey’s estimates of multifamilyunits authorized is used to improve estimate quality.
The monthly value put in place for each project in thesample is increased by the ratio of the architecture, engi-neering, and miscellaneous costs to the total constructioncost to distribute these additional costs over the life of theproject.
Residential Improvements
Estimating for residential improvements is a two-partoperation conducted in conjunction with the ConsumerExpenditure Survey (CES). The CES is conducted by theCensus Bureau for the Bureau of Labor Statistics andcontributes to the derivation of the Consumer Price Index.The sampling units for the CES are households and thesampling frame is the address listings maintained by theCensus Bureau. The sample for the CES is periodicallyreselected and the most recent sample was selectedfollowing the 1990 Census. For owner-occupied housingunits, we employ information about improvements as col-lected directly on the CES questionnaire. For vacant orrented housing units, we collect information from theowners in a mail survey that we conduct, referred to as theSurvey of Residential Alterations and Repairs (SORAR).Information is collected on expenditures for additions,alterations, major replacements (such as replacement of aroof), and maintenance and repairs. We collect the amountof money a household spent on construction materials andlabor by type of job. Maintenance and repairs data arepublished but they are not included in value put in placeestimates.
Approximately 70 percent of our estimate of residentialimprovements comes directly from the CES and the remain-ing portion comes from SORAR. We first describe activitiesin deriving estimates for owner occupied housing units andthen describe activities for vacant or rental units.
The Consumer Expenditure Survey (owner-occupiedunits) . All household expenditure data are collected forowner-occupied housing units by field representatives con-ducting personal interviews which typically last 2 hours or
U.S. Census Bureau
34

more. Five interviews are conducted with each respondentover a 1-year period. After the initial interview, four moreinterviews are conducted at 3-month intervals to collectdata on expenditures. After the fifth interview, the respond-ent is removed from the survey. As respondents areremoved, new households enter the survey. Estimates areadjusted to compensate for nonresponse.
Quarterly Survey of Residential Alterations and Repairs(rental and vacant units) . If a housing unit in the CESsample is vacant or occupied by a renter, the unit isincluded in SORAR, which is a mail survey sent to theowner of the unit.
The owner of a rental or vacant unit from the CES iscontacted and asked to report construction expendituresfor the property which includes the unit. About half the unitsare single-family houses. If a property is a housing complexwhich includes one or more buildings, data are collected forthe entire complex and should include expenditures oncommon areas such as recreation buildings and swimmingpools. The total expenditures for the property are dividedby the number of housing units in the property to provide anexpenditure value for the housing unit in sample.
Once this information has been keyed and edited weadjust for nonresponse. Separate nonresponse factors arecomputed for vacant units and for rental units.
Private Nonresidential Construction (Nonfarm)
A private company, F. W. Dodge, produces a list ofconstruction projects, which we purchase and use as asampling frame of nonresidential construction. Construc-tion projects include new buildings, an addition or alterationto an existing building, or a major replacement such as thereplacement of a roof, and construction other than build-ings such as golf courses. Maintenance and repair projectsare not included in our survey.
Since the Dodge list does not usually include projects innonpermit areas of the country, a canvass for theseprojects in nonpermit areas is conducted in conjunctionwith the residential canvass for SOC. Projects identified inthe canvass are used to supplement the Dodge frame.Field interviewers working on SOC in permit-issuing placesalso list a sample of permits for nonresidential construction,which we employ to evaluate the Dodge sampling frame.This list is matched to the Dodge construction project frameand is used to provide an estimate of frame undercover-age.
A questionnaire is mailed to owners of all sampledprojects that are about to be started (according to informa-tion from Dodge). Initially, respondents are asked to reporttotal construction cost and architectural, engineering, andmiscellaneous costs. The value put in place is collectedmonthly until the project is completed. Data are collectedby mail and phone by the NPC staff. Data are keyed andsent to headquarters for analysis and processing. Edits are
performed to ensure consistency between the total con-struction cost and the sum of the monthly value put in placedata. Information is imputed to compensate for nonre-sponse. Estimates also are adjusted to compensate forundercoverage in the sampling frame.
Monthly and annual estimates of VIP by type of con-struction are produced at the National level. Also providedannually are data on monthly progress from start to comple-tion. Preliminary estimates of monthly value put in placeare produced with revisions the first and second followingmonths and a final revision at the end of the annualprocessing.
The monthly estimates of VIP are seasonally adjustedand constant dollar estimates also are produced. See thesection below for more information on indexes.
Farm Nonresidential
The Department of Agriculture compiles an annual esti-mate of farm nonresidential construction. This number isreleased in the middle of the following year and currentestimates are forecasted by the International Trade Admin-istration. A monthly series is produced from the annualseries by using a benchmarking procedure. The annualseries provides the benchmarking levels and other compo-nents of VIP are used to provide the month-to-monthchanges.
Public Utilities
Telecommunications . In a monthly telephone survey,major phone companies report construction expendituresto us. Annually, we obtain construction levels for all phonecompanies from the U. S. Telephone Association. Annualconstruction for cable companies is obtained from anindustry source. The monthly phone company data arecombined with the annual data for small phone companiesand cable companies to get annual estimates of telecom-munication. Monthly estimates are produced by benchmark-ing the monthly construction of major phone companies tothe annual totals for telecommunication.
Railroads . Major railroads are required to report construc-tion expenditure data to the Surface Transportation Board(STB) each quarter and we access those data. The quar-terly data are converted to a monthly series by benchmark-ing and interpolation. The data reported by the majorcompanies to the STB include items that are out of scope.Annually these companies report detailed expenditure datato the STB that allow us to compile a correct annual total ofconstruction expenditures. We benchmark the monthlyseries to the corrected annual totals.
Electric light and power . We develop annual VIP forelectric light and power from Federal Energy RegulatoryCommission (FERC) data. Monthly estimates are formedby benchmarking trends obtained from progress of a smallsample of electric utility projects to the annual VIP forelectric light and power.
U.S. Census Bureau
35

Gas. The American Gas Association publishes data ontotal construction for all gas companies, which include thecost of land and equipment. To this total we apply anadjustment factor to eliminate land and equipment from thedata.
The adjustment factor for the total construction from theAmerican Gas Association is derived annually from datafrom FERC. We use its data to derive the annual change invalue for buildings and outside plant and the annualchange in value for total assets for large gas companies.The ratio of the two annual changes is the factor applied tothe American Gas Association’s total gas company con-struction.
The annual estimate for gas company construction isconverted to a monthly series by benchmarking trendsobtained from progress of a small sample of gas utilityprojects to these annual estimates.
Petroleum pipelines . From construction expenditure dataon file at FERC, we compile an annual total of VIP. Trendsobtained from progress of a small sample of petroleumpipeline projects are benchmarked to these annual totals toprovide a monthly petroleum pipelines series.
Alternate data collection methods under consider-ation . For the Electric Light and Power, Gas, and Petro-leum Pipelines series, data collection through a samplesurvey of companies is being considered. The monthlyestimates derived from this data collection could be bench-marked to the annual estimates of value put in placecurrently being compiled from regulatory agencies. For theRailroads series, there are plans to begin collecting monthlydata directly from the major railroad companies which donot report to us.
State and Local Government Construction
Data for state and local government construction arecollected by a Construction Progress Reporting Surveythat is very similar in design to the survey for privatenonresidential construction. The sampling frame is pur-chased from F. W. Dodge and is periodically evaluated forquality of coverage. The last evaluation was done in 1988.A sample of state and local governments were contactedand asked to provide a list of construction project awards.These lists were matched to the Dodge project frame, andprojects not found on the Dodge frame contributed to theundercoverage factor.
Initially, data are collected on the project owner’s esti-mate of total construction cost and architectural, engineer-ing, and miscellaneous costs. Value put in place data arecollected monthly.
Edits are performed to ensure consistency between thetotal construction cost and the sum of the monthly value putin place data.
We benchmark our estimates of state and local construc-tion to state and local government construction data avail-able from the Annual Survey of Government Financeswhich is conducted by the Governments Division of theCensus Bureau.
Federal Government Construction
Monthly reports are received from government agen-cies, including branches of the military, which account foralmost all of the federal construction. The reports aretabulated to arrive at monthly totals which are detailed bytype of construction.
MANUFACTURED (MOBILE) HOME PROGRAM
Sampling Units, Sampling Frame, and FrameCoverage
The Department of Housing and Urban Development(HUD) has a contract with the National Conference ofStates on Building Codes and Standards (NCSBCS) toregulate the manufacture of mobile homes. NCSBCS con-tracts with inspection agents to inspect mobile homes inthe manufacturing plants and produce a list of all units withthe name of the dealer who will receive the finished unit.These lists provide the sampling frame from which weselect a sample for our Survey of New Manufactured(Mobile) Home Placements. All mobile homes manufac-tured in the United States are inspected by HUD agents sothis sampling frame has complete coverage.
Data Collection and Processing
Data are collected each month through telephone inter-views conducted by NPC staff. Sampled units stay in thesurvey until they are placed on a mobile home site foroccupancy. If a unit is transferred to another dealer, wecontinue followup on the unit with the new dealer. Otherdata collected are the sales price of sold units and selectedcharacteristics of the unit. Data are keyed in NPC andtransmitted to headquarters for review, correction, andtabulation. Data are imputed for units where response dataare not available.
Estimation and Publication
Estimates are formed by weighting data for sampledunits by the inverse of the unit’s probability of selection.National estimates of mobile homes placed, sales price ofunits sold, and units in dealers’ inventories are providedquarterly. State and selected metropolitan area estimates
U.S. Census Bureau
36

are produced annually along with estimates for selectedcharacteristics. We also publish monthly data compiled byNCSBCS on shipments of mobile homes from manufac-tures.
Special Features
Response rates for this survey have deteriorated overtime. The sales price estimates have a higher rate ofnonresponse than other items since some dealers considerthe price confidential. We are trying to improve theseresponse rates.
ECONOMIC CENSUS: CONSTRUCTION SECTOR
Sampling Units, Sampling Frame, and FrameCoverage
Data on the construction sector of the economy arecollected as part of the economic census in years ending in2 and 7. All establishments of multiunit companies andlarge single-unit establishments with employees that areengaged in construction are included. A sample of smallsingle-unit construction establishments with employees istaken and data from the Internal Revenue Service is usedfor construction establishments with no employees. Thereare about 650,000 construction establishments with employ-ees and over a million with no employees. About 200,000of the employer establishments are included in the census.
The sampling frame, derived from information providedby the Internal Revenue Service and the Social SecurityAdministration, is the Standard Statistical EstablishmentList (SSEL) maintained by the Bureau for economic sur-veys and censuses. The SSEL is regularly updated for newestablishments, purged of discontinued establishments,and corrected for company splits, mergers, and otherchanges. This frame provides very good coverage ofconstruction establishments.
Data Collection and Processing
Data are collected using a mail questionnaire withseveral mail followups and a telephone followup of largeestablishments. Information on number of employees, pay-roll, receipts, cost of materials, work subcontracted out,kind of business, assets, depreciation, and other items iscollected.
Followup mailings are supplemented with newly formedestablishments. Questionnaires are returned to our pro-cessing center where they are reviewed and keyed. Thekeyed data go through a complex edit and are entered intoa database. Analysts in headquarters review tabulated
data. Respondents are contacted during either the process-ing center or the headquarters operations to correct orclarify the data. Data are imputed for establishments thatdo not report or give incomplete information.
Estimation and Publications
Estimates are formed by multiplying response data bythe selection weight. Estimates from the 1997 EconomicCensus will be produced at the National and state levels.In the past, estimates also were produced for selectedmetropolitan areas. All estimates are for the year for whichthe census was conducted.
Special Features
Data from the construction sector of the economiccensus are compared to annual Value Put in Place esti-mates to identify coverage problems in the latter forpossible use as a benchmark. However, there are prob-lems with comparing census data with VIP estimates.
Only about two-thirds of ‘‘construction,’’ as defined inVIP, is actually done by the construction industry as definedby the census. Examples of construction work done out-side the industry are architectural and engineering design,construction management (added for 1997), force-accountconstruction, and secondary construction (installations doneby employees of a hardware store, for instance). Also,outside the scope of the census is work done by nonem-ployers and a significant amount of construction work donein the underground economy. Further problems involvehow one calculates ‘‘net’’ construction in the census. Indeveloping comparisons between VIP and census data,estimates and assumptions have to be made for thesedifferences.
CONSTRUCTION PRICE INDEXES
Bureau Produced Indexes
New single-family houses . Data from SOC are used toproduce two versions of a price index: an index of unitssold and an index of units under construction. Both indexesare produced from a hedonic regression model whichrelates the sales price or contract value of a house to itscharacteristics. In particular, sales price or contract value isthe dependent variable and characteristics such as squarefeet in the unit, geographical location, number of fireplaces,and parking facility are independent variables. Indexes fordetached houses are produced regionally and for attachedhomes at the national level. The final National indexes area weighted average of the regional indexes for detachedunits and the National index of attached units. The index of
U.S. Census Bureau
37

units sold is produced quarterly and annually at the Nationallevel and annually at the regional level. The index of unitsunder construction is produced at the National level monthly.
The single-family index of units under construction isused to deflate current dollar estimates of new residentialconstruction VIP. From time to time the questionnaire forSOC is revised to collect additional characteristic data forpossible use in the index.
New multifamily units . The BEA has designed a multi-family index using data from SOC and the Multifamily VIPSurvey and this index is produced each year at the CensusBureau. This index is also a hedonic regression modelwhere the dependent variable is construction cost per unitand the independent variables are average square feet inthe unit, number of bathrooms, parking structure, etc.
Use of Indexes From Outside the CensusBureau
Besides the indexes discussed above, we use thefollowing construction cost and price indexes from outsidesources as deflators of various categories of the Value Putin Place series. They are:
• Turner Construction Company
• Federal Highway Administration—Composite
• Bureau of Reclamation
• Turner Telephone Plant
• Handy Whitman: Electric, Utility Building, Gas, Water
Further Information About Census BureauConstruction Indexes
More information about indexes is contained in theappendixes of our reports. Information concerning thesingle-family price indexes is found in an appendix to theMarch issue of the New One-family Houses Sold Report(C25), Appendix A: Description of Price Index. Informationon the various indexes used to deflate different compo-nents of the VIP estimate is found in the May issue of theValue of Construction Put in Place (C30), Appendix D:Adjustments for Seasonal Variations and Cost Change.
U.S. Census Bureau
38

Appendix A.Conference Agenda
Construction Statistics Data Users’ ConferenceEmbassy Suites Hotel
1250 22nd Street, N.W., Washington, DCOctober 28, 1997
Agenda
8:30-9:00 a.m. Registration
9:00-9:15 Welcoming Remarks
Frederick T. Knickerbocker,Bureau of the Census
9:15-10:30 New Residential Construction
Michael Carliner,National Association of Home Builders
10:30-10:45 Break
10:45-12:00 Residential Improvements and Repairs
Kermit Baker,Harvard University
12:00-1:30 p.m. Lunch
Luncheon Speaker
Frederick T. Knickerbocker,Bureau of the Census
1:30-2:45 Value Put in Place Program
Robert P. Parker,Bureau of Economic Analysis
2:45-3:00 Break
3:00-4:15 Economic Census: Construction Sector
Manuel D. Gutierrez,Kohler Company
4:15-4:45 Concluding Remarks
Thomas L. Mesenbourg,Bureau of the Census
Appendix A A-1
U.S. Census Bureau

Appendix B.Registered Participants
Gopal Ahluwalia, National Association of Home Builders’, Washington, DCStephen H. Andrews, Bureau of the Census, Washington, DCKermit Baker, Joint Center for Housing Studies, Cambridge, MAEric S. Belsky, Joint Center for Housing Studies, Cambridge, MADavid W. Berson, Fannie Mae, Washington, DC
Will Biddle, National Association of Home Builders’ Research Center, Upper Marlboro, MDDoug C. Bond, Bureau of the Census, Washington, DCHyo-SubByun, Korean Statistical Agency, Washington, DCMichael S. Carliner, National Association of Home Builders, Washington, DCRobert E. Chapman, National Institute of Science and Technology, Gaithersburg, MD
Cynthia Z.F. Clark, Bureau of the Census, Washington, DCJeanine Conwell, Equipment Manufacturers Institute, Chicago, ILJohn Curtis, Associated General Contractors of America, Washington, DCDavid E. Czechowski, Portland Cement Association, Skokie, ILDavid D’Alessandris, National Association of Realtors, Washington, DC
Paul R. D’Armiento, G P & V Associates, Arlington, VAJudy M. Dodds, Bureau of the Census, Washington, DCDennis K. Duke, Bureau of the Census, Washington, DCTimothy Dunne, Bureau of the Census, Washington, DCStanley F. Duobinis, National Association of Home Builders, Washington, DC
Randy Eager, General Management Technologies, Pittsburgh, PAFrederick J. Eggers, U.S. Department of Housing and Urban Development, Washington, DCMary E. Fenelon, McGraw-Hill, Washington, DCJames T. Fergus, Federal Reserve Board, Washington, DCDwight K. French, Energy Information Administration, Washington, DC
Peter J. Fronczek, Bureau of the Census, Washington, DCJohn H. Gates, Bureau of the Census, Washington, DCJohn L. Goodman, Jr., National Multi Housing Council, Washington, DCBrian V. Greenberg, Bureau of the Census, Washington, DCHeather Grob, Center to Protect Workers’ Rights, Washington, DC
Anita Gryan, F.W. Dodge, Lexington, MAManuel D. Gutierrez, Kohler Company, Kohler, WIJohn C. Haltiwanger, Bureau of the Census, Washington, DCShannon Hendrickson, Associated Builders and Contractors, Rosslyn, VAPatricia L. Horning, Bureau of the Census, Washington, DC,
Susan L.Hostetter, Bureau of the Census, Washington, DCLinda P. Hoyle, Bureau of the Census, Washington, DCJoseph J. Huesman, Bureau of the Census, Washington, DCDavid A. Johnston, Design-Build Institute of America, Washington, DCMel Jones, Statistics Canada, Ottawa, Canada
Appendix B B-1
U.S. Census Bureau

Michael J. Kennamann, Caterpillar, Peoria, ILJames Kennedy, Federal Reserve Board, Washington, DCKim Kennedy, Cahners Economics, Newton, MAJames H. Kerr, F.W. Dodge, Washington, DCFrederick T. Knickerbocker, Bureau of the Census, Washington, DC
Anne Lawson, Bureau of Economic Analysis, Washington, DCPatrick MacAuley, Department of Commerce, ITA, Washington, DCKathleen McDonald-Johnson, Bureau of the Census, Washington, DCDuane T. McGough, Washington, DCThomas L. Mesenbourg, Jr., Bureau of the Census, Washington, DC
William K. Mittendorf, Bureau of the Census, Washington, DCEdward D. Montfort, Bureau of the Census, Washington, DCCarol Moylan, Bureau of Economic Analysis, Washington, DCRobert Murray, McGraw-Hill, Lexington, MAFrank Nothaft, Freddie Mac, McLean, VA
Sue Okubo, Bureau of Economic Analysis, Washington, DCJohn G. Olsen, Bureau of Labor Statistics, Washington, DCCalvin S. Oren, Construction Market Data Group, Greenbelt, MDAdam Pagnucco, Building and Construction Trades Dept., AFL-CIO, Washington, DCRobert P. Parker, Bureau of Economic Analysis, Washington, DC
Charles P. Pautler, Bureau of the Census, Washington, DCPhilip Porado, Housing Market Report/CD Publications, Silver Spring, MDLee Price, Department of Commerce, Washington, DCBarry A. Rappaport, Bureau of the Census, Washington, DCRoderick Rennison, National Institute of Standards & Technology, Gaithersburg, MD
Brooks Robinson, Bureau of Economic Analysis, Washington, DCCindy Robinson, National Institute for Occupational Safety and Health, Cincinnati, OHGeorge A. Roff, Jr., Bureau of the Census, Washington, DCG. Daniel Sansbury, Bureau of the Census, Washington, DCRonald J. Sepanik, U.S. Department of Housing and Urban Development, Washington, DC
Robert J. Sheehan, Regis J. Sheehan and Associates, McLean, VAChris Swann, WEFA Group, Eggyston, PAVern Totten, Statistics Canada, Ottawa, CanadaDavid A. Vandenbroucke, U.S. Department of Housing and Urban Development, Washington, DCAntoinette Vnuk, Construction Industry Manufacturers Association, Milwaukee, WI
Daniel H. Weinberg, Bureau of the Census, Washington, DCBarbara T. Williams, Bureau of the Census, Washington, DCDavid Yockel, International Brotherhood of Electrical Workers, Washington, DCKarl Zandi, Regional Financial Associates, Inc., West Chester, PA
U.S. Census Bureau
B-2 Appendix B

Appendix C.Census Bureau Contacts
Contact Phone E-mail
New Residential Construction Dan Sansbury 301-457-1321 [email protected]
Residential Improvements and Repairs Joe Huesman 301-457-4822 [email protected]
Value of Construction Put in Place George Roff 301-457-1605 [email protected]
Construction Sector Pat Horning 301-457-4680 [email protected]
Manufactured (Mobile) Homes George Roff 301-457-1605 [email protected]
Appendix C C-1
U.S. Census Bureau