construction site layout planning: application of multi
TRANSCRIPT

Teknik Dergi, 2018 8691-8713, Paper 519
Construction Site Layout Planning: Application of Multi-Objective Particle Swarm Optimization* Mustafa ORAL1 Siamak BAZAATI2 Serkan AYDINLI3 Emel ORAL4 ABSTRACT
Construction Site Layout Planning (CSLP) comprises determining, sizing and placing of the temporary facilities within the boundaries of a construction site by considering many factors. Traveling distance between facilities and safety risks are two essential factors that need to be minimized while planning site layout of a construction project. Many studies treated CSLP as a single objective optimization problem. They have mainly focused on either diminishing the travel cost of resources on site without considering the safety aspect or vice versa. While a few of the studies have treated the problem as a multi-objective optimization problem, none of them included a risk assessment approach including crane-related constraints. Hence, a user-friendly CSLP model that includes a risk assessment approach for safety constraints is proposed by using a Multi-Objective Particle Swarm Optimization algorithm based on Pareto dominance approach to minimize both the construction safety risks of crane operated projects and the total traveling distance of the resources between temporary facilities.
Keywords: Construction site layout planning, crane, multi-objective optimization, particle swarm optimization, safety.
1. INTRODUCTION
Site layout planning is one of the significant tasks of site management. In the absence of an effective and a systematic approach to site layout planning, construction projects involving a high number of manpower, subcontractors, and equipment may face time loss, cost overruns and jeopardized construction site safety [1,2,3] .
Note:
- This paper has been received on February 02, 2018 and accepted for publication by the Editorial Board on August 29, 2018.
- Discussions on this paper will be accepted by January 31, 2019. DOI: 10.18400/tekderg.389638 1 Cukurova University, Department of Computer Engineering, Adana, Turkey - [email protected] 2 Cukurova University, Department of Civil Engineering, Adana, Turkey - [email protected] 3 Cukurova University, Department of Civil Engineering, Adana, Turkey - [email protected] 4 Cukurova University, Department of Civil Engineering, Adana, Turkey - [email protected]

Construction Site Layout Planning: Application of Multi-Objective Particle …
8692
Construction Site Layout Planning (CSLP) comprises determining, sizing and placing of temporary facilities within the boundaries of a construction site by considering many factors such as; location/design features of the permanent structures to be build, project type/scale, the location of the site, machinery used during construction and organization of the construction works. Presence of tower crane(s) on site is in itself one of the major factors that should be considered during the placement of temporary facilities as cranes are associated with nearly one-third of deaths on construction sites [4].
While practitioners in the industry still rely on individual experience and subjective judgment, significant research advancements have been accomplished in the area of optimizing construction site layout plans. Researchers used a variety of approaches comprising Genetic Algorithms (GA), Ant Colony Optimization (ACO), Multi-Objective Particle Swarm Optimization (MOPSO) and knowledge-based systems. Although these models had great contributions (discussed in the following section), very few of them focused on optimization of both traveling distance between facilities and crane-related site safety risks. Thus, the aim of the current study has been to develop a user-friendly site layout planning model which would both minimize construction safety risks of crane operated projects and the total traveling distance of resources between temporary facilities for quadrilateral construction sites with one tower crane. Unlike previous studies, a risk assessment approach has also been integrated into the model.
2. LITERATURE REVIEW
Table 1 summarizes optimization models developed for CSLP problems.
Table 1. Optimization models developed for CSLP problem
Reference Optimization Objective(s)
# of Objectives
Method(s) Used Validation
1. Li and Love (1998) [3] Li and Love (2000) [5]
Minimize total traveling distance between facilities on site
Single GA Based on a hypothetical case study. Analyses effect of population sizes on the optimal solution.
2. Zouein and Tommelein (1999) [1]
Minimize total traveling distance between facilities on site
Single The Constraint Satisfaction and Propagation Algorithm
Based on a hypothetical case study.
3. Harmanani et al. (2000) [6]
Minimize total traveling distance between facilities on site
Single GA Based on a hypothetical case study. Analyses effect of facility/site area ratio on the optimal solution.
4. Tawfik and Fernando (2001) [7]
Minimize safety risk, maximize space use, minimize the total traveling distance between facilities on site individually.
Single GIS, GA, Simulated Annealing
Based on a hypothetical case study. Analyses effect of number of generations on cost values.
5. Mawdesley et al.(2002) [8]
Minimize total traveling distance between facilities on site
Single GA Based on two case studies; one hypothetical and one real-life project.

Mustafa ORAL, Siamak BAZAATI, Serkan AYDINLI, Emel ORAL
8693
Table 1. Optimization models developed for CSLP problem (continued)
6.El-Rayes and Khalafallah (2005) [9]
Maximize safety (including the crane) and minimize traveling costs, simultaneously
Multiple GA Based on a real-life case study; a multi-story garage building. Analyses effect of population sizes and number of generations on the optimal solution.
7.Sanad et al. (2008) [10]
Maximize safety and minimize traveling costs, simultaneously
Multiple GA Based on a real-life case study. Analyses effect of population sizes and number of generations on the optimal solution.
8. Zhang and Wang (2008) [11]
Minimize total traveling distance between facilities on site
Single PSO Compares results with the results (based on number of iterations) obtained by using GA model by Li and Love [5].
9. Khalafallah and El-Rayes (2011) [12]
Minimize construction safety, construction-related aviation safety construction-related security level, and overall site layout costs separately (including crane as a typical facility).
Multiple GA Based on a real-life case study (Airport construction project) Observes the changes in number of population and generation on the optimal solution. Compares optimal solution for each objective graphically.
10.Xu and Li (2012) [13]
Maximize safety and minimize traveling costs, simultaneously
Multiple PSO with permutation-based representation
Based on a real-life case study. Analyses solutions obtained from fuzzy random type, fuzzy type and standard type of MOPSO.
11.Ning et al. (2010) [14] Ning and Lam (2013) [15]
Maximize safety and minimize traveling costs, simultaneously.
Multiple ACO Based on a real-life case study. Analyses effect of the quality site layout alternatives generated in the initial solution set to the final solution.
12.Adrian et al.(2015) [16]
Minimize total traveling distance between facilities on site
Single GA, PSO, and ACO
Uses a hypothetical case study to compare the results obtained from three methods.
13.Yahya and Saka (2014) [17]
Maximize safety (including the crane) and minimize traveling costs, simultaneously
Multiple Multi-objective ABC (MOABC) via Levy flights
Compares real-life site layout, Basic-MOABC model, and MOABC via Levy flights solution for a hospital project.
14.Zhao and Li (2014) [18]
Minimize total traveling distance of resources and security risks, simultaneously
Multiple Multi-objective GA
Uses a hypothetical case study.
It is seen that earlier studies have focused on single objective -minimizing the total traveling distance of resources between site facilities- by using GA. Validations of the models have been based on case studies which were mostly hypothetical. Quality of obtained solutions

Construction Site Layout Planning: Application of Multi-Objective Particle …
8694
was generally discussed by considering the effect of population sizes and number of generations. Later studies have generally focused on solving CSLP as a multi-objective problem by using methods like GA, PSO, and ACO. Optimal trade-offs between construction safety and total traveling cost of resources have been selected by the model developers from various solutions provided by the existing models. For example, Khalafallah and El-Rayes (2011) [9] provided four trade-off curves (which were site layout cost vs. construction safety, debris control, wildlife management and airport security) from which the airport planners were expected to choose the most suitable one. They maximized construction safety only by placing most vulnerable facilities from the crane as far as possible. Sanad et al. (2008) [7], on the other hand included constraints like; prohibited areas (in order to prevent some facilities that have harmful effects such as noise, air pollution, etc. from being positioned adjacent or near to sensitive entities like hospitals), minimum distance requirements between temporary facilities, and safety zones (in order to protect workers from falling materials, tools or equipment). Use of cranes was not considered as a separate risk factor. Meanwhile, Ning et al. (2010) [14] and Ning and Lam (2013) [15] used ACO, and Xu and Li (2012) [10] used PSO to solve the multi-objective dynamic construction site layout planning to minimize the cost for each single facility, the interaction cost between different facilities and the possibility of safety or environmental accidents. All focused on safety optimization which was based on the logic that ‘high-risk' facilities would be placed far from ‘highly protected’facilities. Crane related risks were not formulated separately. Among all of these studies, only El Rayes and Khalafallah (2005) [9] and Yahya and Saka (2014) [17] considered crane operations as part of safety constraints. While El Rayes and Khalafallah (2005) considered safety criteria based on risk sensitivities of the temporary facilities only due to falling objects from cranes [9]; Yahya and Saka (2014) included a constraint only for the facilities that should be placed within the reachable radius of cranes [17]. However, considering the risks of only the falling objects (like El Rayes and Khalafallah (2005) [9]) or, only the radius of crane operations (like Yahya and Saka (2014) [17]) is not sufficient for safe placement of the facilities on site because crane operations create different risk zones which house varying degrees of risk magnitudes and probabilities which change according to the tower height and the jib length [19], [20]. Thus, the current study takes crane-related risks into account by considering the sensitivity of different areas on site related to possible load struck, object falls, crane collapses and object scatters during crane operations.
3. PROPOSED MODEL
Site layout planning is unique for each project and depends on a large number of variables requiring human experience for the assessment of risks involved. Designing a site layout plan involves; identification of the required temporary facilities, determination of the sizes and other features of the facilities, the establishment of the inter-relationships between the facilities, and placement of the facilities on the site plan. Sites with cranes additionally require the definition of risk relationships between facilities and crane(s), that are not globally quantified. Thus, a risk assessment based on experts' knowledge and experience is crucial for any model which tries to solve the site layout planning problem considering minimization of crane-related safety risks. Hence, in addition to the aforementioned models, a risk assessment approach has been adopted to the safety constraints in the current model.

Mustafa ORAL, Siamak BAZAATI, Serkan AYDINLI, Emel ORAL
8695
Tower crane-related constraints for quadrilateral construction sites with one tower crane were constructed in the form that both the risk magnitudes and the probabilities of possible accidents were expressed together with the risk perceptions/approaches of the experts. To achieve this, the proposed model utilizes Equation 1 to calculate safety risk (SRi) of a temporary facility i.
SRi = RMi *Pi (1)
where;
RMi: Risk magnitude of temporary facility i, which is the estimated magnitude of the risk for the provisional facility owing to the position of the tower crane (see Equations 2-3, 5 and 8).
Pi: The probability of an accident that is influenced by the distance between facility i and the tower crane (see Equations 4, 6, 7 and 9).
Assuming that the crane operating on the construction site has tower height H and jib length J, the construction site is divided into three zones that house varying degrees of risk magnitudes, as shown in Fig.1.
Figure 1. Tower crane dimensions and risk zones
Zone 1: The area that covers the crane operating angles (0 < distance ≤ J); represents the highest sensitivity due to its vulnerability to striking loads and/or falling objects and/or collapse of the crane during its operations. The risk magnitude for facility i in Zone 1 is given in Equation 2.
RMi=(𝑅𝑀 + 𝑅𝑀 + 𝑅𝑀 ) (2)
RMSi, RMFi, and RMCi represent the fatality and injury risks related to possible strikes, load falls, and crane collapses, respectively, on the temporary facility i by the tower crane. Three types of risk magnitudes can be calculated from Equations 3 as follows. 𝑅𝑀 =∑ ∑ (𝑅𝑆 ∗ 𝑊 ) (3)

Construction Site Layout Planning: Application of Multi-Objective Particle …
8696
where;
m is the number of risk experts varying in each expertise type e, 𝑊 is the weight of the risk expert e ( please note: As setting We values would require a comprehensive field survey which would be out of the scope of the current research, these are adapted from Zeng et al. (2007) [19]. The validity of the values were confirmed by Zeng et al. (2007) [19] during the application of their risk assessment approach.), X is the event symbolized with S for load (S)truck, F for load (F)all and C for (C)ollapse, RS is the generalized form of risk severity due to possible X event on the temporary facility i by the use of the tower crane, expressed by the expert j who has an expertise type e. (that is converted to a constant depending [18])
Temporary facility i has the highest probability of an accident (Pi) if it is allocated in Zone 1. It is constant (Equation 4) and its value is calculated by considering the Pi values in all zones and their sub-zones as discussed below. 𝑃 = (4)
Zone 2: It is the area located between zones 1 and 3 (J < distance ≤ J+H); represents an intermediate level of sensitivity due to its vulnerability to the collapse of the tower crane. The risk magnitude for facility i in Zone 2 is given in Equation 5.
RMi = 𝑅𝑀 (5)
Zone 2 is divided into two equal sub-zones to calculate the probability of an accident, Pi. It is linearly decaying and has different slopes within each sub-zone. In sub-zone 1 ( 𝐽 <𝑑𝑖𝑠𝑡𝑎𝑛𝑐𝑒 ≤ 𝐽 + ), and sub-zone 2 ( 𝐽 + < 𝑑𝑖𝑠𝑡𝑎𝑛𝑐𝑒 ≤ 𝐽 +H), the probability is governed by Equations 6 and 7, respectively. 𝑃 = ∗( )∗ + (6)
𝑃 = ∗( )∗ + (7)
As for the location of a facility afar from the reach of the tower crane, the probability of an accident rapidly decreases. This is reflected on the Equations 6 and 7 with different slope values.
Zone 3: the area that is outside the crane risk areas (J+H < distance); represents a low level of sensitivity due to its minor vulnerability to the scattered objects during the crane collapse [19]. Therefore, the risk magnitude is quite low and is as given as in Equation 8.
RMi = 1/33 (8)
The probability of an accident Pi is treated as in Zone 2. Once again, the Zone is divided into two sub-zones. In the first sub-zone ( 𝐽 + 𝐻 < 𝑑𝑖𝑠𝑡𝑎𝑛𝑐𝑒 ≤ 𝐽 + ∗ ), the distance dependent probability is calculated as;

Mustafa ORAL, Siamak BAZAATI, Serkan AYDINLI, Emel ORAL
8697
𝑃 = ∗( )∗ + (9)
In the second sub- zone( 𝐽 + ∗ < 𝑑𝑖𝑠𝑡𝑎𝑛𝑐𝑒), however, tower crane related accident probability becomes extinct.
3.1. Objective Functions
The problem of satisfying two different objectives at the same time is expressed by formulating two separate objective functions, which in our case are; 𝑀𝑖𝑛 𝑆𝑅 = ∑ 𝑅𝑀𝒊 ∗ 𝑃𝑖𝒏 (10) 𝑀𝑖𝑛 𝑇𝐷 = ∑ ∑ 𝑤 𝑑 (11)
The objective function for the minimization of the safety risk (SR) is expressed as in Equation 10 and can be calculated by using Equations 1 to 9. The objective function for the minimization of the total traveling distance (TD) is formulated by considering the proximity weights wij which depends on the desired closeness between the facilities [10]. Proximity weights are originally verbal statements expressed by the site management and need to be quantified. The conversion metrics, used by Hegazy and Elbeltagi (1999) [2] and Sanad et al. (2008) [10], given in Table 2, is used to determine quantified proximity weights [20][10].
Table 2. The six-value scale used for desired closeness between facilities
Desired closeness between facilities Proximity weights for relationships between facilities (wij)
Undesirable (X) 60=1 Unimportant (U) 61=6 Ordinary closeness(O) 62=36 Important (I) 63=216 Especially important (E) 64=1296 Absolutely necessary (A) 65=7776
dij is, on the other hand, the distance between facilities i and j, and can be calculated from Equation 12.
𝑑 = (𝐶 − 𝐶 ) + (𝐶 − 𝐶 ) (12)
where;

Construction Site Layout Planning: Application of Multi-Objective Particle …
8698
𝐶 , 𝐶 , and 𝐶 , 𝐶 are the coordinates of the center of gravity of facilities i and j, respectively.
3.2. Optimization Constraints
To assure the improvement of initial site layout plans, two types of constraints; boundary and overlap, are imposed on the generated solutions. These constraints are required to ensure that temporary facilities are located within the construction site boundaries while avoiding the overlapping of the facilities.
Figure 2. Boundary and overlap constraints
3.2.1. Boundary Constraints
Boundary constraints are investigated using the following steps to provide that each facility is located within the boundaries of the site (provided by the site management and initial site layout drawings).
Boundary constraints for the facility i are satisfied for all k-directions –which in turn satisfies the area requirement of the facility- (see Fig. 2) if: 𝐶 + + 𝛿𝑘 ≤ 𝑘 (13)
𝐶 − + 𝛿𝑘 ≤ 𝑘 (14)
where;
Cki: k (x or y in 2D space) component of the center of gravity of facility i.

Mustafa ORAL, Siamak BAZAATI, Serkan AYDINLI, Emel ORAL
8699
LWki: Length or width of the facility i in the k-direction. If k is x-direction then LW is the length of facility i; otherwise, it is the width. 𝛿𝑘 : Minimum distance required between the facilities i and j, or facility i and the site boundary in the k-direction. 𝑘 : Upper boundary of the site area in the k-direction. 𝑘 : Lower boundary of the site area in the k-direction.
3.2.2. Overlap Constraints
To ensure that no overlap occurs between the facilities on site, overlap constraints are examined using Equation 15. (see Fig. 2).
In k direction overlap constraint between facilities i and j are satisfied if: 𝐶 − 𝐶 ≥ + + max 𝛿𝑘 , 𝛿𝑘 (15)
3.3. Multi-Objective Optimization
As stated in the above sections, site layout optimization problem considering safety risks and traveling distances between facilities is multi-objective in nature as it incorporates more than one objective function to be optimized concurrently. There is not a single solution that simultaneously satisfies each objective [21]. In fact, trade-offs between the objectives of minimizing safety risks and traveling distances between facilities force the decision maker to select an optimal solution from a set of Pareto optimal solutions that are considered equally good if there is not any additional subjective preference. A solution is called Pareto optimal or non-dominated if none of the objective functions can be improved without degrading one or more objective functions.
Given an N-dimensional decision variable vector x=(𝑥 , 𝑥 , … . , 𝑥 ) a minimization multi-objective decision problem with Ω objectives can be formally defined as follows: min ℱ(𝐱) = 𝑓 (𝐱), 𝑓 (𝐱), … … , 𝑓 (𝐱) (16)
𝐱 ∈ 𝑋 (17) 𝒢(𝐱) = 𝑔 (𝐱), 𝑔 (𝐱), … … , 𝑔 (𝐱) ≥ 0 (18) ℋ(𝐱) = ℎ (𝐱), ℎ (𝐱), … … , ℎ (𝐱) = 0 (19) 𝑥 ( ) ≤ 𝑥 ≤ 𝑥 ( ) , 𝑖 =1,…….,N (20)
where, Ω≥2, set X is the solution space, 𝒢(𝐱) and ℋ(𝐱) are λ inequality and 𝜑 equality constraints of the problem. 𝑥 ( )and 𝑥 ( ) are lower and upper boundary of each

Construction Site Layout Planning: Application of Multi-Objective Particle …
8700
decision variable 𝑥 , respectively. A solution vector xfsbl ∈ X is called Pareto optimal or non-dominated solution, if no other solution dominates xfsbl. Formally, a feasible solution x1 ∈ X dominates another solution x2 ∈ X, if; 𝑓 (𝐱 ) ≤ 𝑓 (𝐱 ) (21) for all indices i ∈ 1, 2, … , Ω and, 𝑓 (𝐱 ) < 𝑓 (𝐱 ) (22) for at least one index 𝑗 ∈ 1, 2, … , 𝛺 The set of all non-dominated solutions is called Pareto front, and if there are no preference criteria, the outcome can be any element of the Pareto front set. The concept of dominated and non-dominated solutions is exemplified in Fig. 3.
Figure 3. Feasible solutions of a multi-objective problem with two conflicting objective
functions
3.4. Methodology
The literature review showed that GA, PSO, and ACO have been the most adopted algorithms in solving CSLP problems. Meanwhile, PSO has been reported to outperform the other two algorithms with its superior search performance with faster and more stable convergence rates (Zhang and Wang (2008) [11], Brutto et al. (2016) [22] ).
Particle Swarm Optimization (PSO) is a stochastic optimization algorithm based on the social behavior of birds in a flock or fish in a school. A simple mathematical model which describes the behavior of an individual in such a swarm has been developed by Kennedy and Eberhart in 1995 [23].
The model is based on the main principles of self-organization that is utilized to define the dynamics of complex systems. Self-organized systems display emergent behavior that is decentralized and more complex than the individual’s own actions in a flock. This emergent behavior is the result of individuals’ triggered actions that present random fluctuations by

Mustafa ORAL, Siamak BAZAATI, Serkan AYDINLI, Emel ORAL
8701
amplified positive feedback. Therefore, they achieve a higher level of intelligence. However, members of a flock create complex patterns by accomplishing simple and recurring tasks. A simplified model of this social behavior is used by PSO to solve many optimization problems in a cooperative and smart framework.
In basic PSO, any suggested solution to the problem at hand is called a particle. The problem domain is called problem space where all particles fly through. Each particle has its own position and velocity vector, that is regularly updated relative to either the leader of the flock (best solution in the swarm) and/or dominating solution within a neighborhood as well as the best personal solution experienced so far. The position and the velocity vectors are fluctuated by a degree of randomness to avoid getting trapped in local optima.
Multi-Objective Particle Swarm Optimization or MOPSO algorithm is a multi-objective version of PSO by embodying the Pareto Envelope and Grid Making Technique [24][25]. The particles in MOPSO behave similarly to those of PSO. Common actions of particles in both algorithms are to share information and moving towards the resultant vector that is formed by global best particle and individual’s personal (local) best memory. However, a multi-objective optimization problem with conflicting objectives has a set of optimal solutions that are known as non-dominated (Pareto optimal) solutions. Therefore, a sub-swarm that is called “Repository” is formed by gathering all non-dominated optimal solutions. The global best particle of PSO is replaced with the repository. Therefore, the global best solution is randomly selected from the repository for each particle in MOPSO.
MOPSO algorithm can be summarized as follows [25]:
1. Create a set of feasible solution vectors (POP) in search space. POPi is called ith particle (vector) in problem space that is bounded by the constraints of the problem.
2. Assign a velocity vector (V) to each particle in POP. Vi is the flying speed of ith particle in solution space.
3. Evaluate each particle’s fitness f(POPi) 4. Create a Repository (REP) from non-dominated optimal solutions (particles). REPi is
the ith Pareto optimal solution in POP. 5. Generate hypercubes of the search space explored by the particles so far. Use these
hypercubes to locate a particle. 6. Create a memory (PB) to keep track of each particle’s personal best position in the search
space. Initially, PB is same as POP since there has been no previous experience of any particle.
7. Repeat; 7.1. Update each particle’s velocity Vi by using the following expression. 𝐕 = 𝑤𝐕 + 𝑅 (𝐏𝐁 − 𝐏𝐎𝐏 ) + 𝑅 (𝐑𝐄𝐏 − 𝐏𝐎𝐏 )
where, w is inertia coefficient, R1 and R2 random numbers in the range of [0-1], and REPh is a non-dominated solution randomly selected from Repository as a flock leader.
7.2. Calculate new position of each particle as; 𝐏𝐎𝐏 = 𝐏𝐎𝐏 + 𝐕

Construction Site Layout Planning: Application of Multi-Objective Particle …
8702
7.3. Update Repository by discarding all dominated solutions and by adding new non-dominated solutions.
7.4. Update personal best positions if particles discover better solutions than previous ones.
7.5. Increase cycle counter. 7.6. If a maximum number of cycles are reached, then break the loop.
8. Randomly pick one (or more) Pareto optimal solution(s) from REP as an outcome.
Figure 4. Structure of the proposed model
The presented MOPSO model is implemented with MATLAB to achieve the generation of near-optimal site layout plans that minimize both the safety risks and the traveling distances between facilities by satisfying all layout constraints explained earlier. Computational steps are illustrated in Fig. 4.
3.5. Case Study
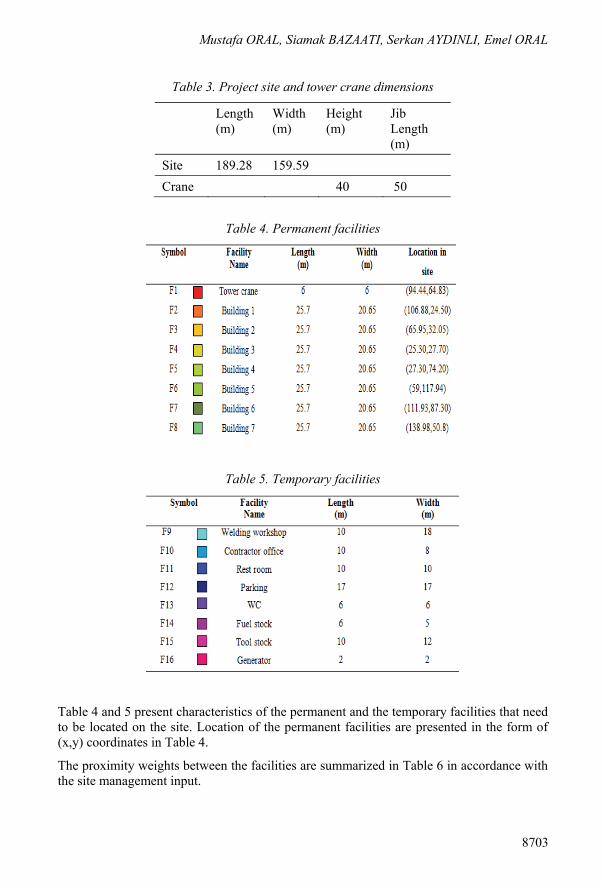
To validate the practicability and capability of the developed model, real-life site layout planning data were obtained from a site management team working on a residential building project. The project consists of seven permanent buildings and a tower crane. Input data of the application example are summarized in Tables 5 to 11. Table 3 presents the project site and tower crane dimensions.
Mustafa ORAL, Siamak BAZAATI, Serkan AYDINLI, Emel ORAL
8703
Table 3. Project site and tower crane dimensions
Length (m)
Width (m)
Height (m)
Jib Length (m)
Site 189.28 159.59 Crane 40 50
Table 4. Permanent facilities
Table 5. Temporary facilities
Table 4 and 5 present characteristics of the permanent and the temporary facilities that need to be located on the site. Location of the permanent facilities are presented in the form of (x,y) coordinates in Table 4.
The proximity weights between the facilities are summarized in Table 6 in accordance with the site management input.

Construction Site Layout Planning: Application of Multi-Objective Particle …
8704
Table 6. Proximity weights between facilities
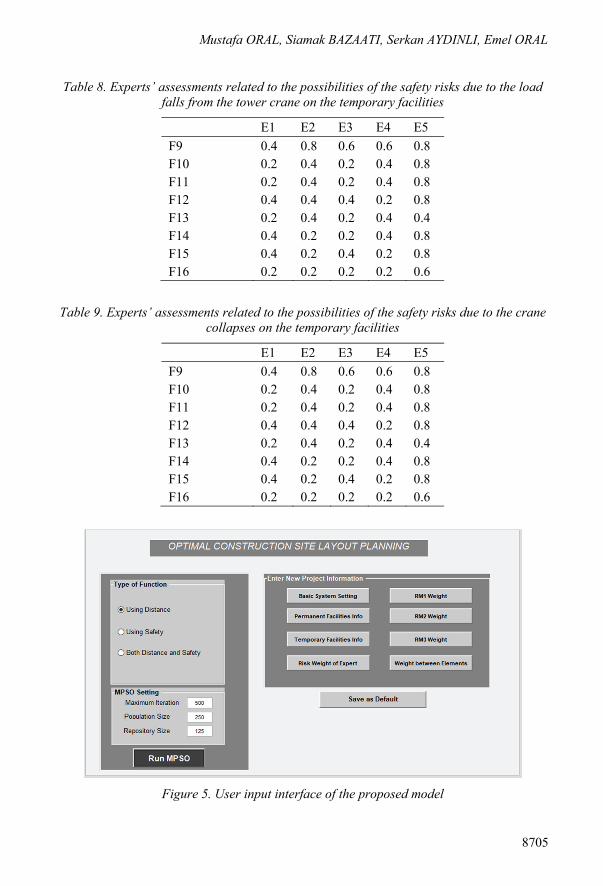
Tables 7, 8 and 9 demonstrate assessments of the risk experts related to the possibilities of the fatalities and injuries based on the risks of crane accidents. E1 to E5 are the project manager, construction manager, senior engineer and two site engineers, respectively Experts’ assessments are evaluated in accordance with the weights of the experts.
Table 7. Experts’ assessments related to the possibilities of the safety risks due to load strucks by the tower crane on the temporary facilities
E1 E2 E3 E4 E5 F9 0.4 0.8 0.4 0.6 0.6 F10 0.6 0.4 0.2 0.8 0.8 F11 1.0 0.4 0.2 0.4 0.4 F12 0.2 0.4 0.4 0.4 0.6 F13 0.2 0.4 0.2 0.4 0.4 F14 0.2 0.2 0.2 0.2 0.4 F15 0.2 0.4 0.4 0.2 0.4 F16 0.6 0.2 0.2 0.2 0.6
All the data related to the site layout plan and information provided by the experts are fed into the developed software by using the interface shown in Fig.5. The developed software allows the user to design the site layout plan by considering; only the distance, only the safety, or both objectives at the same time.
Mustafa ORAL, Siamak BAZAATI, Serkan AYDINLI, Emel ORAL
8705
Table 8. Experts’ assessments related to the possibilities of the safety risks due to the load falls from the tower crane on the temporary facilities
E1 E2 E3 E4 E5 F9 0.4 0.8 0.6 0.6 0.8 F10 0.2 0.4 0.2 0.4 0.8 F11 0.2 0.4 0.2 0.4 0.8 F12 0.4 0.4 0.4 0.2 0.8 F13 0.2 0.4 0.2 0.4 0.4 F14 0.4 0.2 0.2 0.4 0.8 F15 0.4 0.2 0.4 0.2 0.8 F16 0.2 0.2 0.2 0.2 0.6
Table 9. Experts’ assessments related to the possibilities of the safety risks due to the crane collapses on the temporary facilities
E1 E2 E3 E4 E5 F9 0.4 0.8 0.6 0.6 0.8 F10 0.2 0.4 0.2 0.4 0.8 F11 0.2 0.4 0.2 0.4 0.8 F12 0.4 0.4 0.4 0.2 0.8 F13 0.2 0.4 0.2 0.4 0.4 F14 0.4 0.2 0.2 0.4 0.8 F15 0.4 0.2 0.4 0.2 0.8 F16 0.2 0.2 0.2 0.2 0.6
Figure 5. User input interface of the proposed model

Construction Site Layout Planning: Application of Multi-Objective Particle …
8706
4. RESULTS AND DISCUSSION
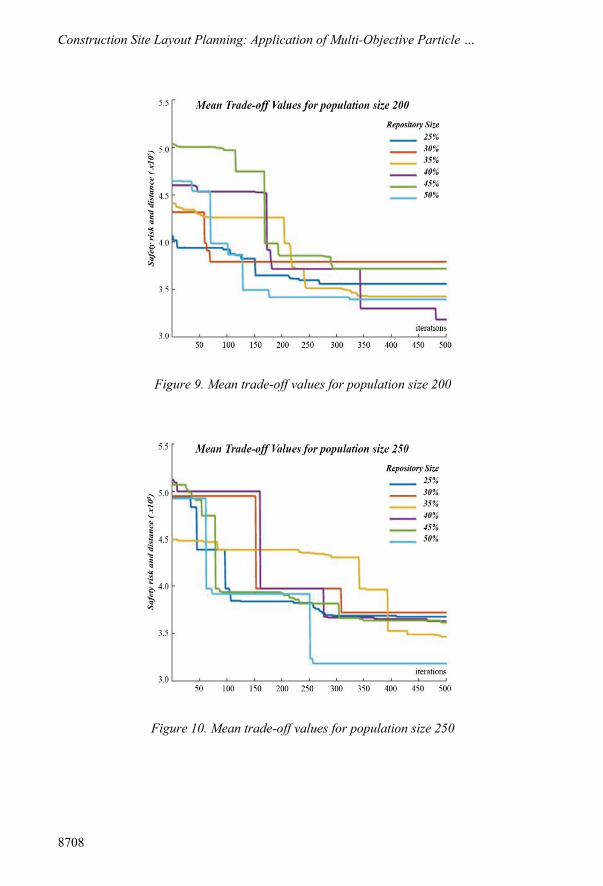
To achieve the best optimization performance, a grid search has been applied for the parameter selection of MOPSO algorithm. The grid is formed by five different population sizes (PSs); 50, 100, 150, 200 and 250, and six different repository sizes (RSs); 25%, 30%, 35%, 40%, 45% and 50%. That allows to build thirty different MOPSO models for CSLP and to select the best performing model. Each model has been run for 500 iterations. One can argue that number of iterations may not necessarily ensure finding the global best solution. However, it should be underlined that there is no strict or clear rule for determining the total number of iterations to get an optimal or near-optimal solution. Not only number of iterations, but many parameters (or algorithm's characteristic components) affect the quality of the final solution. To minimize the effects of MOPSO's random nature, each model has been tested five times, and the reported results are the mean values of these tests.
The graphs of mean trade-off values for five different PSs with six RSs are presented in Fig. 6 to Fig. 10. Figure 6 shows that RS 50% yields the optimum value of 3.5*105 after 250
iterations for PS 50. For PS 100, the optimum value is obtained by RS 45% after around 50 iterations (Fig. 7). The behavior of RS 50% for this population is similar to 45%, but not as good. For PS 150 (Fig. 8), the optimum value is obtained by 40% RS after 400 iterations. RS 50% reaches the same value but after 500 iterations. Meanwhile while Fig. 9 indicates RS 40% that reaches the optimum value before RS 50% for PS 200, Fig. 10 indicates RS 50% that reaches the value of 3.2 *105 after 250 iterations and stays stable for another 250 iterations for PS 250. The detailed analysis of the Figures indicates that the results obtained by RS50% are more stable than the other RSs and the best value among the optimum values obtained by RS 50% is for PS 250. Thus PS250 with RS 50% has been chosen as the best optimization performance and is used for further analysis.
Figure 6. Mean trade-off values for population size 50

Mustafa ORAL, Siamak BAZAATI, Serkan AYDINLI, Emel ORAL
8707
Figure 7. Mean trade-off values for population size 100
Figure 8. Mean trade-off values for population size 150
Construction Site Layout Planning: Application of Multi-Objective Particle …
8708
Figure 9. Mean trade-off values for population size 200
Figure 10. Mean trade-off values for population size 250

Mustafa ORAL, Siamak BAZAATI, Serkan AYDINLI, Emel ORAL
8709
After deciding the MOPSO parameters (i.e., PS 250, RS 50%), the algorithm has been run for 500 iterations, and the final population is obtained. The scatter diagram is drawn according to both objectives (the first objective is the distance, and the second objective is the safety) and given in Fig. 11. Any solution from the Pareto front line, marked with red circles in Fig. 11, can be chosen and implemented as CSLP. For the current case study, the Pareto front line consists of 38 solutions. Solution A, for example, has the minimum total traveling distance among the Pareto set. On the other hand, it has the worst safety objective score. Similarly, solution B has the best safety score; unfortunately, it has the worst distance objective score. Therefore, a decision must be made to select the most satisfactory plan from the Pareto set.
The solution C has been chosen as the most satisfactory plan (visualized form in Fig.12, which is drawn by the model as an output when requested by the user) since it is the “knee point” [25] of Pareto front line. “Knee point” is the solution which satisfies the least distance from the utopia point U and it is determined by using the minimum distance selection method (TMDSM). It should be noted that both objective scores have to be normalized to eliminate the effects of any overpowering magnitudes.
Figure 11. Pareto optimal solutions (Results of the case study)

Construction Site Layout Planning: Application of Multi-Objective Particle …
8710
Figure 12. Optimal site layout plan (Results of the case study)
5. CONCLUSIONS
Current research focused on the multi-objective problem of minimization of both safety risks of crane operated construction sites and total traveling distance between temporary facilities. A model to generate site layout plans that provide optimal trade-offs between these two important objectives while satisfying all related constraints on site was designed.
Earlier studies on CSLP optimization have mostly focused on minimizing the total traveling distance of resources between site facilities, and the evaluation of the quality of the models was generally based on the parameters like the population sizes and the number of generations. Later studies have generally focused on solving CSLP as a multi-objective problem but few included tower crane operations within safety constraints. Even these had limited approach to the problem as they did not include varying degrees of risk magnitudes and probabilities that change according to the dimensions and the location of the tower cranes. Unlike previous studies, safety risk between tower crane and temporary facilities were presented by considering both the risk magnitude and the probability of a possible accident. Risk assessment approaches of construction safety experts were also reflected in the constraints depending on their experiences and management positions. MOPSO was utilized to solve the optimization problem, and a real-life construction project was used as an application example to illustrate its use and its capabilities. The application example with seven permanent buildings, a tower crane and eight temporary facilities to be located was also unique with respect to its size. Grid search method was used to optimize model parameters.They were performed to create the optimal trade-offs between the safety risks and the total distance between facilities as well as to study the efficacy of the diversifying iteration sizes, population sizes, and repository sizes, on the quality of the attained solutions. Results showed that the system is capable of providing a variety of different solutions as well

Mustafa ORAL, Siamak BAZAATI, Serkan AYDINLI, Emel ORAL
8711
as site layout plans that can be practically utilized by construction planners. The system provides a user-friendly environment which allows if required, the user input related to MOPSO settings, project, and expert information.
The limitation of the model is that it produces solutions only for quadrilateral construction sites with one tower crane. Development of a model that covers any site shape with multiple tower cranes is recommended for further research. Developments which include security and environmental requirements as optimization objectives are also recommended.
Acknowledgments
This study was supported by the Scientific Research Project (BAP), Cukurova University, Turkey with Grant no. FDK-2016-6405.
References
[1] Zouein, P. P., Tommelein, N.I.D., Dynamic layout planning using a hybrid incremental solution method. Journal of Construction Engineering and Management, ASCE, 125(6), 400-408, 1999. 6
[2] Hegazy, T ., Elbeltagi, E., EvoSite: Evolution-based model for site layout planning. Journal of Computing in Civil Engineering, ASCE, 13(3), 198-206, 1999. 20
[3] Li, H., Love, P. E. D., Site-level facilities layout using genetic algorithms. Journal of Computing in Civil Engineering. ASCE, 12(4), 227-231, 1998. 4
[4] Neitzel, R.L., Seixas N.S., Ren, K.K., A review of crane safety in the construction industry. Applied Occupational and Environmental Hygiene, 16(12), 1106–1117, 2001. 1
[5] Li, H., Love, P. E. D., Genetic search for solving construction site-level unequal-area facility layout problems. Automation in Construction, 9(2), 217–226, 2000.
[6] Harmanani, H., Zouein, P., Hajar, A., An evolutionary algorithm for solving the geometrically constrained site layout problem. Proceedings of the 8th ASCE Int. Conf. on Comput. Civ. and Build. Eng. (ICCCBE-VIII), August Stanford University, USA, 1442-1449, 2000.
[7] Tawfik, H. M., Fernando, T., A simulation environment for construction site planning. 5th Int. Conf. Information Visualisation, London, UK, July. 2001.
[8] Mawdesley, M. J., Al-Jibouri, S. H., Yang, H., Genetic algorithms for construction site layout in project planning. Journal of Construction Engineering and Management, ASCE, 128 (5), 418-426, 2002.
[9] El-Rayes, K., Khalafallh, A., Trade-off between Safety and Cost in Planning Construction Site Layouts. Journal of Construction Engineering and Management, ASCE, 131(11), 1186-1195, 2005.

Construction Site Layout Planning: Application of Multi-Objective Particle …
8712
[10] Sanad, H. M., Ammar, M. A., Ibrahim, M. E., Optimal construction site layout considering safety and environmental aspects. Journal of Construction Engineering and Management 134 (7), 536–544, 2008.
[11] Zhang, H., Wang, J. Y., Particle swarm optimization for construction site unequal-area layout. Journal of Construction Engineering and Management, 134(9): 739-748, 2008.
[12] Khalafallah, A., El-Rayes, K., Automated multi-objective optimization system for airport site layouts. Automation in Construction, 20(4), 313-320, 2011.
[13] Xu, J., Li, Z., Multi-objective dynamic construction site layout planning in fuzzy random environment. Automation in Construction, 27, 155–169, 2012.
[14] Ning, X, Lam, K.C., Lam M.C.K., Dynamic construction site layout planning using max-min ant system, Automation in Construction, 19, 55-65,2010.
[15] Ning, X ., Lam, K. C., Cost–safety trade-off in unequal-area construction site layout planning. Automation in Construction, 32, 96–103, 2013.
[16] Adrian, A. M., Utamima, A., Wang, K. J., A comparative study of GA, PSO and ACO for solving construction site layout optimization, KSCE Journal of Civil Engineering, 19(3):520-527, 2015.
[17] Yahya, M., Saka, M. P., Construction site layout planning using multi-objective artificial bee colony algorithm with levy flights. Automation in construction, 38, 14-29, 2014.
[18] Zhao, S., Li, Z., Multi-objective Optimization for Construction Site Layout Planning Problem under Fuzzy Random Environment, Computational Sciences and Optimization (CSO), Seventh International Joint Conference, 2014.
[19] Zeng, J., An, M., Smith, N, J., Application of a fuzzy based decision-making methodology to construction project risk assessment. International Journal of Project Management, 25, 589–600, 2007.
[20] Khalafallah, A, M., Optimal construction site layout planning for airport expansion projects. Ph.D. Thesis. Civil Engineering in the Graduate College of the University of Illinois at Urbana-Champaign. 2006.
[21] Bagheli, V., Multiobjective optimization — new formulation and application to radar signal processing, Department of Electronics and Communication National Institute of Technology Rourkela, India 2009.
[22] Brutto,L O.A., Sylvain,G., Thiebot,J., Gualous,H. Comparing Particle Swarm Optimization method and Genetic Algorithm applied to the tidal farm layout optimization problem Conference: IEEE International Conference on Electrical Sciences and Technologies in Maghreb (CISTEM'16), October, 2016.
[23] Chaudhary, D., Dua, R., Application of multiobjective particle swarm optimization to maximize coverage and lifetime of wireless sensor network. International Journal Of Computational Engineering Research, 2(5), 1628-1633, 2012.

Mustafa ORAL, Siamak BAZAATI, Serkan AYDINLI, Emel ORAL
8713
[24] Coello, C., Lechuga, M., MOPSO: A proposal for multiple objective particle swarm optimization. Congress of Evolutionary Computation (CEC’2002), Honolulu, Vol. 1., 1051-1056, 2002.
[25] Hosseini, S.S., Hamidli S.A., Mansri, M., Multi-objective particle swarm optimization (MOPSO) for size and shape optimization of 2D truss structures. Periodica Polytechnica Civil Engineering, 59(1), 9–14, 2014.
[26] Gu, X., Sun, G., Li, G., Li, Q., A comparative study on multiobjective reliable and robust optimization for crashworthiness design of vehicle structure. Struct. Multidisc. Optim., 48, 669-684, 2013.

Construction Site Layout Planning: Application of Multi-Objective Particle …
8714