construction productivity - nziernzier.org.nz/.../nzier_report_to_productivity_partnership.pdf ·...
TRANSCRIPT

Construction productivity An evidence base for research and policy issues
NZIER report to the Building & Construction Sector Productivity Partnership
5 July 2013


L13 Grant Thornton House, 215 Lambton Quay | PO Box 3479, Wellington 6140 Tel +64 4 472 1880 | [email protected]
© NZ Institute of Economic Research (Inc) 2012. Cover image © Dreamstime.com NZIER’s standard terms of engagement for contract research can be found at www.nzier.org.nz.
While NZIER will use all reasonable endeavours in undertaking contract research and producing reports to ensure the
information is as accurate as practicable, the Institute, its contributors, employees, and Board shall not be liable (whether in
contract, tort (including negligence), equity or on any other basis) for any loss or damage sustained by any person relying on
such work whatever the cause of such loss or damage.
About NZIER
NZIER is a specialist consulting firm that uses applied economic research and analysis to provide a wide range of strategic advice to clients in the public and private sectors, throughout New Zealand and Australia, and further afield.
NZIER is also known for its long-established Quarterly Survey of Business Opinion and Quarterly Predictions.
Our aim is to be the premier centre of applied economic research in New Zealand. We pride ourselves on our reputation for independence and delivering quality analysis in the right form, and at the right time, for our clients. We ensure quality through teamwork on individual projects, critical review at internal seminars, and by peer review at various stages through a project by a senior staff member otherwise not involved in the project.
Each year NZIER devotes resources to undertake and make freely available economic research and thinking aimed at promoting a better understanding of New Zealand’s important economic challenges.
NZIER was established in 1958.
Authorship This paper was prepared at NZIER by Shamubeel Eaqub
It was quality approved by John Stephenson
The assistance of Statistics New Zealand, BRANZ and Rider Levett Bucknall is gratefully acknowledged.
NZIER report -Construction productivity i
Key points The Building & Construction Productivity Partnership has asked NZIER for a broad assessment of productivity issues facing the New Zealand construction sector and testable hypotheses for its future work programme. The partnership has an aim to deliver a 20% increase in productivity by 2020.
The analysis is broad and canvasses a range of macroeconomic data, some novel, to look at productivity issues. The key outcomes are a high level assessment of current performance and and a number of hypotheses that require further attention.
Construction sector productivity has grown at half the pace of Australia over recent decades. The widening wedge supports productivity concerns and the Productivity Partnership’s goal to raise productivity.
Some of the key findings of our analysis are:
Not all sub-sectors are the same: Across a number of productivity and competition measures, Construction Services and Heavy & Civil, compare unfavourably to other sub-sectors. The key sectors that stand out negatively are: structural steel erection; painting and decoration; tiling and carpeting; bricklaying carpentry; and plastering and ceiling. House construction performance is middle of the road and non-residential building typically appears at the more favourable end of most performance indicators.
Competition may be an issue: There are signs that competition and conduct may be an issue. Geographically, small and remote regions like Gisborne appear highly concentrated. By sector, Heavy and Civil and Non-residential Building are more concentrated.
Size matters: There is no consistent pattern of productivity differences across firm sizes, but there are large differences in practices related to productivity. For example, small firms tend to use assets inefficiently, perhaps indicating scale inefficiencies. Large firms use their assets more efficiently, but tend to have lazy balance-sheets. The issues and solutions to lift productivity across different firm sizes and sub-sectors may vary.
We build differently: We find typical construction costs are similar across New Zealand and Australia. But our construction sector is structured differently. For example, we use a lot more aggregate (in Civil & Heavy), forest products and architectural services (consistent with industry feedback of more customised homes) and there are much stronger linkages into retail and wholesale. This could mean that there are opportunities to change the building process and industry practices to mimic other more productive countries, or that the policies and processes in New Zealand need to be customised to local conditions.
Costs are not that different: We find little variation in construction costs between New Zealand and Australia. This is in contrast to findings by the Productivity Commission and requires further careful analysis. However, given hourly wages in New Zealand are around 30% lower than in Australia, it is unclear why construction costs are so similar across the two countries and whether this is due to productivity issues with labour or issues of conduct in the supply chain. This requires additional careful analysis.
NZIER report -Construction productivity ii
Labour skills & mobility: Construction sector workers typically earn higher wages than other sectors with similar skills. This could mean low incentive to acquire skills, which may be productivity enhancing. Labour mobility across regions is also relatively low compared to other sectors like retail. This could mean that technological advances in one region are not readily adopted and diffused.
Technology apathy: Survey data hint at apathy over technology, efficiency and change.
There are a number of hypotheses that warrant further investigation. The following hypotheses are ordered as the analysis in the paper, but do not rank in order of the partnership’s priorities.
Hypothesis 1: Construction productivity appears lowest in:
Heavy & Civil - Heavy & Civil needs to be looked at in detail, with land development and road construction likely to perform very differently. When land development fell away sharply so did productivity in the sector.
Construction Services - Construction Services sector is relatively low in productivity in Australia, suggesting it may be a feature of the sub-segment. High incidence of large profit margins in Construction Services, especially in particular trades, means a careful analysis is required.
Hypothesis 2: Management skills are below par with:
Inefficient balance sheet use in Residential Construction, Construction Services and Civil & Heavy.
Sluggish adoption of new technology and resistance to change.
Hypothesis 3: High market concentration inhibits competition and productivity growth, particularly in
Civil & Heavy and Construction Services.
Small regions.
Hypothesis 4: Return on equity in the construction sector is ‘too high’ meaning little incentive to invest in productivity gains.
Hypothesis 5: Long vertically integrated supply chains in the building industry may hide strategic or anti-competitive behaviour.
Hypothesis 6: House construction costs reflect general inflation and specification increases.
Hypothesis 7: Labour quality is a key lever for lifting productivity in the New Zealand construction sector.
Hypothesis 8: Low labour mobility slows diffusion of technology and productivity gains?
NZIER report -Construction productivity iii
Contents 1. Introduction ............................................................................................................ 1
1.1. Framework ................................................................................................... 1
1.2. Defining the sector ...................................................................................... 4
2. Productivity performance ...................................................................................... 5
2.1. Official statistics ........................................................................................... 5
2.2. Australian comparison ................................................................................. 6
2.3. Financial comparison (2011) ........................................................................ 8
2.4. Financial comparison (2007-2011) ............................................................ 11
3. Market structure .................................................................................................. 15
4. Competition & productivity .................................................................................. 20
4.1. Profit margins & incidence of high profitable firms .................................. 20
4.2. Creative destruction and barriers to entry ................................................ 23
4.3. Scale ........................................................................................................... 27
4.4. Pricing ........................................................................................................ 27
5. Labour ................................................................................................................... 34
5.1. Skills ........................................................................................................... 34
5.2. Labour mobility .......................................................................................... 34
6. Technology ........................................................................................................... 39
Figures
Figure 1 Construction sector productivity ................................................................................... 5 Figure 2 Construction labour productivity revisions ................................................................... 6 Figure 3 Construction labour productivity: NZ & Australia ......................................................... 6 Figure 4 Construction return on equity (2005-2011) ................................................................ 12 Figure 5 Construction profit margin (2005-2011) ...................................................................... 13 Figure 6 Construction asset turnover (2005-2011) ................................................................... 13 Figure 7 Construction leverage (2005-2011) ............................................................................. 14 Figure 8 Demand for construction in the economy ................................................................... 15 Figure 9 Industries with a high profit margins (2011) ............................................................... 21 Figure 10 Survival in year 3 from birth at reference year (2002-2009) ..................................... 23 Figure 11 Industry concentration by region (2012) ................................................................... 25 Figure 12 Construction services industry concentration by region (2012) ................................ 26 Figure 13 Average firm size by subsector (2012) ....................................................................... 27 Figure 14 Difference in house build cost: NZ vs OZ ................................................................... 28 Figure 15 Indicative buildings costs by type fo building and region (2012) .............................. 29 Figure 16 In situ material costs in Australia and New Zealand 2012 ......................................... 33 Figure 17 Construction sector wage distribution by qualification (2011) ................................. 35 Figure 18 Distribution of annual income: no formal qualiffication (2011) ................................ 35
NZIER report -Construction productivity iv
Figure 19 Distribution of annual income: no formal qualiffication but has undertaken training
(2011) ........................................................................................................................................ 36 Figure 20 Distribution of annual income: secondary school qualiffication (2011) .................... 36 Figure 21 Distribution of annual income: tertiary education qualiffication (2011) ................... 37 Figure 22 Wage inflation and labour turnover by region (2011) ............................................... 37 Figure 23 Movement of construction sector employees (2001-2011, March years) ................ 38 Figure 24 Degree of change in technology (2012) ..................................................................... 39 Figure 25 ICT outcome (2012) ................................................................................................... 40
Tables
Table 1 Labour productivity: NZ & Australia (2011) .................................................................... 7 Table 2 Construction sector financial performance by firm size (2011) ...................................... 9 Table 3 Financial indicators for the construction sector (2011) ................................................ 10 Table 4 Financial indicators (2007-2011 average)
1 .................................................................... 12
Table 5 Final demand for construction (NZIER 2012 IO estimate) ............................................ 16 Table 6 construction sector international comparison ............................................................. 16 Table 7 Components of value added in Construction: New Zealand (2007) & Australia (2009)
................................................................................................................................................... 17 Table 8 Suppliers to construction: NZ ratio to Australia ............................................................ 19 Table 9 Distribution of profit margins ....................................................................................... 22 Table 10 Model home prices: NZ & Australia ............................................................................ 30 Table 11 Estimated drivers of house cost change (2002 to 2011) ............................................. 31 Table 12 Non-residential building construction cost (Jan 2013) ............................................... 32
NZIER report -Construction productivity 1
1. Introduction The Building and Construction Productivity Partnership (BCPP) has asked NZIER to look at macroeconomic data to provide a snapshot of productivity issues for the sector from a top-down perspective, to complement its own bottom-up investigation.
Motivation for the work is based on the BCPP’s aim to lift New Zealand’s construction sector productivity by 20% by 2020. This is an ambitious goal, as there has been very little productivity growth in recent decades.
1.1. Framework We organise the paper as a collection of data, analysed for insights into the construction sector and hypotheses for more detailed work. The scope of this work is meant to be broad, rather than deep. We selected a wide range of novel datasets to ask typical productivity related questions in a different angle and light. The selection of data and their analysis is motivated by economic frameworks of economic growth and their drivers.
1.1.1. Measures of productivity
In our analysis we take a few liberties with statistical standards in order to test the limits of the data.
The basic tenet of productivity is making more with less. This has clear financial outcomes for the business, through greater profitability. There are also wider economic benefits, as inputs not used in creating this output can now be used for something else.
The measurement of productivity is challenging. The official measures are produced by Statistics New Zealand and are the best available. They adhere to international best practice standards and use a wide range of economic data that is collated and analysed by professional statisticians.
The output side of productivity measurement is generally straight forward. Typically output is measured as value added (total output less intermediate inputs) and can be proxied by the sum of returns to labour (compensation of employees) and returns to capital (profit).
Challenges in measuring productivity arise from constructing standardised measures of the value of primary factors of production: labour, capital and technology. Data on number of employees and wages paid are generally reliable but data on labour quality, capital and technology are not. As a result quite a bit of our analysis looks at unadjusted measures of labour productivity (value added per employee) for general insights.
The benefit of this short cut is that we can dig into sub-sector data and analyse differences between firm performance without recourse to the sorts of time consuming and costly analyses needed to produce ‘ideal’ productivity measures.
NZIER report -Construction productivity 2
Published productivity data do not provide sufficient detail to understand the causes and consequences of productivity performance within the construction sector. Construction productivity estimates are for the entire sector at the national level.
In our search we hypothesise that there may be issues in a sub-sector (say carpentry) or that there are regional variations (for example small and remote regions may have low productivity). As a result we consider a range of data to look at symptoms of productivity, even though the official measures are the most comprehensive and reliable.
1.1.2. Caveats on combining disparate data
To analyse the data and shed light on the issues, we have purchased a large number customised data sets from Statistics New Zealand to ask the questions from a number of different angles. This gives us some surprising results, suggesting new research and policy questions.
An important caveat with disparate data sources is that they are not always directly comparable. Rather than judging this as a weakness, we view it as a strength. Inherent biases in data mean that a portfolio approach to analysis is helpful.
Regardless of their rigour official statistics can cause confusion due to changes in standards or classifications. For example, revisions to productivity statistics following the adoption of new industrial classification1 lead to some aspects of construction to be counted in the construction sector, which were previously counted in government investment or in property services. As a result, construction sector productivity estimates were revised from showing a slump in recent years, to flat performance.
1.1.3. Drivers and diagnoses of productivity performance
We look at the macro economic data to identify if there are areas of the sector where productivity is low and what their drivers may be. We raise a number of hypotheses from our analysis that require further careful and detailed analysis.
Components of productivity performance
Productivity can be decomposed into its proximate components or into its fundamental drivers. The proximate components are technical change, technical efficiency, scale efficiency, and allocative efficiency. There is a rich literature on productivity decomposition.2 In our analysis we dig into these components by analysing:
overall productivity patterns
attitudes to technology
capital utilisation and profitability measures.
1 To ANZSIC06
2 For example, refer to Ma, Liu & Oxley (2012) Productivity growth and policy implications for China’s dairy farms. China Economic Policy Review.
NZIER report -Construction productivity 3
As we do not have perfect measures of these we make use of cross-country comparisons, principally with respect to Australia, but also among sub-sectors and regions within New Zealand.
Competition effects
The literature and empirical evidence on drivers of productivity growth is rich but full of observations that are context dependent.3 As a rule of thumb, there is a causal relationship between competition and firm level productivity. This is because competition leads to reallocation of resources from lower to higher productivity firms. Competition can, however, lead to contrasting outcomes:
Intense competition can reduce profits for innovators and reduce the incentive to innovate (that is, innovations are less durable, so the incentive to innovate is low).
High competition can increase the incentive to continuously innovate to stay ahead of the pack and escape the competition (that is, lower monopoly rents, but the returns from escaping the competition is high enough and is an incentive to continuously innovate).
Irrespective of the impacts, it is also difficult to identify precisely how competitive an industry is. The existence of highly profitable firms can be an indicator of limited competitive pressure but can also reflect high performance. Similarly, highly concentrated market structure, with few firms in the market, may reflect strategic behaviour limiting competition but it may also reflect natural economies of scale in capital intensive industries.
In our analysis we consider both profitability and measures of market concentration (regionally and nationally) to understand whether competitive pressure might be an important driver of productivity in the construction sector.
Scale effects
Scale effects are likely to be important in the construction sector, at least for parts of the sector. This could limit the number of firms in the sector and possibly limit productivity gains but may also be an efficient way for the market to organise itself. To try understand whether this is the case this, wherever possible we decompose our analysis by firm size, sub-sector and region.
External effects
Productivity performance can often be explained by external or unavoidable influences (from the firm perspective) such as distance to market, policy and regulation or poorly functioning upstream and downstream markets. Furthermore, when benchmarking productivity performance across countries it is important to take account of the different demands and desires of customers which can affect the cost of production at home or abroad.
To understand these effects we focus on picking apart some of the key drivers of cost escalation in the sector and compare these to similar measures for Australia. We also
3 Refer to the following for a helpful literature review: Ospina & Schiffbauer (2010) Competition and firm productivity. IMF
Working Paper (WP/10/67)
NZIER report -Construction productivity 4
refer to a case study of a model house to quantify the effects that regulatory and technical standards have on input costs.
This analysis is broken down by sub-sector wherever possible to reflect the considerable variation between construction tasks and products.
1.2. Defining the sector Construction productivity for the purpose of this analysis is defined as below:
Building construction
House Construction
Other Residential Building Construction
Non-Residential Building Construction
Civil & heavy
Road and Bridge Construction
Other Heavy and Civil Engineering Construction
Construction services
Land Development and Subdivision
Site Preparation Services
Concreting Services
Bricklaying Services
Roofing Services
Structural Steel Erection Services
Plumbing Services
Electrical Services
Air Conditioning and Heating Services
Fire and Security Alarm Installation Services
Other Building Installation Services
Plastering and Ceiling Services
Carpentry Services
Tiling and Carpeting Services
Painting and Decorating Services
Glazing Services
Landscape Construction Services
Hire of Construction Machinery with Operator
Other Construction Services n.e.c.
Our analysis of the construction sector does not include suppliers and users of construction sector services, such as architects, wholesalers and retailers.
NZIER report -Construction productivity 5
2. Productivity performance
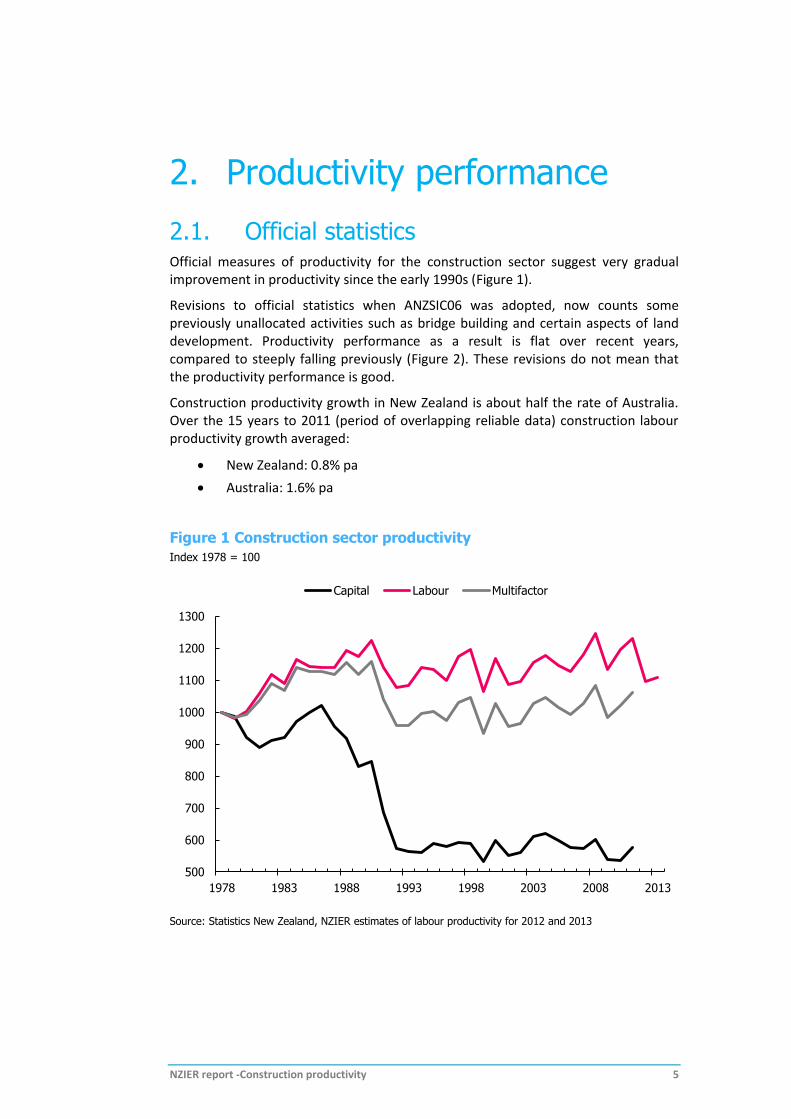
2.1. Official statistics Official measures of productivity for the construction sector suggest very gradual improvement in productivity since the early 1990s (Figure 1).
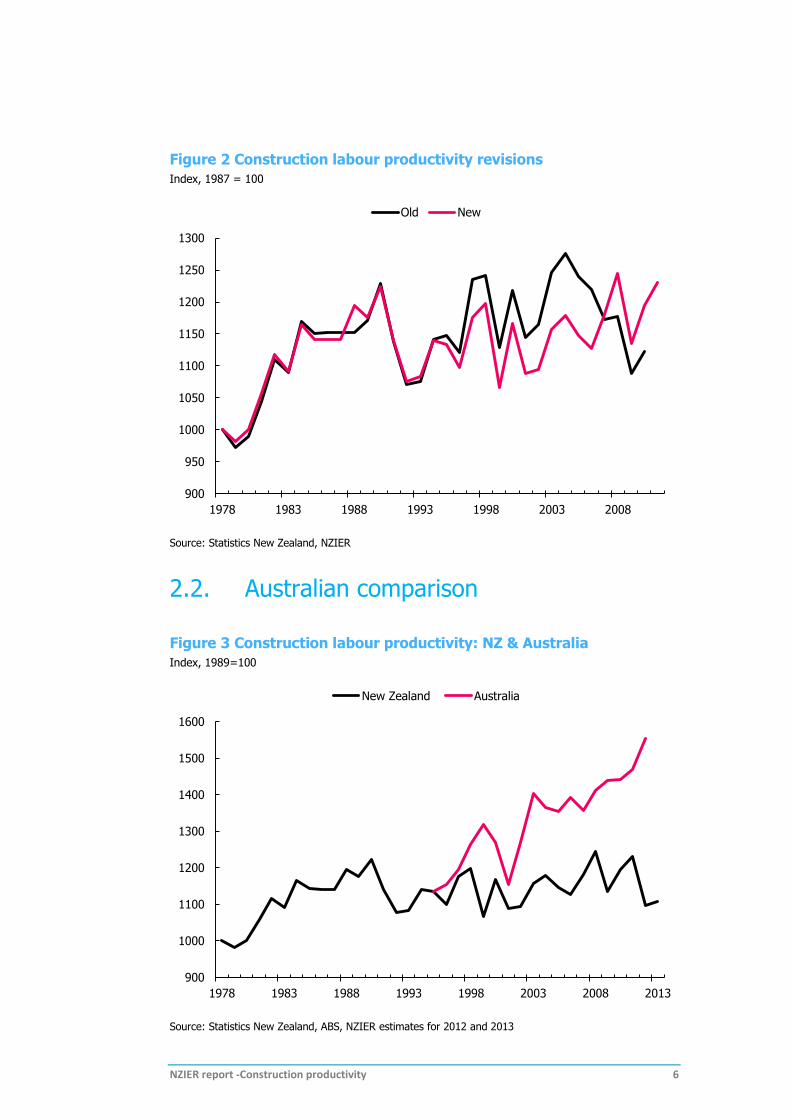
Revisions to official statistics when ANZSIC06 was adopted, now counts some previously unallocated activities such as bridge building and certain aspects of land development. Productivity performance as a result is flat over recent years, compared to steeply falling previously (Figure 2). These revisions do not mean that the productivity performance is good.
Construction productivity growth in New Zealand is about half the rate of Australia. Over the 15 years to 2011 (period of overlapping reliable data) construction labour productivity growth averaged:
New Zealand: 0.8% pa
Australia: 1.6% pa
Figure 1 Construction sector productivity
Index 1978 = 100
Source: Statistics New Zealand, NZIER estimates of labour productivity for 2012 and 2013
500
600
700
800
900
1000
1100
1200
1300
1978 1983 1988 1993 1998 2003 2008 2013
Capital Labour Multifactor
NZIER report -Construction productivity 6
Figure 2 Construction labour productivity revisions
Index, 1987 = 100
Source: Statistics New Zealand, NZIER
2.2. Australian comparison
Figure 3 Construction labour productivity: NZ & Australia
Index, 1989=100
Source: Statistics New Zealand, ABS, NZIER estimates for 2012 and 2013
900
950
1000
1050
1100
1150
1200
1250
1300
1978 1983 1988 1993 1998 2003 2008
Old New
900
1000
1100
1200
1300
1400
1500
1600
1978 1983 1988 1993 1998 2003 2008 2013
New Zealand Australia
NZIER report -Construction productivity 7
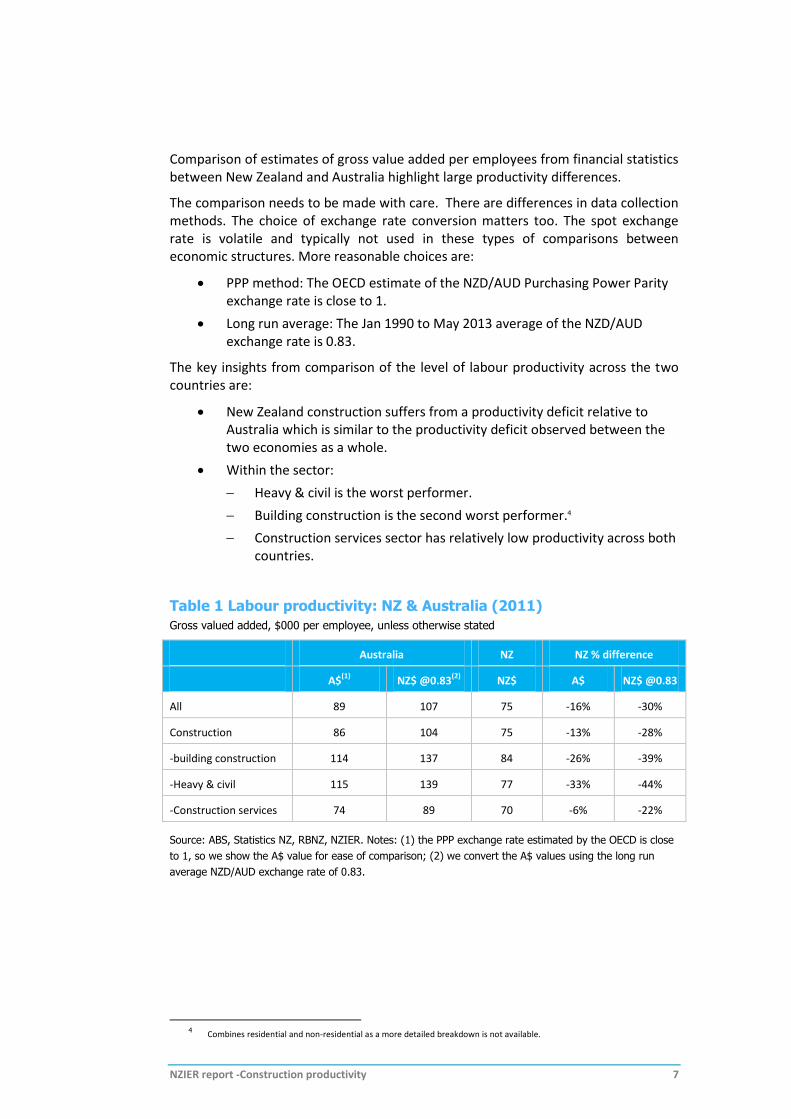
Comparison of estimates of gross value added per employees from financial statistics between New Zealand and Australia highlight large productivity differences.
The comparison needs to be made with care. There are differences in data collection methods. The choice of exchange rate conversion matters too. The spot exchange rate is volatile and typically not used in these types of comparisons between economic structures. More reasonable choices are:
PPP method: The OECD estimate of the NZD/AUD Purchasing Power Parity exchange rate is close to 1.
Long run average: The Jan 1990 to May 2013 average of the NZD/AUD exchange rate is 0.83.
The key insights from comparison of the level of labour productivity across the two countries are:
New Zealand construction suffers from a productivity deficit relative to Australia which is similar to the productivity deficit observed between the two economies as a whole.
Within the sector:
Heavy & civil is the worst performer.
Building construction is the second worst performer.4
Construction services sector has relatively low productivity across both countries.
Table 1 Labour productivity: NZ & Australia (2011)
Gross valued added, $000 per employee, unless otherwise stated
Australia NZ NZ % difference
A$(1)
NZ$ @0.83(2)
NZ$ A$ NZ$ @0.83
All 89 107 75 -16% -30%
Construction 86 104 75 -13% -28%
-building construction 114 137 84 -26% -39%
-Heavy & civil 115 139 77 -33% -44%
-Construction services 74 89 70 -6% -22%
Source: ABS, Statistics NZ, RBNZ, NZIER. Notes: (1) the PPP exchange rate estimated by the OECD is close
to 1, so we show the A$ value for ease of comparison; (2) we convert the A$ values using the long run
average NZD/AUD exchange rate of 0.83.
4 Combines residential and non-residential as a more detailed breakdown is not available.
NZIER report -Construction productivity 8
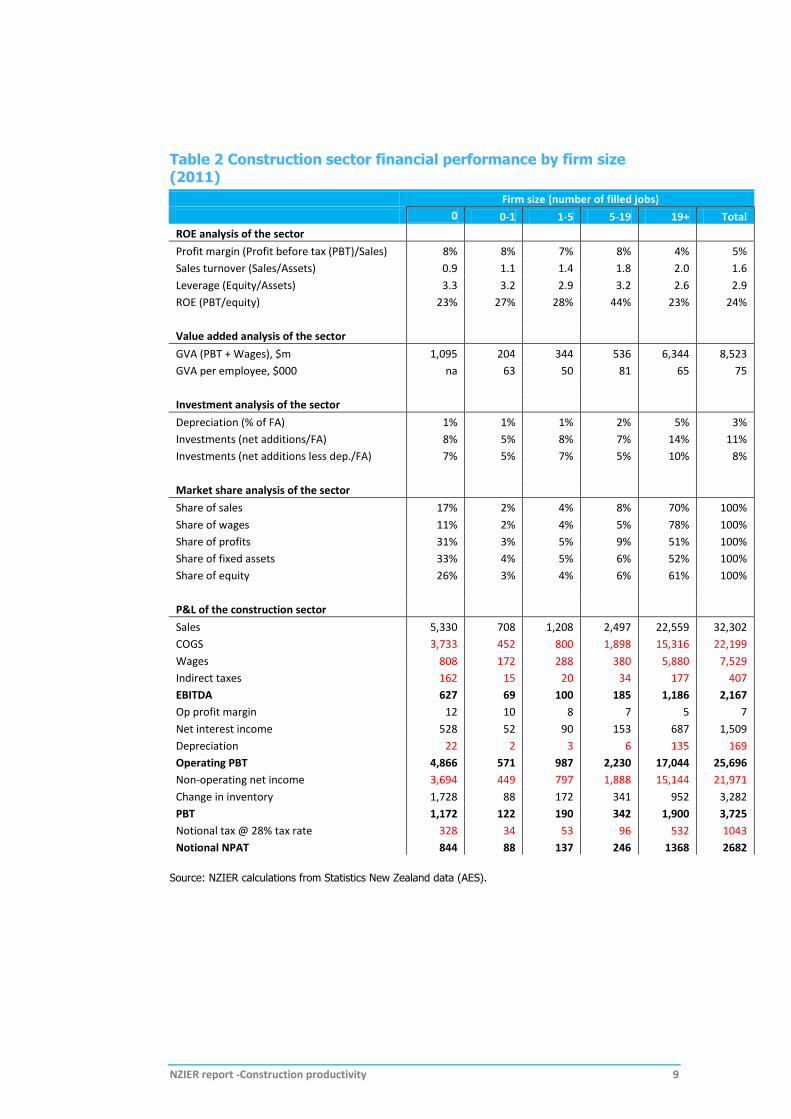
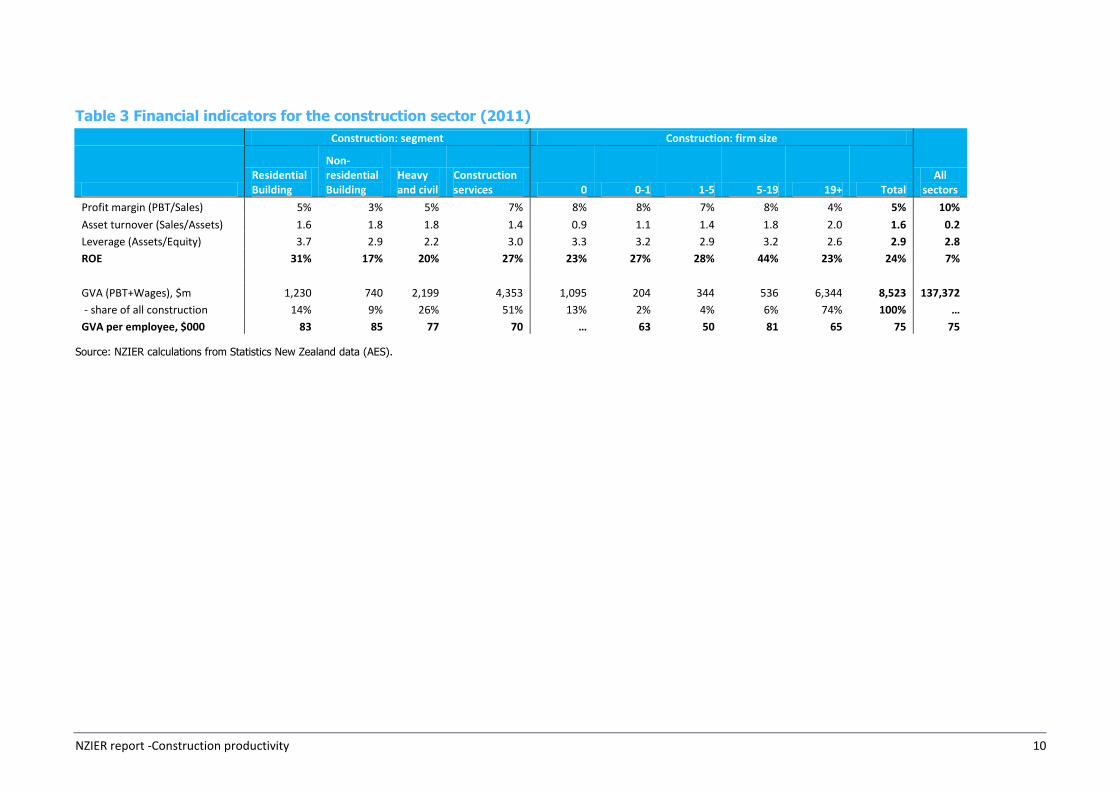
2.3. Financial comparison (2011) To understand productivity performance across different sub-sectors we analysed financial data from the Annual Enterprise Survey data. We use a proxy of value added, defined as profit before tax plus wages and salaries, to mimic returns to capital and labour and benchmark value added against number of workers as a proxy for labour productivity.5
The financial data highlight (Table 2 & Table 3):
Output per worker in the construction sector is about the same as the whole economy as measured at around $75,000 per employee in 2011.
Output per worker is lowest in two sectors:
Heavy & Civil
Construction Services.
The industry is dominated by very small (owner operator) and large firms (19+ employees), but few medium sized firms.
There is no clear correlation between our measure of productivity and firm size
Firm size does appear to be related to other performance measures:
Large firms have lower profit margins, but use their assets more efficiently, invest more and have less leverage
Small firms use assets inefficiently (large stock of fixed assets, but relatively small amount of sales), invest less, but use more leverage.
5 These are not perfect measures and are not directly comparable to National Accounts measures. One specific difficulty is
measurement of owner operators.
NZIER report -Construction productivity 9
Table 2 Construction sector financial performance by firm size (2011)
Firm size (number of filled jobs)
0 0-1 1-5 5-19 19+ Total
ROE analysis of the sector
Profit margin (Profit before tax (PBT)/Sales) 8% 8% 7% 8% 4% 5%
Sales turnover (Sales/Assets) 0.9 1.1 1.4 1.8 2.0 1.6
Leverage (Equity/Assets) 3.3 3.2 2.9 3.2 2.6 2.9
ROE (PBT/equity) 23% 27% 28% 44% 23% 24%
Value added analysis of the sector
GVA (PBT + Wages), $m 1,095 204 344 536 6,344 8,523
GVA per employee, $000 na 63 50 81 65 75
Investment analysis of the sector
Depreciation (% of FA) 1% 1% 1% 2% 5% 3%
Investments (net additions/FA) 8% 5% 8% 7% 14% 11%
Investments (net additions less dep./FA) 7% 5% 7% 5% 10% 8%
Market share analysis of the sector
Share of sales 17% 2% 4% 8% 70% 100%
Share of wages 11% 2% 4% 5% 78% 100%
Share of profits 31% 3% 5% 9% 51% 100%
Share of fixed assets 33% 4% 5% 6% 52% 100%
Share of equity 26% 3% 4% 6% 61% 100%
P&L of the construction sector
Sales 5,330 708 1,208 2,497 22,559 32,302
COGS 3,733 452 800 1,898 15,316 22,199
Wages 808 172 288 380 5,880 7,529
Indirect taxes 162 15 20 34 177 407
EBITDA 627 69 100 185 1,186 2,167
Op profit margin 12 10 8 7 5 7
Net interest income 528 52 90 153 687 1,509
Depreciation 22 2 3 6 135 169
Operating PBT 4,866 571 987 2,230 17,044 25,696
Non-operating net income 3,694 449 797 1,888 15,144 21,971
Change in inventory 1,728 88 172 341 952 3,282
PBT 1,172 122 190 342 1,900 3,725
Notional tax @ 28% tax rate 328 34 53 96 532 1043
Notional NPAT 844 88 137 246 1368 2682
Source: NZIER calculations from Statistics New Zealand data (AES).
NZIER report -Construction productivity 10
Table 3 Financial indicators for the construction sector (2011)
Construction: segment Construction: firm size
All sectors
Residential Building
Non-residential Building
Heavy and civil
Construction services 0 0-1 1-5 5-19 19+ Total
Profit margin (PBT/Sales) 5% 3% 5% 7% 8% 8% 7% 8% 4% 5% 10%
Asset turnover (Sales/Assets) 1.6 1.8 1.8 1.4 0.9 1.1 1.4 1.8 2.0 1.6 0.2
Leverage (Assets/Equity) 3.7 2.9 2.2 3.0 3.3 3.2 2.9 3.2 2.6 2.9 2.8
ROE 31% 17% 20% 27% 23% 27% 28% 44% 23% 24% 7%
GVA (PBT+Wages), $m 1,230 740 2,199 4,353 1,095 204 344 536 6,344 8,523 137,372
- share of all construction 14% 9% 26% 51% 13% 2% 4% 6% 74% 100% …
GVA per employee, $000 83 85 77 70 … 63 50 81 65 75 75
Source: NZIER calculations from Statistics New Zealand data (AES).
NZIER report -Construction productivity 11
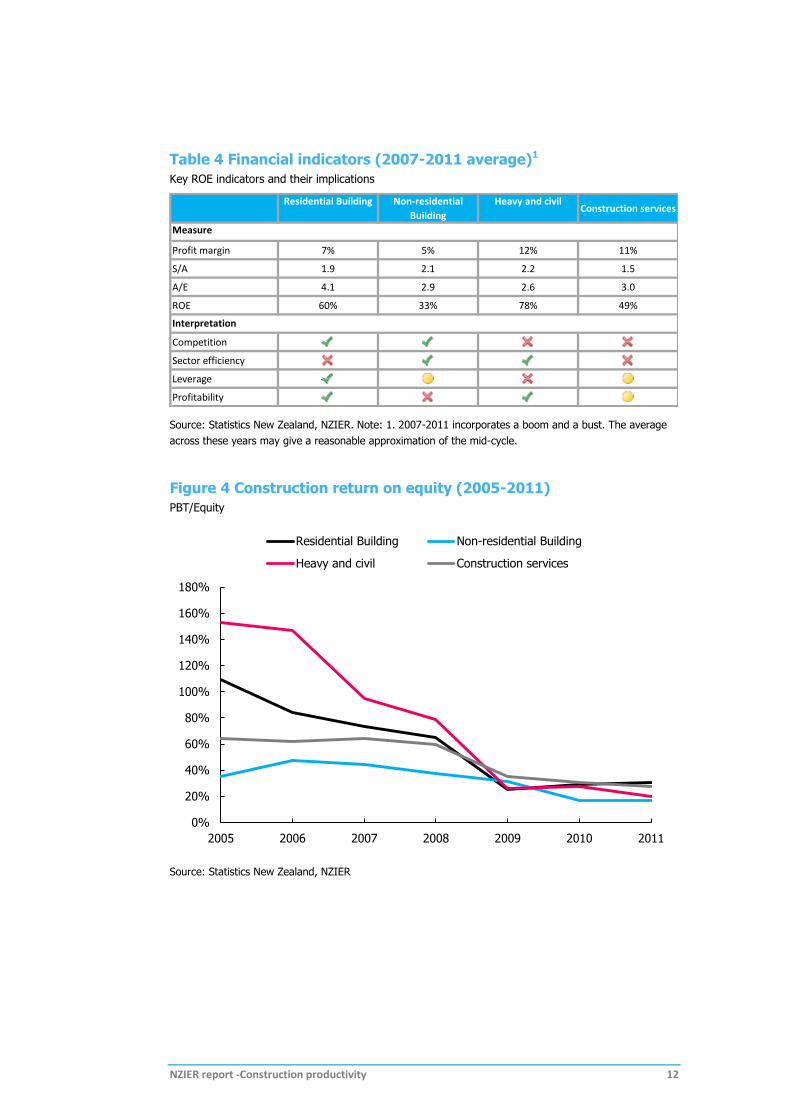
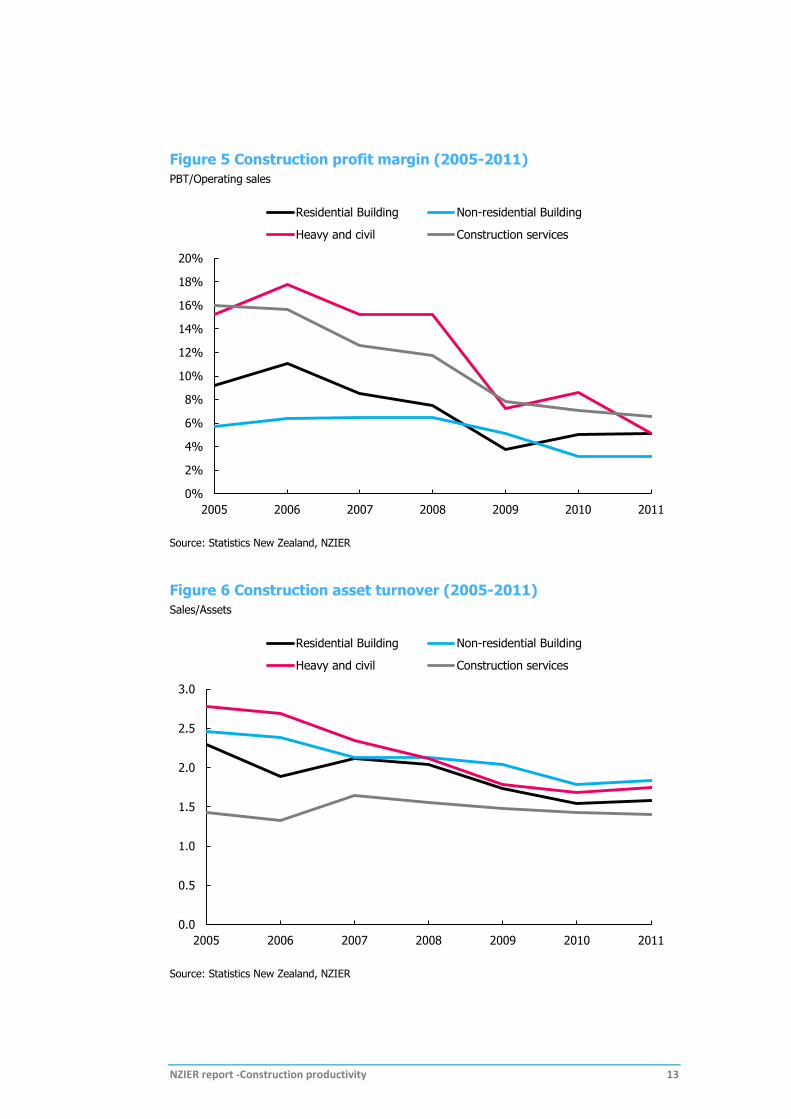
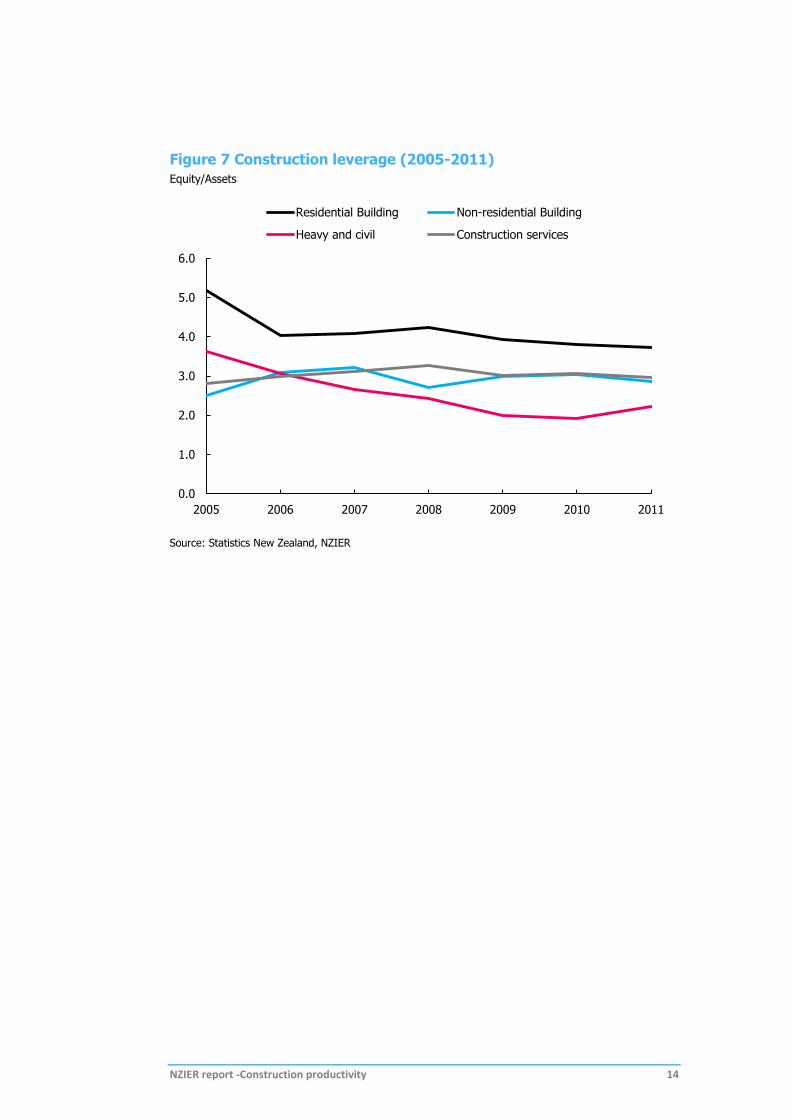
2.4. Financial comparison (2007-2011) To move beyond descriptive performance measures we look at the sector’s financial performance over time using a simple DuPont disaggregation. The measured profitability ratio is Return on Equity (ROE), which most firms seek to maximise. This can be decomposed into three components:
Profit margin (PBT/sales): which rises and falls with the economic cycle (pro-cyclical) and can indicate ability to raise prices in response to cost pressures.
Asset turnover (sales/assets): which measures efficiency of asset use with higher turnover indicating more efficient use of capital.
Leverage (assets/equity): which measures the use of leverage to boost profits. Higher leverage can be symptomatic of easier access to credit and also speculative/risky behaviour.
These metrics provide high-level insights into market conduct and structure issues as well as overall performance.The analysis highlights a number of key issues (Table 4, Figure 4, Figure 5, Figure 6 & Figure 7):
High profit margins in Heavy & Civil and Construction Services are suggestive of limited competitive pressure in these sub-sectors. ROE is also very high across the sector as a whole (24% compared to 7% for all industries), which may indicate little pressure to invest in productivity gains.
Low asset turnover in Residential Construction and Construction Services indicates inefficiency and below par professional management skills because they are not ‘sweating’ the assets enough.
High leverage in Residential Construction which may make these firms less resilient to shocks and less able to invest in new technologies and processes.
Low leverage in the Civil & Heavy sector indicates scope for improvement or a lazy balance sheet and potentially below par professional management skills.
NZIER report -Construction productivity 12
Table 4 Financial indicators (2007-2011 average)1
Key ROE indicators and their implications
Source: Statistics New Zealand, NZIER. Note: 1. 2007-2011 incorporates a boom and a bust. The average
across these years may give a reasonable approximation of the mid-cycle.
Figure 4 Construction return on equity (2005-2011)
PBT/Equity
Source: Statistics New Zealand, NZIER
Residential Building Non-residential
Building
Heavy and civilConstruction services
Profit margin 7% 5% 12% 11%
S/A 1.9 2.1 2.2 1.5
A/E 4.1 2.9 2.6 3.0
ROE 60% 33% 78% 49%
Competition
Sector efficiency
Leverage
Profitability
Interpretation
Measure
0%
20%
40%
60%
80%
100%
120%
140%
160%
180%
2005 2006 2007 2008 2009 2010 2011
Residential Building Non-residential Building
Heavy and civil Construction services
NZIER report -Construction productivity 13
Figure 5 Construction profit margin (2005-2011)
PBT/Operating sales
Source: Statistics New Zealand, NZIER
Figure 6 Construction asset turnover (2005-2011)
Sales/Assets
Source: Statistics New Zealand, NZIER
0%
2%
4%
6%
8%
10%
12%
14%
16%
18%
20%
2005 2006 2007 2008 2009 2010 2011
Residential Building Non-residential Building
Heavy and civil Construction services
0.0
0.5
1.0
1.5
2.0
2.5
3.0
2005 2006 2007 2008 2009 2010 2011
Residential Building Non-residential Building
Heavy and civil Construction services
NZIER report -Construction productivity 14
Figure 7 Construction leverage (2005-2011)
Equity/Assets
Source: Statistics New Zealand, NZIER
0.0
1.0
2.0
3.0
4.0
5.0
6.0
2005 2006 2007 2008 2009 2010 2011
Residential Building Non-residential Building
Heavy and civil Construction services
NZIER report -Construction productivity 15
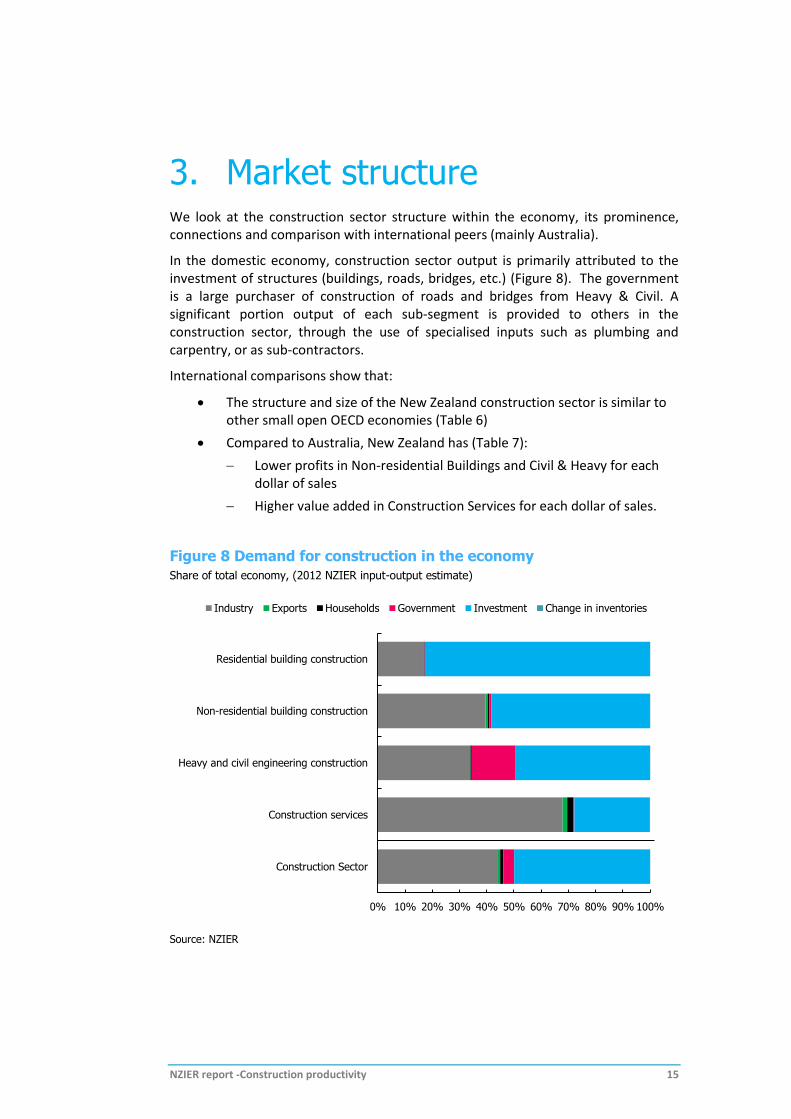
3. Market structure We look at the construction sector structure within the economy, its prominence, connections and comparison with international peers (mainly Australia).
In the domestic economy, construction sector output is primarily attributed to the investment of structures (buildings, roads, bridges, etc.) (Figure 8). The government is a large purchaser of construction of roads and bridges from Heavy & Civil. A significant portion output of each sub-segment is provided to others in the construction sector, through the use of specialised inputs such as plumbing and carpentry, or as sub-contractors.
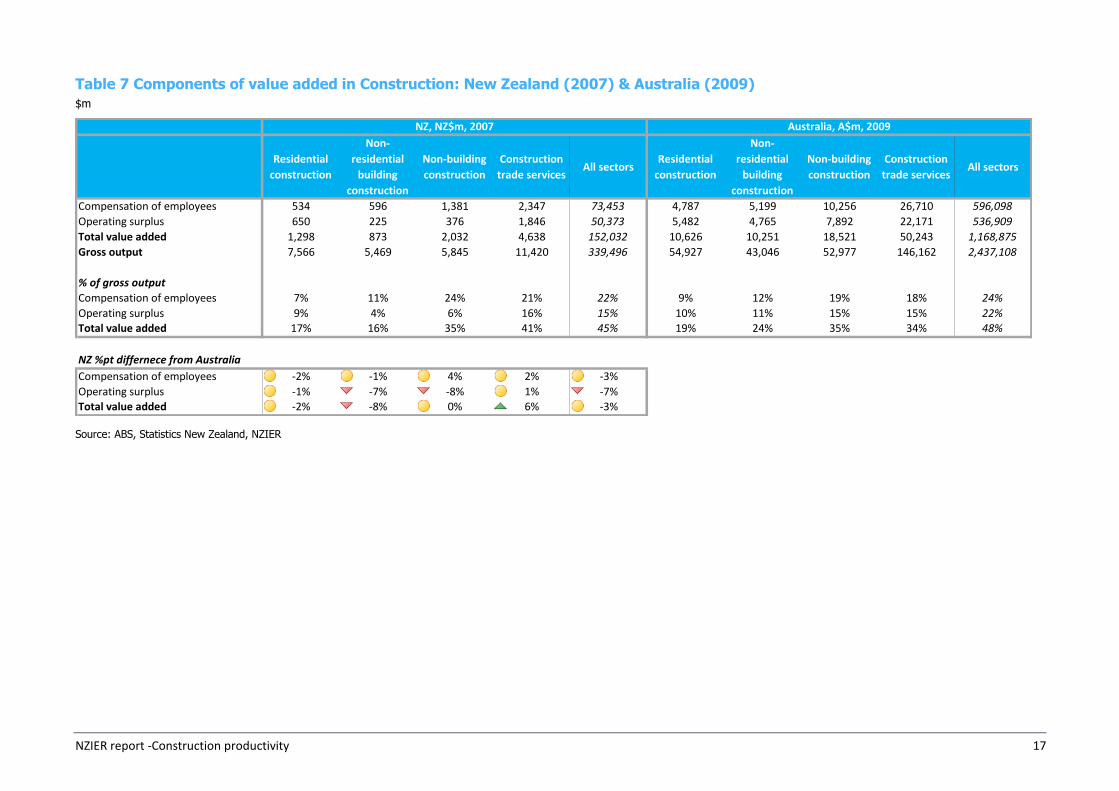
International comparisons show that:
The structure and size of the New Zealand construction sector is similar to other small open OECD economies (Table 6)
Compared to Australia, New Zealand has (Table 7):
Lower profits in Non-residential Buildings and Civil & Heavy for each dollar of sales
Higher value added in Construction Services for each dollar of sales.
Figure 8 Demand for construction in the economy
Share of total economy, (2012 NZIER input-output estimate)
Source: NZIER
0% 10% 20% 30% 40% 50% 60% 70% 80% 90% 100%
Residential building construction
Non-residential building construction
Heavy and civil engineering construction
Construction services
Construction Sector
Industry Exports Households Government Investment Change in inventories
NZIER report -Construction productivity 16
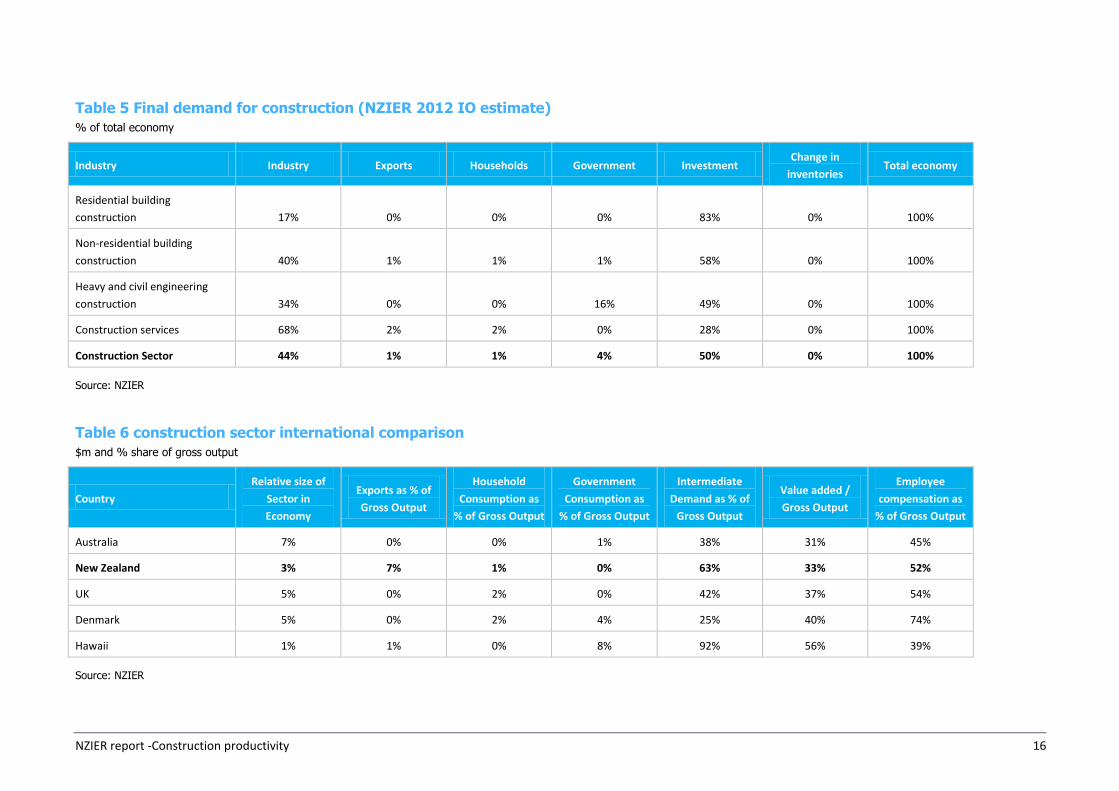
Table 5 Final demand for construction (NZIER 2012 IO estimate)
% of total economy
Industry Industry Exports Households Government Investment Change in
inventories Total economy
Residential building
construction 17% 0% 0% 0% 83% 0% 100%
Non-residential building
construction 40% 1% 1% 1% 58% 0% 100%
Heavy and civil engineering
construction 34% 0% 0% 16% 49% 0% 100%
Construction services 68% 2% 2% 0% 28% 0% 100%
Construction Sector 44% 1% 1% 4% 50% 0% 100%
Source: NZIER
Table 6 construction sector international comparison
$m and % share of gross output
Country
Relative size of
Sector in
Economy
Exports as % of
Gross Output
Household
Consumption as
% of Gross Output
Government
Consumption as
% of Gross Output
Intermediate
Demand as % of
Gross Output
Value added /
Gross Output
Employee
compensation as
% of Gross Output
Australia 7% 0% 0% 1% 38% 31% 45%
New Zealand 3% 7% 1% 0% 63% 33% 52%
UK 5% 0% 2% 0% 42% 37% 54%
Denmark 5% 0% 2% 4% 25% 40% 74%
Hawaii 1% 1% 0% 8% 92% 56% 39%
Source: NZIER
NZIER report -Construction productivity 17
Table 7 Components of value added in Construction: New Zealand (2007) & Australia (2009)
$m
Source: ABS, Statistics New Zealand, NZIER
Residential
construction
Non-
residential
building
construction
Non-building
construction
Construction
trade servicesAll sectors
Residential
construction
Non-
residential
building
construction
Non-building
construction
Construction
trade servicesAll sectors
Compensation of employees 534 596 1,381 2,347 73,453 4,787 5,199 10,256 26,710 596,098
Operating surplus 650 225 376 1,846 50,373 5,482 4,765 7,892 22,171 536,909
Total value added 1,298 873 2,032 4,638 152,032 10,626 10,251 18,521 50,243 1,168,875
Gross output 7,566 5,469 5,845 11,420 339,496 54,927 43,046 52,977 146,162 2,437,108
% of gross output
Compensation of employees 7% 11% 24% 21% 22% 9% 12% 19% 18% 24%
Operating surplus 9% 4% 6% 16% 15% 10% 11% 15% 15% 22%
Total value added 17% 16% 35% 41% 45% 19% 24% 35% 34% 48%
NZ %pt differnece from Australia
Compensation of employees -2% -1% 4% 2% -3%
Operating surplus -1% -7% -8% 1% -7%
Total value added -2% -8% 0% 6% -3%
NZ, NZ$m, 2007 Australia, A$m, 2009
NZIER report -Construction productivity 18
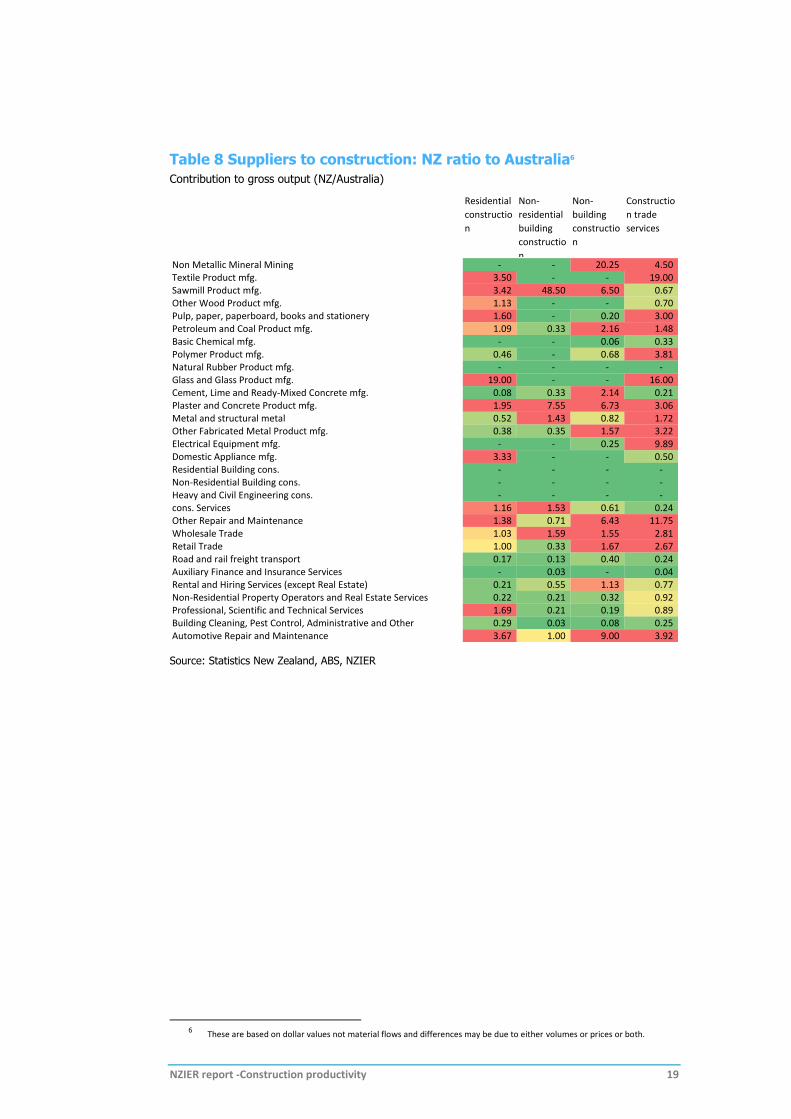
The New Zealand construction sector is structured differently from Australia’s in a number of key ways:
Aggregates is a larger input into Civil & Heavy and Construction Services
Much greater use of forest products, in Residential and Non-residential buildings
Much greater use of architectural and related services for Residential Building in New Zealand
Glass is a larger input in New Zealand (possible due to double glazing rules)
Plaster, concrete and cement are larger inputs in New Zealand
Much stronger reliance on wholesale and retail trade (it may present an opportunity for rent seeking in other parts of the supply chain)
There are some obvious differences between New Zealand and Australia. In particular for the Civil & Heavy sector, which is dominated by mining sector projects in Australia. Also, weather differences can account for differences in preferences and work disruptions. Cross country comparisons need to be made carefully and in this case it illustrates that there may be particular areas of focus, but they may be simply a result of composition or external factors.
NZIER report -Construction productivity 19
Table 8 Suppliers to construction: NZ ratio to Australia6
Contribution to gross output (NZ/Australia)
Source: Statistics New Zealand, ABS, NZIER
6 These are based on dollar values not material flows and differences may be due to either volumes or prices or both.
Residential
constructio
n
Non-
residential
building
constructio
n
Non-
building
constructio
n
Constructio
n trade
services
Non Metallic Mineral Mining - - 20.25 4.50 Textile Product mfg. 3.50 - - 19.00 Sawmill Product mfg. 3.42 48.50 6.50 0.67 Other Wood Product mfg. 1.13 - - 0.70 Pulp, paper, paperboard, books and stationery 1.60 - 0.20 3.00 Petroleum and Coal Product mfg. 1.09 0.33 2.16 1.48 Basic Chemical mfg. - - 0.06 0.33 Polymer Product mfg. 0.46 - 0.68 3.81 Natural Rubber Product mfg. - - - - Glass and Glass Product mfg. 19.00 - - 16.00 Cement, Lime and Ready-Mixed Concrete mfg. 0.08 0.33 2.14 0.21 Plaster and Concrete Product mfg. 1.95 7.55 6.73 3.06 Metal and structural metal 0.52 1.43 0.82 1.72 Other Fabricated Metal Product mfg. 0.38 0.35 1.57 3.22 Electrical Equipment mfg. - - 0.25 9.89 Domestic Appliance mfg. 3.33 - - 0.50 Residential Building cons. - - - - Non-Residential Building cons. - - - - Heavy and Civil Engineering cons. - - - - cons. Services 1.16 1.53 0.61 0.24 Other Repair and Maintenance 1.38 0.71 6.43 11.75 Wholesale Trade 1.03 1.59 1.55 2.81 Retail Trade 1.00 0.33 1.67 2.67 Road and rail freight transport 0.17 0.13 0.40 0.24 Auxiliary Finance and Insurance Services - 0.03 - 0.04 Rental and Hiring Services (except Real Estate) 0.21 0.55 1.13 0.77 Non-Residential Property Operators and Real Estate Services 0.22 0.21 0.32 0.92 Professional, Scientific and Technical Services 1.69 0.21 0.19 0.89 Building Cleaning, Pest Control, Administrative and Other 0.29 0.03 0.08 0.25 Automotive Repair and Maintenance 3.67 1.00 9.00 3.92
NZIER report -Construction productivity 20
4. Competition & productivity
4.1. Profit margins & incidence of high profitable firms
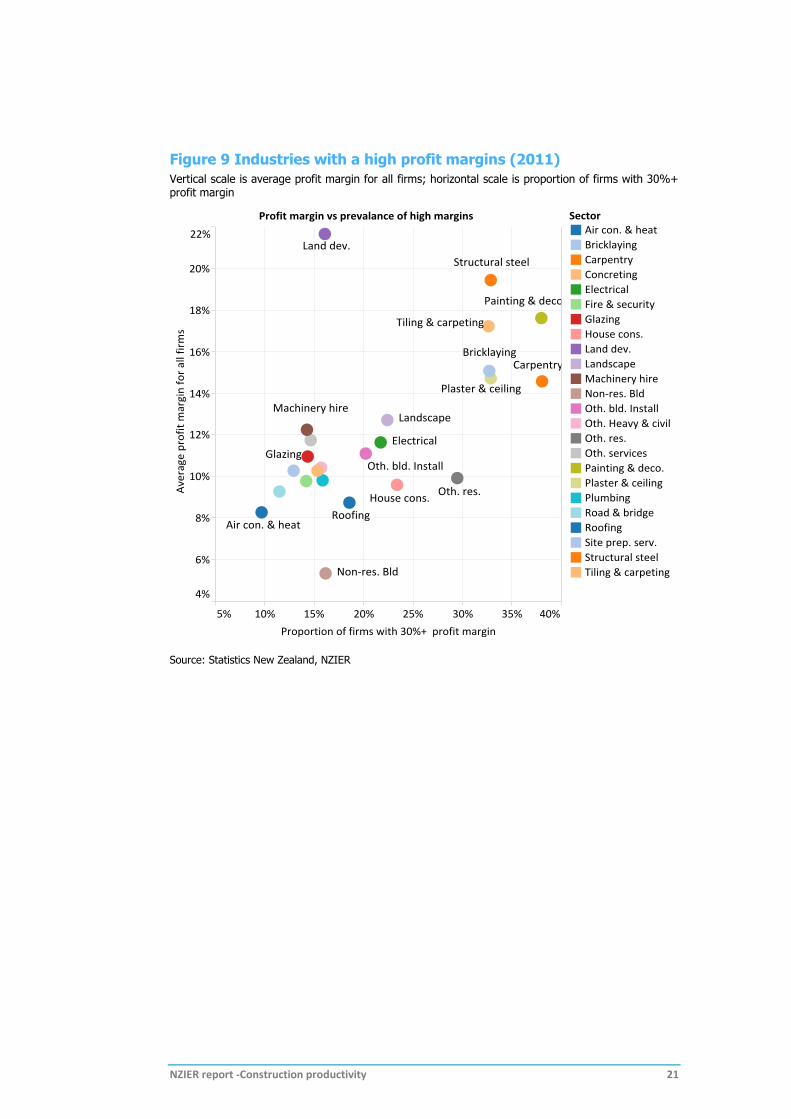
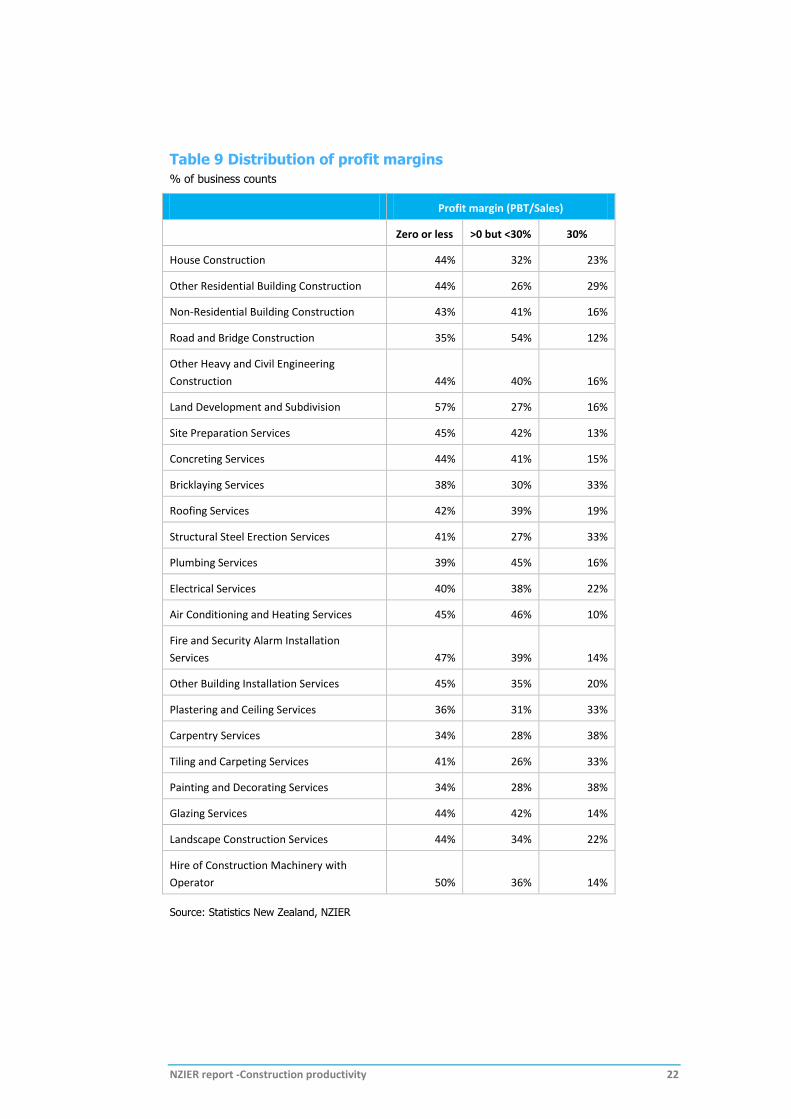
Profit margins can be an indicator of high innovation rates or impediments to productivity growth. Analysis of the profit margins and the incidence of high profit margins at the detailed industry level shows (Figure 9 & Table 9):
Concentration of very high profit margin businesses in Construction Services, in particular:
Carpentry Services
Painting and Decorating Services
Plastering and Ceiling Services
Structural Steel Erection Services
Bricklaying Services
Tiling and Carpeting Services
There are some signs of high margins in Heavy & Civil and Non-residential Buildings, but less obviously so than in Construction Services.
There does not appear to be a systematic pattern of very high profitability in the Residential Building sector.
Non-residential Building appears to be competitive and have tight profit margins.
NZIER report -Construction productivity 21
Figure 9 Industries with a high profit margins (2011)
Vertical scale is average profit margin for all firms; horizontal scale is proportion of firms with 30%+ profit margin
Source: Statistics New Zealand, NZIER
NZIER report -Construction productivity 22
Table 9 Distribution of profit margins
% of business counts
Profit margin (PBT/Sales)
Zero or less >0 but <30% 30%
House Construction 44% 32% 23%
Other Residential Building Construction 44% 26% 29%
Non-Residential Building Construction 43% 41% 16%
Road and Bridge Construction 35% 54% 12%
Other Heavy and Civil Engineering
Construction 44% 40% 16%
Land Development and Subdivision 57% 27% 16%
Site Preparation Services 45% 42% 13%
Concreting Services 44% 41% 15%
Bricklaying Services 38% 30% 33%
Roofing Services 42% 39% 19%
Structural Steel Erection Services 41% 27% 33%
Plumbing Services 39% 45% 16%
Electrical Services 40% 38% 22%
Air Conditioning and Heating Services 45% 46% 10%
Fire and Security Alarm Installation
Services 47% 39% 14%
Other Building Installation Services 45% 35% 20%
Plastering and Ceiling Services 36% 31% 33%
Carpentry Services 34% 28% 38%
Tiling and Carpeting Services 41% 26% 33%
Painting and Decorating Services 34% 28% 38%
Glazing Services 44% 42% 14%
Landscape Construction Services 44% 34% 22%
Hire of Construction Machinery with
Operator 50% 36% 14%
Source: Statistics New Zealand, NZIER
NZIER report -Construction productivity 23
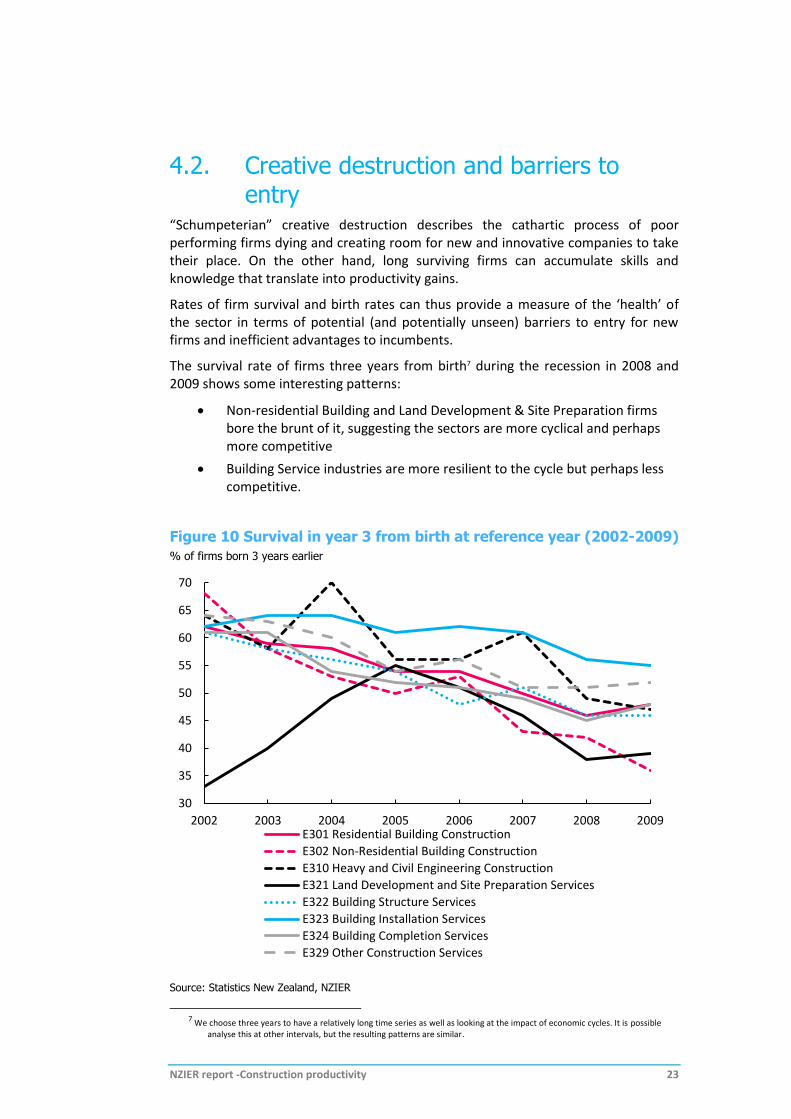
4.2. Creative destruction and barriers to entry
“Schumpeterian” creative destruction describes the cathartic process of poor performing firms dying and creating room for new and innovative companies to take their place. On the other hand, long surviving firms can accumulate skills and knowledge that translate into productivity gains.
Rates of firm survival and birth rates can thus provide a measure of the ‘health’ of the sector in terms of potential (and potentially unseen) barriers to entry for new firms and inefficient advantages to incumbents.
The survival rate of firms three years from birth7 during the recession in 2008 and 2009 shows some interesting patterns:
Non-residential Building and Land Development & Site Preparation firms bore the brunt of it, suggesting the sectors are more cyclical and perhaps more competitive
Building Service industries are more resilient to the cycle but perhaps less competitive.
Figure 10 Survival in year 3 from birth at reference year (2002-2009)
% of firms born 3 years earlier
Source: Statistics New Zealand, NZIER
7 We choose three years to have a relatively long time series as well as looking at the impact of economic cycles. It is possible
analyse this at other intervals, but the resulting patterns are similar.
30
35
40
45
50
55
60
65
70
2002 2003 2004 2005 2006 2007 2008 2009E301 Residential Building Construction
E302 Non-Residential Building Construction
E310 Heavy and Civil Engineering Construction
E321 Land Development and Site Preparation Services
E322 Building Structure Services
E323 Building Installation Services
E324 Building Completion Services
E329 Other Construction Services
NZIER report -Construction productivity 24
4.2.1. Regional and industry concentrations & pricing
Industry concentration, that is few competing firms, can reflect low competition and thus low incentive to innovate.8
We construct market concentration indices based on firm size and employment count data by industry and region to calculate the Herfindahl–Hirschman Index (HHI). The HHI is an index of market concentration, which tends to be higher where there is more market power, or less competition. Because we use a number of simplifying assumptions, the calculations should be seen as indicative.
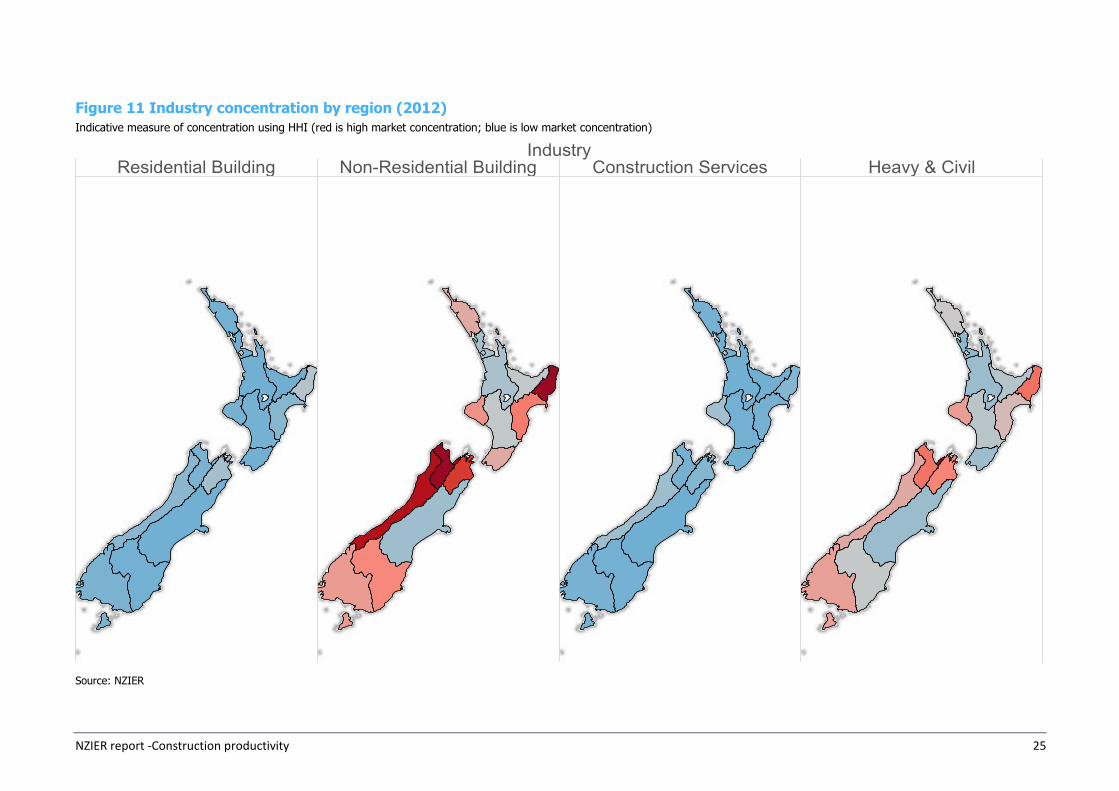
We find that the industry concentration varies by sector and region:
Residential Building is fragmented and competitive (by this measure) across most regions, with the exception of the two small regions of Gisborne and Marlborough. There is a possibility that surrounding regions (Hawke’s Bay for Gisborne and Nelson-Tasman for Marlborough) could provide these services even if they are not physically located in the region.
Non-residential Building and Civil & Heavy are concentrated in the large metro areas of Auckland, Wellington and Canterbury, as well as Waikato, Manawatu-Wanganui and Bay of Plenty. Presence is small and concentrated in smaller regions.
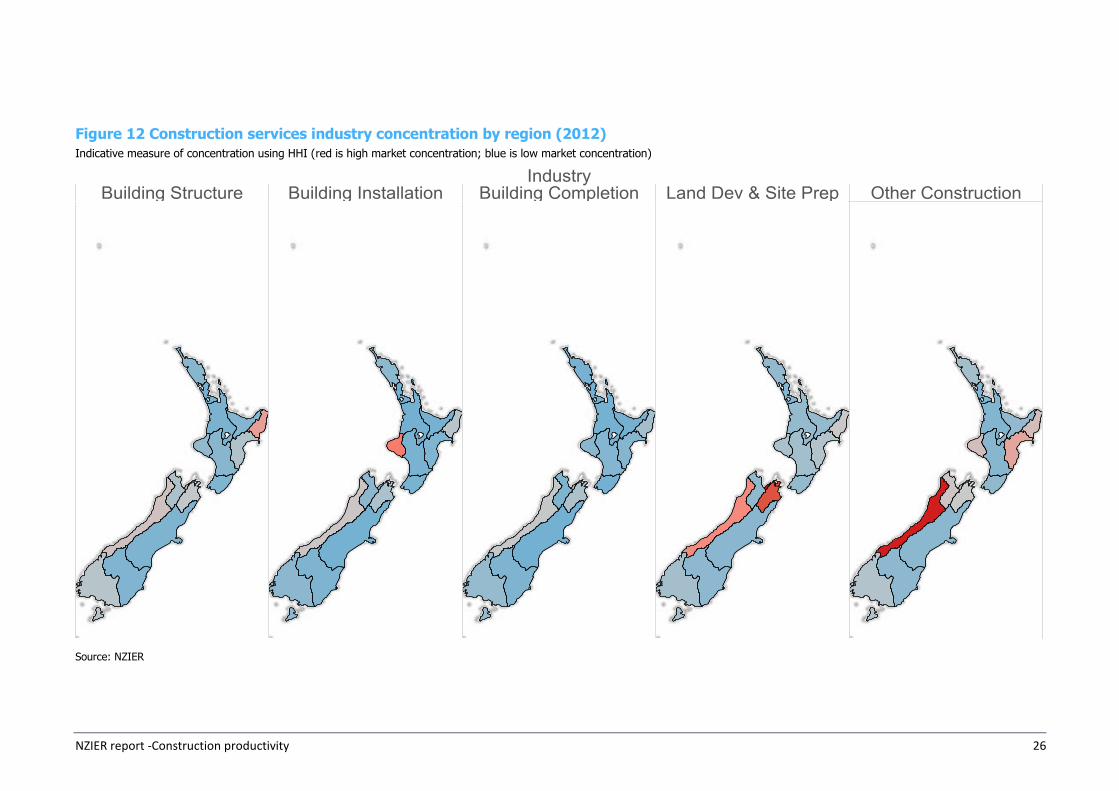
Construction Services is a diffuse industry across the country. Detailed breakdown of the sub-sector shows a similar pattern across the country, with high concentration is remote and small regions.
8 Industry concentration measures are imperfect measures of competition and should be used in conjunction with other data.
NZIER report -Construction productivity 25
Figure 11 Industry concentration by region (2012)
Indicative measure of concentration using HHI (red is high market concentration; blue is low market concentration)
Source: NZIER
NZIER report -Construction productivity 26
Figure 12 Construction services industry concentration by region (2012)
Indicative measure of concentration using HHI (red is high market concentration; blue is low market concentration)
Source: NZIER
NZIER report -Construction productivity 27
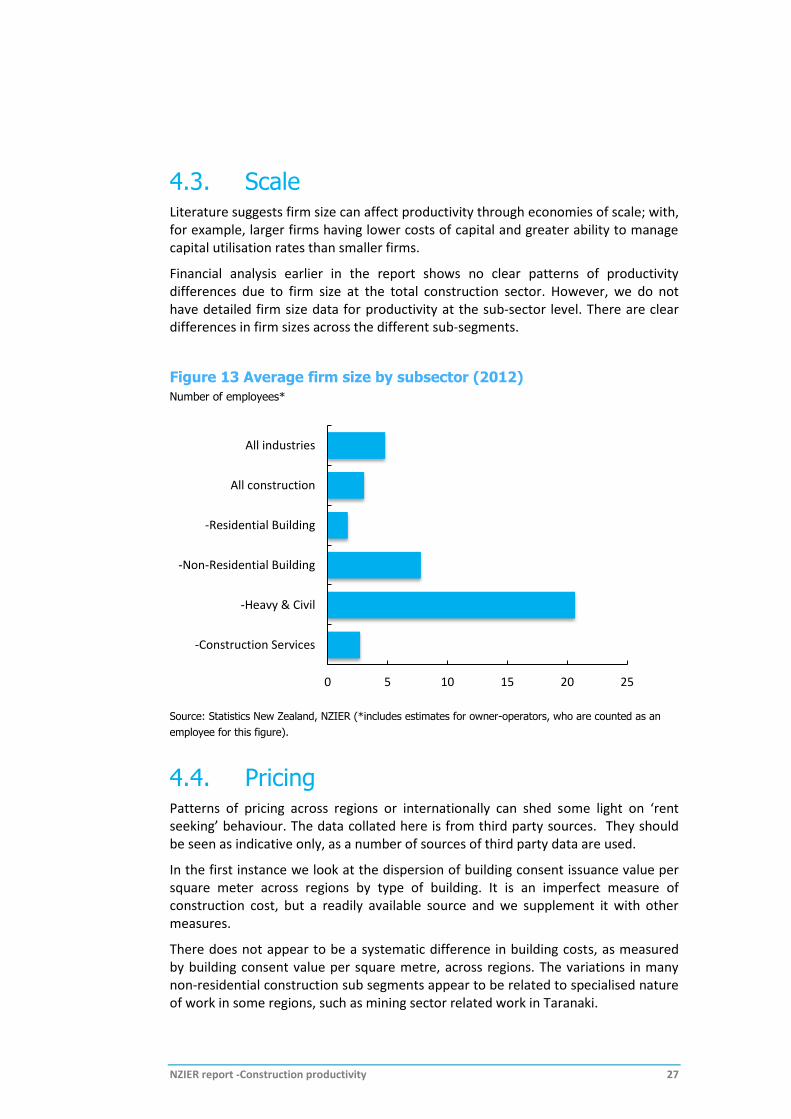
4.3. Scale Literature suggests firm size can affect productivity through economies of scale; with, for example, larger firms having lower costs of capital and greater ability to manage capital utilisation rates than smaller firms.
Financial analysis earlier in the report shows no clear patterns of productivity differences due to firm size at the total construction sector. However, we do not have detailed firm size data for productivity at the sub-sector level. There are clear differences in firm sizes across the different sub-segments.
Figure 13 Average firm size by subsector (2012)
Number of employees*
Source: Statistics New Zealand, NZIER (*includes estimates for owner-operators, who are counted as an
employee for this figure).
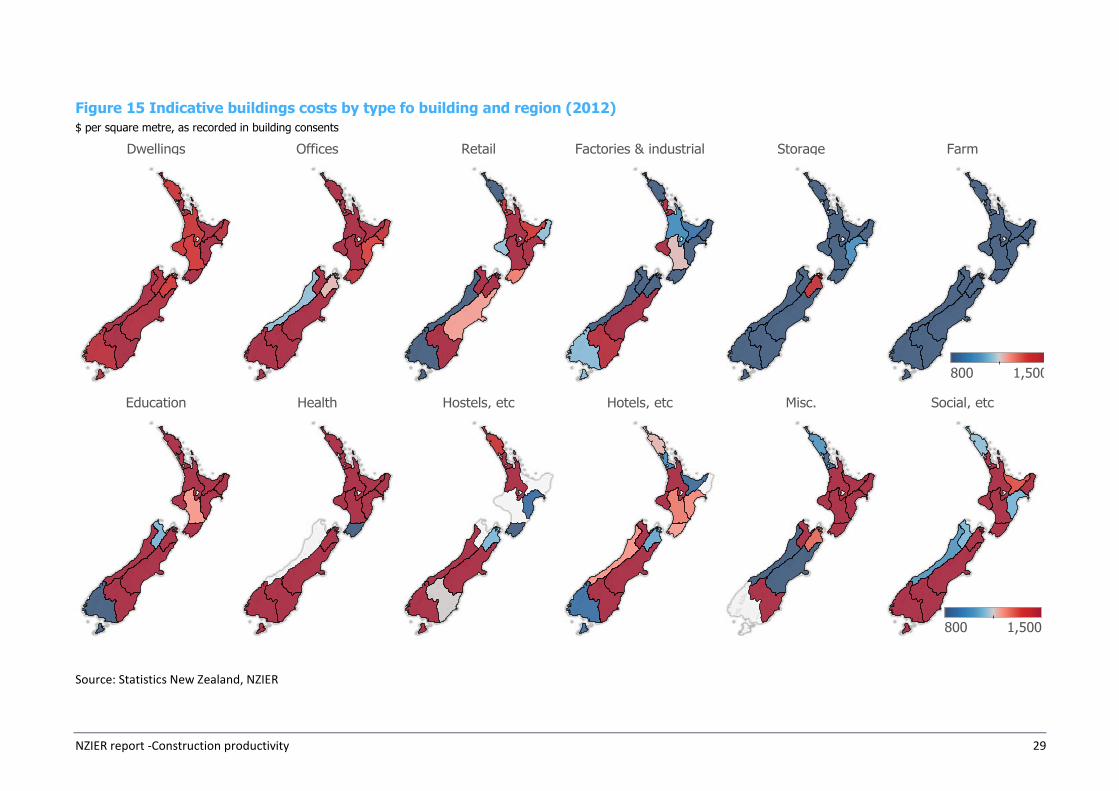
4.4. Pricing Patterns of pricing across regions or internationally can shed some light on ‘rent seeking’ behaviour. The data collated here is from third party sources. They should be seen as indicative only, as a number of sources of third party data are used.
In the first instance we look at the dispersion of building consent issuance value per square meter across regions by type of building. It is an imperfect measure of construction cost, but a readily available source and we supplement it with other measures.
There does not appear to be a systematic difference in building costs, as measured by building consent value per square metre, across regions. The variations in many non-residential construction sub segments appear to be related to specialised nature of work in some regions, such as mining sector related work in Taranaki.
0 5 10 15 20 25
All industries
All construction
-Residential Building
-Non-Residential Building
-Heavy & Civil
-Construction Services
NZIER report -Construction productivity 28
4.4.1. Residential
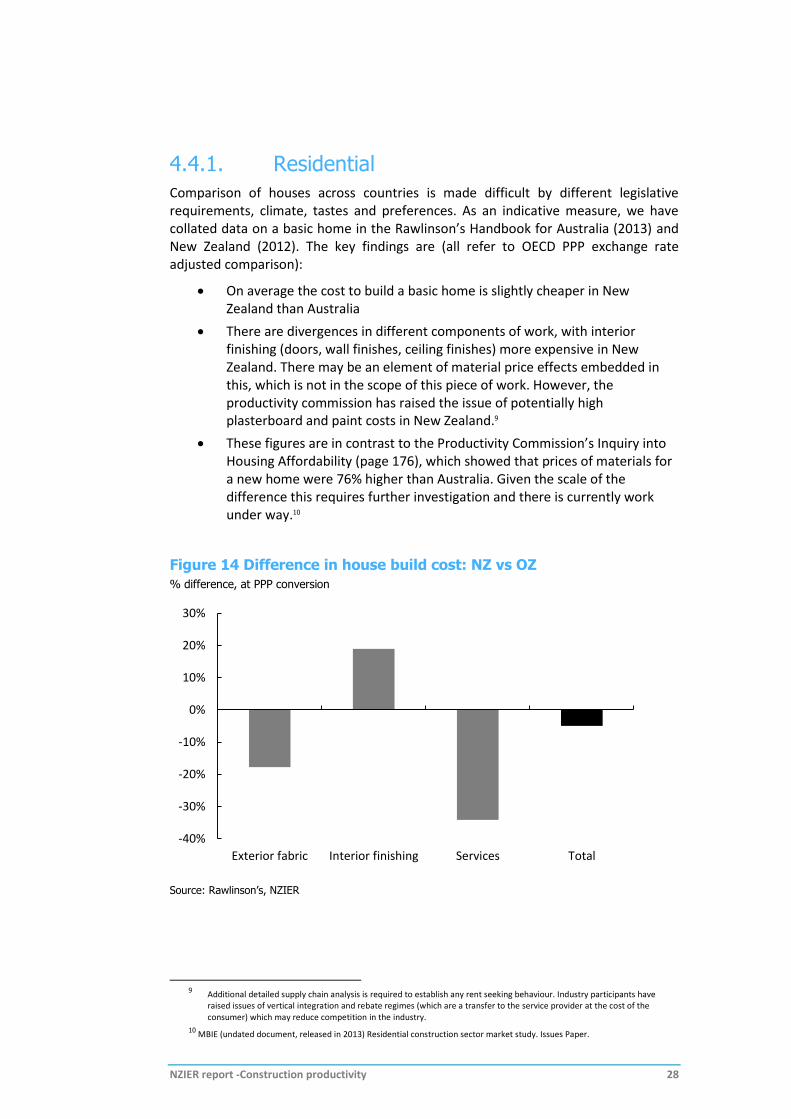
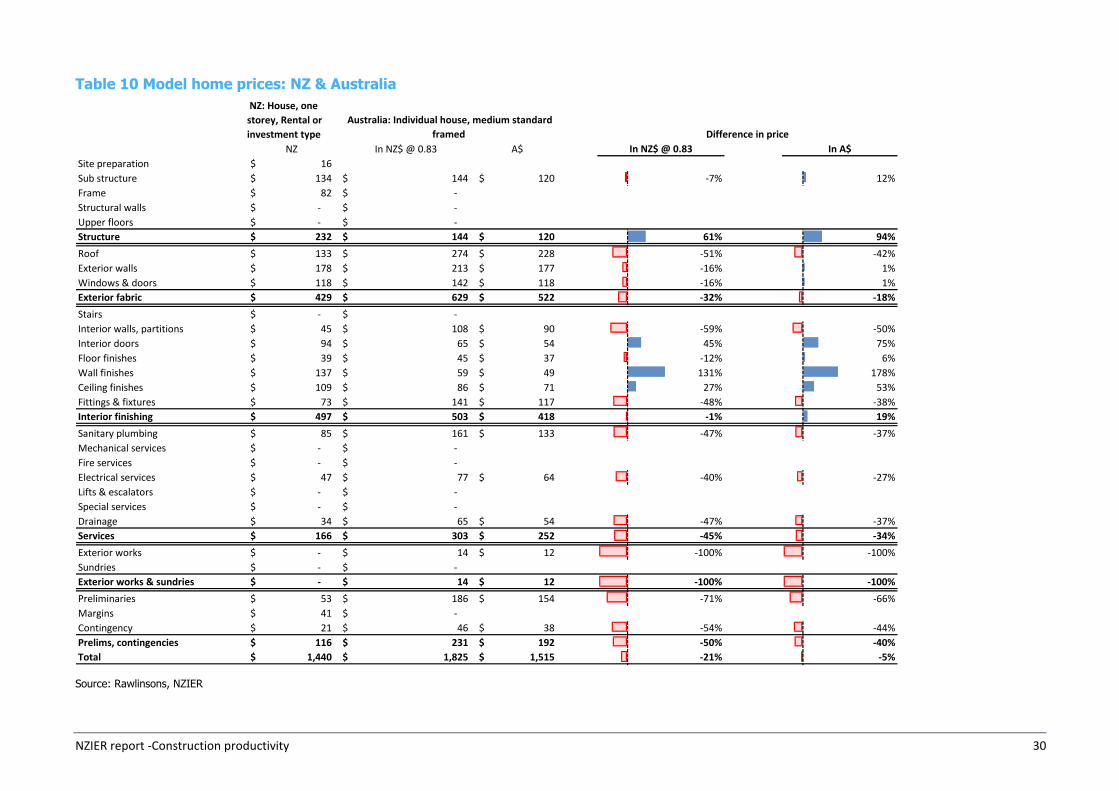
Comparison of houses across countries is made difficult by different legislative requirements, climate, tastes and preferences. As an indicative measure, we have collated data on a basic home in the Rawlinson’s Handbook for Australia (2013) and New Zealand (2012). The key findings are (all refer to OECD PPP exchange rate adjusted comparison):
On average the cost to build a basic home is slightly cheaper in New Zealand than Australia
There are divergences in different components of work, with interior finishing (doors, wall finishes, ceiling finishes) more expensive in New Zealand. There may be an element of material price effects embedded in this, which is not in the scope of this piece of work. However, the productivity commission has raised the issue of potentially high plasterboard and paint costs in New Zealand.9
These figures are in contrast to the Productivity Commission’s Inquiry into Housing Affordability (page 176), which showed that prices of materials for a new home were 76% higher than Australia. Given the scale of the difference this requires further investigation and there is currently work under way.10
Figure 14 Difference in house build cost: NZ vs OZ
% difference, at PPP conversion
Source: Rawlinson’s, NZIER
9 Additional detailed supply chain analysis is required to establish any rent seeking behaviour. Industry participants have
raised issues of vertical integration and rebate regimes (which are a transfer to the service provider at the cost of the consumer) which may reduce competition in the industry.
10 MBIE (undated document, released in 2013) Residential construction sector market study. Issues Paper.
-40%
-30%
-20%
-10%
0%
10%
20%
30%
Exterior fabric Interior finishing Services Total
NZIER report -Construction productivity 29
Figure 15 Indicative buildings costs by type fo building and region (2012)
$ per square metre, as recorded in building consents
Source: Statistics New Zealand, NZIER
NZIER report -Construction productivity 30
Table 10 Model home prices: NZ & Australia
Source: Rawlinsons, NZIER
NZ: House, one
storey, Rental or
investment type
NZ In NZ$ @ 0.83 A$
Site preparation 16$
Sub structure 134$ 144$ 120$ -7% 12%
Frame 82$ -$
Structural walls -$ -$
Upper floors -$ -$
Structure 232$ 144$ 120$ 61% 94%
Roof 133$ 274$ 228$ -51% -42%
Exterior walls 178$ 213$ 177$ -16% 1%
Windows & doors 118$ 142$ 118$ -16% 1%
Exterior fabric 429$ 629$ 522$ -32% -18%
Stairs -$ -$
Interior walls, partitions 45$ 108$ 90$ -59% -50%
Interior doors 94$ 65$ 54$ 45% 75%
Floor finishes 39$ 45$ 37$ -12% 6%
Wall finishes 137$ 59$ 49$ 131% 178%
Ceiling finishes 109$ 86$ 71$ 27% 53%
Fittings & fixtures 73$ 141$ 117$ -48% -38%
Interior finishing 497$ 503$ 418$ -1% 19%
Sanitary plumbing 85$ 161$ 133$ -47% -37%
Mechanical services -$ -$
Fire services -$ -$
Electrical services 47$ 77$ 64$ -40% -27%
Lifts & escalators -$ -$
Special services -$ -$
Drainage 34$ 65$ 54$ -47% -37%
Services 166$ 303$ 252$ -45% -34%
Exterior works -$ 14$ 12$ -100% -100%
Sundries -$ -$
Exterior works & sundries -$ 14$ 12$ -100% -100%
Preliminaries 53$ 186$ 154$ -71% -66%
Margins 41$ -$
Contingency 21$ 46$ 38$ -54% -44%
Prelims, contingencies 116$ 231$ 192$ -50% -40%
Total 1,440$ 1,825$ 1,515$ -21% -5%
In NZ$ @ 0.83 In A$
Australia: Individual house, medium standard
framed Difference in price
NZIER report -Construction productivity 31
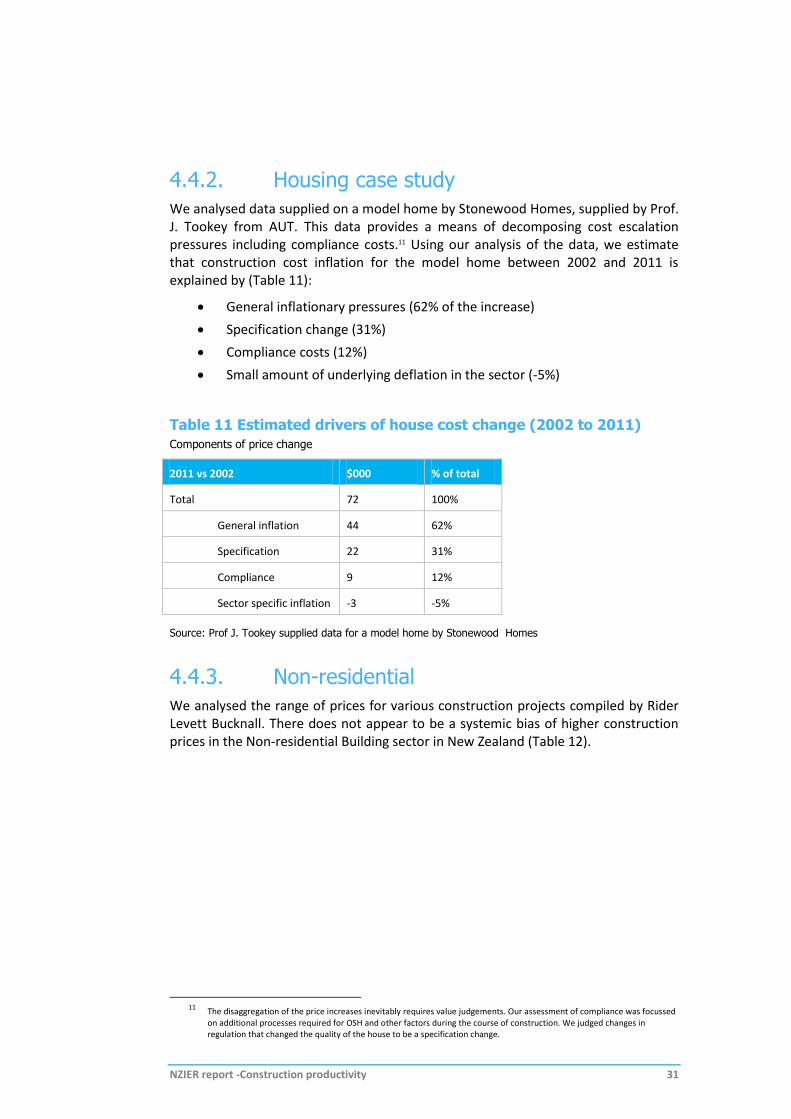
4.4.2. Housing case study
We analysed data supplied on a model home by Stonewood Homes, supplied by Prof. J. Tookey from AUT. This data provides a means of decomposing cost escalation pressures including compliance costs.11 Using our analysis of the data, we estimate that construction cost inflation for the model home between 2002 and 2011 is explained by (Table 11):
General inflationary pressures (62% of the increase)
Specification change (31%)
Compliance costs (12%)
Small amount of underlying deflation in the sector (-5%)
Table 11 Estimated drivers of house cost change (2002 to 2011)
Components of price change
2011 vs 2002 $000 % of total
Total 72 100%
General inflation 44 62%
Specification 22 31%
Compliance 9 12%
Sector specific inflation -3 -5%
Source: Prof J. Tookey supplied data for a model home by Stonewood Homes
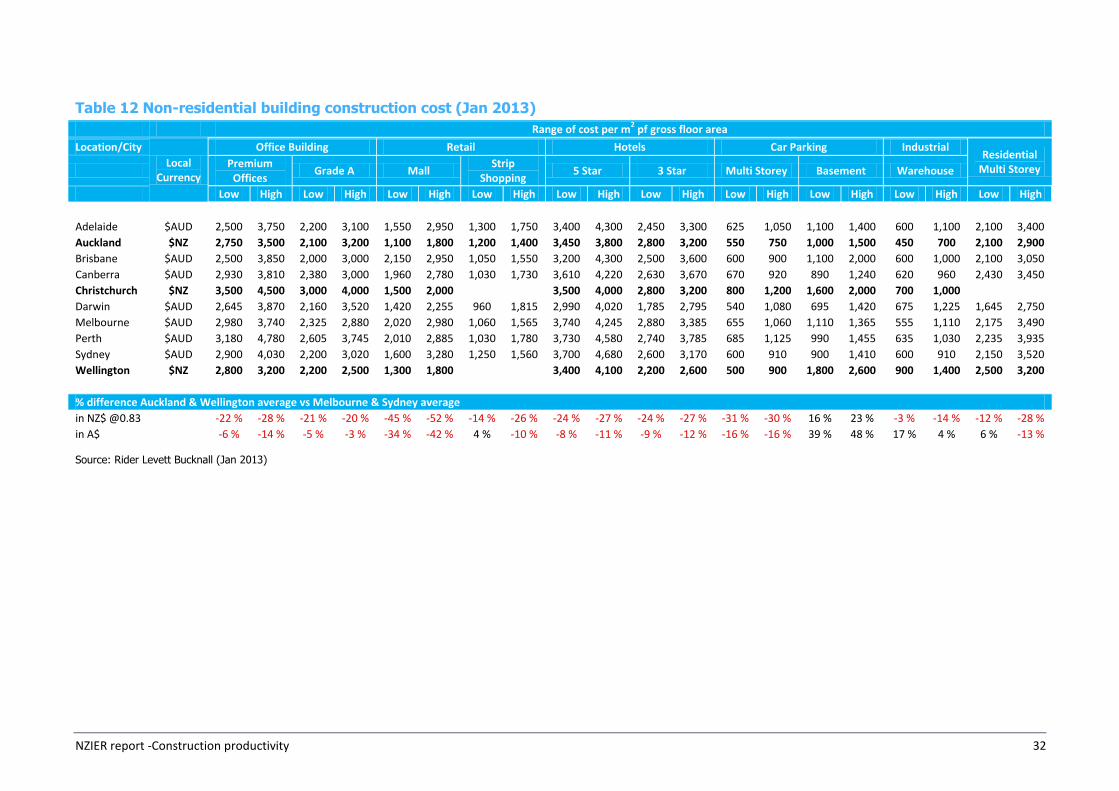
4.4.3. Non-residential
We analysed the range of prices for various construction projects compiled by Rider Levett Bucknall. There does not appear to be a systemic bias of higher construction prices in the Non-residential Building sector in New Zealand (Table 12).
11 The disaggregation of the price increases inevitably requires value judgements. Our assessment of compliance was focussed
on additional processes required for OSH and other factors during the course of construction. We judged changes in regulation that changed the quality of the house to be a specification change.
NZIER report -Construction productivity 32
Table 12 Non-residential building construction cost (Jan 2013)
Range of cost per m2 pf gross floor area
Location/City
Local Currency
Office Building Retail Hotels Car Parking Industrial Residential
Multi Storey Premium
Offices Grade A Mall
Strip Shopping
5 Star 3 Star Multi Storey Basement Warehouse
Low High Low High Low High Low High Low High Low High Low High Low High Low High Low High
Adelaide $AUD 2,500 3,750 2,200 3,100 1,550 2,950 1,300 1,750 3,400 4,300 2,450 3,300 625 1,050 1,100 1,400 600 1,100 2,100 3,400
Auckland $NZ 2,750 3,500 2,100 3,200 1,100 1,800 1,200 1,400 3,450 3,800 2,800 3,200 550 750 1,000 1,500 450 700 2,100 2,900
Brisbane $AUD 2,500 3,850 2,000 3,000 2,150 2,950 1,050 1,550 3,200 4,300 2,500 3,600 600 900 1,100 2,000 600 1,000 2,100 3,050
Canberra $AUD 2,930 3,810 2,380 3,000 1,960 2,780 1,030 1,730 3,610 4,220 2,630 3,670 670 920 890 1,240 620 960 2,430 3,450
Christchurch $NZ 3,500 4,500 3,000 4,000 1,500 2,000 3,500 4,000 2,800 3,200 800 1,200 1,600 2,000 700 1,000
Darwin $AUD 2,645 3,870 2,160 3,520 1,420 2,255 960 1,815 2,990 4,020 1,785 2,795 540 1,080 695 1,420 675 1,225 1,645 2,750
Melbourne $AUD 2,980 3,740 2,325 2,880 2,020 2,980 1,060 1,565 3,740 4,245 2,880 3,385 655 1,060 1,110 1,365 555 1,110 2,175 3,490
Perth $AUD 3,180 4,780 2,605 3,745 2,010 2,885 1,030 1,780 3,730 4,580 2,740 3,785 685 1,125 990 1,455 635 1,030 2,235 3,935
Sydney $AUD 2,900 4,030 2,200 3,020 1,600 3,280 1,250 1,560 3,700 4,680 2,600 3,170 600 910 900 1,410 600 910 2,150 3,520
Wellington $NZ 2,800 3,200 2,200 2,500 1,300 1,800 3,400 4,100 2,200 2,600 500 900 1,800 2,600 900 1,400 2,500 3,200
% difference Auckland & Wellington average vs Melbourne & Sydney average
in NZ$ @0.83
-22 % -28 % -21 % -20 % -45 % -52 % -14 % -26 % -24 % -27 % -24 % -27 % -31 % -30 % 16 % 23 % -3 % -14 % -12 % -28 %
in A$
-6 % -14 % -5 % -3 % -34 % -42 % 4 % -10 % -8 % -11 % -9 % -12 % -16 % -16 % 39 % 48 % 17 % 4 % 6 % -13 %
Source: Rider Levett Bucknall (Jan 2013)
NZIER report -Construction productivity 33
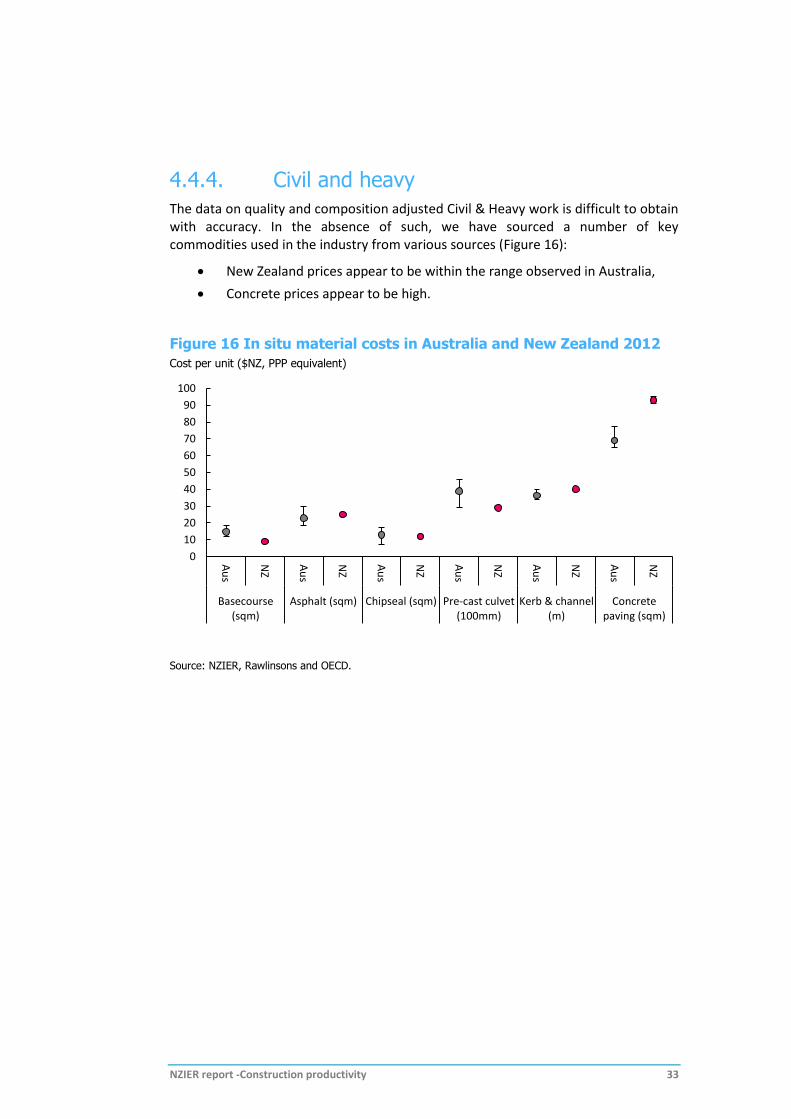
4.4.4. Civil and heavy
The data on quality and composition adjusted Civil & Heavy work is difficult to obtain with accuracy. In the absence of such, we have sourced a number of key commodities used in the industry from various sources (Figure 16):
New Zealand prices appear to be within the range observed in Australia,
Concrete prices appear to be high.
Figure 16 In situ material costs in Australia and New Zealand 2012
Cost per unit ($NZ, PPP equivalent)
Source: NZIER, Rawlinsons and OECD.
0
10
20
30
40
50
60
70
80
90
100
Au
s
NZ
Au
s
NZ
Au
s
NZ
Au
s
NZ
Au
s
NZ
Au
s
NZ
Basecourse(sqm)
Asphalt (sqm) Chipseal (sqm) Pre-cast culvet(100mm)
Kerb & channel(m)
Concretepaving (sqm)
NZIER report -Construction productivity 34
5. Labour Much of our evidence points to similar construction costs between New Zealand and Australia. However, average hourly wages are lower in New Zealand. This means New Zealand uses more labour hours for the same work, and that labour productivity is lower than in Australia.
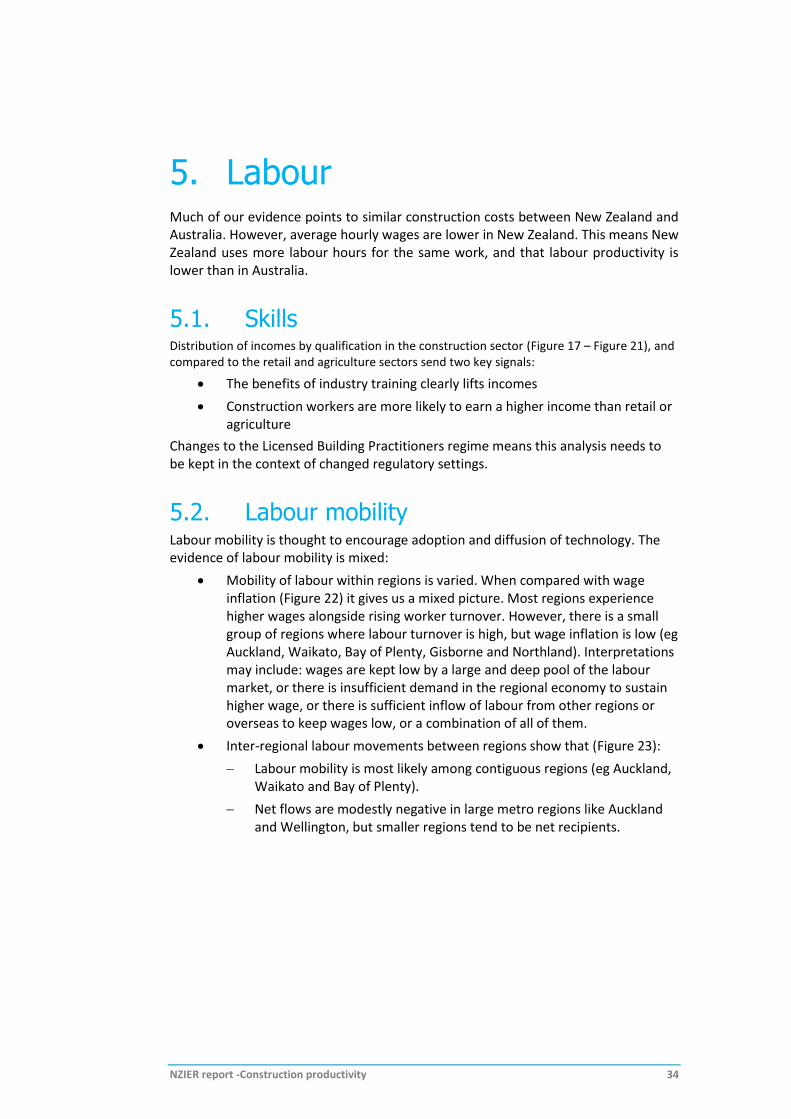
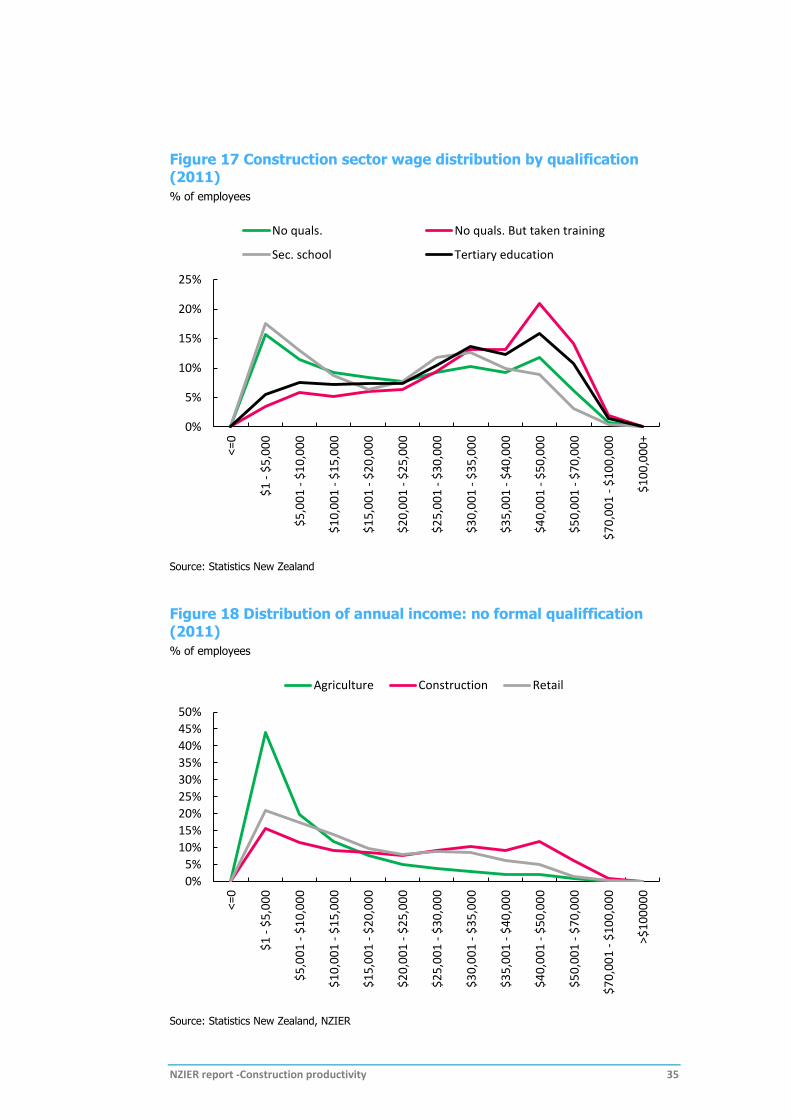
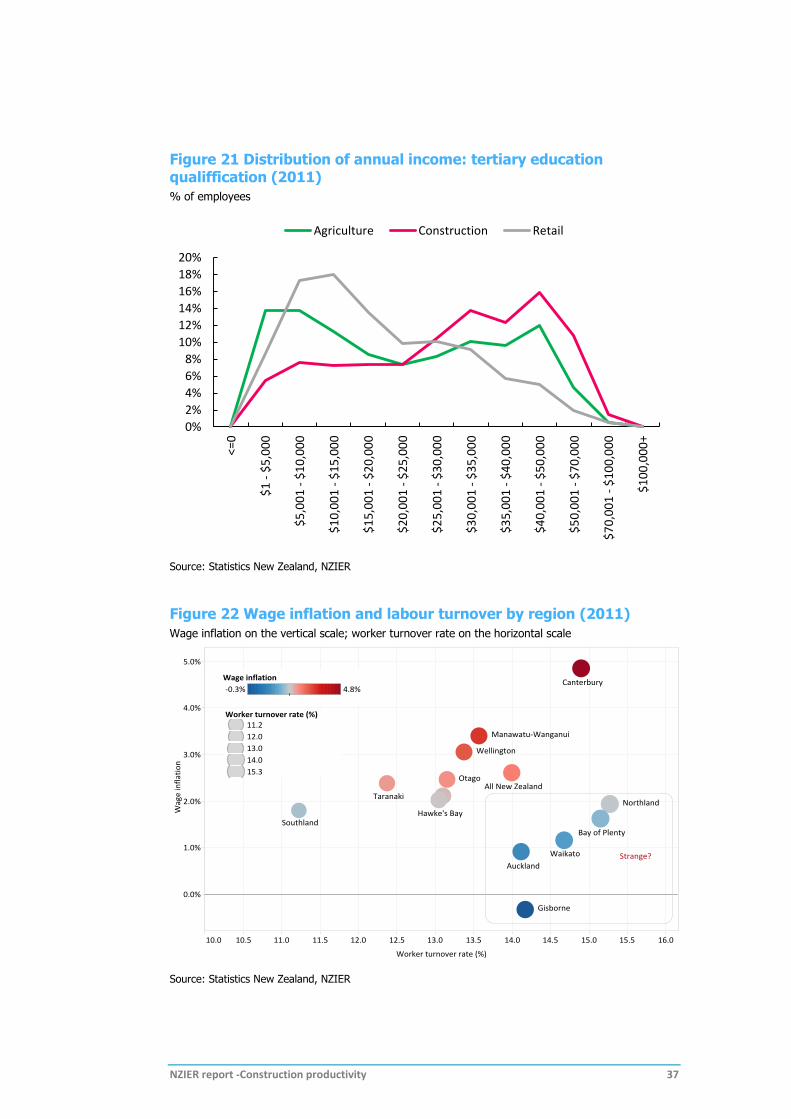
5.1. Skills Distribution of incomes by qualification in the construction sector (Figure 17 – Figure 21), and compared to the retail and agriculture sectors send two key signals:
The benefits of industry training clearly lifts incomes
Construction workers are more likely to earn a higher income than retail or agriculture
Changes to the Licensed Building Practitioners regime means this analysis needs to be kept in the context of changed regulatory settings.
5.2. Labour mobility Labour mobility is thought to encourage adoption and diffusion of technology. The evidence of labour mobility is mixed:
Mobility of labour within regions is varied. When compared with wage inflation (Figure 22) it gives us a mixed picture. Most regions experience higher wages alongside rising worker turnover. However, there is a small group of regions where labour turnover is high, but wage inflation is low (eg Auckland, Waikato, Bay of Plenty, Gisborne and Northland). Interpretations may include: wages are kept low by a large and deep pool of the labour market, or there is insufficient demand in the regional economy to sustain higher wage, or there is sufficient inflow of labour from other regions or overseas to keep wages low, or a combination of all of them.
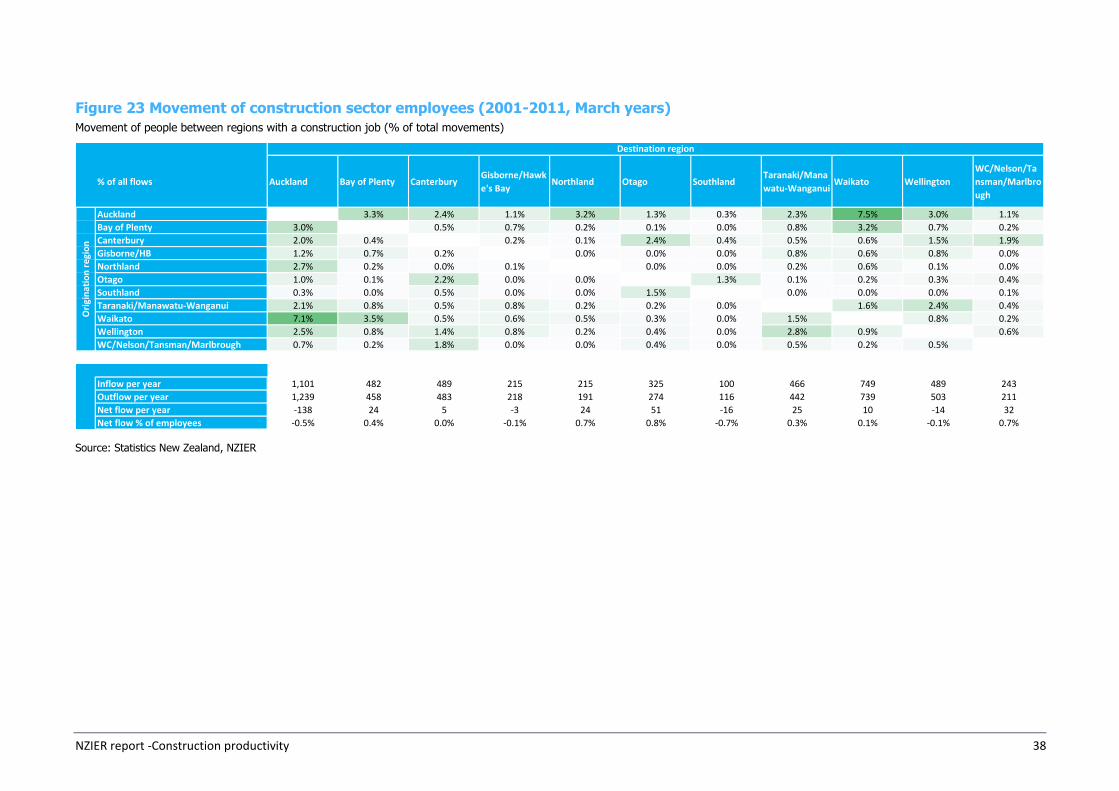
Inter-regional labour movements between regions show that (Figure 23):
Labour mobility is most likely among contiguous regions (eg Auckland, Waikato and Bay of Plenty).
Net flows are modestly negative in large metro regions like Auckland and Wellington, but smaller regions tend to be net recipients.
NZIER report -Construction productivity 35
Figure 17 Construction sector wage distribution by qualification (2011)
% of employees
Source: Statistics New Zealand
Figure 18 Distribution of annual income: no formal qualiffication (2011)
% of employees
Source: Statistics New Zealand, NZIER
0%
5%
10%
15%
20%
25%
<=0
$1
- $
5,0
00
$5
,00
1 -
$1
0,0
00
$1
0,0
01
- $
15
,00
0
$1
5,0
01
- $
20
,00
0
$2
0,0
01
- $
25
,00
0
$2
5,0
01
- $
30
,00
0
$3
0,0
01
- $
35
,00
0
$3
5,0
01
- $
40
,00
0
$4
0,0
01
- $
50
,00
0
$5
0,0
01
- $
70
,00
0
$7
0,0
01
- $
10
0,0
00
$1
00
,00
0+
No quals. No quals. But taken training
Sec. school Tertiary education
0%
5%
10%
15%
20%
25%
30%
35%
40%
45%
50%
<=0
$1
- $
5,0
00
$5
,00
1 -
$1
0,0
00
$1
0,0
01
- $
15
,00
0
$1
5,0
01
- $
20
,00
0
$2
0,0
01
- $
25
,00
0
$2
5,0
01
- $
30
,00
0
$3
0,0
01
- $
35
,00
0
$3
5,0
01
- $
40
,00
0
$4
0,0
01
- $
50
,00
0
$5
0,0
01
- $
70
,00
0
$7
0,0
01
- $
10
0,0
00
>$
10
00
00
Agriculture Construction Retail
NZIER report -Construction productivity 36
Figure 19 Distribution of annual income: no formal qualiffication but has undertaken training (2011)
% of employees
Source: Statistics New Zealand, NZIER
Figure 20 Distribution of annual income: secondary school qualiffication (2011)
% of employees
Source: Statistics New Zealand, NZIER
0%
5%
10%
15%
20%
25%
<=0
$1
- $
5,0
00
$5
,00
1 -
$1
0,0
00
$1
0,0
01
- $
15
,00
0
$1
5,0
01
- $
20
,00
0
$2
0,0
01
- $
25
,00
0
$2
5,0
01
- $
30
,00
0
$3
0,0
01
- $
35
,00
0
$3
5,0
01
- $
40
,00
0
$4
0,0
01
- $
50
,00
0
$5
0,0
01
- $
70
,00
0
$7
0,0
01
- $
10
0,0
00
$1
00
,00
0+
Agriculture Construction Retail
0%
5%
10%
15%
20%
25%
30%
35%
40%
45%
<=0
$1
- $
5,0
00
$5
,00
1 -
$1
0,0
00
$1
0,0
01
- $
15
,00
0
$1
5,0
01
- $
20
,00
0
$2
0,0
01
- $
25
,00
0
$2
5,0
01
- $
30
,00
0
$3
0,0
01
- $
35
,00
0
$3
5,0
01
- $
40
,00
0
$4
0,0
01
- $
50
,00
0
$5
0,0
01
- $
70
,00
0
$7
0,0
01
- $
10
0,0
00
$1
00
,00
0+
Agriculture Construction Retail
NZIER report -Construction productivity 37
Figure 21 Distribution of annual income: tertiary education qualiffication (2011)
% of employees
Source: Statistics New Zealand, NZIER
Figure 22 Wage inflation and labour turnover by region (2011)
Wage inflation on the vertical scale; worker turnover rate on the horizontal scale
Source: Statistics New Zealand, NZIER
0%
2%
4%
6%
8%
10%
12%
14%
16%
18%
20%
<=0
$1
- $
5,0
00
$5
,00
1 -
$1
0,0
00
$1
0,0
01
- $
15
,00
0
$1
5,0
01
- $
20
,00
0
$2
0,0
01
- $
25
,00
0
$2
5,0
01
- $
30
,00
0
$3
0,0
01
- $
35
,00
0
$3
5,0
01
- $
40
,00
0
$4
0,0
01
- $
50
,00
0
$5
0,0
01
- $
70
,00
0
$7
0,0
01
- $
10
0,0
00
$1
00
,00
0+
Agriculture Construction Retail
NZIER report -Construction productivity 38
Figure 23 Movement of construction sector employees (2001-2011, March years)
Movement of people between regions with a construction job (% of total movements)
Source: Statistics New Zealand, NZIER
% of all flows Auckland Bay of Plenty CanterburyGisborne/Hawk
e's BayNorthland Otago Southland
Taranaki/Mana
watu-WanganuiWaikato Wellington
WC/Nelson/Ta
nsman/Marlbro
ugh
Auckland 3.3% 2.4% 1.1% 3.2% 1.3% 0.3% 2.3% 7.5% 3.0% 1.1%
Bay of Plenty 3.0% 0.5% 0.7% 0.2% 0.1% 0.0% 0.8% 3.2% 0.7% 0.2%
Canterbury 2.0% 0.4% 0.2% 0.1% 2.4% 0.4% 0.5% 0.6% 1.5% 1.9%
Gisborne/HB 1.2% 0.7% 0.2% 0.0% 0.0% 0.0% 0.8% 0.6% 0.8% 0.0%
Northland 2.7% 0.2% 0.0% 0.1% 0.0% 0.0% 0.2% 0.6% 0.1% 0.0%
Otago 1.0% 0.1% 2.2% 0.0% 0.0% 1.3% 0.1% 0.2% 0.3% 0.4%
Southland 0.3% 0.0% 0.5% 0.0% 0.0% 1.5% 0.0% 0.0% 0.0% 0.1%
Taranaki/Manawatu-Wanganui 2.1% 0.8% 0.5% 0.8% 0.2% 0.2% 0.0% 1.6% 2.4% 0.4%
Waikato 7.1% 3.5% 0.5% 0.6% 0.5% 0.3% 0.0% 1.5% 0.8% 0.2%
Wellington 2.5% 0.8% 1.4% 0.8% 0.2% 0.4% 0.0% 2.8% 0.9% 0.6%
WC/Nelson/Tansman/Marlbrough 0.7% 0.2% 1.8% 0.0% 0.0% 0.4% 0.0% 0.5% 0.2% 0.5%
Inflow per year 1,101 482 489 215 215 325 100 466 749 489 243
Outflow per year 1,239 458 483 218 191 274 116 442 739 503 211
Net flow per year -138 24 5 -3 24 51 -16 25 10 -14 32
Net flow % of employees -0.5% 0.4% 0.0% -0.1% 0.7% 0.8% -0.7% 0.3% 0.1% -0.1% 0.7%
Ori
gin
atio
n r
egi
on
Destination region
NZIER report -Construction productivity 39
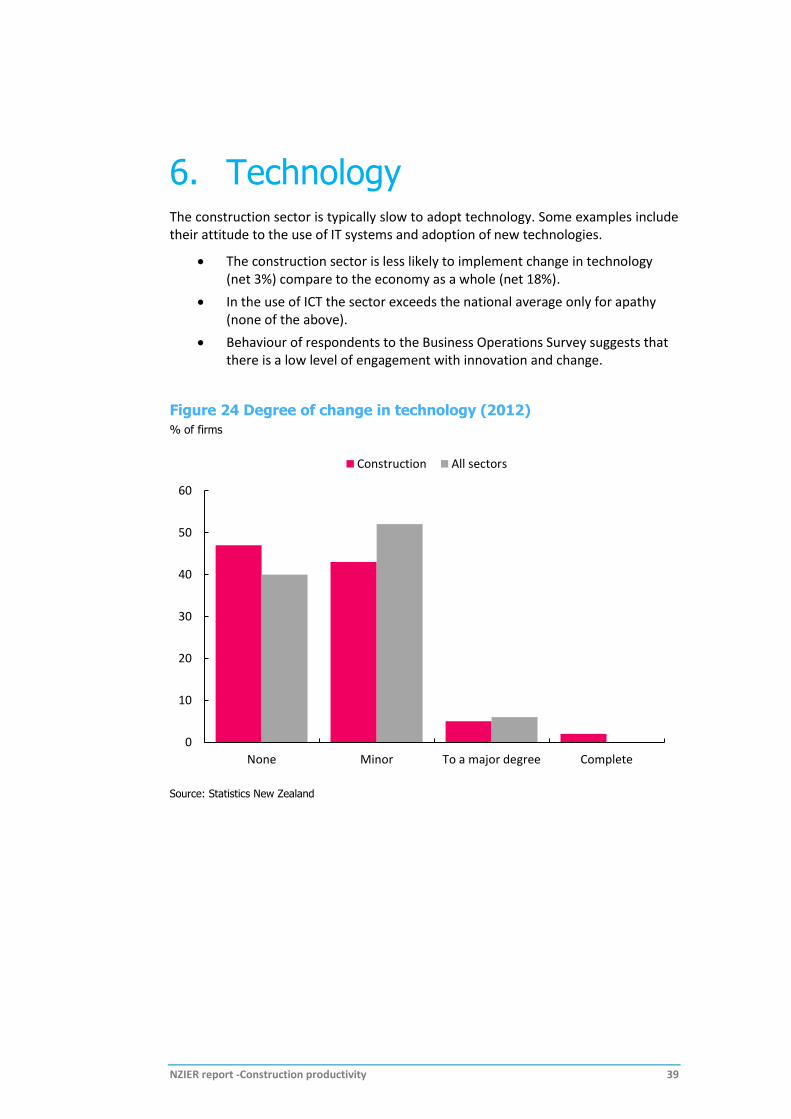
6. Technology The construction sector is typically slow to adopt technology. Some examples include their attitude to the use of IT systems and adoption of new technologies.
The construction sector is less likely to implement change in technology (net 3%) compare to the economy as a whole (net 18%).
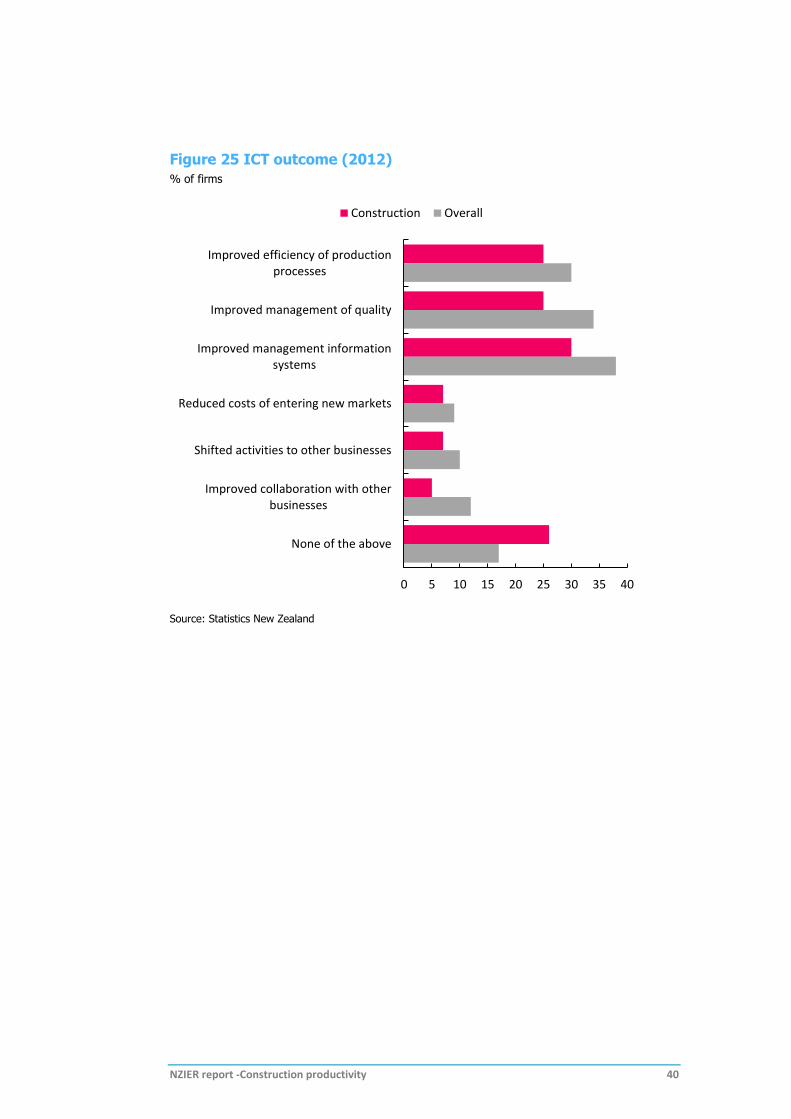
In the use of ICT the sector exceeds the national average only for apathy (none of the above).
Behaviour of respondents to the Business Operations Survey suggests that there is a low level of engagement with innovation and change.
Figure 24 Degree of change in technology (2012)
% of firms
Source: Statistics New Zealand
0
10
20
30
40
50
60
None Minor To a major degree Complete
Construction All sectors
NZIER report -Construction productivity 40
Figure 25 ICT outcome (2012)
% of firms
Source: Statistics New Zealand
0 5 10 15 20 25 30 35 40
Improved efficiency of productionprocesses
Improved management of quality
Improved management informationsystems
Reduced costs of entering new markets
Shifted activities to other businesses
Improved collaboration with otherbusinesses
None of the above
Construction Overall