consolidated summary report - mufg.jp · for inquiry: takeaki ishii, general manager - financial...
TRANSCRIPT

Consolidated Summary Report <under Japanese GAAP> for the fiscal year ended March 31, 2007
Company name: Mitsubishi UFJ Financial Group, Inc. Stock exchange listings: Tokyo, Osaka, Nagoya, New YorkCode number:Representative: Nobuo Kuroyanagi, President & CEOFor inquiry: Takeaki Ishii, General Manager - Financial Planning Division / Financial Accounting Office
TEL (03) 3240-7200The annual general meeting of shareholders (scheduled) Dividend payment date (scheduled)The annual securities report issuing date (scheduled) Trading accounts: Established
1. Consolidated financial data for the fiscal year ended March 31, 2007(1) Result of Operations
Fiscal year ended % % %
March 31, 2007March 31, 2006
(Reference) Former UFJ Holdings, Inc. (6 months)FYE Sep. 30, 2005
Fiscal year endedMarch 31, 2007March 31, 2006
(Reference) Former UFJ Holdings, Inc. (6 months)FYE Sep. 30, 2005
(Reference) Income from investment in affiliates (Equity method):million yen million yen
Former UFJ Holdings, Inc. million yen (6 months)
(2) Financial Conditions
As ofMarch 31, 2007March 31, 2006
Shareholders' equity million yen(*1) Please refer to page 4 for "Total Net Assets", "Net Assets Attributable to MUFG Shareholders to Total Assets" and "Total Net Assets per Common Share".(*2) Beginning from the fiscal year ended March 31, 2007, "Risk-adjusted Capital Ratio" is computed in accordance with the "Standards for Consolidated
the Ministry of Finance No. 62, 1998.
(3) Cash Flows
Fiscal year endedMarch 31, 2007March 31, 2006
(Reference) Former UFJ Holdings, Inc. (6 months)FYE Sep. 30, 2005
2. Dividends on Common stock
(Consolidated)Fiscal year ended
March 31, 2006March 31, 2007
March 31,2008 (*2)(Forecast)
(*1) The table shown above does not include stocks other than common stocks. Please refer to page 3 for information with regard to the preferred stocks.(*2) Please refer to page 5 for information with regard to "Dividends per Common Share" and "Dividend Payout Ratio (consolidated )" for FYE Mar. 31, 2008.
3. Earnings forecasts for the fiscal year ending March 31, 2008 (Consolidated)
InterimAnnual
Capital Adequacy Ratio of Bank Holding Company under Article 52-25 of the Banking Law" (the Notification of the Financial Services Agency No. 20, 2006). For the fiscal year ended March 31, 2006, the "Risk-adjusted Capital Ratio" was computed in accordance with the Notification of
93,263.1686,274.7089,842.27
79,851.45 57,075.34
86,795.08
May 23, 2007
8306
June 28, 2007June 28, 2007
URL http://www.mufg.jp/
June 28, 2007
Net Income per Common Share
Cash Flows fromFinancing Activities
Dividend rate forTotal Net Assets(Consolidated)
Total Dividends
(Annual)%
58,604
(31.0)yen
33,900.14%
800,000 (9.2)
%
700,000 5.51,500,000 2.9
million yen million yen350,0003,300,000
%
16.26,700,000 9.9
million yen
million yen
Total Assets
8,520,265
Net IncomeOrdinary Income Ordinary Profit
Yen
18.0
Yen
111,812
Yen7.5
12.71.01.5
%
7,000.0011,000.00
Cash Flows fromOperating Activities
4.54.1
187,281,022187,046,793
10,523,7007,727,837
(154,096) 5,499,161
million yen
Cash Flows fromInvesting Activities at the end of the fiscal year
2,961,153million yen million yen
573,218
Dividends per Common Share
Annual
77,596.86
(preliminary)
3,847,452 (277,474) 6,238,548
12.5412.20
(319,199)
million yen
million yen
(Amounts of less than one million yen are rounded down.)
Cash and Cash Equivalents
801,320.41692,792.39
Total Net Assetsper Common Share (*1)
4,474
13.6 0.7 25.1
1,707.8
( % represents the difference from the previous period)
yen
Interim
(4,405,492)(7,731,543)
200,419
Year-end
1,446,600
-
0.4 31.9
23.9
yen %
Risk-adjusted CapitalRatio (*2)
15,768
81.714.3880,997
770,7191,457,080
%
Diluted Net Income perCommon Share
411,057355,247
Net Income to Net AssetsAttributable to
MUFG Shareholders
Ordinary Profit to Total Assets
Ordinary Profit toOrdinary Income
127.7
Ordinary Income
4,293,95041.963.4
6,094,033
FYE Mar. 31, 2007 FYE Mar. 31, 2006
million yen million yen
(80,621)
1,078,061
yen
1,113,760
Net Income perCommon Share
11.8
Dividend Payout Ratio
FYE Sep. 30, 2005
million yen
( % represents the difference from the previous period)
% %
0.8
Ordinary Profit Net Income
35.2
million yen
Total Net Assets(*1)
Net Assets Attributable toMUFG Shareholdersto Total Assets (*1)
%million yen
7,000.00 7,000.00 14,000.00
3,000.005,000.00
4,000.006,000.00
As of Mar.31, 2007 As of Mar.31, 2006
1
Mitsubishi UFJ Financial Group, Inc.
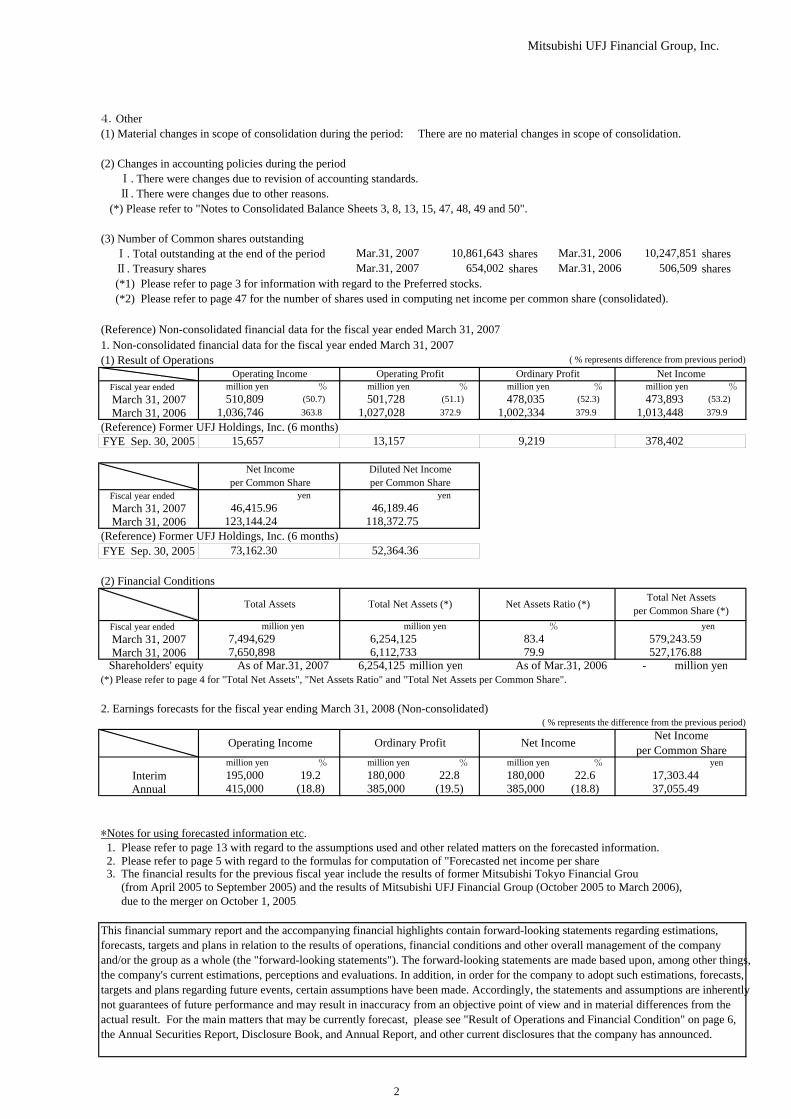
4.Other(1) Material changes in scope of consolidation during the period: There are no material changes in scope of consolidation.
(2) Changes in accounting policies during the period Ⅰ. There were changes due to revision of accounting standards. Ⅱ. There were changes due to other reasons. (*) Please refer to "Notes to Consolidated Balance Sheets 3, 8, 13, 15, 47, 48, 49 and 50".
(3) Number of Common shares outstanding Ⅰ. Total outstanding at the end of the period shares shares Ⅱ. Treasury shares shares shares (*1) Please refer to page 3 for information with regard to the Preferred stocks. (*2) Please refer to page 47 for the number of shares used in computing net income per common share (consolidated).
(Reference) Non-consolidated financial data for the fiscal year ended March 31, 20071. Non-consolidated financial data for the fiscal year ended March 31, 2007(1) Result of Operations
Fiscal year endedMarch 31, 2007March 31, 2006
(Reference) Former UFJ Holdings, Inc. (6 months)FYE Sep. 30, 2005
Fiscal year endedMarch 31, 2007March 31, 2006
(Reference) Former UFJ Holdings, Inc. (6 months)FYE Sep. 30, 2005
(2) Financial Conditions
Fiscal year endedMarch 31, 2007March 31, 2006
million yen(*) Please refer to page 4 for "Total Net Assets", "Net Assets Ratio" and "Total Net Assets per Common Share".
2. Earnings forecasts for the fiscal year ending March 31, 2008 (Non-consolidated)
InterimAnnual
*Notes for using forecasted information etc. 1. Please refer to page 13 with regard to the assumptions used and other related matters on the forecasted information. 2. Please refer to page 5 with regard to the formulas for computation of "Forecasted net income per share" 3. The financial results for the previous fiscal year include the results of former Mitsubishi Tokyo Financial Group (from April 2005 to September 2005) and the results of Mitsubishi UFJ Financial Group (October 2005 to March 2006), due to the merger on October 1, 2005.
510,809
yen
Operating Income
(50.7) 501,728 478,035million yen million yen million yen%
379.9473,893(52.3)
1,036,746
17,303.4437,055.49
46,415.96 46,189.46118,372.75123,144.24
52,364.3673,162.30
This financial summary report and the accompanying financial highlights contain forward-looking statements regarding estimations,forecasts, targets and plans in relation to the results of operations, financial conditions and other overall management of the companyand/or the group as a whole (the "forward-looking statements"). The forward-looking statements are made based upon, among other things,the company's current estimations, perceptions and evaluations. In addition, in order for the company to adopt such estimations, forecasts,targets and plans regarding future events, certain assumptions have been made. Accordingly, the statements and assumptions are inherentlynot guarantees of future performance and may result in inaccuracy from an objective point of view and in material differences from theactual result. For the main matters that may be currently forecast, please see "Result of Operations and Financial Condition" on page 6,the Annual Securities Report, Disclosure Book, and Annual Report, and other current disclosures that the company has announced.
million yenShareholders' equity
million yen million yen
( % represents the difference from the previous period)
As of Mar.31, 2006
%%
Operating Profit Ordinary Profit
378,402
Diluted Net Income
million yen(51.1)
Total Net Assetsper Common Share (*)
%
%
10,861,643Mar.31, 2007Mar.31, 2007
Mar.31, 2006Mar.31, 2006654,002
10,247,851506,509
(53.2)379.9
( % represents difference from previous period)
1,013,448
%
Net Income%
yen
579,243.59527,176.88
385,000 (18.8)180,000 22.6
83.479.9
-
180,000 22.8385,000 (19.5)
195,000%
19.2415,000 (18.8)
million yen
Operating Income Ordinary Profit Net Income Net Incomeper Common Share
15,657 13,157
363.8 1,027,028 372.9
9,219
1,002,334
yen
Net Assets Ratio (*)
yen
Net Incomeper Common Share per Common Share
As of Mar.31, 20077,650,898 6,112,733
Total Assets Total Net Assets (*)
7,494,629million yen million yen
6,254,125
6,254,125
2
Mitsubishi UFJ Financial Group, Inc.
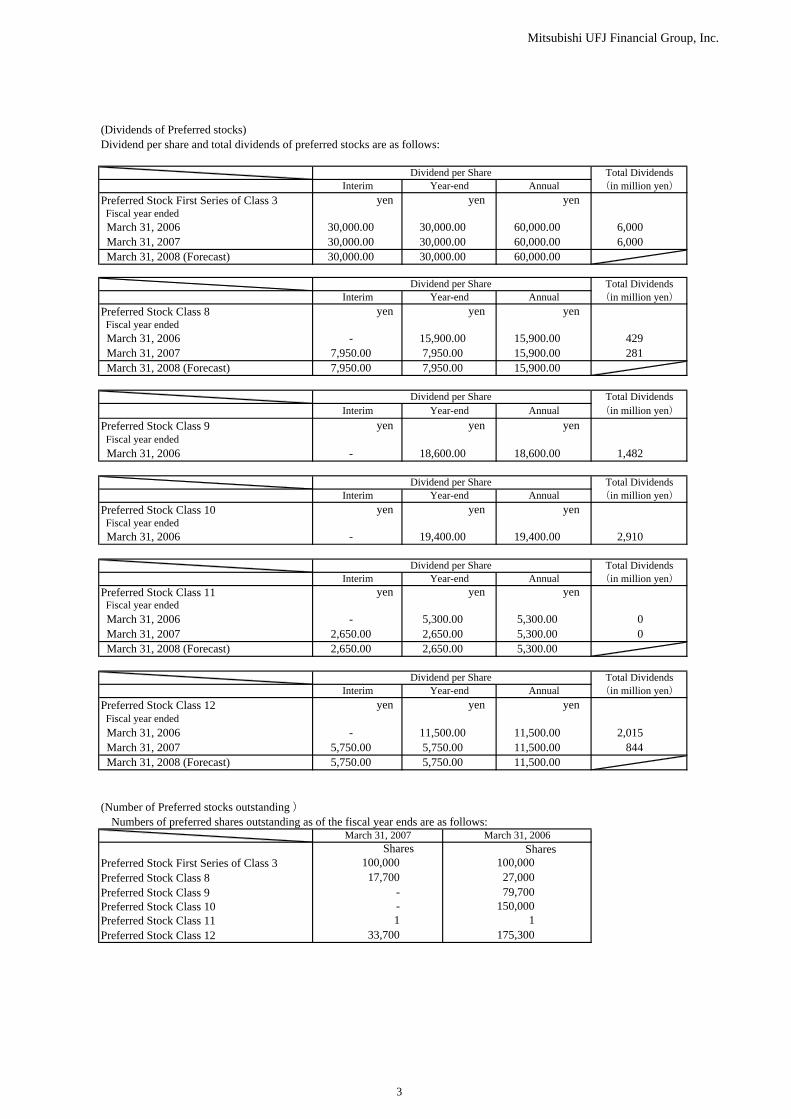
(Dividends of Preferred stocks)Dividend per share and total dividends of preferred stocks are as follows:
Preferred Stock First Series of Class 3
Preferred Stock Class 8
Preferred Stock Class 9
Preferred Stock Class 10
Preferred Stock Class 11
Preferred Stock Class 12
(Number of Preferred stocks outstanding ) Numbers of preferred shares outstanding as of the fiscal year ends are as follows:
SharesPreferred Stock First Series of Class 3Preferred Stock Class 8Preferred Stock Class 9Preferred Stock Class 10Preferred Stock Class 11Preferred Stock Class 12
11,500.00
- 11,500.00 11,500.005,750.00
- 5,300.00 5,300.002,650.00 2,650.00 5,300.00
- 18,600.00 18,600.00
- 19,400.00 19,400.00
yen
Dividend per Share Annual
7,950.00 7,950.00 15,900.007,950.00 7,950.00 15,900.00
60,000.0060,000.00
- 15,900.00 15,900.00
30,000.0030,000.00
yen
30,000.0030,000.00
Interim AnnualTotal Dividends
yenyenYear-end
30,000.00 30,000.00 60,000.00
yen
Dividend per Share Interim
yen yen
0
Total Dividends(in million yen)
6,000
(in million yen)
6,000
(in million yen)
429281
yen
2,910
0
Total Dividends
1,482
Interim Year-end Annual (in million yen)
yen yen
1
100,00017,700
100,00027,000
33,7001
175,300
yen
Shares
--
79,700150,000
Dividend per Share
yen yen
Year-end Annual
Dividend per Share Total Dividends
Interim Year-endyen yen
Dividend per Share Total Dividends
2,650.00 2,650.00 5,300.00
(in million yen)yen yen yen
AnnualInterim Year-end
2,015844
March 31, 2007 March 31, 2006
5,750.00 11,500.005,750.00 5,750.00
Dividend per Share Total DividendsInterim Year-end Annual (in million yen)
Fiscal year ended March 31, 2006 March 31, 2007 March 31, 2008 (Forecast)
Fiscal year ended March 31, 2006 March 31, 2007 March 31, 2008 (Forecast)
Fiscal year ended March 31, 2006
Fiscal year ended March 31, 2006
Fiscal year ended March 31, 2006 March 31, 2007 March 31, 2008 (Forecast)
Fiscal year ended March 31, 2006 March 31, 2007 March 31, 2008 (Forecast)
3
Mitsubishi UFJ Financial Group, Inc.
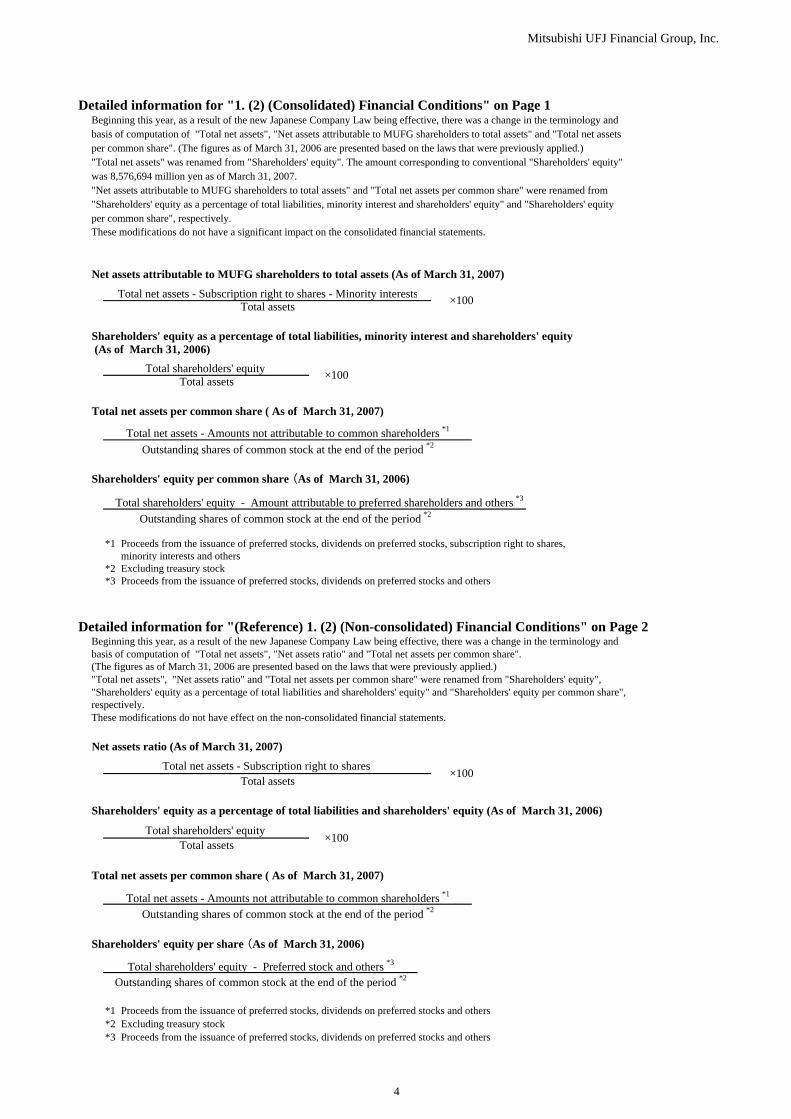
Detailed information for "1. (2) (Consolidated) Financial Conditions" on Page 1Beginning this year, as a result of the new Japanese Company Law being effective, there was a change in the terminology andbasis of computation of "Total net assets", "Net assets attributable to MUFG shareholders to total assets" and "Total net assetsper common share". (The figures as of March 31, 2006 are presented based on the laws that were previously applied.)"Total net assets" was renamed from "Shareholders' equity". The amount corresponding to conventional "Shareholders' equity"was 8,576,694 million yen as of March 31, 2007."Net assets attributable to MUFG shareholders to total assets" and "Total net assets per common share" were renamed from "Shareholders' equity as a percentage of total liabilities, minority interest and shareholders' equity" and "Shareholders' equity per common share", respectively. These modifications do not have a significant impact on the consolidated financial statements.
Net assets attributable to MUFG shareholders to total assets (As of March 31, 2007)
Shareholders' equity as a percentage of total liabilities, minority interest and shareholders' equity (As of March 31, 2006)
Total net assets per common share ( As of March 31, 2007)
Total net assets - Amounts not attributable to common shareholders *1
Outstanding shares of common stock at the end of the period *2
Shareholders' equity per common share (As of March 31, 2006)
Outstanding shares of common stock at the end of the period *2
*1 Proceeds from the issuance of preferred stocks, dividends on preferred stocks, subscription right to shares, minority interests and others
*2 Excluding treasury stock *3 Proceeds from the issuance of preferred stocks, dividends on preferred stocks and others
Detailed information for "(Reference) 1. (2) (Non-consolidated) Financial Conditions" on Page 2Beginning this year, as a result of the new Japanese Company Law being effective, there was a change in the terminology andbasis of computation of "Total net assets", "Net assets ratio" and "Total net assets per common share".(The figures as of March 31, 2006 are presented based on the laws that were previously applied.)"Total net assets", "Net assets ratio" and "Total net assets per common share" were renamed from "Shareholders' equity", "Shareholders' equity as a percentage of total liabilities and shareholders' equity" and "Shareholders' equity per common share", respectively. These modifications do not have effect on the non-consolidated financial statements.
Net assets ratio (As of March 31, 2007)
Shareholders' equity as a percentage of total liabilities and shareholders' equity (As of March 31, 2006)
Total net assets per common share ( As of March 31, 2007)
Total net assets - Amounts not attributable to common shareholders *1
Outstanding shares of common stock at the end of the period *2
Shareholders' equity per share (As of March 31, 2006)
Total shareholders' equity - Preferred stock and others *3
Outstanding shares of common stock at the end of the period *2
*1 Proceeds from the issuance of preferred stocks, dividends on preferred stocks and others*2 Excluding treasury stock *3 Proceeds from the issuance of preferred stocks, dividends on preferred stocks and others
Total net assets - Subscription right to shares - Minority interests ×100Total assets
Total shareholders' equity
×100
×100
×100
Total assets
Total shareholders' equity Total assets
Total net assets - Subscription right to shares Total assets
Total shareholders' equity - Amount attributable to preferred shareholders and others *3
4

Mitsubishi UFJ Financial Group, Inc.
As announced on January 31, 2007, subject to the approval of the amendments of the articles of incorporation at the annual general meeting of shareholders, MUFG will adopt a 1,000 for 1 common stock split that will be effective on September 30, 2007. Dividends per common share after the stock split will be as follows: Interim yen
Annual yen
In addition to the stock split, MUFG will make Mitsubishi UFJ Securities Co., Ltd. a wholly-owned subsidiaryby using the share exchange that will be effective on September 30, 2007."Dividend payout ratio (consolidated )" will be 18.5% on the assumption that the stock split and the share exchange will be effective as of April 1, 2007 .
Formulas for computing "Earnings forecasts for the fiscal year ending March 31, 2008 (Consolidated )" and "Earnings forecasts for the fiscal year ending March 31, 2008 (Non-consolidated )"
Forecasted net income per common share (Consolidated)
*1 Excluding treasury shares
As announced on January 31, 2007, subject to the approval of the amendments of the articles of incorporation at the annual general meeting of shareholders, MUFG will adopt a 1,000 for 1 common stock split that will be effective on September 30, 2007. In addition to the stock split, MUFG will make Mitsubishi UFJ Securities Co., Ltd. a wholly-owned subsidiaryby using the share exchange that will be effective on September 30, 2007."Forecasted net income per share" as of September 30, 2007 and March 31, 2008 that are computed by using the "Forecasted average number of shares outstanding during the period (excluding the treasury shares)" as the denominatorof the above formula on the assumption that the stock split and the share exchange will be effective as of April 1, 2007 are as follows:
Forecasted net income per share as of September 31, 2007Forecasted net income per share as of March 31, 2008
Forecasted net income per common share (Non-consolidated)
*1 Excluding treasury shares
As announced on January 31, 2007, subject to the approval of the amendments of the articles of incorporation at the annual general meeting of shareholders, MUFG will adopt a 1,000 for 1 common stock split that will be effective on September 30, 2007. In addition to the stock split, MUFG will make Mitsubishi UFJ Securities Co., Ltd. a wholly-owned subsidiaryby using the share exchange that will be effective on September 30, 2007."Forecasted net income per share" as of September 30, 2007 and March 31, 2008 that are computed by using the "Forecasted average number of shares outstanding during the period (excluding the treasury shares)" as the denominatorof the above formula on the assumption that the stock split and the share exchange will be effective as of April 1, 2007 are as follows:
Forecasted net income per share as of September 31, 2007Forecasted net income per share as of March 31, 2008
Outstanding shares of common stock at the end of the period *1
7.0014.00
Detailed information of "2. Dividends on Common stock" on Page 1
Forecasted net income - Forecasted total dividends on preferred stocks
36.04 yen
yen
Forecasted net income - Forecasted total dividends on preferred stocksOutstanding shares of common stock at the end of the period *1
16.83 yen
33.0075.54 yen
5

Mitsubishi UFJ Financial Group, Inc.
6
1. Result of Operations and Financial Condition (1) Result of operations
With respect to the economic and financial environment for the fiscal year ended March 31, 2007, overseas economies generally remained firm as seen in China’s continued strong growth led by exports, despite the slowdown of the United States economy. In Japan, while the overall momentum slightly weakened toward the fiscal year-end, exports and capital investments continued to rise along with solid corporate earnings and moderate improvement in personal consumption. Consumer prices followed a very modest upward trend. In the financial environment, the U.S. federal funds target rate was raised to 5.25 percent, and the European Central Bank raised its key policy rate to 3.75 percent in the euro-zone. The Bank of Japan’s additional short-term rate hike in February 2007, following the termination of its zero-interest rate policy in July 2006, has led to slightly increased upward pressure on Japan’s short-term market interest rates. In the long-term interest rate market, the yield on ten-year Japanese government bonds rose temporarily before the zero-interest rate policy was lifted, but has since basically followed a downward trend with some fluctuation. In the foreign exchange market, while there were some temporary swings towards a stronger yen against the dollar from increased concerns in the market regarding the U.S. economic outlook, the yen generally weakened against the dollar reflecting factors such as interest rate gaps between the United States and Japan. Amidst this environment, consolidated net income was ¥880.9 billion, an increase of ¥110.2 billion compared to the previous fiscal year. This increase was primarily due to the following factors. Note: The financial results for the previous fiscal year include the results of former Mitsubishi
Tokyo Financial Group (from April 2005 to September 2005) and the results of Mitsubishi UFJ Financial Group (October 2005 to March 2006) , due to the merger on October 1, 2005.
Ordinary profit by business segment was; ¥1,127.4 billion for the banking segment, ¥273.0 billion
for the trust banking segment, ¥70.5 billion for the securities segment and ¥23.3 billion for the credit card segment. Ordinary profit by geographic segment was; ¥1,221.5 billion in Japan, ¥149.4 billion in North America, ¥14.9 billion in Europe and the Middle East, ¥72.6 billion in Asia and Oceania excluding Japan and ¥42.4 billion in Latin America. The Company has the following earning forecasts for the fiscal year ending March 31, 2008.
Consolidated ordinary income Consolidated ordinary profit Consolidated net income
¥6,700.0 billion ¥1,500.0 billion ¥800.0 billion

Mitsubishi UFJ Financial Group, Inc.
7
(Reference) 1. Forecasted net income per common share (Consolidated): ¥77,596.85 2. Forecasted net income per common share (Non-consolidated) ¥37,055.49 3. Forecasted dividends per share
Common stock: ¥14,000.00 Preferred stock First series of class 3: ¥60,000.00 Preferred stock class 8: ¥15,900.00 Preferred stock class 11: ¥5,300.00 Preferred stock class 12: ¥11,500.00
(2) Financial condition Total assets increased by ¥234.2 billion from March 31, 2006 to ¥187,281.0 billion at March 31, 2007, and total net assets increased by ¥697.3 billion to ¥10,523.7 billion compared to the aggregate amount of minority interest and shareholders' equity at March 31, 2006. With regards to major factors affecting the change in total net assets, retained earnings increased by ¥776.2 billion, while treasury stock increased by ¥227.5 billion due to the repayment of public funds etc. With regards to assets, loans and bills discounted decreased by ¥931.1 billion from March 31, 2006 to ¥84,831.9 billion at March 31, 2007. This change in balance, on the basis of the sum of the two major subsidiary banks, mainly consisted of a decrease in domestic lending by ¥3,418.1 billion (of which housing loans decrease by ¥1,047.0 billion) from March 31, 2006, and an increase in lending mainly by overseas branches by ¥1,525.0 billion. Investment securities decreased by ¥301.3 billion, from March 31, 2006 to ¥48,207.6 billion at March 31, 2007. For the fiscal year ended March 31, 2007, net cash used in operating activities were ¥4,405.4 billion, net cash provided by investing activities were ¥1,446.6 billion and net cash used in financing activities were ¥319.1 billion. As a result, the balance of cash and cash equivalents at March 31, 2007 was ¥2,961.1 billion. The Company’s consolidated risk-adjusted capital ratio based on the Basel 2 Standards was 12.54 % (Preliminary basis) as of March 31, 2007. The following table shows the Company’s consolidated risk adjusted capital ratio as of March 31, 2006, September 30, 2006 and March 31, 2007.

Mitsubishi UFJ Financial Group, Inc.
8
(in billions of yen)
As of March 31, 2006 As of September 30,
2006
As of March 31, 2007
(Preliminary basis) Tier I capital 7,501.6 7,682.1 8,054.8Qualified Tier II capital 6,293.7 6,076.2 5,717.9Qualified Tier III capital - - -Deductions from total qualifying capital 334.9 296.2 428.3Net qualifying capital 13,460.3 13,462.0 13,344.4Risk-adjusted assets 110,292.6 112,567.5 106,395.5Risk-adjusted capital ratio 12.20% 11.95% 12.54%
Beginning from March 31, 2007, risk-adjusted capital ratio is computed in accordance with the Notification of the Financial Services Agency No.20, 2006. For March 31, 2006 and September 30, 2006, risk-adjusted capital ratio was computed in accordance with the Notification of the Ministry of Finance No.62, 1998.
(3) Basic policy regarding profit distribution and dividends for fiscal year 2006 and 2007 The Company considers the return of earnings to shareholders to be one of the most important management priorities and makes it a basic policy to make an effort to continuously increase dividends while sustaining the growth of its corporate value and further strengthening its corporate financial standing. From a medium term perspective, MUFG will aim to increase the dividend ratio to the consolidated net income to approximately 20%, after comprehensive consideration of the business performance and environment for strategic investment, etc.
Based on this policy, the Company, with respect to the year-end dividends for common stock for fiscal year 2006, plans to pay ¥6,000 per share. In this case, the dividends for fiscal year 2006, including the interim dividends of ¥5,000, will total ¥11,000 per share, which is an increase of ¥4,000 from the total dividends of ¥7,000 paid for the previous fiscal year. With respect to the year-end dividends for preferred stock for fiscal year 2006, the Company plans to pay,: for first series of class 3 preferred stock, the prescribed amount of ¥30,000 per share (which, together with the interim dividend, shall result in a total of ¥60,000 per share for the fiscal year); for class 8 preferred stock, the prescribed amount of ¥7,950 per share (which, together with the interim dividend, shall result in a total of ¥15,900 per share for the fiscal year); for class 11 preferred stock, the prescribed amount of ¥2,650 per share (which, together with the interim dividend, shall result in a total of ¥5,300 per share for the fiscal year); and for class 12 preferred stock, the prescribed amount of ¥5,750 per share (which, together with the interim dividend, shall result in a total of ¥11,500 per share for the fiscal year).
Based on this policy, the annual dividend forecast for common stock for fiscal year 2007 is ¥14,000 per share. The annual dividend forecast for preferred stock for fiscal year 2007 are the above-mentioned prescribed amounts respectively, for each class of preferred stock.
Mitsubishi UFJ Financial Group, Inc.
9
(4)Risks relating to the business etc.
Our business and results of operations may be materially affected by a wide range of reasons, including the following factors (which may include information believed to be material to investors):
• Risks relating to the integration of our operation (in particular, risks relating to integration of
our systems); • Risks relating to the establishment of internal controls; • Impairment of our capital ratio; • Changes in interest rates in Japan or elsewhere in the world; • Risks related to our consumer lending business; • Increase of problem loans and credit-related expenses; • Possible negative effects to our equity portfolio; • Risks relating to trading and investment activities; • Downgrade of our credit ratings and the negative effect on our treasury operations; • Failure to achieve certain business plans or operating targets; • Risks accompanying the expansion of our operation and the range of products and services; • Decline in the results of operations and financial conditions of our subsidiaries; • Deterioration of economic conditions in Japan or elsewhere in the world (in Asian, Latin
American and other countries); • Fluctuations in foreign currency exchange rates; • Risks relating to the increase of our pension obligations; • Events that obligate us to compensate for losses in loan trusts and jointly operated designated
money in trusts; • Risks relating to regulatory developments or changes in laws, rules, including accounting rules,
governmental policies and economic controls; • Potential claims or sanctions regarding unfair or inappropriate practices etc. from regulatory
authorities and customers; • Disruption or impairment of our business or operations due to external circumstances or events
(such as the destruction or impairment of our business sites and terrorist attacks); • Risks relating to our capabilities to protect confidential information; • Risks relating to transaction with counterparties in countries designated as state sponsors of
terrorism; • Increase in competitive pressures; • Risks inherent in the holding company structure; and • Possible negative effects related to owning our shares.
For a detailed discussion of these risk factors and other risks, uncertainties, possible changes and others, please see our most recent publicly announced information including the latest Annual Report.
Mitsubishi UFJ Financial Group, Inc.
10
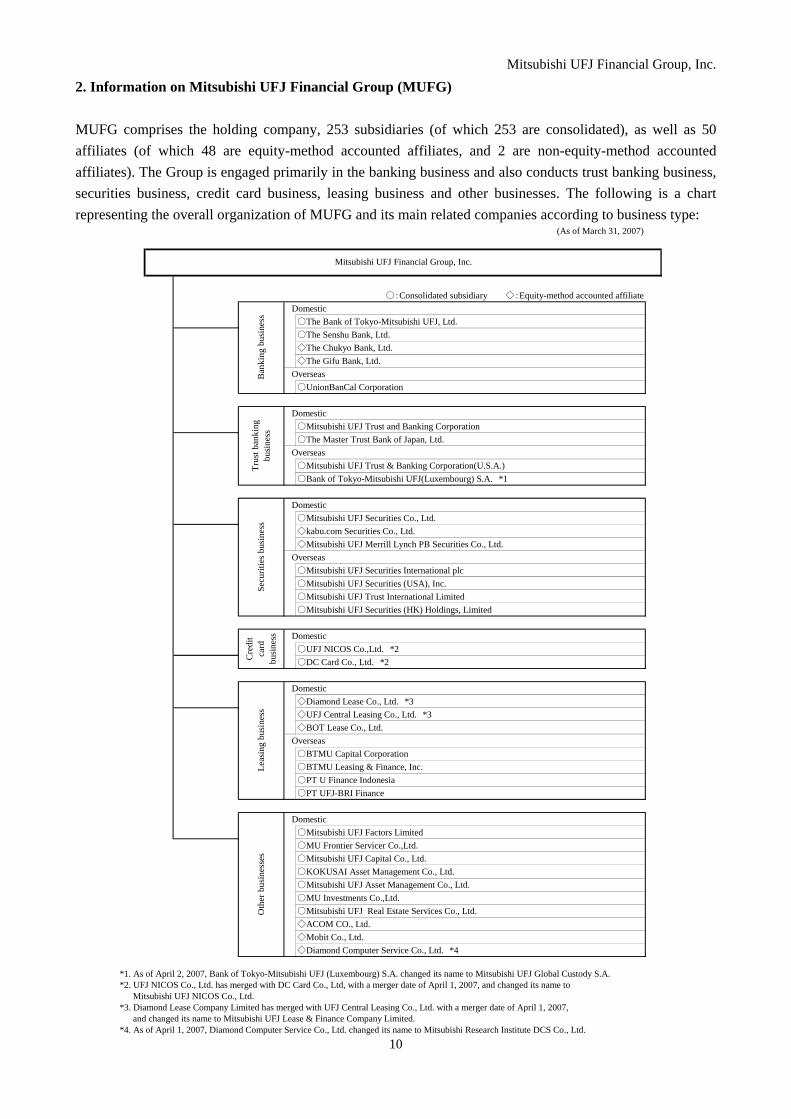
2. Information on Mitsubishi UFJ Financial Group (MUFG) MUFG comprises the holding company, 253 subsidiaries (of which 253 are consolidated), as well as 50 affiliates (of which 48 are equity-method accounted affiliates, and 2 are non-equity-method accounted affiliates). The Group is engaged primarily in the banking business and also conducts trust banking business, securities business, credit card business, leasing business and other businesses. The following is a chart representing the overall organization of MUFG and its main related companies according to business type:
(As of March 31, 2007)
○:Consolidated subsidiary ◇:Equity-method accounted affiliate Domestic
○The Bank of Tokyo-Mitsubishi UFJ, Ltd.○The Senshu Bank, Ltd.◇The Chukyo Bank, Ltd.◇The Gifu Bank, Ltd.
Overseas○UnionBanCal Corporation
Domestic○Mitsubishi UFJ Trust and Banking Corporation○The Master Trust Bank of Japan, Ltd.
Overseas○Mitsubishi UFJ Trust & Banking Corporation(U.S.A.)○Bank of Tokyo-Mitsubishi UFJ(Luxembourg) S.A. *1
Domestic○Mitsubishi UFJ Securities Co., Ltd.◇kabu.com Securities Co., Ltd.◇Mitsubishi UFJ Merrill Lynch PB Securities Co., Ltd.
Overseas○Mitsubishi UFJ Securities International plc○Mitsubishi UFJ Securities (USA), Inc.○Mitsubishi UFJ Trust International Limited○Mitsubishi UFJ Securities (HK) Holdings, Limited
Domestic○UFJ NICOS Co.,Ltd. *2○DC Card Co., Ltd. *2
Domestic◇Diamond Lease Co., Ltd. *3◇UFJ Central Leasing Co., Ltd. *3◇BOT Lease Co., Ltd.
Overseas○BTMU Capital Corporation○BTMU Leasing & Finance, Inc.○PT U Finance Indonesia○PT UFJ-BRI Finance
Domestic○Mitsubishi UFJ Factors Limited○MU Frontier Servicer Co.,Ltd.○Mitsubishi UFJ Capital Co., Ltd.○KOKUSAI Asset Management Co., Ltd.○Mitsubishi UFJ Asset Management Co., Ltd.○MU Investments Co.,Ltd.○Mitsubishi UFJ Real Estate Services Co., Ltd.◇ACOM CO., Ltd.◇Mobit Co., Ltd.◇Diamond Computer Service Co., Ltd. *4
*1. As of April 2, 2007, Bank of Tokyo-Mitsubishi UFJ (Luxembourg) S.A. changed its name to Mitsubishi UFJ Global Custody S.A.*2. UFJ NICOS Co., Ltd. has merged with DC Card Co., Ltd, with a merger date of April 1, 2007, and changed its name to
Mitsubishi UFJ NICOS Co., Ltd.*3. Diamond Lease Company Limited has merged with UFJ Central Leasing Co., Ltd. with a merger date of April 1, 2007,
and changed its name to Mitsubishi UFJ Lease & Finance Company Limited. *4. As of April 1, 2007, Diamond Computer Service Co., Ltd. changed its name to Mitsubishi Research Institute DCS Co., Ltd.
Leas
ing
busi
ness
Bank
ing
busi
ness
Mitsubishi UFJ Financial Group, Inc.Se
curit
ies b
usin
ess
Trus
t ban
king
busi
ness
Cre
dit
card
busi
ness
Oth
er b
usin
esse
s
Mitsubishi UFJ Financial Group, Inc.
11
The business segments of MUFG and its main related companies in the above chart are as follows: Banking: : The Bank of Tokyo-Mitsubishi UFJ, Ltd. / The Senshu Bank, Ltd. / The Chukyo Bank, Ltd. /
The Gifu Bank, Ltd. / kabu.com Securities Co., Ltd. / Mitsubishi UFJ Merrill Lynch PB Securities Co., Ltd. /Diamond Lease Co., Ltd. / UFJ Central Leasing Co., Ltd. / BOT Lease Co., Ltd. / Mitsubishi UFJ Factors Limited /MU Frontier Servicer Co.,Ltd. / KOKUSAI Asset Management Co., Ltd. / Mitsubishi UFJ Asset Management Co., Ltd. / Mobit Co., Ltd. /UnionBanCal Corporation / Bank of Tokyo-Mitsubishi UFJ(Luxembourg) S.A. / PT U Finance Indonesia
Trust banking: : Mitsubishi UFJ Trust and Banking Corporation / The Master Trust Bank of Japan, Ltd. /Mitsubishi UFJ Trust & Banking Corporation(U.S.A.) / Mitsubishi UFJ Trust International Limited
Securities : Mitsubishi UFJ Securities Co., Ltd. /Mitsubishi UFJ Securities International plc / Mitsubishi UFJ Securities (USA), Inc. /Mitsubishi UFJ Securities (HK) Holdings, Limited
Credit card : UFJ NICOS Co.,Ltd. / DC Card Co., Ltd. Other : Mitsubishi UFJ Capital Co., Ltd. / MU Investments Co.,Ltd. / Mitsubishi UFJ Real Estate Services Co., Ltd. /
ACOM CO., Ltd. / Diamond Computer Service Co., Ltd. /BTMU Capital Corporation / BTMU Leasing & Finance, Inc. / PT UFJ-BRI Finance
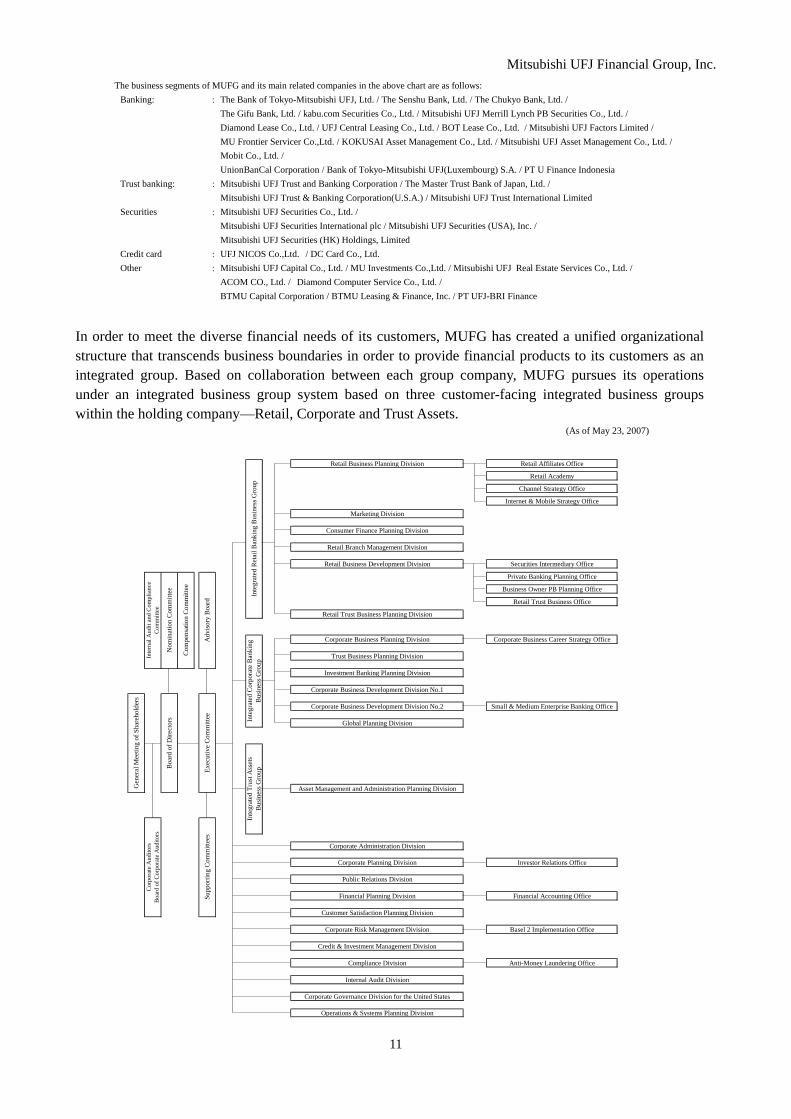
In order to meet the diverse financial needs of its customers, MUFG has created a unified organizational structure that transcends business boundaries in order to provide financial products to its customers as an integrated group. Based on collaboration between each group company, MUFG pursues its operations under an integrated business group system based on three customer-facing integrated business groups within the holding company—Retail, Corporate and Trust Assets.
(As of May 23, 2007)
Retail Business Planning Division Retail Affiliates Office
Retail Academy
Channel Strategy Office
Internet & Mobile Strategy Office
Marketing Division
Consumer Finance Planning Division
Retail Branch Management Division
Retail Business Development Division Securities Intermediary Office
Private Banking Planning Office
Business Owner PB Planning Office
Retail Trust Business Office
Retail Trust Business Planning Division
Corporate Business Planning Division Corporate Business Career Strategy Office
Trust Business Planning Division
Investment Banking Planning Division
Corporate Business Development Division No.1
Corporate Business Development Division No.2 Small & Medium Enterprise Banking Office
Global Planning Division
Asset Management and Administration Planning Division
Corporate Administration Division
Corporate Planning Division Investor Relations Office
Public Relations Division
Financial Planning Division Financial Accounting Office
Customer Satisfaction Planning Division
Corporate Risk Management Division Basel 2 Implementation Office
Credit & Investment Management Division
Compliance Division Anti-Money Laundering Office
Internal Audit Division
Corporate Governance Division for the United States
Operations & Systems Planning Division
Inte
grat
ed C
orpo
rate
Ban
king
Bus
ines
s Gro
upIn
tegr
ated
Ret
ail B
anki
ng B
usin
ess G
roup
Inte
grat
ed T
rust
Ass
ets
Bus
ines
s Gro
upExec
utiv
e C
omm
ittee
Adv
isory
Boa
rdSu
ppor
ting
Com
mitt
ees
Com
pens
atio
n C
omm
ittee
Cor
pora
te A
udito
rsB
oard
of C
orpo
rate
Aud
itors
Boa
rd o
f Dire
ctor
s
Gen
eral
Mee
ting
of S
hare
hold
ers
Inte
rnal
Aud
it an
d C
ompl
ianc
eC
omm
ittee
Nom
inat
ion
Com
mitt
ee
Mitsubishi UFJ Financial Group, Inc.
12
3. Management Policy (1) Principal management policy The Group’s management philosophy serves as the basic policy in conducting its business activities, and provides guidelines for all group activities. The Group’s management philosophy will also be the foundation for management decisions, including the formulation of management strategies and management plans, and will serve as the core values for all employees. The details of the Group management philosophy are set forth below. The Group’s holding company, commercial banks, trust banks and securities companies have adopted the Group’s management philosophy as their own respective management philosophy, and the entire Group will strive to comply with this philosophy.
● Group’s Management Philosophy
1. We will respond promptly and accurately to the diverse needs of our customers around the world and seek to inspire their trust and confidence.
2. We will offer innovative and high-quality financial services by actively pursuing the cultivation of new business areas and developing new technologies.
3. We will comply strictly with all laws and regulations and conduct our business in a fair and transparent manner to gain the public’s trust and confidence.
4. We will seek to inspire the trust of our shareholders by enhancing corporate value through continuous business development and appropriate risk management, and by disclosing corporate information in a timely and appropriate manner.
5. We will contribute to progress toward a sustainable society by assisting with development in the areas in which we operate and conducting our business activities with consideration for the environment.
6. We will provide the opportunities and work environment necessary for all employees to enhance their expertise and make full use of their abilities.
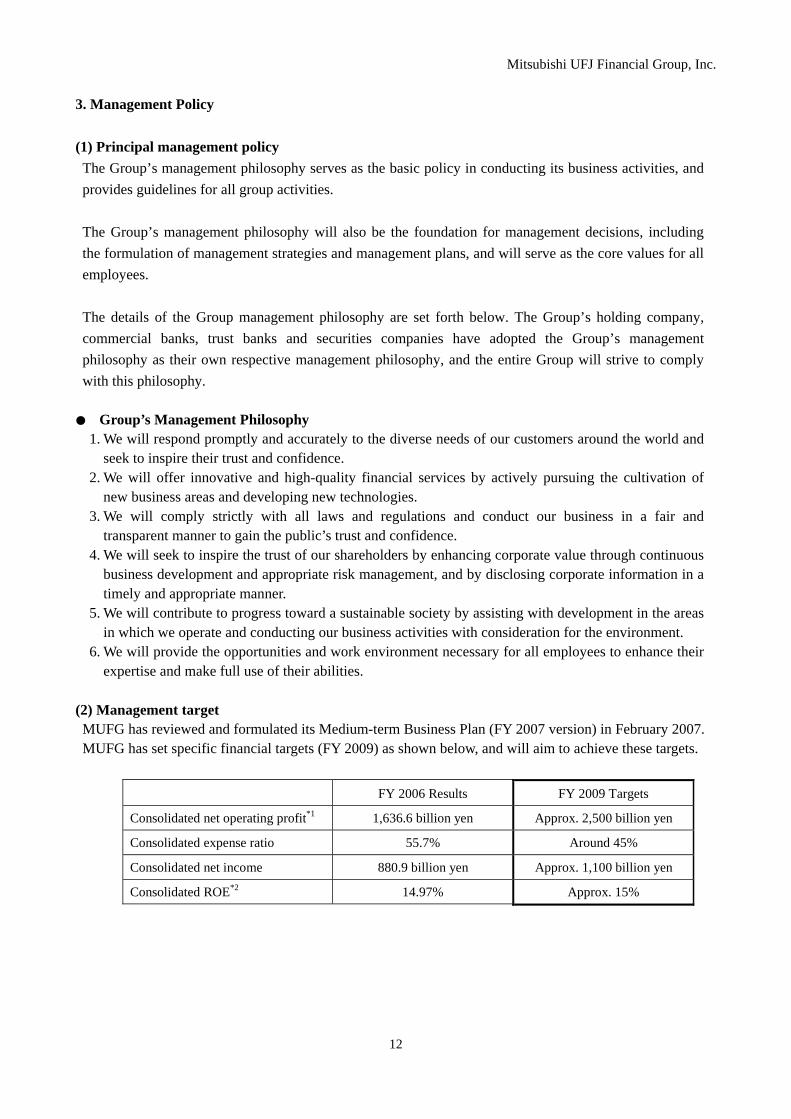
(2) Management target MUFG has reviewed and formulated its Medium-term Business Plan (FY 2007 version) in February 2007. MUFG has set specific financial targets (FY 2009) as shown below, and will aim to achieve these targets.
FY 2006 Results FY 2009 Targets
Consolidated net operating profit*1 1,636.6 billion yen Approx. 2,500 billion yen
Consolidated expense ratio 55.7% Around 45%
Consolidated net income 880.9 billion yen Approx. 1,100 billion yen
Consolidated ROE*2 14.97% Approx. 15%

Mitsubishi UFJ Financial Group, Inc.
13
Macro-economic assumptions underlying the above figures:
FY 2007 FY 2008 FY 2009 Unsecured call rate (period average) 0.6% 1.0% 1.0% 10 year Japanese Government Bond Yield (period average)
2.1% 2.5% 2.5%
Dollar/Yen (value at end of period) ¥115 ¥115 ¥115 Real GDP growth rate (annual rate) 1.8% 2.3% 1.6%
*1 Consolidated net business profits before consolidation adjustments such as elimination of internal
transactions (management accounting basis, before amortization of goodwill) *2
Net income - Annual dividends on nonconvertible preferred stocks{(Total shareholders' equity at the beginning of the period - Number of nonconvertible preferred shares atthe beginning of the period × Issue price + Foreign currency translation adjustments at the beginning of
the period) + (Total shareholders' equity at the end of the period - Number of nonconvertible preferred shares at the end of the period × Issue price + Foreign currency translation adjustments at the end of the period)} / 2
×100
(3) Medium- and long-term management strategy MUFG is a fully-fledged comprehensive financial group comprising commercial banks, trust banks, and securities companies, as well as credit card companies, consumer finance companies, investment trust companies, leasing companies and a U.S. bank (Union Bank of California). The Group aims to unify these Group companies to deliver top quality products and services that meet diverse customer needs. We aim to be No. 1 in service, No.1 in reliability, and No.1 in global coverage and so gain the strong support of customers and society as a premier, comprehensive, global financial group.
No.1 in Service MUFG will leverage its strengths as a comprehensive financial group to provide to its customers with
an outstanding level of high-quality service that is matched to their individual needs. MUFG will fully utilize the integrated business group system comprising our three core business
groups—Retail, Corporate and Trust Assets (asset management and asset administration)—and meet diverse customer needs rapidly and accurately as a unified group that transcends business boundaries.
No.1 in Reliability MUFG aims to be a truly reliable financial group and will strive to further enhance its financial health,
implement thorough legal and other compliance and strengthen internal controls. Moreover, we will fulfill our responsibilities to society through enhancing customer satisfaction (CS), and pursuing CSR activities that contribute to society and to environmental conservation.
No.1 in Global Coverage MUFG aims to use its Group strengths to the maximum, leveraging the leading global network
amongst Japanese banks and talented staff well-versed in the business of each country to swiftly and precisely meet the requirements of customers globally.

Mitsubishi UFJ Financial Group, Inc.
14
(4) Key issues MUFG aims to be a comprehensive financial group that is strongly supported by its customers and by society at large, while from the perspective of enhancing shareholder value we also aspire to be one of the world’s top five financial institutions by market capitalization. In pursuit of these objectives MUFG formulated its Medium-term Business Plan (FY 2007 version) in February 2007. In this plan MUFG has set FY 2009 financial targets for consolidated net operating profit of approximately ¥2.5 trillion, consolidated net income of approximately ¥1.1 trillion, and consolidated ROE of approximately 15% in FY2009. MUFG will pursue the following four key strategies.
(Growth strategy) MUFG aims to increase profits in its three core businesses (Retail, Corporate, and Trust Assets), with a particular focus on Retail, and build an optimal business portfolio for sustainable growth by strengthening risk/return management. In FY 2009 we aim for the Retail business to contribute over 30% of total net operating profit, and in overseas business we aim to expand business by pursuing an investment and alliance strategy, significantly strengthen profits, and from the perspective of improved risk/return management we intend to conduct a thorough review of our business model and resource allocation. In support of our growth strategy we will aim to raise MUFG’s corporate value by pursuing a balanced capital policy comprising three elements: the utilization of capital to maintain growth and enhance profitability; the strengthening of equity capital; and enhancing shareholder returns. For equity capital, at the end of FY 2009 we are targeting a Tier 1 ratio of 8% (at the end of FY 2006 7.57%) and an equity capital ratio of 12% (at the end of FY 2006 12.54%). In regard to returns to shareholders we will strive to increase dividends in a sustainable manner, while over the medium term, we will work to raise the dividend payout ratio to around 20% of consolidated net income (FY 2006 planned payout ratio is 12.7%). Moreover, subject to approval by the General Meeting of Shareholders of amendments to our Articles of Incorporation, we plan to reduce the minimum stock investment unit with respect to MUFG’s common shares through a stock split and the adoption of a unit share system.
(Strengthening compliance) We take very seriously our receipt of administrative orders in Japan and the United States, and we will strengthen and improve the entire Group’s business administration and internal control frameworks, and legal and other compliance, and seek to rapidly restore trust in the Group. MUFG is already steadily implementing measures to strengthen business administration at each Group company and, specifically, we have appointed an independent Chief Compliance Officer (CCO) in the holding company and established a Group CCO Committee, chaired by the holding company CCO and comprising the Chief Compliance Officers of each Group company. Improving our compliance is our top priority issue and we are fully committed to this task.
(Completion of full-scale systems integration and steady realization of benefits of integration) Considering the potentially large effects of the full-scale integration of the systems of Group banks on our service to customers and on the financial system, and in full recognition of the Group’s social

Mitsubishi UFJ Financial Group, Inc.
15
responsibilities we are taking the greatest care to achieve safe and secure integration. The project to achieve full integration is progressing according to plan and by FY 2008 we plan to steadily shift to operations under the new system. Through transferring to the new system we aim to enhance services and steadily realize cost synergies.
(Maintaining and strengthening MUFG brand) Through the provision of the highest quality services MUFG will seek to enhance customer satisfaction while also pursuing management with a clear emphasis on its corporate social responsibilities. As part of our initiative to improve customer satisfaction, in FY 2006 we made certain bank transfers commission free, introduced measures to reduce waiting times at branches, and made our facilities easier to use for senior customers. Regarding CSR activities, we continued to actively pursue efforts to contribute to society through our core financial business, for example by implementing environment-related financing and providing SRI funds, while we were also active in providing childcare facilities and inviting children to experience new things through the MUFG Experience Workshop. Looking ahead, based on our slogan ‘No. 1 in service, No. 1 in reliability, No. 1 in global coverage’ we aim to build the MUFG brand as one that is broadly supported and appreciated by society.
Mitsubishi UFJ Financial Group, Inc.(Japanese GAAP)
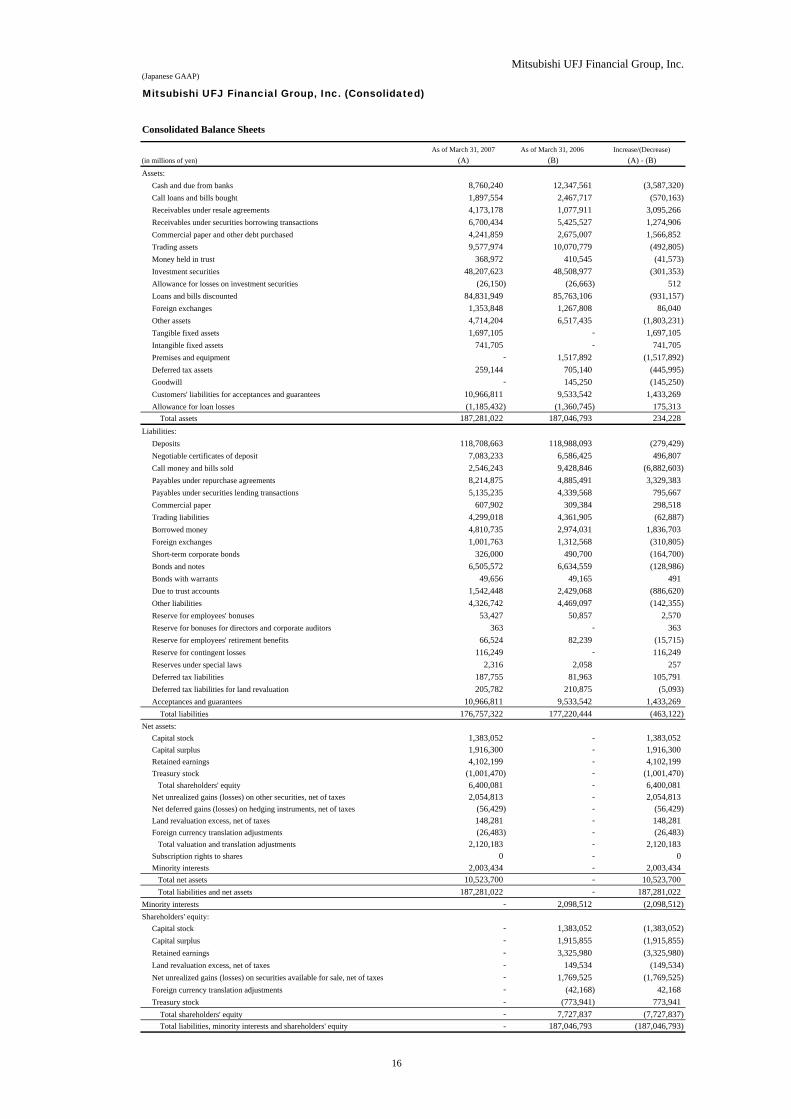
As of March 31, 2007 As of March 31, 2006 Increase/(Decrease)(in millions of yen) (A) (B) (A) - (B)Assets:
Cash and due from banks 8,760,240 12,347,561 (3,587,320)Call loans and bills bought 1,897,554 2,467,717 (570,163)Receivables under resale agreements 4,173,178 1,077,911 3,095,266Receivables under securities borrowing transactions 6,700,434 5,425,527 1,274,906Commercial paper and other debt purchased 4,241,859 2,675,007 1,566,852Trading assets 9,577,974 10,070,779 (492,805)Money held in trust 368,972 410,545 (41,573)Investment securities 48,207,623 48,508,977 (301,353)Allowance for losses on investment securities (26,150) (26,663) 512Loans and bills discounted 84,831,949 85,763,106 (931,157)Foreign exchanges 1,353,848 1,267,808 86,040Other assets 4,714,204 6,517,435 (1,803,231)Tangible fixed assets 1,697,105 - 1,697,105Intangible fixed assets 741,705 - 741,705Premises and equipment - 1,517,892 (1,517,892)Deferred tax assets 259,144 705,140 (445,995)Goodwill - 145,250 (145,250)Customers' liabilities for acceptances and guarantees 10,966,811 9,533,542 1,433,269Allowance for loan losses (1,185,432) (1,360,745) 175,313 Total assets 187,281,022 187,046,793 234,228
Liabilities:Deposits 118,708,663 118,988,093 (279,429)Negotiable certificates of deposit 7,083,233 6,586,425 496,807Call money and bills sold 2,546,243 9,428,846 (6,882,603)Payables under repurchase agreements 8,214,875 4,885,491 3,329,383Payables under securities lending transactions 5,135,235 4,339,568 795,667Commercial paper 607,902 309,384 298,518Trading liabilities 4,299,018 4,361,905 (62,887)Borrowed money 4,810,735 2,974,031 1,836,703Foreign exchanges 1,001,763 1,312,568 (310,805)Short-term corporate bonds 326,000 490,700 (164,700)Bonds and notes 6,505,572 6,634,559 (128,986)Bonds with warrants 49,656 49,165 491Due to trust accounts 1,542,448 2,429,068 (886,620)Other liabilities 4,326,742 4,469,097 (142,355)Reserve for employees' bonuses 53,427 50,857 2,570Reserve for bonuses for directors and corporate auditors 363 - 363Reserve for employees' retirement benefits 66,524 82,239 (15,715)Reserve for contingent losses 116,249 - 116,249Reserves under special laws 2,316 2,058 257Deferred tax liabilities 187,755 81,963 105,791Deferred tax liabilities for land revaluation 205,782 210,875 (5,093)Acceptances and guarantees 10,966,811 9,533,542 1,433,269 Total liabilities 176,757,322 177,220,444 (463,122)
Net assets:Capital stock 1,383,052 - 1,383,052Capital surplus 1,916,300 - 1,916,300Retained earnings 4,102,199 - 4,102,199Treasury stock (1,001,470) - (1,001,470) Total shareholders' equity 6,400,081 - 6,400,081Net unrealized gains (losses) on other securities, net of taxes 2,054,813 - 2,054,813Net deferred gains (losses) on hedging instruments, net of taxes (56,429) - (56,429)Land revaluation excess, net of taxes 148,281 - 148,281Foreign currency translation adjustments (26,483) - (26,483) Total valuation and translation adjustments 2,120,183 - 2,120,183Subscription rights to shares 0 - 0Minority interests 2,003,434 - 2,003,434 Total net assets 10,523,700 - 10,523,700 Total liabilities and net assets 187,281,022 - 187,281,022
Minority interests - 2,098,512 (2,098,512)Shareholders' equity:
Capital stock - 1,383,052 (1,383,052)Capital surplus - 1,915,855 (1,915,855)Retained earnings - 3,325,980 (3,325,980)Land revaluation excess, net of taxes - 149,534 (149,534)Net unrealized gains (losses) on securities available for sale, net of taxes - 1,769,525 (1,769,525)Foreign currency translation adjustments - (42,168) 42,168Treasury stock - (773,941) 773,941 Total shareholders' equity - 7,727,837 (7,727,837) Total liabilities, minority interests and shareholders' equity - 187,046,793 (187,046,793)
Consolidated Balance Sheets
Mitsubishi UFJ Financial Group, Inc. (Consolidated)
16

Mitsubishi UFJ Financial Group, Inc.
(Japanese GAAP)
Mitsubishi UFJ Financial Group, Inc. (Consolidated)
Consolidated Statements of Operations
For the fiscal year ended For the fiscal year ended Increase/ (Decrease)
(in millions of yen) March 31,2007 (A) March 31,2006 (B) (A) - (B)
Ordinary income:
Interest income: 3,514,976 2,365,923 1,149,052
(Interest on loans and bills discounted) 2,123,825 1,411,124 712,700
(Interest and dividends on securities) 778,295 598,194 180,101
Trust fees 152,945 122,898 30,047
Fees and commissions 1,330,617 1,000,853 329,763
Trading profits 315,042 148,524 166,518
Other business income 331,646 391,226 (59,579)
Other ordinary income 448,805 264,524 184,281
Total ordinary income 6,094,033 4,293,950 1,800,083
Ordinary expenses:
Interest expenses: 1,613,422 884,422 728,999
(Interest on deposits) 732,883 414,861 318,022
Fees and commissions 171,993 117,058 54,934
Trading losses - 1,113 (1,113)
Other business expenses 136,050 170,456 (34,405)
General and administrative expenses 2,111,754 1,663,458 448,295
Other ordinary expenses 603,732 379,380 224,352
Total ordinary expenses 4,636,953 3,215,888 1,421,064
Ordinary profit 1,457,080 1,078,061 379,018
Extraordinary gains 132,123 451,571 (319,447)
Extraordinary losses 80,473 28,535 51,937
Income before income taxes and others 1,508,730 1,501,097 7,633
Income taxes-current 115,091 108,982 6,108
Income taxes-deferred 413,731 525,011 (111,280)
Minority interests 98,910 96,383 2,527
Net income 880,997 770,719 110,277
17
Mitsubishi UFJ Financial Group, Inc.(Japanese GAAP)
Mitsubishi UFJ Financial Group, Inc. (Consolidated)
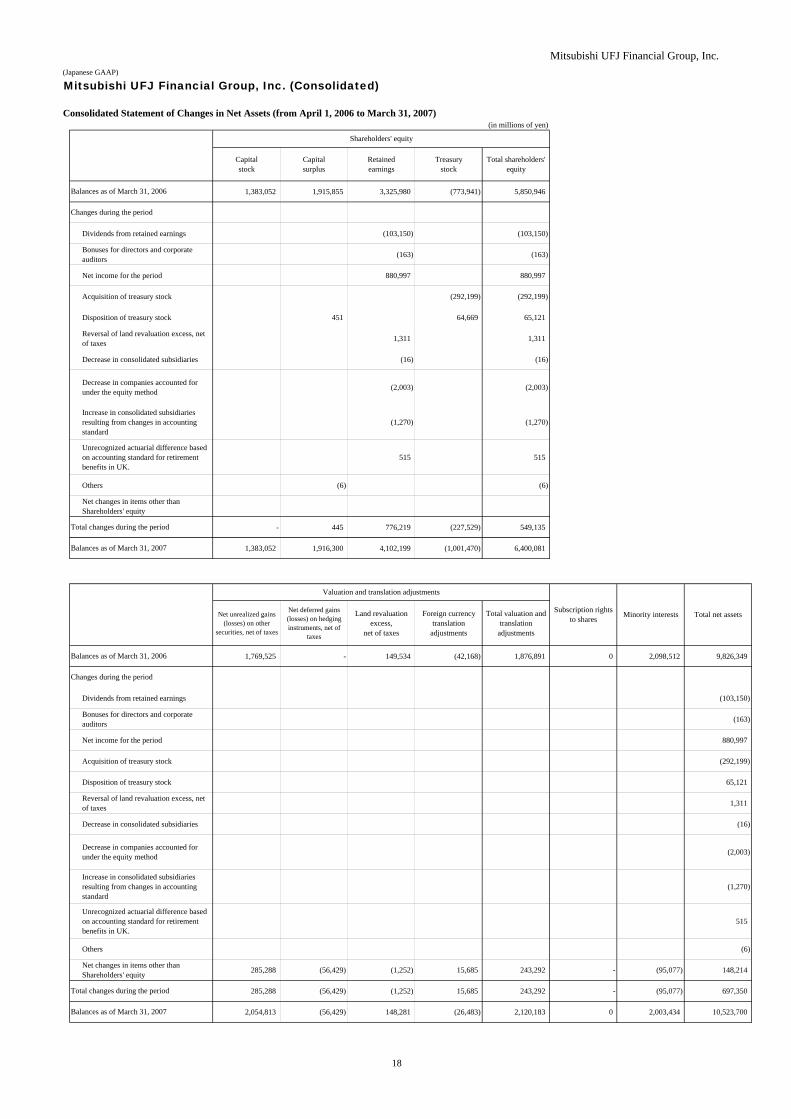
Consolidated Statement of Changes in Net Assets (from April 1, 2006 to March 31, 2007)(in millions of yen)
Capitalstock
Capitalsurplus
Retainedearnings
Treasurystock
Total shareholders'equity
1,383,052 1,915,855 3,325,980 (773,941) 5,850,946
Dividends from retained earnings (103,150) (103,150)
Bonuses for directors and corporateauditors (163) (163)
Net income for the period 880,997 880,997
Acquisition of treasury stock (292,199) (292,199)
Disposition of treasury stock 451 64,669 65,121
Reversal of land revaluation excess, netof taxes 1,311 1,311
Decrease in consolidated subsidiaries (16) (16)
Decrease in companies accounted forunder the equity method (2,003) (2,003)
Increase in consolidated subsidiariesresulting from changes in accountingstandard
(1,270) (1,270)
Unrecognized actuarial difference basedon accounting standard for retirementbenefits in UK.
515 515
Others (6) (6)
Net changes in items other thanShareholders' equity
- 445 776,219 (227,529) 549,135
1,383,052 1,916,300 4,102,199 (1,001,470) 6,400,081
Net unrealized gains(losses) on other
securities, net of taxes
Net deferred gains(losses) on hedginginstruments, net of
taxes
Land revaluationexcess,
net of taxes
Foreign currencytranslation
adjustments
Total valuation andtranslation
adjustments
1,769,525 - 149,534 (42,168) 1,876,891 0 2,098,512 9,826,349
Dividends from retained earnings (103,150)
Bonuses for directors and corporateauditors (163)
Net income for the period 880,997
Acquisition of treasury stock (292,199)
Disposition of treasury stock 65,121
Reversal of land revaluation excess, netof taxes 1,311
Decrease in consolidated subsidiaries (16)
Decrease in companies accounted forunder the equity method (2,003)
Increase in consolidated subsidiariesresulting from changes in accountingstandard
(1,270)
Unrecognized actuarial difference basedon accounting standard for retirementbenefits in UK.
515
Others (6)
Net changes in items other thanShareholders' equity 285,288 (56,429) (1,252) 15,685 243,292 - (95,077) 148,214
285,288 (56,429) (1,252) 15,685 243,292 - (95,077) 697,350
2,054,813 (56,429) 148,281 (26,483) 2,120,183 0 2,003,434 10,523,700
Minority interests Total net assets
Balances as of March 31, 2006
Changes during the period
Valuation and translation adjustments
Subscription rightsto shares
Balances as of March 31, 2007
Total changes during the period
Total changes during the period
Balances as of March 31, 2007
Shareholders' equity
Balances as of March 31, 2006
Changes during the period
18
Mitsubishi UFJ Financial Group, Inc.
(Japanese GAAP)
Mitsubishi UFJ Financial Group, Inc. (Consolidated)
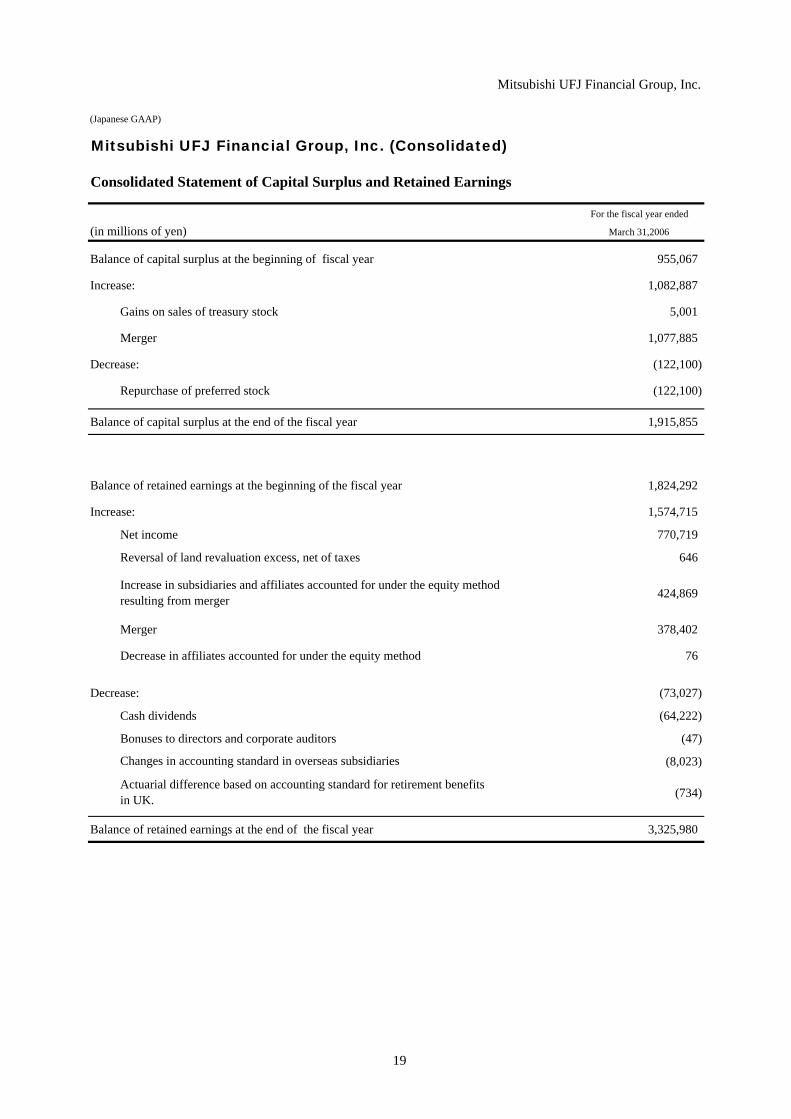
Consolidated Statement of Capital Surplus and Retained Earnings
For the fiscal year ended
(in millions of yen) March 31,2006
Balance of capital surplus at the beginning of fiscal year 955,067
Increase: 1,082,887
Gains on sales of treasury stock 5,001
Merger 1,077,885
Decrease: (122,100)
Repurchase of preferred stock (122,100)
Balance of capital surplus at the end of the fiscal year 1,915,855
Balance of retained earnings at the beginning of the fiscal year 1,824,292
Increase: 1,574,715
Net income 770,719
Reversal of land revaluation excess, net of taxes 646
424,869
Merger 378,402
Decrease in affiliates accounted for under the equity method 76
Decrease: (73,027)
Cash dividends (64,222)
Bonuses to directors and corporate auditors (47)
(8,023)
(734)
Balance of retained earnings at the end of the fiscal year 3,325,980
Actuarial difference based on accounting standard for retirement benefitsin UK.
Changes in accounting standard in overseas subsidiaries
Increase in subsidiaries and affiliates accounted for under the equity methodresulting from merger
19
Mitsubishi UFJ Financial Group, Inc.(Japanese GAAP)
Mitsubishi UFJ Financial Group, Inc. (Consolidated)
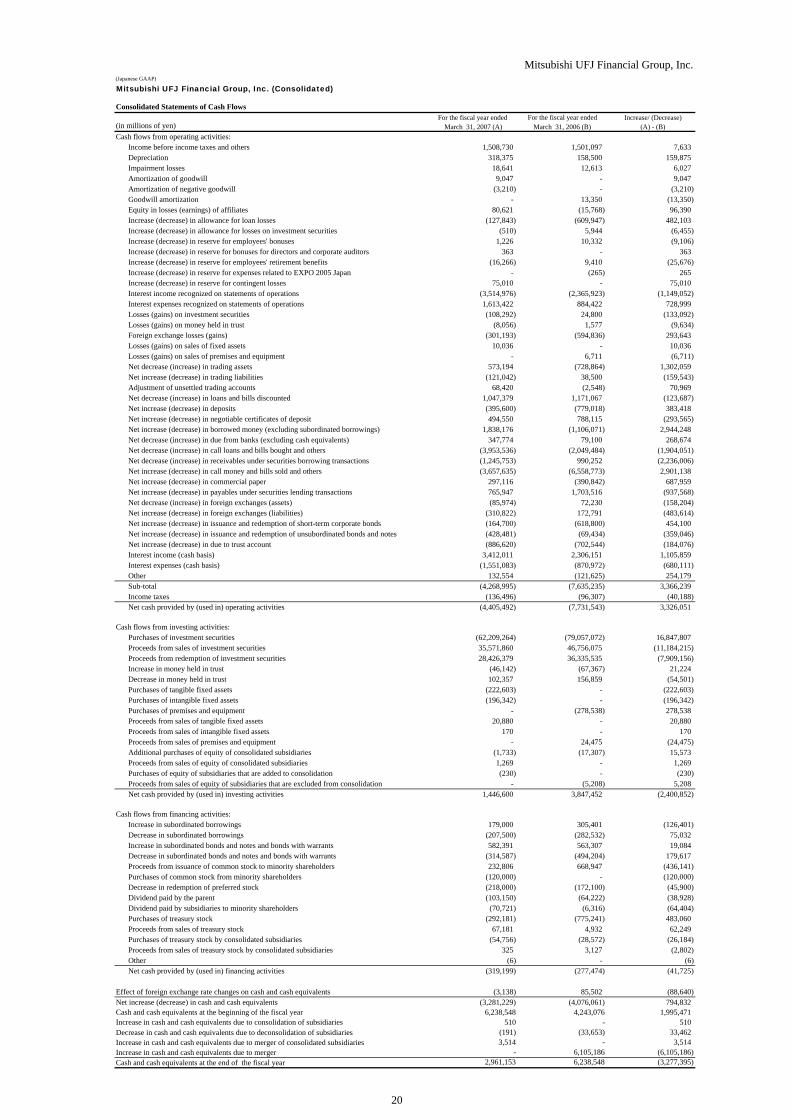
Consolidated Statements of Cash FlowsFor the fiscal year ended For the fiscal year ended Increase/ (Decrease)
March 31, 2007 (A) March 31, 2006 (B) (A) - (B)Cash flows from operating activities:
Income before income taxes and others 1,508,730 1,501,097 7,633Depreciation 318,375 158,500 159,875Impairment losses 18,641 12,613 6,027Amortization of goodwill 9,047 - 9,047Amortization of negative goodwill (3,210) - (3,210)Goodwill amortization - 13,350 (13,350)Equity in losses (earnings) of affiliates 80,621 (15,768) 96,390Increase (decrease) in allowance for loan losses (127,843) (609,947) 482,103Increase (decrease) in allowance for losses on investment securities (510) 5,944 (6,455)Increase (decrease) in reserve for employees' bonuses 1,226 10,332 (9,106)Increase (decrease) in reserve for bonuses for directors and corporate auditors 363 - 363Increase (decrease) in reserve for employees' retirement benefits (16,266) 9,410 (25,676)Increase (decrease) in reserve for expenses related to EXPO 2005 Japan - (265) 265Increase (decrease) in reserve for contingent losses 75,010 - 75,010Interest income recognized on statements of operations (3,514,976) (2,365,923) (1,149,052)Interest expenses recognized on statements of operations 1,613,422 884,422 728,999Losses (gains) on investment securities (108,292) 24,800 (133,092)Losses (gains) on money held in trust (8,056) 1,577 (9,634)Foreign exchange losses (gains) (301,193) (594,836) 293,643Losses (gains) on sales of fixed assets 10,036 - 10,036Losses (gains) on sales of premises and equipment - 6,711 (6,711)Net decrease (increase) in trading assets 573,194 (728,864) 1,302,059Net increase (decrease) in trading liabilities (121,042) 38,500 (159,543)Adjustment of unsettled trading accounts 68,420 (2,548) 70,969Net decrease (increase) in loans and bills discounted 1,047,379 1,171,067 (123,687)Net increase (decrease) in deposits (395,600) (779,018) 383,418Net increase (decrease) in negotiable certificates of deposit 494,550 788,115 (293,565)Net increase (decrease) in borrowed money (excluding subordinated borrowings) 1,838,176 (1,106,071) 2,944,248Net decrease (increase) in due from banks (excluding cash equivalents) 347,774 79,100 268,674Net decrease (increase) in call loans and bills bought and others (3,953,536) (2,049,484) (1,904,051)Net decrease (increase) in receivables under securities borrowing transactions (1,245,753) 990,252 (2,236,006)Net increase (decrease) in call money and bills sold and others (3,657,635) (6,558,773) 2,901,138Net increase (decrease) in commercial paper 297,116 (390,842) 687,959Net increase (decrease) in payables under securities lending transactions 765,947 1,703,516 (937,568)Net decrease (increase) in foreign exchanges (assets) (85,974) 72,230 (158,204)Net increase (decrease) in foreign exchanges (liabilities) (310,822) 172,791 (483,614)Net increase (decrease) in issuance and redemption of short-term corporate bonds (164,700) (618,800) 454,100Net increase (decrease) in issuance and redemption of unsubordinated bonds and notes (428,481) (69,434) (359,046)Net increase (decrease) in due to trust account (886,620) (702,544) (184,076)Interest income (cash basis) 3,412,011 2,306,151 1,105,859Interest expenses (cash basis) (1,551,083) (870,972) (680,111)Other 132,554 (121,625) 254,179Sub-total (4,268,995) (7,635,235) 3,366,239Income taxes (136,496) (96,307) (40,188)Net cash provided by (used in) operating activities (4,405,492) (7,731,543) 3,326,051
Cash flows from investing activities:Purchases of investment securities (62,209,264) (79,057,072) 16,847,807Proceeds from sales of investment securities 35,571,860 46,756,075 (11,184,215)Proceeds from redemption of investment securities 28,426,379 36,335,535 (7,909,156)Increase in money held in trust (46,142) (67,367) 21,224Decrease in money held in trust 102,357 156,859 (54,501)Purchases of tangible fixed assets (222,603) - (222,603)Purchases of intangible fixed assets (196,342) - (196,342)Purchases of premises and equipment - (278,538) 278,538Proceeds from sales of tangible fixed assets 20,880 - 20,880Proceeds from sales of intangible fixed assets 170 - 170Proceeds from sales of premises and equipment - 24,475 (24,475)Additional purchases of equity of consolidated subsidiaries (1,733) (17,307) 15,573Proceeds from sales of equity of consolidated subsidiaries 1,269 - 1,269Purchases of equity of subsidiaries that are added to consolidation (230) - (230)Proceeds from sales of equity of subsidiaries that are excluded from consolidation - (5,208) 5,208Net cash provided by (used in) investing activities 1,446,600 3,847,452 (2,400,852)
Cash flows from financing activities:Increase in subordinated borrowings 179,000 305,401 (126,401)Decrease in subordinated borrowings (207,500) (282,532) 75,032Increase in subordinated bonds and notes and bonds with warrants 582,391 563,307 19,084Decrease in subordinated bonds and notes and bonds with warrants (314,587) (494,204) 179,617Proceeds from issuance of common stock to minority shareholders 232,806 668,947 (436,141)Purchases of common stock from minority shareholders (120,000) - (120,000)Decrease in redemption of preferred stock (218,000) (172,100) (45,900)Dividend paid by the parent (103,150) (64,222) (38,928)Dividend paid by subsidiaries to minority shareholders (70,721) (6,316) (64,404)Purchases of treasury stock (292,181) (775,241) 483,060Proceeds from sales of treasury stock 67,181 4,932 62,249Purchases of treasury stock by consolidated subsidiaries (54,756) (28,572) (26,184)Proceeds from sales of treasury stock by consolidated subsidiaries 325 3,127 (2,802)Other (6) - (6)Net cash provided by (used in) financing activities (319,199) (277,474) (41,725)
Effect of foreign exchange rate changes on cash and cash equivalents (3,138) 85,502 (88,640)Net increase (decrease) in cash and cash equivalents (3,281,229) (4,076,061) 794,832Cash and cash equivalents at the beginning of the fiscal year 6,238,548 4,243,076 1,995,471Increase in cash and cash equivalents due to consolidation of subsidiaries 510 - 510Decrease in cash and cash equivalents due to deconsolidation of subsidiaries (191) (33,653) 33,462Increase in cash and cash equivalents due to merger of consolidated subsidiaries 3,514 - 3,514Increase in cash and cash equivalents due to merger - 6,105,186 (6,105,186)Cash and cash equivalents at the end of the fiscal year 2,961,153 6,238,548 (3,277,395)
(in millions of yen)
20
Mitsubishi UFJ Financial Group, Inc.
21
Notes to Consolidated Balance Sheets 1. Amounts of less than one million yen are rounded down.
2. Transactions involving short-term fluctuations or arbitrage opportunities in interest rates, currency exchange rates, market
prices of securities or other market indices (“Trading transactions”) are presented in “Trading assets” and “Trading liabilities”
on a trade date basis.
Trading assets and trading liabilities are stated at their fair values on the consolidated balance sheet date.
3. Held to maturity debt securities are stated at amortized costs (using the straight-line method) computed under the moving
average method. Investments in non-consolidated subsidiaries and affiliates not accounted for under the equity method are
stated at acquisition costs computed under the moving average method. Other securities with quoted market prices are stated
at their quoted market prices on the consolidated balance sheet date (cost of securities sold is calculated primarily under the
moving average method) and other securities where quoted market prices are not available are stated at acquisition costs or
amortized costs as computed under the moving average method. Net unrealized gains (losses) on other securities are included
directly in net assets, net of applicable income taxes, except in the case of securities with embedded derivatives, which are
measured at fair value in their entirety with the change in fair value recognized in current earnings.
Prior to March 31, 2006, Credit linked bonds, Synthetic CBOs and Synthetic CLOs were classified as Other securities. The
Bond portion and the implied derivative portion were evaluated altogether and the unrealized gains (losses) were reflected to
the consolidated statements of operations. However, beginning from this fiscal year, MUFG modified its accounting
procedure in accordance with ASBJ Guidance No.12 “Guidance on Accounting for Other Compound Financial Instruments
(Compound Financial Instruments Other than Those with Option to Increase Paid-in Capital)” (March 30, 2006). Starting this
period, Compound financial instruments including Inflation-indexed Japanese government bonds are stated at amortized costs,
with book value as of March 31, 2006 to be acquired cost, and unrealized gains (losses) net of deferred tax liabilities are
included in Net assets.
This modification does not have a significant impact on the consolidated balance sheets or consolidated statements of
operations.
4. Securities which are held as trust assets in Money held in trust are accounted for under the same basis as noted above in Notes
2 and 3. Unrealized gains and losses on securities in Money held in trust, which are not held for trading purposes or held to
maturity, are included directly in Net assets, net of applicable income taxes.
5. Derivatives transactions (other than trading transactions) are calculated primarily based on fair value.
6. Depreciation for Tangible fixed assets of MUFG and its domestic banking subsidiaries and trust banking subsidiaries is
computed under the declining-balance method. The estimated useful lives are as follows:
Buildings: 15 years to 50 years
Equipment: 2 years to 20 years
Depreciation for Tangible fixed assets of other consolidated subsidiaries is computed primarily under the straight-line method
based on their estimated useful lives.
7. Depreciation for Intangible fixed assets is computed under the straight-line method. Development costs for internally used
software are capitalized and depreciated under the straight-line method over the estimated useful lives of primarily 3 to 10
years.
Mitsubishi UFJ Financial Group, Inc.
22
8. Bond issuance costs and stock issuance costs are expensed as incurred.
Discount on bonds recognized prior to March 31, 2006 was amortized using the straight-line method and the unamortized
portion is deducted directly from Bonds and notes in accordance with ASBJ Guidance No.19 “Tentative Treatment for
Deferred Assets” (August 11, 2006). This modification caused a ¥ 1,619 million decrease in Discount on bonds in Other
assets and Bonds and notes. Premium on bonds in Other liabilities also decreased by ¥ 491 million and Bonds with warrants
increased by ¥ 491 million.
9. Assets and Liabilities denominated in foreign currencies and accounts of overseas branches of MUFG’s domestic banking
subsidiaries and trust banking subsidiaries are translated into yen primarily at the exchange rates in effect on the consolidated
balance sheet date, except for investments in non-consolidated subsidiaries and affiliates which are translated into yen at
exchange rates in effect on the acquisition dates.
Assets and Liabilities denominated in foreign currencies of other consolidated subsidiaries are translated into yen at the
exchange rates in effect on the consolidated balance sheet date.
10. Allowance for loan losses of major domestic consolidated subsidiaries are provided in detail below in accordance with the
internal standards for self-assessment of asset quality and internal standards for write-offs and provisions.
For claims on borrowers that have entered into bankruptcy, special liquidation proceedings or similar legal proceedings
(“bankrupt borrowers”) or borrowers that are not legally or formally bankrupt but are regarded as substantially in a similar
condition (“substantially bankrupt borrowers”), allowances are provided based on the amount of claims, after write-offs as
stated below, net of expected amounts to be collected through the disposal of collateral and the execution of guarantees.
For claims on borrowers that are not yet legally or formally bankrupt but deemed to have a high possibility to become
bankrupt (“potentially bankrupt borrowers”), which cash flows from collection of principal and interest cannot be reasonably
estimated, allowances are provided based on an overall solvency assessment of the claims, net of expected amounts to be
collected through the disposal of collateral and the execution of guarantees.
For claims on potentially bankrupt borrowers and claims on borrowers requiring close monitoring, which cash flows from
collection of principal and interest can be reasonably estimated, allowances are provided as the difference between the book
value of the claims and the fair value of principal and interest, which is calculated using estimated cash flows discounted at
the initial contractual interest rates.
For other claims, allowances are provided based on the historical loan loss experience. For claims originated in specific
foreign countries, additional allowances are provided based on an assessment of the political and economic conditions of these
countries.
All claims are assessed by branches and the credit supervision departments in accordance with internal standards for
self-assessment of asset quality and the credit review department, which is independent from operating sections, subsequently
audits these assessments. The allowances presented reflect these internally audited assessments.
For collateralized or guaranteed claims on bankrupt borrowers and substantially bankrupt borrowers, the amount of claims
exceeding the estimated value of collateral or guarantees which is deemed uncollectible, has been written-off. The amount of
write-offs is ¥ 844,161 million.
Allowances for claims of consolidated subsidiaries are provided based on their historical loan loss experience or individual
assessments of the possibility for collection on specific claims.
11. Allowances for losses on investment securities are provided based on assessments of each issuers’ financial condition and
other relevant factors.
Mitsubishi UFJ Financial Group, Inc.
23
12. Reserve for employees’ bonuses, which is provided for future bonus payments to employees, reflects an estimated amount
accrued on the consolidated balance sheet date.
13. Some consolidated subsidiaries record Reserve for bonuses for directors and corporate auditors in the amount deemed accrued
on the consolidated balance sheet date.
Prior to March 31, 2006, Bonuses for directors and corporate auditors was recorded as a decrease in unappropriated profits.
However, beginning from this fiscal year, MUFG modified its accounting procedure in accordance with ASBJ Statement No.4
“Accounting Standard for Bonuses to Directors” (November 29, 2005) that required Bonuses for directors and corporate
auditors to be expensed as incurred. This change in accounting procedure caused a ¥ 366 million increase in General and
administrative expenses and a ¥ 366 million decrease in Income before income taxes and others.
14. Reserve for employees’ retirement benefits, which is provided for future pension payments to employees, is recorded in the
amount deemed accrued at the consolidated balance sheet date based on the projected benefit obligation and the estimated
plan asset amount at the end of each fiscal year. Prior service cost is amortized under the straight-line method primarily over
10 years within the employees’ average remaining service period when the services were provided. Net actuarial gains
(losses) are amortized under the straight-line method primarily over 10 years, within the employees’ average remaining
service period, commencing from the fiscal year following when the services were provided.
15. Reserve for contingent losses, which is provided for possible losses from contingent events related to derivatives and other
transactions, is calculated by estimation of the impact of these contingent events.
Reserve for contingent losses is recorded for possible future loss for the termination fees that will be incurred from the
cancellation of the system development outsourcing agreements of former UFJ Bank Limited since the computer systems of
the former The Bank of Tokyo-Mitsubishi, Ltd. and former UFJ Bank Limited are being integrated. The reserve as of March
31, 2007 is ¥ 40,530 million.
Reserve for contingent losses includes the reserves that were included in Allowance for loan losses and Other liabilities. The
amount that was included in the Allowance for loan losses is ¥ 25,746 million and the amount that was included in Other
liabilities is ¥ 14,937 million.
16. Finance leases of domestic consolidated subsidiaries that do not involve transfer of ownership to lessees are accounted for as
operating leases.
17. With respect to hedge accounting for interest rate risks arising from financial assets and liabilities of MUFG’s domestic
banking subsidiaries and trust banking subsidiaries, MUFG has principally adopted portfolio hedges or individual hedges as
prescribed in Industry Audit Committee Report No.24, “Treatment of Accounting and Auditing of Application of Accounting
Standard for Financial Instruments in Banking Industry”, issued by the Japanese Institute of Certified Public Accountants
(“JICPA”) on February 13, 2002 and Accounting Committee Report No.14, “Practical Guidelines for Accounting for
Financial Instruments”, issued by the JICPA on January 31, 2000. MUFG applies the deferred hedge accounting method.
With respect to hedging activities to offset fluctuations in the fair value of fixed rate deposits, loans and other instruments,
MUFG’s domestic banking subsidiaries and trust banking subsidiaries assess the effectiveness of such hedging activities by
classifying hedged items and hedging instruments, such as interest rate swap transactions, by their maturities in accordance
with Industry Audit Committee Report No.24.
With respect to hedging activities to offset fluctuations in fair value of fixed rate bonds, MUFG’s domestic banking

Mitsubishi UFJ Financial Group, Inc.
24
subsidiaries and trust banking subsidiaries classify hedged items and designate hedging instruments, such as interest rate swap
transactions. Since material terms related to hedged items and hedging instruments are substantially identical and such
hedging activities are deemed highly effective, the assessment of the effectiveness is based on the similarity of the terms.
With respect to hedging activities to fix the cash flows related to floating rate deposits and loans, MUFG’s domestic banking
subsidiaries and trust banking subsidiaries classify hedged items by interest rate indices and tenors and designate hedging
instruments, such as interest rate swap transactions, in accordance with Industry Audit Committee Report No.24. Since
material terms related to hedged items and hedging instruments are substantially identical and such hedging activities are
deemed highly effective, the assessment of the effectiveness is based on the similarity of the terms. The effectiveness of
hedging activities is also assessed based on the correlation between the fluctuation of factors related to the hedged items and
hedging instruments.
As of March 31, 2003, deferred hedging losses and gains are recorded in the consolidated balance sheet as a result of the
application of macro hedge accounting based on JICPA Industry Audit Committee Report No.15 “Tentative Treatment for
Accounting and Auditing in Adoption of Accounting Standards for Banking Industry”, under which the overall interest rate
risks arising from numerous deposits, loans and other instruments are hedged collectively by derivative transactions. These
losses and gains are amortized as expense or income over the remaining lives of the macro hedging instruments (for a
maximum period of 15 years from April 1, 2003). Deferred hedge losses and gains attributable to macro hedge accounting as
of March 31, 2007 were ¥ 42,127 million (before tax effect adjustment ) and ¥ 67,092million (before tax effect adjustment ),
respectively.
18. With respect to hedging activities for risks arising from volatility in foreign exchange rates associated with monetary assets
and liabilities denominated in foreign currencies, MUFG’s domestic banking subsidiaries and trust banking subsidiary
have applied the deferred hedge accounting method by classifying hedged items by currencies and designating currency swap
transactions and forward exchange contracts (fund swap transactions) as hedging instruments in accordance with JIPCA
Industry Audit Committee Report No.25 “Treatment of Accounting and Auditing concerning Accounting for Foreign
Currency Transactions in the Banking Industry”.
In addition to the activities described above, MUFG’s domestic banking subsidiaries and trust banking subsidiaries have
applied the deferred hedge accounting method for hedging risks arising from the volatility in foreign exchange rates
associated with investment in subsidiaries denominated in foreign currencies and have applied the fair value hedge accounting
method to foreign securities (other than bonds) with foreign currency denominated liabilities and forward exchange contracts
as hedging instruments.
19. Derivative transactions, including interest rate swaps and currency swaps which are designated as hedging instruments,
among consolidated companies or between trading accounts and other accounts (or among internal sections) are not
eliminated from the consolidated statements of operations and related gains and losses are recognized or deferred under hedge
accounting because these derivative transactions are executed and meet certain criteria, which include a framework, policies
and procedures resulting in transactions equivalent to external third party operations, which are treated as hedge transactions
in accordance with JICPA Industry Audit Committee Reports No.24 and No.25.
20. National and Local Consumption Taxes are excluded from transaction amounts. Non-deductible portions of Consumption
Taxes on the purchases of Tangible fixed assets are expensed when incurred.
21. Reserve for contingent liabilities from futures transactions: ¥ 31 million
This reserve is maintained in accordance with Article 81 of the Financial Futures Transactions Law.
Reserve for contingent liabilities from securities transactions: ¥ 2,284 million

Mitsubishi UFJ Financial Group, Inc.
25
This reserve is maintained in accordance with Article 51 of the Securities and Exchange Law.
22. Investment in affiliates (not including investments in consolidated subsidiaries): ¥ 227,186 million.
23. Accumulated depreciation on Tangible fixed assets: ¥ 1,386,158 million.
24. Deferred gains on Tangible fixed assets deducted for tax purposes: ¥ 92,986 million.
25. In addition to the Tangible fixed assets that are presented in the consolidated balance sheets, MUFG uses certain computers
under financing lease contracts without transfer of ownership of the leased assets. These assets are not included in the
consolidated balance sheets.
1. Acquisition cost equivalents
Tangible fixed assets ¥ 198,924 million
Intangible fixed assets ¥ 149,776 million
Fixed assets total ¥ 348,700 million
2. Accumulated depreciation equivalents
Tangible fixed assets ¥ 101,142 million
Intangible fixed assets ¥ 63,195 million
Fixed assets total ¥ 164,338 million
3. Net book value equivalents as of March 31, 2007
Tangible fixed assets ¥ 97,782 million
Intangible fixed assets ¥ 86,580 million
Fixed assets total ¥ 184,362 million
(Note)
The net book value equivalents include the interest expenses since the percentage of the future minimum lease payments to
the balance of Tangible fixed assets as of March 31, 2007 is immaterial. However, for main items in the Intangible fixed
assets, interest expenses equivalents that are reasonably estimated are deducted from the net book value equivalents.
4. Future minimum lease payments as of March 31, 2007
Due within one year ¥ 52,808 million
Due after one year ¥ 134,001 million
Future minimum lease payments total
¥ 186,809 million
(Note)
Future minimum lease payments include the interest expenses since the percentage of the future minimum lease payments
to the balance of Tangible fixed assets as of March 31, 2007 is immaterial. However, for main items in the Intangible fixed
assets, interest expenses equivalents that are reasonably estimated are deducted from the net book value equivalents.
5. Lease expense, depreciation equivalents and interest expense equivalents
Lease expense ¥ 59,626 million
Depreciation equivalents ¥ 58,462 million
Interest expense equivalents ¥ 1,419 million
6. Method used to calculate the depreciation equivalents
The depreciation equivalents is calculated using the straight-line method over the lease term of the respective assets under
the assumption that there is no residual value at the end of the lease period.

Mitsubishi UFJ Financial Group, Inc.
26
7. Method used to calculate the interest expense equivalents
The interest expense equivalents is calculated as the difference between the total minimum lease payments and the
acquisition costs of the leased assets and is allocated to each leasing period using the effective interest method.
26. Loans to bankrupt borrowers: ¥ 40,924 million.
Non-accrual delinquent loans: ¥ 822,160 million.
Loans to bankrupt borrowers are loans, after write-offs, to bankrupt borrowers as defined in Article 96-1-3-1to 5 and 96-1-4 of
the Enforcement Ordinance of the Corporate Tax Law (No. 97 in 1965) on which accrued interest income is not recognized
(“Non-accrual loans”) as there is substantial doubt of the collection of principal and/or interest because of delinquencies in
payment of principal and/or interest for a significant period of time or for some other reasons.
Non-accrual delinquent loans represent non-accrual loans other than loans to bankrupt borrowers and loans renegotiated at
concessionary terms, including reduction or deferral of interest due to the borrower's weakened financial condition.
27. Loans past due for 3 months or more: ¥ 19,691 million.
Loans past due for 3 months or more represent loans whose principal and/or interest payments have been past due for 3
months or more, excluding loans to bankrupt borrowers and non-accrual delinquent loans.
28. Restructured loans: ¥ 648,054 million.
Restructured loans represent loans renegotiated at concessionary terms, including reduction or deferral of interest or principal
and waiver of the claims, due to the borrower's weakened financial condition, excluding loans to bankrupt borrowers,
non-accrual delinquent loans and loans past due for 3 months or more.
29. The total amount of loans to bankrupt borrowers, non-accrual delinquent loans, loans past due for 3 months or more and
restructured loans was ¥ 1,530,830 million.
The amounts provided in Notes 26 to 29 represent gross amounts before the deduction of allowances for loan losses.
30. Bills discounted are accounted for as financial transactions in accordance with JICPA Industry Audit Committee Report
No.24. MUFG’s banking subsidiaries and trust banking subsidiaries have rights to sell or pledge bank acceptances bought,
commercial bills discounted, documentary bills and foreign exchanges bought without restrictions. The total face value of
these bills is ¥ 1,173,639 million.
31. Assets pledged as collateral are as follows:
Cash and due from banks: ¥ 1,257 million
Trading assets: ¥ 644,175 million
Investment securities: ¥ 1,710,696 million
Loans and bills discounted: ¥ 793,539 million
Other assets: ¥ 2,553 million
Tangible fixed assets: ¥ 745 million
Intangible fixed assets: ¥ 283 million
Liabilities related to pledged assets are as follows:
Deposits: ¥ 247,879 million
Call money and bills sold: ¥ 968,300 million
Borrowed money: ¥ 1,586,442 million
Bonds and notes: ¥ 20,051 million
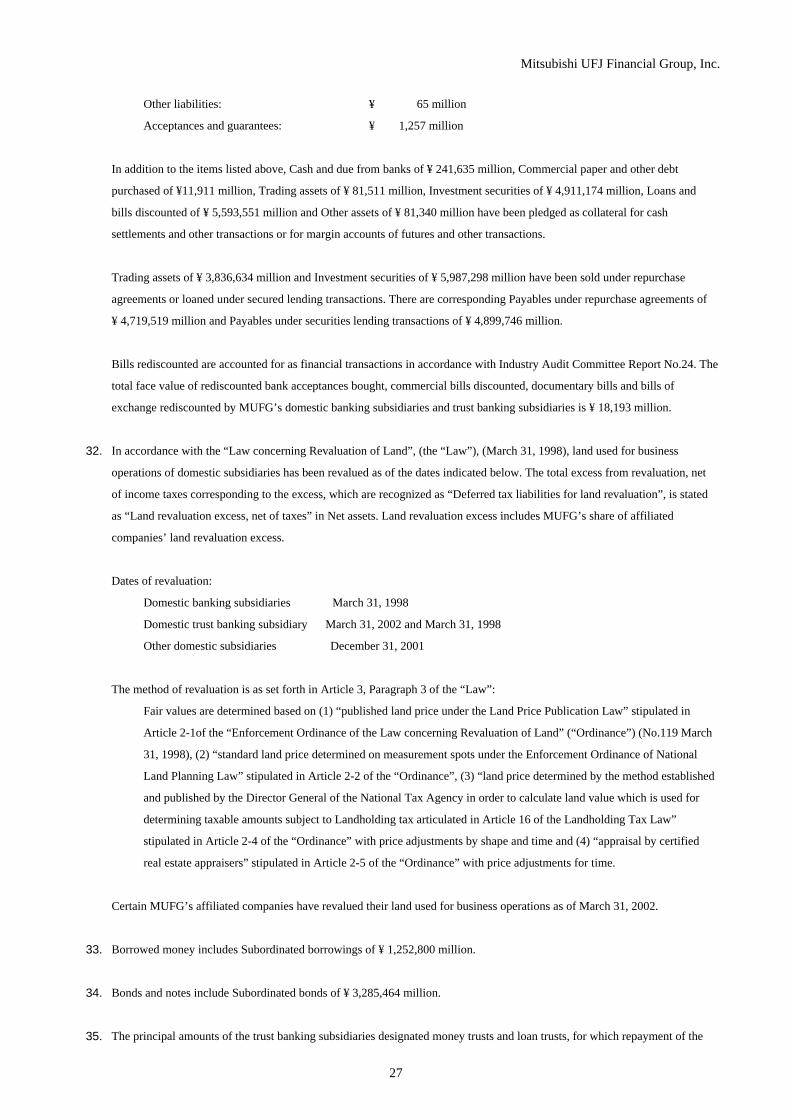
Mitsubishi UFJ Financial Group, Inc.
27
Other liabilities: ¥ 65 million
Acceptances and guarantees: ¥ 1,257 million
In addition to the items listed above, Cash and due from banks of ¥ 241,635 million, Commercial paper and other debt
purchased of ¥11,911 million, Trading assets of ¥ 81,511 million, Investment securities of ¥ 4,911,174 million, Loans and
bills discounted of ¥ 5,593,551 million and Other assets of ¥ 81,340 million have been pledged as collateral for cash
settlements and other transactions or for margin accounts of futures and other transactions.
Trading assets of ¥ 3,836,634 million and Investment securities of ¥ 5,987,298 million have been sold under repurchase
agreements or loaned under secured lending transactions. There are corresponding Payables under repurchase agreements of
¥ 4,719,519 million and Payables under securities lending transactions of ¥ 4,899,746 million.
Bills rediscounted are accounted for as financial transactions in accordance with Industry Audit Committee Report No.24. The
total face value of rediscounted bank acceptances bought, commercial bills discounted, documentary bills and bills of
exchange rediscounted by MUFG’s domestic banking subsidiaries and trust banking subsidiaries is ¥ 18,193 million.
32. In accordance with the “Law concerning Revaluation of Land”, (the “Law”), (March 31, 1998), land used for business
operations of domestic subsidiaries has been revalued as of the dates indicated below. The total excess from revaluation, net
of income taxes corresponding to the excess, which are recognized as “Deferred tax liabilities for land revaluation”, is stated
as “Land revaluation excess, net of taxes” in Net assets. Land revaluation excess includes MUFG’s share of affiliated
companies’ land revaluation excess.
Dates of revaluation:
Domestic banking subsidiaries March 31, 1998
Domestic trust banking subsidiary March 31, 2002 and March 31, 1998
Other domestic subsidiaries December 31, 2001
The method of revaluation is as set forth in Article 3, Paragraph 3 of the “Law”:
Fair values are determined based on (1) “published land price under the Land Price Publication Law” stipulated in
Article 2-1of the “Enforcement Ordinance of the Law concerning Revaluation of Land” (“Ordinance”) (No.119 March
31, 1998), (2) “standard land price determined on measurement spots under the Enforcement Ordinance of National
Land Planning Law” stipulated in Article 2-2 of the “Ordinance”, (3) “land price determined by the method established
and published by the Director General of the National Tax Agency in order to calculate land value which is used for
determining taxable amounts subject to Landholding tax articulated in Article 16 of the Landholding Tax Law”
stipulated in Article 2-4 of the “Ordinance” with price adjustments by shape and time and (4) “appraisal by certified
real estate appraisers” stipulated in Article 2-5 of the “Ordinance” with price adjustments for time.
Certain MUFG’s affiliated companies have revalued their land used for business operations as of March 31, 2002.
33. Borrowed money includes Subordinated borrowings of ¥ 1,252,800 million.
34. Bonds and notes include Subordinated bonds of ¥ 3,285,464 million.
35. The principal amounts of the trust banking subsidiaries designated money trusts and loan trusts, for which repayment of the

Mitsubishi UFJ Financial Group, Inc.
28
principal to the customers is guaranteed, are ¥ 1,594,472 million and ¥ 378,556 million, respectively.
36. Guarantees are provided on certain privately placed bonds in Investment securities in accordance with Paragraph 3 of Article
2 of the Securities Exchange Law. The amount of the guarantees is ¥ 3,516,970 million.
37. Net assets per common share is ¥ 801,320.41.
“Implementation Guidance on Accounting Standard for Earnings per Share” by ASBJ (September 25, 2002) was revised on
January 31, 2006. MUFG has applied this revision and calculates Net assets per common share considering the amount of
gains and losses from deferred hedges, beginning from this fiscal year. This revision does not have a significant impact on Net
assets per common share.
38. Marketable securities other than trading securities are subject to write-downs when the market value of these securities has
declined considerably and it is not probable that the market value will recover to the acquisition cost. Any differences between
fair value and acquisition cost are recognized as losses for the period. “Considerable decline in market value” is determined
based on the classification of issuers in accordance with the internal standards for self-assessment of asset quality as follows:
Bankrupt, Substantially bankrupt or Potentially bankrupt issuers: Market value is lower than acquisition cost.
Issuers requiring close monitoring: Market value has declined 30% or more from acquisition cost.
Other issuers: Market value has declined 50% or more, from acquisition cost.
Bankrupt issuers: Issuers that have entered into bankruptcy, special liquidation proceedings or similar legal proceedings.
Substantially bankrupt issuers: Issuers that are not legally bankrupt but regarded as substantially in a similar condition.
Potentially bankrupt issuers: Issuers that are not legally bankrupt but deemed to have high possibility to become bankrupt.
Issuers requiring close monitoring: Issuers that are financially weak and under close monitoring by MUFG.
39. Market value and net unrealized gains and losses of securities are explained below. In addition to Investment securities,
securities below include trading securities, securities related to trading transactions and trading short-term corporate bonds
classified as Trading assets, negotiable certificates of deposits classified as Cash and due from banks and investments in
commodity investment trusts classified as Commercial paper and other debt purchased. The same definition is applied in
Notes 39 to 42.
Trading securities (in millions of yen)
Amount on consolidated balance sheet Net unrealized gains (losses) recorded in the consolidated
statement of operation during this period
Trading securities 8,534,402 31,890
Debt securities being held to maturity with market values (in millions of yen)
Amount on
consolidated balance sheet
Market value Net unrealized gains (losses) Unrealized gains Unrealized losses
Domestic bonds 2,972,899 2,973,163 264 7,825 7,561Government bonds 2,707,097 2,705,087 (2,010) 5,506 7,516Municipal bonds 78,121 79,189 1,067 1,070 3Corporate bonds 187,680 188,887 1,206 1,248 41
Other securities 282,941 283,634 692 1,259 566Foreign bonds 35,845 36,538 693 1,259 566Other 247,096 247,095 (0) - 0
Total 3,255,841 3,256,798 957 9,085 8,128

Mitsubishi UFJ Financial Group, Inc.
29
Other securities with quoted market values (in millions of yen)
Acquisition cost Amount on
consolidated balance sheet
Net unrealized gains (losses)
Unrealized gains
Unrealized losses
Domestic equity securities 4,440,300 7,661,609 3,221,309 3,322,569 101,260Domestic bonds 22,132,341 22,061,951 (70,390) 17,401 87,792
Government bonds 20,276,028 20,210,220 (65,807) 12,539 78,347Municipal bonds 231,721 231,683 (38) 893 932Corporate bonds 1,624,591 1,620,047 (4,544) 3,968 8,512
Other securities 12,834,514 13,067,827 233,312 353,322 120,010Foreign equity securities 85,293 201,967 116,673 118,574 1,900Foreign bonds 8,057,763 8,009,637 (48,125) 22,515 70,641Other 4,691,458 4,856,222 164,763 212,232 47,468
Total 39,407,156 42,791,388 3,384,231 3,693,293 309,062
Net unrealized gains on marketable securities available for sale shown above includes gains of ¥ 2 million which are related to
the securities with embedded derivatives and are recorded in current earnings. The amount recorded in Net assets is
¥ 3,384,229 million.
¥ 2,054,280 million of “Net unrealized gains on other securities” is composed of the following items:
Net unrealized gains recorded in Net assets: ¥3,384,229 million
Unrealized gains on securities of investment LPSs: ¥28,244 million
(-) Corresponding deferred tax liabilities: ¥ (1,363,676) million
(-) Corresponding minority interests ¥ (1,416) million
MUFG’s share of net unrealized gains on other securities
held by affiliates accounted for under the equity method: ¥6,899 million
40. Other securities sold during the fiscal year is as follows:
(in millions of yen)
Amount sold Gains on sales Losses on sales
35,293,542 252,343 104,266
41. Major components of securities not stated at market values and the amounts recorded in the consolidated balance sheets are as
follows:
(in millions of yen)
Amount on consolidated balance sheet
Debt securities being held to maturity
Foreign bonds 24,223
Other securities
Domestic equity securities 524,424
Domestic corporate bonds 3,799,134
Foreign equity securities 73,860
Foreign bonds 136,827
42. The redemption schedule of bonds classified as other securities with maturities and securities being held to maturity is as
follows:
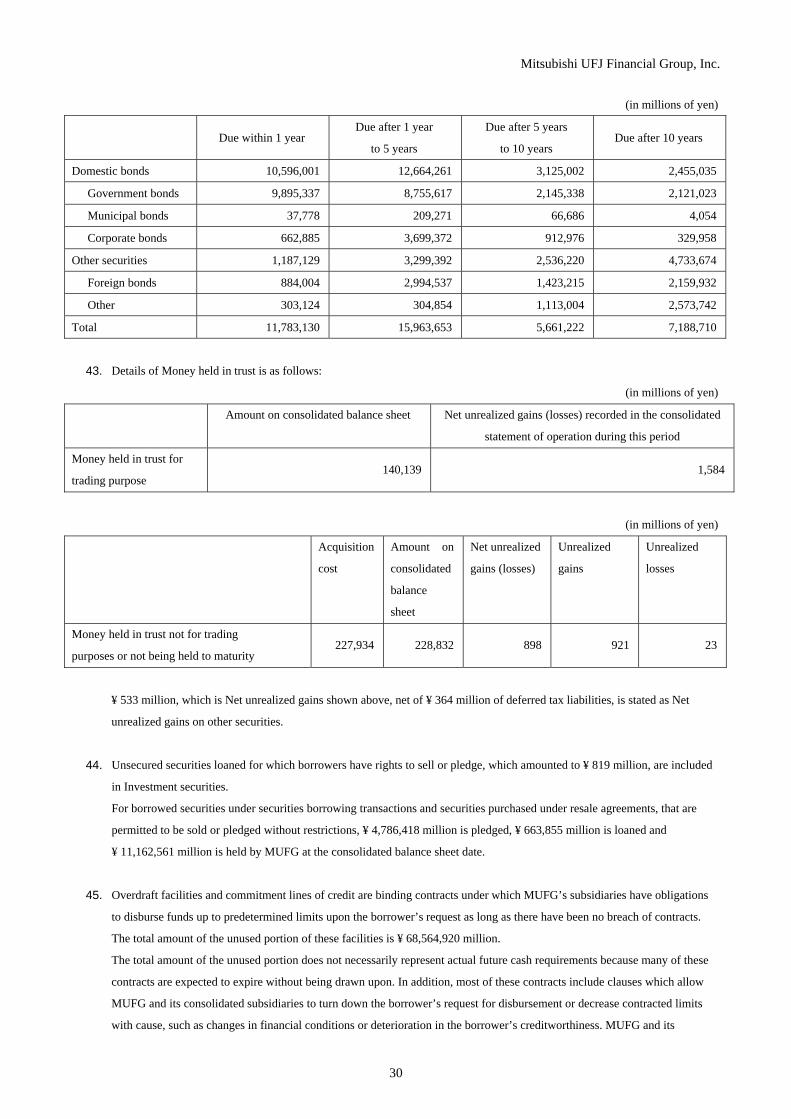
Mitsubishi UFJ Financial Group, Inc.
30
(in millions of yen)
Due within 1 year
Due after 1 year
to 5 years
Due after 5 years
to 10 years Due after 10 years
Domestic bonds 10,596,001 12,664,261 3,125,002 2,455,035
Government bonds 9,895,337 8,755,617 2,145,338 2,121,023
Municipal bonds 37,778 209,271 66,686 4,054
Corporate bonds 662,885 3,699,372 912,976 329,958
Other securities 1,187,129 3,299,392 2,536,220 4,733,674
Foreign bonds 884,004 2,994,537 1,423,215 2,159,932
Other 303,124 304,854 1,113,004 2,573,742
Total 11,783,130 15,963,653 5,661,222 7,188,710
43. Details of Money held in trust is as follows:
(in millions of yen)
Amount on consolidated balance sheet Net unrealized gains (losses) recorded in the consolidated
statement of operation during this period
Money held in trust for
trading purpose 140,139 1,584
(in millions of yen)
Acquisition
cost
Amount on
consolidated
balance
sheet
Net unrealized
gains (losses)
Unrealized
gains
Unrealized
losses
Money held in trust not for trading
purposes or not being held to maturity 227,934 228,832 898 921 23
¥ 533 million, which is Net unrealized gains shown above, net of ¥ 364 million of deferred tax liabilities, is stated as Net
unrealized gains on other securities.
44. Unsecured securities loaned for which borrowers have rights to sell or pledge, which amounted to ¥ 819 million, are included
in Investment securities.
For borrowed securities under securities borrowing transactions and securities purchased under resale agreements, that are
permitted to be sold or pledged without restrictions, ¥ 4,786,418 million is pledged, ¥ 663,855 million is loaned and
¥ 11,162,561 million is held by MUFG at the consolidated balance sheet date.
45. Overdraft facilities and commitment lines of credit are binding contracts under which MUFG’s subsidiaries have obligations
to disburse funds up to predetermined limits upon the borrower’s request as long as there have been no breach of contracts.
The total amount of the unused portion of these facilities is ¥ 68,564,920 million.
The total amount of the unused portion does not necessarily represent actual future cash requirements because many of these
contracts are expected to expire without being drawn upon. In addition, most of these contracts include clauses which allow
MUFG and its consolidated subsidiaries to turn down the borrower’s request for disbursement or decrease contracted limits
with cause, such as changes in financial conditions or deterioration in the borrower’s creditworthiness. MUFG and its

Mitsubishi UFJ Financial Group, Inc.
31
consolidated subsidiaries may request the borrowers to pledge real properties and/or securities as collateral upon signing of
the contract and will perform periodic monitoring of the borrower’s business conditions in accordance with internal
procedures, which may lead to renegotiation of the terms and conditions of the contract and/or initiate the request for
additional collateral and/or guarantees.
46. The funded status and amounts recognized in the consolidated balance sheet were as follows:
(in millions of yen)
Projected benefit obligation (1,892,249)
Fair value of plan assets 2,679,773
Projected benefit obligation in excess of plan assets 787,524
Unrecognized net actuarial loss (349,608)
Unrecognized prior service cost (68,197)
Net amount recognized in the Consolidated Balance Sheets 369,719
Prepaid pension costs 436,243
Reserve for employees’ retirement benefits (66,524)
47. Prior to March 31, 2006, Trust fees of domestic trust banking subsidiaries were recognized as revenue upon the termination
of each trust contract. However, beginning from this fiscal year, MUFG modified its accounting procedure to improve the
periodic accounting and information disclosures. Starting this period, trust fees are recognized on the accrual basis except for
trust fees which are not computed based on the computation period of trust fees stated in the trust agreements or based on the
balance of entrusted assets. This modification became available because of the upgrade of the trust banking subsidiary’s
information system which made it possible to calculate fees based on the computation period of trust fees under the trust
agreements and based on the balance of entrusted assets. This modification caused a ¥7,811 million increase in Ordinary
income, Ordinary profit and Income before income taxes and others.
48. In accordance with the newly effective ASBJ Statement No.5 “Accounting Standards for Presentation of Net Assets on
Balance Sheet” (December 9, 2005) and ASBJ Guidance No.8 “Guidance on Accounting Standards for Presentation of Net
Assets on Balance Sheet” (December 9, 2005), the appendix forms of the “Banking Law Enforcement Regulations” (Ministry
of Finance Ordinance No. 10, 1982) have been revised by the “Cabinet Office Ordinance to Amend Part of Detailed
Enforcement Regulations on Mutual Loan Business Law and Banking Law” (Cabinet Office Ordinance No. 60, April 28,
2006) and applied after April 1, 2006. As a result of the revision, MUFG has made certain adjustments to its terminology.
(1) “Shareholders’ equity” was renamed “Net assets” and divided into “Shareholders’ Equity”, “Valuation and translation
adjustments”, “Subscription rights to shares” and “Minority interests”. The amount corresponding to conventional
“Shareholders’ equity” was ¥ 8,576,694 million on the consolidated balance sheet date.
(2) “Deferred hedge gains” and “Deferred hedge losses” that were included in Other assets or Other liabilities were
represented on a net basis. Amounts net of corresponding tax amounts were stated as “Net deferred gains (losses) on
hedging instruments” in “Valuation and translation adjustments” of “Net assets”. The amount corresponding to
conventional “Net deferred hedge gains (losses), gross basis” in Other assets or Other liabilities were ¥ (224,064)
million.
(3) “Unrealized gains on securities available for sale” was changed to “Net unrealized gains (losses) on other securities”.
(4) “Subscription rights to shares” which used to be included in “Other liabilities” was reclassified to “Net assets”.
(5) “Minority interests” was reclassified to “Net Assets”.
(6) “Premises and equipment” was represented into “Buildings”, “Land”, “Construction in progress” and “Other tangible
fixed assets”, all of which are included in “Tangible fixed assets”, “Other intangible fixed assets” which are included in

Mitsubishi UFJ Financial Group, Inc.
32
“Intangible fixed assets” , and “Other assets”.
The amounts of “Fixed tangible assets”, “Fixed intangible assets” and “Other assets” in conventional “Premises and
equipment” as of March 31, 2006 were ¥ 1,331, 224 million, ¥ 43,057 million and ¥ 143,610 million, respectively.
(7) “Leased assets” which was included in “Other assets” was represented either as “Other tangible fixed assets” in
“Tangible fixed assets” or as “Other intangible fixed assets” in “Intangible fixed assets”. “Software” which was
included in “Other assets” was represented as “Software” in “Other intangible fixed assets”. The amount s of “Leased
assets” and “Software” in “Other assets” as of March 31, 2006 were ¥ 402,406 million and ¥ 387,578 million,
respectively.
(8) “Consolidated goodwill” which was separately disclosed as an asset was included in “Intangible fixed assets” or “Other
liabilities” as “Goodwill”. Prior to March 31, 2006, amortization of “Consolidated goodwill” which was recorded as an
assets and was recorded as a liability were included in “Other ordinary expense” under Ordinary expense or in “Other
ordinary income” under Ordinary income on a net basis. However, beginning from this fiscal year , amortization of
“Goodwill” which is recorded as “Intangible fixed assets” is included in “General and administrative expenses” under
Ordinary expense and amortization of “Goodwill” which is recorded as liability is included in “Other ordinary income”
under Ordinary income in the consolidated statements of operations. The amount s of amortization of “Goodwill”,
gross basis, for the previous fiscal year were ¥ 14,821 million (cost) and ¥1,471 million (profit), respectively.
Amortization of “Goodwill” which is included to “Operating expense” is ¥ 9,047 million and amortization of negative
goodwill which is included “Other ordinary income” is ¥ 3,210 million for this fiscal year.
49. MUFG applied the newly effective ASBJ Practical Solution No.20 “Practical Solution on Investors’ Accounting for
Investment Partnerships” (September 8, 2006). The application of the Practical Solution does not have a significant impact on
the consolidated balance sheets. 50. MUFG applied the newly effective FSA Business Accounting Council “Comment on Accounting Standard for Business
Combinations” (October 31, 2003), ASBJ Statement No.7 “Accounting Standard for Business Divestitures” (December 27,
2005) and ASBJ Guidance No.10 “Guidance on Accounting Standard for Business Combinations and Business Divestitures”
(December 27, 2005).
51. UFJ NICOS Co., Ltd. merged with DC Card Co., Ltd. as of April 1, 2007 under the merger agreement that was approved by
the board of directors on December 20, 2006. As both UFJ NICOS Co., Ltd. and DC Card Co., Ltd. are subsidiaries of
MUFG, the merger is treated as one between companies under common control of the parent company in accordance with the
“Accounting Standard for Business Combinations”.
1. The summary of the merger is as follows:
(1) Company names and their main businesses
Ⅰ. Merging company
UFJ NICOS Co., Ltd.
Credit card business
Ⅱ. Merged company
DC Card Co., Ltd.
Credit cared business
(2) Date of the merger
April 1, 2007
(3) Legal form of the merger
UFJ NICOS Co., Ltd. is the surviving company and DC Card Co., Ltd. is the dissolved company.

Mitsubishi UFJ Financial Group, Inc.
33
(4) Name of the merged company
Mitsubishi UFJ NICOS Co., Ltd.
(5) Purpose of the merger
The purpose of the merger of the core credit card companies in MUFG is to establish the leading credit card
company in Japan that will be able to offer cutting-edge solutions and to provide a stable business base and solid
profitability in the credit card industry.
2. The accounting principal applied
MUFG complies with the accounting treatment between companies under common control of the parent company in
accordance with the article 3-4 of the “Accounting Standard for Business Combinations”.
52. The Bank of Tokyo-Mitsubishi UFJ, Ltd., a subsidiary of MUFG, resolved to acquire shares of kabu.com Securities Co., Ltd.
by a public tender offer at the meeting of its board of directors on March 5, 2007. The tender offer commenced on March 20,
2007 and was completed on April 18, 2007. As a result of the tender offer, the ownership ratio of common shares by the
MUFG and its subsidiaries increased to 40.36%.
It is planned that, after the general meeting of shareholders of kabu.com Securities scheduled in June 2007, kabu.com
Securities will become a consolidated subsidiary of MUFG through the appointment of directors, executive officers or
employees of MUFG or its subsidiaries, or those who were formerly in these positions. MUFG will be able to influence the
financial and business policies of kabu.com Securities as directors of kabu.com Securities as these people will constitute a
majority of the board of directors of kabu.com Securities.
The summary of the tender offer is as follows:
(1) Purpose of the tender offer
MUFG positions kabu.com Securities as a core operation to provide the comprehensive internet financial services
within the group. The purpose of the tender offer is:
Ⅰ. to strengthen synergies between the businesses of the Bank of Tokyo-Mitsubishi UFJ and kabu.com Securities by
providing high value added services conducted through the internet in the retail financial area.
Ⅱ. to make kabu.com Securities a consolidated subsidiary of MUFG.
(2) Name of the company, business and size
Ⅰ. Name of the company
kabu.com Securities Co., Ltd.
Ⅱ. Business
Securities business
Ⅲ. Size
Capital as of March 31, 2007: ¥ 7,195 million
Total Assets as of March 31, 2007: ¥ 363,771 million
Number of employees as of March 31, 2007: 81
(3) Acquisition date of the shares
April 19, 2007
(4) Number of shares to purchase, purchase price and holding ratio of the voting rights
Ⅰ. Number of shares to purchase
94,000 shares
Ⅱ. Purchase price
¥ 22,653 million
Mitsubishi UFJ Financial Group, Inc.
34
Ⅲ. Holding ratio of the voting rights after the tender offer
40.36%
53. Subject to the approval of the amendments of the articles of incorporation at the annual general meeting of shareholders that is
scheduled to be held on June 28, 2007, MUFG will adopt a stock split and unit share system that will be effective on
September 30, 2007. In order to expand the investment opportunity in MUFG for the individual investor, the investment unit
will be reduced to one tenth of the current amount after a 1,000 for 1 common stock split and the unit share system will be 100
common shares for one unit.
54. Subject to the approval of the annual general meeting of shareholders that is scheduled to be held on June 28, 2007 and of the
relevant authority, MUFG concluded the share exchange agreement as of March 28, 2007, under which MUFG planed to
make Mitsubishi UFJ Securities Co., Ltd. a wholly-owned subsidiary by using the share exchange to enhance cooperation
between group companies and to conduct business as a unified group.
Under the share exchange agreement that will be effective on September 30, 2007, 1.02 shares of MUFG after the stock split
mentioned in Note 53 above (0.00102 shares before the stock split) will be exchanged for one share of Mitsubishi UFJ
Securities Co., Ltd.
MUFG will not issue new shares in connection with the share exchange since no shares will be exchanged for the shares of
Mitsubishi UFJ Securities Co., Ltd. that are held by MUFG and MUFG will deliver common treasury shares to the
shareholders of Mitsubishi UFJ Securities Co., Ltd.

Mitsubishi UFJ Financial Group, Inc.
35
Notes to Consolidated Statements of Operations
1. Amounts of less than one million yen are rounded down.
2. Net income per common share: ¥ 86,795.07
3. Diluted net income per common share: ¥ 86,274.70
4. Gains and losses from Trading transactions, such as interest received, realized gains (losses) on sales and unrealized
gains (losses), are presented in “Trading profits” and “Trading losses” on a trade date basis.
5. “Other ordinary income” includes ¥169,738 million of realized gains on sales of equity securities and ¥156,856
million of leasing fees in the consolidated leasing subsidiaries.
6. “Other ordinary expenses” includes ¥ 193,368 million of write down of loans, ¥115,118 million of leasing costs in
the consolidated leasing subsidiaries, ¥80,621 million of investment losses on equity method and ¥ 38,731 million of
write down of equity securities.
7. “Extraordinary gains” includes ¥ 111,229 million of gains on loans written-off, ¥ 11,008 million of gains on sales of
fixed assets, and ¥ 9,337 million of reversal of allowance for loan losses.
8. “Extraordinary losses” includes ¥ 40,530 million of provision for contingent losses related to system integration,
¥ 21,044 million of losses on retirement of fixed assets, and ¥ 18,641 million of losses on impairment of fixed
assets.

Mitsubishi UFJ Financial Group, Inc.
36
Notes to Consolidated Statement of Changes in Net Assets 1. Amounts of less than one million yen are rounded down. 2. Detailed information for outstanding shares
(Thousand shares) Number of
shares as of March 31, 2006
Number of shares in-creased
Number of shares
decreased
Number of shares as of
March 31, 2007 Notes
Outstanding shares Common stock 10,247 613 - 10,861 (1) Preferred stock first series of class 3 100 - - 100 Preferred stock class 8 27 - 9 17 (2) Preferred stock class 9 79 - 79 - (3) Preferred stock class 10 150 - 150 - (4) Preferred stock class 11 0 - - 0 Preferred stock class 12 175 - 141 33 (5)
Total 10,779 613 380 11,013 Treasury shares Common stock 506 190 43 654 (6)
Preferred stock class 8 - 9 9 - (7) Preferred stock class 9 - 79 79 - (8) Preferred stock class 10 - 150 150 - (9) Preferred stock class 12 - 96 96 - (10)
Total 506 525 378 654 (1) Increase in the number of Common stock by 613 thousand shares was due to conversion of Preferred stock class 12 to Common
stocks and due to issuance of Common stock in exchange for acquisitions of Preferred stock class 8, 9, 10 and 12. (2) Decrease in the number of Preferred stock class 8 by 9 thousand shares was due to retirement of the preferred stocks after acqui-
sition. (3) Decrease in the number of Preferred stock class 9 by 79 thousand shares was due to retirement of the preferred stocks after acqui-
sition. (4) Decrease in the number of Preferred stock class 10 by 150 thousand shares was due to retirement of the preferred stocks after ac-
quisition. (5) Decrease in the number of Preferred stock class 12 by 141 thousand shares was due to conversion to Common stocks and retire-
ment of the preferred stocks after acquisition. (6) Increase in the number of treasury stock, Common by 190 thousand shares was mainly due to acquisition from the market after
the issuance of the common stocks in exchange for acquisition of the preferred stocks held by the Resolution and Collection Cor-poration (“RCC”) that resulted in repayment of the public funds by MUFG, due to acquisition of odd-lot shares and due to in-crease in number of shares held by affiliates. Decrease in the number of treasury shares, Common by 43 thousand shares was mainly due to disposition of the shares that were acquired from the market, referred in the previous sentence, due to disposition of odd-lot shares and due to decrease in the number of shares held by subsidiaries.
(7) Increase in the number of treasury stock, Preferred class 8 by 9 thousand shares was due to acquisition from the RCC that re-sulted in repayment of the public funds by MUFG. Decrease by 9 thousand shares was due to retirement of the treasury stock.
(8) Increase in the number of treasury stock, Preferred class 9 by 79 thousand shares was due to acquisition from the RCC that re-sulted in repayment of the public funds by MUFG. Decrease by 79 thousand shares was due to retirement of the treasury stock.
(9) Increase in the number of treasury stock, Preferred class 10 by 150 thousand shares was due to acquisition from the RCC that re-sulted in repayment of the public funds by MUFG. Decrease by 150 thousand shares was due to retirement of the treasury stock.
(10) Increase in the number of treasury stock, Preferred class 12 by 96 thousand shares was due to acquisition from the RCC, that re-sulted in repayment of the public funds by MUFG, and other shareholders. Decrease by 96 thousand shares was due to retirement of the treasury stock.
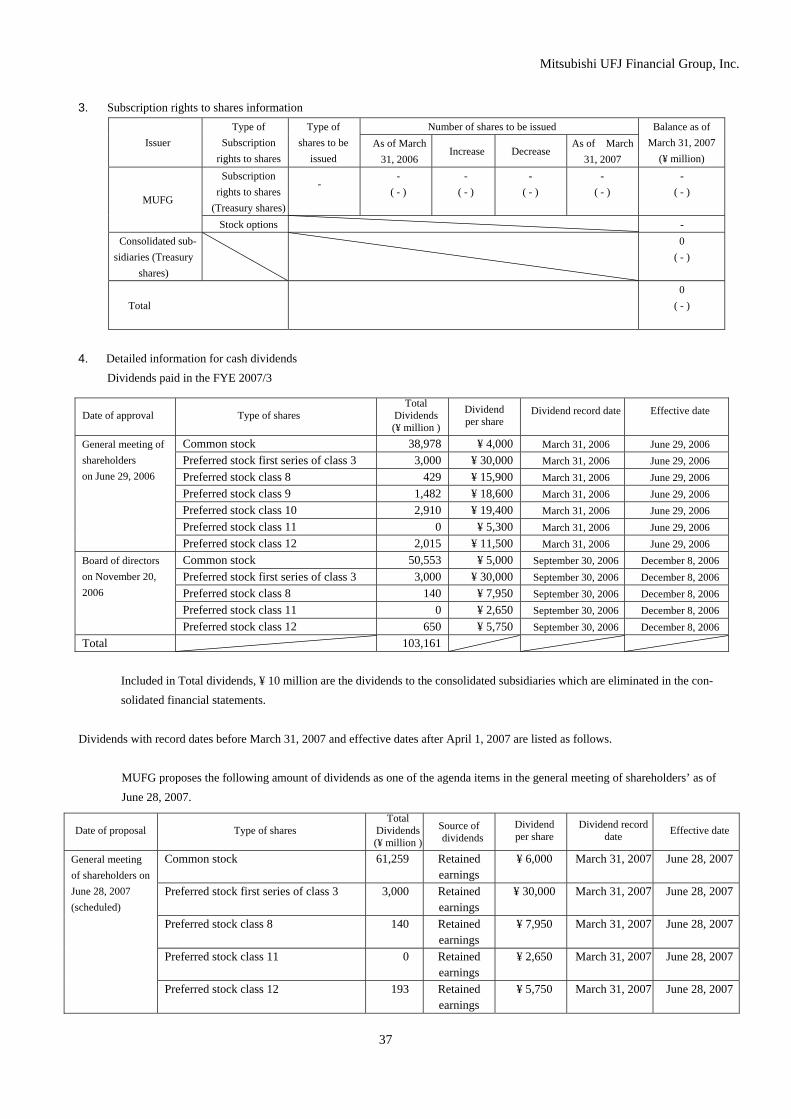
Mitsubishi UFJ Financial Group, Inc.
37
3. Subscription rights to shares information Number of shares to be issued
Issuer Type of
Subscription rights to shares
Type of shares to be
issued As of March
31, 2006 Increase Decrease
As of March 31, 2007
Balance as of March 31, 2007
(¥ million) Subscription
rights to shares (Treasury shares)
-
- ( - )
- ( - )
- ( - )
- ( - )
- ( - )
MUFG
Stock options - Consolidated sub-
sidiaries (Treasury shares)
0
( - )
Total 0
( - )
4. Detailed information for cash dividends Dividends paid in the FYE 2007/3
Included in Total dividends, ¥ 10 million are the dividends to the consolidated subsidiaries which are eliminated in the con-solidated financial statements.
Dividends with record dates before March 31, 2007 and effective dates after April 1, 2007 are listed as follows. MUFG proposes the following amount of dividends as one of the agenda items in the general meeting of shareholders’ as of June 28, 2007.
Date of approval Type of shares Total
Dividends(¥ million )
Dividend per share
Dividend record date
Effective date
Common stock 38,978 ¥ 4,000 March 31, 2006 June 29, 2006 Preferred stock first series of class 3 3,000 ¥ 30,000 March 31, 2006 June 29, 2006 Preferred stock class 8 429 ¥ 15,900 March 31, 2006 June 29, 2006 Preferred stock class 9 1,482 ¥ 18,600 March 31, 2006 June 29, 2006 Preferred stock class 10 2,910 ¥ 19,400 March 31, 2006 June 29, 2006 Preferred stock class 11 0 ¥ 5,300 March 31, 2006 June 29, 2006
General meeting of shareholders on June 29, 2006
Preferred stock class 12 2,015 ¥ 11,500 March 31, 2006 June 29, 2006 Common stock 50,553 ¥ 5,000 September 30, 2006 December 8, 2006Preferred stock first series of class 3 3,000 ¥ 30,000 September 30, 2006 December 8, 2006Preferred stock class 8 140 ¥ 7,950 September 30, 2006 December 8, 2006Preferred stock class 11 0 ¥ 2,650 September 30, 2006 December 8, 2006
Board of directors on November 20, 2006
Preferred stock class 12 650 ¥ 5,750 September 30, 2006 December 8, 2006Total 103,161
Date of proposal Type of shares Total
Dividends(¥ million )
Source of dividends
Dividend per share
Dividend record date Effective date
Common stock 61,259 Retained earnings
¥ 6,000 March 31, 2007 June 28, 2007
Preferred stock first series of class 3 3,000 Retained earnings
¥ 30,000 March 31, 2007 June 28, 2007
Preferred stock class 8 140 Retained earnings
¥ 7,950 March 31, 2007 June 28, 2007
Preferred stock class 11 0 Retained earnings
¥ 2,650 March 31, 2007 June 28, 2007
General meeting of shareholders on June 28, 2007 (scheduled)
Preferred stock class 12 193 Retained earnings
¥ 5,750 March 31, 2007 June 28, 2007

Mitsubishi UFJ Financial Group, Inc.
38
5. From the fiscal year ended March 31, 2007, MUFG provides the Statement of Change in Net Assets in accordance with ASBJ Statement No.6 “Accounting Standards for Statement of Changes in Net Assets ” (December 27, 2005) and ASBJ Guidance No.9 “Guidance on Accounting Standards for Statement of Changes in Net Assets” (December 27, 2005).

Mitsubishi UFJ Financial Group, Inc.
39
Notes to Consolidated Statements of Cash flows
1. Amounts of less than one million yen are rounded down.
2. Cash and cash equivalents in this statement are defined as “Cash and due from banks” on the consolidated balance sheet, ex-
cluding time deposits and negotiable certificates of deposits in other banks.
3. Cash and due from banks on the consolidated balance sheet: ¥ 8,760,240 million
(-) Time deposits and negotiable certificates of deposits in other banks: (¥ 5,799,087 million)
Cash and cash equivalents at the end of the fiscal year: ¥2,961,153 million
4. The appendix forms of the “Banking Law Enforcement Regulations” (Ministry of Finance Ordinance No. 10, 1982) have been
revised by the “Cabinet Office Ordinance to Amend Part of Detailed Enforcement Regulations on Mutual Loan Business Law
and Banking Law” (Cabinet Office Ordinance No. 60, April 28, 2006) and applied after April 1, 2006. As a result of the revision,
MUFG has made certain adjustments to its terminology.
(1) “Goodwill amortization” is presented as “Amortization of goodwill” and “Amortization of negative goodwill”.
(2) On the consolidated balance sheet, “Premises and equipment” was changed to “Tangible fixed assets”, “Intangible fixed as-
sets” and others. As a result of this change, “Losses (gains) on sales of premises and equipment” was changed to “Losses
(gains) on sales of fixed assets” and others. “Purchases of premises and equipment” was changed to “Purchases of tangible
fixed assets” and “Purchases of intangible fixed assets”. “Proceeds from sales of premises and equipment” was changed to
“Proceeds from sales of tangible fixed assets” and “Proceeds from sales of intangible fixed assets”.
(3) On the consolidated balance sheet, “Leased assets” and “Software” were changed from “Other assets” to “Tangible fixed
assets” and “Intangible fixed assets”. As a result of these changes, cash outflows from purchases of leased assets and soft-
ware and cash inflows from sales of leased assets and software that were included in “Other” in Cash flows from operating
activities were represented as “Purchases of tangible fixed assets”, “Purchases of intangible fixed assets”, “Proceeds from
sales of tangible fixed assets” and “Proceeds from sales of intangible fixed assets” in Cash flows from investing activities.
Together with these changes, depreciation of leased assets that was included in “Other” was represented in “Depreciation” in
Cash flows from operating activities.
Cash flows from investing activities related to Leased assets and Software are as follows:
“Purchases of tangible fixed assets” includes ¥ 123,290 million of cash outflow from purchases of leased assets.
“Purchases of intangible fixed assets” includes ¥ 16,321 million of cash outflow from purchases of leased assets.
“Purchases of intangible fixed assets” includes ¥ 96,498 million of cash outflow from purchases of software.
“Proceeds from sales of tangible fixed assets” includes ¥ 12,003 million of cash inflow from sales of leased assets.
“Proceeds from sales of intangible fixed assets” includes ¥ 0 million of cash inflow from sales of leased assets.
“Proceeds from sales of intangible fixed assets” includes ¥ 13 million of cash inflow from sales of software.
“Depreciation” in Cash flows from operating activities includes ¥ 108,286 million of depreciation on leased assets.

Mitsubishi UFJ Financial Group, Inc.
40
Significant accounting policies applied in the preparation of the Consolidated Financial Statements 1. Scope of Consolidation (1) Number of consolidated subsidiaries: 253 Principal companies
The Bank of Tokyo-Mitsubishi UFJ, Ltd. Mitsubishi UFJ Trust and Banking Corporation Mitsubishi UFJ Securities Co., Ltd. The Senshu Bank, Ltd. The Master Trust Bank of Japan, Ltd. UFJ NICOS Co., Ltd. DC Card Co., Ltd. The Mitsubishi UFJ Factors Limited MU Frontier Servicer Co., Ltd. Mitsubishi UFJ Capital Co., Ltd. KOKUSAI Asset Management Co., Ltd. Mitsubishi UFJ Asset Management Co., Ltd. MU Investments Co., Ltd.
Mitsubishi UFJ Real Estate Services Co., Ltd. UnionBanCal Corporation Mitsubishi UFJ Trust & Banking Corporation (U.S.A.) Bank of Tokyo-Mitsubishi UFJ (Luxembourg) S.A. Mitsubishi UFJ Securities International plc Mitsubishi UFJ Securities (USA), Inc. Mitsubishi UFJ Trust International Limited Mitsubishi UFJ Securities (HK) Holdings, Limited BTMU Capital Corporation BTMU Leasing & Finance, Inc. PT U Finance Indonesia PT UFJ-BRI Finance
From the fiscal year ended March 31, 2007, ZAO Bank of Tokyo-Mitsubishi UFJ (Eurasia) and 31 other companies were newly included in the scope of the consolidated subsidiaries due to their foundation or other reasons. From the fiscal year ended March 31, 2007, Kinki Nippon Shinpan Co., Ltd. and 26 other companies were excluded from the scope of consolidated subsidiaries as they became non-consolidated subsidiaries due to dissolution, merger or other reasons. UFJ NICOS Co., Ltd. merged with DC Card Co., Ltd. as of April 1, 2007 and changed its name to Mitsubishi UFJ NICOS Co., Ltd.. Bank of Tokyo-Mitsubishi UFJ (Luxembourg) S.A. changed its name to Mitsubishi UFJ Global Custody S.A.
(2) Non-consolidated subsidiaries: None
(3) Entities not included in the scope of the subsidiaries while MUFG owned the majority of the votes: Ⅰ. Nichiele Corporation (The reason for excluding from the scope)
MUFG does not have the intent to control the subsidiary as it owns the majority of the votes of the subsidiary for the purpose of increasing its corporate value.
Ⅱ. Hygeia Co., Ltd. (The reason for excluding from the scope)
Since the subsidiary is established as a property management company in the land trust businesses, MUFG is restricted in its control of the company by the originators and co-trustees.
Ⅲ. THCAP investment LPS Shonan Sangakurenkei Fund investment LPS Gunma Challenge Fund investment LPS, and 3 other companies
(The reason for excluding from the scope) MUFG does not have the intent to control the subsidiary. Although it owns the majority of the votes through venture capital subsidiaries, MUFG participates in the management of the partnerships as a limited liability partners or investors in order to nurture the venture businesses.
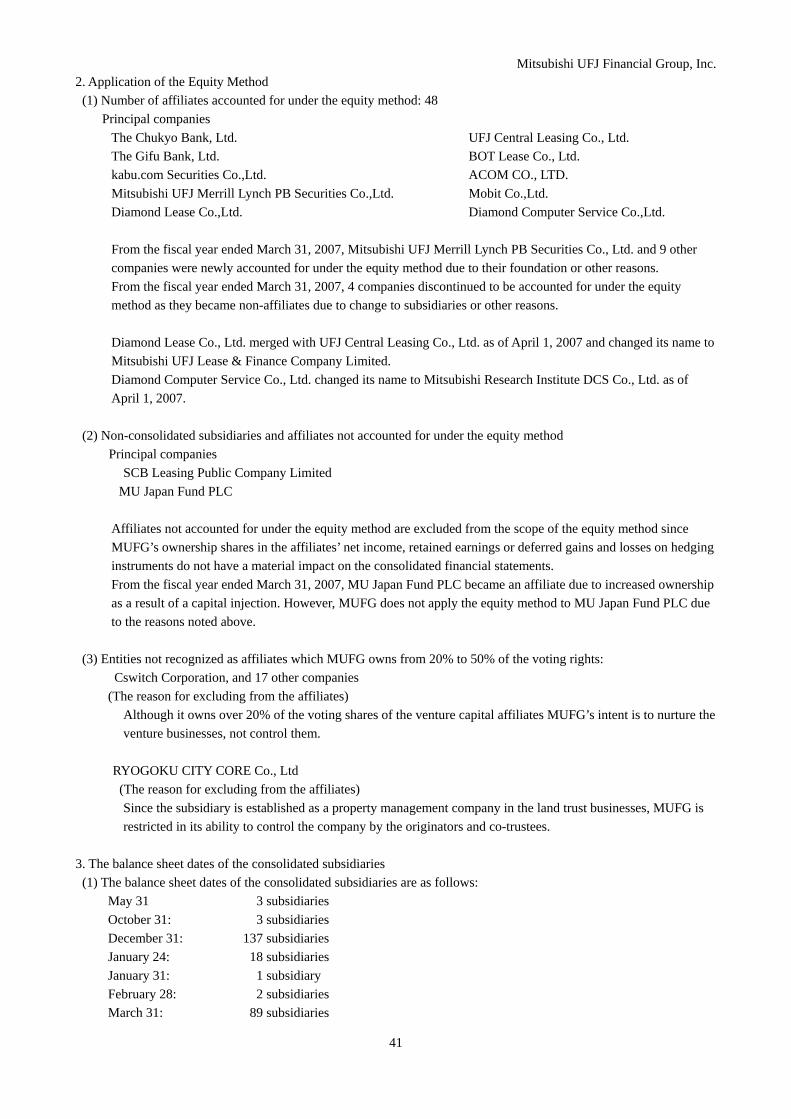
Mitsubishi UFJ Financial Group, Inc.
41
2. Application of the Equity Method (1) Number of affiliates accounted for under the equity method: 48 Principal companies
The Chukyo Bank, Ltd. The Gifu Bank, Ltd. kabu.com Securities Co.,Ltd. Mitsubishi UFJ Merrill Lynch PB Securities Co.,Ltd. Diamond Lease Co.,Ltd.
UFJ Central Leasing Co., Ltd. BOT Lease Co., Ltd. ACOM CO., LTD. Mobit Co.,Ltd. Diamond Computer Service Co.,Ltd.
From the fiscal year ended March 31, 2007, Mitsubishi UFJ Merrill Lynch PB Securities Co., Ltd. and 9 other companies were newly accounted for under the equity method due to their foundation or other reasons. From the fiscal year ended March 31, 2007, 4 companies discontinued to be accounted for under the equity method as they became non-affiliates due to change to subsidiaries or other reasons. Diamond Lease Co., Ltd. merged with UFJ Central Leasing Co., Ltd. as of April 1, 2007 and changed its name to Mitsubishi UFJ Lease & Finance Company Limited. Diamond Computer Service Co., Ltd. changed its name to Mitsubishi Research Institute DCS Co., Ltd. as of April 1, 2007.
(2) Non-consolidated subsidiaries and affiliates not accounted for under the equity method Principal companies
SCB Leasing Public Company Limited MU Japan Fund PLC
Affiliates not accounted for under the equity method are excluded from the scope of the equity method since MUFG’s ownership shares in the affiliates’ net income, retained earnings or deferred gains and losses on hedging instruments do not have a material impact on the consolidated financial statements. From the fiscal year ended March 31, 2007, MU Japan Fund PLC became an affiliate due to increased ownership as a result of a capital injection. However, MUFG does not apply the equity method to MU Japan Fund PLC due to the reasons noted above.
(3) Entities not recognized as affiliates which MUFG owns from 20% to 50% of the voting rights: Cswitch Corporation, and 17 other companies
(The reason for excluding from the affiliates) Although it owns over 20% of the voting shares of the venture capital affiliates MUFG’s intent is to nurture the venture businesses, not control them.
RYOGOKU CITY CORE Co., Ltd (The reason for excluding from the affiliates)
Since the subsidiary is established as a property management company in the land trust businesses, MUFG is restricted in its ability to control the company by the originators and co-trustees.
3. The balance sheet dates of the consolidated subsidiaries (1) The balance sheet dates of the consolidated subsidiaries are as follows:
May 31 3 subsidiaries October 31: 3 subsidiaries December 31: 137 subsidiaries January 24: 18 subsidiaries January 31: 1 subsidiary February 28: 2 subsidiaries March 31: 89 subsidiaries

Mitsubishi UFJ Financial Group, Inc.
42
(2) 2 subsidiaries with the balance sheet date on May 31 are consolidated based on their preliminary financial
statements as of February 28. Subsidiaries with the balance sheet date on May 31 (1 out of 3), October 31 (1 out of 3) and December 31 (1 out of 137) are consolidated based on their preliminary financial statements as of March 31. Subsidiaries with the balance sheet date on October 31 (2 out of 3) are consolidated based on their preliminary financial statements as of January 31. Other subsidiaries are consolidated based on the financial statements that are prepared as of their balance sheet dates. Adjustments are made in the consolidated financial statements to reflect the significant transactions that occur between the balance sheet dates of the subsidiaries and the consolidated balance sheet date .
4. Assets and liabilities of consolidated subsidiaries
Assets and liabilities of consolidated subsidiaries are stated at their fair values on the balance sheet dates of the subsidiaries.
5. Amortization of Goodwill
Goodwill on UFJ NICOS Co., Ltd. and UnionBanCal Corporation is amortized on a straight-line method over 20 years starting from the period of the consolidation. Other goodwill and its equivalents with insignificant balances are expensed as incurred. Prior to March 31, 2006, the equivalent of goodwill on ACOM CO., LTD. was amortized over 10 years starting from the period that incurred. As of March 31, 2007, MUFG recognized the impairment losses on goodwill for the remaining balance of ¥ 24,802 million. The amount of the impairment losses are included in Other ordinary expenses.

Mitsubishi UFJ Financial Group, Inc.
Segment Information
1. Business segment information
<For the fiscal year ended March 31, 2007> (in millions of yen)
<For the fiscal year ended March 31, 2006> (in millions of yen)
16,964 401,301 - 401,301Capital expenditures 325,108 38,396 20,831
187,046,793
Depreciation 101,805 31,459 14,581 10,653 158,500 -
Assets
158,500
444,352 - 444,352
22,673
Capital expenditures 222,867 37,548 17,890
(3,878,195) 187,281,022
Depreciation 139,150 43,996 10,236 102,319 318,375 - 318,375
Assets 152,181,552 19,526,190 13,565,148
4,293,9503,193,734 598,336 332,899 1,409,670
452,781
Trust Banking
490,157 747,381
Securities
131,959
466,840
23,316
6,764,906
-
4,293,950 - 4,293,950
384,852 1,879,206
4,885,699
1,433,519 191,159,217
1,240,690 (1,240,690)
ConsolidatedOther Total (Elimination)
Ordinary income
3,215,888
Ordinary profit 825,646 204,781 80,598 1,072,159 2,183,185 (1,105,124) 1,078,061
3,351,455
Trust Banking
Ordinary income
Banking
337,511252,301
Securities
25,476
6,094,033
-
- 6,094,033
670,872 (670,872)
4,636,953(248,746)
(422,126) 1,457,080
(670,872) 6,094,033
Mitsubishi UFJ Financial Group, Inc. (Consolidated)
from customers
from internal transactions
4,285,963
66,664
Other Total (Elimination) Consolidated
Ordinary expenses 3,225,178 448,892
702,682
19,275
Total ordinary income 4,352,628 721,957
201,208
70,522
382,259 362,528
Credit card
546,173
476,874
13,283
427,305
Ordinary expenses 2,368,087 393,555
Ordinary profit 1,127,449 273,065
Banking
from customers 3,080,732 556,980
from internal transactions 113,002 41,356
299,951
32,948
356,286
4,452,806
34,087
1,053,383
(135,566)
6,094,631 192,217,414
Total ordinary income 5,534,641 (1,240,690)
156,908,109 19,345,736 9,868,936 (5,170,620)
Notes: 1. "Ordinary Income" and "Ordinary profit" correspond to "Net sales" and "Operating profit" on the statement of operations of companies in other than the banking industry. 2. "Other" includes leasing. 3. "Ordinary profit" for "Other" includes 488,899 million yen of dividends from MUFG's domestic banking subsidiary and trust banking subsidiary. 4. Prior to March 31, 2006, "Bonuses for directors and corporate auditors" was recorded as a decrease in unappropriated profits. However, beginning from this fiscal year, MUFG modified its accounting procedure in accordance with ASBJ Statement No.4 “Accounting Standard for Bonuses to Directors” (November 29, 2005) that required "Bonuses for directors and corporate auditors" to be expensed as incurred. This modification caused 366 million yen decrease in "Ordinary profit" on the consolidated statements of operations, of which 125 million yen decrease was for "Banking", 90 million yen decrease was for "Trust Banking" and 151 million yen decrease was for "Securities". 5. Prior to March 31, 2006, trust fees of domestic trust banking subsidiaries were recognized as revenue upon the termination of each trust contract. However, beginning from this fiscal year, MUFG modified its accounting procedure to improve the periodic accounting and information disclosures. Starting this period, trust fees are recognized on the accrual basis except for trust fees which are not computed based on the computation period of trust fees stated in the trust agreements or based on the balance of entrusted assets. This modification became available because of the upgrade of the trust banking subsidiaries' information system which made it possible to calculate fees based on the computation period of trust fees under the trust agreements and based on the balance of entrusted assets. This modification caused a 7,811 million yen increase in "Ordinary profits" for "Trust Banking". 6. Discount on bonds recognized prior to March 31, 2006 was amortized using the straight-line method and the unamortized portion is deducted directly from Bonds and notes in accordance with ASBJ Guidance No.19 “Tentative Treatment for Deferred Assets” (August 11, 2006). This modification caused a 1,619 million yen decrease in "Assets" for "Banking". 7. "Credit card" was included in "Other" in the segment information as of March 31, 2006. However, since UFJ NICOS Co., Ltd. became a consolidated subsidiary of MUFG in October 2005, beginning this fiscal year, “Credit card” is separately disclosed. Information with regard to the “Credit card” segment for the previous fiscal year is as follows: Ordinary income 283,836 million yen Ordinary expenses 235,992 million yen Ordinary profits 47,844 million yen Assets 4,673,479 million yen
Notes 1. "Ordinary income" and "Ordinary profits" correspond to "Net sales" and "Operating profits" on the statement of operations of companies in other than the banking industry. 2. "Other" includes Credit card and leasing. 3. "Ordinary profits" for "Other" includes 1,010,251million yen of dividends from MUFG's domestic banking subsidiary and trust banking subsidiary.
43

Mitsubishi UFJ Financial Group, Inc.
2. Geographic segment information
<For the fiscal year ended March 31, 2007> (in millions of yen)
<For the fiscal year ended March 31, 2006> (in millions of yen)
3. Ordinary income from overseas operations(in millions of yen)
(18,453,632)Assets 165,489,243 17,511,957 3,863,548
922,118 159,061 494,204 428,992
479,244
9,754,707
(335,198) 4,293,950
8,234,097 206,057,697 (19,010,904) 187,046,793
187,281,0229,280,687
298,689 261,832 4,629,148
149,409
9,589,216 205,734,654
AsiaOceania Total
53,408 50,950
Total ordinary income 3,283,367 708,590 76,669
1,122,921
Ordinary income fromoverseas operations
26.1%
Share of Ordinary income fromoverseas operations
4,293,950
Consolidated ordinary income
For the fiacal year endedMarch 31, 2006
Europe Mid. East
42,482
12,010 414,513
79,690
AsiaOceania Total Consolidated(Elimination)Japan North America Latin America
135,900
4,485,310 841,123
116,579
Ordinary income
from customers
80,995
772,709
147,051 from internal transactions
Ordinary expenses
Total ordinary income 4,621,210
Ordinary profit 1,221,565
3,399,645
1,501,073
356,335
14,960
5,124,514
341,075
87,916
72,656
6,094,033
531,554
6,625,587
(487,561)
-
4,636,953
1,457,080(43,993)
6,094,033(531,554)
6,094,033
(531,554) -
Japan North America Latin America Europe Mid. East (Elimination) Consolidated
Ordinary income
from customers 3,171,028 662,632 4,126 245,280 210,881 4,293,950 - 4,293,950
from internal transactions 112,338 45,957 72,542 335,198 (335,198) -
Ordinary expenses 2,348,698 585,684 72,838 291,286 216,340 3,514,848 (298,959) 3,215,888
Ordinary profit 934,669 122,905 3,830 1,078,0617,403 45,491 1,114,300 (36,239)
For the fiacal year ended 1,608,723 6,094,033 26.3%March 31, 2007
Assets 166,312,031 17,957,661 3,799,200
Notes: 1. "Ordinary income" and "Ordinary profits" correspond to "Net sales" and "Operating profits" on the statement of operations of companies in other than the banking industry. 2. "North America" includes United States and Canada. "Latin America" primarily includes Caribbean countries and Brazil. "Europe/Middle East" primarily includes United Kingdom, Germany and Netherlands. "Asia/Oceania" primarily includes Hong Kong, Singapore and China. 3. Prior to March 31, 2006, "Bonuses for directors and corporate auditors" was recorded as a decrease in unappropriated profits. However, beginning from this fiscal year, MUFG modified its accounting procedure in accordance with ASBJ Statement No.4 “Accounting Standard for Bonuses to Directors” (November 29, 2005) that required "Bonuses for directors" to be expensed as incurred. This modification caused 366 million yen decrease in "Ordinary profit" for "Japan". 4. Prior to March 31, 2006, trust fees of domestic trust banking subsidiaries were recognized as revenue upon the termination of each trust contract. However, beginning from this fiscal year, MUFG modified its accounting procedure to improve the periodic accounting and information disclosures. Starting this period, trust fees are recognized on the accrual basis except for trust fees which are not computed based on the computation period of trust fees stated in the trust agreements or based on the balance of entrusted assets. This modification became available because of the upgrade of the trust banking subsidiaries' information system which made it possible to calculate fees based on the computation period of trust fees under the trust agreements and based on the balance of entrusted assets. This modification caused a 7,811 million yen increase in "Ordinary profits" for "Japan". 5. Discount on bonds recognized prior to March 31, 2006 was amortized using the straight-line method and the unamortized portion is deducted directly from Bonds and notes in accordance with ASBJ Guidance No.19 “Tentative Treatment for Deferred Assets” (August 11, 2006). This modification caused 819 million yen decrease in "Assets" for "Japan"and 799 million yen decrease in "Assets" for "North America".
Notes: 1. "Ordinary income from overseas operations" corresponds to "Net sales from overseas operations" on the statement of operations of companies in other than the banking industry. 2. "Ordinary income from overseas operations" consists of income from operations of the overseas branches of MUFG's domestic banking subsidiaries and trust banking subsidiaries, and MUFG's overseas subsidiaries (excluding ordinary income from internal transactions).
Notes: 1. "Ordinary income" and "Ordinary profits" correspond to "Net sales" and "Operating profits" on the statement of operations of companies in other than the banking industry. 2. "North America" includes United States and Canada. "Latin America" primarily includes Caribbean countries and Brazil. "Europe/Middle East" primarily includes United Kingdom, Germany and Netherlands. "Asia/Oceania" primarily includes Hong Kong, Singapore and China.
44

Mitsubishi UFJ Financial Group, Inc.
Mitsubishi UFJ Financial Group, Inc. (Consolidated)
Investment securities information Following tables include: Investment securities
Trading securities, securities related to trading transactions, trading commercial paper and trading short-term corporate bonds in "Trading assets" Negotiable certificates of deposits in "Cash and due from banks" Beneficiary certificates of commodity investment trusts in "Commercial Paper and other debt purchased".
1. Trading securities( in millions of yen)
2. Debt securities being held to maturity with market values ( in millions of yen)
Market value
Unrealized gains Unrealized losses Domestic bonds 2,376,562 2,361,806 (14,756) 2,065 16,822
Government bonds 2,253,947 2,237,316 (16,630) 121 16,752 Municipal bonds 85,625 86,821 1,196 1,249 52 Corporate bonds 36,989 37,667 677 694 16
50,726 50,946 219 1,589 1,370381,409 381,388 (20) 6 26
Total 2,808,698 2,794,141 (14,556) 3,662 18,219
3. Marketable securities available for sale ( in millions of yen)
Acquisition cost Amount onbalance sheet Unrealized gains Unrealized losses
Domestic equity securities 4,485,361 7,466,163 2,980,802 2,996,101 15,298 Domestic bonds 25,621,822 25,411,680 (210,142) 7,277 217,419
Government bonds 23,210,594 23,022,213 (188,381) 4,806 193,187 Municipal bonds 246,784 245,594 (1,189) 933 2,122 Corporate bonds 2,164,443 2,143,871 (20,571) 1,538 22,109
67,909 159,483 91,573 92,307 7346,458,140 6,367,170 (90,969) 15,305 106,2753,077,335 3,259,309 181,973 228,734 46,760
Total 39,710,569 42,663,806 2,953,237 3,339,726 386,488
4. Securities sold during the fiscal year ended March 31, 2006 ( in millions of yen)Gains Losses
on sales on sales236,525 161,249
5.Securities stated at acquired costs ( in millions of yen)
Debt securities being held to maturity Foreign bonds 30,765 Securities available for sale Domestic equity securities 668,822 Domestic corporate bonds 3,445,256 Foreign equity securities 113,250 Foreign bonds 114,865
6. Maturities of bonds ( in millions of yen)
within 1 year 5 years over 1 year to 5 years to 10 years 10 years
Domestic bonds 12,397,660 14,800,383 2,221,806 1,817,606 Government bonds 11,675,719 10,762,375 1,189,204 1,648,860 Municipal bonds 32,704 188,195 110,937 4,341 Corporate bonds 689,236 3,849,812 921,664 164,403
560,492 1,926,088 1,381,721 2,641,512414,192 327,219 420,875 1,128,946
Total 13,372,345 17,053,690 4,024,403 5,588,065
As of March 31, 2006
Foreign bonds Other
Net unrealized gains (losses) recognized on the fiscal year ended March 31, 2006
(22,097)
Amount on consolidatedbalance sheet8,824,461
sold
As of March 31, 2006Balance sheet amount
Foreign equity securities Foreign bonds Other
Amount
Other
As of March 31, 2006Net unrealized gains (losses)
47,000,226
As of March 31, 2006
Net unrealized gains (losses)
As of March 31, 2006
Foreign bonds
Amount onconsolidatedbalance sheet
45
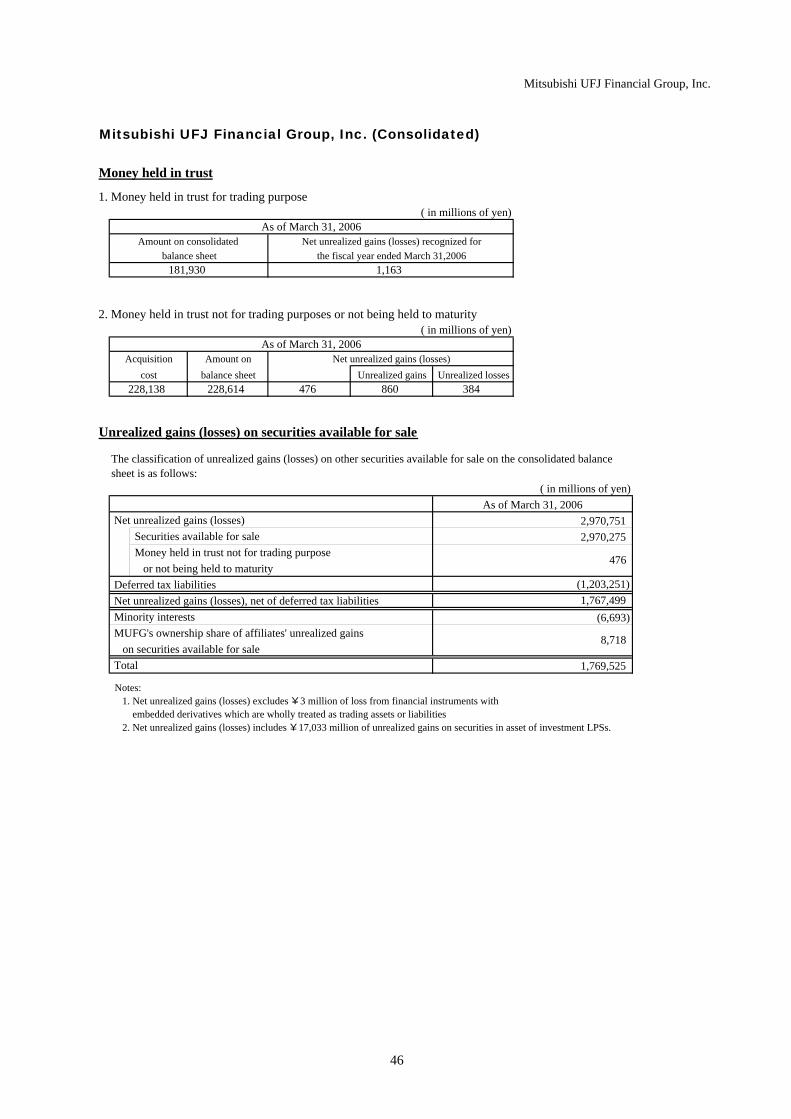
Mitsubishi UFJ Financial Group, Inc.
Mitsubishi UFJ Financial Group, Inc. (Consolidated)
Money held in trust
1. Money held in trust for trading purpose( in millions of yen)
2. Money held in trust not for trading purposes or not being held to maturity( in millions of yen)
Amount onbalance sheet Unrealized gains Unrealized losses
228,614 476 860 384
Unrealized gains (losses) on securities available for sale
( in millions of yen)
Net unrealized gains (losses) Securities available for sale 2,970,275 Money held in trust not for trading purpose or not being held to maturity
Deferred tax liabilities Net unrealized gains (losses), net of deferred tax liabilities Minority interests MUFG's ownership share of affiliates' unrealized gains on securities available for sale Total
The classification of unrealized gains (losses) on other securities available for sale on the consolidated balancesheet is as follows:
As of March 31, 2006
1,769,525
(1,203,251)1,767,499
(6,693)
8,718
2,970,751
476
As of March 31, 2006Amount on consolidated Net unrealized gains (losses) recognized for
balance sheet the fiscal year ended March 31,20061,163
Acquisitioncost
228,138
181,930
Net unrealized gains (losses)As of March 31, 2006
Notes: 1. Net unrealized gains (losses) excludes ¥3 million of loss from financial instruments with embedded derivatives which are wholly treated as trading assets or liabilities 2. Net unrealized gains (losses) includes ¥17,033 million of unrealized gains on securities in asset of investment LPSs.
46

Mitsubishi UFJ Financial Group, Inc.
Related party transactions
Per share information
For the fiscal year ended March 31, 2007
For the fiscal yearended March 31, 2007
million yen 880,997million yen 8,376million yen -million yen 8,376million yen 872,621
thousand shares 10,053
million yen 1,126million yen 1,126
thousand shares 73thousand shares 73
There are no material information to report with regards to Income Taxes and Derivative transactions
There are no material transactions with related parties to report for the fiscal year ended March 31, 2006.There are no material transactions with related parties to report for the fiscal year ended March 31, 2007.
(*) Basis for computing net income per common share and Diluted net income per common share
¥93,263.15¥89,842.26
For the fiscal year ended March 31, 2006Total net assets per common share Net income per common shareDiluted net income per common share
Net income per common share
For the fiscal yearended March 31, 2006
Total net assets per common share Net income per common shareDiluted net income per common share
¥801,320.41¥86,795.07¥86,274.70
¥692,792.38
Diluted net income per common share Adjustments in net income Total dividends on preferred stock
Net income Amounts not attributable to common shareholders
Total dividends on preferred stock
Average number of common shares outstanding for the fiscal year Net income attributable to common shares
Total bonuses to directors
770,71913,408
151
6,837
13,257757,310
8,120
6,837
385385 Preferred shares
Common equivalent share
47

(Japanese GAAP)
Mitsubishi UFJ Financial Group, Inc.
Non-consolidated Balance Sheets
As of March 31, As of March 31, Increase/2007 (A) 2006 (B) (Decrease)
(in millions of yen) (A) - (B)Assets:
Current assets:Cash and due from banks 42,224 38,410 3,814Prepaid expenses 2,640 2,349 291Accrued revenue 8,644 10,365 (1,721)Accounts receivable 100,540 203,371 (102,831)Other current assets 43 3 40
Total current assets 154,094 254,500 (100,406)Fixed assets:
Tangible fixed assets 242 421 (178)Buildings 40 150 (110)Equipment and furniture 202 270 (68)
Intangible fixed assets 828 350 478Trademarks 53 60 (7)Computer software 773 287 485Other intangible fixed assets 1 1 (0)
Investments and other fixed assets 7,339,463 7,395,625 (56,161)Investment in subsidiaries and affiliates 7,346,602 7,399,493 (52,890)Allowance for losses on investments (7,138) (7,138) -Other fixed assets - 3,518 (3,518)Allowance for doubtful accounts - (248) 248
Total fixed assets 7,340,534 7,396,397 (55,862)
Total assets 7,494,629 7,650,898 (156,269)
Liabilities:Current liabilities:
Short-term borrowings 57,380 44,400 12,980Current portion of long-term borrowings 32,400 312,400 (280,000)Current portion of bonds and notes 100,000 - 100,000Accounts payable 821 654 167Accrued expenses 1,641 1,167 474Income taxes payable 3 119 (115)Deferred tax liabilities 3,433 4,086 (652)Deposits received 266 277 (10)Reserve for employees' bonuses 211 235 (23)Other current liabilities 0 70 (70)
Total current liabilities 196,159 363,411 (167,251)Fixed liabilities:
Bonds 550,000 650,000 (100,000)Long-term borrowings - 25,000 (25,000)Long-term borrowings from subsidiaries and affiliates 488,818 496,689 (7,870)Deferred tax liabilities 5,524 3,063 2,461
Total fixed liabilities 1,044,343 1,174,753 (130,409)
Total liabilities 1,240,503 1,538,164 (297,661)
Net assets:Shareholders' equity:
Capital stock 1,383,052 - 1,383,052Capital surplus
Capital reserve 1,383,070 - 1,383,070Other capital surplus 2,549,056 - 2,549,056
Total capital surplus 3,932,126 - 3,932,126Retained earnings
Voluntary reserve 150,000 - 150,000Unappropriated retained earnings 1,789,675 - 1,789,675
Total retained earnings 1,939,675 - 1,939,675Treasury stock (1,000,728) - (1,000,728)Total shareholders' equity 6,254,125 - 6,254,125
Total net assets 6,254,125 - 6,254,125
Total liabilities and net assets 7,494,629 - 7,494,629
Shareholders' equity:Capital stock - 1,383,052 (1,383,052)Capital surplus
Capital reserve - 3,577,570 (3,577,570)Other capital surplus - 356,167 (356,167)
Transfer from capital stock and capital reserve - 355,762 (355,762)Gains on sales of treasury stock - 405 (405)
Total capital surplus - 3,933,738 (3,933,738)Retained earnings
Voluntary reserve - 150,000 (150,000)Unappropriated retained earnings - 1,418,943 (1,418,943)
Total retained earnings - 1,568,943 (1,568,943)Unrealized gains on securities available for sale, net of taxes - 135 (135)Treasury stock - (773,135) 773,135
Total shareholders' equity - 6,112,733 (6,112,733)
Total liabilities and shareholders' equity - 7,650,898 (7,650,898)
Mitsubishi UFJ Financial Group, Inc.
48
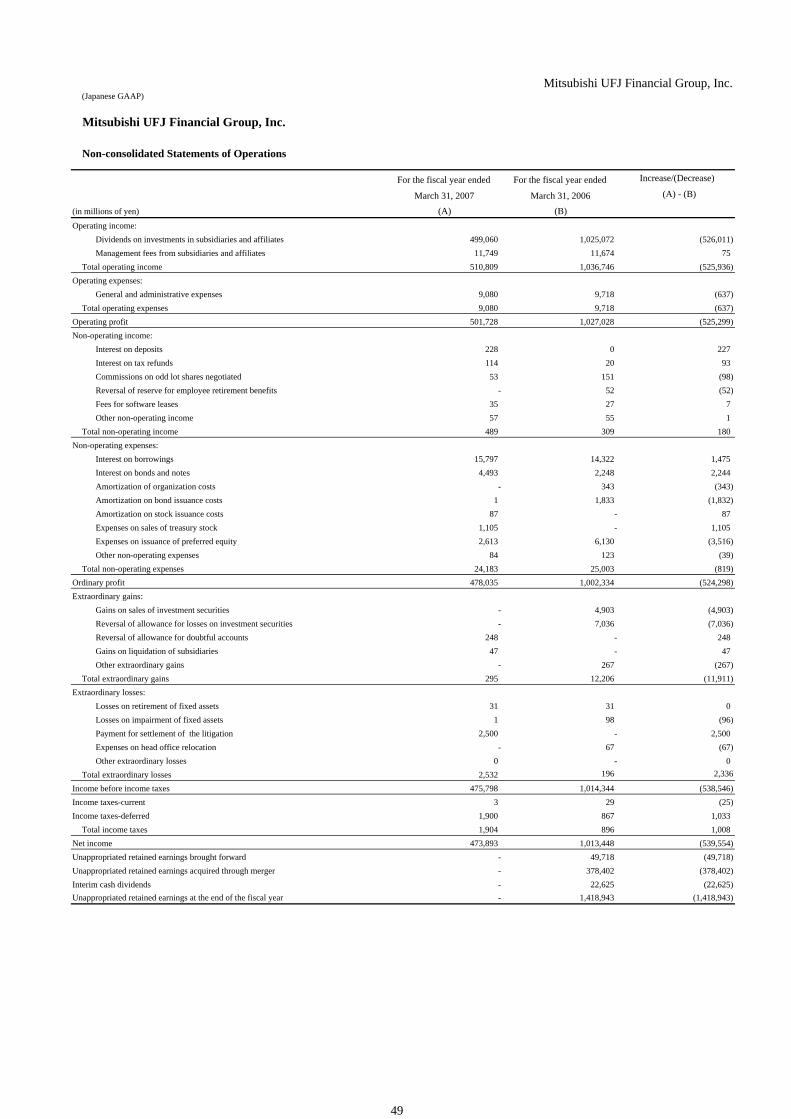
(Japanese GAAP)
For the fiscal year ended For the fiscal year ended Increase/(Decrease)
March 31, 2007 March 31, 2006 (A) - (B)
(in millions of yen) (A) (B)Operating income:
Dividends on investments in subsidiaries and affiliates 499,060 1,025,072 (526,011)Management fees from subsidiaries and affiliates 11,749 11,674 75
Total operating income 510,809 1,036,746 (525,936)Operating expenses:
General and administrative expenses 9,080 9,718 (637)Total operating expenses 9,080 9,718 (637)
Operating profit 501,728 1,027,028 (525,299)Non-operating income:
Interest on deposits 228 0 227Interest on tax refunds 114 20 93Commissions on odd lot shares negotiated 53 151 (98)Reversal of reserve for employee retirement benefits - 52 (52)Fees for software leases 35 27 7Other non-operating income 57 55 1
Total non-operating income 489 309 180Non-operating expenses:
Interest on borrowings 15,797 14,322 1,475Interest on bonds and notes 4,493 2,248 2,244Amortization of organization costs - 343 (343)Amortization on bond issuance costs 1 1,833 (1,832)Amortization on stock issuance costs 87 - 87Expenses on sales of treasury stock 1,105 - 1,105Expenses on issuance of preferred equity 2,613 6,130 (3,516)Other non-operating expenses 84 123 (39)
Total non-operating expenses 24,183 25,003 (819)Ordinary profit 478,035 1,002,334 (524,298)Extraordinary gains:
Gains on sales of investment securities - 4,903 (4,903)Reversal of allowance for losses on investment securities - 7,036 (7,036)Reversal of allowance for doubtful accounts 248 - 248Gains on liquidation of subsidiaries 47 - 47Other extraordinary gains - 267 (267)
Total extraordinary gains 295 12,206 (11,911)Extraordinary losses:
Losses on retirement of fixed assets 31 31 0Losses on impairment of fixed assets 1 98 (96)Payment for settlement of the litigation 2,500 - 2,500Expenses on head office relocation - 67 (67)Other extraordinary losses 0 - 0
Total extraordinary losses 2,532 196 2,336
Income before income taxes 475,798 1,014,344 (538,546)Income taxes-current 3 29 (25)Income taxes-deferred 1,900 867 1,033
Total income taxes 1,904 896 1,008Net income 473,893 1,013,448 (539,554)Unappropriated retained earnings brought forward - 49,718 (49,718)Unappropriated retained earnings acquired through merger - 378,402 (378,402)Interim cash dividends - 22,625 (22,625)Unappropriated retained earnings at the end of the fiscal year - 1,418,943 (1,418,943)
Mitsubishi UFJ Financial Group, Inc.
Non-consolidated Statements of Operations
Mitsubishi UFJ Financial Group, Inc.
49
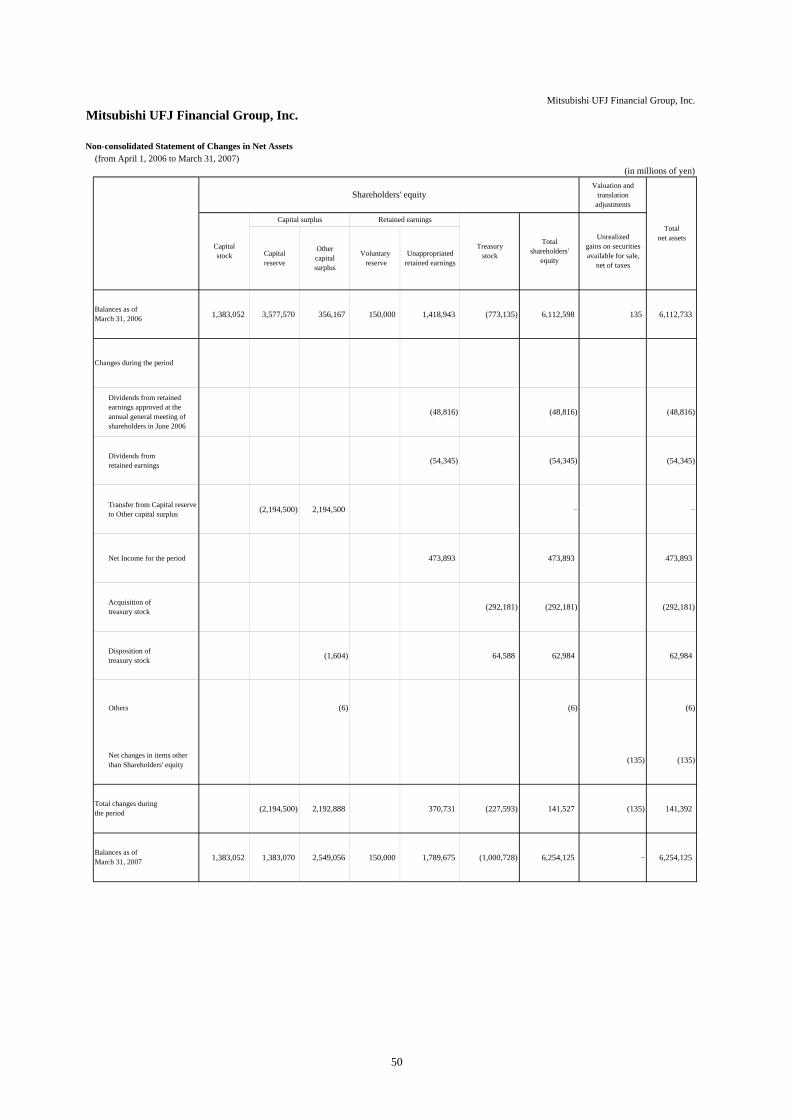
Mitsubishi UFJ Financial Group, Inc.Mitsubishi UFJ Financial Group, Inc.
Non-consolidated Statement of Changes in Net Assets(from April 1, 2006 to March 31, 2007)
(in millions of yen)Valuation and
translationadjustments
1,383,052 3,577,570 356,167 150,000 1,418,943 (773,135) 6,112,598 135 6,112,733
Dividends from retainedearnings approved at theannual general meeting ofshareholders in June 2006
(48,816) (48,816) (48,816)
Dividends fromretained earnings (54,345) (54,345) (54,345)
Transfer from Capital reserveto Other capital surplus (2,194,500) 2,194,500 - -
Net Income for the period 473,893 473,893 473,893
Acquisition oftreasury stock (292,181) (292,181) (292,181)
Disposition oftreasury stock (1,604) 64,588 62,984 62,984
Others (6) (6) (6)
Net changes in items otherthan Shareholders' equity (135) (135)
(2,194,500) 2,192,888 370,731 (227,593) 141,527 (135) 141,392
1,383,052 1,383,070 2,549,056 150,000 1,789,675 (1,000,728) 6,254,125 - 6,254,125
Balances as ofMarch 31, 2006
Changes during the period
Total changes duringthe period
Balances as ofMarch 31, 2007
Totalnet assets
Retained earnings
Unrealizedgains on securitiesavailable for sale,
net of taxesVoluntary reserve
Unappropriatedretained earnings
Capitalstock
Capital surplus
Capitalreserve
Othercapitalsurplus
Shareholders' equity
Treasurystock
Totalshareholders'
equity
50

Mitsubishi UFJ Financial Group, Inc.(Japanese GAAP)
Mitsubishi UFJ Financial Group, Inc.Appropriations of Retained Earnings and Other Capital Surplus
(in millions of yen)
Appropriations of Retained Earnings
Unappropriated retained earnings at the end of the fiscal year 1,418,943
Appropriations:
Cash dividends on preferred stock-First series of Class 3 (30,000 yen per share) 3,000
Cash dividends on preferred stock-Class 8 (15,900 yen per share) 429
Cash dividends on preferred stock-Class 9 (18,600 yen per share) 1,482
Cash dividends on preferred stock-Class 10 (19,400 yen per share) 2,910
Cash dividends on preferred stock-Class 11 (5,300 yen per share) 0
Cash dividends on preferred stock-Class 12 (11,500 yen per share) 2,015
Cash dividends on common stock (4,000 yen per share) 38,978
Total 48,816
Unappropriated retained earnings to be carried forward 1,370,126
Appropriations of Other Capital Surplus
Other capital surplus at the end of the fiscal year 356,167
Other capital surplus to be carried forward 356,167
Fiscal year endedMarch 31, 2006
51

Mitsubishi UFJ Financial Group, Inc.
52
Notes to Non-Consolidated Financial Statements Significant accounting policies
1. Investments
Investments in subsidiaries and affiliates are stated at cost computed under the moving-average method.
2. Depreciation and amortization
Ⅰ. Tangible fixed assets
Depreciation for tangible fixed assets is computed under the declining-balance method. The estimated useful lives
are as follows:
Buildings 5 to 15 years
Equipment and furniture 4 to 15 years
Ⅱ. Intangible fixed assets
Amortization for intangible fixed assets is computed under the straight-line method over their estimated useful
lives. Development costs for internally used software are amortized under the straight-line method over the esti-
mated useful lives (5 years).
3. Deferred charges
Bond issuance costs and stock issuance costs are expensed as incurred.
4. Translation of foreign currency items
Foreign currency assets and liabilities are translated into yen equivalents at exchange rates prevailing at the balance
sheet date, except for investments in subsidiaries which are translated at exchange rates prevailing at the acquisition
dates. Exchange differences are recognized as gains or losses.
5. Reserves and allowances
(1) Allowance for losses on investment securities are recorded for future possible losses on investments in securities
based on assessments of the financial condition and other relevant factors of the investees.
(2) Reserve for employees’ bonuses, which is provided for future bonus payments to employees, reflects an estimated
amount accrued at the balance sheet date.
6. Consumption taxes
National and local consumption taxes are excluded from transaction amounts.
Significant changes in accounting policies
In accordance with newly effective Accounting Standards Board Statement No.5 “Accounting Standards for Presentation of Net Assets
on Balance Sheet” (December 9, 2005) and Accounting Standards Board Guidance No.8 “Guidance on Accounting Standards for Pres-
entation of Net Assets on Balance Sheet” (December 9, 2005), “Shareholders’ equity” was renamed as “Net assets”. The amount corre-
sponding to conventional “Shareholders’ equity” was ¥ 6,254,125 million at the balance sheet date.
The Net assets section of the non-consolidated financial statements is presented in accordance with the revised Ministry of Finance Or-
dinance No.59 “Ordinance regarding financial Statements” (November 27, 1963).

Mitsubishi UFJ Financial Group, Inc.
53
Notes to Non-Consolidated Balance Sheets
1. Amounts of less than one million yen are rounded down.
2. Accumulated depreciation on tangible fixed assets: ¥ 360 million.
3. Assets pledged as collateral are as follows:
Investments in subsidiaries: ¥ 72,360 million
Liabilities related to pledged assets are as follows:
Current portion of long term borrowings: ¥ 25,000 million
4. Assets and Liabilities to/from affiliates
Assets to affiliates
Cash and due from banks, Prepaid expense, Unearned income and Others: ¥ 54,079 million
Liabilities from affiliates
Short-term borrowings, Current portion of long-term borrowings, Accounts payables and Accrued expense:
¥ 65,116 million
5. Subordinated Borrowings
Subordinated borrowings of ¥ 26,666 million are included in Long-term borrowings from affiliates.
6. Guarantees and items of similar nature
(1) MUFG indemnifies the Bankers Association of Deutschland for the deposit liabilities of the branches of The Bank of
Tokyo-Mitsubishi UFJ Ltd., a subsidiary of MUFG, in Germany in accordance with regulations of the Deposit Insur-
ance Corporation of Deutschland. The amount indemnified by MUFG is ¥192,705 million.
(2) MUFG has entered into subordinated guarantee contracts with the issuers of the preferred securities and the paying
agent relating to the preferred securities of MUFG Capital Finance 1 Limited, MUFG Capital Finance 2 Limited and
MUFG Capital Finance 3 Limited.
Guaranteed Parties Amount of guarantee MUFG Capital Finance 1 Limited ¥ 271,515 million MUFG Capital Finance 2 Limited ¥ 117,997 million MUFG Capital Finance 3 Limited ¥ 120,000 million
Notes to Non-Consolidated Statements of Operations
1. Amounts of less than one million yen are rounded down. 2. Operating income from transactions with subsidiaries and affiliates
Dividends on investments in subsidiaries and affiliates ¥ 499,060 million Management fees from subsidiaries and affiliates ¥ 11,749 million
3. Major non-operating income from transactions with subsidiaries and affiliates
Interest on deposits ¥ 228 million
4. Major non-operating expenses from transactions with subsidiaries and affiliates
Interest on borrowings ¥ 15,008 million
5. Major items in General and administrative expenses (all items are classified as General expenses)
Salaries and employee benefits ¥ 3,555 million Outsourcing expenses ¥ 1,342 million Rental expenses for land, buildings and machines ¥ 520 million Legal expenses ¥ 440 million System related expenses ¥ 281 million Depreciation and amortization ¥ 263 million Advertisement ¥ 123 million Supplies expenses ¥ 105 million
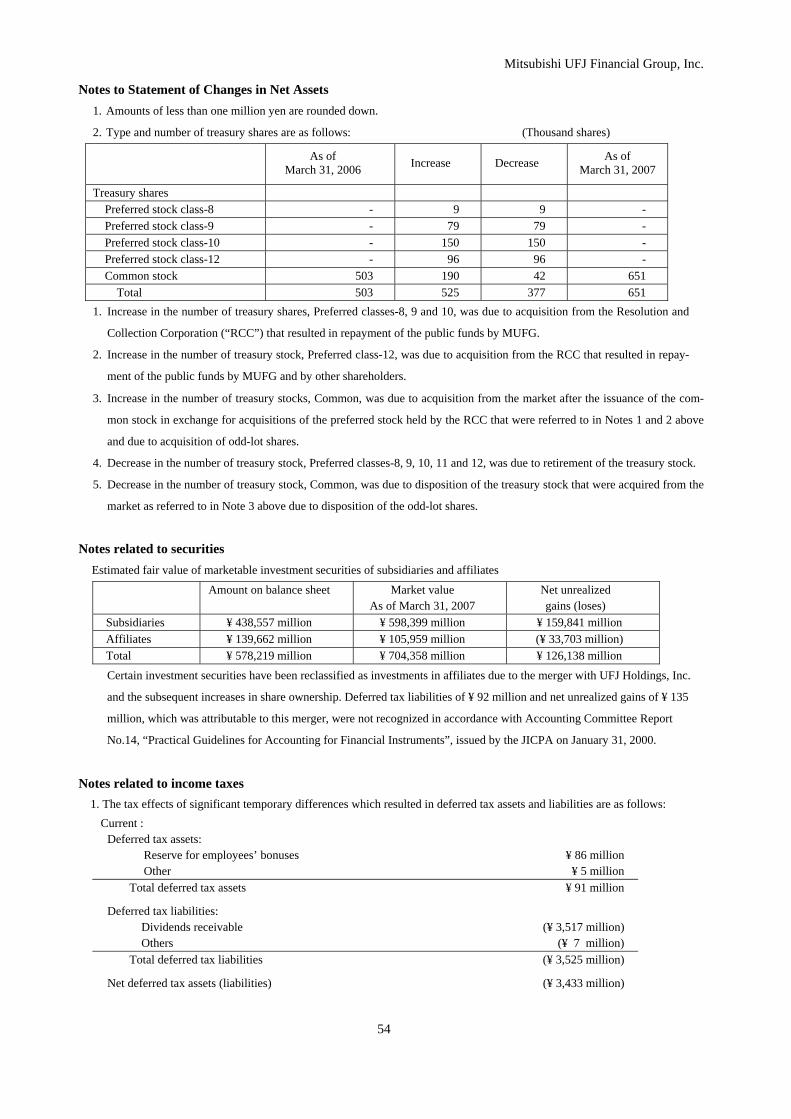
Mitsubishi UFJ Financial Group, Inc.
54
Notes to Statement of Changes in Net Assets 1. Amounts of less than one million yen are rounded down.
2. Type and number of treasury shares are as follows: (Thousand shares)
As of March 31, 2006 Increase Decrease As of
March 31, 2007
Treasury shares Preferred stock class-8 - 9 9 - Preferred stock class-9 - 79 79 - Preferred stock class-10 - 150 150 - Preferred stock class-12 - 96 96 -
Common stock 503 190 42 651 Total 503 525 377 651 1. Increase in the number of treasury shares, Preferred classes-8, 9 and 10, was due to acquisition from the Resolution and
Collection Corporation (“RCC”) that resulted in repayment of the public funds by MUFG.
2. Increase in the number of treasury stock, Preferred class-12, was due to acquisition from the RCC that resulted in repay-
ment of the public funds by MUFG and by other shareholders.
3. Increase in the number of treasury stocks, Common, was due to acquisition from the market after the issuance of the com-
mon stock in exchange for acquisitions of the preferred stock held by the RCC that were referred to in Notes 1 and 2 above
and due to acquisition of odd-lot shares.
4. Decrease in the number of treasury stock, Preferred classes-8, 9, 10, 11 and 12, was due to retirement of the treasury stock.
5. Decrease in the number of treasury stock, Common, was due to disposition of the treasury stock that were acquired from the
market as referred to in Note 3 above due to disposition of the odd-lot shares.
Notes related to securities Estimated fair value of marketable investment securities of subsidiaries and affiliates
Amount on balance sheet Market value As of March 31, 2007
Net unrealized gains (loses)
Subsidiaries ¥ 438,557 million ¥ 598,399 million ¥ 159,841 million Affiliates ¥ 139,662 million ¥ 105,959 million (¥ 33,703 million) Total ¥ 578,219 million ¥ 704,358 million ¥ 126,138 million
Certain investment securities have been reclassified as investments in affiliates due to the merger with UFJ Holdings, Inc.
and the subsequent increases in share ownership. Deferred tax liabilities of ¥ 92 million and net unrealized gains of ¥ 135
million, which was attributable to this merger, were not recognized in accordance with Accounting Committee Report
No.14, “Practical Guidelines for Accounting for Financial Instruments”, issued by the JICPA on January 31, 2000.
Notes related to income taxes 1. The tax effects of significant temporary differences which resulted in deferred tax assets and liabilities are as follows:
Current : Deferred tax assets:
Reserve for employees’ bonuses ¥ 86 million Other ¥ 5 million
Total deferred tax assets ¥ 91 million
Deferred tax liabilities: Dividends receivable (¥ 3,517 million) Others (¥ 7 million) Total deferred tax liabilities (¥ 3,525 million)
Net deferred tax assets (liabilities) (¥ 3,433 million)

Mitsubishi UFJ Financial Group, Inc.
55
Fixed : Deferred tax assets:
Investments in subsidiaries ¥ 1,596,211 million Net operating loss carryforwards ¥ 9,464 million Other ¥ 5,957 million
Subtotal ¥ 1,611,634 million Valuation allowance (¥ 1,610,888 million) Total deferred tax assets ¥ 745 million
Deferred tax liabilities: Investment securities (¥ 6,270 million)
Total deferred tax liabilities (¥ 6,270 million)
Net deferred tax assets (liabilities) (¥ 5,524 million)
2. A reconciliation between the effective statutory tax rate and the actual effective tax rate is as follows: Effective statutory tax rate 40.69 %
Reconciliation: Dividends and other permanent differences ( 41.51 %) Others 1.22 %
Actual Effective tax rate 0.40 % Per share information:
Net assets per common share ¥ 579,243.59 Net income per common share ¥ 46,415.96 Diluted net income per common share ¥ 46,189.46
(Notes) Basis for computing basic net income per common share and diluted net income per common share Net income per common share
Net income ¥ 473,893 million Total dividends on preferred stock ¥ 7,126 million Net income attributable to common shares ¥ 466,767 million Average number of common shares outstanding for the fiscal year 10,056,179.85 shares
Diluted net income per common share Adjustments in net income ¥ 1,126 million Common equivalent share 73,692.97 shares
Additional Information 1. Adoption of stock split and unit share system
Subject to the approval of the amendments of the articles of incorporation at the general meeting of shareholders that is scheduled
to be held on June 28, 2007, MUFG will adopt a stock split and unit share system that will be effective on September 30, 2007. In
order to expand the investment opportunity in MUFG for the individual investor, the investment unit will be reduced to one tenth
of the current amount after a 1,000 for 1 common stock split and the unit share system will be 100 common shares for one unit.
2. Subject to the approval of the general meeting of shareholders that is scheduled to be held on June 28, 2007 and of the relevant
authorities, MUFG concluded the share exchange agreement as of March 28, 2007, under which MUFG planned to make Mitsubi-
shi UFJ Securities Co., Ltd. a wholly-owned subsidiary by using the share exchange to enhance cooperation between group com-
panies and to conduct our business as a unified group. Under the share exchange agreement that will be effective on September 30,
2007, 1.02 shares of MUFG after the stock split mentioned in Note 1 above (0.00102 shares before the stock split) will be ex-
changed for one share of Mitsubishi UFJ Securities Co., Ltd. MUFG will not issue new shares in connection with this share ex-
change since no shares will be exchanged for the shares of Mitsubishi UFJ Securities that are held by MUFG and MUFG will de-
liver common treasury shares to the shareholders of Mitsubishi UFJ Securities Co., Ltd.

56
Mitsubishi UFJ Financial Group, Inc.
Changes of Directors and Corporate Auditors
Changes in Directors and Corporate Auditors have been disclosed separately on May 23, 2007.
Selected Financial Informationunder Japanese GAAP
For the Fiscal Year Ended March 31, 2007
Mitsubishi UFJ Financial Group, Inc.The Bank of Tokyo-Mitsubishi UFJ, Ltd.
Mitsubishi UFJ Trust and Banking Corporation
Mitsubishi UFJ Financial Group, Inc.
I. Financial Highlights under Japanese GAAP for the Fiscal Year Ended March 31, 2007
1. Financial Statements [ BTMU ][ MUTB ] ・・・・・ 1
2. Statements of Trust Assets and Liabilities [ MUTB ] ・・・・・ 7
3. Financial Results [ MUFG Consolidated ][ BTMU + MUTB ][ BTMU Consolidated ][ BTMU ][ MUTB Consolidated ][ MUTB ]
・・・・・ 9
4. Average Interest Spread [ BTMU ][ MUTB ] ・・・・・ 15
5. Notional Principal by the Remaining Life of the Interest Rate Swaps for Hedge-Accounting
[ MUFG Consolidated ][ BTMU Consolidated ][ MUTB Consolidated ]
・・・・・ 16
6. Securities [ MUFG Consolidated ][ BTMU ][ MUTB ] ・・・・・ 17
7. Return on Equity [ MUFG Consolidated ] ・・・・・ 20
8. Risk-Adjusted Capital Ratio Based on the Basel 2 Standards [ MUFG Consolidated ][ BTMU Consolidated ][ MUTB Consolidated ]
・・・・・ 21
Ⅱ. Loan Portfolio and Other
1. Risk-Monitored Loans [ MUFG Consolidated ][ BTMU ][ MUTB ][ Trust Accounts ]
・・・・・ 24
2. Non Performing Loans Based on the Financial Reconstruction Law (the ”FRL”)
[ BTMU + MUTB ][ BTMU ][ MUTB ][ Trust Accounts ]
・・・・・ 31
3. Progress in the Disposal of Problem Assets [ BTMU + MUTB ][ BTMU ][ MUTB ] ・・・・・ 35
4. Classification of Loans by Type of Industry, Domestic Consumer Loans, Domestic Loans to Small / Medium Sized Companies and Proprietors
[ BTMU + MUTB ][ BTMU ][ MUTB ][ Trust Accounts ]
・・・・・ 44
5. Overseas Loans [ BTMU + MUTB ] ・・・・・ 48
6. Loans and Deposits [ BTMU + MUTB ][ BTMU ][ MUTB ] ・・・・・ 49
7. Domestic Deposits [ BTMU + MUTB ][ BTMU ][ MUTB ] ・・・・・ 50
8. Number of Employees [ BTMU + MUTB ][ BTMU ][ MUTB ] ・・・・・ 51
9. Number of Offices [ BTMU + MUTB ][ BTMU ][ MUTB ] ・・・・・ 52
10. Status of Deferred Tax Assets [ BTMU ][ MUTB ] ・・・・・ 53
11. Employees' Retirement Benefits [ MUFG Consolidated ][ BTMU ][ MUTB ] ・・・・・ 55
12. Earnings Forecasts for Fiscal Year Ending March 31, 2008 [ MUFG Consolidated ][ MUFG ][ BTMU Consolidated ][ BTMU ][ MUTB Consolidated ][ MUTB ]
・・・・・ 58
[Contents]
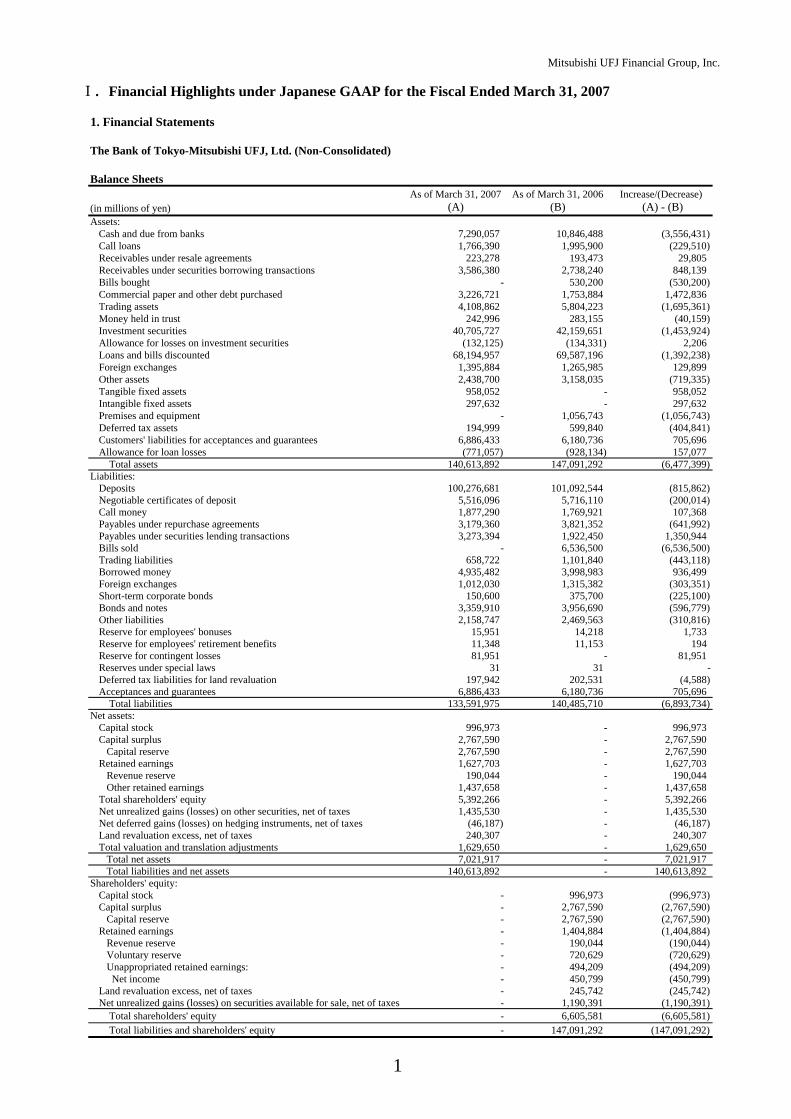
Mitsubishi UFJ Financial Group, Inc.
Ⅰ. Financial Highlights under Japanese GAAP for the Fiscal Ended March 31, 2007
1. Financial Statements
The Bank of Tokyo-Mitsubishi UFJ, Ltd. (Non-Consolidated)
Balance Sheets As of March 31, 2007 As of March 31, 2006 Increase/(Decrease)
(in millions of yen) (A) (B) (A) - (B)Assets:
Cash and due from banks 7,290,057 10,846,488 (3,556,431)Call loans 1,766,390 1,995,900 (229,510)Receivables under resale agreements 223,278 193,473 29,805Receivables under securities borrowing transactions 3,586,380 2,738,240 848,139Bills bought - 530,200 (530,200)Commercial paper and other debt purchased 3,226,721 1,753,884 1,472,836Trading assets 4,108,862 5,804,223 (1,695,361)Money held in trust 242,996 283,155 (40,159)Investment securities 40,705,727 42,159,651 (1,453,924)Allowance for losses on investment securities (132,125) (134,331) 2,206Loans and bills discounted 68,194,957 69,587,196 (1,392,238)Foreign exchanges 1,395,884 1,265,985 129,899Other assets 2,438,700 3,158,035 (719,335)Tangible fixed assets 958,052 - 958,052Intangible fixed assets 297,632 - 297,632Premises and equipment - 1,056,743 (1,056,743)Deferred tax assets 194,999 599,840 (404,841)Customers' liabilities for acceptances and guarantees 6,886,433 6,180,736 705,696Allowance for loan losses (771,057) (928,134) 157,077 Total assets 140,613,892 147,091,292 (6,477,399)
Liabilities:Deposits 100,276,681 101,092,544 (815,862)Negotiable certificates of deposit 5,516,096 5,716,110 (200,014)Call money 1,877,290 1,769,921 107,368Payables under repurchase agreements 3,179,360 3,821,352 (641,992)Payables under securities lending transactions 3,273,394 1,922,450 1,350,944Bills sold - 6,536,500 (6,536,500)Trading liabilities 658,722 1,101,840 (443,118)Borrowed money 4,935,482 3,998,983 936,499Foreign exchanges 1,012,030 1,315,382 (303,351)Short-term corporate bonds 150,600 375,700 (225,100)Bonds and notes 3,359,910 3,956,690 (596,779)Other liabilities 2,158,747 2,469,563 (310,816)Reserve for employees' bonuses 15,951 14,218 1,733Reserve for employees' retirement benefits 11,348 11,153 194Reserve for contingent losses 81,951 - 81,951Reserves under special laws 31 31 -Deferred tax liabilities for land revaluation 197,942 202,531 (4,588)Acceptances and guarantees 6,886,433 6,180,736 705,696 Total liabilities 133,591,975 140,485,710 (6,893,734)
Net assets:Capital stock 996,973 - 996,973Capital surplus 2,767,590 - 2,767,590 Capital reserve 2,767,590 - 2,767,590Retained earnings 1,627,703 - 1,627,703 Revenue reserve 190,044 - 190,044 Other retained earnings 1,437,658 - 1,437,658Total shareholders' equity 5,392,266 - 5,392,266Net unrealized gains (losses) on other securities, net of taxes 1,435,530 - 1,435,530Net deferred gains (losses) on hedging instruments, net of taxes (46,187) - (46,187)Land revaluation excess, net of taxes 240,307 - 240,307Total valuation and translation adjustments 1,629,650 - 1,629,650 Total net assets 7,021,917 - 7,021,917 Total liabilities and net assets 140,613,892 - 140,613,892
Shareholders' equity:Capital stock - 996,973 (996,973)Capital surplus - 2,767,590 (2,767,590) Capital reserve - 2,767,590 (2,767,590)Retained earnings - 1,404,884 (1,404,884) Revenue reserve - 190,044 (190,044) Voluntary reserve - 720,629 (720,629) Unappropriated retained earnings: - 494,209 (494,209) Net income - 450,799 (450,799)Land revaluation excess, net of taxes - 245,742 (245,742)Net unrealized gains (losses) on securities available for sale, net of taxes - 1,190,391 (1,190,391) Total shareholders' equity - 6,605,581 (6,605,581) Total liabilities and shareholders' equity - 147,091,292 (147,091,292)
1
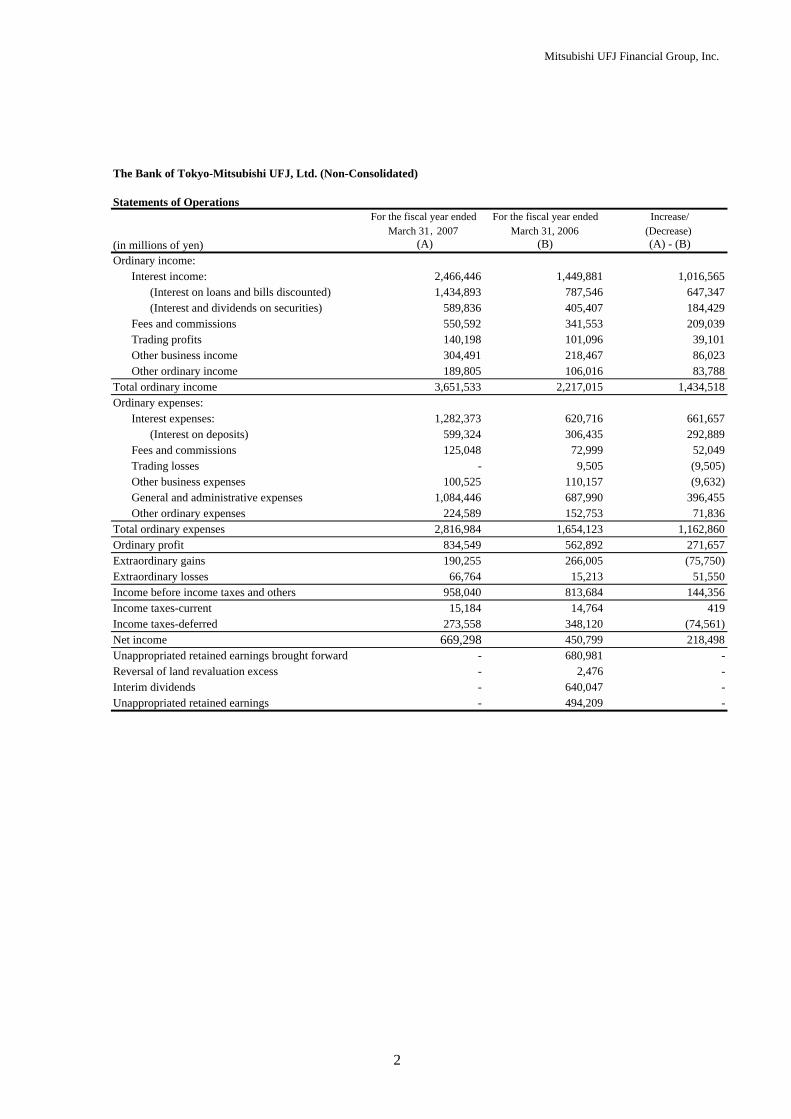
Mitsubishi UFJ Financial Group, Inc.
The Bank of Tokyo-Mitsubishi UFJ, Ltd. (Non-Consolidated)
Statements of OperationsFor the fiscal year ended For the fiscal year ended Increase/
March 31,2007 March 31, 2006 (Decrease)(in millions of yen) (A) (B) (A) - (B)Ordinary income:
Interest income: 2,466,446 1,449,881 1,016,565(Interest on loans and bills discounted) 1,434,893 787,546 647,347(Interest and dividends on securities) 589,836 405,407 184,429
Fees and commissions 550,592 341,553 209,039Trading profits 140,198 101,096 39,101Other business income 304,491 218,467 86,023Other ordinary income 189,805 106,016 83,788
Total ordinary income 3,651,533 2,217,015 1,434,518Ordinary expenses:
Interest expenses: 1,282,373 620,716 661,657(Interest on deposits) 599,324 306,435 292,889
Fees and commissions 125,048 72,999 52,049Trading losses - 9,505 (9,505)Other business expenses 100,525 110,157 (9,632)General and administrative expenses 1,084,446 687,990 396,455Other ordinary expenses 224,589 152,753 71,836
Total ordinary expenses 2,816,984 1,654,123 1,162,860Ordinary profit 834,549 562,892 271,657Extraordinary gains 190,255 266,005 (75,750)Extraordinary losses 66,764 15,213 51,550Income before income taxes and others 958,040 813,684 144,356Income taxes-current 15,184 14,764 419Income taxes-deferred 273,558 348,120 (74,561)Net income 669,298 450,799 218,498Unappropriated retained earnings brought forward - 680,981 -Reversal of land revaluation excess - 2,476 -Interim dividends - 640,047 -Unappropriated retained earnings - 494,209 -
2
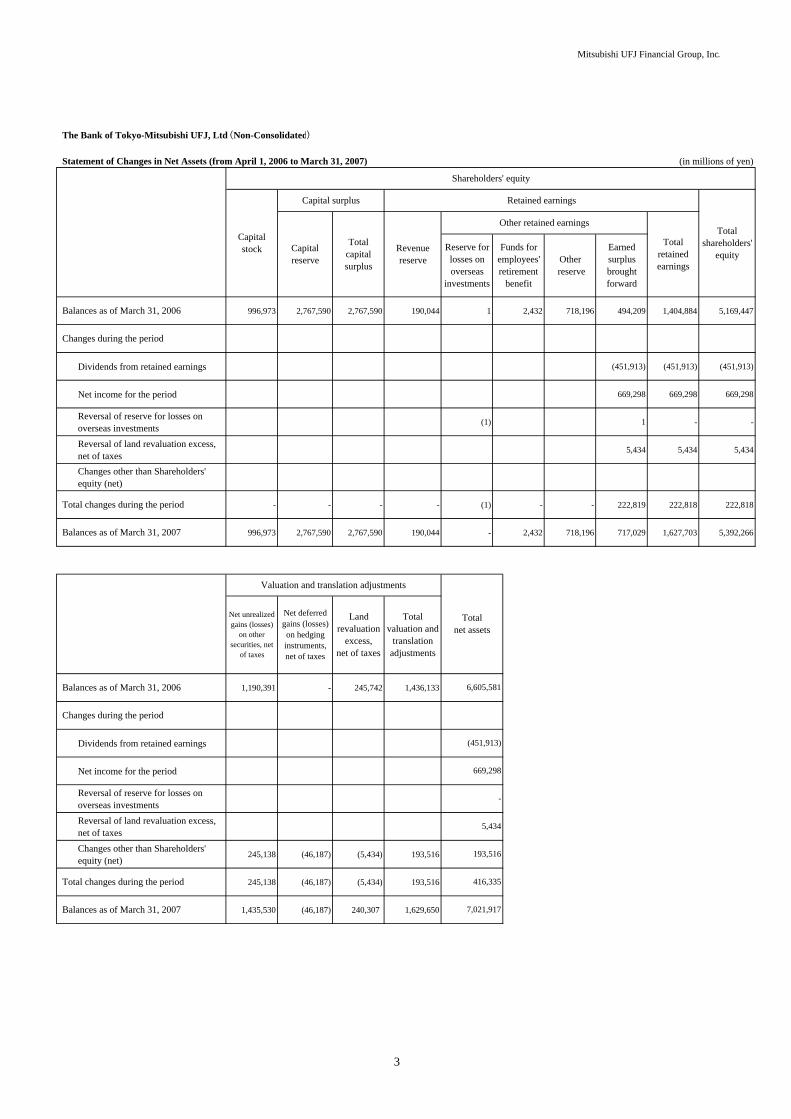
Mitsubishi UFJ Financial Group, Inc.
The Bank of Tokyo-Mitsubishi UFJ, Ltd.(Non-Consolidated)
Statement of Changes in Net Assets (from April 1, 2006 to March 31, 2007) (in millions of yen)
996,973 2,767,590 2,767,590 190,044 1 2,432 718,196 494,209 1,404,884 5,169,447
Dividends from retained earnings (451,913) (451,913) (451,913)
Net income for the period 669,298 669,298 669,298
Reversal of reserve for losses onoverseas investments
(1) 1 - -
Reversal of land revaluation excess,net of taxes
5,434 5,434 5,434
Changes other than Shareholders'equity (net)
- - - - (1) - - 222,819 222,818 222,818
996,973 2,767,590 2,767,590 190,044 - 2,432 718,196 717,029 1,627,703 5,392,266
1,190,391 - 245,742 1,436,133
Dividends from retained earnings
Net income for the period
Reversal of reserve for losses onoverseas investmentsReversal of land revaluation excess,net of taxesChanges other than Shareholders'equity (net)
245,138 (46,187) (5,434) 193,516
245,138 (46,187) (5,434) 193,516
1,435,530 (46,187) 240,307 1,629,650 7,021,917
-
5,434
193,516
416,335
6,605,581
(451,913)
669,298
Capitalstock
Capital surplus
Valuation and translation adjustments
Totalnet assets
Net unrealizedgains (losses)
on othersecurities, net
of taxes
Net deferredgains (losses)on hedginginstruments,net of taxes
Landrevaluation
excess,net of taxes
Totalvaluation and
translationadjustments
Earnedsurplusbroughtforward
Retained earnings
Balances as of March 31, 2007
Capitalreserve
Totalcapitalsurplus
Revenuereserve
Balances as of March 31, 2007
Total changes during the period
Balances as of March 31, 2006
Changes during the period
Balances as of March 31, 2006
Changes during the period
Total changes during the period
Shareholders' equity
Totalshareholders'
equityTotal
retainedearnings
Other retained earnings
Reserve forlosses onoverseas
investments
Funds foremployees'retirement
benefit
Other reserve
3

Mitsubishi UFJ Financial Group, Inc.
Mitsubishi UFJ Trust and Banking Corporation (Non-Consolidated)
Balance Sheets As of March 31,2007 As of March 31,2006 Increase/(Decrease)
(in millions of yen) (A) (B) (A) - (B)Assets:
Cash and due from banks 888,167 798,172 89,994Call loans 177,100 25,293 151,806Receivables under securities borrowing transactions 150,638 233,697 (83,059)Commercial paper and other debt purchased 95,235 151,415 (56,179)Trading assets 237,307 314,489 (77,182)Money held in trust 9,559 13,001 (3,442)Investment securities 6,836,277 5,791,091 1,045,186Allowance for losses on investment securities (577) (167) (409)Loans and bills discounted 9,890,460 10,391,395 (500,934)Foreign exchanges 5,203 5,148 55Other assets 650,789 680,672 (29,882)Tangible fixed assets 108,462 ‐ 108,462Intangible fixed assets 60,401 ‐ 60,401Premises and equipment ‐ 171,314 (171,314)Customers' liabilities for acceptances and guarantees 257,412 236,807 20,605Allowance for loan losses (122,979) (124,448) 1,468 Total assets 19,243,460 18,687,883 555,577
Liabilities:Deposits 11,764,679 11,889,329 (124,650)Negotiable certificates of deposit 1,724,653 1,224,847 499,806Call money 292,026 67,677 224,348Payables under repurchase agreements 250,604 33,999 216,604Payables under securities lending transactions 202,248 484,854 (282,606)Bills sold ‐ 449,400 (449,400)Trading liabilities 32,706 55,493 (22,786)Borrowed money 916,365 234,228 682,136Foreign exchanges 592 699 (107)Short-term corporate bonds 81,900 10,200 71,700Bonds and notes 299,900 359,400 (59,500)Due to trust accounts 1,328,469 1,761,850 (433,380)Other liabilities 291,927 317,345 (25,418)Reserve for employees' bonuses 4,432 4,343 88Reserve for bonuses for directors and corporate auditors 90 ‐ 90Reserve for employees' retirement benefits ‐ 8,709 (8,709)Reserve for contingent losses 9,612 ‐ 9,612Deferred tax liabilities 92,284 7,085 85,198Deferred tax liabilities for land revaluation 6,150 6,401 (251)Acceptances and guarantees 257,412 236,807 20,605 Total liabilities 17,556,056 17,152,675 403,381
Net assets:Capital stock 324,279 ‐ 324,279Capital surplus: 530,334 ‐ 530,334 Capital reserve 250,619 ‐ 250,619 Other capital surplus 279,714 ‐ 279,714Retained earnings: 434,303 ‐ 434,303 Revenue reserve 73,714 ‐ 73,714 Other retained earnings 360,589 ‐ 360,589Total shareholders' equity 1,288,916 ‐ 1,288,916Net unrealized gains (losses) on other securities, net of taxes 415,045 ‐ 415,045Net deferred gains (losses) on hedging instruments, net of taxes (6,858) ‐ (6,858)Land revaluation excess, net of taxes (9,699) ‐ (9,699)Total valuation and translation adjustments 398,487 ‐ 398,487 Total net assets 1,687,403 ‐ 1,687,403 Total liabilities and net assets 19,243,460 ‐ 19,243,460
Shareholders' equity:Capital stock ‐ 324,279 (324,279)Capital surplus: ‐ 582,419 (582,419) Capital reserve ‐ 582,419 (582,419)Retained earnings: ‐ 260,964 (260,964) Revenue reserve ‐ 73,714 (73,714) Voluntary reserve ‐ 189,206 (189,206) Unabsorbed losses: ‐ 1,955 (1,955) Net income ‐ 147,211 (147,211)Land revaluation excess, net of taxes ‐ (10,721) 10,721Net unrealized gains (losses) on securities available for sale, net of taxes ‐ 378,266 (378,266) Total shareholders' equity ‐ 1,535,208 (1,535,208) Total liabilities and shareholders' equity ‐ 18,687,883 (18,687,883)
4

Mitsubishi UFJ Financial Group, Inc.
Mitsubishi UFJ Trust and Banking Corporation (Non-Consolidated)
Statements of OperationsFor the fiscal year ended For the fiscal year ended Increase/
March 31,2007 March 31, 2006 (Decrease)(in millions of yen) (A) (B) (A) - (B)Ordinary income:
Trust fees 111,075 92,221 18,853Interest income: 348,257 274,139 74,117
(Interest on loans and bills discounted) 143,732 109,555 34,176(Interest and dividends on securities) 171,645 129,996 41,649
Fees and commissions 165,111 126,163 38,947Trading profits 17,197 363 16,834Other business income 28,407 51,392 (22,984)Other ordinary income 39,031 37,260 1,771
Total ordinary income 709,081 581,540 127,540Ordinary expenses:
Interest expenses: 123,150 94,531 28,618(Interest on deposits) 67,282 57,721 9,560
Fees and commissions 24,087 16,372 7,714Trading losses 172 5,558 (5,386)Other business expenses 51,319 39,337 11,981General and administrative expenses 204,764 184,496 20,267Other ordinary expenses 27,228 24,662 2,565
Total ordinary expenses 430,721 364,959 65,761Ordinary profit 278,360 216,581 61,778Extraordinary gains 10,558 64,238 (53,680)Extraordinary losses 4,844 20,347 (15,502)Income before income taxes and others 284,073 260,472 23,600Income taxes-current 631 (2,392) 3,023Income taxes-deferred 71,800 115,653 (43,853)Net income 211,642 147,211 64,430Unappropriated retained earnings brought forward - 20,600 -
- 21,004 -Reversal of land revaluation excess - (762) -Interim dividends - 190,010 -Unabsorbed losses - 1,955 -
Unappropriated retained earnings acquired resulting from the merger
5
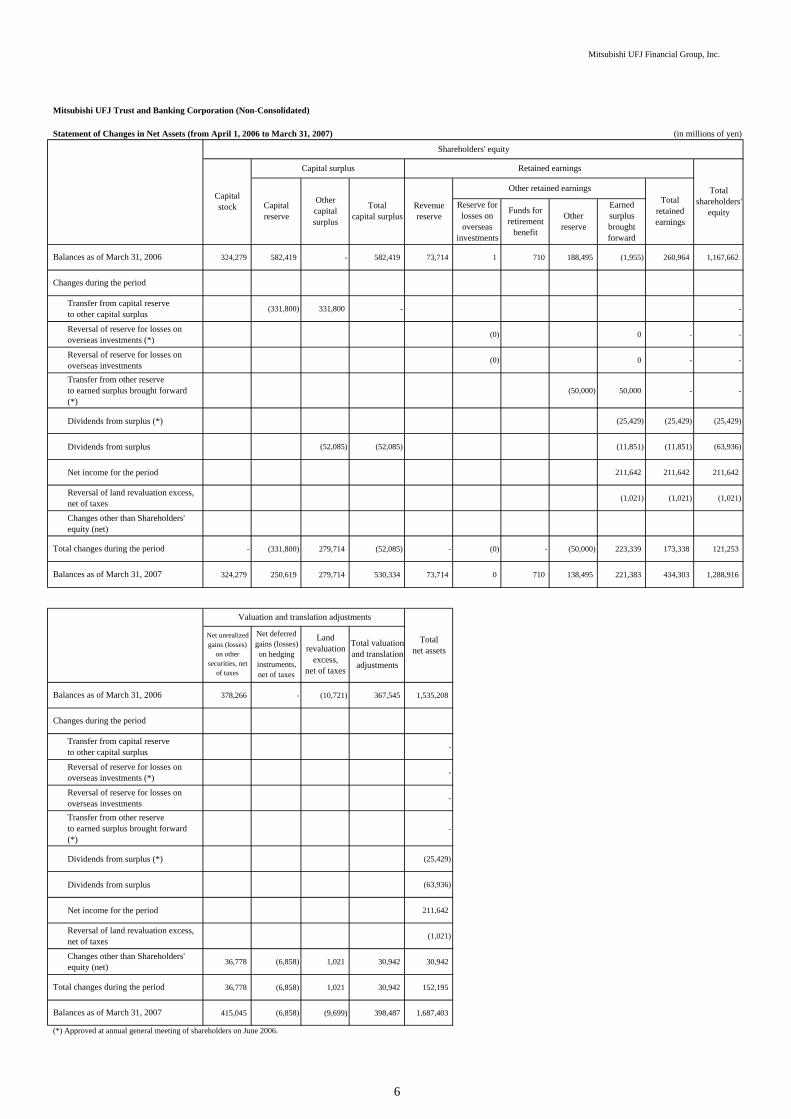
Mitsubishi UFJ Financial Group, Inc.
Mitsubishi UFJ Trust and Banking Corporation (Non-Consolidated)
Statement of Changes in Net Assets (from April 1, 2006 to March 31, 2007) (in millions of yen)
324,279 582,419 - 582,419 73,714 1 710 188,495 (1,955) 260,964 1,167,662
Transfer from capital reserveto other capital surplus (331,800) 331,800 - -
Reversal of reserve for losses onoverseas investments (*) (0) 0 - -
Reversal of reserve for losses onoverseas investments (0) 0 - -
Transfer from other reserveto earned surplus brought forward(*)
(50,000) 50,000 - -
Dividends from surplus (*) (25,429) (25,429) (25,429)
Dividends from surplus (52,085) (52,085) (11,851) (11,851) (63,936)
Net income for the period 211,642 211,642 211,642
Reversal of land revaluation excess,net of taxes (1,021) (1,021) (1,021)
Changes other than Shareholders'equity (net)
- (331,800) 279,714 (52,085) - (0) - (50,000) 223,339 173,338 121,253
324,279 250,619 279,714 530,334 73,714 0 710 138,495 221,383 434,303 1,288,916
378,266 - (10,721) 367,545 1,535,208
Transfer from capital reserveto other capital surplus -
Reversal of reserve for losses onoverseas investments (*) -
Reversal of reserve for losses onoverseas investments -
Transfer from other reserveto earned surplus brought forward(*)
-
Dividends from surplus (*) (25,429)
Dividends from surplus (63,936)
Net income for the period 211,642
Reversal of land revaluation excess,net of taxes (1,021)
Changes other than Shareholders'equity (net) 36,778 (6,858) 1,021 30,942 30,942
36,778 (6,858) 1,021 30,942 152,195
415,045 (6,858) (9,699) 398,487 1,687,403
Totalnet assets
Valuation and translation adjustments
Net deferredgains (losses)on hedginginstruments,net of taxes
Landrevaluation
excess,net of taxes
Total changes during the period
Balances as of March 31, 2006
Changes during the period
Shareholders' equity
Totalshareholders'
equityTotal
retainedearnings
Other retained earnings
Reserve forlosses onoverseas
investments
Funds forretirement
benefit
Otherreserve
Balances as of March 31, 2007
Total valuationand translation
adjustments
Total changes during the period
Net unrealizedgains (losses)
on othersecurities, net
of taxes
Retained earnings
Totalcapital surplus
Capitalstock
Capital surplus
Earnedsurplusbroughtforward
Othercapitalsurplus
Revenuereserve
Capitalreserve
Balances as of March 31, 2006
Changes during the period
Balances as of March 31, 2007
(*) Approved at annual general meeting of shareholders on June 2006.
6

Mitsubishi UFJ Financial Group, Inc.
2. Statements of Trust Assets and Liabilities
Mitsubishi UFJ Trust and Banking Corporation (Non-Consolidated)(1) Statements of Trust Assets and Liabilities including Trust Assets under Service-Shared Co-Trusteeship
As of March 31,2007 As of March 31, 2006 Increase/(A) (B) (Decrease)
(in millions of yen) (A) - (B)Assets:
Loans and bills discounted 318,762 350,037 (31,275)Loans on bills 306,736 339,762 (33,026)Loans on deeds 12,026 10,275 1,750
Securities 51,797,506 49,971,674 1,825,832Government bonds 13,804,392 13,015,914 788,478Municipal bonds 1,867,354 1,691,445 175,908Short-term corporate bonds 57,978 ‐ 57,978Corporate bonds 9,178,301 9,078,077 100,223Equity securities 12,794,546 12,071,562 722,984Foreign securities 11,470,409 11,756,293 (285,883)Other securities 2,624,523 2,358,380 266,142
Beneficiary rights to the trust 24,954,882 24,690,554 264,328Securities held in custody accounts 1,327,575 1,129,454 198,121Money claims 12,639,248 11,398,024 1,241,224
Other money claims 12,639,248 11,398,024 1,241,224Tangible fixed assets 7,810,422 ‐ 7,810,422
Premises 42,035 ‐ 42,035Equipment 7,768,387 ‐ 7,768,387
Intangible fixed assets 91,057 ‐ 91,057Surface rights 24,791 ‐ 24,791Real estate lease rights 63,820 ‐ 63,820Other intangible fixed assets 2,445 ‐ 2,445
Premises and equipment ‐ 6,363,329 (6,363,329)Premises ‐ 27,294 (27,294)Equipment ‐ 6,336,034 (6,336,034)
Surface rights ‐ 17,805 (17,805)Land lease rights ‐ 52,094 (52,094)Other claims 3,005,010 2,333,082 671,928Call loans 1,321,679 1,396,008 (74,329)Due from banking account 1,542,327 2,428,889 (886,562)Cash and due from banks 1,442,039 1,054,442 387,597
Cash 367 393 (25)Due from banks 1,441,671 1,054,048 387,622
Total assets 106,250,513 101,185,395 5,065,118Liabilities:
Money trusts 30,086,680 29,699,587 387,093Pension trusts 13,444,615 12,150,927 1,293,687Property formation benefit trusts 13,978 14,583 (604)Loan trusts 379,728 653,459 (273,731)Investment trusts 23,220,314 22,892,430 327,884Money entrusted other than money trusts 2,909,555 2,946,860 (37,304)Securities trusts 1,773,451 1,560,549 212,902Money claim trusts 13,099,740 11,783,807 1,315,932Equipment trusts 42,461 27,027 15,433Land and fixtures trusts 114,487 118,056 (3,569)Land leases trusts ‐ 265 (265)Composite trusts 21,165,498 19,337,839 1,827,659Other trusts ‐ 0 (0)Total liabilities 106,250,513 101,185,395 5,065,118
7

Mitsubishi UFJ Financial Group, Inc.
Mitsubishi UFJ Trust and Banking Corporation (Non-Consolidated)
(2) Supplemental Data as of March 31, 2007
Detailed information for designated money trusts and loan trusts which repayment of the principal to the customers is guaranteed,including trusts for which beneficiary interests are re-entrusted.
Money trusts (in millions of yen)Assets: Liabilities:Loans and bills discounted 170,826 Principal 1,594,472Securities 467,820 Allowance for bad debts 514Other 1,039,372 Other 83,032Total 1,678,019 Total 1,678,019
Loan trusts (in millions of yen)Assets: Liabilities:Loans and bills discounted - Principal 378,556Securities - Special internal reserves 2,374Other 382,305 Other 1,375Total 382,305 Total 382,305
(3) Comparison of major items
As of March 31, As of March 31, Increase/2007 2006 (Decrease)
(in millions of yen) (A) (B) (A) - (B)Total funds 57,414,336 55,632,735 1,781,601
Deposits 11,764,679 11,889,329 (124,650)Negotiable certificates of deposit 1,724,653 1,224,847 499,806Money trusts 30,086,680 29,699,587 387,093Pension trusts 13,444,615 12,150,927 1,293,687Property formation benefit trusts 13,978 14,583 (604)Loan trusts 379,728 653,459 (273,731)
Loans and bills discounted 10,209,222 10,741,432 (532,210)Banking account 9,890,460 10,391,395 (500,934)Trust account 318,762 350,037 (31,275)
Investment securities 58,633,784 55,762,765 2,871,018Note: Tables shown above includes master trust assets under the service-shared co-trusteeship between Mitsubishi UFJ Trust and Banking Corporation and The Master Trust Bank of Japan, Ltd.
8

Mitsubishi UFJ Financial Group, Inc.
3. Financial Results
Mitsubishi UFJ Financial Group, Inc. (Consolidated) Financial Results
(in millions of yen)Increase/
March 31, 2007 March 31, 2006 (Decrease)(A) (B) (A) - (B)
Gross profits 3,726,674 3,609,991 116,683(Gross profits before credit costs for trust accounts) 3,726,793 3,610,913 115,879
Net interest income 1,904,467 1,857,901 46,565Trust fees 152,945 146,619 6,325
Credit costs for trust accounts (1) (118) (921) 803Net fees and commissions 1,158,623 1,099,706 58,917Net trading profits 315,042 161,576 153,466Net other business income 195,595 344,187 (148,592)
Net gains (losses) on debt securities (18,884) (29,499) 10,614General and administrative expenses 2,074,029 1,925,327 148,702
Amortization of goodwill 9,047 - 9,047Net business profits before credit costs for trust accounts, provision for general allowance for loan losses and amortization of goodwillNet business profits before credit costs for trust accounts and provision for general allowance for loan losses Provision for general allowance for loan losses (2) - - -Net business profits* 1,652,645 1,684,664 (32,019)Net non-recurring gains (losses) (195,565) (251,355) 55,790
Credit related costs (3) (196,138) (218,295) 22,156Losses on loan write-offs (193,368) (153,740) (39,628)Provision for specific allowance for loan losses - - - Other credit related costs (2,770) (64,554) 61,784
Net gains (losses) on equity securities 127,176 60,902 66,273Gains on sales of equity securities 169,738 122,757 46,980Losses on sales of equity securities (3,830) (26,146) 22,315Losses on write down of equity securities (38,731) (35,708) (3,022)
Profits (losses) from investments in affiliates (80,621) 20,243 (100,864)Other (45,981) (114,206) 68,225
Amortization of goodwill 3,210 (16,294) 19,505Ordinary profit 1,457,080 1,433,308 23,771Net extraordinary gains (losses) 51,650 634,252 (582,601)
Gains on loans written-off (4) 111,229 100,843 10,386Reversal of allowance for loan losses (5) 9,337 608,957 (599,620)
(18,641) (43,701) 25,060Income before income taxes and others 1,508,730 2,067,561 (558,830)Income taxes-current 115,091 140,994 (25,903)Income taxes-deferred 413,731 645,399 (231,667)Minority interests 98,910 99,390 (479)Net income 880,997 1,181,777 (300,779)
* Net business profits = Banking subsidiaries' Net business profits + Other consolidated entities' gross profits - Otherconsolidated entities' general and administrative expenses - Other consolidated entities' provision for general allowance for loanlosses - Amortization of goodwill - Inter-company transactions
(Reference)Total credit costs (1)+(2)+(3)+(5) (186,920) 389,740 (576,661)
(75,691) 490,584 (566,275)
Number of consolidated subsidiaries 253 248 5Number of affiliated companies accounted for under the equity method 48 42 6
Losses on impairment of fixed assets
Note:
Total credit costs + Gains on loans written-off (1)+(2)+(3)+(4)+(5)
(32,822)1,652,764 1,685,586
The amounts presented as of March 31, 2006 include amounts of former Mitsubishi Tokyo Financial Group, Inc. (April - September), former UFJHoldings, Inc. (April - September) and Mitsubishi UFJ Financial Group, Inc. (October - March).
For the fiscal year ended
1,661,811 1,685,586 (23,774)
9

Mitsubishi UFJ Financial Group, Inc.
The Bank of Tokyo-Mitsubishi UFJ, Ltd. and Mitsubishi UFJ Trust and Banking Corporation (Combined)Financial Results
(in millions of yen)Increase/
March 31, 2007 March 31, 2006 (Decrease)(A) (B) (A) - (B)
Gross profits 2,428,014 2,546,763 (118,749)(Gross profits before credit costs for trust accounts) 2,428,133 2,547,685 (119,552)
Net interest income 1,412,093 1,515,066 (102,973)Trust fees 111,075 116,167 (5,092)
Credit costs for trust accounts (1) (118) (921) 803 Net fees and commissions 566,568 553,749 12,819 Net trading profits 157,224 19,184 138,039 Net other business income 181,053 342,595 (161,542)
Net gains (losses) on debt securities (15,664) (15,818) 153 General and administrative expenses 1,254,039 1,207,276 46,763 Net business profits before credit costs for trust accounts
and provision for general allowance for loan lossesProvision for general allowance for loan losses (2) (1,758) ‐ (1,758)Net business profits 1,172,216 1,339,487 (167,271)Net non-recurring gains (losses) (59,306) (161,060) 101,753
Credit related costs (3) (129,141) (163,465) 34,323 Losses on loan write-offs (116,606) (114,218) (2,387)Provision for specific allowance for loan losses (4,558) ‐ (4,558)Other credit related costs (7,976) (49,247) 41,270
Net gains (losses) on equity securities 108,474 133,319 (24,844)Gains on sales of equity securities 153,197 186,896 (33,698)Losses on sales of equity securities (3,176) (12,562) 9,385 Losses on write down of equity securities (41,545) (41,014) (531)
Other (38,639) (130,914) 92,274 Ordinary profit 1,112,909 1,178,427 (65,517)Net extraordinary gains (losses) 129,204 741,311 (612,107)
Gains on loans written-off (4) 102,005 88,999 13,006 Reversal of allowance for loan losses (5) 90,556 696,155 (605,598)
(15,190) (20,190) 4,999 Income before income taxes and others 1,242,113 1,919,738 (677,624)Income taxes-current 15,815 15,219 596 Income taxes-deferred 345,358 622,280 (276,922)Net income 880,940 1,282,239 (401,299)
(Reference)Total credit costs (1)+(2)+(3)+(5) (40,462) 531,768 (572,230)
61,543 620,767 (559,224)
The amounts presented as of March 31, 2006 include amounts of former The Bank of Tokyo-Mitsubishi, Ltd. (April - December), former UFJ BankLimited (April - December), The Bank of Tokyo-Mitsubishi UFJ, Ltd. (January - March), former The Mitsubishi Trust and Banking Corporation (April- September), former UFJ Trust Bank Limited (April - September) and Mitsubishi UFJ Trust and Banking Corporation (October - March).
Total credit costs + Gains on loans written-off (1)+(2)+(3)+(4)+(5)
For the fiscal year ended
1,174,093 1,340,409 (166,315)
Losses on impairment of fixed assets
10

Mitsubishi UFJ Financial Group. Inc.
The Bank of Tokyo-Mitsubishi UFJ, Ltd. (Consolidated)Financial Results
(in millions of yen)Increase/
March 31, 2007 March 31, 2006 (Decrease)(A) (B) (A) - (B)
Gross profits 2,907,417 2,864,946 42,471 Net interest income 1,719,800 1,683,594 36,206 Trust fees 24,562 21,551 3,010 Net fees and commissions 807,590 774,450 33,140 Net trading profits 144,088 37,943 106,144 Net other business income 211,375 347,406 (136,030)
Net gains (losses) on debt securities (2,285) (24,160) 21,875 General and administrative expenses 1,614,485 1,533,998 80,486
Amortization of goodwill 1,675 - 1,675 Net business profits before provision for general allowancefor loan losses and amortization of goodwillNet business profits before provision for general allowancefor loan losses Provision for general allowance for loan losses (1) - - -Net business profits* 1,292,931 1,330,947 (38,015)Net non-recurring gains (losses) (114,453) (187,098) 72,644
Credit related costs (2) (200,788) (184,902) (15,886)Losses on loan write-offs (191,280) (140,187) (51,093)Provision for specific allowance for loan losses - - -Other credit related costs (9,507) (44,714) 35,207
Net gains (losses) on equity securities 108,658 56,529 52,129 Gains on sales of equity securities 138,811 107,860 30,950 Losses on sales of equity securities (1,305) (21,999) 20,693 Losses on write-down of equity securities (28,846) (29,332) 485
Profits (losses) from investments in affiliates 11,826 13,672 (1,846)Other (34,149) (72,398) 38,248
Amortization of goodwill - (15,425) 15,425 Ordinary profit 1,178,478 1,143,848 34,629 Net extraordinary gains (losses) 52,522 599,419 (546,897)
Gains on loans written-off (3) 101,128 91,149 9,979 Reversal of allowance for loan losses (4) 12,087 528,302 (516,214)Losses on impairment of fixed assets (12,520) (18,136) 5,616
Income before income taxes and others 1,231,000 1,743,268 (512,268)Income taxes-current 65,071 103,833 (38,762)Income taxes-deferred 348,456 465,981 (117,525)Minority interests 72,988 64,909 8,079 Net income 744,484 1,108,544 (364,059)
Net business profits = Net business profits of The Bank of Tokyo-Mitsubishi UFJ + consolidated entities' gross profits - consolidated entities' general and administrative expenses - consolidated entities' provision for general allowance for loanlosses - Amortization of goodwill - Inter-company transactions.
(Reference)Total credit costs (1)+(2)+(4) (188,701) 343,400 (532,101)
Total credit costs + Gains on loans written-off (1)+(2)+(3)+(4) (87,572) 434,549 (522,121)
Number of consolidated subsidiaries 179 174 5 Number of affiliated companies accounted for under the equity method 50 45 5
*
1,292,931 1,330,947
The amounts presented as of March 31, 2006 include amounts of former The Bank of Tokyo-Mitsubishi, Ltd. (April - December), former UFJ BankLimited (April - December) and The Bank of Tokyo-Mitsubishi UFJ, Ltd. (January - March).
Note:
For the fiscal year ended
(38,015)
1,294,607 1,330,947 (36,339)
11
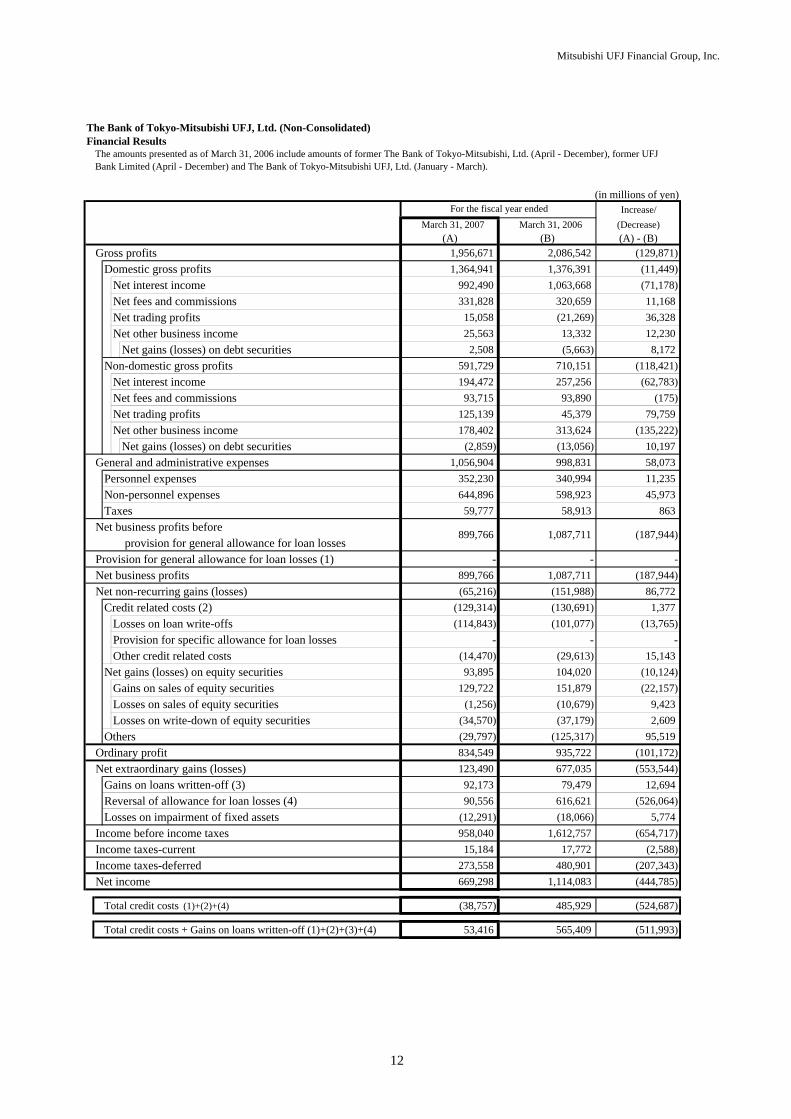
Mitsubishi UFJ Financial Group, Inc.
The Bank of Tokyo-Mitsubishi UFJ, Ltd. (Non-Consolidated)Financial Results
(in millions of yen)Increase/
March 31, 2007 March 31, 2006 (Decrease)(A) (B) (A) - (B)
Gross profits 1,956,671 2,086,542 (129,871)Domestic gross profits 1,364,941 1,376,391 (11,449)
Net interest income 992,490 1,063,668 (71,178)Net fees and commissions 331,828 320,659 11,168 Net trading profits 15,058 (21,269) 36,328 Net other business income 25,563 13,332 12,230
Net gains (losses) on debt securities 2,508 (5,663) 8,172 Non-domestic gross profits 591,729 710,151 (118,421)
Net interest income 194,472 257,256 (62,783)Net fees and commissions 93,715 93,890 (175)Net trading profits 125,139 45,379 79,759 Net other business income 178,402 313,624 (135,222)
Net gains (losses) on debt securities (2,859) (13,056) 10,197 General and administrative expenses 1,056,904 998,831 58,073
Personnel expenses 352,230 340,994 11,235 Non-personnel expenses 644,896 598,923 45,973 Taxes 59,777 58,913 863
Net business profits before provision for general allowance for loan losses
Provision for general allowance for loan losses (1) - - -Net business profits 899,766 1,087,711 (187,944)Net non-recurring gains (losses) (65,216) (151,988) 86,772
Credit related costs (2) (129,314) (130,691) 1,377 Losses on loan write-offs (114,843) (101,077) (13,765)Provision for specific allowance for loan losses - - -Other credit related costs (14,470) (29,613) 15,143
Net gains (losses) on equity securities 93,895 104,020 (10,124)Gains on sales of equity securities 129,722 151,879 (22,157)Losses on sales of equity securities (1,256) (10,679) 9,423 Losses on write-down of equity securities (34,570) (37,179) 2,609
Others (29,797) (125,317) 95,519 Ordinary profit 834,549 935,722 (101,172)Net extraordinary gains (losses) 123,490 677,035 (553,544)
Gains on loans written-off (3) 92,173 79,479 12,694 Reversal of allowance for loan losses (4) 90,556 616,621 (526,064)Losses on impairment of fixed assets (12,291) (18,066) 5,774
Income before income taxes 958,040 1,612,757 (654,717)Income taxes-current 15,184 17,772 (2,588)Income taxes-deferred 273,558 480,901 (207,343)Net income 669,298 1,114,083 (444,785)
Total credit costs (1)+(2)+(4) (38,757) 485,929 (524,687)
Total credit costs + Gains on loans written-off (1)+(2)+(3)+(4) 53,416 565,409 (511,993)
The amounts presented as of March 31, 2006 include amounts of former The Bank of Tokyo-Mitsubishi, Ltd. (April - December), former UFJBank Limited (April - December) and The Bank of Tokyo-Mitsubishi UFJ, Ltd. (January - March).
For the fiscal year ended
899,766 1,087,711 (187,944)
12

Mitsubishi UFJ Financial Group, Inc.
Mitsubishi UFJ Trust and Banking Corporation (Consolidated)Financial Results
(in millions of yen)Increase/
March 31, 2007 March 31, 2006 (Decrease)(A) (B) (A) - (B)
Gross profits 515,207 500,614 14,593 (Gross profits before credit costs for trust accounts) 515,326 501,536 13,790
Trust fees 128,383 126,305 2,077 Trust fees before credit costs for trust accounts 128,501 127,227 1,274
Loan trusts and money trusts fees (Jointly operated designatedmoney trusts before credit costs for trust accounts)Other trust fees 113,983 91,397 22,586
Credit costs for trust accounts (1) (118) (921) 803 Net interest income 212,791 195,229 17,562 Net fees and commissions 177,516 166,836 10,679 Net trading profits (losses) 19,560 (2,771) 22,331 Net other business income (expenses) (23,042) 15,014 (38,057)
Net gains (losses) on debt securities (15,314) 2,902 (18,216)General and administrative expenses 243,445 239,491 3,954
Amortization of goodwill 77 - 77 Net business profits before credit costs for trust accounts, provision forgeneral allowance for loan losses and amortization of goodwillNet business profits before credit costs for trust accounts and provisionfor general allowance for loan losses *Provision for general allowance for loan losses (2) (2,332) - (2,332)Net business profits** 269,429 261,122 8,307 Net non-recurring gains (losses) 12,165 (8,037) 20,203
Credit related costs (3) 49 (33,519) 33,568 Losses on loan write-offs (2,083) (13,362) 11,278 Provision for specific allowance for loan losses (4,360) - (4,360)Other credit related costs 6,493 (20,157) 26,651
Net gains (losses) on equity securities 15,647 31,350 (15,703)Gains on sales of equity securities 23,606 37,455 (13,849)Losses on sales of equity securities (1,949) (3,193) 1,244 Losses on write down of equity securities (6,008) (2,910) (3,098)
Profits (losses) from investments in affiliates 2,759 (110) 2,870 Other (6,290) (5,758) (532)
Ordinary profit 281,595 253,084 28,510 Net extraordinary gains (losses) 4,334 45,409 (41,075)
Gains on loans written-off (4) 9,937 9,716 221 Reversal of allowance for loan losses (5) - 80,669 (80,669)Expenses for the preparation of planned management integration - (22,695) 22,695 Losses on impairment of fixed assets (5,876) (22,706) 16,829
Income before income taxes and others 285,929 298,494 (12,564)Income taxes-current 6,505 2,660 3,845 Income taxes-deferred 70,107 128,510 (58,402)Minority interests 1,385 2,778 (1,392)Net income 207,931 164,545 43,385
* Net business profits before credit costs for trust accounts and provision for general allowance for loan losses= Consolidated net business profits + credit costs for trust accounts + provision for general allowance for loan losses
** Net business profits = Net business profits of Mitsubishi UFJ Trust and Banking Corporation + consolidated entities' gross profits - consolidated entities' general and administrative expenses - consolidated entities' provision for general allowance for loan losses - amortization of goodwill - inter-company transactions
(Reference)Total credit costs (1)+(2)+(3)+(5) (2,401) 46,228 (48,630)Total credit costs + Gains on loans written-off (1)+(2)+(3)+(4)+(5) 7,536 55,945 (48,409)
Number of consolidated subsidiaries 22 24 (2)Number of affiliated companies accounted for under the equity method 8 8 -
The amounts presented as of March 31, 2006 include amounts of former The Mitsubishi Trust and Banking Corporation (April - September), former UFJ TrustBank Limited (April - September) and Mitsubishi UFJ Trust and Banking Corporation (October - March).
Notes:
9,836
9,913
(21,311)
271,880
For the fiscal year ended
271,957 262,044
14,518 35,829
262,044
13

Mitsubishi UFJ Financial Group, Inc.
Mitsubishi UFJ Trust and Banking Corporation (Non-Consolidated)Financial Results
(in millions of yen)Increase/
March 31, 2007 March 31, 2006 (Decrease)(A) (B) (A) - (B)
Gross profits 471,343 460,221 11,122 (Gross profits before credit costs for trust accounts)* 471,462 461,143 10,319
Domestic gross profits 465,916 428,060 37,855 Trust fees 111,075 116,167 (5,092)
Trust fees before credit costs for trust accounts* 111,193 117,089 (5,895)Loan trusts and money trusts fees (Jointly operated designatedmoney trusts before credit costs for trust accounts)*Other trust fees 96,675 81,259 15,415
Credit costs for trust accounts** (1) (118) (921) 803 Net interest income 200,354 166,345 34,009 Net fees and commissions 141,263 140,595 667 Net trading profits (losses) 27,541 (11,059) 38,601 Net other business income (expenses) (14,316) 16,011 (30,328)
Net gains (losses) on debt securities (10,276) 3,408 (13,684)Non-domestic gross profits 5,426 32,160 (26,733)
Trust fees 0 - 0 Net interest income 24,775 27,796 (3,020)Net fees and commissions (238) (1,397) 1,158 Net trading profits (losses) (10,515) 6,134 (16,649)Net other business income (expenses) (8,595) (373) (8,221)
Net gains (losses) on debt securities (5,038) (506) (4,531)General and administrative expenses 197,134 208,444 (11,310)
Personnel expenses 62,947 73,062 (10,115)Non-personnel expenses 125,232 125,137 95 Taxes 8,954 10,244 (1,289)
Net business profits before credit costs for trust accounts
Provision for general allowance for loan losses (2) (1,758) - (1,758)Net business profits 272,449 251,776 20,673 Net non-recurring gains (losses) 5,910 (9,071) 14,981
Credit related costs (3) 172 (32,773) 32,946 Losses on loan write-offs (1,762) (13,140) 11,378 Provision for specific allowance for loan losses (4,558) - (4,558)Provision for allowance for loans to specific foreign borrowers - - -Other credit related costs 6,493 (19,633) 26,127
Net gains (losses) on equity securities 14,579 29,298 (14,719)Gains on sales of equity securities 23,474 35,016 (11,541)Losses on sales of equity securities (1,920) (1,883) (37)Losses on write down of equity securities (6,974) (3,834) (3,140)
Other (8,841) (5,596) (3,245)
Ordinary profit 278,360 242,705 35,654 Net extraordinary gains (losses) 5,713 64,275 (58,562)
9,831 9,519 311 - 79,534 (79,534)- (22,672) 22,672
Losses on impairment of fixed assets (2,899) (2,124) (775)Income before income taxes and others 284,073 306,981 (22,907)Income taxes-current 631 (2,553) 3,184 Income taxes-deferred 71,800 141,378 (69,578)
Net income 211,642 168,155 43,486
* Amounts before credit costs for loans in trusts with contracts for compensating the principal** Credit costs for loans in trusts with contracts for compensating the principal
Total credit costs (1)+(2)+(3)+(5) (1,704) 45,838 (47,543)
Total credit costs + Gains on loans written-off (1)+(2)+(3)+(4)+(5) 8,127 55,358 (47,231)
Reversal of allowance for loan losses (5)
Notes:
14,518
and provision for general allowance for loan losses*
Expenses for the preparation of planned management integration
Gains on loans written-off (4)
The amounts presented as of March 31, 2006 include amounts of former The Mitsubishi Trust and Banking Corporation (April - September), former UFJ TrustBank Limited (April - September) and Mitsubishi UFJ Trust and Banking Corporation (October - March).
(21,311)
21,629
For the fiscal year ended
35,829
274,327 252,698
14

Mitsubishi UFJ Financial Group, Inc.
4. Average Interest Rate Spread
The Bank of Tokyo-Mitsubishi UFJ, Ltd. (Non-Consolidated)
(All branches) (percentage per annum)
Total average interest rate on interest-earning assets (a)
Average interest rate on Loans and bills discounted
Average interest rate on Investment securities
Average interest rate on Deposits and NCD
Average interest rate on other liabilities
Total average interest rate spread (a)-(b)
(Domestic business segment)Total average interest rate on interest-earning assets (a) 1.13 0.01
Average interest rate on Loans and bills discounted 1.46 0.05
Average interest rate on Investment securities 0.68 0.11
0.78 0.20
Average interest rate on Deposits and NCD 0.02 0.08
Average interest rate on other liabilities 0.15 0.41
Total average interest rate spread (a)-(b) 0.35
Mitsubishi UFJ Trust and Banking Corporation (Non-Consolidated)
(All branches) (percentage per annum)
Total average interest rate on interest-earning assets (a) 2.06 1.58 0.48
Average interest rate on Loans and bills discounted 1.42 1.11 0.30
Average interest rate on Investment securities 3.00 2.21 0.79
Total average interest rate on interest-bearing liabilities (b) 0.73 0.54 0.19
Average interest rate on Deposits and NCD 0.64 0.45 0.18
Total average interest rate spread (a)-(b) 1.32 1.04 0.28
(Domestic business segment)Total average interest rate on interest-earning assets (a) 1.57 1.16 0.41
Average interest rate on Loans and bills discounted 1.24 1.00 0.23
Average interest rate on Investment securities 2.57 1.75 0.82
Total average interest rate on interest-bearing liabilities (b) 0.23 0.13 0.10
Average interest rate on Deposits and NCD 0.22 0.11 0.10
Total average interest rate spread (a)-(b) 1.34 1.02 0.31
Total average interest rate on interest-bearing liabilities (b) <including General and administrative expenses> 0.98
0.57
For the fiscal year ended
0.10
0.16
2007(A) 2006(B) (A) - (B)
2.02 1.70 0.31
For the fiscal year ended Increase/March 31, (Decrease)
2.07 1.79 0.27
1.30 0.181.48
Total average interest rate on interest-bearing liabilities (b) <including General and administrative expenses> 1.88 1.35 0.53
0.39 0.24
2.05 0.70 1.35
0.64
0.35 (0.21)0.13
(percentage per annum)1.15
0.80
1.51
(0.18)
Increase/
March 31, (Decrease)
(percentage per annum)
The amounts presented as of March 31, 2006 are weighted average of amounts of former The Bank of Tokyo-Mitsubishi, Ltd. (April -December), former UFJ Bank Limited (April - December) and The Bank of Tokyo-Mitsubishi UFJ, Ltd. ( January - March).
The amounts presented as of March 31, 2006 are weighted average of amounts of former The Mitsubishi Trust and Banking Corporation (April- September), former UFJ Trust Bank Limited (April - September) and Mitsubishi UFJ Trust and Banking Corporation (October - March).
2007(A) 2006(B) (A) - (B)
15

Mitsubishi UFJ Financial Group, Inc.
5. Notional Principal by the Remaining Life of the Interest Rate Swaps for Hedge-Accounting
Mitsubishi UFJ Financial Group, Inc. (Consolidated)(in billions of yen)
within 1 year 1 year to 5 years over 5 years Total
Receive-fix / pay-floater 13,651.1 9,633.4 442.8 23,727.4Receive-floater / pay-fix 2,425.9 1,306.1 743.1 4,475.2Receive-floater / pay-floater - - 20.0 20.0Receive-fix / pay-fix - - - -Total 16,077.1 10,939.5 1,206.0 28,222.7
The Bank of Tokyo-Mitsubishi UFJ, Ltd. (Consolidated)(in billions of yen)
within 1 year 1 year to 5 years over 5 years Total
Receive-fix / pay-floater 12,563.2 8,300.0 370.3 21,233.6Receive-floater / pay-fix 2,481.3 779.0 316.2 3,576.6Receive-floater / pay-floater - - 20.0 20.0Receive-fix / pay-fix - - - -Total 15,044.5 9,079.1 706.6 24,830.3
Mitsubishi UFJ Trust and Banking Corporation (Consolidated)(in billions of yen)
within 1 year 1 year to 5 years over 5 years Total
Receive-fix / pay-floater 1,237.9 3,288.3 130.0 4,656.3 Receive-floater / pay-fix 199.1 535.7 567.7 1,302.6 Receive-floater / pay-floater - - - -Receive-fix / pay-fix - - - -Total 1,437.0 3,824.0 697.7 5,958.9
As of March 31, 2007
As of March 31, 2007
As of March 31, 2007
16
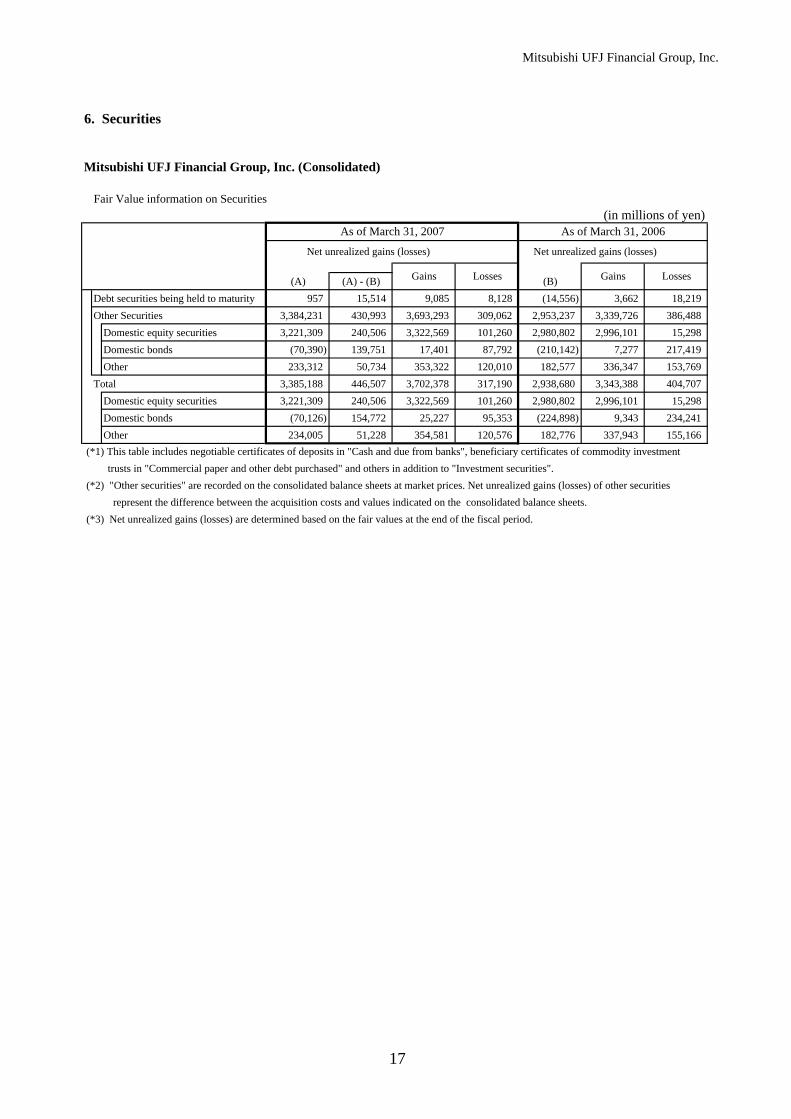
Mitsubishi UFJ Financial Group, Inc.
6. Securities
Mitsubishi UFJ Financial Group, Inc. (Consolidated)
Fair Value information on Securities(in millions of yen)
(A) (A) - (B) (B)Debt securities being held to maturity 957 15,514 9,085 8,128 (14,556) 3,662 18,219Other Securities 3,384,231 430,993 3,693,293 309,062 2,953,237 3,339,726 386,488
Domestic equity securities 3,221,309 240,506 3,322,569 101,260 2,980,802 2,996,101 15,298Domestic bonds (70,390) 139,751 17,401 87,792 (210,142) 7,277 217,419Other 233,312 50,734 353,322 120,010 182,577 336,347 153,769
Total 3,385,188 446,507 3,702,378 317,190 2,938,680 3,343,388 404,707Domestic equity securities 3,221,309 240,506 3,322,569 101,260 2,980,802 2,996,101 15,298Domestic bonds (70,126) 154,772 25,227 95,353 (224,898) 9,343 234,241Other 234,005 51,228 354,581 120,576 182,776 337,943 155,166
(*1) This table includes negotiable certificates of deposits in "Cash and due from banks", beneficiary certificates of commodity investment
represent the difference between the acquisition costs and values indicated on the consolidated balance sheets. (*3) Net unrealized gains (losses) are determined based on the fair values at the end of the fiscal period.
trusts in "Commercial paper and other debt purchased" and others in addition to "Investment securities". (*2) "Other securities" are recorded on the consolidated balance sheets at market prices. Net unrealized gains (losses) of other securities
As of March 31, 2007
Gains Losses
Net unrealized gains (losses)
As of March 31, 2006
Net unrealized gains (losses)
Gains Losses
17
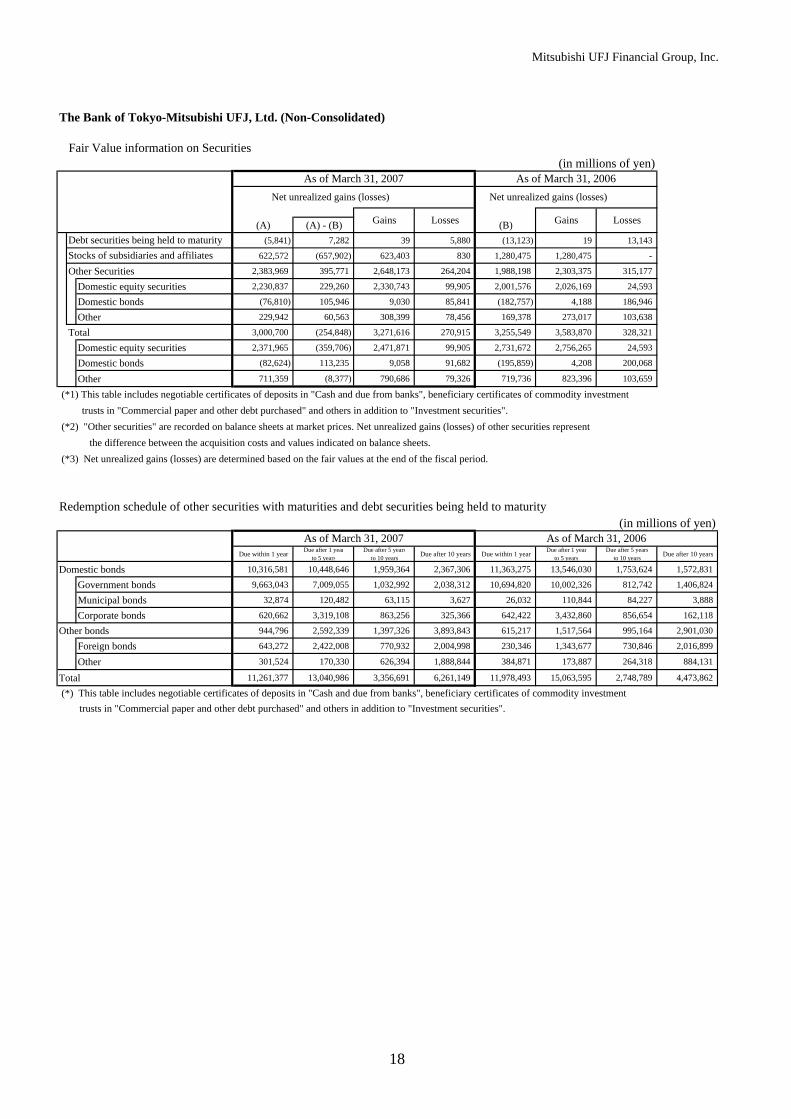
Mitsubishi UFJ Financial Group, Inc.
The Bank of Tokyo-Mitsubishi UFJ, Ltd. (Non-Consolidated)
Fair Value information on Securities(in millions of yen)
(A) (A) - (B) (B)(5,841) 7,282 39 5,880 (13,123) 19 13,143
622,572 (657,902) 623,403 830 1,280,475 1,280,475 -
Other Securities 2,383,969 395,771 2,648,173 264,204 1,988,198 2,303,375 315,177
Domestic equity securities 2,230,837 229,260 2,330,743 99,905 2,001,576 2,026,169 24,593
Domestic bonds (76,810) 105,946 9,030 85,841 (182,757) 4,188 186,946
Other 229,942 60,563 308,399 78,456 169,378 273,017 103,638
Total 3,000,700 (254,848) 3,271,616 270,915 3,255,549 3,583,870 328,321
Domestic equity securities 2,371,965 (359,706) 2,471,871 99,905 2,731,672 2,756,265 24,593
Domestic bonds (82,624) 113,235 9,058 91,682 (195,859) 4,208 200,068
Other 711,359 (8,377) 790,686 79,326 719,736 823,396 103,659
Redemption schedule of other securities with maturities and debt securities being held to maturity (in millions of yen)
Due within 1 year Due after 1 yearto 5 years
Due after 5 yearsto 10 years Due after 10 years Due within 1 year Due after 1 year
to 5 yearsDue after 5 years
to 10 years Due after 10 years
Domestic bonds 10,316,581 10,448,646 1,959,364 2,367,306 11,363,275 13,546,030 1,753,624 1,572,831
Government bonds 9,663,043 7,009,055 1,032,992 2,038,312 10,694,820 10,002,326 812,742 1,406,824
Municipal bonds 32,874 120,482 63,115 3,627 26,032 110,844 84,227 3,888
Corporate bonds 620,662 3,319,108 863,256 325,366 642,422 3,432,860 856,654 162,118
Other bonds 944,796 2,592,339 1,397,326 3,893,843 615,217 1,517,564 995,164 2,901,030
Foreign bonds 643,272 2,422,008 770,932 2,004,998 230,346 1,343,677 730,846 2,016,899
Other 301,524 170,330 626,394 1,888,844 384,871 173,887 264,318 884,131
Total 11,261,377 13,040,986 3,356,691 6,261,149 11,978,493 15,063,595 2,748,789 4,473,862
(*) This table includes negotiable certificates of deposits in "Cash and due from banks", beneficiary certificates of commodity investment trusts in "Commercial paper and other debt purchased" and others in addition to "Investment securities".
As of March 31, 2006 Net unrealized gains (losses) Net unrealized gains (losses)
As of March 31, 2007
Gains LossesGains Losses
Debt securities being held to maturityStocks of subsidiaries and affiliates
As of March 31, 2006As of March 31, 2007
(*1) This table includes negotiable certificates of deposits in "Cash and due from banks", beneficiary certificates of commodity investment trusts in "Commercial paper and other debt purchased" and others in addition to "Investment securities". (*2) "Other securities" are recorded on balance sheets at market prices. Net unrealized gains (losses) of other securities represent the difference between the acquisition costs and values indicated on balance sheets. (*3) Net unrealized gains (losses) are determined based on the fair values at the end of the fiscal period.
18

Mitsubishi UFJ Financial Group, Inc.
Mitsubishi UFJ Trust and Banking Corporation (Non-Consolidated)
Fair Value information on Securities(in millions of yen)
(A) (A) - (B) (B)Debt securities being held to maturity 7,735 7,361 7,747 11 374 1,980 1,605
Other Securities 686,235 51,153 710,832 24,596 635,081 679,214 44,132
Domestic equity securities 651,812 36,618 667,935 16,122 615,194 619,579 4,385
Domestic bonds 7,555 30,304 8,072 516 (22,748) 3,912 26,661
Other 26,867 (15,769) 34,823 7,956 42,636 55,722 13,086
Total 693,971 58,515 718,579 24,608 635,456 681,194 45,738
Domestic equity securities 651,812 36,618 667,935 16,122 615,194 619,579 4,385
Domestic bonds 15,291 37,666 15,820 528 (22,374) 5,892 28,267
Other 26,867 (15,769) 34,823 7,956 42,636 55,722 13,086
Redemption schedule of other securities with maturities and debt securities being held to maturity (in millions of yen)
Due within 1 yearDue after 1 year
to 5 yearsDue after 5 years
to 10 yearsDue after 10 years Due within 1 year
Due after 1 yearto 5 years
Due after 5 yearsto 10 years
Due after 10 years
Domestic bonds 12,791 2,112,198 1,083,758 5,018 728,425 1,157,804 388,743 154,560
Government bonds 803 1,733,663 1,037,299 - 689,205 739,673 299,193 152,309
Municipal bonds 4,883 78,448 3,569 426 6,171 67,041 26,678 452
Corporate bonds 7,104 300,086 42,889 4,592 33,048 351,090 62,871 1,798
Other 114,325 513,426 761,712 182,945 194,953 535,505 569,146 203,554
Foreign bonds 112,927 404,424 596,645 145,993 178,781 405,731 467,966 137,568
Other 1,398 109,001 165,066 36,951 16,172 129,774 101,179 65,985
Total 127,117 2,625,625 1,845,470 187,964 923,378 1,693,310 957,889 358,114
(*) This table includes beneficiary certificates of commodity investment trusts in "Commercial paper and other debt purchased" and others in addition to "Investment securities".
As of March 31, 2007
(*1) This table includes beneficiary certificates of commodity investment trusts in "Commercial paper and other debt purchased" and others in addition to "Investment securities". (*2) "Other securities" are recorded on balance sheets at market prices. Net unrealized gains (losses) of other securities represent the difference between the acquisition costs and values indicated on balance sheets. (*3) Net unrealized gains (losses) are determined based on the fair values at the end of the fiscal period.
As of March 31, 2006 Net unrealized gains (losses)
Gains Losses
As of March 31, 2007
Gains Losses
As of March 31, 2006
Net unrealized gains (losses)
19
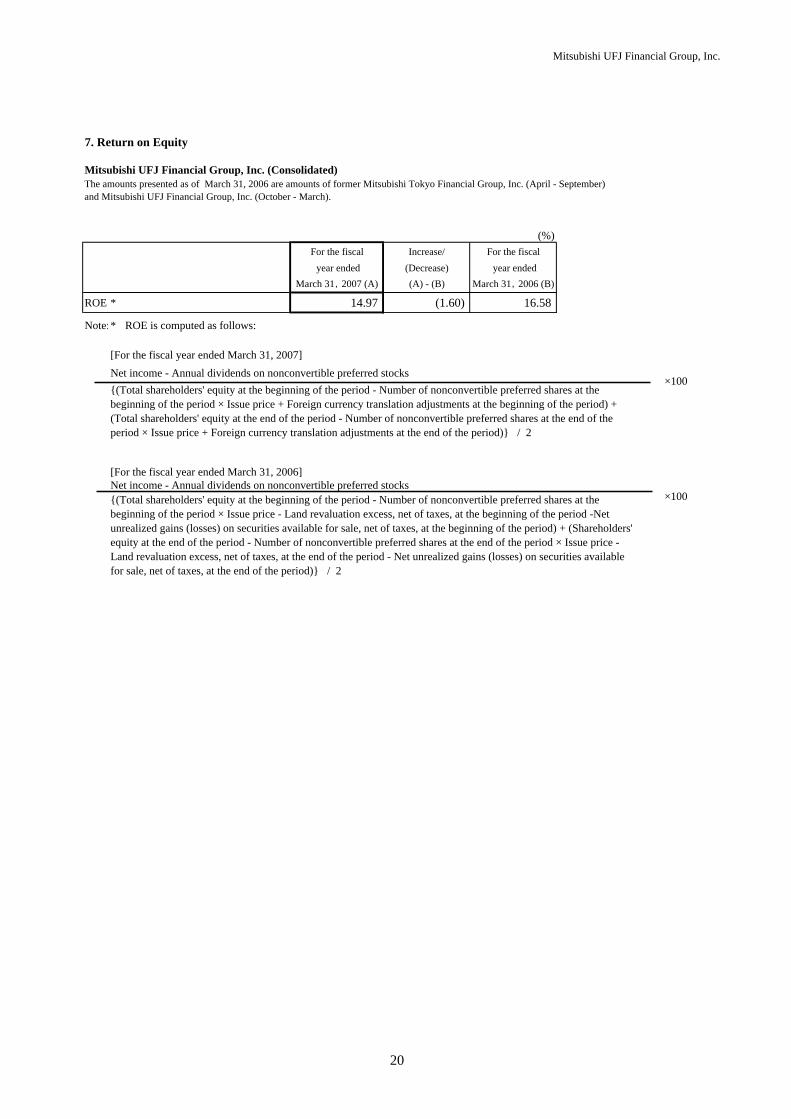
Mitsubishi UFJ Financial Group, Inc.
7. Return on Equity
Mitsubishi UFJ Financial Group, Inc. (Consolidated)
(%)For the fiscal Increase/ For the fiscal year ended (Decrease) year ended
March 31,2007 (A) (A) - (B) March 31,2006 (B)
ROE * 14.97 (1.60) 16.58
Note:* ROE is computed as follows:
[For the fiscal year ended March 31, 2007]
[For the fiscal year ended March 31, 2006]
{(Total shareholders' equity at the beginning of the period - Number of nonconvertible preferred shares at thebeginning of the period × Issue price - Land revaluation excess, net of taxes, at the beginning of the period -Netunrealized gains (losses) on securities available for sale, net of taxes, at the beginning of the period) + (Shareholders'equity at the end of the period - Number of nonconvertible preferred shares at the end of the period × Issue price -Land revaluation excess, net of taxes, at the end of the period - Net unrealized gains (losses) on securities availablefor sale, net of taxes, at the end of the period)} / 2
The amounts presented as of March 31, 2006 are amounts of former Mitsubishi Tokyo Financial Group, Inc. (April - September)and Mitsubishi UFJ Financial Group, Inc. (October - March).
Net income - Annual dividends on nonconvertible preferred stocks
Net income - Annual dividends on nonconvertible preferred stocks
{(Total shareholders' equity at the beginning of the period - Number of nonconvertible preferred shares at thebeginning of the period × Issue price + Foreign currency translation adjustments at the beginning of the period) +(Total shareholders' equity at the end of the period - Number of nonconvertible preferred shares at the end of theperiod × Issue price + Foreign currency translation adjustments at the end of the period)} / 2
×100
×100
20

Mitsubishi UFJ Financial Group, Inc
8. Risk-Adjusted Capital Ratio Based on the Basel 2 Standards
Mitsubishi UFJ Financial Group, Inc. (Consolidated)
(in billions of yen)As of Increase/ As of
March 31, (Decrease) March 31,2007 (A) (A) - (B) 2006 (B)
(Preliminary basis) (for reference)
(1) Risk-adjusted capital ratio 12.54% 0.33% 12.20%
Tier 1 ratio 7.57% 0.76% 6.80%
(2) Tier 1 capital 8,054.8 553.1 7,501.6
(3) 5,717.9 (575.7) 6,293.7
i) 1,541.7 198.5 1,343.1
ii) 159.3 (2.8) 162.1
iii) Subordinated debts 3,844.3 57.6 3,786.6
(4) - - -
(5) 428.3 93.3 334.9
(6) Net qualifying capital (2)+(3)+(4)-(5) 13,344.4 (115.9) 13,460.3
(7) Risk-adjusted assets 106,395.5 (3,897.1) 110,292.6
note: Beginning from the fiscal year ended March 31, 2007, risk-adjusted capital ratio is computed in accordancewith the Notification of the Financial Services Agency No.20, 2006.For the fiscal year ended March 31, 2006, risk-adjusted capital ratio was computed in accordance with theNotification of the Ministry of Finance No.62, 1998.
Deductions from totalqualifying capital
Qualified Tier 2 capitalThe amount of unrealized gains oninvestment securities
The amount of land revaluation excess
Qualified Tier 3 capital
21
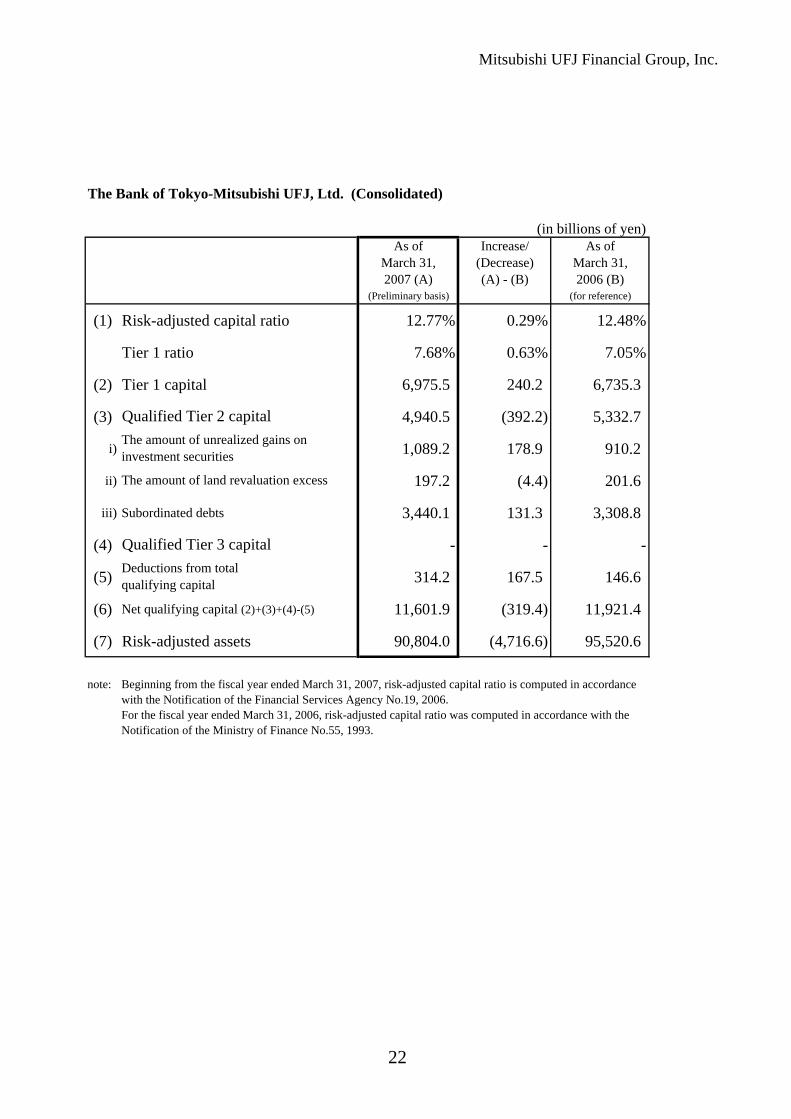
Mitsubishi UFJ Financial Group, Inc.
The Bank of Tokyo-Mitsubishi UFJ, Ltd. (Consolidated)
(in billions of yen)As of Increase/ As of
March 31, (Decrease) March 31,2007 (A) (A) - (B) 2006 (B)
(Preliminary basis) (for reference)
(1) Risk-adjusted capital ratio 12.77% 0.29% 12.48%
Tier 1 ratio 7.68% 0.63% 7.05%
(2) Tier 1 capital 6,975.5 240.2 6,735.3
(3) 4,940.5 (392.2) 5,332.7
i) 1,089.2 178.9 910.2
ii) 197.2 (4.4) 201.6
iii) Subordinated debts 3,440.1 131.3 3,308.8
(4) - - -
(5) 314.2 167.5 146.6
(6) Net qualifying capital (2)+(3)+(4)-(5) 11,601.9 (319.4) 11,921.4
(7) Risk-adjusted assets 90,804.0 (4,716.6) 95,520.6
note: Beginning from the fiscal year ended March 31, 2007, risk-adjusted capital ratio is computed in accordancewith the Notification of the Financial Services Agency No.19, 2006.For the fiscal year ended March 31, 2006, risk-adjusted capital ratio was computed in accordance with theNotification of the Ministry of Finance No.55, 1993.
Deductions from totalqualifying capital
Qualified Tier 2 capitalThe amount of unrealized gains oninvestment securities
The amount of land revaluation excess
Qualified Tier 3 capital
22

Mitsubishi UFJ Financial Group, Inc.
Mitsubishi UFJ Trust and Banking Corporation (Consolidated)
(in billions of yen)As of Increase/ As of
March 31, (Decrease) March 31,2007 (A) (A) - (B) 2006 (B)
(Preliminary basis) (for reference)
(1) Risk-adjusted capital ratio 13.20% 0.14% 13.05%
Tier 1 ratio 8.40% (0.40)% 8.80%
(2) Tier 1 capital 1,175.5 (15.7) 1,191.3
(3) 729.7 (145.3) 875.0
i) 314.1 25.2 288.8
ii) (1.1) 0.0 (1.1)
iii) Subordinated debts 416.6 (81.3) 497.9
(4) - - -
(5) 57.4 (241.9) 299.3
(6) Net qualifying capital (2)+(3)+(4)-(5) 1,847.8 80.8 1,766.9
(7) Risk-adjusted assets 13,994.7 460.8 13,533.9
note: Beginning from the fiscal year ended March 31, 2007, risk-adjusted capital ratio is computed in accordance withthe Notification of the Financial Services Agency No.19, 2006.For the fiscal year ended March 31, 2006, risk-adjusted capital ratio was computed in accordance with theNotification of the Ministry of Finance No.55, 1993.
Deductions from totalqualifying capital
Qualified Tier 2 capitalThe amount of unrealized gains oninvestment securities
The amount of land revaluation excess
Qualified Tier 3 capital
23

Mitsubishi UFJ Financial Group, Inc.
II. Loan Portfolio and Other
1. Risk-Monitored Loans
Mitsubishi UFJ Financial Group, Inc. (Consolidated)
(1) Risk-Monitored Loans(in millions of yen)
As of Increase/ Increase/ As of As ofMarch 31, (Decrease) (Decrease) March 31, September 30,2007 (A) (A) - (B) (A) - (C) 2006 (B) 2006 (C)
Loans to bankrupt borrowers 40,924 (17,480) (11,477) 58,404 52,401 Non-accrual delinquent loans 822,160 (78,019) 135,950 900,179 686,209
past due 3 months or moreRestructured loans 648,054 (351,442) (91,223) 999,497 739,278 Total (1) 1,530,830 (450,107) 32,569 1,980,937 1,498,260 Written-off 844,161 (306,613) (134,419) 1,150,775 978,581
Total loans and bills discounted 84,831,949 (931,157) (839,232) 85,763,106 85,671,181
( % to total loans and bills discounted)Loans to bankrupt borrowers 0.04% (0.01)% (0.01)% 0.06% 0.06%Non-accrual delinquent loans 0.96% (0.08)% 0.16% 1.04% 0.80%
past due 3 months or moreRestructured loans 0.76% (0.40)% (0.09)% 1.16% 0.86%Total 1.80% (0.50)% 0.05% 2.30% 1.74%
(2) Allowance for Loan Losses(in millions of yen)
As of Increase/ Increase/ As of As ofMarch 31, (Decrease) (Decrease) March 31, September 30,2007 (A) (A) - (B) (A) - (C) 2006 (B) 2006 (C)
Allowance for loan losses (2) 1,185,432 (175,313) 72,180 1,360,745 1,113,252General allowance for loan losses 805,245 (196,407) (72,767) 1,001,652 878,013Specific allowance for loan losses 380,116 21,104 145,044 359,012 235,071Allowance for loans to specific foreign borrowers 71 (10) (96) 81 167
Coverage Ratio (2) / (1) 77.43% 8.74% 3.13% 68.69% 74.30%
Accruing loans contractually 19,691 (3,165) (678) 22,856 20,370
Accruing loans contractually 0.02% (0.00)% (0.00)% 0.02% 0.02%
24
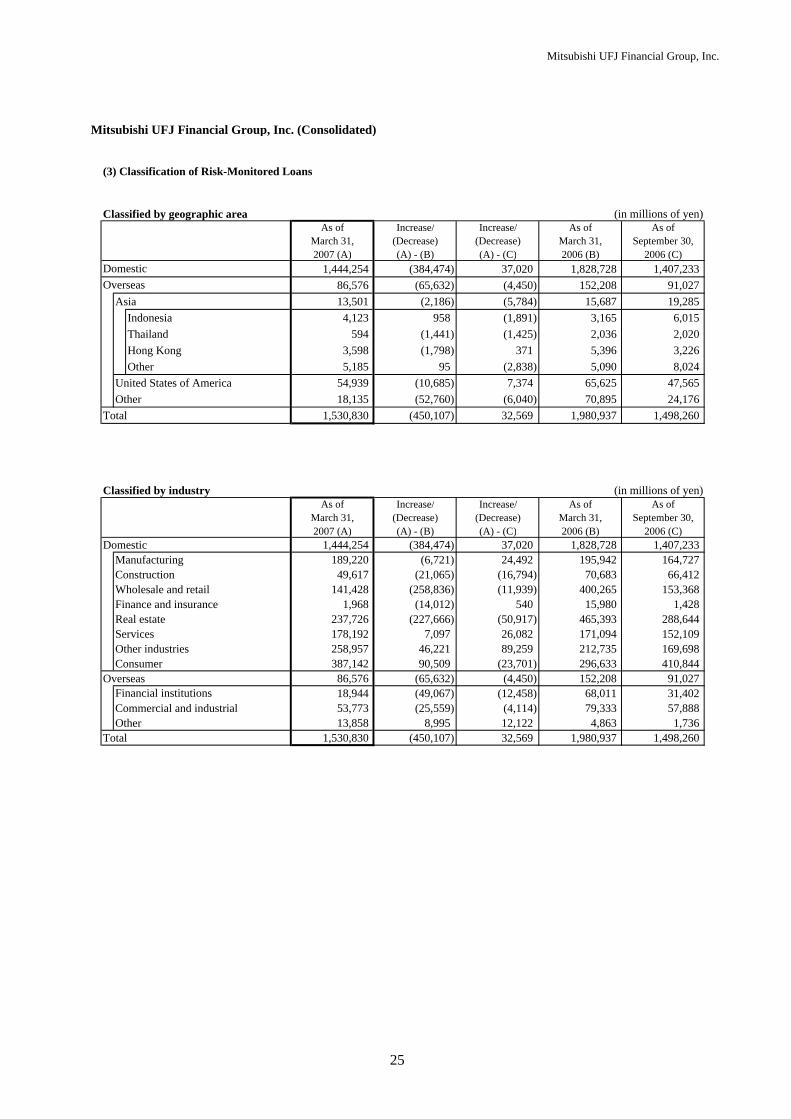
Mitsubishi UFJ Financial Group, Inc.
Mitsubishi UFJ Financial Group, Inc. (Consolidated)
(3) Classification of Risk-Monitored Loans
Classified by geographic area (in millions of yen)As of Increase/ Increase/ As of As of
March 31, (Decrease) (Decrease) March 31, September 30,2007 (A) (A) - (B) (A) - (C) 2006 (B) 2006 (C)
1,444,254 (384,474) 37,020 1,828,728 1,407,233 86,576 (65,632) (4,450) 152,208 91,027
Asia 13,501 (2,186) (5,784) 15,687 19,285 Indonesia 4,123 958 (1,891) 3,165 6,015 Thailand 594 (1,441) (1,425) 2,036 2,020 Hong Kong 3,598 (1,798) 371 5,396 3,226 Other 5,185 95 (2,838) 5,090 8,024
United States of America 54,939 (10,685) 7,374 65,625 47,565 Other 18,135 (52,760) (6,040) 70,895 24,176
Total 1,530,830 (450,107) 32,569 1,980,937 1,498,260
Classified by industry (in millions of yen)As of Increase/ Increase/ As of As of
March 31, (Decrease) (Decrease) March 31, September 30,2007 (A) (A) - (B) (A) - (C) 2006 (B) 2006 (C)
Domestic 1,444,254 (384,474) 37,020 1,828,728 1,407,233 Manufacturing 189,220 (6,721) 24,492 195,942 164,727 Construction 49,617 (21,065) (16,794) 70,683 66,412 Wholesale and retail 141,428 (258,836) (11,939) 400,265 153,368 Finance and insurance 1,968 (14,012) 540 15,980 1,428 Real estate 237,726 (227,666) (50,917) 465,393 288,644 Services 178,192 7,097 26,082 171,094 152,109 Other industries 258,957 46,221 89,259 212,735 169,698 Consumer 387,142 90,509 (23,701) 296,633 410,844
Overseas 86,576 (65,632) (4,450) 152,208 91,027 18,944 (49,067) (12,458) 68,011 31,402
Commercial and industrial 53,773 (25,559) (4,114) 79,333 57,888 Other 13,858 8,995 12,122 4,863 1,736
Total 1,530,830 (450,107) 32,569 1,980,937 1,498,260
Financial institutions
DomesticOverseas
25
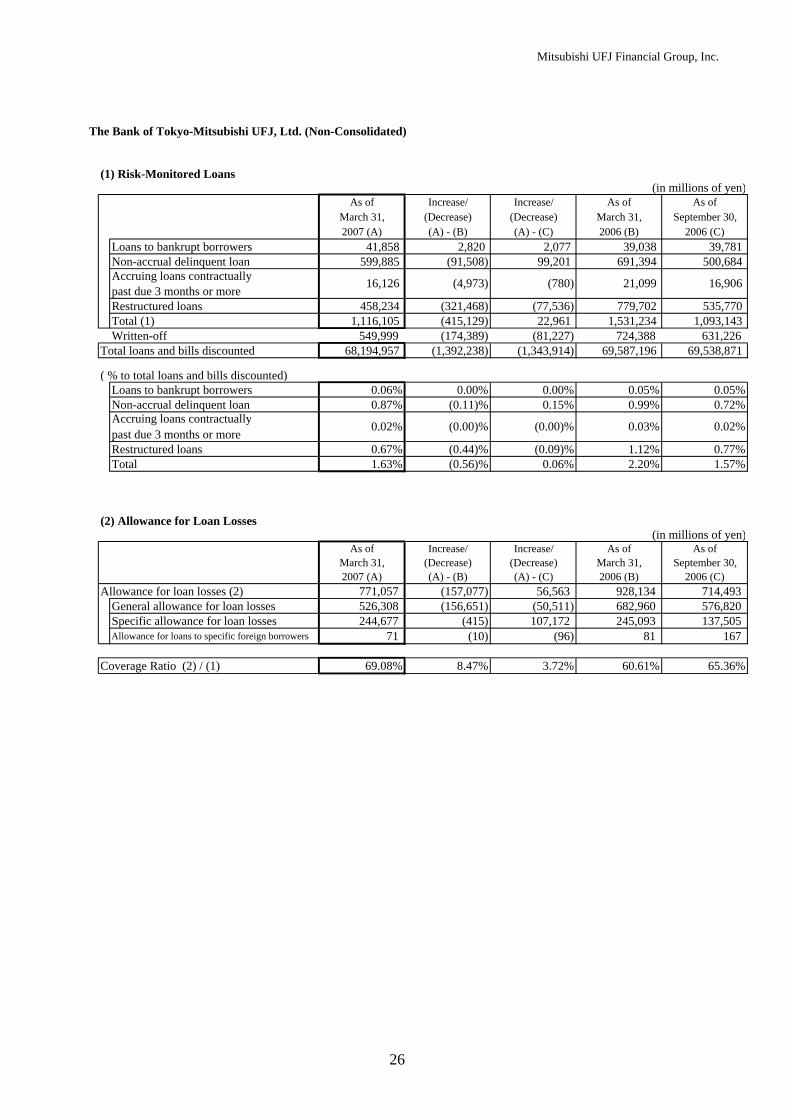
Mitsubishi UFJ Financial Group, Inc.
The Bank of Tokyo-Mitsubishi UFJ, Ltd. (Non-Consolidated)
(1) Risk-Monitored Loans(in millions of yen)
As of Increase/ Increase/ As of As ofMarch 31, (Decrease) (Decrease) March 31, September 30,2007 (A) (A) - (B) (A) - (C) 2006 (B) 2006 (C)
Loans to bankrupt borrowers 41,858 2,820 2,077 39,038 39,781 Non-accrual delinquent loan 599,885 (91,508) 99,201 691,394 500,684
past due 3 months or moreRestructured loans 458,234 (321,468) (77,536) 779,702 535,770 Total (1) 1,116,105 (415,129) 22,961 1,531,234 1,093,143 Written-off 549,999 (174,389) (81,227) 724,388 631,226
Total loans and bills discounted 68,194,957 (1,392,238) (1,343,914) 69,587,196 69,538,871
( % to total loans and bills discounted)Loans to bankrupt borrowers 0.06% 0.00% 0.00% 0.05% 0.05%Non-accrual delinquent loan 0.87% (0.11)% 0.15% 0.99% 0.72%
past due 3 months or moreRestructured loans 0.67% (0.44)% (0.09)% 1.12% 0.77%Total 1.63% (0.56)% 0.06% 2.20% 1.57%
(2) Allowance for Loan Losses(in millions of yen)
As of Increase/ Increase/ As of As ofMarch 31, (Decrease) (Decrease) March 31, September 30,2007 (A) (A) - (B) (A) - (C) 2006 (B) 2006 (C)
Allowance for loan losses (2) 771,057 (157,077) 56,563 928,134 714,493General allowance for loan losses 526,308 (156,651) (50,511) 682,960 576,820Specific allowance for loan losses 244,677 (415) 107,172 245,093 137,505Allowance for loans to specific foreign borrowers 71 (10) (96) 81 167
Coverage Ratio (2) / (1) 69.08% 8.47% 3.72% 60.61% 65.36%
Accruing loans contractually 16,126 (4,973)
Accruing loans contractually
(780) 21,099 16,906
0.02% (0.00)% (0.00)% 0.03% 0.02%
26
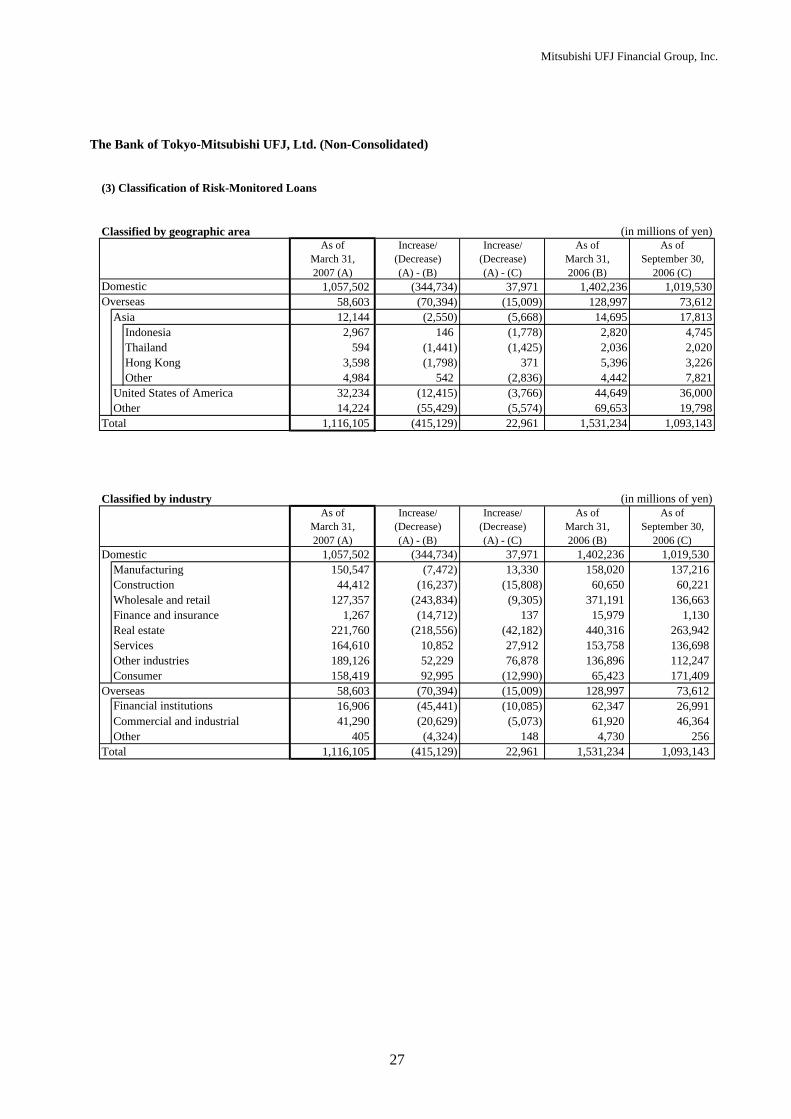
Mitsubishi UFJ Financial Group, Inc.
The Bank of Tokyo-Mitsubishi UFJ, Ltd. (Non-Consolidated)
(3) Classification of Risk-Monitored Loans
Classified by geographic area (in millions of yen)As of Increase/ Increase/ As of As of
March 31, (Decrease) (Decrease) March 31, September 30,2007 (A) (A) - (B) (A) - (C) 2006 (B) 2006 (C)
1,057,502 (344,734) 37,971 1,402,236 1,019,53058,603 (70,394) (15,009) 128,997 73,612
Asia 12,144 (2,550) (5,668) 14,695 17,813Indonesia 2,967 146 (1,778) 2,820 4,745Thailand 594 (1,441) (1,425) 2,036 2,020Hong Kong 3,598 (1,798) 371 5,396 3,226Other 4,984 542 (2,836) 4,442 7,821
United States of America 32,234 (12,415) (3,766) 44,649 36,000Other 14,224 (55,429) (5,574) 69,653 19,798
Total 1,116,105 (415,129) 22,961 1,531,234 1,093,143
Classified by industry (in millions of yen)As of Increase/ Increase/ As of As of
March 31, (Decrease) (Decrease) March 31, September 30,2007 (A) (A) - (B) (A) - (C) 2006 (B) 2006 (C)
Domestic 1,057,502 (344,734) 37,971 1,402,236 1,019,530 Manufacturing 150,547 (7,472) 13,330 158,020 137,216 Construction 44,412 (16,237) (15,808) 60,650 60,221 Wholesale and retail 127,357 (243,834) (9,305) 371,191 136,663 Finance and insurance 1,267 (14,712) 137 15,979 1,130 Real estate 221,760 (218,556) (42,182) 440,316 263,942 Services 164,610 10,852 27,912 153,758 136,698 Other industries 189,126 52,229 76,878 136,896 112,247 Consumer 158,419 92,995 (12,990) 65,423 171,409
Overseas 58,603 (70,394) (15,009) 128,997 73,612 16,906 (45,441) (10,085) 62,347 26,991
Commercial and industrial 41,290 (20,629) (5,073) 61,920 46,364 Other 405 (4,324) 148 4,730 256
Total 1,116,105 (415,129) 22,961 1,531,234 1,093,143
Financial institutions
DomesticOverseas
27
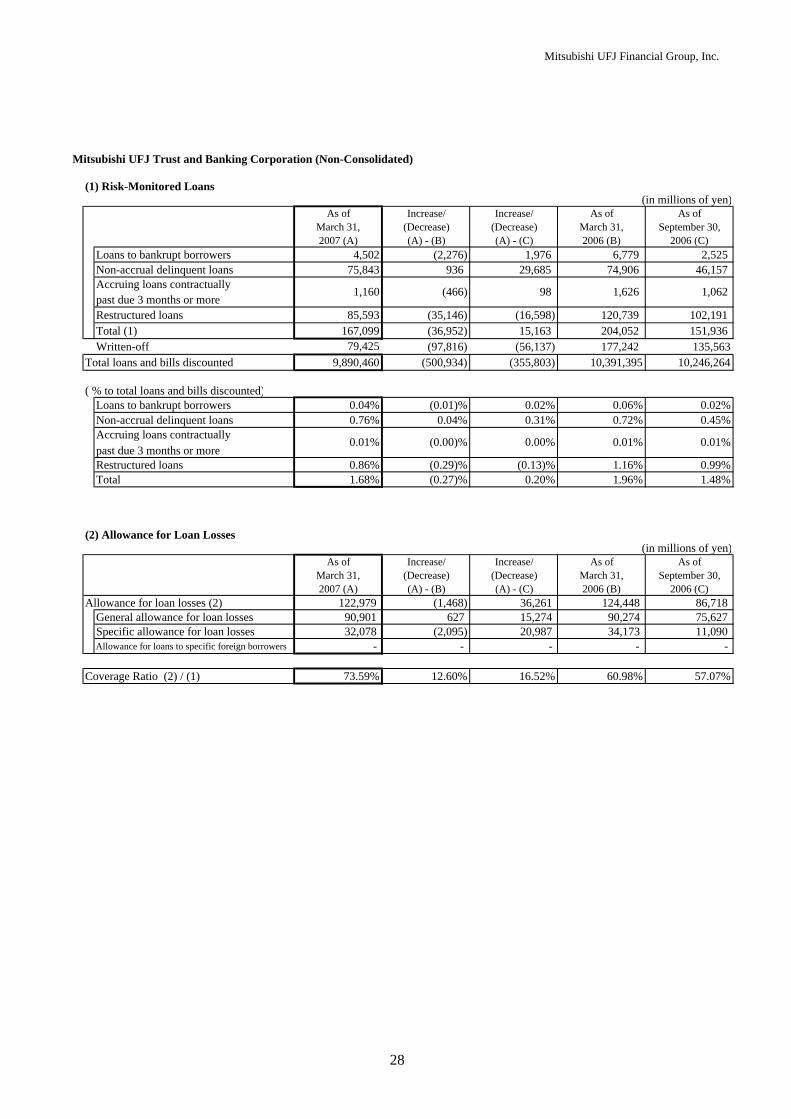
Mitsubishi UFJ Financial Group, Inc.
Mitsubishi UFJ Trust and Banking Corporation (Non-Consolidated)
(1) Risk-Monitored Loans(in millions of yen)
As of Increase/ Increase/ As of As ofMarch 31, (Decrease) (Decrease) March 31, September 30,2007 (A) (A) - (B) (A) - (C) 2006 (B) 2006 (C)
Loans to bankrupt borrowers 4,502 (2,276) 1,976 6,779 2,525 Non-accrual delinquent loans 75,843 936 29,685 74,906 46,157
past due 3 months or moreRestructured loans 85,593 (35,146) (16,598) 120,739 102,191 Total (1) 167,099 (36,952) 15,163 204,052 151,936 Written-off 79,425 (97,816) (56,137) 177,242 135,563
Total loans and bills discounted 9,890,460 (500,934) (355,803) 10,391,395 10,246,264
( % to total loans and bills discounted)Loans to bankrupt borrowers 0.04% (0.01)% 0.02% 0.06% 0.02%Non-accrual delinquent loans 0.76% 0.04% 0.31% 0.72% 0.45%
past due 3 months or moreRestructured loans 0.86% (0.29)% (0.13)% 1.16% 0.99%Total 1.68% (0.27)% 0.20% 1.96% 1.48%
(2) Allowance for Loan Losses(in millions of yen)
As of Increase/ Increase/ As of As ofMarch 31, (Decrease) (Decrease) March 31, September 30,2007 (A) (A) - (B) (A) - (C) 2006 (B) 2006 (C)
Allowance for loan losses (2) 122,979 (1,468) 36,261 124,448 86,718 General allowance for loan losses 90,901 627 15,274 90,274 75,627 Specific allowance for loan losses 32,078 (2,095) 20,987 34,173 11,090 Allowance for loans to specific foreign borrowers - - - - -
Coverage Ratio (2) / (1) 73.59% 12.60% 16.52% 60.98% 57.07%
Accruing loans contractually 1,160 (466) 98 1,626 1,062
Accruing loans contractually 0.01% (0.00)% 0.00% 0.01% 0.01%
28

Mitsubishi UFJ Financial Group, Inc.
Mitsubishi UFJ Trust and Banking Corporation (Non-Consolidated)
(3) Classification of Risk-Monitored Loans
Classified by geographic area (in millions of yen)As of Increase/ Increase/ As of As of
March 31, (Decrease) (Decrease) March 31, September 30,2007 (A) (A) - (B) (A) - (C) 2006 (B) 2006 (C)
151,599 (39,986) 6,310 191,585 145,289 15,500 3,033 8,852 12,466 6,647
Asia 39 (4) (2) 43 41 Indonesia 39 (4) (2) 43 41 Thailand - - - - - Hong Kong - - - - - Other - - - - -
United States of America 15,263 2,856 9,036 12,407 6,227 Other 197 182 (180) 15 378
Total 167,099 (36,952) 15,163 204,052 151,936
Classified by industry (in millions of yen)As of Increase/ Increase/ As of As of
March 31, (Decrease) (Decrease) March 31, September 30,2007 (A) (A) - (B) (A) - (C) 2006 (B) 2006 (C)
Domestic 151,599 (39,986) 6,310 191,585 145,289 Manufacturing 28,445 (6,350) 3,819 34,795 24,626 Construction 3,466 (4,690) (367) 8,157 3,834 Wholesale and retail 10,155 (14,166) (2,169) 24,321 12,324 Finance and insurance - - (288) - 288 Real estate 5,540 (6,437) (4,552) 11,978 10,092 Services 8,050 (4,313) (2,579) 12,363 10,629 Other industries 64,633 (4,260) 13,496 68,894 51,137 Consumer 31,307 232 (1,049) 31,074 32,356
Overseas 15,500 3,033 8,852 12,466 6,647 2,037 (3,626) (2,372) 5,663 4,410
Commercial and industrial 1,402 (5,361) (796) 6,764 2,199 Other 12,059 12,021 12,022 38 37
Total 167,099 (36,952) 15,163 204,052 151,936
DomesticOverseas
Financial institutions
29

Mitsubishi UFJ Financial Group, Inc.
Trust Accounts
(1) Risk-Monitored Loans(in millions of yen)
As of Increase/ Increase/ As of As ofMarch 31, (Decrease) (Decrease) March 31, September 30,2007 (A) (A) - (B) (A) - (C) 2006 (B) 2006 (C)
Loans to bankrupt borrowers 50 (1) (34) 51 85 Non-accrual delinquent loans 129 72 78 56 50
past due 3 months or moreRestructured loans 1,082 (117) (176) 1,199 1,258 Total 1,323 (22) (167) 1,346 1,491
Total loans and bills discounted 170,826 (18,582) (7,377) 189,409 178,203
(% to total loans and bills discounted)Loans to bankrupt borrowers 0.02% 0.00% (0.01)% 0.02% 0.04%Non-accrual delinquent loans 0.07% 0.04% 0.04% 0.02% 0.02%
past due 3 months or moreRestructured loans 0.63% 0.00% (0.07)% 0.63% 0.70%Total 0.77% 0.06% (0.06)% 0.71% 0.83%
(2) Allowance for Loan Losses(in millions of yen)
As of Increase/ Increase/ As of As ofMarch 31, (Decrease) (Decrease) March 31, September 30,2007 (A) (A) - (B) (A) - (C) 2006 (B) 2006 (C)
Special internal reserves 2,374 (3,432) (1,019) 5,806 3,393 Allowance for bad debts 514 (103) (19) 617 534
(3) Classification of Risk-Monitored Loans
Classified by industry (in millions of yen)As of Increase/ Increase/ As of As of
March 31, (Decrease) (Decrease) March 31, September 30,2007 (A) (A) - (B) (A) - (C) 2006 (B) 2006 (C)
Domestic 1,323 (22) (167) 1,346 1,491 Manufacturing - - - - - Construction - - - - - Wholesale and retail - (9) (4) 9 4 Finance and insurance - - - - - Real estate 202 (19) (9) 222 212 Services 262 (48) (39) 311 301 Other industries - (8) (8) 8 8 Consumer 858 64 (104) 794 963
Total 1,323 (22) (167) 1,346 1,491
(35) 37 96 Accruing loans contractually 61 24
0.01% 0.05%Accruing loans contractually
0.03% 0.01% (0.01)%
30

Mitsubishi UFJ Financial Group, Inc.
2. Non Performing Loans Based on the Financial Reconstruction Law (the "FRL")
Non performing loans had been determined among "Loans and bills discounted", "Foreign exchanges", "Acceptances and guarantees", "Credit related suspense accounts", "Accrued interest" and "Securities lent" prior to September 2006. In accordance with the revision of the Ministerial Ordinance for the FRL, "Guaranteed private placement bonds" was included in the scope for determining non performing loans as of March 31, 2007.
The Bank of Tokyo-Mitsubishi UFJ, Ltd. and Mitsubishi UFJ Trust and Banking Corporation(Combined including Trust Accounts)
(1)Non Performing Loans(in millions of yen)
As of Increase/ Increase/ As of As ofMarch 31, (Decrease) (Decrease) March 31, September 30,2007 (A) (A) - (B) (A) - (C) 2006 (B) 2006 (C)
Bankrupt or De facto Bankrupt 115,968 (36,385) (9,039) 152,354 125,008 Doubtful 647,903 (101,530) 151,985 749,433 495,918 Special Attention 562,007 (362,106) (94,899) 924,114 656,907
Non Performing Loans (1) 1,325,880 (500,022) 48,046 1,825,902 1,277,833
Normal 89,268,191 2,995,855 1,805,220 86,272,336 87,462,970
(2)Status of Coverage of Non Performing Loans (in millions of yen)
As of Increase/ Increase/ As of As ofMarch 31, (Decrease) (Decrease) March 31, September 30,2007 (A) (A) - (B) (A) - (C) 2006 (B) 2006 (C)
Covered amount (2) 1,059,836 (241,026) 50,178 1,300,862 1,009,657 Allowance for loan losses 401,377 (66,449) 103,664 467,827 297,712
- - - - -
Collateral, guarantees, etc. 658,458 (174,576) (53,486) 833,034 711,944
Coverage ratio (2) / (1) 79.93% 8.68% 0.92% 71.24% 79.01%
Loan amount (A) Allowance forloan losses (B)
Reserve forfinancial
support tospecific
borrowers (C)
Covered bycollateral and/orguarantees (D)
Coverage ratiofor unsecured
portion [(B)+(C)] /
[(A)-(D)]
Coverage ratio[(B)+(C)+(D)]
/ (A)
115,968 1,647 - 114,321 100.00% [152,354] [4,432] [-] [147,921] [100.00%]647,903 261,335 - 285,842 84.45%
[749,433] [232,601] [-] [414,151] [86.29%]562,007 138,394 - 258,294 70.58%
[924,114] [230,793] [-] [270,962] [54.29%]1,325,880 401,377 - 658,458 79.93%
[1,825,902] [467,827] [-] [833,034] [71.24%]89,268,191
[86,272,336]90,594,071
[88,098,238]1.46%
[2.07%]
Reserve for financial support to specific borrowers
Category
Bankrupt or De facto Bankrupt
Doubtful
Share of Non Performing Loans(3) / (4)Note: The upper figures are as of March 31, 2007. The lower figures with bracket are as of March 31, 2006.
Special Attention
Non Performing Loans (3)
Normal
Total (4)
31
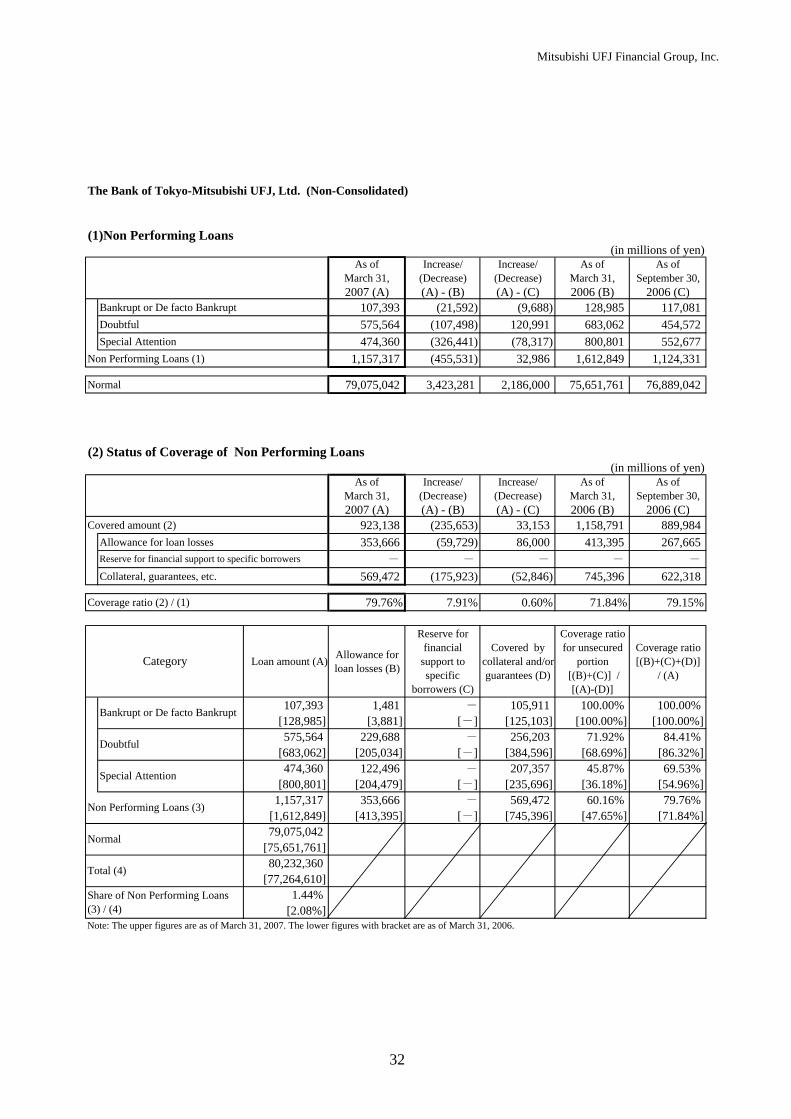
Mitsubishi UFJ Financial Group, Inc.
The Bank of Tokyo-Mitsubishi UFJ, Ltd. (Non-Consolidated)
(1)Non Performing Loans
(in millions of yen)As of Increase/ Increase/ As of As of
March 31, (Decrease) (Decrease) March 31, September 30,2007 (A) (A) - (B) (A) - (C) 2006 (B) 2006 (C)
Bankrupt or De facto Bankrupt 107,393 (21,592) (9,688) 128,985 117,081 Doubtful 575,564 (107,498) 120,991 683,062 454,572 Special Attention 474,360 (326,441) (78,317) 800,801 552,677
Non Performing Loans (1) 1,157,317 (455,531) 32,986 1,612,849 1,124,331
Normal 79,075,042 3,423,281 2,186,000 75,651,761 76,889,042
(2) Status of Coverage of Non Performing Loans(in millions of yen)
As of Increase/ Increase/ As of As ofMarch 31, (Decrease) (Decrease) March 31, September 30,2007 (A) (A) - (B) (A) - (C) 2006 (B) 2006 (C)
Covered amount (2) 923,138 (235,653) 33,153 1,158,791 889,984 Allowance for loan losses 353,666 (59,729) 86,000 413,395 267,665
- - - - - Collateral, guarantees, etc. 569,472 (175,923) (52,846) 745,396 622,318
Coverage ratio (2) / (1) 79.76% 7.91% 0.60% 71.84% 79.15%
Loan amount (A) Allowance forloan losses (B)
Reserve forfinancial
support tospecific
borrowers (C)
Covered bycollateral and/orguarantees (D)
Coverage ratiofor unsecured
portion [(B)+(C)] /
[(A)-(D)]
Coverage ratio[(B)+(C)+(D)]
/ (A)
107,393 1,481 - 105,911 100.00% 100.00% [128,985] [3,881] [-] [125,103] [100.00%] [100.00%]575,564 229,688 - 256,203 71.92% 84.41%
[683,062] [205,034] [-] [384,596] [68.69%] [86.32%]474,360 122,496 - 207,357 45.87% 69.53%
[800,801] [204,479] [-] [235,696] [36.18%] [54.96%]1,157,317 353,666 - 569,472 60.16% 79.76%
[1,612,849] [413,395] [-] [745,396] [47.65%] [71.84%]79,075,042
[75,651,761]80,232,360
[77,264,610]1.44%
[2.08%]
Category
Special Attention
Reserve for financial support to specific borrowers
Note: The upper figures are as of March 31, 2007. The lower figures with bracket are as of March 31, 2006.
Doubtful
Bankrupt or De facto Bankrupt
Normal
Total (4)
Non Performing Loans (3)
Share of Non Performing Loans(3) / (4)
32

Mitsubishi UFJ Financial Group, Inc.
Mitsubishi UFJ Trust and Banking Corporation (Non-Consolidated)
(1) Non Performing Loans(in millions of yen)
As of Increase/ Increase/ As of As ofMarch 31, (Decrease) (Decrease) March 31, September 30,2007 (A) (A) - (B) (A) - (C) 2006 (B) 2006 (C)
Bankrupt or De facto Bankrupt 8,343 (14,905) 622 23,248 7,720Doubtful 72,141 6,049 31,104 66,091 41,037Special Attention 86,753 (35,612) (16,499) 122,366 103,253
Non Performing Loans (1) 167,238 (44,468) 15,227 211,706 152,010
Normal 10,023,645 (408,865) (373,569) 10,432,511 10,397,215
(2) Status of Coverage of Non Performing Loans(in millions of yen)
As of Increase/ Increase/ As of As ofMarch 31, (Decrease) (Decrease) March 31, September 30,2007 (A) (A) - (B) (A) - (C) 2006 (B) 2006 (C)
Covered amount (2) 135,631 (5,379) 17,119 141,010 118,511 Allowance for loan losses 47,711 (6,720) 17,664 54,431 30,047
- - - - - Collateral, guarantees, etc. 87,919 1,341 (545) 86,578 88,464
Coverage ratio (2) / (1) 81.10% 14.49% 3.13% 66.60% 77.96%
Loan amount (A) Allowance forloan losses (B)
Reserve forfinancial
support tospecific
borrowers (C)
Covered bycollateral and/orguarantees (D)
Coverage ratiofor unsecured
portion [(B)+(C)] /
[(A)-(D)]
Coverage ratio[(B)+(C)+(D)]
/ (A)
8,343 165 - 8,177 100.00% 100.00% [23,248] [551] [-] [22,697] [100.00%] [100.00%]72,141 31,647 - 29,460 74.15% 84.70%
[66,091] [27,566] [-] [29,283] [74.89%] [86.01%]86,753 15,897 - 50,281 43.58% 76.28%
[122,366] [26,313] [-] [34,597] [29.98%] [49.77%]167,238 47,711 - 87,919 60.15% 81.10%
[211,706] [54,431] [-] [86,578] [43.50%] [66.60%]10,023,645
[10,432,511]10,190,884
[10,644,218]1.64%
[1.98%]
Reserve for financial support to specific borrowers
Category
Bankrupt or De facto Bankrupt
Doubtful
Share of Non Performing Loans(3) / (4)Note: The upper figures are as of March 31, 2007. The lower figures with bracket are as of March 31, 2006.
Special Attention
Non Performing Loans (3)
Normal
Total (4)
33
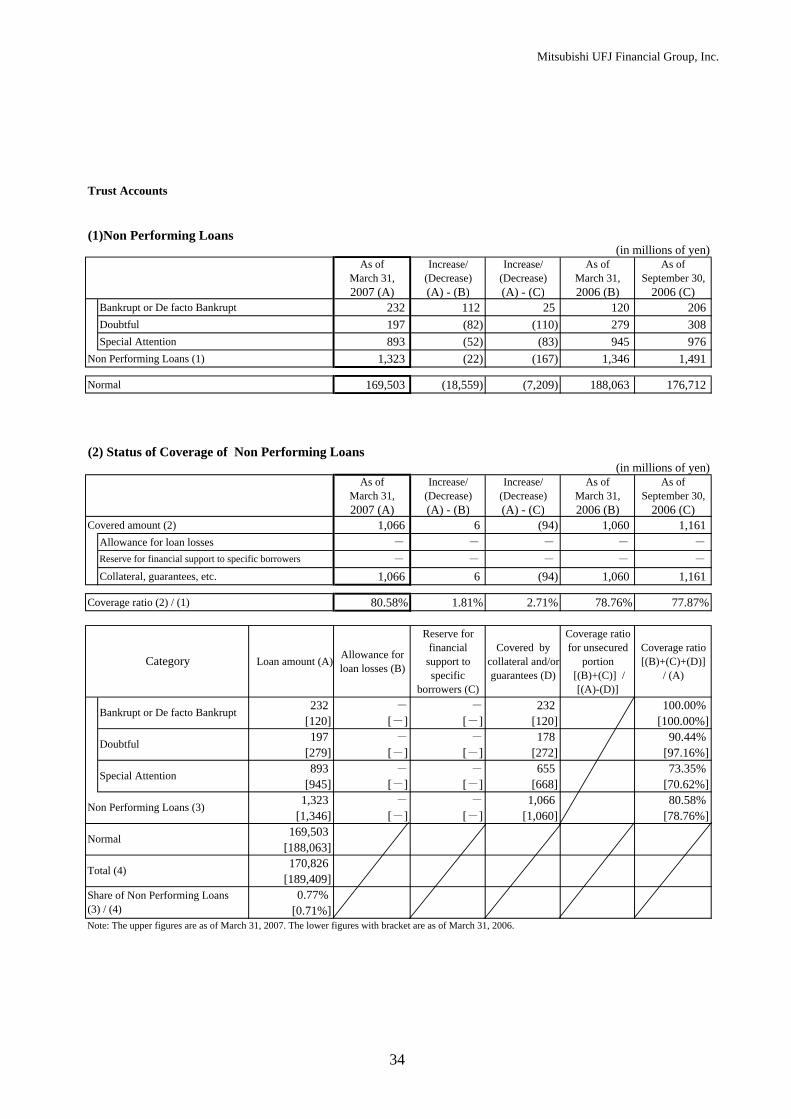
Mitsubishi UFJ Financial Group, Inc.
Trust Accounts
(1)Non Performing Loans(in millions of yen)
As of Increase/ Increase/ As of As ofMarch 31, (Decrease) (Decrease) March 31, September 30,2007 (A) (A) - (B) (A) - (C) 2006 (B) 2006 (C)
Bankrupt or De facto Bankrupt 232 112 25 120 206 Doubtful 197 (82) (110) 279 308 Special Attention 893 (52) (83) 945 976
Non Performing Loans (1) 1,323 (22) (167) 1,346 1,491
Normal 169,503 (18,559) (7,209) 188,063 176,712
(2) Status of Coverage of Non Performing Loans (in millions of yen)
As of Increase/ Increase/ As of As ofMarch 31, (Decrease) (Decrease) March 31, September 30,2007 (A) (A) - (B) (A) - (C) 2006 (B) 2006 (C)
Covered amount (2) 1,066 6 (94) 1,060 1,161 Allowance for loan losses - - - - -
- - - - - Collateral, guarantees, etc. 1,066 6 (94) 1,060 1,161
Coverage ratio (2) / (1) 80.58% 1.81% 2.71% 78.76% 77.87%
Loan amount (A) Allowance forloan losses (B)
Reserve forfinancial
support tospecific
borrowers (C)
Covered bycollateral and/orguarantees (D)
Coverage ratiofor unsecured
portion [(B)+(C)] /
[(A)-(D)]
Coverage ratio[(B)+(C)+(D)]
/ (A)
232 - - 232 100.00% [120] [-] [-] [120] [100.00%]197 - - 178 90.44%
[279] [-] [-] [272] [97.16%]893 - - 655 73.35%
[945] [-] [-] [668] [70.62%]1,323 - - 1,066 80.58%
[1,346] [-] [-] [1,060] [78.76%]169,503
[188,063]170,826
[189,409]0.77%
[0.71%]
Reserve for financial support to specific borrowers
Category
Bankrupt or De facto Bankrupt
Doubtful
Share of Non Performing Loans(3) / (4)Note: The upper figures are as of March 31, 2007. The lower figures with bracket are as of March 31, 2006.
Special Attention
Non Performing Loans (3)
Normal
Total (4)
34

Mitsubishi UFJ Financial Group, Inc.
3. Progress in Disposal of Problem Assets
The Bank of Tokyo-Mitsubishi UFJ, Ltd., Mitsubishi UFJ Trust and Banking Corporation and MU Strategic Partner, Co., Ltd. ("MUSP") (Combined, including Trust Accounts)
(A) Historical trend of problem assets based on the "FRL"(in billions of yen)
As of As of As of As of As of As of As ofMarch 31, September 30, March 31, September 30, March 31, September 30, March 31,
2004 2004 2005 2005 2006 2006 (a) 2007 (b)444.8 367.3 279.1 194.5 153.3 125.2 116.3 (8.9)
Doubtful 2,024.9 4,439.0 1,407.2 1,266.9 749.7 500.4 652.3 151.8 Total 2,469.8 4,806.4 1,686.4 1,461.4 903.0 625.7 768.6 142.9
(1) Assets categorized as problem assets based on the "FRL" prior to March 31, 2004 444.8 295.5 172.6 106.6 81.8 49.6 40.3 (9.3)
Doubtful 2,024.9 916.4 403.7 273.1 169.9 128.0 97.1 (30.8)Total 2,469.8 1,211.9 576.3 379.7 251.8 177.6 137.4 (40.2)
(2) Assets newly categorized as problem assets based on the "FRL" during the first half of fiscal 200471.8 35.7 20.2 13.5 8.7 6.3 (2.4)
Doubtful 3,522.6 638.8 365.6 209.1 34.6 26.4 (8.2)Total 3,594.4 674.5 385.9 222.7 43.4 32.7 (10.6)
(3) Assets newly categorized as problem assets based on the "FRL" during the second half of fiscal 200470.8 26.4 14.0 8.8 7.0 (1.7)
Doubtful 364.7 208.4 49.1 28.2 20.8 (7.4)Total 435.5 234.8 63.1 37.0 27.8 (9.1)
(4) Assets newly categorized as problem assets based on the "FRL" during the first half of fiscal 200541.2 22.5 19.3 13.0 (6.2)
Doubtful 419.6 170.0 101.2 78.6 (22.6)Total 460.8 192.6 120.6 91.7 (28.9)
(5) Assets newly categorized as problem assets based on the "FRL" during the second half of fiscal 200521.2 16.3 10.2 (6.1)
Doubtful 151.4 72.1 37.4 (34.7)Total 172.6 88.5 47.6 (40.8)
(6) Assets newly categorized as problem assets based on the "FRL" during the first half of fiscal 2006 22.2 16.4 (5.8)
Doubtful 136.0 63.0 (73.0)Total 158.3 79.4 (78.8)
(7) Assets newly categorized as problem assets based on the "FRL" during the second half of fiscal 2006 22.8
Doubtful 328.7 Total 351.6
Problem assets had been determined among "Loans and bills discounted", "Foreign exchanges", "Acceptances and guarantees", "Credit related suspenseaccounts", "Accrued interest" and "Securities lent" prior to September 2006. In accordance with the revision of the Ministerial Ordinance for the FRL,"Guaranteed private placement bonds" was included in the scope for determining problem assets as of March 31, 2007.
Bankrupt or De facto Bankrupt
Bankrupt or De facto Bankrupt
Bankrupt or De facto Bankrupt
Bankrupt or De facto Bankrupt
Bankrupt or De facto Bankrupt
Bankrupt or De facto Bankrupt
Bankrupt or De facto Bankrupt
The amounts presented as "during the second half of fiscal 2005" include amounts of The Bank of Tokyo-Mitsubishi UFJ, Ltd., former The Bank of Tokyo-Mitsubishi, Ltd., former UFJ Bank Limited, Mitsubishi UFJ Trust and Banking Corporation, MUSP and Trust accounts. The amounts prior to September 30,2005 include amounts of former The Bank of Tokyo-Mitsubishi, Ltd., former UFJ Bank Limited, former The Mitsubishi Trust and Banking Corporation,former UFJ Trust Bank Limited, MUSP and Trust accounts.
(b) - (a)
Bankrupt or De facto Bankrupt
35

Mitsubishi UFJ Financial Group, Inc.
(B) Historical data for disposal of problem assets
(1) Assets categorized as problem assets prior to March 31,2004 (2) Assets newly categorized as problem assets during the first half of fiscal 2004 (in billions of yen) (in billions of yen)
As of As of As of As ofSeptember 30, March 31, September 30, March 31,
2006 2007 2006 2007
49.6 40.3 (9.3) 8.7 6.3 (2.4)Doubtful 128.0 97.1 (30.8) Doubtful 34.6 26.4 (8.2)Total 177.6 137.4 (40.2) Total 43.4 32.7 (10.6)
(A) (B) (C) (D)Progress in disposal of problem assets (in billions of yen) Progress in disposal of problem assets (in billions of yen)
Second half offiscal 2006
Second half offiscal 2006
Liquidation 0.5 Liquidation 0.0 Re-constructive treatment 1.5 Re-constructive treatment 1.2
- - Loan sales to secondary market 8.1 Loan sales to secondary market 1.7 Write-offs 3.6 Write-offs 2.5 Other 26.2 Other 5.0
Collection / Repayment 22.3 Collection / Repayment 4.0 Upgraded 3.8 Upgraded 0.9
Total 40.2 (B) Total 10.6 (D)
These measures shown below have been already taken to outstanding problem loans (A). These measures shown below have been already taken to outstanding problem loans (C). (in billions of yen) (in billions of yen)
Second half offiscal 2006
Second half offiscal 2006
Legal liquidation 8.6 Legal liquidation 2.8 Quasi-legal liquidation 1.3 Quasi-legal liquidation -
- - 27.2 3.4
- - Total 37.2 Total 6.3
(3) Assets newly categorized as problem assets during the second half of fiscal 2004 (4) Assets newly categorized as problem assets during the first half of fiscal 2005 (in billions of yen) (in billions of yen)
As of As of As of As ofSeptember 30, March 31, September 30, March 31,
2006 2007 2006 2007
8.8 7.0 (1.7) 19.3 13.0 (6.2)Doubtful 28.2 20.8 (7.4) Doubtful 101.2 78.6 (22.6)Total 37.0 27.8 (9.1) Total 120.6 91.7 (28.9)
(E) (F) (G) (H)Progress in disposal of problem assets (in billions of yen) Progress in disposal of problem assets (in billions of yen)
Second half offiscal 2006
Second half offiscal 2006
Liquidation 0.0 Liquidation 0.0 Re-constructive treatment 0.0 Re-constructive treatment 0.5
- - Loan sales to secondary market 3.2 Loan sales to secondary market 4.1 Write-offs 0.5 Write-offs 2.6 Other 5.3 Other 21.5
Collection / Repayment 4.6 Collection / Repayment 17.8 Upgrade 0.7 Upgrade 3.6
Total 9.1 (F) Total 28.9 (H)
These measures shown below have been already taken to outstanding problem loans (E). These measures shown below have been already taken to outstanding problem loans (G). (in billions of yen) (in billions of yen)
Second half offiscal 2006
Second half offiscal 2006
Legal liquidation 4.2 Legal liquidation 5.7 Quasi-legal liquidation - Quasi-legal liquidation -
- - 2.7 7.0
- - Total 7.0 Total 12.8
Upgrade due to re-constructive treatment Upgrade due to re-constructive treatment
Partial write-off of small balance loans
Split-off of problem loans
Bankrupt or De facto Bankrupt
Increase / (Decrease)
Increase / (Decrease)
Bankrupt or De facto Bankrupt
Split-off of problem loans
Partial write-off of small balance loans
Entrust to the Resolution and Collection Corporation Entrust to the Resolution and Collection Corporation
Increase / (Decrease)
Increase / (Decrease)
Bankrupt or De facto Bankrupt Bankrupt or De facto Bankrupt
Entrust to the Resolution and Collection Corporation
Upgrade due to re-constructive treatment
Split-off of problem loans Split-off of problem loans
Partial write-off of small balance loans Partial write-off of small balance loans
Entrust to the Resolution and Collection Corporation
Upgrade due to re-constructive treatment
36
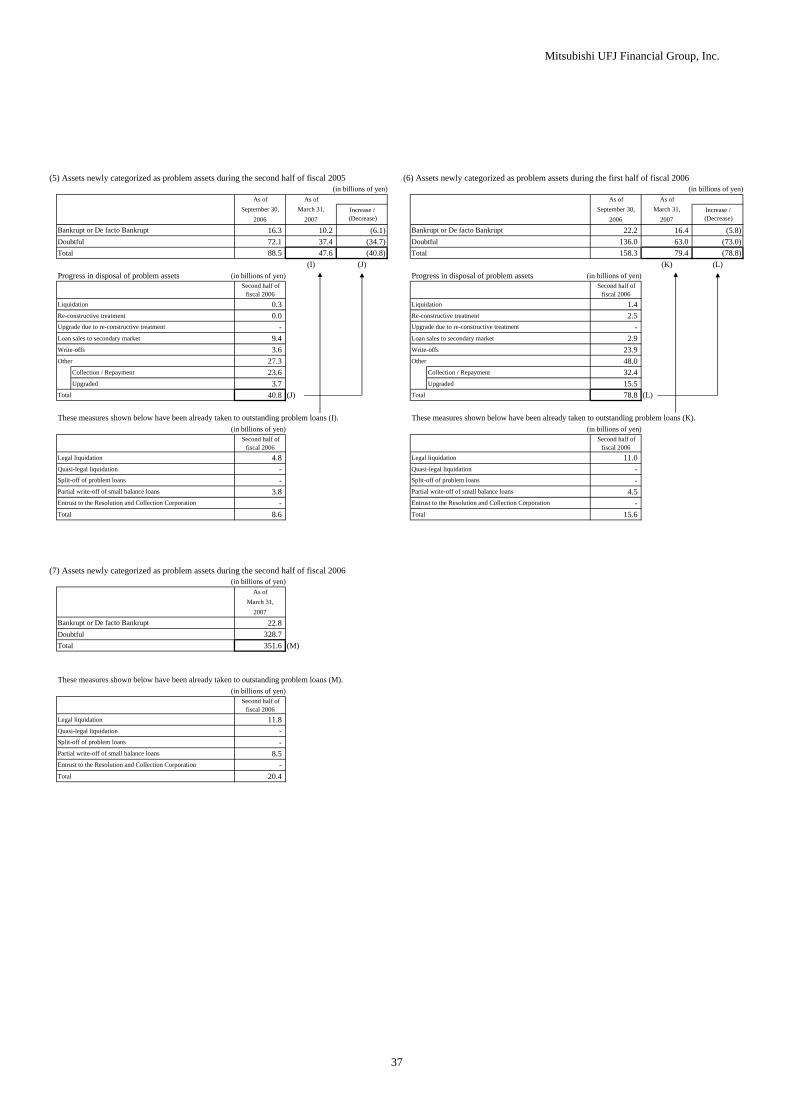
Mitsubishi UFJ Financial Group, Inc.
(5) Assets newly categorized as problem assets during the second half of fiscal 2005 (6) Assets newly categorized as problem assets during the first half of fiscal 2006(in billions of yen) (in billions of yen)
As of As of As of As ofSeptember 30, March 31, September 30, March 31,
2006 2007 2006 2007
16.3 10.2 (6.1) 22.2 16.4 (5.8)Doubtful 72.1 37.4 (34.7) Doubtful 136.0 63.0 (73.0)Total 88.5 47.6 (40.8) Total 158.3 79.4 (78.8)
(I) (J) (K) (L)Progress in disposal of problem assets (in billions of yen) Progress in disposal of problem assets (in billions of yen)
Second half offiscal 2006
Second half offiscal 2006
Liquidation 0.3 Liquidation 1.4 Re-constructive treatment 0.0 Re-constructive treatment 2.5
- - Loan sales to secondary market 9.4 Loan sales to secondary market 2.9 Write-offs 3.6 Write-offs 23.9 Other 27.3 Other 48.0
Collection / Repayment 23.6 Collection / Repayment 32.4 Upgraded 3.7 Upgraded 15.5
Total 40.8 (J) Total 78.8 (L)
These measures shown below have been already taken to outstanding problem loans (I). These measures shown below have been already taken to outstanding problem loans (K). (in billions of yen) (in billions of yen)
Second half offiscal 2006
Second half offiscal 2006
Legal liquidation 4.8 Legal liquidation 11.0 Quasi-legal liquidation - Quasi-legal liquidation -
- - 3.8 4.5
- - Total 8.6 Total 15.6
(7) Assets newly categorized as problem assets during the second half of fiscal 2006 (in billions of yen)
As ofMarch 31,
2007
22.8 Doubtful 328.7 Total 351.6 (M)
These measures shown below have been already taken to outstanding problem loans (M). (in billions of yen)
Second half offiscal 2006
Legal liquidation 11.8 Quasi-legal liquidation -
- 8.5
- Total 20.4
Split-off of problem loans
Partial write-off of small balance loans
Entrust to the Resolution and Collection Corporation
Entrust to the Resolution and Collection Corporation
Bankrupt or De facto Bankrupt
Entrust to the Resolution and Collection Corporation
Increase / (Decrease)
Bankrupt or De facto Bankrupt Bankrupt or De facto Bankrupt
Upgrade due to re-constructive treatment Upgrade due to re-constructive treatment
Increase / (Decrease)
Split-off of problem loans Split-off of problem loans
Partial write-off of small balance loans Partial write-off of small balance loans
37

Mitsubishi UFJ Financial Group, Inc.
The Bank of Tokyo-Mitsubishi UFJ, Ltd., and MUSP (Combined)
(A) Historical trend of problem assets based on the "FRL"(in billions of yen)
As of As of As of As of As of As of As ofMarch 31, September 30, March 31, September 30, March 31, September 30, March 31,
2004 2004 2005 2005 2006 2006 (a) 2007 (b)365.2 306.5 229.5 162.1 129.9 117.3 107.7 (9.6)
Doubtful 1,639.7 3,901.2 1,240.6 1,106.7 683.3 459.1 579.9 120.8 Total 2,004.9 4,207.7 1,470.2 1,268.8 813.3 576.4 687.7 111.2
(1) Assets categorized as problem assets based on the "FRL" prior to March 31, 2004 365.2 237.9 139.2 86.5 69.2 45.7 38.2 (7.4)
Doubtful 1,639.7 771.9 346.3 223.3 148.5 121.1 91.4 (29.7)Total 2,004.9 1,009.8 485.6 309.9 217.7 166.8 129.6 (37.2)
(2) Assets newly categorized as problem assets based on the "FRL" during the first half of fiscal 200468.5 25.3 16.5 9.3 8.3 6.2 (2.0)
Doubtful 3,129.3 579.1 312.8 186.3 29.3 23.0 (6.3)Total 3,197.9 604.4 329.3 195.6 37.7 29.2 (8.4)
(3) Assets newly categorized as problem assets based on the "FRL" during the second half of fiscal 200464.9 25.6 13.4 8.4 6.8 (1.5)
Doubtful 315.1 173.5 46.7 27.4 20.4 (6.9)Total 380.0 199.1 60.2 35.8 27.3 (8.5)
(4) Assets newly categorized as problem assets based on the "FRL" during the first half of fiscal 200533.5 17.0 17.6 11.7 (5.9)
Doubtful 396.8 156.1 90.0 69.5 (20.5)Total 430.4 173.2 107.7 81.2 (26.4)
(5) Assets newly categorized as problem assets based on the "FRL" during the second half of fiscal 200520.8 15.2 9.0 (6.2)
Doubtful 145.4 68.8 36.0 (32.7)Total 166.3 84.0 45.1 (38.9)
(6) Assets newly categorized as problem assets based on the "FRL" during the first half of fiscal 2006 22.0 13.8 (8.2)
Doubtful 122.2 54.8 (67.4)Total 144.2 68.6 (75.6)
(7) Assets newly categorized as problem assets based on the "FRL" during the second half of fiscal 2006 21.8
Doubtful 284.6 Total 306.4
(b) - (a)
Bankrupt or De facto Bankrupt
The amounts presented as "during the second half of fiscal 2005" include amounts of The Bank of Tokyo-Mitsubishi UFJ, Ltd., former The Bank ofTokyo-Mitsubishi, Ltd., former UFJ Bank Limited and MUSP. The amounts prior to September 30, 2005 include amounts of former The Bank ofTokyo-Mitsubishi, Ltd., former UFJ Bank Limited and MUSP.
Bankrupt or De facto Bankrupt
Bankrupt or De facto Bankrupt
Bankrupt or De facto Bankrupt
Bankrupt or De facto Bankrupt
Bankrupt or De facto Bankrupt
Bankrupt or De facto Bankrupt
Bankrupt or De facto Bankrupt
38

Mitsubishi UFJ Financial Group, Inc.
(B) Historical data for disposal of problem assets
(1) Assets categorized as problem assets prior to March 31,2004 (2) Assets newly categorized as problem assets during the first half of fiscal 2004(in billions of yen) (in billions of yen)
As of As of As of As ofSeptember 30, March 31, September 30, March 31,
2006 2007 2006 2007
45.7 38.2 (7.4) 8.3 6.2 (2.0)Doubtful 121.1 91.4 (29.7) Doubtful 29.3 23.0 (6.3)Total 166.8 129.6 (37.2) Total 37.7 29.2 (8.4)
(A) (B) (C) (D)Progress in disposal of problem assets (in billions of yen) Progress in disposal of problem assets (in billions of yen)
Second half offiscal 2006
Second half offiscal 2006
Liquidation 0.5 Liquidation 0.0 Re-constructive treatment 1.5 Re-constructive treatment 1.2
- - Loan sales to secondary market 6.9 Loan sales to secondary market 1.4 Write-offs 3.9 Write-offs 0.9 Other 24.2 Other 4.7
Collection / Repayment 20.3 Collection / Repayment 3.7 Upgrade 3.8 Upgrade 0.9
Total 37.2 (B) Total 8.4 (D)
These measures shown below have been already taken to outstanding problem loans (A). These measures shown below have been already taken to outstanding problem loans (C). (in billions of yen) (in billions of yen)
Second half offiscal 2006
Second half offiscal 2006
Legal liquidation 6.7 Legal liquidation 2.8 Quasi-legal liquidation - Quasi-legal liquidation -
- - 26.2 3.3
- - Total 32.9 Total 6.2
(3) Assets newly categorized as problem assets during the second half of fiscal 2004 (4) Assets newly categorized as problem assets during the first half of fiscal 2005 (in billions of yen) (in billions of yen)
As of As of As of As ofSeptember 30, March 31, September 30, March 31,
2006 2007 2006 2007
8.4 6.8 (1.5) 17.6 11.7 (5.9)Doubtful 27.4 20.4 (6.9) Doubtful 90.0 69.5 (20.5)Total 35.8 27.3 (8.5) Total 107.7 81.2 (26.4)
(E) (F) (G) (H)Progress in disposal of problem assets (in billions of yen) Progress in disposal of problem assets (in billions of yen)
Second half offiscal 2006
Second half offiscal 2006
Liquidation 0.0 Liquidation 0.0 Re-constructive treatment 0.0 Re-constructive treatment 0.5
- - Loan sales to secondary market 2.6 Loan sales to secondary market 4.1 Write-offs 0.5 Write-offs 2.7 Other 5.2 Other 18.9
Collection / Repayment 4.4 Collection / Repayment 15.3 Upgrade 0.7 Upgrade 3.5
Total 8.5 (F) Total 26.4 (H)
These measures shown below have been already taken to outstanding problem loans (E). These measures shown below have been already taken to outstanding problem loans (G). (in billions of yen) (in billions of yen)
Second half offiscal 2006
Second half offiscal 2006
Legal liquidation 4.1 Legal liquidation 5.4 Quasi-legal liquidation - Quasi-legal liquidation -
- - 2.6 6.0
- - Total 6.8 Total 11.5
Increase / (Decrease)
Increase / (Decrease)
Bankrupt or De facto Bankrupt
Split-off of problem loans
Partial write-off of small balance loans Partial write-off of small balance loans
Entrust to the Resolution and Collection Corporation Entrust to the Resolution and Collection Corporation
Bankrupt or De facto Bankrupt Bankrupt or De facto Bankrupt
Upgrade due to re-constructive treatment Upgrade due to re-constructive treatment
Increase / (Decrease)
Increase / (Decrease)
Bankrupt or De facto Bankrupt
Upgrade due to re-constructive treatment
Split-off of problem loans
Entrust to the Resolution and Collection Corporation
Upgrade due to re-constructive treatment
Split-off of problem loans Split-off of problem loans
Partial write-off of small balance loans Partial write-off of small balance loans
Entrust to the Resolution and Collection Corporation
39

Mitsubishi UFJ Finacial Group, Inc.
(5) Assets newly categorized as problem assets during the second half of fiscal 2005 (6) Assets newly categorized as problem assets during the first half of fiscal 2006(in billions of yen) (in billions of yen)
As of As of As of As ofSeptember 30, March 31, September 30, March 31,
2006 2007 2006 2007
15.2 9.0 (6.2) 22.0 13.8 (8.2)Doubtful 68.8 36.0 (32.7) Doubtful 122.2 54.8 (67.4)Total 84.0 45.1 (38.9) Total 144.2 68.6 (75.6)
(I) (J) (K) (L)Progress in disposal of problem assets (in billions of yen) Progress in disposal of problem assets (in billions of yen)
Second half offiscal 2006
Second half offiscal 2006
Liquidation 0.3 Liquidation 1.4 Re-constructive treatment 0.0 Re-constructive treatment 2.5
- - Loan sales to secondary market 9.3 Loan sales to secondary market 2.9 Write-offs 2.2 Write-offs 22.6 Other 26.9 Other 46.0
Collection / Repayment 23.2 Collection / Repayment 31.3 Upgrade 3.7 Upgrade 14.7
Total 38.9 (J) Total 75.6 (L)
These measures shown below have been already taken to outstanding problem loans (I). These measures shown below have been already taken to outstanding problem loans (K). (in billions of yen) (in billions of yen)
Second half offiscal 2006
Second half offiscal 2006
Legal liquidation 4.7 Legal liquidation 8.7 Quasi-legal liquidation - Quasi-legal liquidation -
- - 2.7 4.2
- - Total 7.4 Total 12.9
(7) Assets newly categorized as problem assets during the second half of fiscal 2006 (in billions of yen)
As ofMarch 31,
2007
21.8 Doubtful 284.6 Total 306.4 (M)
These measures shown below have been already taken to outstanding problem loans (M). (in billions of yen)
Second half offiscal 2006
Legal liquidation 11.0 Quasi-legal liquidation -
- 8.4
- Total 19.4 Entrust to the Resolution and Collection Corporation
Entrust to the Resolution and Collection Corporation Entrust to the Resolution and Collection Corporation
Upgrade due to re-constructive treatment
Split-off of problem loans
Partial write-off of small balance loans Partial write-off of small balance loans
Split-off of problem loans
Increase / (Decrease)
Bankrupt or De facto Bankrupt
Partial write-off of small balance loans
Bankrupt or De facto Bankrupt
Split-off of problem loans
Bankrupt or De facto Bankrupt
Upgrade due to re-constructive treatment
Increase / (Decrease)
40

Mitsubishi UFJ Financial Group, Inc.
Mitsubishi UFJ Trust and Banking Corporation (Non-Consolidated, including Trust Accounts)
(A) Historical trend of problem assets based on the "FRL"(in billions of yen)
As of As of As of As of As of As of As ofMarch 31, September 30, March 31, September 30, March 31, September 30, March 31,
2004 2004 2005 2005 2006 2006 (a) 2007 (b)79.6 60.8 49.6 32.3 23.3 7.9 8.5 0.6
Doubtful 385.2 537.7 166.5 160.2 66.3 41.3 72.3 30.9 Total 464.8 598.6 216.2 192.6 89.7 49.2 80.9 31.6
(1) Assets categorized as problem assets based on the "FRL" prior to March 31, 2004 79.6 57.6 33.3 20.1 12.6 3.9 2.0 (1.8)
Doubtful 385.2 144.4 57.3 49.7 21.3 6.8 5.6 (1.1)Total 464.8 202.1 90.6 69.8 34.0 10.7 7.7 (2.9)
(2) Assets newly categorized as problem assets based on the "FRL" during the first half of fiscal 20043.2 10.3 3.7 4.2 0.4 0.0 (0.3)
Doubtful 393.2 59.7 52.8 22.8 5.2 3.4 (1.8)Total 396.5 70.0 56.5 27.0 5.7 3.4 (2.2)
(3) Assets newly categorized as problem assets based on the "FRL" during the second half of fiscal 20045.9 0.8 0.5 0.4 0.2 (0.2)
Doubtful 49.5 34.9 2.3 0.8 0.3 (0.4)Total 55.4 35.7 2.9 1.2 0.5 (0.6)
(4) Assets newly categorized as problem assets based on the "FRL" during the first half of fiscal 20057.6 5.5 1.7 1.3 (0.3)
Doubtful 22.7 13.9 11.2 9.1 (2.0)Total 30.4 19.4 12.9 10.5 (2.4)
(5) Assets newly categorized as problem assets based on the "FRL" during the second half of fiscal 20050.4 1.1 1.2 0.0
Doubtful 5.9 3.3 1.3 (1.9)Total 6.3 4.4 2.5 (1.8)
(6) Assets newly categorized as problem assets based on the "FRL" during the first half of fiscal 2006 0.2 2.6 2.3
Doubtful 13.8 8.2 (5.5)Total 14.1 10.8 (3.2)
(7) Assets newly categorized as problem assets based on the "FRL" during the second half of fiscal 2006 0.9
Doubtful 44.1 Total 45.1
The amounts presented prior to September 30, 2005 include amounts of former The Mitsubishi Trust and Banking Corporation and former UFJ TrustBank Limited.
Bankrupt or De facto Bankrupt
Bankrupt or De facto Bankrupt
Bankrupt or De facto Bankrupt
Bankrupt or De facto Bankrupt
Bankrupt or De facto Bankrupt
Bankrupt or De facto Bankrupt
Bankrupt or De facto Bankrupt
(b) - (a)
Bankrupt or De facto Bankrupt
41
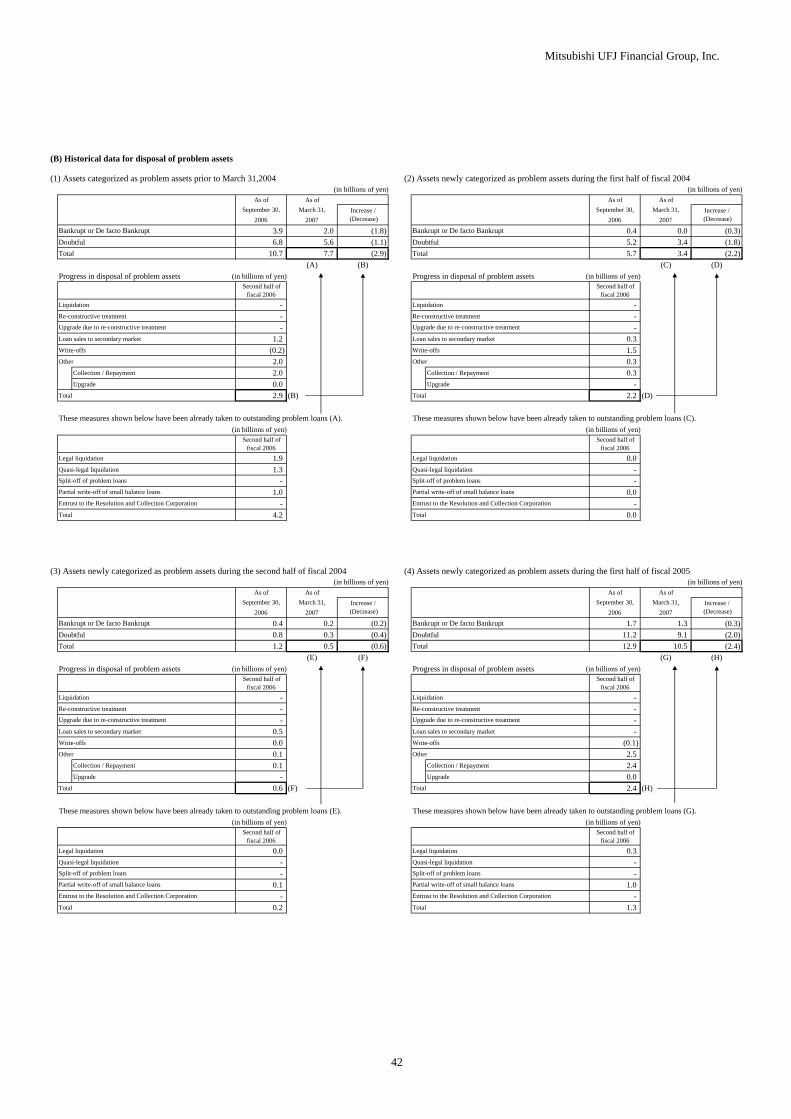
Mitsubishi UFJ Financial Group, Inc.
(B) Historical data for disposal of problem assets
(1) Assets categorized as problem assets prior to March 31,2004 (2) Assets newly categorized as problem assets during the first half of fiscal 2004(in billions of yen) (in billions of yen)
As of As of As of As ofSeptember 30, March 31, September 30, March 31,
2006 2007 2006 2007
3.9 2.0 (1.8) 0.4 0.0 (0.3)Doubtful 6.8 5.6 (1.1) Doubtful 5.2 3.4 (1.8)Total 10.7 7.7 (2.9) Total 5.7 3.4 (2.2)
(A) (B) (C) (D)Progress in disposal of problem assets (in billions of yen) Progress in disposal of problem assets (in billions of yen)
Second half offiscal 2006
Second half offiscal 2006
Liquidation - Liquidation - Re-constructive treatment - Re-constructive treatment -
- - Loan sales to secondary market 1.2 Loan sales to secondary market 0.3 Write-offs (0.2) Write-offs 1.5 Other 2.0 Other 0.3
Collection / Repayment 2.0 Collection / Repayment 0.3 Upgrade 0.0 Upgrade -
Total 2.9 (B) Total 2.2 (D)
These measures shown below have been already taken to outstanding problem loans (A). These measures shown below have been already taken to outstanding problem loans (C). (in billions of yen) (in billions of yen)
Second half offiscal 2006
Second half offiscal 2006
Legal liquidation 1.9 Legal liquidation 0.0 Quasi-legal liquidation 1.3 Quasi-legal liquidation -
- - 1.0 0.0
- - Total 4.2 Total 0.0
(3) Assets newly categorized as problem assets during the second half of fiscal 2004 (4) Assets newly categorized as problem assets during the first half of fiscal 2005 (in billions of yen) (in billions of yen)
As of As of As of As ofSeptember 30, March 31, September 30, March 31,
2006 2007 2006 2007
0.4 0.2 (0.2) 1.7 1.3 (0.3)Doubtful 0.8 0.3 (0.4) Doubtful 11.2 9.1 (2.0)Total 1.2 0.5 (0.6) Total 12.9 10.5 (2.4)
(E) (F) (G) (H)Progress in disposal of problem assets (in billions of yen) Progress in disposal of problem assets (in billions of yen)
Second half offiscal 2006
Second half offiscal 2006
Liquidation - Liquidation - Re-constructive treatment - Re-constructive treatment -
- - Loan sales to secondary market 0.5 Loan sales to secondary market - Write-offs 0.0 Write-offs (0.1)Other 0.1 Other 2.5
Collection / Repayment 0.1 Collection / Repayment 2.4 Upgrade - Upgrade 0.0
Total 0.6 (F) Total 2.4 (H)
These measures shown below have been already taken to outstanding problem loans (E). These measures shown below have been already taken to outstanding problem loans (G). (in billions of yen) (in billions of yen)
Second half offiscal 2006
Second half offiscal 2006
Legal liquidation 0.0 Legal liquidation 0.3 Quasi-legal liquidation - Quasi-legal liquidation -
- - 0.1 1.0
- - Total 0.2 Total 1.3
Split-off of problem loans
Partial write-off of small balance loans Partial write-off of small balance loans
Entrust to the Resolution and Collection Corporation
Increase / (Decrease)
Bankrupt or De facto Bankrupt Bankrupt or De facto Bankrupt
Upgrade due to re-constructive treatment Upgrade due to re-constructive treatment
Entrust to the Resolution and Collection Corporation Entrust to the Resolution and Collection Corporation
Increase / (Decrease)
Split-off of problem loans
Partial write-off of small balance loans Partial write-off of small balance loans
Split-off of problem loans
Increase / (Decrease)
Bankrupt or De facto Bankrupt
Entrust to the Resolution and Collection Corporation
Split-off of problem loans
Bankrupt or De facto Bankrupt
Upgrade due to re-constructive treatment
Increase / (Decrease)
Upgrade due to re-constructive treatment
42

Mitsubishi UFJ Financial Group, Inc.
(5) Assets newly categorized as problem assets during the second half of fiscal 2005 (6) Assets newly categorized as problem assets during the first half of fiscal 2006(in billions of yen) (in billions of yen)
As of As of As of As ofSeptember 30, March 31, September 30, March 31,
2006 2007 2006 2007
1.1 1.2 0.0 0.2 2.6 2.3 Doubtful 3.3 1.3 (1.9) Doubtful 13.8 8.2 (5.5)Total 4.4 2.5 (1.8) Total 14.1 10.8 (3.2)
(I) (J) (K) (L)Progress in disposal of problem assets (in billions of yen) Progress in disposal of problem assets (in billions of yen)
Second half offiscal 2006
Second half offiscal 2006
Liquidation - Liquidation - Re-constructive treatment - Re-constructive treatment 0.0
- - Loan sales to secondary market 0.0 Loan sales to secondary market - Write-offs 1.4 Write-offs 1.2 Other 0.4 Other 1.9
Collection / Repayment 0.3 Collection / Repayment 1.1 Upgrade 0.0 Upgrade 0.8
Total 1.8 (J) Total 3.2 (L)
These measures shown below have been already taken to outstanding problem loans (I). These measures shown below have been already taken to outstanding problem loans (K). (in billions of yen) (in billions of yen)
Second half offiscal 2006
Second half offiscal 2006
Legal liquidation 0.0 Legal liquidation 2.2 Quasi-legal liquidation - Quasi-legal liquidation -
- - 1.1 0.3
- - Total 1.2 Total 2.6
(7) Assets newly categorized as problem assets during the second half of fiscal 2006 (in billions of yen)
As ofMarch 31,
2007
0.9 Doubtful 44.1 Total 45.1 (M)
These measures shown below have been already taken to outstanding problem loans (M). (in billions of yen)
Second half offiscal 2006
Legal liquidation 0.8 Quasi-legal liquidation -
- 0.1
- Total 0.9
Increase / (Decrease)
Increase / (Decrease)
Bankrupt or De facto Bankrupt
Bankrupt or De facto Bankrupt
Partial write-off of small balance loans
Entrust to the Resolution and Collection Corporation
Upgrade due to re-constructive treatment
Split-off of problem loans
Entrust to the Resolution and Collection Corporation
Partial write-off of small balance loans
Bankrupt or De facto Bankrupt
Upgrade due to re-constructive treatment
Partial write-off of small balance loans
Entrust to the Resolution and Collection Corporation
Split-off of problem loans
Split-off of problem loans
43

Mitsubishi UFJ Financial Group, Inc.
The Bank of Tokyo-Mitsubishi UFJ, Ltd. and Mitsubishi UFJ Trust and Banking Corporation including Trust Accounts(Combined )
(1)Classification of Loans by Type of Industry (in millions of yen)As of Increase/ Increase/ As of As of
March 31, (Decrease) (Decrease) March 31, September 30,2007 (A) (A) - (B) (A) - (C) 2006 (B) 2006 (C)
Domestic offices (excluding loans booked at offshore markets) 68,273,175 (3,449,462) (2,467,524) 71,722,637 70,740,699
Manufacturing 7,644,091 (39,074) (4,842) 7,683,165 7,648,933Agriculture 23,535 2,280 (494) 21,255 24,029Forestry 16,746 (501) 4,689 17,247 12,057Fishery 30,588 (559) (1,360) 31,147 31,948Mining 49,115 (4,119) (1,917) 53,234 51,032Construction 1,554,978 (115,676) (13,215) 1,670,654 1,568,193Utilities 633,106 38,256 33,675 594,850 599,431Communication and information services 1,818,480 (47,805) (38,122) 1,866,285 1,856,602Wholesale and retail 7,293,045 (528,099) (330,028) 7,821,144 7,623,073Finance and insurance 7,321,664 (180,249) (916,414) 7,501,913 8,238,078Real estate 9,223,743 (653,345) (445,220) 9,877,088 9,668,963Services 6,444,114 218,914 281,705 6,225,200 6,162,409Municipal government 812,415 (73,569) (63,551) 885,984 875,966Other industries 25,407,541 (2,065,912) (972,431) 27,473,453 26,379,972
Overseas offices and loans booked at offshore markets 10,131,005 1,525,013 749,862 8,605,991 9,381,143
Total 78,404,180 (1,924,448) (1,717,662) 80,328,629 80,121,843
(2)Domestic Consumer Loans (in millions of yen)As of Increase/ Increase/ As of As of
March 31, (Decrease) (Decrease) March 31, September 30,2007 (A) (A) - (B) (A) - (C) 2006 (B) 2006 (C)
Total domestic consumer loans 18,328,956 (1,209,699) (305,430) 19,538,655 18,634,387 Residential mortgage 17,190,135 (1,054,568) (216,418) 18,244,704 17,406,554 Other 1,138,820 (155,131) (89,012) 1,293,951 1,227,832
(3)Domestic Loans to Small/Medium-Sized Companies and Proprietors (in millions of yen)As of Increase/ Increase/ As of As of
March 31, (Decrease) (Decrease) March 31, September 30,2007 (A) (A) - (B) (A) - (C) 2006 (B) 2006 (C)44,077,149 (856,627) (737,437) 44,933,776 44,814,586
64.55% 1.91% 1.20% 62.64% 63.35%
4. Classification of Loans by Type of Industry, Domestic Consumer Loans, Domestic Loans to Small/Medium-Sized Companies and Proprietors
Outstanding amount% to total domestic loans
44

Mitsubishi UFJ Financial Group, Inc.
The Bank of Tokyo-Mitsubishi UFJ, Ltd. (Non-Consolidated )
(1)Classification of Loans by Type of Industry (in millions of yen)As of Increase/ Increase/ As of As of
March 31, (Decrease) (Decrease) March 31, September 30,2007 (A) (A) - (B) (A) - (C) 2006 (B) 2006 (C)
58,358,487 (2,878,241) (2,082,938) 61,236,728 60,441,425
Manufacturing 6,384,756 (61,823) (41,423) 6,446,579 6,426,179Agriculture 22,458 2,164 (417) 20,294 22,875Forestry 16,746 (501) 4,689 17,247 12,057Fishery 5,150 (945) 573 6,095 4,577Mining 46,340 (3,441) (1,269) 49,781 47,609Construction 1,409,731 (102,298) (4,579) 1,512,029 1,414,310Utilities 381,239 42,901 25,687 338,338 355,552Communication and information services 871,251 (92,514) (61,128) 963,765 932,379Wholesale and retail 6,546,870 (614,889) (338,562) 7,161,759 6,885,432Finance and insurance 5,103,326 6,050 (924,862) 5,097,276 6,028,188Real estate 7,564,642 (733,902) (481,395) 8,298,544 8,046,037Services 5,458,352 100,086 184,324 5,358,266 5,274,028Municipal government 760,427 (73,222) (61,627) 833,649 822,054Other industries 23,787,199 (1,345,907) (382,949) 25,133,106 24,170,148
Overseas offices and loansbooked at offshore markets 9,836,470 1,486,002 739,024 8,350,468 9,097,446
Total 68,194,957 (1,392,238) (1,343,914) 69,587,196 69,538,871
(2)Domestic Consumer Loans (in millions of yen)As of Increase/ Increase/ As of As of
March 31, (Decrease) (Decrease) March 31, September 30,2007 (A) (A) - (B) (A) - (C) 2006 (B) 2006 (C)
Total domestic consumer loans 17,163,337 (1,211,444) (324,061) 18,374,781 17,487,398 Residential mortgage 16,051,849 (1,061,871) (237,605) 17,113,720 16,289,454 Other 1,111,488 (149,573) (86,456) 1,261,061 1,197,944
(3)Domestic Loans to Small/Medium-Sized Companies and Proprietors (in millions of yen)As of Increase/ Increase/ As of As of
March 31, (Decrease) (Decrease) March 31, September 30,2007 (A) (A) - (B) (A) - (C) 2006 (B) 2006 (C)38,911,759 (1,219,600) (954,871) 40,131,359 39,866,630
66.67% 1.14% 0.71% 65.53% 65.95%Outstanding amount% to total domestic loans
Domestic offices (excluding loans booked at offshore markets)
45
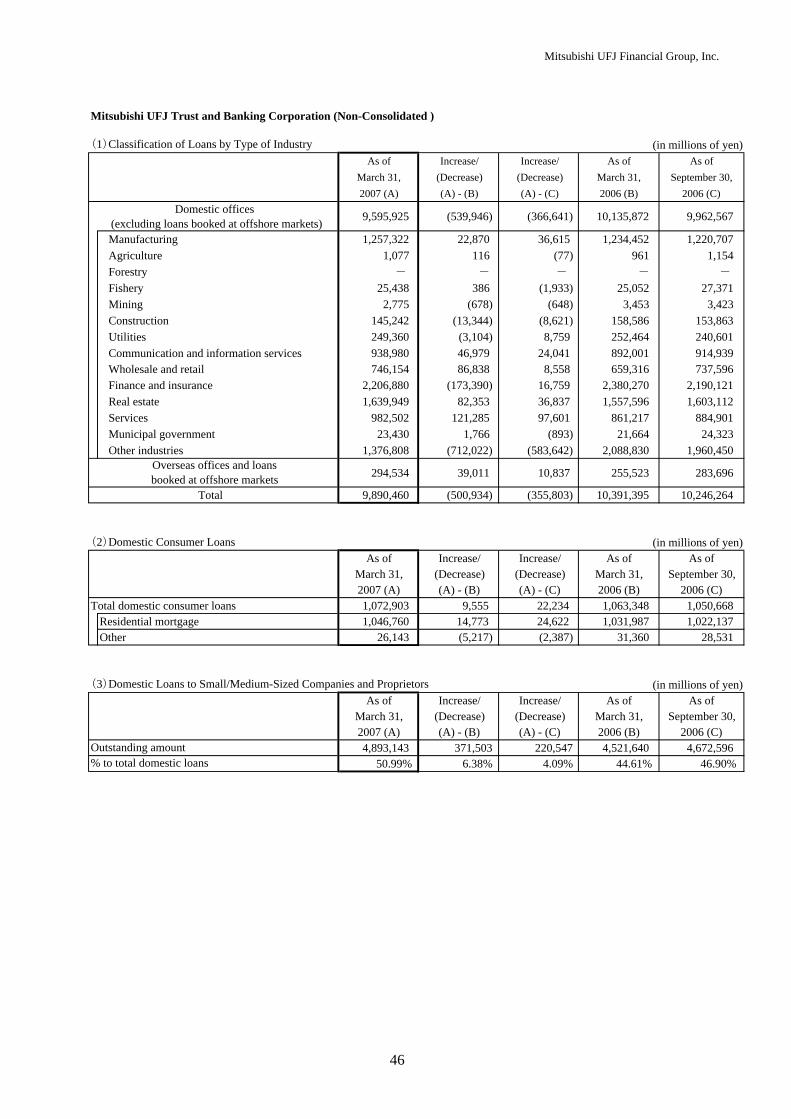
Mitsubishi UFJ Financial Group, Inc.
Mitsubishi UFJ Trust and Banking Corporation (Non-Consolidated )
(1)Classification of Loans by Type of Industry (in millions of yen)As of Increase/ Increase/ As of As of
March 31, (Decrease) (Decrease) March 31, September 30,2007 (A) (A) - (B) (A) - (C) 2006 (B) 2006 (C)
Domestic offices (excluding loans booked at offshore markets) 9,595,925 (539,946) (366,641) 10,135,872 9,962,567
Manufacturing 1,257,322 22,870 36,615 1,234,452 1,220,707 Agriculture 1,077 116 (77) 961 1,154 Forestry - - - - - Fishery 25,438 386 (1,933) 25,052 27,371 Mining 2,775 (678) (648) 3,453 3,423 Construction 145,242 (13,344) (8,621) 158,586 153,863 Utilities 249,360 (3,104) 8,759 252,464 240,601 Communication and information services 938,980 46,979 24,041 892,001 914,939 Wholesale and retail 746,154 86,838 8,558 659,316 737,596 Finance and insurance 2,206,880 (173,390) 16,759 2,380,270 2,190,121 Real estate 1,639,949 82,353 36,837 1,557,596 1,603,112 Services 982,502 121,285 97,601 861,217 884,901 Municipal government 23,430 1,766 (893) 21,664 24,323 Other industries 1,376,808 (712,022) (583,642) 2,088,830 1,960,450
294,534 39,011 10,837 255,523 283,696
Total 9,890,460 (500,934) (355,803) 10,391,395 10,246,264
(2)Domestic Consumer Loans (in millions of yen)
As of Increase/ Increase/ As of As ofMarch 31, (Decrease) (Decrease) March 31, September 30,2007 (A) (A) - (B) (A) - (C) 2006 (B) 2006 (C)
Total domestic consumer loans 1,072,903 9,555 22,234 1,063,348 1,050,668 Residential mortgage 1,046,760 14,773 24,622 1,031,987 1,022,137 Other 26,143 (5,217) (2,387) 31,360 28,531
(3)Domestic Loans to Small/Medium-Sized Companies and Proprietors (in millions of yen)As of Increase/ Increase/ As of As of
March 31, (Decrease) (Decrease) March 31, September 30,2007 (A) (A) - (B) (A) - (C) 2006 (B) 2006 (C)4,893,143 371,503 220,547 4,521,640 4,672,596
50.99% 6.38% 4.09% 44.61% 46.90%Outstanding amount% to total domestic loans
Overseas offices and loansbooked at offshore markets
46
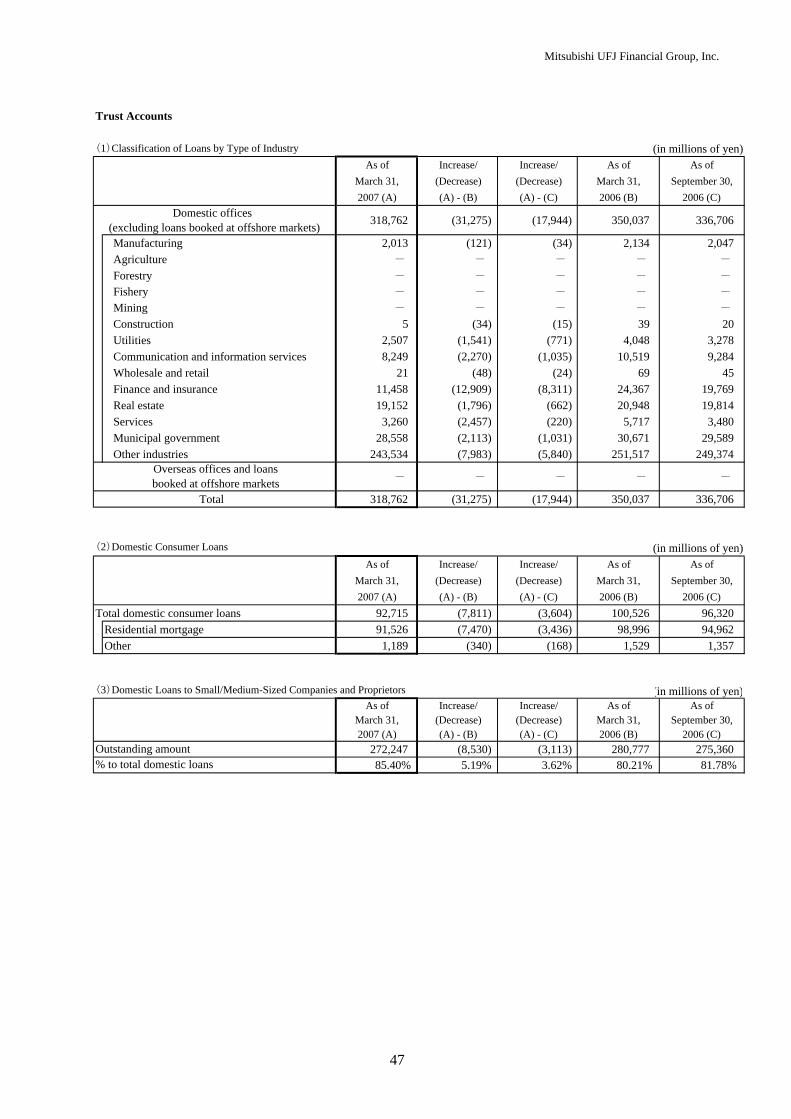
Mitsubishi UFJ Financial Group, Inc.
Trust Accounts
(1)Classification of Loans by Type of Industry (in millions of yen)As of Increase/ Increase/ As of As of
March 31, (Decrease) (Decrease) March 31, September 30,2007 (A) (A) - (B) (A) - (C) 2006 (B) 2006 (C)
Domestic offices (excluding loans booked at offshore markets) 318,762 (31,275) (17,944) 350,037 336,706
Manufacturing 2,013 (121) (34) 2,134 2,047 Agriculture - - - - - Forestry - - - - - Fishery - - - - - Mining - - - - - Construction 5 (34) (15) 39 20 Utilities 2,507 (1,541) (771) 4,048 3,278 Communication and information services 8,249 (2,270) (1,035) 10,519 9,284 Wholesale and retail 21 (48) (24) 69 45 Finance and insurance 11,458 (12,909) (8,311) 24,367 19,769 Real estate 19,152 (1,796) (662) 20,948 19,814 Services 3,260 (2,457) (220) 5,717 3,480 Municipal government 28,558 (2,113) (1,031) 30,671 29,589 Other industries 243,534 (7,983) (5,840) 251,517 249,374
- - - - -
Total 318,762 (31,275) (17,944) 350,037 336,706
(2)Domestic Consumer Loans (in millions of yen)As of Increase/ Increase/ As of As of
March 31, (Decrease) (Decrease) March 31, September 30,2007 (A) (A) - (B) (A) - (C) 2006 (B) 2006 (C)
Total domestic consumer loans 92,715 (7,811) (3,604) 100,526 96,320 Residential mortgage 91,526 (7,470) (3,436) 98,996 94,962 Other 1,189 (340) (168) 1,529 1,357
(in millions of yen)As of Increase/ Increase/ As of As of
March 31, (Decrease) (Decrease) March 31, September 30,2007 (A) (A) - (B) (A) - (C) 2006 (B) 2006 (C)
272,247 (8,530) (3,113) 280,777 275,360 85.40% 5.19% 3.62% 80.21% 81.78%
Outstanding amount% to total domestic loans
Overseas offices and loansbooked at offshore markets
(3)Domestic Loans to Small/Medium-Sized Companies and Proprietors
47

Mitsubishi UFJ Financial Group, Inc.
The Bank of Tokyo-Mitsubishi UFJ, Ltd. and Mitsubishi UFJ Trust and Banking Corporation (Combined )
(1) Loans to Asian countries (in millions of yen)As of Increase/ Increase/ As of As of
March 31, (Decrease) (Decrease) March 31, September 30,2007 (A) (A) - (B) (A) - (C) 2006 (B) 2006 (C)
Thailand 565,457 153,131 86,174 412,326 479,283 Indonesia 258,017 (21,941) (6,454) 279,958 264,472 Malaysia 174,391 13,885 (22,338) 160,505 196,729 Philippines 59,385 (4,651) (2,584) 64,037 61,969 South Korea 250,434 42,264 23,829 208,169 226,604 Singapore 400,395 133,539 29,040 266,856 371,355 Hong Kong 727,734 97,366 56,067 630,367 671,667 China 684,763 74,739 26,076 610,023 658,687 Taiwan 177,327 23,285 12,031 154,041 165,296 Other 201,259 84,372 57,298 116,886 143,960
Total 3,499,167 595,992 259,140 2,903,174 3,240,026
(2) Loans to Latin American countries (in millions of yen)As of Increase/ Increase/ As of As of
March 31, (Decrease) (Decrease) March 31, September 30,2007 (A) (A) - (B) (A) - (C) 2006 (B) 2006 (C)
Argentina 2,090 (570) (853) 2,661 2,944 Brazil 107,178 15,629 17,906 91,548 89,272 Mexico 95,899 12,194 (3,561) 83,705 99,461 Caribbean countries 738,087 79,368 23,309 658,719 714,778 Other 67,197 (3,285) (3,650) 70,482 70,848
Total 1,010,454 103,337 33,149 907,117 977,305
5. Overseas Loans
48
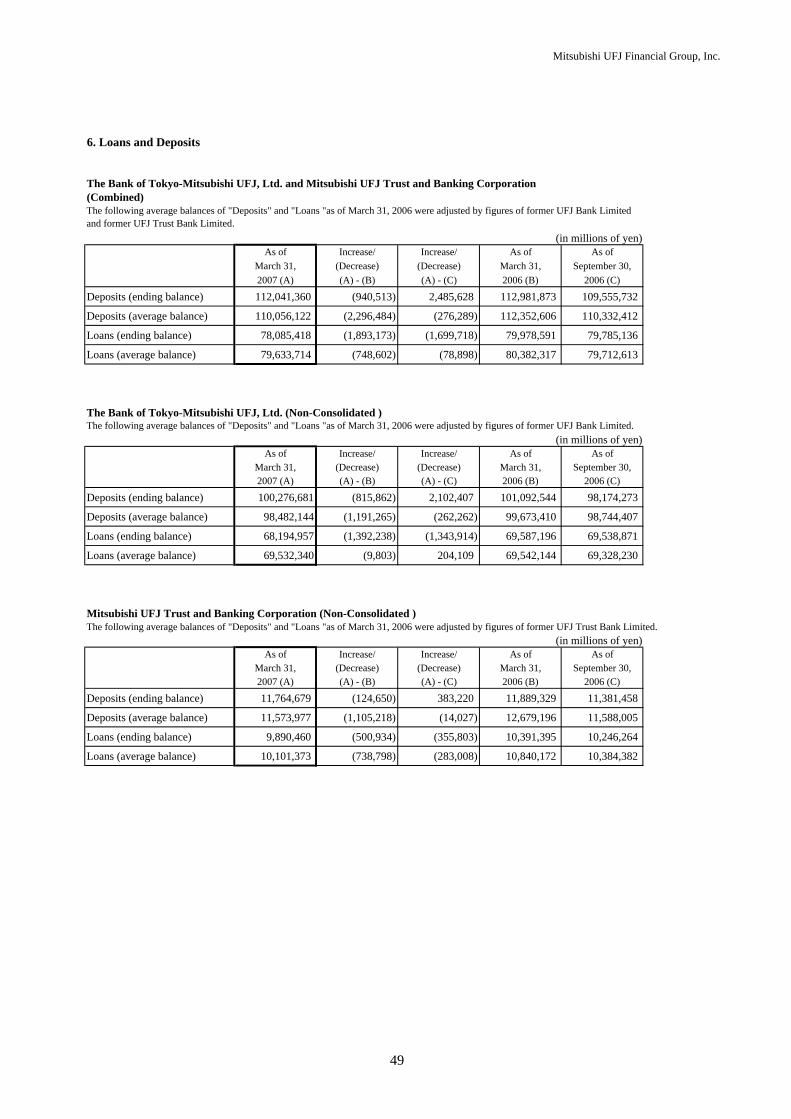
Mitsubishi UFJ Financial Group, Inc.
6. Loans and Deposits
The Bank of Tokyo-Mitsubishi UFJ, Ltd. and Mitsubishi UFJ Trust and Banking Corporation (Combined)
(in millions of yen)As of Increase/ Increase/ As of As of
March 31, (Decrease) (Decrease) March 31, September 30,2007 (A) (A) - (B) (A) - (C) 2006 (B) 2006 (C)
Deposits (ending balance) 112,041,360 (940,513) 2,485,628 112,981,873 109,555,732
Deposits (average balance) 110,056,122 (2,296,484) (276,289) 112,352,606 110,332,412
Loans (ending balance) 78,085,418 (1,893,173) (1,699,718) 79,978,591 79,785,136
Loans (average balance) 79,633,714 (748,602) (78,898) 80,382,317 79,712,613
The Bank of Tokyo-Mitsubishi UFJ, Ltd. (Non-Consolidated )
(in millions of yen)As of Increase/ Increase/ As of As of
March 31, (Decrease) (Decrease) March 31, September 30,2007 (A) (A) - (B) (A) - (C) 2006 (B) 2006 (C)
Deposits (ending balance) 100,276,681 (815,862) 2,102,407 101,092,544 98,174,273
Deposits (average balance) 98,482,144 (1,191,265) (262,262) 99,673,410 98,744,407
Loans (ending balance) 68,194,957 (1,392,238) (1,343,914) 69,587,196 69,538,871
Loans (average balance) 69,532,340 (9,803) 204,109 69,542,144 69,328,230
Mitsubishi UFJ Trust and Banking Corporation (Non-Consolidated )The following average balances of "Deposits" and "Loans "as of March 31, 2006 were adjusted by figures of former UFJ Trust Bank Limited.
(in millions of yen)As of Increase/ Increase/ As of As of
March 31, (Decrease) (Decrease) March 31, September 30,2007 (A) (A) - (B) (A) - (C) 2006 (B) 2006 (C)
Deposits (ending balance) 11,764,679 (124,650) 383,220 11,889,329 11,381,458
Deposits (average balance) 11,573,977 (1,105,218) (14,027) 12,679,196 11,588,005
Loans (ending balance) 9,890,460 (500,934) (355,803) 10,391,395 10,246,264
Loans (average balance) 10,101,373 (738,798) (283,008) 10,840,172 10,384,382
The following average balances of "Deposits" and "Loans "as of March 31, 2006 were adjusted by figures of former UFJ Bank Limitedand former UFJ Trust Bank Limited.
The following average balances of "Deposits" and "Loans "as of March 31, 2006 were adjusted by figures of former UFJ Bank Limited.
49

Mitsubishi UFJ Financial Group, Inc.
7. Domestic Deposits
The Bank of Tokyo-Mitsubishi UFJ, Ltd. and Mitsubishi UFJ Trust and Banking Corporation (Combined)
(in millions of yen)As of Increase/ Increase/ As of As of
March 31, (Decrease) (Decrease) March 31, September 30,2007 (A) (A) - (B) (A) - (C) 2006 (B) 2006 (C)
Individuals 60,858,345 640,513 951,560 60,217,831 59,906,785
Corporations and others 40,840,251 (1,879,209) 1,530,628 42,719,460 39,309,622
Domestic deposits 101,698,596 (1,238,695) 2,482,188 102,937,292 99,216,407 Note: Amounts do not include negotiable certificates of deposit and JOM accounts.
The Bank of Tokyo-Mitsubishi UFJ, Ltd. (Non-Consolidated )(in millions of yen)
As of Increase/ Increase/ As of As ofMarch 31, (Decrease) (Decrease) March 31, September 30,2007 (A) (A) - (B) (A) - (C) 2006 (B) 2006 (C)
Individuals 52,661,717 610,054 774,602 52,051,663 51,887,115Corporations and others 38,099,566 (1,629,158) 1,424,030 39,728,724 36,675,535
Domestic deposits 90,761,283 (1,019,104) 2,198,632 91,780,387 88,562,650Note: Amounts do not include negotiable certificates of deposit and JOM accounts.
Mitsubishi UFJ Trust and Banking Corporation (Non-Consolidated )(in millions of yen)
As of Increase/ Increase/ As of As ofMarch 31, (Decrease) (Decrease) March 31, September 30,2007 (A) (A) - (B) (A) - (C) 2006 (B) 2006 (C)
Individuals 8,196,628 30,459 176,958 8,166,168 8,019,670 Corporations and others 2,740,684 (250,051) 106,597 2,990,735 2,634,086
Domestic deposits 10,937,313 (219,591) 283,556 11,156,904 10,653,757 Note: Amounts do not include negotiable certificates of deposit and JOM accounts.
50

Mitsubishi UFJ Financial Group, Inc.
8. Number of Employees
The Bank of Tokyo-Mitsubishi UFJ, Ltd. and Mitsubishi UFJ Trust and Banking Corporation (Combined)
As of Increase/ Increase/ As of As ofMarch 31, (Decrease) (Decrease) March 31, September 30,2007 (A) (A) - (B) (A) - (C) 2006 (B) 2006 (C)
Number of Employees 37,611 (1,309) (1,058) 38,920 38,669
The Bank of Tokyo-Mitsubishi UFJ, Ltd. (Non-Consolidated )
As of Increase/ Increase/ As of As ofMarch 31, (Decrease) (Decrease) March 31, September 30,2007 (A) (A) - (B) (A) - (C) 2006 (B) 2006 (C)
Number of Employees 29,844 (974) (782) 30,818 30,626
Mitsubishi UFJ Trust and Banking Corporation (Non-Consolidated )
As of Increase/ Increase/ As of As ofMarch 31, (Decrease) (Decrease) March 31, September 30,2007 (A) (A) - (B) (A) - (C) 2006 (B) 2006 (C)
Number of Employees 7,767 (335) (276) 8,102 8,043
51

Mitsubishi UFJ Financial Group, Inc.
9. Number of Offices
The Bank of Tokyo-Mitsubishi UFJ, Ltd. and Mitsubishi UFJ Trust and Banking Corporation (Combined)
As of Increase/ Increase/ As of As ofMarch 31, (Decrease) (Decrease) March 31, September 30,2007 (A) (A) - (B) (A) - (C) 2006 (B) 2006 (C)
Domestic 886 6 10 880 876
Head office and Branches 742 3 2 739 740
Sub-branches and Agencies 144 3 8 141 136
Overseas 88 1 1 87 87
Branches 44 - - 44 44
Sub-branches 25 2 2 23 23
Representative offices 19 (1) (1) 20 20
Total 974 7 11 967 963
The Bank of Tokyo-Mitsubishi UFJ, Ltd. (Non-Consolidated )
As of Increase/ Increase/ As of As ofMarch 31, (Decrease) (Decrease) March 31, September 30,2007 (A) (A) - (B) (A) - (C) 2006 (B) 2006 (C)
Domestic 794 10 10 784 784
Head office and Branches 665 3 2 662 663
Sub-branches and Agencies 129 7 8 122 121
Overseas 81 1 1 80 80
Branches 39 - - 39 39
Sub-branches 25 2 2 23 23
Representative offices 17 (1) (1) 18 18
Total 875 11 11 864 864
Mitsubishi UFJ Trust and Banking Corporation (Non-Consolidated )
As of Increase/ Increase/ As of As ofMarch 31, (Decrease) (Decrease) March 31, September 30,2007 (A) (A) - (B) (A) - (C) 2006 (B) 2006 (C)
Domestic 92 (4) - 96 92
Head office and Branches 77 - - 77 77
Sub-branches and Agencies 15 (4) - 19 15
Overseas 7 - - 7 7
Branches 5 - - 5 5
Representative offices 2 - - 2 2
Total 99 (4) - 103 99
52

Mitsubishi UFJ Financial Group, Inc.
10. Status of Deferred Tax Assets
The Bank of Tokyo-Mitsubishi UFJ, Ltd. (Non-Consolidated )
The amounts presented for FY 2005 include amounts of The Bank of Tokyo-Mitsubishi UFJ, Ltd. and former UFJ Bank Limited. The amounts prior to FY 2004 include amounts of former The Bank of Tokyo-Mitsubishi, Ltd. and former UFJ Bank Limited.
(1) Tax Effects of the Items Comprising (2) Net Business profit before Credit Costs Net Deferred Tax Assets and Taxable Income (Current fiscal year)
(in billions of yen) (in billions of yen)
vs. Mar. 31, 2006
1,489.1 (253.8) Credit related costs
429.5 (115.4) Income before income taxes
219.2 (89.6) Reconciliation to taxable income
905.1 (201.4) Taxable income
89.6 (9.5)
11.0 11.0
440.1 68.2 (in billions of yen)(605.5) 82.9
1,294.1 150.9
46.5 1.4 Credit related costs
996.8 184.2
Other 250.7 (34.7)
194.9 (404.8) Taxable income
[Consolidated]166.3 (479.0)
(4) Classification Based on Prior Year Operating Results as Provided in the JICPA Audit Committee Report No.66Although we recorded taxable income for the fiscal year ended March 31, 2007, we are classified as "4" described above since we have material net operating losses carried forwards. However since we believe the net operating losses carried forwards are attributable to extraordinary factors such as changes in laws and regulations, we apply the exception to classification 4. (Five years' future taxable income is estimable.)
[Extraordinary Factors Such as Changes in Laws and Regulations]Our net operating losses carried forwards were incurred due to, among other things, the followings : (i) we accelerated the final disposal of non performing loans in response to both the “Emergency Economic Package”, which provided guidance to major banks to remove claims to debtors classified as “likely to become bankrupt” or below from their balance sheets, and the “Program for Financial Revival”,which urged major banks to reduce the ratio of non performing loans to total claims by about half; and (ii) we reduced our holdings of strategic equity investments under the “Law Concerning Restriction, etc. of Banks' Shareholdings etc”.
(5) Collectability of Deferred Tax Assets at March 31, 2007 (Assumptions)(in billions of yen)
(*1) Before deduction of credit costs
(*2) Based on the scenario that market indices stay below Assumptions for Business Plans.
(Reference) Assumptions for Business Plan
FY 2007 FY 2008
0.56% 0.97%2.12% 2.47%¥115 ¥115
Mar. 31, 2007 FY 2006Net business profits before credit costs 899.7
Deferred tax assets 38.7Allowance for loan losses 958.0Write-down on investment securities (404.2)Net operating losses carried forwards 553.7
Unrealized losses on other securities (3) Net Business Profits before Credit Costs and Taxable Income (Past five fiscal years)
Reserve for employees' retirement benefits
FY2003 FY2004 FY2005OtherValuation allowance FY2001
Net business profitbefore credit costs 1,052.8 1,188.4
FY2002
1,170.2 1,201.4 1,087.7Gains on placing trust for retirement benefits 2,229.0 1,097.9 1,089.3 892.4 (485.9)
Deferred tax liabilities
Unrealized gains on other securities Income beforeincome taxes (1,698.4) (833.3) 262.5 (47.3) 1,612.7
Reconciliation totaxable income 1,654.6 (1,873.2) 289.5 (311.4) (1,403.1)
(358.8) 209.5
Net deferred tax assets
Net deferred tax assets (43.7) (2,706.5) 552.0
Five years total (2007 to 2011)
Net business profits (based on our business plan) (*1) 7,335.6Net business profit (basis of collectability determination) (*2) 5,697.6Income before income taxes (basis of collectability determination) 4,633.6Taxable income before adjustments (basis of collectability determination)(*3) 5,164.7 (*3) Before reversals of existing deductible temporary
differences and net operating loss carried forwardsTemporary difference + net operating losses carried forwards (for whichdeferred tax assets shall be recognized) 3,490.1
Deferred tax assets at March 31, 2007 1,489.1
FY2009 FY2010 FY2011
L/T interest rate (10 year JGB) 2.46% 2.65% 2.69%S/T interest rate (Unsecured call rate) 1.00% 1.25% 1.50%
Exchange rate (Yen/USD) ¥115 ¥115 ¥115
53
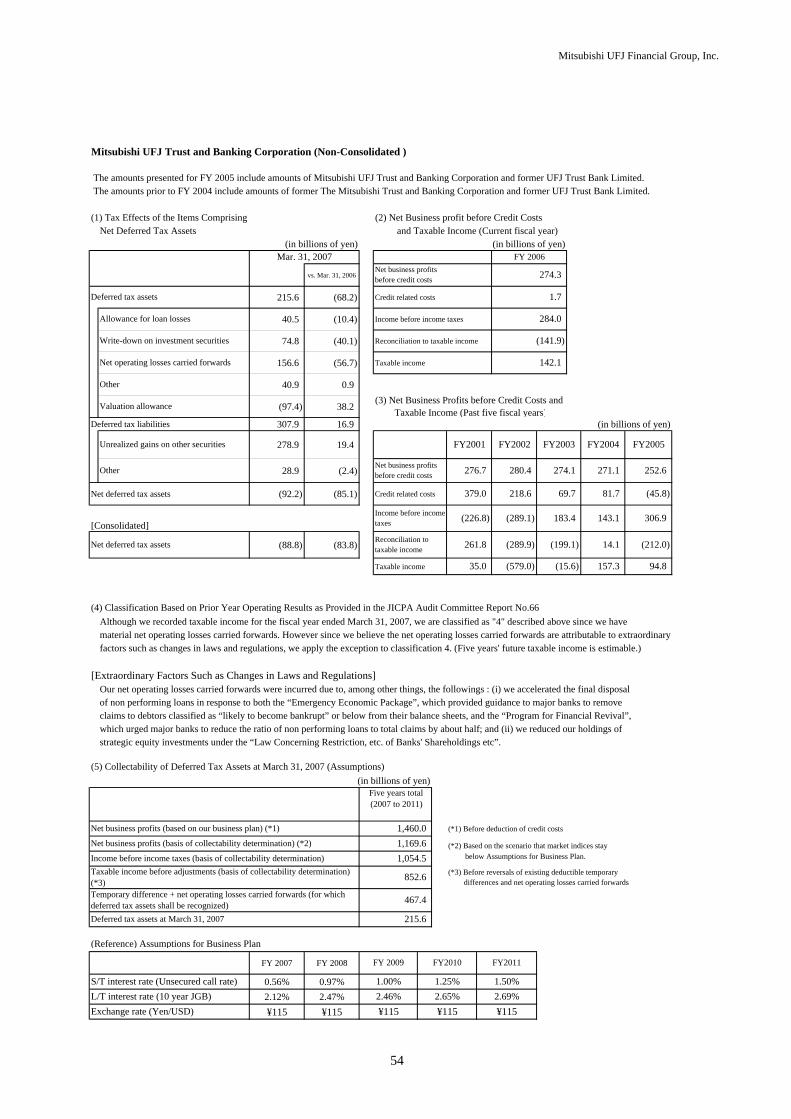
Mitsubishi UFJ Financial Group, Inc.
Mitsubishi UFJ Trust and Banking Corporation (Non-Consolidated )
The amounts presented for FY 2005 include amounts of Mitsubishi UFJ Trust and Banking Corporation and former UFJ Trust Bank Limited. The amounts prior to FY 2004 include amounts of former The Mitsubishi Trust and Banking Corporation and former UFJ Trust Bank Limited.
(1) Tax Effects of the Items Comprising (2) Net Business profit before Credit CostsNet Deferred Tax Assets and Taxable Income (Current fiscal year)
(in billions of yen) (in billions of yen)
vs. Mar. 31, 2006
215.6 (68.2) Credit related costs
40.5 (10.4) Income before income taxes
74.8 (40.1) Reconciliation to taxable income
156.6 (56.7) Taxable income
40.9 0.9
(97.4) 38.2
Deferred tax liabilities 307.9 16.9 (in billions of yen)
278.9 19.4
28.9 (2.4)
Net deferred tax assets (92.2) (85.1) Credit related costs
[Consolidated]
(88.8) (83.8)
Taxable income
(4) Classification Based on Prior Year Operating Results as Provided in the JICPA Audit Committee Report No.66Although we recorded taxable income for the fiscal year ended March 31, 2007, we are classified as "4" described above since we have material net operating losses carried forwards. However since we believe the net operating losses carried forwards are attributable to extraordinary factors such as changes in laws and regulations, we apply the exception to classification 4. (Five years' future taxable income is estimable.)
[Extraordinary Factors Such as Changes in Laws and Regulations]Our net operating losses carried forwards were incurred due to, among other things, the followings : (i) we accelerated the final disposal of non performing loans in response to both the “Emergency Economic Package”, which provided guidance to major banks to remove claims to debtors classified as “likely to become bankrupt” or below from their balance sheets, and the “Program for Financial Revival”,which urged major banks to reduce the ratio of non performing loans to total claims by about half; and (ii) we reduced our holdings of strategic equity investments under the “Law Concerning Restriction, etc. of Banks' Shareholdings etc”.
(5) Collectability of Deferred Tax Assets at March 31, 2007 (Assumptions)(in billions of yen)
(*1) Before deduction of credit costs
(*2) Based on the scenario that market indices stay below Assumptions for Business Plan.
(Reference) Assumptions for Business Plan
FY 2007 FY 2008
0.56% 0.97%2.12% 2.47%¥115 ¥115
1.50%
Exchange rate (Yen/USD) ¥115 ¥115 ¥115
FY 2009 FY2010 FY2011
L/T interest rate (10 year JGB) 2.46% 2.65% 2.69%S/T interest rate (Unsecured call rate) 1.00% 1.25%
(*3) Before reversals of existing deductible temporary differences and net operating losses carried forwards
Temporary difference + net operating losses carried forwards (for whichdeferred tax assets shall be recognized) 467.4
Deferred tax assets at March 31, 2007 215.6
Income before income taxes (basis of collectability determination) 1,054.5Taxable income before adjustments (basis of collectability determination)(*3) 852.6
Net business profits (based on our business plan) (*1) 1,460.0Net business profits (basis of collectability determination) (*2) 1,169.6
Five years total (2007 to 2011)
157.3 94.8
Net deferred tax assets
35.0 (579.0) (15.6)
306.9
Reconciliation totaxable income 261.8 (289.9) (199.1) 14.1 (212.0)
Income before incometaxes (226.8) (289.1) 183.4
274.1 271.1
143.1
252.6
379.0 218.6 69.7 81.7 (45.8)
Net business profitsbefore credit costs 276.7 280.4
FY2002 FY2003 FY2004 FY2005FY2001
(3) Net Business Profits before Credit Costs and Taxable Income (Past five fiscal years)
Write-down on investment securities (141.9)
Net operating losses carried forwards 142.1
Deferred tax assets 1.7
Allowance for loan losses 284.0
Mar. 31, 2007 FY 2006Net business profitsbefore credit costs 274.3
Other
Other
Valuation allowance
Unrealized gains on other securities
54

Mitsubishi UFJ Financial Group, Inc.
11. Employees' Retirement Benefits
Mitsubishi UFJ Financial Group, Inc. (Consolidated)
(1) Benefit obligation(in millions of yen)
Projected benefit obligation (A) 1,892,249
Fair value of plan assets (B) 2,679,773
Prepaid pension cost (C) 436,243
Reserve for employees' retirement benefits (D) 66,524
Total amount unrecognized (A)-(B)+(C)-(D) (417,805)
Unrecognized prior service cost (68,197)
Unrecognized net actuarial loss (349,608)
(2) Net periodic cost(in millions of yen)
Net periodic cost of the employees' retirement benefits 11,975
Service cost 47,924
Interest cost 46,712
Expected return on plan assets (87,589)
Amortization of unrecognized prior service cost (8,870)
Amortization of unrecognized net actuarial loss 668
Other 13,129
For the fiscal year endedMarch 31, 2007
As ofMarch 31, 2007
55

Mitsubishi UFJ Financial Group, Inc.
The Bank of Tokyo-Mitsubishi UFJ, Ltd. (Non-Consolidated )
(1) Benefit obligation(in millions of yen)
Projected benefit obligation (A) 1,214,242
Fair value of plan assets (B) 1,683,978
Prepaid pension cost (C) 226,852
Reserve for employees' retirement benefits (D) 11,348
Total amount unrecognized (A)-(B)+(C)-(D) (254,232)
Unrecognized prior service cost (42,521)
Unrecognized net actuarial loss (211,710)
(2) Net periodic cost(in millions of yen)
Net periodic cost of the employees' retirement benefits 16,531
Service cost 25,504
Interest cost 26,919
Expected return on plan assets (40,815)
Amortization of unrecognized prior service cost (6,184)
Amortization of unrecognized net actuarial loss 4,504
Other 6,603
For the fiscal year endedMarch 31, 2007
March 31, 2007
As of
Note : Discount rates for pension and retirement allowance are 2.3% and 1.9%, respectively.
56

Mitsubishi UFJ Financial Group, Inc.
(1) Benefit obligation(in millions of yen)
Projected benefit obligation (A) 391,432
Fair value of plan assets (B) 694,106
Prepaid pension cost (C) 162,394
Reserve for employees' retirement benefits (D) -
Total amount unrecognized (A)-(B)+(C)-(D) (140,279)
Unrecognized prior service cost (38,725)
Unrecognized net actuarial loss (101,553)
(2) Net periodic cost(in millions of yen)
Net periodic cost of the employees' retirement benefits (14,666)
Service cost 7,507
Interest cost 8,797
Expected return on plan assets (29,837)
Amortization of unrecognized prior service cost (2,594)
Amortization of unrecognized net actuarial loss (3,955)
Other 5,416
Mitsubishi UFJ Trust and Banking Corporation (Non-Consolidated )
For the fiscal year endedMarch 31, 2007
March 31, 2007
As of
Note : The discount rate for pension and retirement allowance is 2.2%.
57
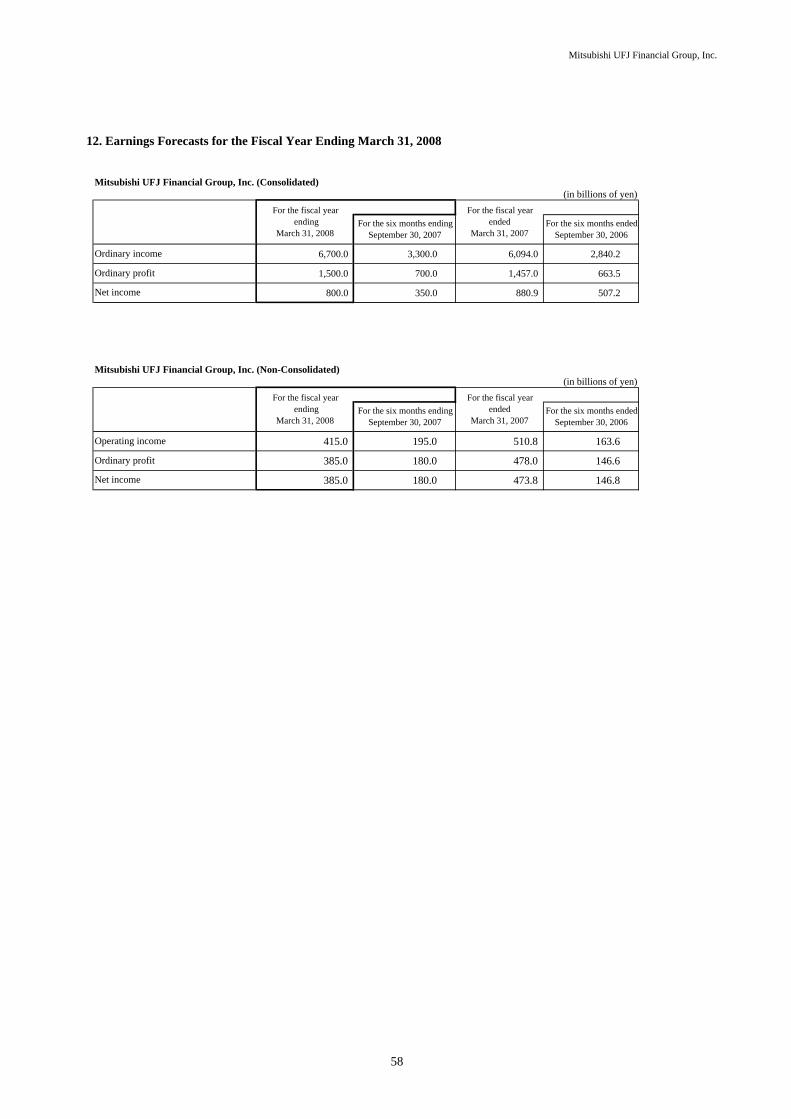
Mitsubishi UFJ Financial Group, Inc.
Mitsubishi UFJ Financial Group, Inc. (Consolidated)(in billions of yen)
6,700.0 3,300.0 6,094.0 2,840.2
1,500.0 700.0 1,457.0 663.5
800.0 350.0 880.9 507.2
Mitsubishi UFJ Financial Group, Inc. (Non-Consolidated)(in billions of yen)
415.0 195.0 510.8 163.6
385.0 180.0 478.0 146.6
385.0 180.0 473.8 146.8
Operating income
Ordinary profit
Net income
Ordinary income
Ordinary profit
Net income
For the fiscal year ending
March 31, 2008
For the fiscal yearended
March 31, 2007For the six months ending
September 30, 2007For the six months ended
September 30, 2006
12. Earnings Forecasts for the Fiscal Year Ending March 31, 2008
For the fiscal year ending
March 31, 2008
For the fiscal yearended
March 31, 2007For the six months ending
September 30, 2007For the six months ended
September 30, 2006
58

Mitsubishi UFJ Financial Group, Inc.
The Bank of Tokyo-Mitsubishi UFJ, Ltd. (Consolidated )(in billions of yen)
1,135.0 510.0 1,178.4 534.8
610.0 270.0 744.4 431.1
The Bank of Tokyo-Mitsubishi UFJ, Ltd. (Non-Consolidated )(in billions of yen)
1,025.0 455.0 899.7 426.1
885.0 395.0 834.5 358.3
530.0 235.0 669.2 422.9
Mitsubishi UFJ Trust and Banking Corporation (Consolidated )(in billions of yen)
220.0 105.0 281.5 137.6
135.0 65.0 207.9 119.3
Mitsubishi UFJ Trust and Banking Corporation (Non-Consolidated )(in billions of yen)
240.0 110.0 274.3 122.8
210.0 95.0 278.3 127.2
125.0 60.0 211.6 112.5
For the fiscal year ending
March 31, 2008
For the fiscal yearended
March 31, 2007For the six months ending
September 30, 2007For the six months ended
September 30, 2006
For the fiscal year ending
March 31, 2008
For the fiscal yearended
March 31, 2007For the six months ending
September 30, 2007For the six months ended
September 30, 2006
Ordinary profit
Net income
Ordinary profit
Net income
Net business profits before provisionfor general allowance for loan losses
For the fiscal year ending
March 31, 2008
For the fiscal yearended
March 31, 2007For the six months ending
September 30, 2007For the six months ended
September 30, 2006
For the fiscal year ending
March 31, 2008
For the fiscal yearended
March 31, 2007For the six months ending
September 30, 2007For the six months ended
September 30, 2006
Net business profits before credit costsfor trust accounts and provision forgeneral allowance for loan losses
Ordinary profit
Net income
Ordinary profit
Net income
59