consolidated summary report - mufg.jp · 73.22 72.94 298,302,898 ... in addition, in order for the...
TRANSCRIPT

Consolidated Summary Report <under Japanese GAAP>for the fiscal year ended March 31, 2016
May 16, 2016
Company name: Mitsubishi UFJ Financial Group, Inc. Stock exchange listings: Tokyo, Nagoya, New YorkCode number: 8306 URL http://www.mufg.jp/Representative: Nobuyuki Hirano, President & Group CEOFor inquiry: Kazutaka Yoneda, General Manager - Financial Planning Division / Financial Accounting Office
TEL (03) 3240-3110General meeting of shareholders: June 29, 2016 Dividend payment date: June 29, 2016Securities report issuing date: June 29, 2016 Trading accounts: EstablishedSupplemental information for financial statements: AvailableInvestor meeting presentation: Scheduled (for investors and analysts)
(Amounts of less than one million yen are rounded down.)1. Consolidated Financial Data for the Fiscal Year ended March 31, 2016(1) Results of Operations ( % represents the change from the previous fiscal year)
Fiscal year ended million yen % million yen % million yen %March 31, 2016March 31, 2015
(*)Comprehensive incomeMarch 31, 2016: million yen % ; March 31, 2015: million yen %
Fiscal year ended yen yen % % %March 31, 2016March 31, 2015
(Reference) Income from investment in affiliates (Equity method)March 31, 2016: million yen ; March 31, 2015: million yen
(2) Financial Conditions
As of million yen million yen % yenMarch 31, 2016March 31, 2015
(Reference) Shareholders’ equity as of March 31, 2016: million yen ; March 31, 2015: million yen(*) “Equity-to-asset ratio” is computed under the formula shown below
(Total net assets - Subscription rights to shares - Non-controlling interests) / Total assets
(3) Cash Flows
Fiscal year ended million yen million yen million yen million yenMarch 31, 2016March 31, 2015
2. Dividends on Common Stock
Fiscal year yen yen yen yen yen million yen % %ended March 31, 2015ended March 31, 2016
(*) Revision of forecasts for dividends on the presentation date of this Consolidated Summary Report : None
3. Earnings Target for the Fiscal Year ending March 31, 2017 (Consolidated)MUFG has set an earnings target of 850.0 billion yen of profits attributable to owners of parent for the fiscal year ending March 31, 2017.MUFG is engaged in financial service businesses such as banking business, trust banking business, securities business and credit card/loan businesses. Because there are various uncertainties caused by economic situation, market environments and other factors in these businesses, MUFG discloses a target of its profits attributable to owners of parent instead of a forecast of its performance. Please see “3. Management Policy (4) Management Target”, for further information of the target.
Ordinary Income Ordinary Profits
15,457,970 15,317,940
Basic earningsper share
Diluted earningsper share
68.51 73.22 72.94
298,302,898 286,149,768
5.0 5,638,402 8.9 1,713,001 1.1 1,033,759
17,287,533 1,092.75
5,714,419 1.3 1,539,486 (10.1) 951,402 (8.0)
Profits Attributable toOwners of Parent
Total Assets Total Net Assets Equity-to-asset ratio(*)
Total Net Assets per Common Stock
17,386,769 5.2
Ordinary Profits toOrdinary Income
26.9
5.4 1,121.07
159,637
Net Income to Net AssetsAttributable to
MUFG shareholders
Ordinary Profits toTotal Assets
6.2 0.5
620,662 3,455,231 (82.0)
7.4 0.6 30.4
102.2
68.17
(2,095,748) 6,501,689 (1,156,621) 9,990,035
Cash Flows fromOperating Activities
Cash Flows fromInvesting Activities
Cash Flows fromFinancing Activities
Cash and Cash Equivalentsat the end of the period
6,754,428 2,240,209
Dividends per Share Totaldividends
Dividendpayout ratio
(Consolidated)
Dividend onnet assets ratio(Consolidated)
1stquarter-end
2ndquarter-end
3rdquarter-end
Fiscalyear-end Total
18.00 253,695 24.6 1.8 - 9.00 - 9.00 26.3 1.6 9.00
ending March 31, 2017 (Forecast) - 9.00 -
- 9.00 -
(105,602) 18,763,856
230,415
9.00 18.00 29.2
18.00 249,329

※ Notes(1) Changes in significant subsidiaries during the period: No
(2) Changes in accounting policies, changes in accounting estimates and restatements(A) Changes in accounting policies due to revision of accounting standards: No(B) Changes in accounting policies due to reasons other than (A): No(C) Changes in accounting estimates: No(D) Restatements: No
(3) Number of common stocks outstanding at the end of the period(A) Total stocks outstanding including treasury stocks: March 31, 2016 shares
March 31, 2015 shares(B) Treasury stocks: March 31, 2016 shares
March 31, 2015 shares(C) Average outstanding stocks: Fiscal year ended March 31, 2016 shares
Fiscal year ended March 31, 2015 shares
(Reference) Summary of non-consolidated financial data1. Non-consolidated Financial Data for the Fiscal Year ended March 31, 2016(1) Results of Operations ( % represents the change from the previous fiscal year)
Fiscal year ended million yen % million yen % million yen % million yen %March 31, 2016March 31, 2015
Fiscal year ended yen yenMarch 31, 2016March 31, 2015
(2) Financial Conditions
As of million yen million yen % yenMarch 31, 2016March 31, 2015
(Reference) Shareholders’ equity as of March 31, 2016: million yen ; March 31, 2015: million yen
*Disclosure regarding the execution of the audit processThis “Consolidated Summary Report” (“Tanshin”) is outside the scope of the external auditor’s audit procedure which is requiredby “Financial Instruments and Exchange Act”. Therefore, the audit process has not been completed as of this disclosure in the “Consolidated Summary Report”.
*Notes for using forecasted information etc.1. This financial summary report contains forward-looking statements regarding estimations, forecasts, targets and plans inrelation to the results of operations, financial conditions and other overall management of the company and/or the group as a whole (the “forward-looking statements”). The forward-looking statements are made based upon, among other things, the company’s current estimations, perceptions and evaluations. In addition, in order for the company to adopt such estimations,forecasts, targets and plans regarding future events, certain assumptions have been made. Accordingly, due to various risksand uncertainties, the statements and assumptions are inherently not guarantees of future performance, may be considereddifferently from alternative perspectives and may result in material differences from the actual result. For the main factorsthat may affect the current forecasts, please see Consolidated Summary Report, Annual Securities Report, Disclosure Book,Annual Report, and other current disclosures that the company has announced.
2. The financial information included in this financial summary report is prepared and presented in accordance with accounting principles generally accepted in Japan (“Japanese GAAP”). Differences exist between Japanese GAAP and the accountingprinciples generally accepted in the United States (“U.S. GAAP”) in certain material respects. Such differences have resultedin the past, and are expected to continue to result for this period and future periods, in amounts for certain financial statement line items under U.S. GAAP to differ significantly from the amounts under Japanese GAAP. For example, differences in consolidation basis or accounting for business combinations, including but not limited to amortization and impairment of goodwill, could result in significant differences in our reported financial results between Japanese GAAP and U.S. GAAP. Readers should consult their own professional advisors for an understanding of the differences between Japanese GAAP and U.S. GAAP and how those differences might affect our reported financial results. We will publish U.S. GAAP financial resultsin a separate disclosure document when such information becomes available.
8,474,069
551,691 585,805
Basic earningsper share
Diluted earningsper share
14,168,853,820
380,255,157
13,886,503,497 14,119,202,720
14,168,853,820
151,014,803
Total Net Assets per Common Stock
12,043,230 8,482,329 70.4 614.47
39.29 39.24 39.19 39.14
8,349,679
Operating Income Operating Profits Ordinary Profits
0.4 126.5
0.1 543,069
Total Assets
Net Income
545,738 (1.4)553,400 128.9
(1.6)143.5
10,646,262 8,357,950 78.4 595.56
588,340 564,394 564,684
135.4
Total Net Assets Equity-to-asset ratio

Mitsubishi UFJ Financial Group, Inc.
(Appendix) Contents of Appendix 1. Results of Operations and Financial Condition ··················································································· 2
(1) Analysis of results of operations ································································································· 2 (2) Analysis of financial condition ··································································································· 3 (3) Basic policy regarding profit distribution and dividends for fiscal years 2015 and 2016 ································· 5
2. Information on Mitsubishi UFJ Financial Group (MUFG Group) ····························································· 6 3. Management Policy ·················································································································· 9
(1) Principal management policy ····································································································· 9 (2) Medium- and long-term management strategy ················································································· 9 (3) Key issues ·························································································································· 10 (4) Management Target ··············································································································· 12
4. Basic Views on Selection of Accounting Standards············································································· 12 5. Consolidated Financial Statements ································································································ 13
(1) Consolidated Balance Sheets ···································································································· 13 (2) Consolidated Statements of Income and Consolidated Statements of Comprehensive Income ························ 15 (3) Consolidated Statements of Changes in Net Assets ·········································································· 18 (4) Consolidated Statements of Cash Flows ······················································································· 20
Notes to the Consolidated Financial Statements ·············································································· 22 Notes on Going-Concern Assumption Significant Accounting Policies Applied in the Preparation of the Consolidated Financial Statements Changes in Method of Presentation Consolidated Balance Sheet Consolidated Statements of Income Consolidated Statements of Changes in Net Assets Consolidated Statements of Cash Flows Financial Instruments Securities Money Held in Trust Net Unrealized Gains (Losses) on Other Securities Segment Information Per Share Information Significant Subsequent Events
6. Non-consolidated Financial Statements ·························································································· 48 (1) Non-consolidated Balance Sheets ······························································································· 48 (2) Non-consolidated Statements of Income ······················································································· 50 (3) Non-consolidated Statements of Changes in Net Assets ····································································· 51
Notes on Going-Concern Assumption ·························································································· 53 7. Other ·································································································································· 53
(1) Changes of Directors, Corporate Auditors and Executive Officers ·················································· 53 Supplemental Information: “Selected Financial Information under Japanese GAAP For the fiscal year ended March 31, 2016” (*) The following is the schedule of internet conference and explanation for investors and analysts. You can confirm
those contents over the internet. Materials distributed for those will be uploaded in our homepage soon after the internet conference or the explanation is held.
Internet Conference: May 16, 2016 (Monday) Explanation for investors and analysts: May 23, 2016 (Monday)
1

Mitsubishi UFJ Financial Group, Inc.
1. Results of Operations and Financial Condition
(1) Analysis of results of operations
(Results of operations for the fiscal year ended March 31, 2016)
The outlook has become increasingly clouded, even as the global economy – especially developed countries –
remained on a gradual recovery course in FY15. Share prices around the world dropped owing to concerns
surrounding China, weak oil and other resource prices. However, US domestic demand, in particular, remained on a
path of self-sustained recovery as the employment picture steadily improved, despite weakness in the energy
industry and some other sectors. Europe’s economy continued to pick up, propelled by the weak EUR and cheap oil,
in spite of the Greek debt issue and NPLs in southern countries. In Asia, China continued to slow due to suppressed
investment, while weak exports weighed on other Asian economies. Even so, private consumption remained firm
throughout the region, bolstered by lower inflation. Against this backdrop, Japan’s economy continued on a gradual
recovery trajectory, even with some apparent weak spots. The warm winter dampened private consumption, which
remained fairly flat overall despite higher incomes. Exports to the US and Europe were strong overall, but exports to
China and other emerging economies were weak, including resource-producing countries. On the other hand, capital
expenditures continued to rise gradually due to robust corporate profits as the glut of capital stock was erased.
With regard to the financial situation, the US Fed hiked interest rates for the first time in nine-and-a-half years in
December, as employment conditions improved. In the Eurozone, on the other hand, the ECB bolstered monetary
easing, including cutting the deposit rate in December and again in March. The Bank of Japan introduced
Quantitative and Qualitative Monetary Easing with Negative Interest rates in January, and the benchmark yield
turned and stayed negative through to the end of the fiscal year. Share prices have fallen and the Japanese yen has
rallied since the start of the year: a reflection of heightened risk aversion around the globe.
Under such business environment, consolidated gross profits for the fiscal year ended March 31, 2016 decreased
85.8 billion yen from the previous fiscal year to 4,143.2 billion yen. This was mainly due to the appreciation of the
Japanese yen against the U.S. dollar since January, a decrease in net interest income from domestic loans and
deposits as well as a decrease in gains on ALM, whereas an increase in overseas profit from MUFG’s group
collaboration businesses in the U.S. and overseas subsidiaries’ businesses contributed to increase gross profit.
General and administrative (G&A) expenses for the fiscal year ended March 31, 2016 increased 1.1 billion yen from
the previous fiscal year, mainly due to higher regulatory costs in overseas businesses despite cost cutting of MUFG
and a positive impact from exchange rate. As a result, net business profits were 1,557.9 billion yen, a decrease of
87.0 billion yen from the previous fiscal year.
Total credit costs for the fiscal year ended March 31, 2016 increased 93.5 billion yen from the previous fiscal year,
mainly due to an increase in provision for specific allowance for credit losses. Net gains (losses) on equity securities
decreased 4.8 billion yen from the previous fiscal year, mainly due to an increase in losses on write-down of equity
securities.
2

Mitsubishi UFJ Financial Group, Inc.
As a result, ordinary profits for the fiscal year ended March 31, 2016 were 1,539.4 billion yen, a decrease of
173.5 billion yen from the previous fiscal year, and profits attributable to owners of parent for the fiscal year
ended March 31, 2016 was 951.4 billion yen, a decrease of 82.3 billion yen from the previous fiscal year.
(in billions of Japanese yen) For the fiscal year
ended March 31, 2016
For the fiscal year ended
March 31, 2015 Increase
(Decrease)
Gross profits before credit costs for trust accounts 4,143.2 4,229.0 (85.8)
General and administrative expenses 2,585.2 2,584.1 1.1 Net business profits before credit costs for trust accounts and provision for general allowance for credit losses
1,557.9 1,644.9 (87.0)
Credit costs (315.7) (227.8) (87.9)
Net gains (losses) on equity securities 88.3 93.1 (4.8)
Other non-recurring gains (losses) 209.0 202.8 6.2
Profits (Losses) from investments in affiliates 230.4 159.6 70.7
Ordinary profits 1,539.4 1,713.0 (173.5)
Net extraordinary gains (losses) (40.7) (98.2) 57.5
Total of income taxes-current and income taxes-deferred (460.2) (467.7) 7.5
Profits attributable to non-controlling interests (87.1) (113.2) 26.0
Profits attributable to owners of parent 951.4 1033.7 (82.3)
Total credit costs*1 (255.1) (161.6) (93.5)
*1 Included gains on loans written-offs
(Earnings Target for the fiscal year ending March 31, 2017)
MUFG has set an earnings target of 850.0 billion yen of profits attributable to owners of parent for the fiscal year
ending March 31, 2017.
MUFG is engaged in financial service businesses such as banking business, trust banking business, securities
business and credit card/loan businesses.
Because there are various uncertainties caused by economic situation, market environments and other factors in
these businesses, MUFG discloses a target of its profits attributable to owners of parent instead of a forecast of its
performance. Please see “3. Management Policy (4) Management Target”, for further information of the target.
(2) Analysis of financial condition Total assets as of March 31, 2016 increased 12,153.1 billion yen from March 31, 2015 to 298,302.8 billion yen, and
total net assets as of March 31, 2016 increased 99.2 billion yen from March 31, 2015 to 17,386.7 billion yen. The
increase in total net assets was mainly due to increases in retained earnings.
With regard to major items of assets, securities as of March 31, 2016 decreased 3,544.3 billion yen from March
31, 2015 to 69,993.8 billion yen and loans and bills discounted as of March 31, 2016 increased 4,387.9 billion yen
3

Mitsubishi UFJ Financial Group, Inc.
from March 31, 2015 to 113,756.3 billion yen. With regard to major items of liabilities, deposits as of March 31,
2016 increased 7,607.6 billion yen from March 31, 2015 to 160,965.0 billion yen.
With regard to MUFG’s consolidated risk-adjusted capital ratio based on the Basel Ⅲ Standards as of March 31,
2016, Common Equity Tier 1 capital ratio was 11.63%, Tier 1 capital ratio was 13.24% and Total capital ratio was
16.01%.
4

Mitsubishi UFJ Financial Group, Inc.
(3) Basic policy regarding profit distribution and dividends for fiscal years 2015 and 2016 MUFG considers the return of earnings to shareholders to be one of the most important management priorities and
makes it a basic policy to aim for a stable and continuous increase in dividends per share through growth in profits.
With respect to the year-end dividend for common stock for fiscal year 2015, MUFG plans to pay ¥9 per share. As a
result, the annual dividend for fiscal year 2015, including the interim dividend of ¥9 per share, is expected to be ¥18
per share, which is the same amount as the annual dividend of ¥18 paid for the previous fiscal year.
The annual dividend forecast for common stock for fiscal year 2016 is ¥18 per share, which is the same amount as
the annual dividend to be paid for fiscal year 2015.
5

Mitsubishi UFJ Financial Group, Inc.
2.Information on Mitsubishi UFJ Financial Group (MUFG Group) MUFG Group comprises the holding company, 224 consolidated subsidiaries, and 65 equity-method affiliates. MUFG’s goal is to be the world’s most trusted financial group, and it is engaged primarily in the banking, trust banking and securities businesses, while also conducting business in credit cards and consumer finance, leasing, asset management and other areas. The Group conducts consolidated reporting of its main entities on a segmental basis and the relationships between MUFG and its major related companies are as shown in the chart below.
(As of March 31, 2016)
○:Consolidated subsidiary ◇:Equity-method accounted affiliate
○The Bank of Tokyo-Mitsubishi UFJ, Ltd.○MU Frontier Servicer Co., Ltd.○Mitsubishi UFJ Factors Limited○Mitsubishi UFJ Research and Consulting Co., Ltd.○Mitsubishi UFJ Capital Co., Ltd.◇JACCS CO., LTD.◇Jibun Bank Corporation◇JALCARD, INC.◇BOT Lease Co., Ltd.◇The Chukyo Bank, Ltd.○MUFG Americas Holdings Corporation○BTMU Capital Corporation *2○BTMU Leasing & Finance, Inc.○Bank of Ayudhya Public Company Limited○PT U Finance Indonesia○PT. BTMU-BRI Finance◇Vietnam Joint Stock Commercial Bank for Industry and Trade◇Dah Sing Financial Holdings Limited
○Mitsubishi UFJ Trust and Banking Corporation○The Master Trust Bank of Japan, Ltd.○MU Investments Co., Ltd.○Mitsubishi UFJ Kokusai Asset Management Co., Ltd.○Mitsubishi UFJ Real Estate Services Co., Ltd.○Mitsubishi UFJ Trust & Banking Corporation (U.S.A.)○Mitsubishi UFJ Baillie Gifford Asset Management Limited○Mitsubishi UFJ Global Custody S.A. *3○Mitsubishi UFJ Asset Management (UK) Limited○Mitsubishi UFJ Fund Services Holdings Limited○Mitsubishi UFJ Trust International Limited◇Aberdeen Asset Management PLC◇AMP Capital Holdings Limited
○Mitsubishi UFJ Securities Holdings Co., Ltd.○Mitsubishi UFJ Morgan Stanley Securities Co., Ltd.○Mitsubishi UFJ Morgan Stanley PB Securities Co., Ltd.○kabu.com Securities Co., Ltd.◇Morgan Stanley MUFG Securities Co., Ltd.◇Marunouchi Capital Co., Ltd.○Mitsubishi UFJ Securities International plc *4○Mitsubishi UFJ Securities (USA), Inc. *5○Mitsubishi UFJ Wealth Management Bank (Switzerland), Ltd.○Mitsubishi UFJ Securities (HK) Holdings, Limited○Mitsubishi UFJ Securities (Singapore), Limited *6
○Mitsubishi UFJ NICOS Co., Ltd.
○ACOM CO., LTD.
◇Mitsubishi UFJ Lease & Finance Company Limited◇Mitsubishi Research Institute DCS Co., Ltd.◇Morgan Stanley
Mits
ubish
i UFJ
Fin
anci
al G
roup
Mitsubishi UFJ Financial Group, Inc.Th
e Ban
k of
Tok
yo-M
itsub
ishi U
FJ, L
td. *
1M
itsub
ishi U
FJ T
rust
and
Bank
ing
Corp
orat
ion
Mits
ubish
i UFJ
Sec
uriti
es H
oldi
ngs
Co.,
Ltd.
CF su
b ‐sid
iarie
s*
7
Oth
erbu
sines
ses
6

Mitsubishi UFJ Financial Group, Inc. *1. As of April 1, 2016, Security Bank Corporation became an equity-method affiliate of The Bank of Tokyo-Mitsubishi
UFJ, Ltd. following a share acquisition by The Bank of Tokyo-Mitsubishi UFJ, Ltd. *2. The ownership of BTMU Capital Corporation is planned to be transferred to MUFG Americas Holdings Corporation
on July 1, 2016.
*3. As of May 1, 2016, Mitsubishi UFJ Global Custody S.A. was renamed Mitsubishi UFJ Investor Services & Banking (Luxembourg) S.A.
*4. Mitsubishi UFJ Securities International plc plans to be renamed MUFG Securities EMEA plc on July 1, 2016. *5. Mitsubishi UFJ Securities (USA), Inc. is planned to be renamed MUFG Securities Americas Inc. and its ownership
transferred to MUFG Americas Holdings Corporation on July 1, 2016. *6. Mitsubishi UFJ Securities (Singapore), Limited plans to be renamed MUFG Securities Asia (Singapore) Limited on
July 1, 2016. *7. Consumer finance subsidiaries.
7

Mitsubishi UFJ Financial Group, Inc.
(As of May 16, 2016)
*
Private Banking Division Business Owner PB Planning Office *
Retail Business Planning Division Retail Affiliates Office
Retail Academy *
Marketing Office *
Retail Branch Management Division Retail Academy *
Retail & Corporate Business Promotion Office *
Retail Branch Service Innovation Office
Retail Business Development Division Securities Business Promotion Office
Bancassurance Strategy Office
Retail Trust Business Office
Retail Business Promotion Planning Division Marketing Office *Co
rpor
ate B
anki
ngBu
sines
s Gro
up Trust Business Planning Division
Retail Trust Business Planning Division
Business Owner PB Planning Office *
Retail & Corporate Business Collaboration Office *
Corporate Business Career Strategy OfficeCorporate Business Planning DivisionFi
nanc
ialSo
lutio
ns U
nit *
Financial Solutions Planning Division *
Fina
ncial
Solu
tions
Uni
t *
Financial Solutions Planning Division *
Trus
t Ass
etsBu
sines
s Gro
up
Asset Management and Administration Planning Division
Glob
alBu
sines
s Gro
up
Economic Research Office
Global Markets S&T Project Management Office
Corporate Administration Division Executive Secretariat
Human Resources Division Diversity & Inclusion Office
Global Markets Planning Division
Global Human Resources Office
Human Rights Promotion Office
Corporate Planning Division Government & Regulatory Affairs Office
Strategic Alliance Office
Corporate Risk Management Division Market Risk Management Office
EPS FBO Implementation Office *
Innovation Lab *
Financial Planning Division Office of the CFO
Management Information Office *
Financial Accounting Office
Tax Planning Office
IFRS Project Management Office
Investor Relations Office
Corporate Communication Division Media Relations Office
Internal Audit Division Americas Audit Office
Liquidity Risk Management Office
Management Information Office *
Research & Development Office
Credit Policy & Planning Division Credit Risk Management Office
Global Compliance Division Conflict-of-Interest Management Office
Customer Protection OfficeGlobal Financial Crimes Intelligence DivisionAnti-Money Laundering Office
Legal Division Global Markets Compliance Office
Operations & Systems Planning Division Cyber Security Office
Digital Innovation Division Innovation Lab *
Offices marked with an asterix are shared by multipledivisions or are jointly administered within a division
EPS FBO Implementation Office *
Global Business Development OfficeGlobal Planning Division
Group Strategy Division for East Asia
Group Strategy Division for Asia & Oceania
Group Strategy Division for EMEA
Risk Monitoring Office for Asia *
Risk Monitoring Office for Asia *
Risk Monitoring Office for EMEA
Americas Enterprise Risk Management Office
Americas Holdings Division EPS FBO Implementation Office *
Global Corporate Banking Division
Glob
al M
arke
tsBu
sines
s Gro
up
Gene
ral M
eetin
g of
Shar
ehol
ders
Boar
d of
Dire
ctors
Exec
utiv
e Com
mitt
ee
Glob
al Ad
viso
ry B
oard
Audi
tCo
mm
ittee
Com
pens
ation
Com
mitt
ee
Nom
inati
ng an
d Go
vern
ance
Com
mitt
ee
Risk
Com
mitt
ee
Supp
ortin
g Co
mm
ittee
s
U.S.
Risk
Com
mitt
ee
Retai
l Ban
king
Busin
ess G
roup
The Group has a combined group organization through which it seeks as a unified group to meet the financial needs of its customers by providing financial products and services that transcend traditional business boundaries. A system of business groups has been introduced under which the group formulates a unified strategy and pursues its business based on coordination between group companies.
** The Nominating and Governance Committee is a nomination committee under the Companies Act. ***On July 1, 2016, an Americas Enterprise Risk Management Division is planned to be established within the Global
Business Group, and the Americas Enterprise Risk Management Office in the Americas Holdings Division will be abolished.
8

Mitsubishi UFJ Financial Group, Inc.
3. Management Policy (1) Principal management policy
MUFG Group has formulated the Group Corporate Vision to clarify the nature of the Group’s overall
mission and the type of group it should aspire to be, and as a shared credo to unify the hearts and minds of Group employees, while meeting the expectations of customers and society. Throughout the Group, the people of MUFG are working under three shared values—Integrity and Responsibility, Professionalism and Teamwork, and Challenging Ourselves to Grow—while aiming to be the world’s most trusted financial group.
Corporate Vision (2) Medium- and long-term management strategy
The operating environment for financial institutions is transforming substantially amidst such trends as changing patterns of consumption stemming from an aging Japanese population and its declining birthrate and the advance of information and communications technology. It is crucial to the continued progress of MUFG for us to maintain an accurate understanding of such changes, and evolve and reform our business model as a preemptive response to these changes. Based on this recognition, the MUFG Group turned its eye toward the expected operating environment changes over the next decade, and launched its medium-term business plan, which outlines the strategies that will be implemented over the first three years of this period (Fiscal 2015–Fiscal 2017).
The basic policy of the medium-term business plan was defined as “Evolution and reformation to achieve sustainable growth for MUFG,” and we formulated the Group business strategies and the administrative practices and business foundation strategies of the plan based on three strategic focuses: “Customer perspective,” “Group-driven approach,” and “Productivity improvements.” “Customer perspective” calls on us to develop businesses based on changing customer needs. “Group-driven approach” inspires us to bolster inter-Group company unity and consider how to optimize our business on a Group-wide basis. “Productivity improvements” encapsulates our commitment to boosting
OUR MISSION To be a foundation of strength, committed to meeting the needs of
our customers, serving society, and fostering shared and sustainable growth for a better world.
OUR VISION —Be the world’s most trusted financial group—
1. Work together to exceed the expectations of our customers 2. Provide reliable and constant support to our customers 3. Expand and strengthen our global presence
OUR VALUES 1. Integrity and Responsibility 2. Professionalism and Teamwork 3. Challenge Ourselves to Grow
9
Mitsubishi UFJ Financial Group, Inc.
competitiveness by pursuing higher levels of rationality and efficiency. By swiftly responding to environmental changes and continuing to accelerate and broaden the business
and administration strategies outlined in MUFG’s medium-term business plan, the Group will pursue improved corporate value and work to live up to the expectations of its customers, shareholders, employees, and other stakeholders.
(3) Key issues
In fiscal 2015, the outlook for the world economy grew more uncertain as markets were affected by the United States’ exit strategy from quantitative easing and the large impact of China’s economic slowdown on developing economies. Financial markets experienced large fluctuations, partly due to the Bank of Japan’s adoption of negative interest rates early in 2016. In this environment, MUFG implemented the first year of its medium-term business plan in a concerted, Group-wide effort to advance and revolutionize its business model ahead of structural changes in the future.
Advancing Group business strategies
As part of our Group business strategies, we will maintain our focus on the Japanese market while simultaneously working to incorporate the growth of the global market and evolving and reforming our business model.
For individual customers, the Group will band together to provide asset management, asset administration, and inheritance services and encourage the flow of assets from savings to investment while helping to stimulate consumption by strengthening payment and consumer finance businesses.
To address the needs of SME customers, MUFG will work to provide smooth support for customers’ funding needs while also implementing initiatives in new business fields. Initiatives in new fields will include enhancing M&A advisory service functions to respond to the rising number of business transfers and bolstering the Group’s ability to provide asset management solutions. At the same time, the Group will also accelerate efforts to contribute to the growth of customers through means such as offering business matching services.
Meanwhile, MUFG will respond to the ever more advanced, diverse, and global needs of large companies through concerted efforts conducted on a Group-wide and global basis, and will establish a unique global Corporate & Investment Banking (CIB)*1 model to aid in this endeavor. As part of this process, the Group will consolidate the its sector-specific expertise while deepening strategic collaboration with Morgan Stanley.
In sales and trading operations*2, we intend to advance integrated operations to boost our competitiveness. Specifically, MUFG will push forward with efforts to strengthen its ability to provide products and services that address the diverse needs of various customers, such as corporations and institutional investors, on a global basis.
As for asset management and investor service operations, MUFG is committed to establishing a strong position as a global player in the fields of alternative investment investor services and asset management operations in the United States, Asia, and other regions. Both organic and non-organic strategies will be employed in pursuing this goal.
10

Mitsubishi UFJ Financial Group, Inc.
In transaction banking*3 operations, we aim to build an unrivaled position in the domestic market. At the same time, we will redouble efforts to address cross-border business flows, and expand trade finance operations. In addition, we will bolster product competitiveness and step up inter-regional collaboration to increase deposit balances.
Outside Japan, MUFG is working to establish and strengthen unique, comprehensive commercial banking platforms. These efforts are centered around Bank of Ayudhya Public Company Limited and MUFG Union Bank, N.A and also include developing our new capital and business alliance with Security Bank Corporation. The Group’s overseas operations have previously focused primarily on transactions with large companies, but in strengthening platforms we are branching out to accommodate local individual and SME customers.
*1 A business model that provides customers with end-to-end, comprehensive financial services including both Corporate Banking (e.g. deposits and loans) and Investment Banking (e.g. M&A advisory) services, in order to help customers increase their corporate value
*2 General term for sales operations involving the provision of financial products and solutions including foreign exchange and derivatives, and trading operations to buy and sell marketable products through inter-bank trading or trading on exchanges
*3 General term for deposit business, domestic exchange business, foreign exchange business, and related businesses such as cash management and trade finance
Enhancement of management fundamentals and controls
Strategies for enhancing management fundamentals and controls include the following measures to improve upon the financial base and administration practices that will underpin the evolution and reformation of business models.
BTMU, MUTB, and MUSHD will transition to Company with Audit and Supervisory Committee. Through building effective frameworks for business supervision by the Board of Directors, MUFG aims to further strengthen corporate governance systems, and governance on both a Group and global basis. At the same time, MUFG is developing more evolved and advanced comprehensive risk management practices that address new regulations and progress in businesses while placing emphasis on managing risks in an integrated and preventative manner.
We aim to strengthen and streamline the Group business platform, and this will be done in part through shared usage of systems, back-office functions, and facilities on a Group-wide basis.
In managing the Group’s finances and capital, we will work to entrench frameworks for increasing returns on risks taken, which will be done while maintaining a strong capital base as the first priority. We will also diversify funding methods in consideration of global financial regulations.
Communication with external stakeholders and Group employees will be conducted strategically and in a manner that is integrated on a Group-wide and global basis to maximize the benefits of this communication. We recognize internal communication as a means of fostering a corporate culture and creating sense of cohesion within the Group. Meanwhile, communication with outside parties contributes to improving customer satisfaction and brand value and helps accomplish corporate social responsibility activities.
11
Mitsubishi UFJ Financial Group, Inc.
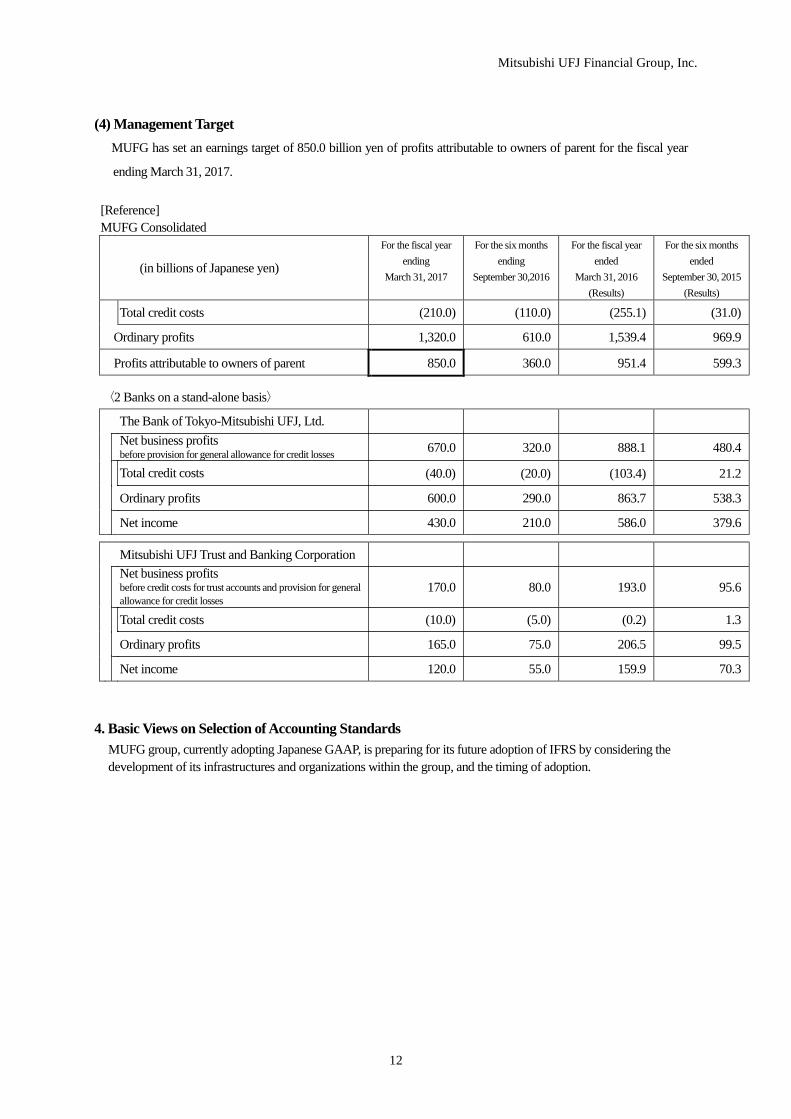
(4) Management Target MUFG has set an earnings target of 850.0 billion yen of profits attributable to owners of parent for the fiscal year
ending March 31, 2017. [Reference] MUFG Consolidated
(in billions of Japanese yen)
For the fiscal year ending
March 31, 2017
For the six months ending
September 30,2016
For the fiscal year ended
March 31, 2016 (Results)
For the six months ended
September 30, 2015 (Results)
Total credit costs (210.0) (110.0) (255.1) (31.0)
Ordinary profits 1,320.0 610.0 1,539.4 969.9
Profits attributable to owners of parent 850.0 360.0 951.4 599.3 〈2 Banks on a stand-alone basis〉
The Bank of Tokyo-Mitsubishi UFJ, Ltd.
Net business profits before provision for general allowance for credit losses 670.0 320.0 888.1 480.4
Total credit costs (40.0) (20.0) (103.4) 21.2
Ordinary profits 600.0 290.0 863.7 538.3
Net income 430.0 210.0 586.0 379.6 Mitsubishi UFJ Trust and Banking Corporation
Net business profits before credit costs for trust accounts and provision for general allowance for credit losses
170.0 80.0 193.0 95.6
Total credit costs (10.0) (5.0) (0.2) 1.3
Ordinary profits 165.0 75.0 206.5 99.5
Net income 120.0 55.0 159.9 70.3
4. Basic Views on Selection of Accounting Standards
MUFG group, currently adopting Japanese GAAP, is preparing for its future adoption of IFRS by considering the development of its infrastructures and organizations within the group, and the timing of adoption.
12

Mitsubishi UFJ Financial Group, Inc.
13
5. Consolidated Financial Statements
(1) Consolidated Balance SheetsAs of As of
(in millions of yen) March 31, 2015 March 31, 2016Assets:
Cash and due from banks 40,488,318 49,158,293 Call loans and bills bought 604,625 660,015 Receivables under resale agreements 7,342,335 7,466,633 Receivables under securities borrowing transactions 4,633,544 6,041,983 Monetary claims bought 4,570,712 4,733,393 Trading assets 20,810,617 20,460,863 Money held in trust 700,218 679,678 Securities 73,538,191 69,993,869 Loans and bills discounted 109,368,340 113,756,325 Foreign exchanges 2,187,311 1,792,888 Other assets 10,119,936 12,255,764 Tangible fixed assets 1,352,727 1,362,044
Buildings 333,430 349,761 Land 744,416 730,130 Lease assets 11,181 10,856 Construction in progress 35,774 38,494 Other tangible fixed assets 227,924 232,801
Intangible fixed assets 1,297,277 1,254,727 Software 552,345 570,884 Goodwill 309,119 278,628 Lease assets 730 648 Other intangible fixed assets 435,082 404,566
Net defined benefit assets 504,761 377,955 Deferred tax assets 114,919 125,739 Customers’ liabilities for acceptances and guarantees 9,511,714 9,240,310 Allowance for credit losses (995,784) (1,057,585)Total assets 286,149,768 298,302,898

Mitsubishi UFJ Financial Group, Inc.
14
As of As of(in millions of yen) March 31, 2015 March 31, 2016
Liabilities:Deposits 153,357,410 160,965,056 Negotiable certificates of deposit 16,073,850 11,591,578 Call money and bills sold 3,600,104 1,360,238 Payables under repurchase agreements 21,899,506 23,515,240 Payables under securities lending transactions 8,205,350 4,710,407 Commercial papers 2,179,634 2,292,282 Trading liabilities 15,521,917 17,251,302 Borrowed money 13,866,196 12,482,277 Foreign exchanges 1,496,476 2,054,937 Short-term bonds payable 789,512 752,492 Bonds payable 8,141,713 9,190,542 Due to trust accounts 3,183,295 13,296,033 Other liabilities 9,530,371 10,834,564 Reserve for bonuses 90,360 90,219 Reserve for bonuses to directors 454 396 Net defined benefit liabilities 62,121 62,791 Reserve for retirement benefits to directors 1,086 1,113 Reserve for loyalty award credits 15,375 15,971 Reserve for contingent losses 204,790 210,087 Reserves under special laws 3,771 4,232 Deferred tax liabilities 988,550 866,815 Deferred tax liabilities for land revaluation 138,669 127,237 Acceptances and guarantees 9,511,714 9,240,310 Total liabilities 268,862,234 280,916,129
Net assets:Capital stock 2,141,513 2,141,513 Capital surplus 1,428,403 1,425,637 Retained earnings 7,860,410 8,587,578 Treasury stock (101,661) (298,922)Total shareholders’ equity 11,328,666 11,855,806 Net unrealized gains (losses) on other securities 2,835,091 2,486,627 Net deferred gains (losses) on hedging instruments 83,194 337,297 Land revaluation excess 172,350 176,364 Foreign currency translation adjustments 951,547 791,401
(52,909) (189,526)Total accumulated other comprehensive income 3,989,274 3,602,163 Subscription rights to shares 8,271 8,260 Non-controlling interests 1,961,322 1,920,538 Total net assets 17,287,533 17,386,769
Total liabilities and net assets 286,149,768 298,302,898
Remeasurements of defined benefit plans

Mitsubishi UFJ Financial Group, Inc.
15
(2) Consolidated Statements of Income and Consolidated Statements of Comprehensive Income Consolidated Statements of Income
For the fiscal year For the fiscal yearended ended
(in millions of yen) March 31, 2015 March 31, 2016Ordinary income 5,638,402 5,714,419
Interest income 2,806,238 2,769,248 Interest on loans and bills discounted 1,835,445 1,812,133 Interest and dividends on securities 627,946 628,882 Interest on call loans and bills bought 11,813 9,887 Interest on receivables under resale agreements 53,712 41,818 Interest on receivables under securities borrowing transactions 9,237 6,520 Interest on deposits 63,470 79,087 Other interest income 204,612 190,919
Trust fees 111,916 117,046 Fees and commissions 1,508,698 1,536,719 Trading income 352,950 306,354 Other business income 407,668 469,265 Other ordinary income 450,930 515,784
Gains on loans written-off 64,735 60,645 Others 386,194 455,138
Ordinary expenses 3,925,400 4,174,932 Interest expenses 624,743 655,735
Interest on deposits 296,887 292,909 Interest on negotiable certificates of deposit 44,009 48,093 Interest on call money and bills sold 7,226 8,204 Interest on payables under repurchase agreements 39,075 48,263 Interest on payables under securities lending transactions 8,424 7,449 Interest on commercial papers 3,445 6,347 Interest on borrowed money 47,826 46,856 Interest on short-term bonds payable 661 749 Interest on bonds payable 132,499 142,728 Other interest expenses 44,686 54,133
Fees and commissions 200,094 216,165 Other business expenses 133,275 183,583 General and administrative expenses 2,619,867 2,602,450 Other ordinary expenses 347,420 516,997
Provision for allowance for credit losses 62,012 132,691 Others 285,407 384,305
Ordinary profits 1,713,001 1,539,486

Mitsubishi UFJ Financial Group, Inc.
16
For the fiscal year For the fiscal yearended ended
(in millions of yen) March 31, 2015 March 31, 2016Extraordinary gains 14,655 21,316
Gains on disposition of fixed assets 5,011 21,316 Gains on change in equity 9,643 -
Extraordinary losses 112,899 62,033 Losses on disposition of fixed assets 9,938 12,144 Losses on impairment of fixed assets 11,487 13,415
918 460 Losses on change in equity 33,291 36,013 Settlement package 37,097 -
20,167 - Income before income taxes and others 1,614,757 1,498,769 Income taxes-current 421,941 424,814 Income taxes-deferred 45,845 35,389 Total taxes 467,786 460,204 Profits 1,146,970 1,038,565 Profits attributable to non-controlling interests 113,211 87,162 Profits attributable to owners of parent 1,033,759 951,402
Losses on sales of equity securities of subsidiaries
Provision for reserve for contingent liabilities from financial instruments transactions

Mitsubishi UFJ Financial Group, Inc.
17
Consolidated Statements of Comprehensive IncomeFor the fiscal year For the fiscal year
ended ended(in millions of yen) March 31, 2015 March 31, 2016
Profits 1,146,970 1,038,565 Other comprehensive income
Net unrealized gains (losses) on other securities 1,595,505 (346,220)Net deferred gains (losses) on hedging instruments 77,367 252,671 Land revaluation excess 14,149 7,055 Foreign currency translation adjustments 442,466 (214,273)Remeasurements of defined benefit plans 27,880 (141,896)
150,891 24,759 Total other comprehensive income 2,308,260 (417,903)
Comprehensive income 3,455,231 620,662 (Comprehensive income attributable to)
Comprehensive income attributable to owners of the parent 3,313,220 556,163 Comprehensive income attributable to non-controlling interests 142,011 64,498
Share of other comprehensive income of associates accounted for using equity method

Mitsubishi UFJ Financial Group, Inc.
18
(3) Consolidated Statements of Changes in Net Assets
For the fiscal year ended March 31, 2015
1,033,759
(399,526) 769,374 (99,962)
17,287,533 172,350 951,547 (52,909) 3,989,274 8,271
2,207,004
14,574 544,537 29,180 2,279,885 (461) (72,419) 2,477,916
150
-
(424)
(10,617)
14,574 544,537 29,180 2,279,885
(490,045)
(263,959)
1,033,759
2,048
407,010 (82,090) 1,709,388 8,732 2,033,741 14,809,617
2,048,101 15,112,895
(219) (152) (371) (14,360) (303,277)
Balance at the beginning of the period 157,776 407,229 (81,937) 1,709,760 8,732
(in millions of yen)
Subscription rightsto shares
Non-controllinginterests Total net assetsLand revaluation
excess
Foreign currencytranslation
adjustments
Remeasurements ofdefined benefit plans
Total accumulatedother comprehensive
income
Accumulated other comprehensive income
1,616,693 74,898
1,033,759
270,911 1,616,693 74,898
(390,000)
(10,617) (10,617)
(424) (424)
390,000
68 82 150
1,218,397 accounting policies
8,295
1,023 2,048
Changes in subsidiaries’ equity
Reversal of land revaluation excess
Retirement of treasury stock
2,140,488 1,827,929 7,091,035 (1,699) 11,057,754
Balance at the beginning of the period
subscription rights to shares Dividends from retained earnings
parent Repurchase of treasury stock
Disposal of treasury stock
Profits attributable to owners of
Cumulative effects of changes in
Changes during the period
Issuance of new shares-exercise of
Reversal of land revaluation excess
Capital stock
2,140,488
1,024
Net unrealized gains(losses) on other
securities
2,835,091 1,428,403 7,860,410 83,194 11,328,666
1,218,397
(346,454) 57,909 (288,545)
Net deferred gains(losses) on hedging
instruments
11,346,299 (1,699) 8,295
Retained earnings
-
Capital surplus
2,174,384 7,033,125
Treasury stock Total shareholders’equity
(490,045) (490,045)
(in millions of yen)
Shareholders’ equity Accumulated other comprehensive income
(101,661)
(263,959) (263,959)
Repurchase of treasury stock
Disposal of treasury stock
Retirement of treasury stock
Restated balance accounting policies
157,776
parent
1,961,322
(461) (72,419)
Changes in subsidiaries’ equity
Total changes during the period
Balance at the end of the period
shareholders’ equity Net changes of items other than
subscription rights to shares Dividends from retained earnings Profits attributable to owners of
Restated balance
Total changes during the period
Balance at the end of the period
Cumulative effects of changes in
Changes during the period Issuance of new shares-exercise of
Net changes of items other than shareholders’ equity
2,141,513
1,024
Mitsubishi UFJ Financial Group, Inc.
19
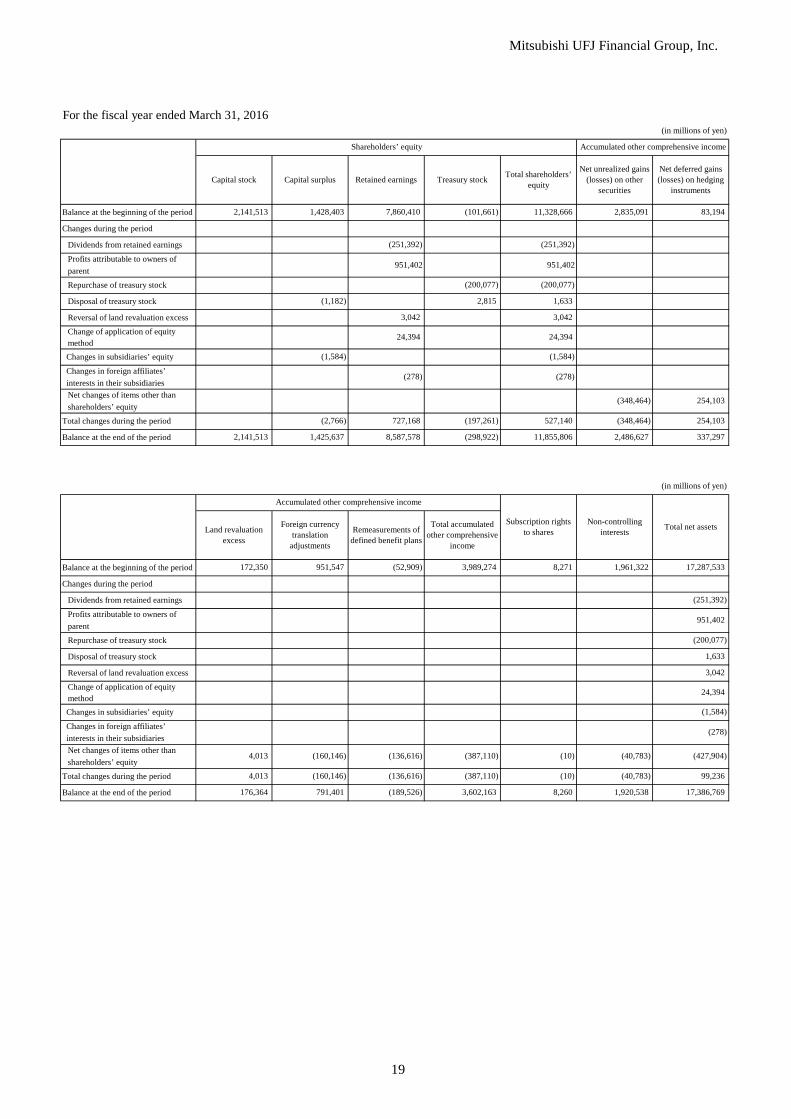
For the fiscal year ended March 31, 2016
method
Change of application of equity 24,394
shareholders’ equity
Change of application of equity 24,394
(278) interests in their subsidiaries
Net changes of items other than
(200,077)
1,633
11,855,806
(348,464)
Total accumulatedother comprehensive
income
254,103
(278)
2,486,627
(1,584)
Total changes during the period (2,766) 727,168 (197,261) 527,140
24,394
Changes in foreign affiliates’
(1,182) 2,815 1,633
3,042 3,042
(278) interests in their subsidiaries
(251,392)
Changes in subsidiaries’ equity
Capital stock
2,141,513
Total shareholders’equityCapital surplus
(101,661)
(251,392)
Net deferred gains(losses) on hedging
instruments
11,328,666 1,428,403 7,860,410 2,835,091 83,194
Retained earnings Treasury stock
Balance at the beginning of the period
Changes during the period
Shareholders’ equity
(in millions of yen)
Accumulated other comprehensive income
Net unrealized gains(losses) on other
securities
Repurchase of treasury stock
Reversal of land revaluation excess
parent Profits attributable to owners of
method
Disposal of treasury stock
Dividends from retained earnings
Changes during the period
Net changes of items other than
(200,077) (200,077)
Dividends from retained earnings
parent
Reversal of land revaluation excess
Balance at the beginning of the period
Changes in subsidiaries’ equity
Profits attributable to owners of
Repurchase of treasury stock
Disposal of treasury stock
Changes in foreign affiliates’
(1,584)
8,271 1,961,322
951,402 951,402
(348,464) 254,103
Balance at the end of the period 2,141,513 1,425,637 8,587,578 (298,922)
shareholders’ equity
337,297
(in millions of yen)
Accumulated other comprehensive income
Subscription rightsto shares
Non-controllinginterests Total net assetsLand revaluation
excess
Foreign currencytranslation
adjustments
Remeasurements ofdefined benefit plans
172,350 951,547 (52,909) 3,989,274 17,287,533
951,402
(251,392)
3,042
(1,584)
4,013 (160,146) (136,616) (387,110) (10) (40,783) (427,904)
Total changes during the period 4,013 (160,146) (136,616) (387,110) (10) (40,783) 99,236
Balance at the end of the period 176,364 791,401 (189,526) 3,602,163 8,260 1,920,538 17,386,769

Mitsubishi UFJ Financial Group, Inc.
20
(4) Consolidated Statements of Cash FlowsFor the fiscal year For the fiscal year
ended ended(in millions of yen) March 31, 2015 March 31, 2016
Cash flows from operating activities:Income before income taxes and others 1,614,757 1,498,769 Depreciation 300,163 298,527 Impairment losses 11,487 13,415 Amortization of goodwill 17,787 16,931 Equity in losses (gains) of affiliates (159,637) (230,415)Increase (decrease) in allowance for credit losses 46,037 71,084 Increase (decrease) in reserve for bonuses 10,321 955 Increase (decrease) in reserve for bonuses to directors (172) (58)Decrease (increase) in net defined benefit assets (62,696) (88,908)Increase (decrease) in net defined benefit liabilities (1,601) (2,255)Increase (decrease) in reserve for retirement benefits to directors (115) 27 Increase (decrease) in reserve for loyalty award credits 969 1,313 Increase (decrease) in reserve for contingent losses (43,807) 5,572 Interest income recognized on statement of income (2,806,238) (2,769,248)Interest expenses recognized on statement of income 624,743 655,735 Losses (gains) on securities (208,271) (221,235)Losses (gains) on money held in trust 639 (10,689)Foreign exchange losses (gains) (1,213,235) 1,439,205 Losses (gains) on sales of fixed assets 4,926 (9,171)Net decrease (increase) in trading assets (1,337,542) 49,544 Net increase (decrease) in trading liabilities 1,181,142 1,980,093 Adjustment of unsettled trading accounts 889,029 (821,034)Net decrease (increase) in loans and bills discounted (5,909,031) (4,990,628)Net increase (decrease) in deposits 6,793,900 7,888,704 Net increase (decrease) in negotiable certificates of deposit 488,549 (4,482,406)
3,247,294 (1,362,550)Net decrease (increase) in due from banks (excluding cash equivalents) (13,003,581) 80,699 Net decrease (increase) in call loans and bills bought and others 261,206 (633,599)
(370,559) (1,438,094)Net increase (decrease) in call money and bills sold and others (350,881) (435,883)Net increase (decrease) in commercial papers 667,730 119,203 Net increase (decrease) in payables under securities lending transactions 2,657,417 (3,446,893)Net decrease (increase) in foreign exchanges (assets) (137,770) 380,193 Net increase (decrease) in foreign exchanges (liabilities) 375,867 544,080 Net increase (decrease) in short-term bonds payable 353,597 (37,019)
906,637 649,951 Net increase (decrease) in due to trust accounts 1,238,144 10,112,737 Interest income (cash basis) 2,917,319 2,897,378 Interest expenses (cash basis) (636,368) (654,026)Others (26,303) 175,151 Sub-total (1,658,147) 7,245,155 Income taxes (463,446) (537,036)Refund of income taxes 25,845 46,308 Net cash provided by (used in) operating activities (2,095,748) 6,754,428
Net increase (decrease) in issuance and redemption of unsubordinated bonds payable
Net increase (decrease) in borrowed money (excluding subordinated borrowings)
Net decrease (increase) in receivables under securities borrowing transactions

Mitsubishi UFJ Financial Group, Inc.
21
For the fiscal year For the fiscal yearended ended
(in millions of yen) March 31, 2015 March 31, 2016Cash flows from investing activities:
Purchases of securities (138,305,190) (86,422,400)Proceeds from sales of securities 110,348,143 60,274,528 Proceeds from redemption of securities 34,682,841 28,452,434 Increase in money held in trust (479,026) (641,740)Decrease in money held in trust 576,140 672,854 Purchases of tangible fixed assets (176,368) (116,931)Purchases of intangible fixed assets (223,581) (231,615)Proceeds from sales of tangible fixed assets 12,393 35,494 Proceeds from sales of intangible fixed assets 19 166
(1,015) -
- 218,639
67,952 - Others (619) (1,221)Net cash provided by (used in) investing activities 6,501,689 2,240,209
Cash flows from financing activities:Increase in subordinated borrowings 55,000 38,000 Decrease in subordinated borrowings (74,800) (92,500)Increase in subordinated bonds payable and bonds with warrants 190,000 793,218 Decrease in subordinated bonds payable and bonds with warrants (284,324) (294,460)Proceeds from issuance of common stock to non-controlling shareholders 2,949 1,081 Decrease in redemption of preferred stocks (137,400) - Dividend paid by MUFG (263,978) (251,497)Dividend paid by subsidiaries to non-controlling shareholders (106,964) (94,825)Repayments to non-controlling shareholders (17,602) - Purchases of treasury stock (490,044) (200,053)Proceeds from sales of treasury stock 2 1
(29,463) (4,572)Others 4 3 Net cash provided by (used in) financing activities (1,156,621) (105,602)
Effect of foreign exchange rate changes on cash and cash equivalents 252,797 (115,214)Net increase (decrease) in cash and cash equivalents 3,502,117 8,773,820 Cash and cash equivalents at the beginning of the period 6,487,918 9,990,035 Cash and cash equivalents at the end of the period 9,990,035 18,763,856
Decrease related to purchases of subsidiaries’ equity affecting the scope of consolidation
Increase related to sales of subsidiaries’ equity affecting the scope of consolidation
Decrease related to purchases of subsidiaries’ equity not affecting the scope of consolidation
Increase related to purchases of subsidiaries’ equity affecting the scope of consolidation

Mitsubishi UFJ Financial Group, Inc.
Notes to the Consolidated Financial Statements (Notes on Going-Concern Assumption)
Not applicable (Significant Accounting Policies Applied in the Preparation of the Consolidated Financial Statements) 1. Scope of Consolidation
(1) Number of Consolidated Subsidiaries: 224 Principal companies: The Bank of Tokyo-Mitsubishi UFJ, Ltd. Mitsubishi UFJ Securities Holdings Co., Ltd. Mitsubishi UFJ Trust and Banking Corporation Mitsubishi UFJ NICOS Co., Ltd. ACOM CO., LTD. (Changes in the scope of consolidation) In the current fiscal year, Mitsubishi UFJ Capital V, Limited Partnership and 12 other companies were newly consolidated following new establishments or for other reasons. In the current fiscal year, Mitsubishi UFJ Venture Fund II, Limited Partnership and 14 other companies were excluded from the scope of consolidation because they were no longer subsidiaries due to liquidation or other reasons.
(2) Non-consolidated Subsidiaries: None
(3) Entities not Accounted for as Subsidiaries even though MUFG owns the Majority of Voting Rights: Hygeia Co., Ltd. OiDE CapiSEA, Inc. These were not treated as subsidiaries because Hygeia was established as a property management agent for a land trust project without any intent to control, or because OiDE CapiSEA, Inc. was established as ownership to benefit from the appreciation of their investments resulting from growth of the investees’ businesses without any intent to control.
2. Application of the Equity Method (1) Number of Non-consolidated Subsidiaries Accounted for under the Equity Method: None
(2) Number of Affiliates Accounted for under the Equity Method: 65
Principal companies: Mitsubishi UFJ Lease & Finance Company Limited Morgan Stanley (Changes in the scope of application of the equity method) In current fiscal year, GOLDEN ASIA FUND II, L.P. and 2 other companies were newly included in the scope of application of the equity method following new establishments.
(3) Number of Non-consolidated Subsidiaries not Accounted for under the Equity Method: None (4) Affiliates not Accounted for under the Equity Method: None
(5) Entities not Recognized as Affiliates in which MUFG Owns 20% to 50% of their Voting Rights:
TECHTOM Ltd. Osteopharma Inc. Hirosaki Co., Ltd. EDP Corporation
22

Mitsubishi UFJ Financial Group, Inc.
ISLE Co.,Ltd. Fun Place Co.,Ltd. AKITAYA Co,.Ltd.
These were not treated as affiliates because MUFG’s consolidated venture capital subsidiaries owned 20% to 50% of voting rights primarily to benefit from the appreciation of their investments resulting from growth or restructuring of the investees’ businesses, without any intent to control.
3. The Balance Sheet Dates of Consolidated Subsidiaries (1) The balance sheet dates of consolidated subsidiaries were as follows:
August 31: 1 subsidiary October 31: 1 subsidiary December 31: 140 subsidiaries January 24: 17 subsidiaries March 31: 65 subsidiaries
(2) A subsidiary whose balance sheet date is August 31 was consolidated based on its preliminary financial statements as of February 29. A subsidiary whose balance sheet date is October 31 was consolidated based on its preliminary financial statements as of January 31. Subsidiaries other than specified above were consolidated based on the financial statements as of their balance sheet dates. Adjustments were made to the consolidated financial statements to reflect the significant transactions that occurred between the balance sheet dates of the subsidiaries and the consolidated balance sheet date.
4. Accounting Policies (1) Trading Assets and Trading Liabilities; Trading Income and Expenses
Transactions involving short-term fluctuations or arbitrage opportunities in interest rates, currency exchange rates, market prices of financial instruments or other market indices (“trading purposes”) are presented in “Trading assets” and “Trading liabilities” on the consolidated balance sheet on a trade-date basis, and gains and losses from trading transactions (interest and dividends, gains or losses on sales and gains or losses on valuation) are presented in “Trading income” and “Trading expenses” on the consolidated statement of income on a trade-date basis. Trading assets and trading liabilities are stated at their fair values on the consolidated balance sheet date.
(2) Securities
(A) Debt securities being held to maturity are stated at amortized cost (using the straight-line method) computed using the moving average method. Other securities are primarily stated at their quoted market prices on the consolidated balance sheet date (cost of securities sold is calculated primarily using the moving average method), and other securities whose fair value is extremely difficult to estimate are stated at acquisition costs computed using the moving average method. Net unrealized gains (losses) on other securities are included directly in net assets, net of applicable income taxes, except in the case of application of the fair value hedge accounting method, in which the change in fair value recognized is recorded in current earnings.
(B) Securities that are held as trust assets in money held in trust are accounted for under the same basis as noted above in Notes (1) and (2)(A). Unrealized gains and losses on securities in money held in trust, which are not held for trading purposes or held to maturity, are included directly in net assets, net of applicable income taxes.
(3) Derivatives
Derivative transactions (other than trading purposes) are calculated primarily based on fair value.
23

Mitsubishi UFJ Financial Group, Inc.
(4) Depreciation and Amortization of Fixed Assets (A) Tangible Fixed Assets (Except for Lease Assets)
Depreciation of tangible fixed assets of MUFG and its domestic consolidated banking subsidiaries and domestic consolidated trust banking subsidiaries is computed using the declining-balance method.
The useful lives are primarily estimated as follows: Buildings: 15 to 50 years Equipment: 2 to 20 years
Depreciation of tangible fixed assets of other consolidated subsidiaries is computed primarily using the straight-line method based on their estimated useful lives.
(B) Intangible Fixed Assets (Except for Lease Assets) Amortization of intangible fixed assets is computed using the straight-line method. Development costs for internally used software are amortized using the straight-line method over the estimated useful lives of primarily 3 to 10 years.
(C) Lease Assets Depreciation or amortization of lease assets in “Tangible fixed assets” or “Intangible fixed assets” of the finance leases other than those that are deemed to transfer the ownership of leased property to the lessees is computed using the straight-line method over the lease periods with zero residual value unless residual value is guaranteed by the corresponding lease contracts.
(5) Deferred Assets
Bond issuance costs and stock issuance costs are expensed as incurred.
(6) Allowance for Credit Losses Principal domestic consolidated subsidiaries provide an allowance for credit losses in accordance with the internal standards for self-assessment of asset quality and the internal standards for write-offs and provisions. For claims on borrowers that have entered into bankruptcy, special liquidation proceedings or similar legal proceedings or whose notes have been dishonored and suspended from processing through clearing houses (“bankrupt borrowers”) or borrowers that are not legally or formally bankrupt but are regarded as substantially in a similar condition (“substantially bankrupt borrowers”), allowances are provided based on the amount of claims, after the write-offs as stated below, net of expected amounts to be collected through the disposal of collateral and the execution of guarantees. For claims on borrowers that are not yet legally or formally bankrupt but deemed to have a high possibility of becoming bankrupt (“potentially bankrupt borrowers”) excluding a portion of which principal and interest payment can be reasonably estimated from borrower’s cash flows, allowances are provided based on an overall solvency assessment of the claims, net of expected amounts to be collected through the disposal of collateral and the execution of guarantees. For claims on potentially bankrupt borrowers and claims on borrowers requiring close monitoring, of which principal and interest payment can be reasonably estimated from borrower’s cash flows, allowances are provided in an amount equal to the difference between the book value of the claims and the relevant cash flows discounted by the initial contractual interest rates. For other claims, allowances are provided based on historical credit loss experience. For claims originated in specific foreign countries, additional allowances are provided based on an assessment of political and economic conditions of these countries. All claims are assessed by branches and the credit supervision departments in accordance with the internal standards for self-assessment of asset quality. The credit review department, which is independent from those operating sections, subsequently audits these assessments. For claims on bankrupt borrowers and substantially bankrupt borrowers, the amount of claims exceeding the estimated value of collateral or guarantees, which is deemed uncollectible, has been written-off. The total amount of write-offs was ¥397,076 million.
24

Mitsubishi UFJ Financial Group, Inc.
Consolidated subsidiaries, not adopting procedures stated above, provide allowances based on their historical credit loss experience for general claims and based on individual assessments of the possibility of collection for specific deteriorated claims.
(7) Reserve for Bonuses
Reserve for bonuses, which is provided for future bonus payments to employees, reflects an estimated amount accrued on the consolidated balance sheet date.
(8) Reserve for Bonuses to Directors
Reserve for bonuses to directors, which is provided for future bonus payments to directors, reflects an estimated amount accrued on the consolidated balance sheet date.
(9) Reserve for Retirement Benefits to Directors
Reserve for retirement benefits to directors, which is provided for future payments of retirement benefits to directors of subsidiaries, is recorded in the amount deemed accrued on the consolidated balance sheet date based on the estimated amount of benefits.
(10) Reserve for Loyalty Award Credits
Reserve for loyalty award credits, which is provided to meet future use of credits granted to credit card (such as Super IC Card) customers, is recorded in the amount deemed necessary based on the estimated future use of unused credits.
(11) Reserve for Contingent Losses
Reserve for contingent losses, which is provided for possible losses from contingent events related to off-balance -sheet and other transactions, is calculated by estimating the impact of such contingent events and includes future claims for repayment of excess interest payments on consumer loans that are estimated based on the past and pending claims.
(12) Reserves under Special Laws Reserves under special laws represent the reserve for contingent liabilities from financial instrument transactions set aside in accordance with Article 46-5-1 and Article 48-3-1 of the Financial Instruments and Exchange Law and Article 175 and Article 189 of the Cabinet Office Ordinance on Financial Instruments Business.
(13) Retirement Benefits
In calculating benefit obligation, the portion of projected benefit obligation attributed to the current fiscal year is determined using the benefit formula basis. Unrecognized prior service cost is amortized using the straight-line method for a fixed period, primarily over 10 years, within the employees’ average remaining service period. Unrecognized net actuarial gains (losses) are amortized using the straight-line method for a fixed period, primarily over 10 years, within the employees’ average remaining service period, starting from the subsequent fiscal year after its occurrence. For certain overseas branches of domestic consolidated subsidiaries and some of consolidated subsidiaries, net defined benefit liability and retirement benefit expenses are calculated by the simplified method.
(14) Translation of Assets and Liabilities Denominated in Foreign Currencies Assets and liabilities denominated in foreign currencies or booked at overseas branches of domestic consolidated banking subsidiaries and domestic consolidated trust banking subsidiaries are translated into yen primarily at exchange rates prevailing at the consolidated balance sheet date, except for investments in non-consolidated affiliates which are translated into yen at exchange rates prevailing at the acquisition dates. Assets and liabilities denominated in foreign currencies of other consolidated subsidiaries are translated into yen at the exchange rates prevailing at the respective balance sheet date.
25

Mitsubishi UFJ Financial Group, Inc.
(15) Leasing Transactions (As Lessees) Domestic consolidated subsidiaries’ finance leases other than those that are deemed to transfer the ownership of leased property to the lessees are accounted for in a similar way to purchases, and depreciation for lease assets is computed using the straight-line method over the lease term with zero residual value unless residual value is guaranteed by the corresponding lease contracts. (As Lessors) Finance leases other than those that are deemed to transfer the ownership of leased property to the lessees are accounted for in a similar way to sales and income and expenses related to such leases are recognized by allocating interest equivalents to applicable fiscal periods instead of recording sales as “Other ordinary income.”
(16) Hedge Accounting
(A) Hedge Accounting for Interest Rate Risks Domestic consolidated banking subsidiaries and domestic consolidated trust banking subsidiaries have adopted the deferred hedge accounting method for hedging transactions for interest rate risks arising from financial assets and liabilities. Portfolio hedging or individual hedging, as described in the Japanese Institute of Certified Public Accountants (“JICPA”) Industry Audit Committee Report No. 24, “Treatment of Accounting and Auditing of Application of Accounting Standard for Financial Instruments in Banking Industry” (February 13, 2002) and JICPA Accounting Committee Report No. 14, “Practical Guidelines for Accounting for Financial Instruments” (January 31, 2000), are primarily applied to determine hedged items. With respect to hedging transactions to offset fluctuations in the fair value of fixed rate deposits, loans and other instruments, hedging instruments (e.g. interest rate swaps) are designated to hedged items individually or collectively by their maturities in accordance with JICPA Industry Audit Committee Report No. 24. With respect to hedging transactions to offset fluctuations in fair value of fixed rate bonds classified as other securities, hedging instruments (e.g. interest rate swaps) are designated to hedged items collectively by the type of bond. Since material terms related to hedged items and hedging instruments are substantially identical, and such hedging transactions are deemed highly effective, the assessment of effectiveness is based on the similarity of the terms. With respect to hedging transactions to fix the cash flows related to floating rate deposits and loans as well as forecasted transactions related to short-term fixed rate deposits, loans and other instruments, hedging instruments (e.g. interest rate swaps) are designated to hedged items collectively by interest rate indices and tenors in accordance with JICPA Industry Audit Committee Report No. 24. Since material terms related to hedged items and hedging instruments are substantially identical, and such hedging transactions are deemed highly effective, the assessment of effectiveness is based on the similarity of the terms. The effectiveness of hedging transactions is also assessed by the correlation between factors that cause fluctuations in interest rates of hedged items and those of hedging instruments.
(B) Hedge Accounting for Foreign Currency Risks Domestic consolidated banking subsidiaries and domestic consolidated trust banking subsidiaries have adopted the deferred hedge accounting method for hedging foreign currency risks arising from financial assets and liabilities denominated in foreign currencies. Portfolio hedging is applied to determine hedged items as described in JICPA Industry Audit Committee Report No. 25 “Treatment of Accounting and Auditing concerning Accounting for Foreign Currency Transactions in the Banking Industry” (July 29, 2002). Hedging instruments (e.g. currency swaps and forward exchange contracts) are designated to hedged items collectively by currencies. Portfolio hedging and individual hedging are applied to hedge foreign currency risks arising from equity investments in foreign subsidiaries and foreign affiliates, and other securities (other than bonds) denominated in foreign currencies. Monetary claims and liabilities denominated in the same foreign currencies or forward exchange contracts are used as hedging instruments. As for the hedge accounting method applied to equity investments in foreign subsidiaries and foreign affiliates, foreign currency translation differences arising from hedging instruments are recorded as foreign currency translation adjustments. The fair value hedge accounting method is applied to other securities (other than bonds) denominated in foreign currencies.
26

Mitsubishi UFJ Financial Group, Inc.
(C) Hedge Accounting for Stock Price Fluctuation Risks
Individual hedging is applied to hedge market fluctuation risks arising from strategic equity securities held by domestic consolidated banking subsidiaries. Instruments such as total return swaps are used as hedging instruments. The effectiveness of hedging transactions is assessed by the correlation between changes in fair value of hedged items and changes in fair value of hedging instruments. The fair value hedge accounting method is applied.
(D) Transactions among Consolidated Subsidiaries Derivative transactions including interest rate swaps and currency swaps which are designated as hedging instruments among consolidated subsidiaries or between trading accounts and other accounts (or among internal sections) are not eliminated from the consolidated statements of income or valuation difference, but are recognized as related gains or losses or deferred under hedge accounting because these derivative transactions are executed, meeting certain criteria under JICPA Industry Audit Committee Reports No. 24 and No. 25 and they are regarded as equivalent to external third-party transactions.
(17) Amortization Method and Amortization Period of Goodwill
Goodwill is primarily amortized using the straight-line method over 20 years starting from the period of the acquisition. Other goodwill with insignificant balances is expensed as incurred.
(18) Cash and Cash Equivalents in the Consolidated Statements of Cash Flows
Cash and cash equivalents in the consolidated statements of cash flows are defined as “Cash and due from banks” on the consolidated balance sheet, excluding time deposits and negotiable certificates of deposits in other banks.
(19) Consumption Taxes
National and local consumption taxes are excluded from transaction amounts. Non-deductible portions of consumption taxes on the purchases of tangible fixed assets are expensed when incurred.
(20) Adoption of Consolidated Taxation System
MUFG and some of its domestic consolidated subsidiaries adopt the consolidated taxation system. (21) Accounting Standard for Foreign Subsidiaries
Financial statements of foreign subsidiaries are used for consolidated accounting as long as they are prepared in accordance with the International Financial Reporting Standards (“IFRS”) or Accounting Principles Generally Accepted in the United States (“U.S. GAAP”). If they are prepared in accordance with generally accepted accounting principles in each domicile country and not in accordance with IFRS or U.S. GAAP, the financial statements of foreign subsidiaries are mainly rearranged in accordance with U.S. GAAP. They were also adjusted when necessary in the process of consolidation.
27

Mitsubishi UFJ Financial Group, Inc.
(Changes in Method of Presentation) Change in presentation for “Net income,” etc. as well as change in presentation from “Minority interests” to “Non-controlling interests” has been carried out, in compliance with the provisions, etc. in Article 39 of the “Revised Accounting Standard for Consolidated Financial Statements” (ASBJ Statement No. 22 issued on September 13, 2013).
28

Mitsubishi UFJ Financial Group, Inc.
(Consolidated Balance Sheet) 1. Securities include ¥2,559,559 million in stock and ¥29,730 million in investments of affiliates.
2. For borrowed securities under securities borrowing transactions and securities purchased under resale agreements
which were permissible to be sold or re-pledged without restrictions, ¥12,388,598 million of such securities were re-pledged, ¥222,362 million were re-loaned and ¥3,091,874 million were held by MUFG as of the consolidated balance sheet date.
3. Loans to bankrupt borrowers: ¥54,913 million. Non-accrual delinquent loans: ¥1,110,576 million. Loans to bankrupt borrowers are loans, after write-offs, to bankrupt borrowers as defined in Article 96-1-3-1 to 5 and 96-1-4 of the Enforcement Ordinance of the Corporate Tax Law (No. 97 in 1965) on which accrued interest income is not recognized (“Non-accrual loans”) as there is substantial doubt as to the collection of principal and/or interest because of delinquencies in payment of principal and/or interest for a significant period of time or for some other reasons. Non-accrual delinquent loans represent non-accrual loans other than loans to bankrupt borrowers and loans renegotiated at concessionary terms including reduction or deferral of interest due to borrowers’ weakened financial condition.
4. Loans past due for 3 months or more: ¥51,620 million. Loans past due for 3 months or more represent loans whose principal and/or interest payments have been past due for 3 months or more excluding loans to bankrupt borrowers and non-accrual delinquent loans.
5. Restructured loans: ¥438,767 million. Restructured loans represent loans renegotiated at concessionary terms including reduction or deferral of interest or principal and waiver of the claims for the purpose of business reconstruction or support for the borrower, excluding loans to bankrupt borrowers, non-accrual delinquent loans and loans past due for 3 months or more.
6. The total amount of loans to bankrupt borrowers, non-accrual delinquent loans, loans past due for 3 months or more and restructured loans was ¥1,655,877 million. The amounts provided in Notes 3 to 6 represent gross amounts before the deduction of allowances for credit losses.
7. Bills discounted were accounted for as financial transactions in accordance with JICPA Industry Audit Committee Report No. 24. MUFG’s banking subsidiaries and trust banking subsidiaries have rights to sell or pledge bank acceptances bought, commercial bills discounted, documentary bills and foreign exchanges bought without restrictions. The total face value of these bills was ¥1,088,768 million.
8. Assets pledged as collateral were as follows: Cash and due from banks ¥6,194 million Trading assets ¥125,562 million Securities ¥2,843,706 million Loans and bills discounted ¥7,587,495 million
29
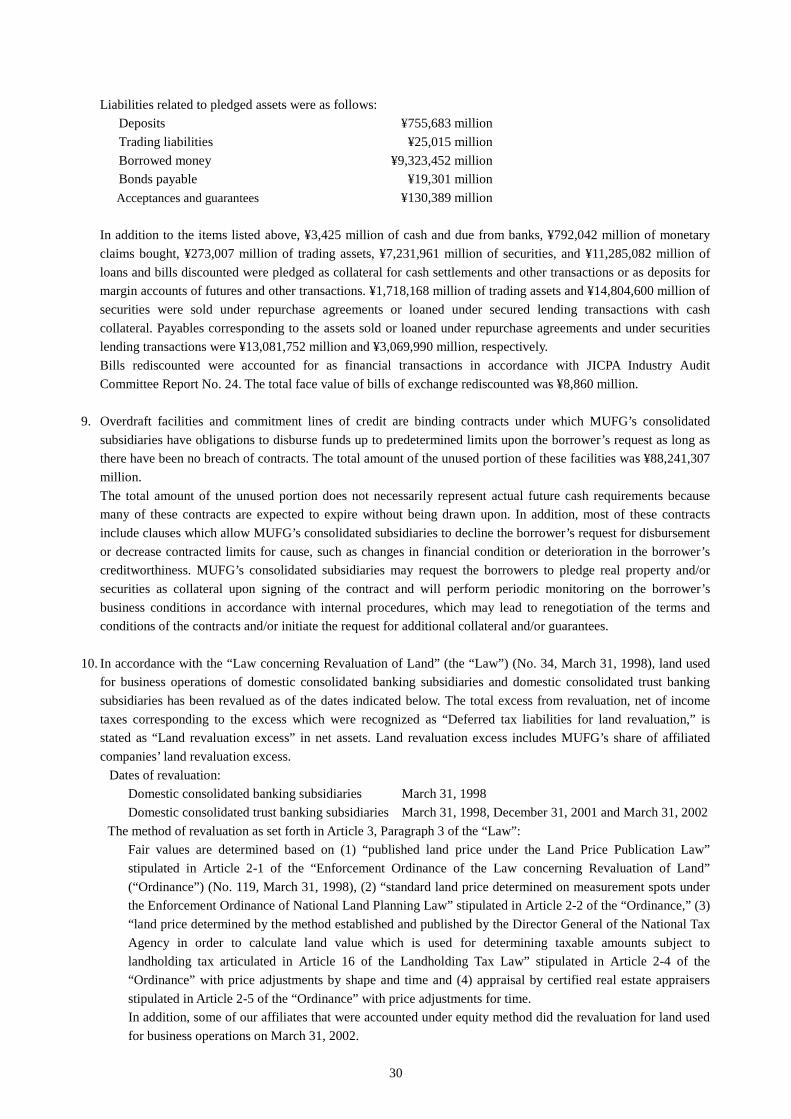
Mitsubishi UFJ Financial Group, Inc.
Liabilities related to pledged assets were as follows: Deposits ¥755,683 million Trading liabilities ¥25,015 million Borrowed money ¥9,323,452 million Bonds payable ¥19,301 million Acceptances and guarantees ¥130,389 million
In addition to the items listed above, ¥3,425 million of cash and due from banks, ¥792,042 million of monetary claims bought, ¥273,007 million of trading assets, ¥7,231,961 million of securities, and ¥11,285,082 million of loans and bills discounted were pledged as collateral for cash settlements and other transactions or as deposits for margin accounts of futures and other transactions. ¥1,718,168 million of trading assets and ¥14,804,600 million of securities were sold under repurchase agreements or loaned under secured lending transactions with cash collateral. Payables corresponding to the assets sold or loaned under repurchase agreements and under securities lending transactions were ¥13,081,752 million and ¥3,069,990 million, respectively. Bills rediscounted were accounted for as financial transactions in accordance with JICPA Industry Audit Committee Report No. 24. The total face value of bills of exchange rediscounted was ¥8,860 million.
9. Overdraft facilities and commitment lines of credit are binding contracts under which MUFG’s consolidated subsidiaries have obligations to disburse funds up to predetermined limits upon the borrower’s request as long as there have been no breach of contracts. The total amount of the unused portion of these facilities was ¥88,241,307 million. The total amount of the unused portion does not necessarily represent actual future cash requirements because many of these contracts are expected to expire without being drawn upon. In addition, most of these contracts include clauses which allow MUFG’s consolidated subsidiaries to decline the borrower’s request for disbursement or decrease contracted limits for cause, such as changes in financial condition or deterioration in the borrower’s creditworthiness. MUFG’s consolidated subsidiaries may request the borrowers to pledge real property and/or securities as collateral upon signing of the contract and will perform periodic monitoring on the borrower’s business conditions in accordance with internal procedures, which may lead to renegotiation of the terms and conditions of the contracts and/or initiate the request for additional collateral and/or guarantees.
10. In accordance with the “Law concerning Revaluation of Land” (the “Law”) (No. 34, March 31, 1998), land used for business operations of domestic consolidated banking subsidiaries and domestic consolidated trust banking subsidiaries has been revalued as of the dates indicated below. The total excess from revaluation, net of income taxes corresponding to the excess which were recognized as “Deferred tax liabilities for land revaluation,” is stated as “Land revaluation excess” in net assets. Land revaluation excess includes MUFG’s share of affiliated companies’ land revaluation excess.
Dates of revaluation: Domestic consolidated banking subsidiaries March 31, 1998 Domestic consolidated trust banking subsidiaries March 31, 1998, December 31, 2001 and March 31, 2002
The method of revaluation as set forth in Article 3, Paragraph 3 of the “Law”: Fair values are determined based on (1) “published land price under the Land Price Publication Law” stipulated in Article 2-1 of the “Enforcement Ordinance of the Law concerning Revaluation of Land” (“Ordinance”) (No. 119, March 31, 1998), (2) “standard land price determined on measurement spots under the Enforcement Ordinance of National Land Planning Law” stipulated in Article 2-2 of the “Ordinance,” (3) “land price determined by the method established and published by the Director General of the National Tax Agency in order to calculate land value which is used for determining taxable amounts subject to landholding tax articulated in Article 16 of the Landholding Tax Law” stipulated in Article 2-4 of the “Ordinance” with price adjustments by shape and time and (4) appraisal by certified real estate appraisers stipulated in Article 2-5 of the “Ordinance” with price adjustments for time. In addition, some of our affiliates that were accounted under equity method did the revaluation for land used for business operations on March 31, 2002.
30

Mitsubishi UFJ Financial Group, Inc.
11. Accumulated depreciation on tangible fixed assets: ¥1,218,922 million.
12. Deferred gains on tangible fixed assets deducted for tax purposes: ¥91,132 million.
13. Borrowed money included ¥616,500 million of subordinated borrowings.
14. Bonds payable included ¥2,579,457 million of subordinated bonds.
15. The principal amount of money trusts entrusted to domestic trust banking subsidiaries, for which repayment of the
principal to the customers was guaranteed, was ¥7,111,058 million.
16. With regard to bonds and other securities in “Securities,” guarantee obligations for private placement bonds (provided in accordance with the Article 2-3 of the Financial Instruments and Exchange Law) were ¥580,398 million.
31

Mitsubishi UFJ Financial Group, Inc.
(Consolidated Statements of Income)
1. “Other ordinary income” included ¥230,415 million of equity in gains of the equity method investees and ¥145,347 million of gains on sales of equity securities.
2. “Other ordinary expenses” included ¥143,946 million of write-offs of loans and ¥101,239 million of provision for
reserve for contingent losses.
32
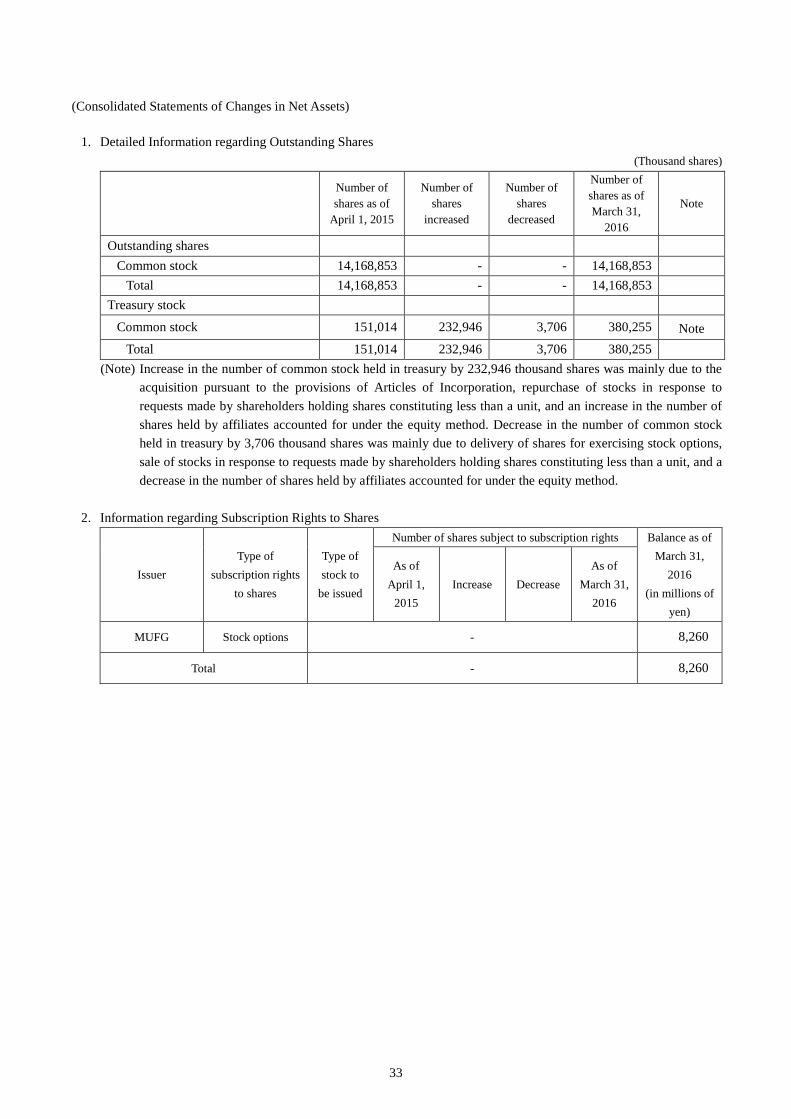
Mitsubishi UFJ Financial Group, Inc.
(Consolidated Statements of Changes in Net Assets)
1. Detailed Information regarding Outstanding Shares (Thousand shares)
(Note) Increase in the number of common stock held in treasury by 232,946 thousand shares was mainly due to the acquisition pursuant to the provisions of Articles of Incorporation, repurchase of stocks in response to requests made by shareholders holding shares constituting less than a unit, and an increase in the number of shares held by affiliates accounted for under the equity method. Decrease in the number of common stock held in treasury by 3,706 thousand shares was mainly due to delivery of shares for exercising stock options, sale of stocks in response to requests made by shareholders holding shares constituting less than a unit, and a decrease in the number of shares held by affiliates accounted for under the equity method.
2. Information regarding Subscription Rights to Shares
Issuer Type of
subscription rights to shares
Type of stock to
be issued
Number of shares subject to subscription rights Balance as of March 31,
2016 (in millions of
yen)
As of April 1,
2015 Increase Decrease
As of March 31,
2016
MUFG Stock options - 8,260
Total - 8,260
Number of shares as of
April 1, 2015
Number of shares
increased
Number of shares
decreased
Number of shares as of March 31,
2016
Note
Outstanding shares Common stock 14,168,853 - - 14,168,853
Total 14,168,853 - - 14,168,853 Treasury stock
Common stock 151,014 232,946 3,706 380,255 Note Total 151,014 232,946 3,706 380,255
33

Mitsubishi UFJ Financial Group, Inc.
3. Detailed Information regarding Cash Dividends
(A) Dividends Paid in the Fiscal Year Ended March 31, 2016
Date of approval Type of stock Total Dividends (in millions of
yen)
Dividend per share
(¥)
Dividend
record date Effective date
Annual General Meeting
of Shareholders on
June 25, 2015
Common stock 126,179 9 March 31,
2015 June 25, 2015
Meeting of Board of Directors on November 13,
2015
Common stock 125,212 9 September
30, 2015
December 4,
2015
(B) Dividends with Record Dates on or before March 31, 2016 and Effective Dates after March 31, 2016
The following matters relating to dividends are planned to be brought up at the Annual General Meeting of Shareholders scheduled to be held on June 29, 2016.
Date of approval
(scheduled) Type of stock
Total Dividends
(in millions of
yen)
Source of
dividends
Dividend
per share
(¥)
Dividend
record date
Effective
date
Annual General Meeting
of Shareholders on June 29, 2016
(tentative)
Common stock 124,116 Retained earnings 9 March 31,
2016 June 29, 2016
34

Mitsubishi UFJ Financial Group, Inc.
(Consolidated Statements of Cash Flows)
The difference between “cash and cash equivalents” and items presented on the consolidated balance sheet As of March 31, 2016
Cash and due from banks on the consolidated balance sheet: ¥49,158,293 million Time deposits and negotiable certificates of deposit in other banks: (¥30,394,436 million) Cash and cash equivalents: ¥18,763,856 million
35

Mitsubishi UFJ Financial Group, Inc.
(Financial Instruments)
Disclosure on the Fair Value and Other Matters of Financial Instruments (1) The following table summarizes the amount stated on the consolidated balance sheet and the fair value of
financial instruments as of March 31, 2016 together with their differences. Note that the following table does not include non-listed equity securities and certain other securities of which
fair value is extremely difficult to determine.
(in millions of yen)
Amount on consolidated balance
sheet Fair value Difference
(1) Cash and due from banks 49,158,293 49,158,293 - (2) Call loans and bills bought 660,015 660,015 - (3) Receivables under resale agreements 7,466,633 7,466,633 - (4) Receivables under securities borrowing
transactions 6,041,983 6,041,983 -
(5) Monetary claims bought (*1) 4,733,393 4,730,669 (2,723) (6) Trading assets 4,569,638 4,569,638 - (7) Money held in trust 679,678 679,243 (435) (8) Securities
Debt securities being held to maturity 2,334,278 2,399,033 64,754 Other securities 64,843,522 64,843,522 -
(9) Loans and bills discounted 113,756,325 Allowance for credit losses (*1) (921,546)
112,834,779 114,507,040 1,672,261
(10) Foreign exchanges (*1) 1,792,888 1,792,888 -
Total assets 255,115,104 256,848,961 1,733,857
(1) Deposits 160,965,056 161,003,509 38,452 (2) Negotiable certificates of deposit 11,591,578 11,596,148 4,569 (3) Call money and bills sold 1,360,238 1,360,238 - (4) Payables under repurchase agreements 23,515,240 23,515,240 - (5) Payables under securities lending
transactions 4,710,407 4,710,407 -
(6) Commercial papers 2,292,282 2,292,282 - (7) Trading liabilities 1,655,277 1,655,277 - (8) Borrowed money 12,482,277 12,527,811 45,533 (9) Foreign exchanges 2,054,937 2,054,937 - (10) Short-term bonds payable 752,492 752,492 - (11) Bonds payable 9,190,542 9,342,105 151,563 (12) Due to trust accounts 13,296,033 13,296,033 -
Total liabilities 243,866,364 244,106,483 240,118
Derivative transactions (*2) Activities not qualifying for hedge accounting 345,179 345,179 -
Activities qualifying for hedge accounting 513,695 513,695 -
Total derivative transactions 858,875 858,875 -
36
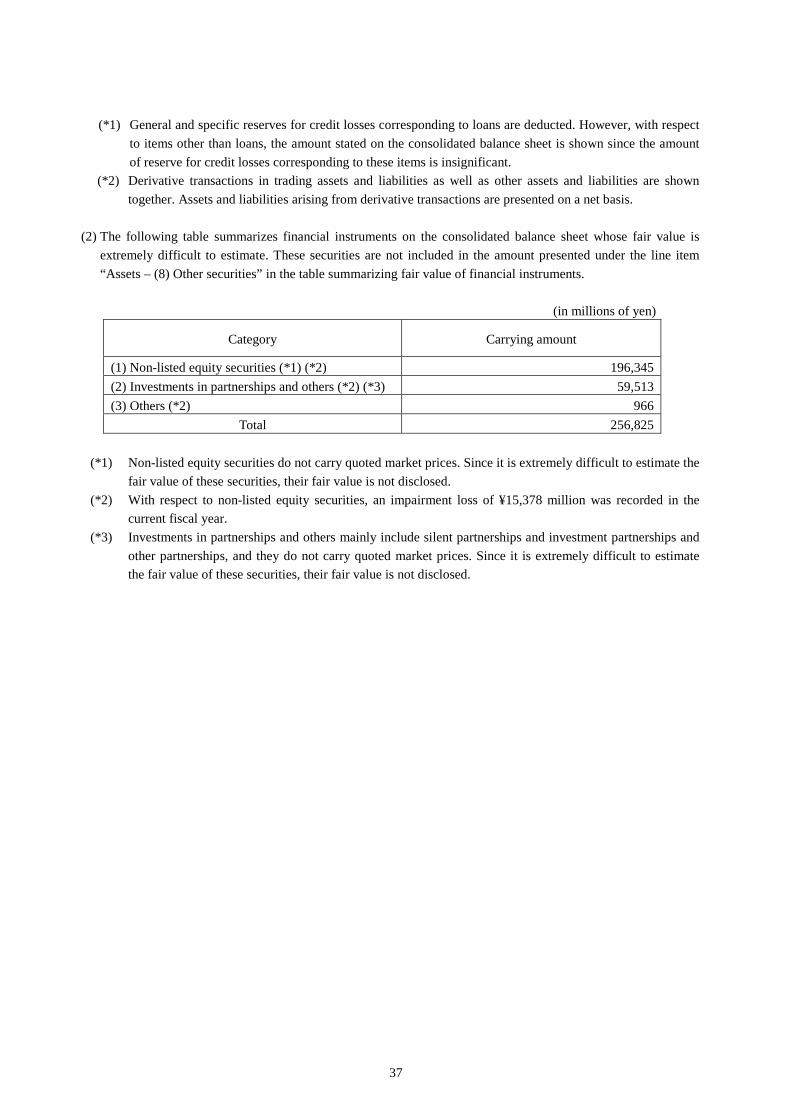
Mitsubishi UFJ Financial Group, Inc.
(*1) General and specific reserves for credit losses corresponding to loans are deducted. However, with respect
to items other than loans, the amount stated on the consolidated balance sheet is shown since the amount of reserve for credit losses corresponding to these items is insignificant.
(*2) Derivative transactions in trading assets and liabilities as well as other assets and liabilities are shown together. Assets and liabilities arising from derivative transactions are presented on a net basis.
(2) The following table summarizes financial instruments on the consolidated balance sheet whose fair value is
extremely difficult to estimate. These securities are not included in the amount presented under the line item “Assets – (8) Other securities” in the table summarizing fair value of financial instruments.
(in millions of yen)
Category Carrying amount
(1) Non-listed equity securities (*1) (*2) 196,345 (2) Investments in partnerships and others (*2) (*3)
59,513 (3) Others (*2) 966
Total 256,825
(*1) Non-listed equity securities do not carry quoted market prices. Since it is extremely difficult to estimate the fair value of these securities, their fair value is not disclosed.
(*2) With respect to non-listed equity securities, an impairment loss of ¥15,378 million was recorded in the current fiscal year.
(*3) Investments in partnerships and others mainly include silent partnerships and investment partnerships and other partnerships, and they do not carry quoted market prices. Since it is extremely difficult to estimate the fair value of these securities, their fair value is not disclosed.
37

Mitsubishi UFJ Financial Group, Inc.
(Securities)
In addition to “Securities” on the consolidated balance sheet, the figures in the following tables include trading account securities, securities related to trading transactions and short-term corporate bonds classified as “Trading assets,” negotiable certificates of deposit in “Cash and due from banks” and beneficiary certificates of commodities investment trusts in “Monetary claims bought” and others. 1. Trading Securities (as of March 31, 2016)
(in millions of yen)
Net unrealized gains (losses) recorded on the consolidated statement of income during the current fiscal year
Trading securities 4,196 2. Debt Securities Being Held to Maturity (as of March 31, 2016)
(in millions of yen)
Type of securities Amount on
consolidated balance sheet
Fair value Difference
Securities of which the fair value exceeds the amount recorded on the consolidated balance sheet
Domestic bonds 1,101,107 1,159,115 58,008 Government bonds 1,101,107 1,159,115 58,008 Municipal bonds - - - Corporate bonds - - -
Other securities 1,157,524 1,179,101 21,576 Foreign bonds 714,485 727,290 12,805 Other 443,039 451,810 8,771
Subtotal 2,258,631 2,338,216 79,584 Securities of which the fair value does not exceed the amount recorded on the consolidated balance sheet
Domestic bonds - - - Government bonds - - - Municipal bonds - - - Corporate bonds - - -
Other securities 1,627,607 1,612,541 (15,066) Foreign bonds 518,685 512,627 (6,058) Other 1,108,922 1,099,914 (9,007)
Subtotal 1,627,607 1,612,541 (15,066) Total 3,886,239 3,950,758 64,518
38

Mitsubishi UFJ Financial Group, Inc.
3. Other Securities (as of March 31, 2016) (in millions of yen)
Type of securities Amount on
consolidated balance sheet
Acquisition cost Difference
Securities of which the fair value exceeds the acquisition cost
Domestic equity securities 4,470,335 2,174,567 2,295,767 Domestic bonds 25,972,881 25,251,159 721,722
Government bonds 23,143,622 22,511,489 632,132 Municipal bonds 412,716 401,093 11,623 Corporate bonds 2,416,542 2,338,575 77,966
Other securities 24,976,085 24,287,079 689,005 Foreign equity securities 92,567 57,122 35,445 Foreign bonds 23,029,536 22,484,665 544,870 Other 1,853,981 1,745,292 108,689
Subtotal 55,419,301 51,712,806 3,706,495 Securities of which the fair value does not exceed the acquisition cost
Domestic equity securities 402,877 493,219 (90,342) Domestic bonds 4,349,610 4,353,085 (3,475)
Government bonds 4,112,375 4,112,607 (231) Municipal bonds 36,613 36,697 (84) Corporate bonds 200,621 203,780 (3,159)
Other securities 5,346,690 5,474,071 (127,380) Foreign equity securities 56,509 68,134 (11,624) Foreign bonds 3,620,897 3,654,781 (33,883) Other 1,669,284 1,751,156 (81,872)
Subtotal 10,099,178 10,320,377 (221,198)
Total 65,518,480 62,033,183 3,485,297 (Note) The total difference amount shown in the table above includes ¥5,480 million revaluation losses of
securities by application of the fair value hedge accounting method.
39
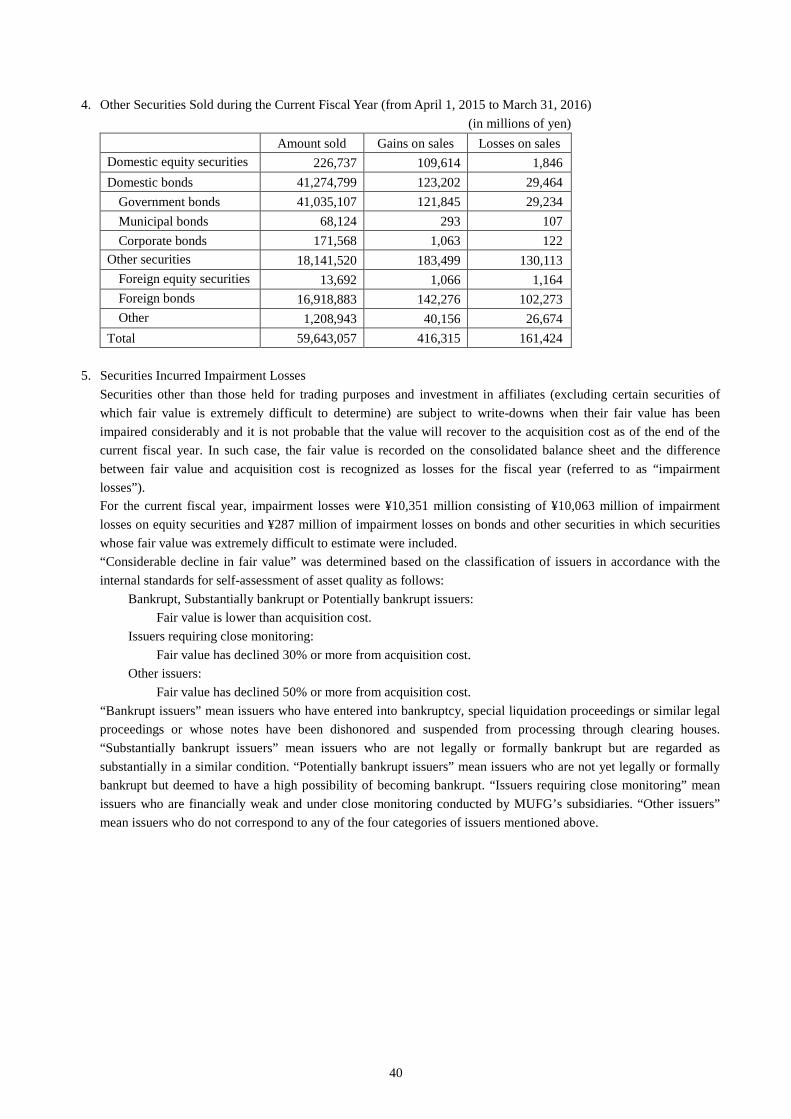
Mitsubishi UFJ Financial Group, Inc.
4. Other Securities Sold during the Current Fiscal Year (from April 1, 2015 to March 31, 2016) (in millions of yen)
Amount sold Gains on sales Losses on sales Domestic equity securities 226,737 109,614 1,846 Domestic bonds 41,274,799 123,202 29,464
Government bonds 41,035,107 121,845 29,234 Municipal bonds 68,124 293 107 Corporate bonds 171,568 1,063 122
Other securities 18,141,520 183,499 130,113 Foreign equity securities 13,692 1,066 1,164 Foreign bonds 16,918,883 142,276 102,273 Other 1,208,943 40,156 26,674
Total 59,643,057 416,315 161,424 5. Securities Incurred Impairment Losses
Securities other than those held for trading purposes and investment in affiliates (excluding certain securities of which fair value is extremely difficult to determine) are subject to write-downs when their fair value has been impaired considerably and it is not probable that the value will recover to the acquisition cost as of the end of the current fiscal year. In such case, the fair value is recorded on the consolidated balance sheet and the difference between fair value and acquisition cost is recognized as losses for the fiscal year (referred to as “impairment losses”). For the current fiscal year, impairment losses were ¥10,351 million consisting of ¥10,063 million of impairment losses on equity securities and ¥287 million of impairment losses on bonds and other securities in which securities whose fair value was extremely difficult to estimate were included. “Considerable decline in fair value” was determined based on the classification of issuers in accordance with the internal standards for self-assessment of asset quality as follows:
Bankrupt, Substantially bankrupt or Potentially bankrupt issuers: Fair value is lower than acquisition cost.
Issuers requiring close monitoring: Fair value has declined 30% or more from acquisition cost.
Other issuers: Fair value has declined 50% or more from acquisition cost.
“Bankrupt issuers” mean issuers who have entered into bankruptcy, special liquidation proceedings or similar legal proceedings or whose notes have been dishonored and suspended from processing through clearing houses. “Substantially bankrupt issuers” mean issuers who are not legally or formally bankrupt but are regarded as substantially in a similar condition. “Potentially bankrupt issuers” mean issuers who are not yet legally or formally bankrupt but deemed to have a high possibility of becoming bankrupt. “Issuers requiring close monitoring” mean issuers who are financially weak and under close monitoring conducted by MUFG’s subsidiaries. “Other issuers” mean issuers who do not correspond to any of the four categories of issuers mentioned above.
40

Mitsubishi UFJ Financial Group, Inc.
(Money Held in Trust)
1. Money Held in Trust for Trading Purpose (as of March 31, 2016) (in millions of yen)
Amount on
consolidated balance sheet
Net unrealized gains (losses) recorded on the consolidated statement of income during the current fiscal year
Money held in trust for trading purpose 70,196 (222)
2. Money Held in Trust Being Held to Maturity (as of March 31, 2016)
(in millions of yen)
(a) Amount on consolidated balance sheet
(b) Fair value Difference (b) – (a)
Money held in trust with respect to which (b)
exceeds (a)
Money held in trust with respect to
which (b) does not exceed (a)
Money held in trust being held to maturity
46,266 46,761 494 494 -
(Note) “Money held in trust with respect to which (b) exceeds (a)” and “Money held in trust with respect to which (b) does not exceed (a)” show the breakdown of the difference between (a) and (b).
3. Money Held in Trust not for Trading Purpose or Being Held to Maturity (as of March 31, 2016)
(in millions of yen)
(a) Amount on consolidated balance sheet
(b) Acquisition
cost
Difference (a)-(b)
Money held in trust with respect to which (a)
exceeds (b)
Money held in trust with respect to
which (a) does not exceed (b)
Money held in trust not for trading purpose or being held to maturity
563,215 561,853 1,361 1,361 -
(Note) “Money held in trust with respect to which (a) exceeds (b)” and “Money held in trust with respect to which (a) does not exceed (b)” show the breakdown of the difference between (a) and (b).
(Net Unrealized Gains (Losses) on Other Securities)
Detailed information regarding net unrealized gains (losses) on other securities (as of March 31, 2016) (in millions of yen)
Net unrealized gains (losses) on other securities 3,473,305 Other securities 3,499,436 Money held in trust not for trading purpose or being held to maturity 1,361 Reclassification from “Other securities” to “Debt securities being held to maturity” (27,492)
Deferred tax liabilities (1,011,562) Net unrealized gains (losses) on other securities, net of deferred tax liabilities (before MUFG’s ownership share of affiliates’ unrealized gains (losses) adjustments) 2,461,743
Non-controlling interests 9,785 MUFG’s ownership share of affiliates’ unrealized gains (losses) on other securities 15,098 Total 2,486,627
(Notes) (1) “Net unrealized gains (losses) on other securities” shown in the above table excluded ¥5,480 million revaluation losses of securities by application of the fair value hedge accounting method, which were recorded in current earnings.
(2) “Net unrealized gains (losses) on other securities” shown in the above table included ¥8,659 million of unrealized gains on securities in investment limited partnerships.
41

Mitsubishi UFJ Financial Group, Inc.
(Segment Information)
1. Information regarding the Amounts of Ordinary Income, Ordinary Profits (Losses), Assets and other items by
Segment For the Fiscal Year Ended March 31, 2016 (in millions of yen)
The Bank of
Tokyo-Mitsubishi UFJ, Ltd.
Mitsubishi UFJ Trust and Banking
Corporation
Mitsubishi UFJ Securities
Holdings Co., Ltd.
Consumer Finance
Subsidiaries Others Total Adjustments
Amount recorded in the
consolidated financial
statements
Ordinary income 4,033,796 728,186 487,969 509,022 677,339 6,436,315 (721,895) 5,714,419
Interest income 2,323,774 237,123 38,315 196,460 644,809 3,440,483 (671,234) 2,769,248
Investment gains on equity method 25,000 11,020 19,578 195 - 55,794 174,621 230,415
Ordinary income from customers 3,906,856 714,368 411,727 487,845 193,621 5,714,419 - 5,714,419
Ordinary income from internal transactions 126,939 13,818 76,242 21,176 483,718 721,895 (721,895) -
Segment income (loss) 685,835 160,919 41,926 (26,307) 608,171 1,470,546 (519,143) 951,402
Segment assets 222,797,387 45,685,976 31,021,997 4,249,166 13,344,284 317,098,811 (18,795,913) 298,302,898
Other items
Depreciation 212,656 32,288 20,794 25,256 2,452 293,449 5,077 298,527
Amortization of goodwill 15,943 1,049 2,077 984 - 20,055 (3,124) 16,931
Interest expenses 535,643 83,767 30,912 20,010 32,153 702,486 (46,751) 655,735
Extraordinary gains 36,950 81 - 8 - 37,040 (15,723) 21,316
Extraordinary losses 21,247 2,677 3,596 1,919 91 29,532 32,501 62,033
Impairment losses on fixed assets
11,011 1,605 710 6 81 13,415 - 13,415
Income tax expenses 350,207 66,095 33,329 19,981 (2,590) 467,024 (6,820) 460,204
Unamortized balance of goodwill 258,760 20,520 37,320 6,459 - 323,061 (44,432) 278,628
Investment to companies accounted for under the equity method
282,910 139,749 251,025 5,016 823,721 1,502,423 1,086,866 2,589,290
Increases in tangible and intangible fixed assets
223,441 51,035 48,147 28,606 5,938 357,169 - 357,169
(Notes) (1) Ordinary income, interest income and interest expenses are presented, respectively, in lieu of net sales, interest on deposits and interest on borrowings of the companies in non-banking industries.
(2) “Others” includes MUFG. (3) Segment income for “Others” includes ¥574,251 million of dividends from MUFG’s subsidiaries and
affiliates. (4) Interest income adjustments include elimination of the dividends from affiliates recorded by MUFG. (5) Segment income (loss) adjustments include minus ¥721,513 million elimination of internal transactions,
as well as ¥202,369 million comprising investment gains (losses) on equity method, amortization of goodwill, tax expenses, and profits attributable to non-controlling interests that are not attributable to specific segments.
(6) Segment assets adjustments are primarily elimination of assets and liabilities between segments. (7) Adjustments for extraordinary losses include losses on change in equity (8) Segment income (loss) is reconciled to profits attributable to owners of parent in the consolidated
statement of income.
42

Mitsubishi UFJ Financial Group, Inc.
(Per Share Information)
For the fiscal year ended March 31, 2016
Net assets per common share ¥1,121.06
Basic earnings per common share ¥68.51
Diluted earnings per common share ¥68.17 (Notes) (1) Basis for computing basic earnings per common share and diluted earnings per common share is as
follows: For the fiscal year ended
March 31, 2016 Basic earnings per common share
Profits attributable to owners of parent million yen 951,402 Amounts not attributable to common shareholders million yen - Profits attributable to common shareholders of parent million yen 951,402 Average number of common share outstanding for the fiscal period
thousand shares 13,886,503
Diluted earnings per common share
Adjustments in profits attributable to owners of parent million yen (3,539) Adjustments made to reflect dilutive shares of consolidated subsidiaries and others
million yen (3,539)
Increase in common share thousand shares 17,474 Subscription rights to shares thousand shares 17,474
Antidilutive securities which were not included in the calculation of diluted earnings per common share
Subscription rights to shares of affiliates accounted for under the equity method:
Morgan Stanley Stock options - 11 million units as of December 31, 2015
(2) Basis for computing net assets per common share is as follows:
For the fiscal year ended March 31, 2016
Total net assets million yen 17,386,769
Amounts deducted from total net assets million yen 1,928,799
Subscription rights to shares million yen 8,260
Non-controlling interests million yen 1,920,538
Net assets attributable to common shareholders at the end of the fiscal period
million yen 15,457,970
Number of common stock outstanding at the end of the fiscal period (excluding treasury stock)
thousand shares 13,788,598
43

Mitsubishi UFJ Financial Group, Inc.
(Significant Subsequent Events) (Share Acquisition of Security Bank) The Bank of Tokyo-Mitsubishi UFJ, Ltd. (BTMU), a consolidated subsidiary of MUFG, has concluded the Subscription Agreement with Security Bank Corporation (Security Bank), a leading commercial bank in the Philippines on January 14, 2016, and on April 1, 2016, BTMU acquired 20.0% of Security Bank’s newly issued common shares and preferred shares and appointed 2 directors of Security Bank’s Board of Directors (BOD), and Security Bank became an equity method affiliate of BTMU. 1. Outline of Share Acquisition
(1) Total number of shares acquired: 150,707,778 shares of common shares 200,000,000 shares of preferred shares
(2) Acquisition rate: 20.0% of Security Bank’s common shares and preferred shares with voting rights
(3) Acquisition Price: PHP 245 per common share PHP 0.1 per preferred share (4) Investment Amount: PHP 36,943 million (5) Board Representation: BTMU has already appointed 2 directors to the Security Bank’s BOD
2. Outline of Business Alliance Leveraging both banks’ expertise and customer base, BTMU will enhance its services offered to the enlarged customer base in the Philippines through promoting the collaboration in the areas described below: <Main collaboration areas> (1) Work-site business to Japanese corporate employees (2) Trade Finance (3) Project Finance (4) Reciprocal long-term funding support (5) Capture Japan-related business opportunities including large-size projects Japanese corporates are engaged in (6) Exchange of knowledge and technological expertise (7) Explore other collaboration areas between MUFG’s key subsidiaries/affiliates companies, including leasing,
securities, and asset management.
3. Overview of Security Bank (1) Name: Security Bank Corporation (2) Type of business: Commercial Bank (3) Year of establishment: 1951 (4) Headquarters: Manila City, Republic of the Philippines (5) Representative: Mr. Alfonso L. Salcedo, Jr. President and CEO (6) Capital Stock: PHP 6,089 million (as of September 30, 2015) (7) Relationship with MUFG and BTMU:
MUFG and BTMU, on one hand, and Security Bank, on the other, do not have any capital, personal or transactional relationship that are required to be disclosed.
(8) Number of Employees: 4,014 (as of December 31, 2014) (9) Number of branches: 262 (as of January 13, 2016) (10) Business sizes (for the fiscal year ended December 31, 2015)
(in millions of PHP) Total operating income 18,308 Income before income tax 8,302 Profits attributable to owners of parent 7,536 Total assets 532,200 Net assets 53,214
(Notes) (1) The amount of “Income before income tax” is the difference between “Total operating income”
44

Mitsubishi UFJ Financial Group, Inc.
and “Operating expenses.” (2) The above figures are based on the Form 17-C of Security Bank prepared in accordance with the
Securities Regulation Code of the Philippines.
45

Mitsubishi UFJ Financial Group, Inc.
(Capital and Business Alliance of Hitachi Capital) MUFG and Mitsubishi UFJ Lease & Finance Company Limited (MUL), an affiliate accounted for under the equity method of MUFG, has concluded the Share Purchase Agreement to transfer common shares of Hitachi Capital Corporation (Hitachi Capital) held by Hitachi, Ltd. (Hitachi) on May 13, 2016 and the five companies, MUFG, The Bank of Tokyo-Mitsubishi UFJ, Ltd. (BTMU), a consolidated subsidiary of MUFG, MUL, Hitachi, and Hitachi Capital have agreed to execute a business alliance as follows. MUFG will acquire 23.0% of Hitachi Capital’s shares, subject to the execution of the definitive agreement on business alliance and approval of relevant regulatory authorities, and will appoint a director of Hitachi Capital’s Board of Directors (BOD). Hitachi Capital will become an equity method affiliate of MUFG.
1. Outline of Capital Alliance
(1) Acquisition structure: MUFG will acquire 26,884,484 shares of Hitachi Capital’s common shares (23.0%) from Hitachi, the parent company of Hitachi Capital, through off-market trading and Hitachi Capital will become an equity method affiliate of MUFG. In addition, MUFG and MUL signed the Agreement on Capital Alliance with Hitachi Capital.
(2) Acquisition Price: JPY 3,400 in common shares (3) Acquisition Amount: JPY 91,400 million (4) Implementation Date: The transaction is expected to close in August 2016, subject
to regulatory approval and other conditions precedents (5) Board Representation: MUFG will appoint a director to the Hitachi Capital’s BOD
2. Outline of Business Alliance MUFG, BTMU, MUL, Hitachi, and Hitachi Capital will make a discussion on building an open financial platform, mainly operated by MUL and Hitachi Capital through promoting the collaboration, in order to provide support for infrastructure industry from financial perspective. The areas of main collaboration are as follows: <Main collaboration areas> (1) Environment and energy (2) Urban infrastructure and public facilities (3) Real estate (4) Overseas market mainly in the Americas, ASEAN, and China
3. Overview of Hitachi Capital (1) Name: Hitachi Capital Corporation (2) Type of business: General leasing business (3) Year of establishment: 1957 (4) Headquarters: Nishi-Shimbashi Square, 3-1, Nishi Shimbashi 1-chome,
Minato-ku, Tokyo (5) Representative: Mr. Seiji Kawabe President and CEO (6) Capital Stock: JPY 9,983 million (as of March 31, 2016) (7) Relationship with MUFG:
MUFG and Hitachi Capital, on the other, do not have any capital, personal or transactional relationship that are required to be disclosed.
(8) Number of Employees: 5,397 (consolidated, as of March 31, 2015)
46

Mitsubishi UFJ Financial Group, Inc.
(9) Business sizes (for the fiscal year ended March 31, 2016) (in millions of JPY)
Gross profit 130,014 Adjusted operating income 45,230 Net income attributable to owners of the parent 32,694 Total assets 3,081,201 Total equity 347,559
(Notes) (1) The amount of “Adjusted operating income” is the difference between “Gross profit” and “Selling, general and administrative expenses.”
(2) The above figures are based on the consolidated earnings report of Hitachi Capital prepared in accordance with IFRS.
47

Mitsubishi UFJ Financial Group, Inc.
48
6. Non-consolidated Financial Statements
(1) Non-consolidated Balance SheetsAs of As of
(in millions of yen) March 31, 2015 March 31, 2016Assets:
Current assets:Cash and due from banks 71,674 160,467 Prepaid expenses 45 117 Deferred tax assets 203 307 Accounts receivable 147,935 63,428 Others 2,249 5,947 Allowance for credit losses (0) (1)Total current assets 222,109 230,267
Fixed assets:Tangible fixed assets:
Buildings 22 21 Equipment and furniture 380 412 Total tangible fixed assets 402 433
Intangible fixed assets:Trademarks 72 136 Software 8,302 9,207 Lease assets 59 38 Others 1 1 Total intangible fixed assets 8,436 9,384
Investments and other assets:Investments in subsidiaries and affiliates 10,186,842 10,186,842 Long-term loans receivable from subsidiaries and affiliates 190,000 1,586,400 Deferred tax assets 38,412 30,523 Others 172 172 Allowance for credit losses (114) (793)Total investments and other assets 10,415,313 11,803,145
Total fixed assets 10,424,152 11,812,962 Total assets 10,646,262 12,043,230

Mitsubishi UFJ Financial Group, Inc.
49
As of As of(in millions of yen) March 31, 2015 March 31, 2016
Liabilities:Current liabilities:
Short-term borrowings 1,824,447 1,703,000 Lease liabilities 21 20 Accounts payable 16,346 9,782 Accrued expenses 2,324 5,985 Income taxes payable 67 1,415 Deposits received 143 142 Reserve for bonuses 422 569 Reserve for bonuses to directors 51 105 Others 1 0 Total current liabilities 1,843,826 1,721,022
Fixed liabilities:Bonds payable 440,500 1,798,024 Long-term borrowings - 38,000 Long-term borrowings from subsidiaries and affiliates 3,938 3,826 Lease liabilities 34 14 Others 11 11 Total fixed liabilities 444,484 1,839,877
Total liabilities 2,288,311 3,560,900 Net assets:
Shareholders’ equity:Capital stock 2,141,513 2,141,513 Capital surplus:
Capital reserve 2,141,524 2,141,524 Other capital surplus 1,470,006 1,468,824 Total capital surplus 3,611,530 3,610,348
Retained earnings:Other retained earnings:
Other reserve 150,000 150,000 Earned surplus brought forward 2,682,257 2,976,603
Total retained earnings 2,832,257 3,126,603 Treasury stock (100,147) (297,385)Total shareholders’ equity 8,485,153 8,581,079
Valuation and translation adjustments:Net deferred gains (losses) on hedging instruments (135,474) (107,010)Total valuation and translation adjustments (135,474) (107,010)
Subscription rights to shares 8,271 8,260 Total net assets 8,357,950 8,482,329
Total liabilities and net assets 10,646,262 12,043,230

Mitsubishi UFJ Financial Group, Inc.
50
(2) Non-consolidated Statements of IncomeFor the fiscal year For the fiscal year
ended ended(in millions of yen) March 31, 2015 March 31, 2016
Operating income:Dividends 563,746 563,953 Management fees from subsidiaries and affiliates 22,059 24,387 Total operating income 585,805 588,340
Operating expenses:General and administrative expenses 21,411 23,655 Total operating expenses 21,411 23,655
Operating profits 564,394 564,684 Non-operating income:
Interest on deposits 413 8,043 Interest on securities 35 - Dividends 15,524 10,298 Others 1,042 990 Total non-operating income 17,016 19,331
Non-operating expenses:Interest on borrowings 13,117 13,701 Interest on bonds payable 15,063 18,410 Provision for allowance for credit losses 114 681 Bonds payable issuance cost 1,193 7,717 Others 230 436 Total non-operating expenses 29,719 40,946
Ordinary profits 551,691 543,069 Extraordinary losses:
Losses on retirement of fixed assets 53 7 Losses on impairment of fixed assets - 81 Total extraordinary losses 53 88
Income before income taxes 551,637 542,980 Income taxes-current (16,534) (2,307)Income taxes-deferred 14,771 (450)Total taxes (1,762) (2,758)Net income 553,400 545,738

Mitsubishi UFJ Financial Group, Inc.
51
(3) Non-consolidated Statements of Changes in Net Assets
For the fiscal year ended March 31, 2015
Earned surplusbrought forward
553,400
2
Treasury stock Total shareholders’equity
Net deferred gains(losses) on hedging
instruments
Subscription rightsto shares Total net assets
Net income
Repurchase of treasury stock
Disposal of treasury stock 2
(490,045)
2
553,400
(263,959)
Changes during the period
Dividends from retained earnings
Balance at the beginning of the period
subscription rights to shares Issuance of new shares-exercise of
Valuation andtranslation
adjustments
subscription rights to shares
0
Repurchase of treasury stock
Net income
Net changes of items other than shareholders’ equity
(66,249)
Balance at the end of the period (100,147)
(100,042)Total changes during the period
(135,474)
Net changes of items other than shareholders’ equity
(263,959)
8,271 8,357,950
(198,553) (66,249) (461) (265,264)
8,485,153
(490,045)
2,682,257
-
(461) (66,711)
(in millions of yen)
Shareholders’ equity
Capital surplus Retained earnings
Capital reserve Other capital surplusOther retained earnings
Other reserve
Balance at the beginning of the period
Changes during the period
Dividends from retained earnings
Issuance of new shares-exercise of
2,140,501
1,024
1,860,006
289,440
2,392,816 150,000
8,732
(263,959)
150,000
Shareholders’ equity
553,400
Capital stock
2,140,488
Total changes during the period
1,023
(390,000)
Disposal of treasury stock
1,023
2,141,513 Balance at the end of the period
Retirement of treasury stock
(in millions of yen)
Retirement of treasury stock 390,000 -
2,048 2,048
-
(390,000)
1,024
2,141,524 1,470,006
8,623,215 (105)
(490,045)
8,683,707 (69,224)

Mitsubishi UFJ Financial Group, Inc.
52
For the fiscal year ended March 31, 2016
8,357,950 8,485,153 (135,474)
150,000 2,976,603
Valuation andtranslation
adjustments
Total changes during the period (1,182)
Disposal of treasury stock
-
2,141,513 Balance at the end of the period
-
Shareholders’ equity
545,738
Capital stock
2,141,513
2,141,524 1,468,824
8,271
(251,392)
(in millions of yen)
1,470,006
294,346
2,682,257 150,000 Balance at the beginning of the period
Changes during the period
Dividends from retained earnings
2,141,524
Other retained earnings
Other reserve
(in millions of yen)
Shareholders’ equity
Capital surplus Retained earnings
Capital reserve Other capital surplus
-
(10) 28,453
(200,053)
(251,392)
8,260 8,482,329
95,926 28,463 (10) 124,379
8,581,079 Balance at the end of the period (297,385)
(197,237)Total changes during the period
(107,010)
Net changes of items other than shareholders’ equity
(1,182)
Repurchase of treasury stock
Net income
Net changes of items other than shareholders’ equity
28,463
(100,147)
Changes during the period
Dividends from retained earnings
Balance at the beginning of the period
545,738
(200,053)
(251,392)
Net income
Repurchase of treasury stock
Disposal of treasury stock 1,633
(200,053)
2,815
Earned surplusbrought forward
545,738
1,633
Treasury stock Total shareholders’equity
Net deferred gains(losses) on hedging
instruments
Subscription rightsto shares Total net assets

Mitsubishi UFJ Financial Group, Inc.
53
Notes on Going-Concern Assumption
Not applicable
7. Other
(1) Changes of Directors, Corporate Auditors and Executive Officers
Please refer to “Directors, Corporate Auditors and Executive Officers, Planned Changes and Candidates”posted on May 16, 2016 with regard to the changes of directors.