conpqnent part notice this paper is a cuvoment part …
TRANSCRIPT

(TITLE):
COnPQNENT PART NOTICE
THIS PAPER IS A CUVOMENT PART OF THE FOLLOWING COMPILATION REPORT:
Proceedings of the Internat Ion- I Conference on the Performance of
Off-Road Vehicle» and Machines (8th) Volume 2 Held at Cambridge,
England on Au«ust 5-11, 198'
(SOURCE): International So:<ety for Terr, n-Velhrle Systems
TO ORDER THE COMPLETE COMPILATION REPORT USE AD-A1'>8 635 .
THE COMPONENT PART is PROVIDED HERE TO ALLOW USERS ACCESS TO INDIVIDUALLY AUTHORED SECTIONS Of PROCEEDINGS« ANNALS, SYMPOSIA« ETC* HOWEVER, THE COMPONENT SHOULD BE CONSIDERED WITHIN THE CONTEXT OF THE OVERALL COMPILATION REPORT AND NOT AS A STAND-ALONE TECHNICAL REPORT'
THE FOLLOWING COMPONENT PART NUMBERS COMPRISE THE COMPILATION REPORT:
Ali: TITLE: POOL 283 The reaaeareh of the driving wheel with movable lugs of the
paddy field floating tractor POOL. ?8U An investigation 0 ' the driving wheel thrust of paddy field
tractors POOL 285 Mobility of the saudl combine (track type) on soft ground -
Relationship between the position of the center of gravity and the mobility
POOL 286 The stress-strain- ime graph of reheological soils and its application
POO$ 287 , Behaviour of soil inder a lugged wheel POOL 288 Prediction accuracy of the torques for rotary tillage by an
analog tool POOL 289 The analysis on the dynamic perforaance of a single lug POOL 290 Study of the aotioi of agricultural vehicles on steep grass-
covered slopes P00L ?91 See» stability and control probleaa with trailed farm tankers
on alopea POOL 292_ Control of tractort on sloping ground POOL 293' Stability indicatois for front end loaders POOL 29L Pressure tests in toil below tires of agric-lv-jral vehicles POOL 29$ (totality control in aoil coapaction by behaviour of exciter POOL 296 Smoother terrain nu chine POOL 297. Coapaction of sand using ordinary off-road vehicles POOL 296 A siaple perdictior model for soil coapaction under various
wheel loads and geeaetriee as an aid to vehicle design POOL 299 Flotation tires ant subsurface coapaction POOL 3ÖO Tractor power «election with compaction constraints POOL 301 The guideline» to resign the lever turning gears in astioulated
vehicles POOL 302 Study on controllerility and stability of high speed tracked
vehicles POOL 303 forces on undrlven, angled wheels POOL 30L Turning behaviour cf articulated fraas steering tractor
COWNENT PART NOTICE (COB'T)
AW: poou 305
P0014 306
POOU 307. pool* 308
T1TU: A tracked vehicle test plant for the simulation of dynamic operation Proffleinfluan auf Wideratands-und lenkkraft frei rollender reifen (The influence of the tyre tread on the rolling resistance and steering forces on undriven wheels) (including English translation) Basic study on the turning resistance of track Study on steerability of articulated tracked vehicles
Thfc mow—salI aas h( public »IMM and aale; In d-tnbution la ualimttsd
aaeeaslao Fer_
iris emu! T '!C TAB ".ai>nouno»d Juattfleatlon-
* o c
!»T Distribution/
i Availability Cod»a_ {Avail aad/ar
Plat I Special
k\
M
© © 0. I
9
s 675
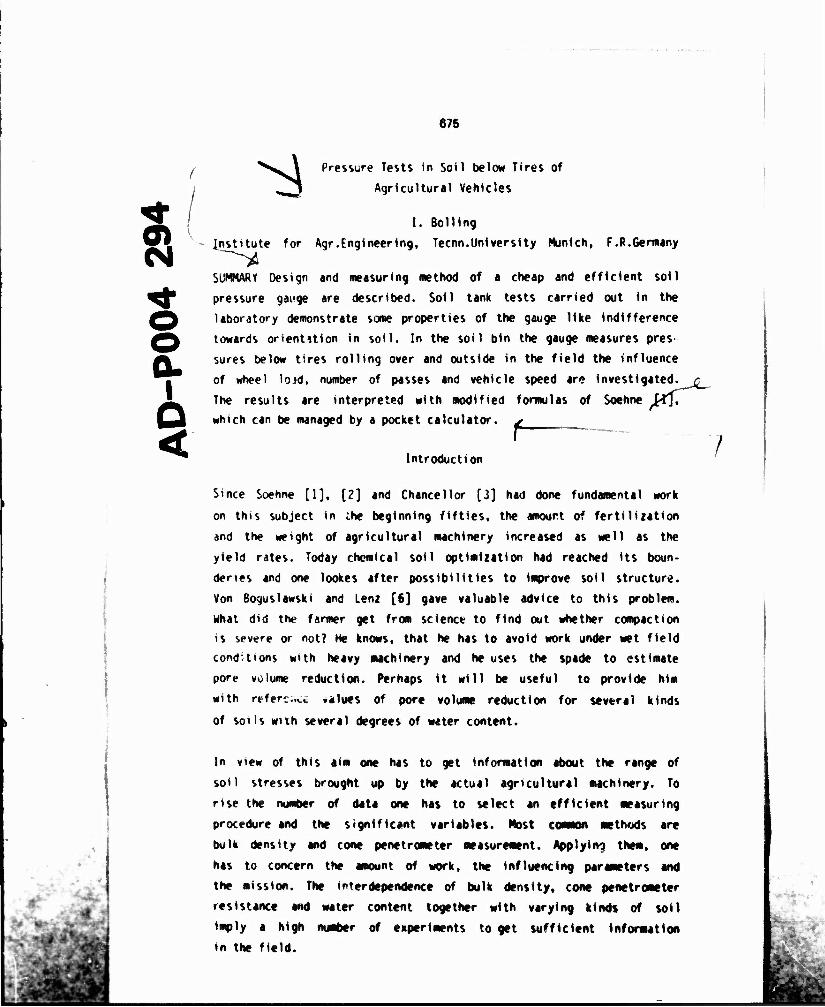
Pressure Tests In Soil below Tires of
Agricultural Vehicles
I, Boiling
institute for Agr.Engineering, Tecnn.University Munich, F.R.Germany
SUMMARY Design and measuring method of a cheap and efficient soil
pressure gauge are described. Soil tank tests carried out in the
laboratory demonstrate some properties of the gauge like indifference
towards orientation in soil. In the soil bin the gauge measures pres-
sures below tires rolling over and outside in the field the influence
of wheel loid, number of passes and vehicle speed are investigated.^
The results »re interpreted with modified formulas of Soehne Wj,
which can be managed by a pocket calculator.
f- Introduction
Since Soehne [1], [2] and Chancellor [3] had done fundamental work
on this subject in ;he beginning fifties, the amount of fertiliiation
and the ««eight of agricultural machinery increased as well as the
yield rates. Today chemical soil optimization had reached its boun-
dertes and one looces after possibilities to improve soil structure,
yon Boguslawski and Lenz [6] gave valuable advice to this problem.
What did the farmer get from science to find out whether compaction
is severe or not? He knows, that he has to avoid work under wet field
conditions with heavy machinery and he uses the spade to estimate
pore volume reduction. Perhaps it will be useful to provide him
with rfferc.^i .alues of pore volume reduction for several kinds
of soils with several degrees of water content.
/
In view of this aim one has to get information about the range of
soil stresses brought up by the actual agricultural machinery. To
rise the number of data one has to select an efficient measuring
procedure and the significant variables. Most common methods are
bulk density and cone penetrometer measurement. Applying them, one
has to concern the amount of work, the influencing parameters and
the mission. The interdependence of bulk density, cone penetrometer
resistance and water content together with varying kinds of soil
imply a high number of experiments to get sufficient information
in the field.
676
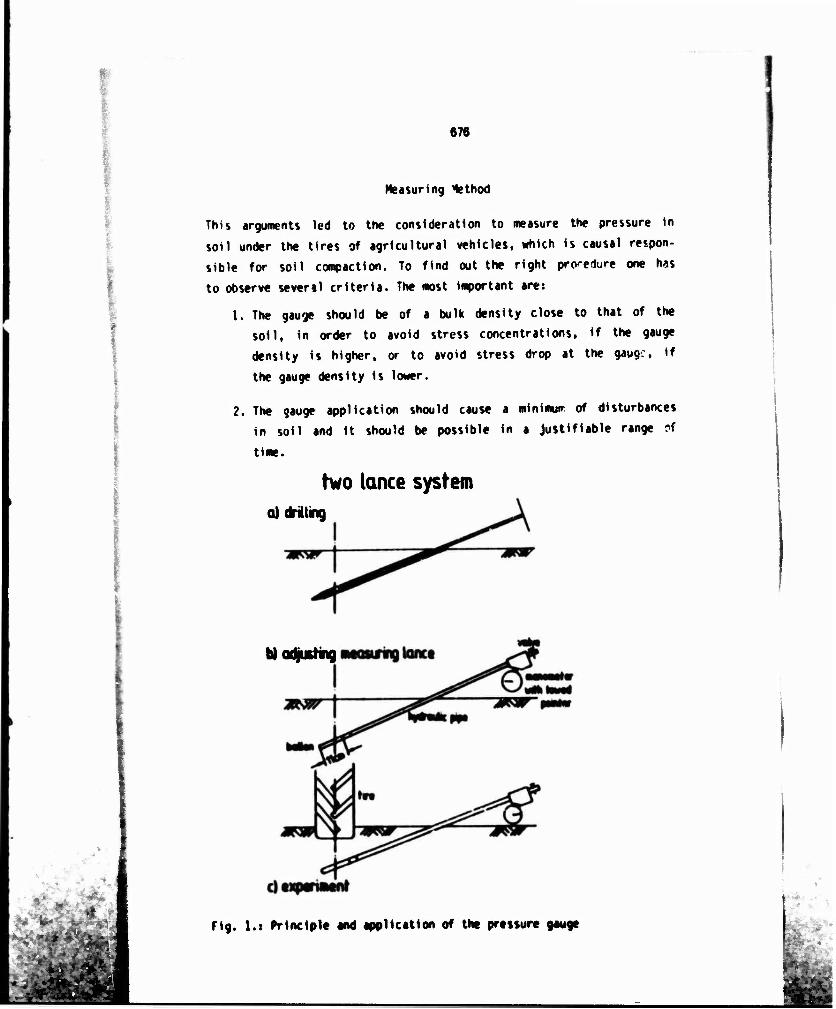
Measuring Method
This arguments led to the consideration to measure the pressure in
soil under the tires of agricultural vehicles, which is causal respon-
sible for soil compaction. To find out the right procedure one has
to observe several criteria. The most important are:
1. The gauge should be of a bulk density close to that of the
soil, in order to avoid stress concentrations, if the gauge
density is higher, or to avoid stress drop at the gauge, if
the gauge density is lower.
!
«.''■
Wß
2. The gauge application should cause a minimuir of disturbances
in soil and it should be possible in a Justifiable range pf
time.
two lance system a) drilling
b) adjusting
Fig. l.t Principle and application of the pressure 94419c
-jm

t&#.*smXMtf*mw*v>?emtt*iiii*
677
3. The gauge should measure defined stress components.
4. The gauge should be able to record the pressure during tire
operation, to ge*. Information about dynamic effects.
5. Inexact gauge orientation in sell should cause minimum errors.
6. To use many gauges at the same time the costs must not be high.
Viewing the literature to this subject many valuable advices have been
found for example In the works of Berdan [4], Cooper [5], Hovanesian
[7], Barnes [8] and Blackwell [12]. The compromise made to observe
most of the shown main criteria represents fig. 1:
1
A hole inclined about 15° - 20° to the surface is drilled into the
soil, in which a pipe is pushed. A ballon with walls being 0,5 mm
thick, a length of 11 cm and a diameter of 2 cm is turned out of
the pipe by an air pump. Now the system is filled with water. This
causes a gauge density of 1 g/cm*.
one lance systems a) outer protecting ppt
b) nner supper ting pipe
«£~— —~ 1 I ] i§7 /
Fig. ?i Designs of one lance systems for simplified soil
pressure gauge application 4
?*■■■ mm. ■m^mwPH
lS*3

678
1 If a mixture of water and magnesium dlchlorlde is used, higher densi-
ties are possible. With other fluids gauge densities between 1 and
ü g/cm* are conceivable, to accommodate gauge and soil density. When
the air bubbles are pushed out of the system, the valve is closed
and the experiment starts. When the tire rolls over the gauge, the
pressure in the system rises. The maximum value can be recorded by
a manometer with towed pointer or one can apply a usual pressure
gauge with recording system to measure dynamic processes. To Improve
the handling abilities of this measuring principle, it was tried
to design one lance systems shown In fig. 2. Here the three steps
in fig. 1 are combined: The cone forms the hole In soil and when the
protecting or supporting pipes are retracted, th» fluid filled sili-
cone hose with a wall thickness of 1 mm gets flexible similar to
the ballon. The most significant advantage of the one lance system
is, that turning out the proper gauge and filling the system with
fluid 1s not necessary. Later more details will be described.
2 4 (Aalt untagt i
Fig. 3: Testing the pres-
sure gauge In a
Mil tank with sandy low
of different dry densities
'•m #**< ,

679
First the properties of the two lance system should be shown. In
fig. 3 the curves of the soil pressure p« in the gauge are plotted
against the slnkage z of a circular plate moving into a tank with
sandy loam of different densities. Increasing plate pressures p
cause increasing gauge pressures p.. With the bulk density the final
values at i * 10 cm of p and of p. rise, whereas the caracterlsties
of the curves don't change. (The water content was 15 %.)
Fig. 4 gives evidence of the tests varying the inclination (X of
gauge and pipe. The influence Is of the order of the variations caused
by soil preparation. The reason may be, that the gauge is exposed
to the varying
Fig. 4: Influence of gauge
inclination fj on
the measured pressure p.
In a soil tank with sandy
loam
pml5gfctfl
sandy loan w=15%
-vtf ̂ ^
as* *a. SB**
uUi &£ ■/4"
Ofasto
,//''
t£ /'
8 an 10 0 2 4 6 platt smkagt z
stresses on its surface and the manometer shows the mean value of all
of them. So turning the cylindric gauge body round Its center of
gravity is of almost no effect in the range 0° < a S 40°. This fact
is of advantage during work in field, because the rough terrain causes
considerable errors of the measurement of the angle of inclination d .
Therefore one always has to excavate the gauge in field after the test
to determine its real depth below the surface.
The record of the gauge pressure p. during the roll over of a tire is
plotted in fig. S against the position * of u* tire relative to the
gauge. pR starts with wro.when the tire is half a meter awcy from
the gauge. It reaches the maximum, when the center of the tire is
over the gauge but does not decrease in the same manner. The remai-
ning pressure of 0.2S bar at x • 60 on reduces to values of about
0,1 bar after some minutes and then does not change for longer time.
* •*" '.""

680
45 OR 60 -» -15 «15 (Mtftai af NM Mrt i
Fig. 5: Record of soil pressure pg below a tire rolling over in the
soil bin of the Institute for Agricultural Engineering of the Techn. Univ. of Munich
Fig. 6: Approximating the distribution of the
wheel load G in the contact
area of the tire by three
single loads G,, Gj, G, r—h Before field tests were aede, it was Investigated whether the one
lance systea {fig. 2a) could be used. Fig. 7 snows the insufficient
result: The cavity caused by retracting the protecting pipe has to
be filled up with coapacting soil and therefor« up to a sinkage
I • 2 ca no signal P8 is Measured. Afterwards pg is euch higher than
that Measured with the two lance systea, surely because the steel
cone and the silicon tube are suffer t>»an the ballon and concen-
trate stresses on the gauge. The one l«*e systea with supporting
pipe (fig. 2b) has not yet been tested, but obviously this systea
avoids the problem arising with the cavity around the gauge.

681
Flg. 7: Pressure p. in sandy j| ■§.
loa« in a soil tank, 0,8
measured with the one lance
system (fig. 2a) and the two 0
lance system (fig,1) 2 4 6 Ben 10 plate smkage z
Summarizing the important properties of the two lance system in
fig. 1 one can say:
1. The bulk density of the gauge can be fitted to that of the
surrounding soil by using the right fluid. (For this first
tests only water was used).
?. Gauge application causes disturbances in soil as far as the
drilling of the hole is concerned. The amount of time for one
application is less than IS minutes.
3. The gauge does not measure defined stress components in the
soil, but on the other hand
4. the gauge orientation causes minimal errors. So only the com-
pirison of results is possible at present.
5. Using pressure gauges In spite of manometers one is able to
record dynamic processes like the roll over of a tire.
6. The costs of the gauge are of an amount of about 200 • 300 DM,
if a manometer is used. (The valve was built with acryl glass,
to be able to observe air bubbles rising in the pipe, when the
fluid is filled in.)
mwi-) A* J r^e%meeaat; Hmi.-
j,,.^,::^:.;;.^^,.^';*^-';;^-
-
# -■*& 'S C _j■*_.._**--:
,? Jfc
682
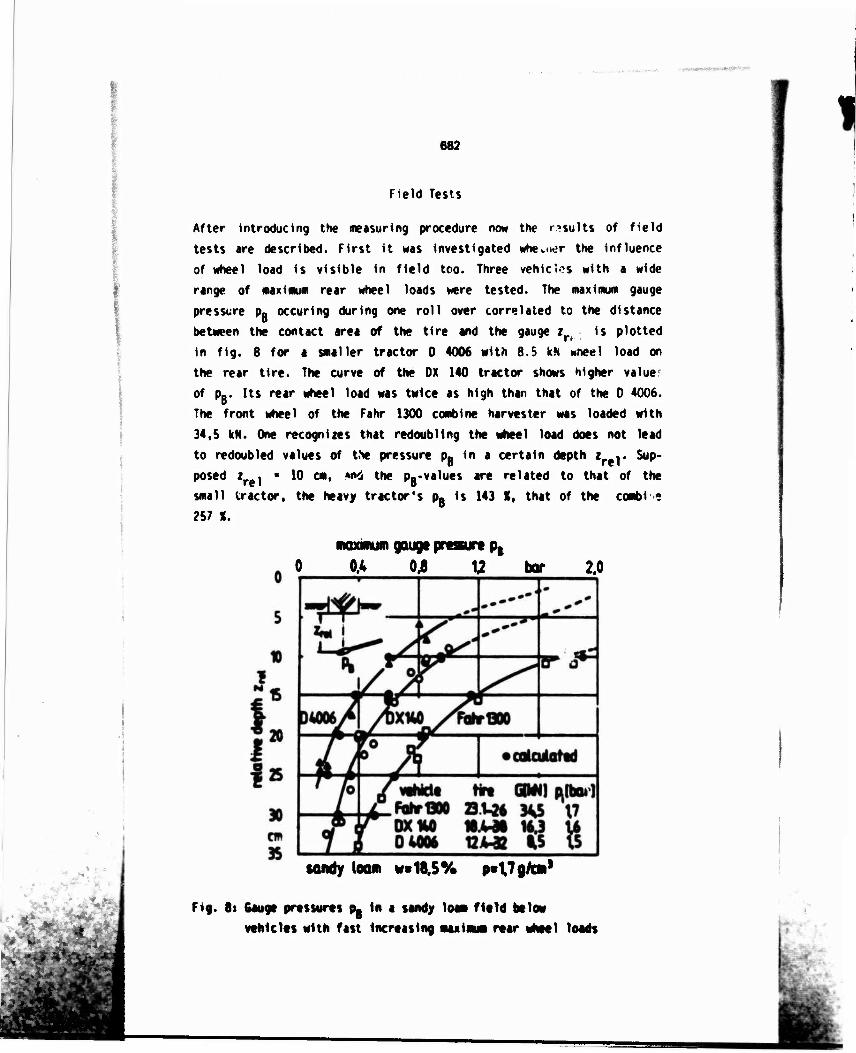
Field Tests
After introducing the measuring procedure now the results of field
tests are described. First it was investigated whcner the influence
of wheel load Is visible in field too. Three vehicles with a wide
range of maximum rear wheel loads were tested. The maximum gauge
pressure p- occur ing during one roll over correlated to the distance
between the contact area of the tire and the gauge z is plotted
in fig. 8 for a smaller tractor 0 4006 with 8.S kH «neel load on
the rear tire. The curve of the OX 140 tractor shows higher value
of p«. Its rear wheel load was twice as high than that of the 0 4006.
The front wheel of the Fahr 1300 combine harvester was loaded with
34,5 kN. One recognizes that redoubling the wheel load does not lead
to redoubled values of t.Ne pressure p. in a certain depth i y Sup-
posed z j ■ 10 cm, *n4 the pg-values are related to that of the
small tractor, the heavy tractor's pfi 1s 143 *, that of the combi i
257 t.
maximum gauge pressure pB
0 0,4 0,8 1; bar 2.0
sandy lean ¥«18.5% p«T.7g/c»J
Fig. 8: Gauge pressures pB In a sandy loam field below
vehicles with fast Increasing maximum ntr wheel loads
f *

683
tire
"*—"6 MUM
M+ Fig. 9: Approximating the dis-
tribution of the wheel
load 6 in the contact area of
the tire length 1 by five
uniform single loads 6Q
■■* -.\
~-
MSs^
As Raghavan [9, 10, 11, 14, 15] pointed out, besides wheel load the
number of passes is of essential Influence on compaction. Fig. 10
shows the sinkages i., *,, «10 of a tractor after the 1st, 5th and
10th roll over in the same rut. The amount of the maximum gauge pres-
sure pB increases fro« the 1st to the 5th roll over more intensive
than from the 5th to the 10th. This multi-pass effect on p. Is depen-
dent on the initial pore volume P.V. of tte field. Fig. 11 shows
the influence of vehicle U
15 20 25 absolute depth
Fig. IOI Gauge pressures p. in a field with sandy 1
after one, five and ten passes
,*■,■' -StWVin.i« W '«*"?*-r--*iSS 1* '''"t * " f ■ :^'-';'-(" r
684
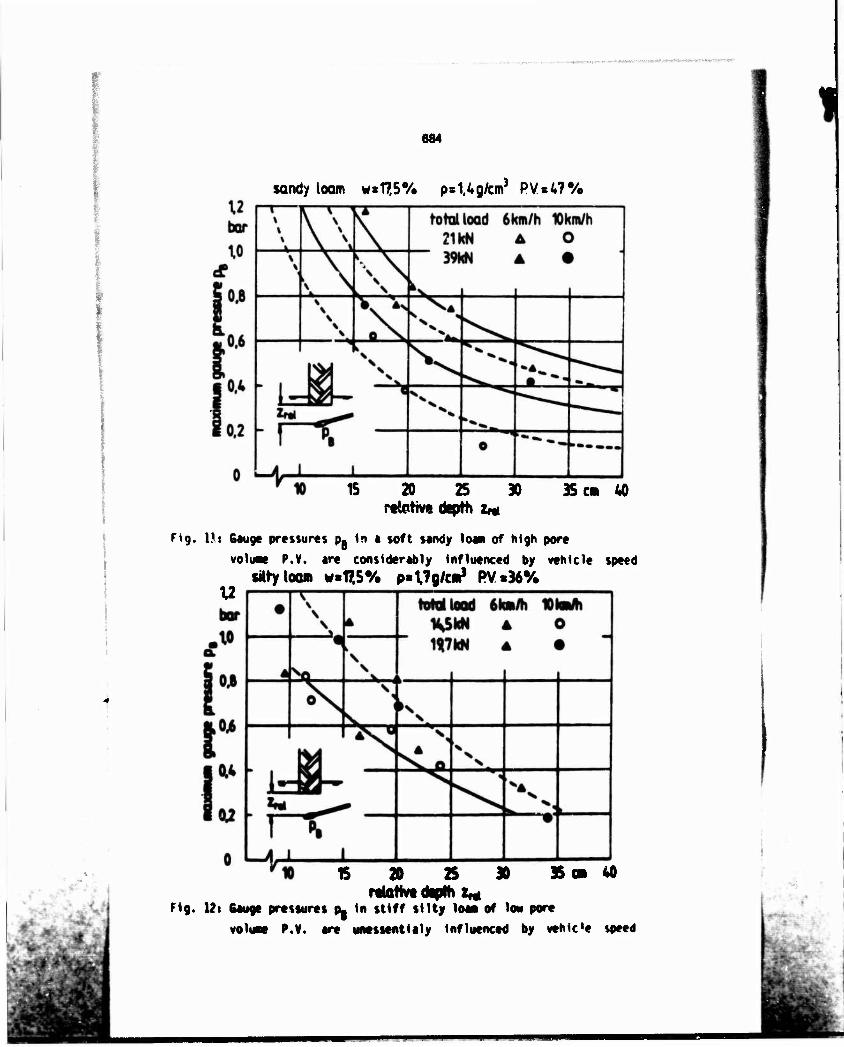
sandy loam wsT?,5% ps1,4g/cm3 PVs47%
15 20 25 30 Ptlctivi depth Zrti
35 c» 40
Fig. Ut Gauge pressures pB in • soft sandy low of high pore
volume P.V. are considerably influenced by vehicle speed titty loon v«17,5% p«l7g/cmJ PY«36%
12
15 20 25 30 3S« 40 rttativt dtptti z^i
Fig. l?t Gauge pressures p. in stiff silty loan of »on pore
votuae P.V. ere unessentialy influenced by vehic'e speed
1
*mgmmm~**i'*mmm*

p*&
888
speed in a soft sandy loam with high pore volume P.V. » 47 % and a
dry density of p« 1.4 g/cm'. Increasing speed reduces the values
of pB. If one compares this results with those of a silty loam with
higher initial dry density p- 1,7 g/cm' and a smaller amount of Initial
pore volume P.V. ■ 36 X in fig. 12, one realizes, that only wheel
load makes an effect, if the pores filled with air are of considerable
smaller amount. So in the silly loam field the Influence of vehicle
speed Is not visible. Both soils had a water content of about 17,5 X.
Soltynskl [13] and Stafford [16] have found similar tendencies by
investigating the increase of bulk density in soil below tires rolling
over.
This view on some field tests should have demonstrated, that the
Introduced gauge 1s useful to compare the Influence of different
vehicle weights, speeds and numbers of passes on soil compaction.
First Simple Analytical Analysis
Now it Is tried to apply the formulas stated by Soehne [1]. The verti-
cal stress in a depth i j below the load axis of a circular
plate of radius r with uniform load distribution p In a soil with
the stress concentration factor vis (cf. fig. 3)t
o,«|y(l-cosvß) (1)
cosß« (2)
-:*
-
xJÜ4ä&
9 * ??&.
0 1s not identical with the pressure measured by the gauge. But
we know, that 0, Is the highest stress component appearing at the
gauge. The stresses 0f together with all other, smaller stress compo-
nents acting on the fluid ft Hod cylindrical ballon, produce a mean
stress PB in it. Therefore on can statei
^■C-«, 0«C«1 O) If the plate pressure p Is expressed by the formula describing plate
linkage tests«
Htf <«>
■■P
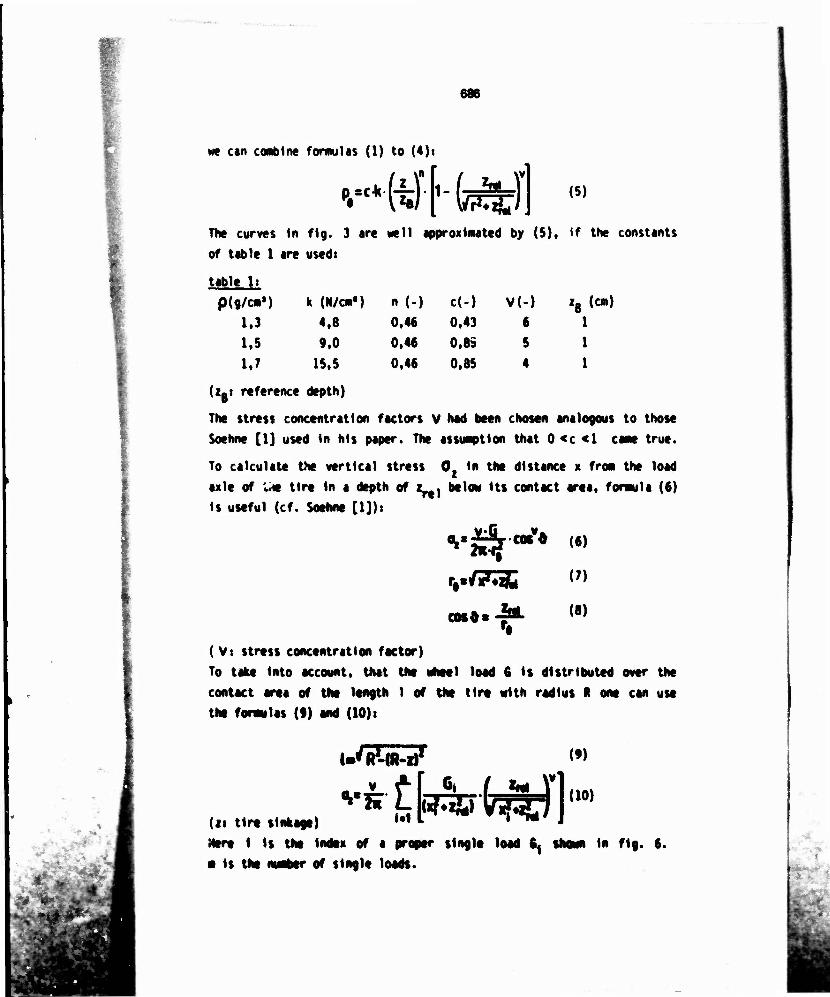
we can combine formulas (1) to (4):
P. (5)
The curves In fig. 3 are well approximated by (5), If the constants
of table 1 are used:
table It
p(9/cm») k (N/cma) n (-) c(-) V(-) iB (cm)
1.3 4,8 0,46 0,43 6 1 1.5 9,0 0,46 0,8a 5 1 1.7 15,5 0,46 0,85 4 1
(igt reference depth)
The stress concentration factors V had been chosen analogous to those
Soehne [1] used (n his paper. The assumption that 0 <c <1 came true.
0 In the distance x from the load To calculate the vertical stress
axle of ;.* tire In a depth of i , below Its contact area, formula (6)
Is useful (cf. Soehne [l])i
..*4. V£jW*
«•■
CM««
(6)
(7)
(8)
(Vi stress concentration factor)
To take Into account, that the 1 load 6 Is distributed over the
contact area of the length 1 of the tire with radius R one can use
the formulas (t) and (10)t
l-'tf-IR-i) r
Ut tire sinkaee)
Mere I is the index of a proper single load 6,
m is the number of single loads.
(t)
(10)
in fig. f. *
-

687
Regarding (3) we get the term for the gauge pressure pB:
*» w.
i«l
(11)
(12)
In fig. 5 the results for m-1, me3 and m*6 are shown for the distances
x * -30 cm, -15 cm and x ■ 0 cm. The wheel load 6 was divided up
into uniform single loads G,. The constants c resulting from the
calculations with a different number m of single loads shows table 2:
table 2:
m (-) 6, (N) c (-) V(-) 1 15 000 0,31 5 3 5 000 0,48 5 6 2 500 0,48 5
Vwas set to 5, because the soil bin was filled with the same sandy
loam used for the soil tank tests (fig. 3). The mean density In the
bin was p* 1,5 g/cm' and the water content (dry base) w « 15 %.
Fig. 5 shows, that the step from m-1 (1 single load) to m-3 (3 single
loads) improves the result of the calculation significantly, but
not the step from m«3 to m-6. In the latter case also c does not
change. Perhaps a better fit would be reached, If the wheel load
G is divided up along the contact length 1 and along the tire width B
Into single loads. The lower constants c compared with those of the
soil tank tests (table 1) are Imaginable, if one takes into account,
that in the tank with a diameter of 0,4 m soil flow in horizontal
direction is more hindered by the side walls of the tank than in
the soil bin where the walls have a distance of 2.5 m. So the small
main stresses in the tank will be greater than In the soil bin.
At last the field tests of fig. 8 vt discussed. Because tires trt
concerned, the formulas (6) to (12) are used for the analysis. The
sandy loam had a dry density of 1,7 g/cm* and a water content of
18,5 f. Therefore a stress concentration factor V • 4 was assumed.
The wheel loads acting on the rear tire were divided up Into five
uniform single loads 6Q applying the experiences made with the evalua-
tion of the soil bin tests. For different depths *re) the pressures
p. in the load axle were calculated.
aSEßß'
mm —S ■M^HMi mm *mn

688
Formula (11) for this purpose becomes:
P.sC V
2n
(13)
If sjmoetry is taken Into account { cf. fig.
WK*
9 ), we get:
2 i . 2 / i« r 2 yy (14)
(15)
Table 3 shows the constants used for the calculations and in fig. 8
the resu its are plotted.
table 3:
tire rear wheel sink age tire length of single load
load radius contact . irea distance
6 (kN) l (cm) R (cm) 1 (cm) x (cm)
12.4-32 8,5 7,25 69,75 31,0 7,75
18.4-38 16,3 8,83 89,75 39,0 9.75
21.3-26 34,5 12.25 83,00 43,4 10,85
Best fit was achieved by putting c ■ c~ ■ 0,36 in formula (14). Com- pared with the value of c calculated for the soil bin test (fig.
5) c$ ■ 0,48 in the field c was lower. This short view on mathematical description shows, that the formulas
stated by Soehne [1] need only the modification with the factor c,
to regard the gauge properties. Surely this few results are not
adequate to give evidence about all aspects of the constant c, but
i'» is encouraging to see, that just simple assumptions for the calcu-
lations yield good fit. Further tests, easy to do with the described
gauge, will show more about the parameters influencing c. Especially
the correlation between c, stress concentration factor V , dry density
pand the water content w should be investigated.
Conclusions
-*
A cheap and handy gauge to measure pressures In soil below tires
and pressure plates was introduced. The Influence of soil density
and gauge inclination on the measured pressures was shown. Tests
in the soil bin proved, that the gauge can be applied in dynamic

669
tests. The problems ai isin j by simplifying the test mode with one
lance systems Mere demonstrated. In spite of the wall thickness of
0,5 mm making the inherent stiffness of the ballon negligible, several
missions in field showed, that the gauge is sturdy enough for scientific
purposes. Variation of wheel load, number of passes and vehicle speed
yielded well distinguishable results. Some of them could be described
by the well known formulas of Soehne [I]. Modifying them by a factor
c and taking simple assumptions about load distribution In the contact
area of the tires, led to results encouraging to further tests,
yielding more details about this type of pressure gauge.
literature:
[1] Sohiie, w.:
[«]
C^uckverteilung im Boden und Sodenverformung unter Schlepperreifen. Grundlagen der Landtechnik 5(1953) p. 49/63
Untersuchung der Verdichtbarkeit einiger kalifor- nischer Böden, detailed Internal report according to [3]
Chancellor, H.J.; R.H. Schmidt, W.H. Söhnet Laboratory Measurement of Soil Compaction and Plastic Flow. Trans.ASAE (1962) p. 235/246
Berdan, 0. and R.K. Bernhardt Pilot Studies of Soil Density Measurements by Means of X-Rays. Proc.Am.Soc. for Testing Mat. 50(1950) p. 1328/1342
[2] Sohne, y.
[3]
[5] Cooper, A.M. et.al.t Strain Gage Cell Measures Soil Pressure. Agric.Eng. April 1957, p. 232/235
[6] von Bogutlawski. F. and K.O. Lenz: Die Ertragsbildung in Abhängig- keit von Porenvolumen und Bodenwiderstand. Vorl.Mitteilg. aus dem Inst. f. Pflanzenbau und Pflanjemuchtung der Justus-Hebig-Univ., Sept. 1959
[7] Hovanesian, J.O. and W.F. Buche let Oevelopement of a Recording Volumetric Transducer for Studying Effects of Soil Parameters on Compaction. Trans.ASAE (1959) p. 78/81
[8] Barnes, K.K.t Compaction of Agricultural Soils. ASAE Monograph (1971) 2950 Miles Road. St. Joseph Michigan 49085
[9] Raghevan, G.S.V. et.al.t Prediction of Clay Soil Compaction. Jour, of Terraaech. 14(1977)1, p.31/38
[10] Reghavan, G.S.v. et.al.t Effect of Wheel Slip on Soil Compaction. Jour, of Terramech. 22(1977)1, p. 79/83
[11] Raghevan. G.S.V. and £. McKyest Effect of Vehicular Traffic on Soil Moisture Content in Com (Mawe) Plots. Jour, of agnc. Eng.tes. (1978)23, p.429/439

690
[12] Blackwell, P.S. «nd B.D. Soane: Daformable Sphe» if-?1 Devices to measure Stresses within Field Soils. Jour, of Terramech. 15(1978)4, p. 207222
sThe Mobility Problem in Agriculture. Jour, of Terramech. 16(1979)3, p. 139/149
G.S.V. et.al.s Vehicular Traffic Effects on Oevelope- ment and Yield of Corn (Maize)> Jour, of Terramech. i6(1979)2, p. 69/76
[15] Raghavan, G.S.V. et.al.: Traffic-Soil-Plant (MtUe) Relation« Jour, of Terramech. 6(1979)4, p. 181/189
[16] Stafford, J.V. and P. de Carvalho Mattos: The tfua of Forw;M Speed on Wheel-induced Soil Compacti m: Laborat. , Simulation and Field Experiments. J.agric.Engng.Res. (1981)26, p. 333/»47
[13] Soltynskis A.
[14] Raghavan,
f\
st -
•