connecting process and form: new results on scaling and implications for modeling and prediction in...
TRANSCRIPT

Connecting Process and Form:New Results on Scaling and Implications for Modeling
and Prediction in Ungauged Basins
Efi Foufoula-Georgiou
University of Minnesota
GrenobleNovember, 2006
HYDROLOGY AND EARTH-SURFACE DYNAMICS RESEARCH
@
SAFL and NCED
Efi Foufoula-Georgiou
St. Anthony Falls Laboratory (SAFL)National Center for Earth-Surface Dynamics (NCED)
Department of Civil Engineering
University of Minnesota
HYDROLOGY AND EARTH-SURFACE DYNAMICS RESEARCH
@
SAFL and NCED
Efi Foufoula-Georgiou
St. Anthony Falls Laboratory (SAFL)National Center for Earth-Surface Dynamics (NCED)
Department of Civil Engineering
University of Minnesota

SAFL’s goal is to advance the knowledge of environmental hydrology and hydraulics, turbulence, earthscape evolution, and climate/ ecosystem dynamics via high quality experimental, theoretical and computational research.
Transfer this knowledge to the engineering community and to the public through applied research and outreach activities
St. Anthony Falls LaboratoryUniversity of Minnesota (1938-present)
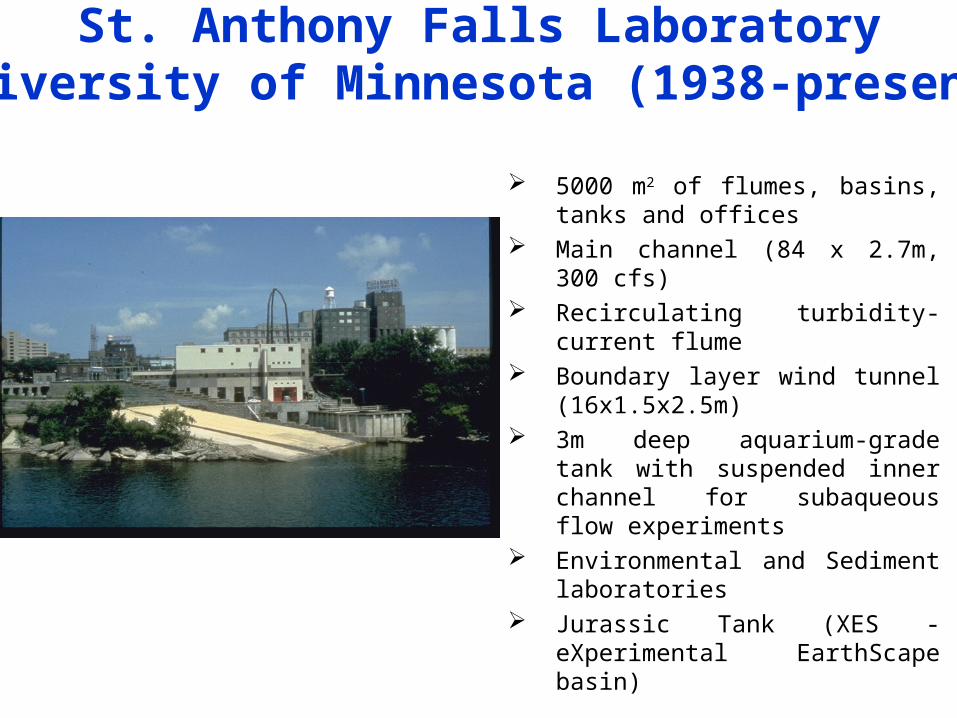
St. Anthony Falls LaboratoryUniversity of Minnesota (1938-present)
5000 m2 of flumes, basins, tanks and offices
Main channel (84 x 2.7m, 300 cfs)
Recirculating turbidity-current flume
Boundary layer wind tunnel (16x1.5x2.5m)
3m deep aquarium-grade tank with suspended inner channel for subaqueous flow experiments
Environmental and Sediment laboratories
Jurassic Tank (XES - eXperimental EarthScape basin)
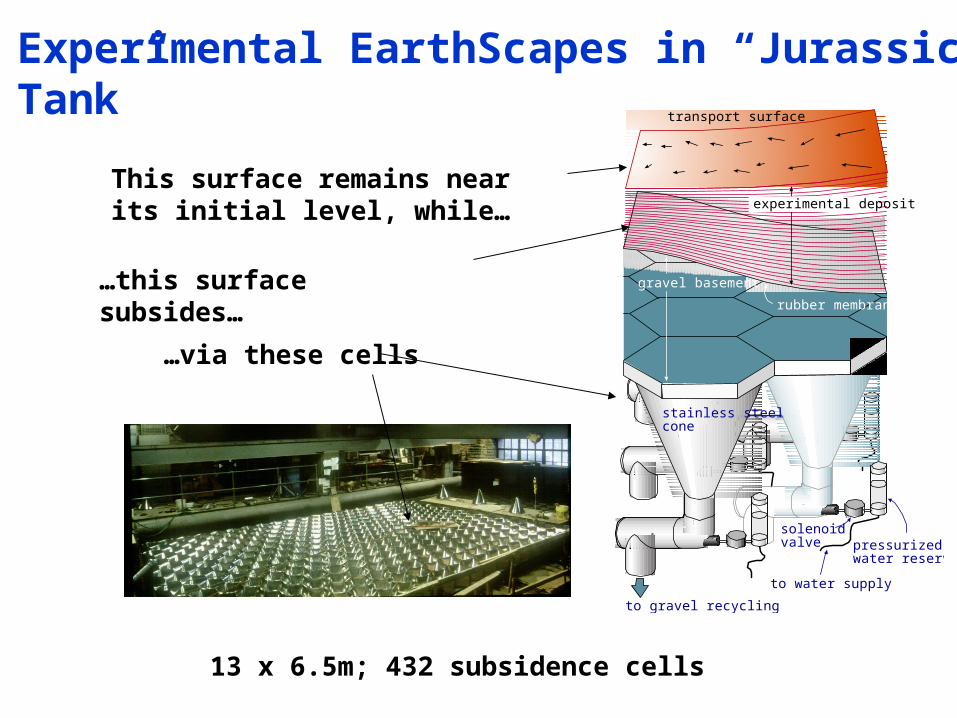
Experimental EarthScapes in “Jurassic Tank”
pressurizedwater reservoir
to water supply
solenoidvalve
stainless steelcone
to gravel recycling
transport surface
gravel basement
rubber membrane
experimental deposit
This surface remains near its initial level, while…
…this surface subsides…
…via these cells
13 x 6.5m; 432 subsidence cells

Experimental EarthScapes in “Jurassic Tank”
Stratigraphy, Morphodynamics, Continental Margins
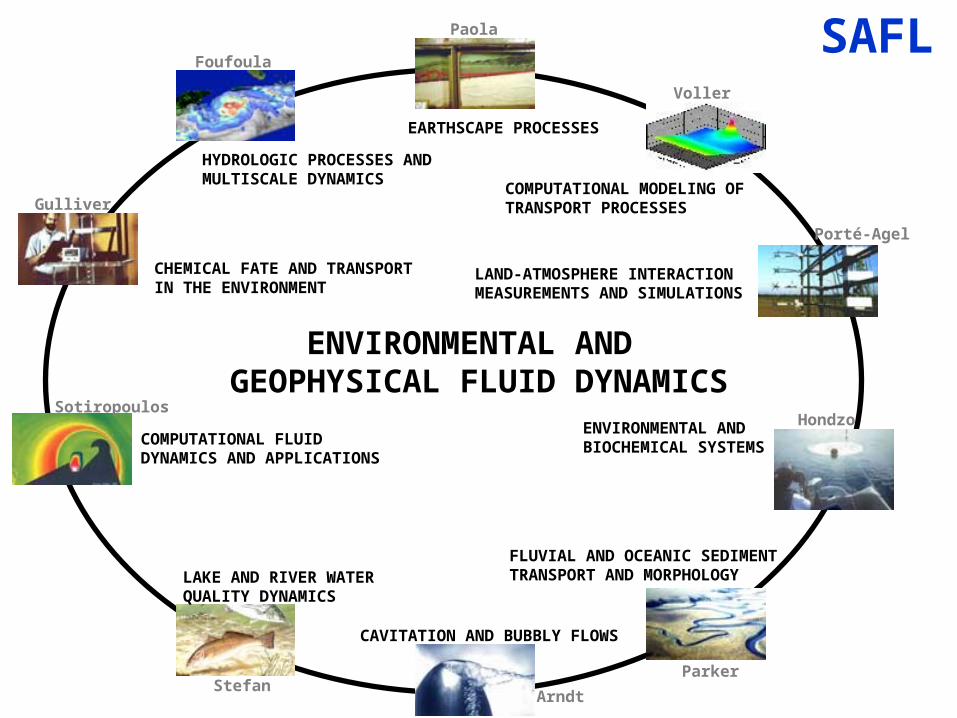
Foufoula
Paola
Voller
Porté-Agel
Gulliver
Sotiropoulos
StefanArndt
Parker
Hondzo
CAVITATION AND BUBBLY FLOWS
FLUVIAL AND OCEANIC SEDIMENTTRANSPORT AND MORPHOLOGYLAKE AND RIVER WATER
QUALITY DYNAMICS
COMPUTATIONAL FLUID DYNAMICS AND APPLICATIONS
CHEMICAL FATE AND TRANSPORTIN THE ENVIRONMENT
HYDROLOGIC PROCESSES ANDMULTISCALE DYNAMICS
EARTHSCAPE PROCESSES
ENVIRONMENTAL AND BIOCHEMICAL SYSTEMS
LAND-ATMOSPHERE INTERACTIONMEASUREMENTS AND SIMULATIONS
COMPUTATIONAL MODELING OFTRANSPORT PROCESSES
ENVIRONMENTAL AND GEOPHYSICAL FLUID DYNAMICS
SAFL

The St. Anthony Falls Laboratory is involved in a wide variety of APPLIED RESEARCH AND ENGINEERING projects commissioned by government agencies, private companies, and consultants. These projects span the areas of river modeling for environmental protection and restoration; water and wastewater treatment; water quality of lakes, rivers and reservoirs; hydropower plants and hydraulic structures; wind engineering; and various performance and calibration testing.
WATER AND WASTEWATER TREATMENT
AERATION TECHNIQUES
HYDROPOWER ENGINEERING
HYDRAULIC STRUCTURESSURFACE WATER QUALITY RIVER ENGINEERING
WIND ENGINEERING
CALIBRATION AND PERFORMANCE TESTING
SAFL
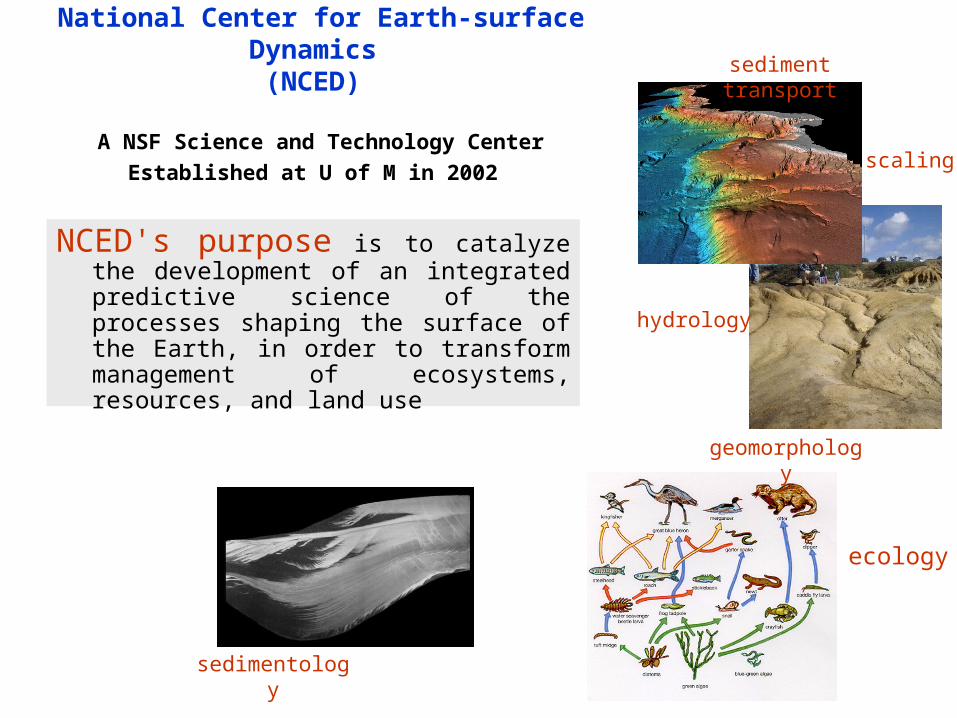
sedimentology
ecology
hydrology
geomorphology
sediment transport
scaling
National Center for Earth-surface Dynamics
(NCED)
A NSF Science and Technology CenterEstablished at U of M in 2002
NCED's purpose is to catalyze the development of an integrated predictive science of the processes shaping the surface of the Earth, in order to transform management of ecosystems, resources, and land use

GCMs predict a reduction of precipitation here. How will the system respond (sediment yield, hydrology, ecosystem, landsliding…)?
Landscape and ecosystem response to extreme stress
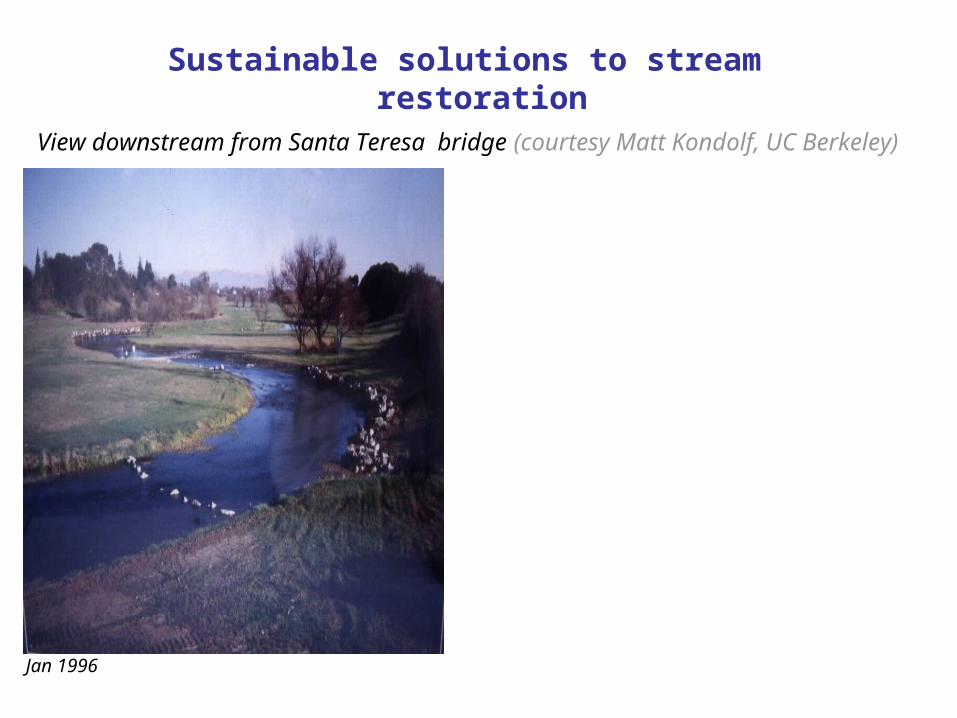
View downstream from Santa Teresa bridge (courtesy Matt Kondolf, UC Berkeley)
Jan 1996
Sustainable solutions to stream restoration

Jan 1996 July 1997 – After flood of Feb 1996
Could this have been prevented?
View downstream from Santa Teresa bridge (courtesy Matt Kondolf, UC Berkeley)
Sustainable solutions to stream restoration
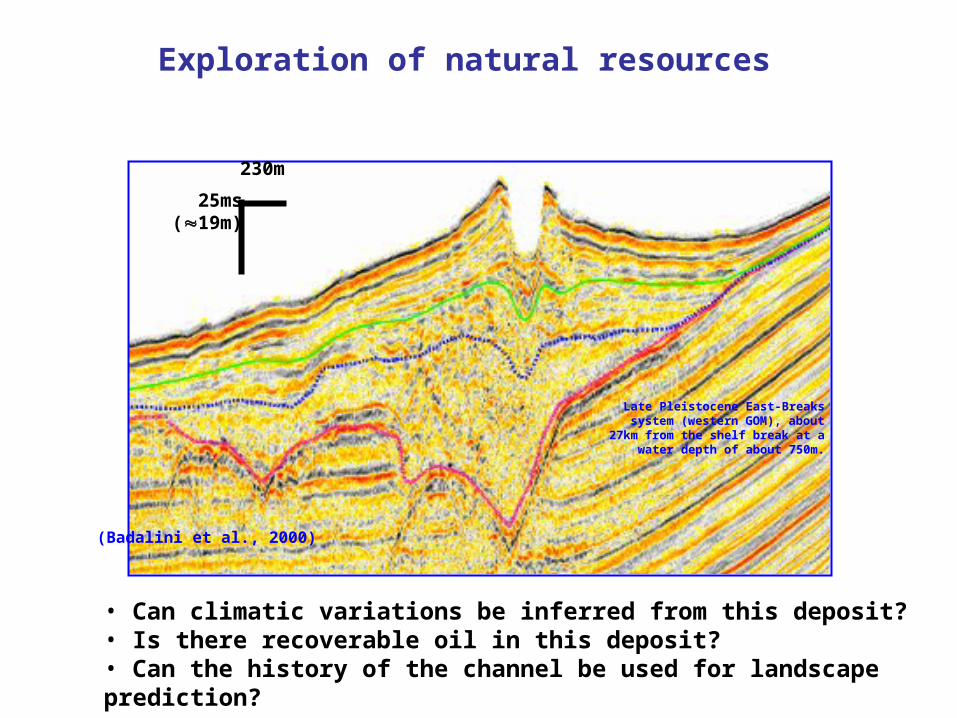
• Can climatic variations be inferred from this deposit?• Is there recoverable oil in this deposit?• Can the history of the channel be used for landscape prediction?
230m
25ms(19m)
Late Pleistocene East-Breaks system (western GOM), about 27km from the shelf break at a water depth of about
750m.
(Badalini et al., 2000)
Exploration of natural resources

University of Minnesota (SAFL)
University of California, Berkeley
University of Colorado, Boulder
Fond du Lac Tribal and Community College
University of Illinois, Urbana/Champaign
Johns Hopkins University
Massachusetts Institute of Technology
Princeton University
Science Museum of Minnesota
Participating Institutions
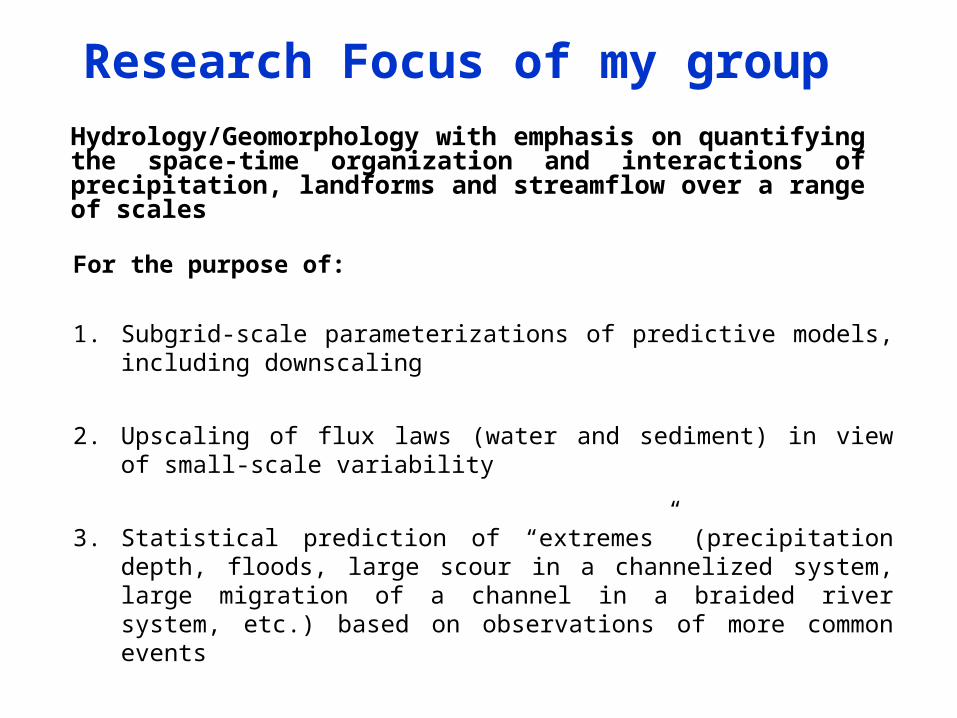
Research Focus of my group Hydrology/Geomorphology with emphasis on quantifying the space-time organization and interactions of precipitation, landforms and streamflow over a range of scales
For the purpose of:
1. Subgrid-scale parameterizations of predictive models, including downscaling
2. Upscaling of flux laws (water and sediment) in view of small-scale variability
3. Statistical prediction of “extremes” (precipitation depth, floods, large scour in a channelized system, large migration of a channel in a braided river system, etc.) based on observations of more common events

Current Research 1. Precipitation (NASA, NSF)
Multiscale characterization and downscaling methodologiesMultisensor estimationNWP model verification and quantification of forecast prediction
uncertainty via ensembles
2. Hydro-geomorphology (NSF)Evolution of braided river systemsChannel/floodplain dynamics and effect on hydrologic response Process signatures in high resolution topography
3. Atmospheric boundary layer turbulence (NASA, NSF)
Subgrid-scale parameterizations and LES closuresStable boundary layer
Connecting Process and Form:New Results on Scaling and Implications for Modeling
and Prediction in Ungauged Basins
Efi Foufoula-Georgiou
SAFL, NCED
University of Minnesota
GrenobleNovember, 2006

1. How much of the physical/mechanistic behavior of the coupled hydrologic/geomorphologic system is reflected in the observed statistical patterns of landscapes and streamflows?
2. Are statistical patterns distinct across physical boundaries and how can they be used in assisting modeling, prediction and observatory design across scales and across environments?
3. Where/what to sample to get the most out of a limited number of observations?
Overarching Questions

MAIN MESSAGES
1. Physical processes do leave important signatures on the statistics of landscapes and streamflows and thus provide a powerful means of inference
[to guide modeling and observatory design, to further pose and test hypotheses, etc . . .]
2. High resolution topography offers new opportunities for connecting process and form at an ever increasing range of scales
[hillslope to watershed scales, explicit extraction of channel heads, verification of mechanistic transport laws, spatially-distributed hydrologic modeling, etc…]
Examples to discuss
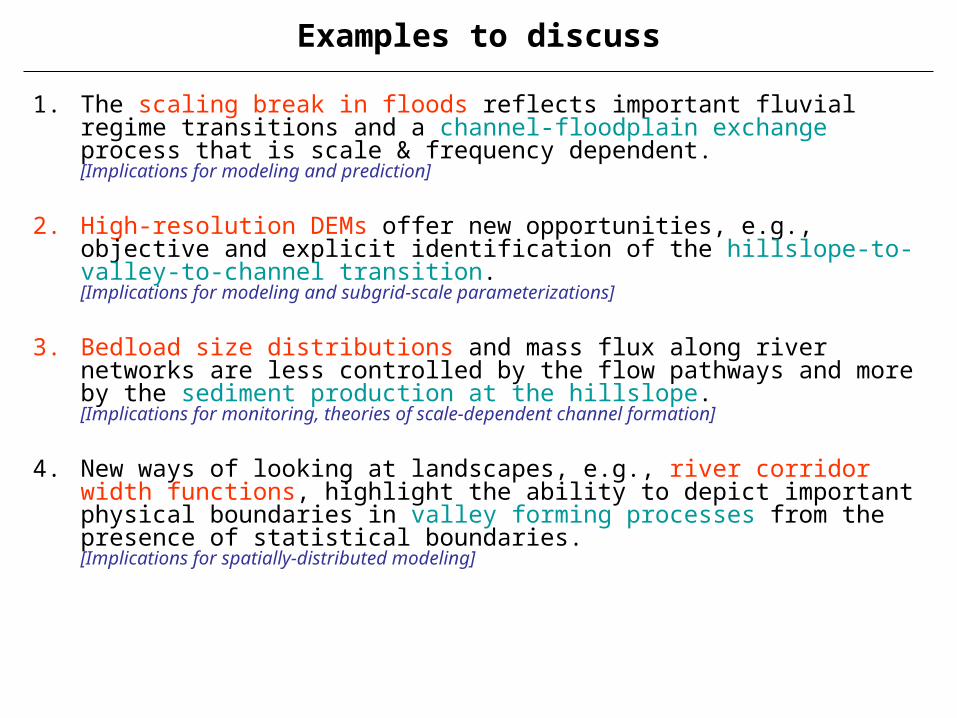
1. The scaling break in floods reflects important fluvial regime transitions and a channel-floodplain exchange process that is scale & frequency dependent.[Implications for modeling and prediction]
2. High-resolution DEMs offer new opportunities, e.g., objective and explicit identification of the hillslope-to-valley-to-channel transition.[Implications for modeling and subgrid-scale parameterizations]
3. Bedload size distributions and mass flux along river networks are less controlled by the flow pathways and more by the sediment production at the hillslope.[Implications for monitoring, theories of scale-dependent channel formation]
4. New ways of looking at landscapes, e.g., river corridor width functions, highlight the ability to depict important physical boundaries in valley forming processes from the presence of statistical boundaries.[Implications for spatially-distributed modeling]
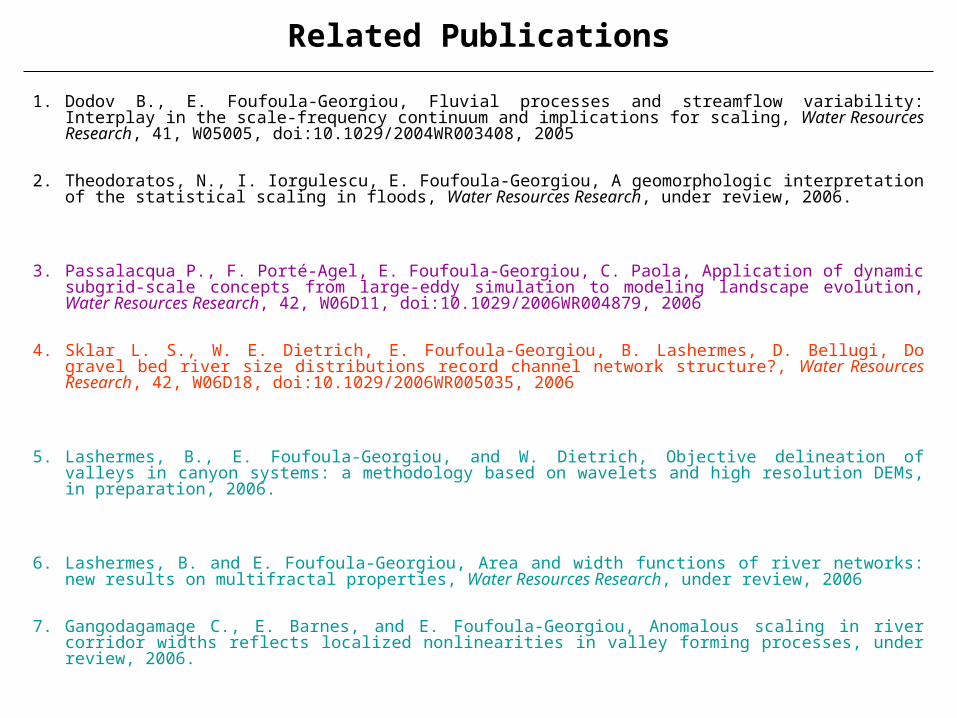
Related Publications
1. Dodov B., E. Foufoula-Georgiou, Fluvial processes and streamflow variability: Interplay in the scale-frequency continuum and implications for scaling, Water Resources Research, 41, W05005, doi:10.1029/2004WR003408, 2005
2. Theodoratos, N., I. Iorgulescu, E. Foufoula-Georgiou, A geomorphologic interpretation of the statistical scaling in floods, Water Resources Research, under review, 2006.
3. Passalacqua P., F. Porté-Agel, E. Foufoula-Georgiou, C. Paola, Application of dynamic subgrid-scale concepts from large-eddy simulation to modeling landscape evolution, Water Resources Research, 42, W06D11, doi:10.1029/2006WR004879, 2006
4. Sklar L. S., W. E. Dietrich, E. Foufoula-Georgiou, B. Lashermes, D. Bellugi, Do gravel bed river size distributions record channel network structure?, Water Resources Research, 42, W06D18, doi:10.1029/2006WR005035, 2006
5. Lashermes, B., E. Foufoula-Georgiou, and W. Dietrich, Objective delineation of valleys in canyon systems: a methodology based on wavelets and high resolution DEMs, in preparation, 2006.
6. Lashermes, B. and E. Foufoula-Georgiou, Area and width functions of river networks: new results on multifractal properties, Water Resources Research, under review, 2006
7. Gangodagamage C., E. Barnes, and E. Foufoula-Georgiou, Anomalous scaling in river corridor widths reflects localized nonlinearities in valley forming processes, under review, 2006.

1. SCALING BREAK IN FLOODS1. SCALING BREAK IN FLOODS
Multiscaling theory of flood peaks, Multiscaling theory of flood peaks, Gupta et al.Gupta et al. [1994]:[1994]:
(reproduced from (reproduced from SmithSmith, 1992), 1992)
1. SCALING BREAK IN FLOODS1. SCALING BREAK IN FLOODS
Multiscaling theory of flood peaks, Multiscaling theory of flood peaks, Gupta et al.Gupta et al. [1994]:[1994]:
(reproduced from (reproduced from SmithSmith, 1992), 1992)
Q(Q(A) A) ==dd G( G() Q(A)) Q(A)
CV(A)

•99 stations for HG (100’s of measurements for different Q/ station)
•72 stations for max annual flows (>15 yrs)
•70 stations for daily flows (>10 yrs)
•72 stations for hourly flows (>5 yrs)
•High resolution hydrography data for Osage and Neosho basins, KS
•Stratigraphic logs for 420 water wells
•115 stations of suspended sediment (100’s measurements for different Q/station)
Midwest Region
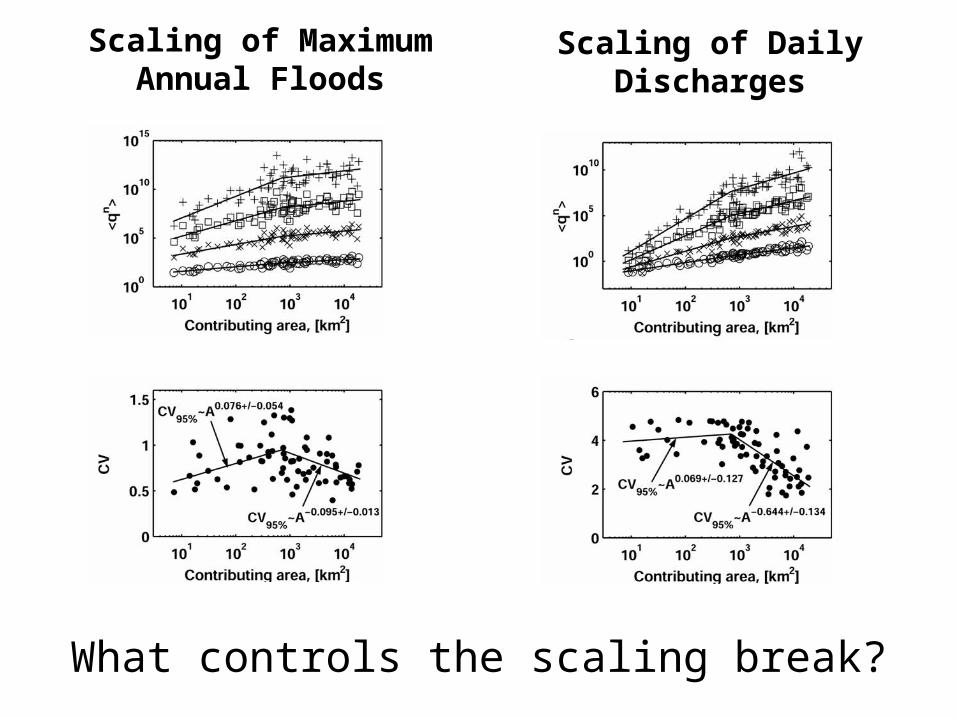
Scaling of MaximumAnnual Floods
Scaling of DailyDischarges
What controls the scaling break?
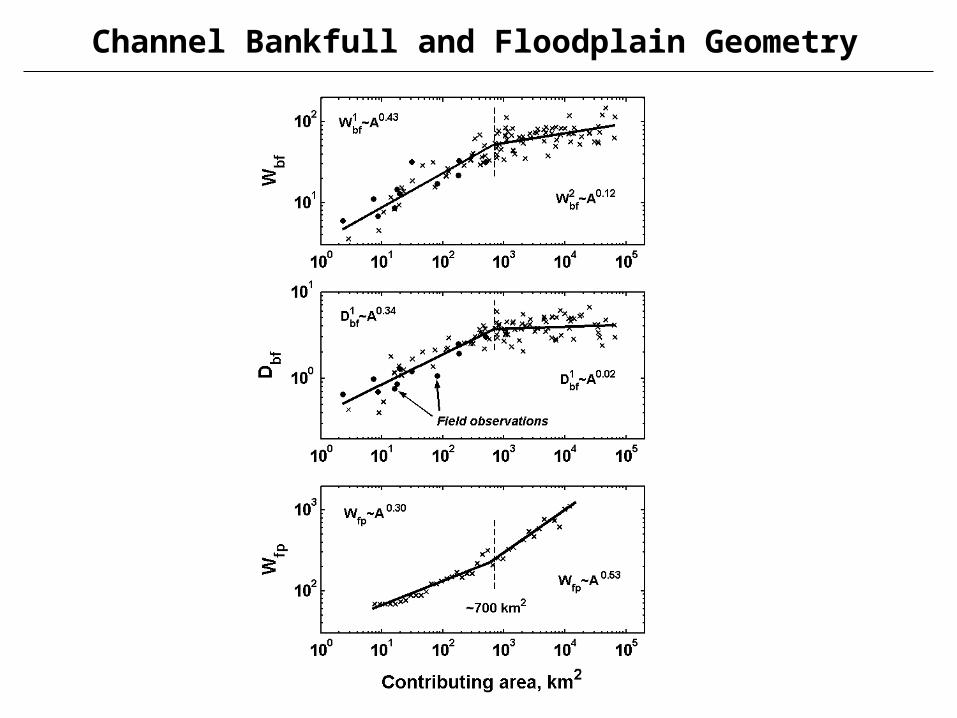
Channel Bankfull and Floodplain Geometry
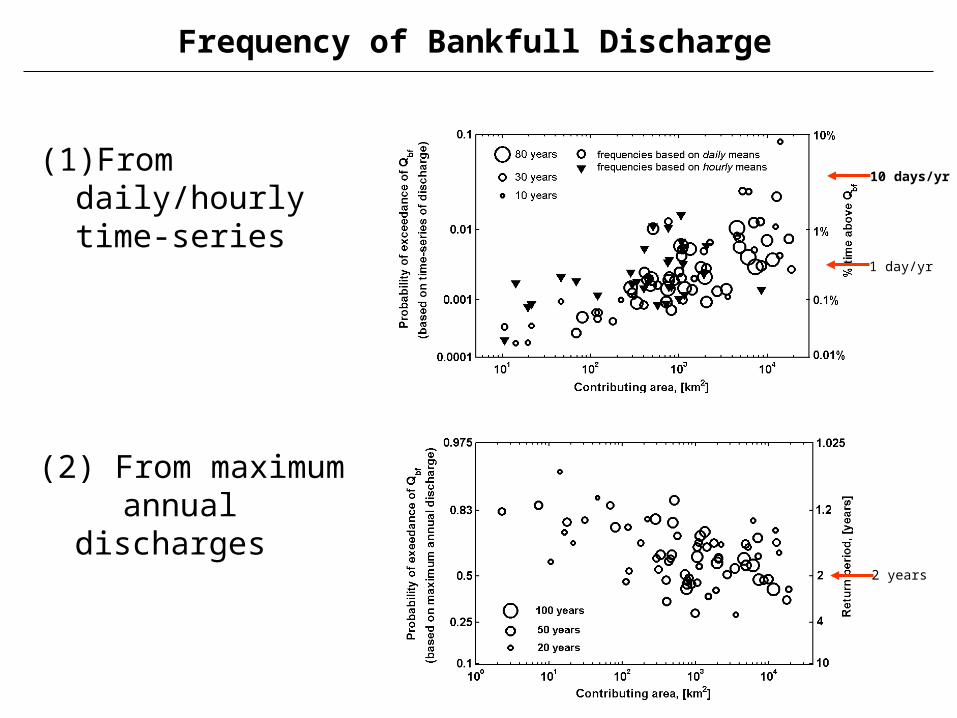
(2) From maximum annual
discharges
10 days/yr
1 day/yr
2 years
(1)From daily/hourly time-series
Frequency of Bankfull Discharge

The scaling break in floods is controlled by the channel/floodplain geometry and interactions
AppalachiAppalachianan MidwestMidwest
Implications for Flood Prediction
• Hydrologic transitions are imprinted in geomorphologic transitions
• High resolution DEMs offer potential to explicitly extract channel-floodplain morphometry which can:
– (a) guide hydrologic predictions over a range of scales, and
– (b) guide spatially-distributed modeling over large domains
• • • • •
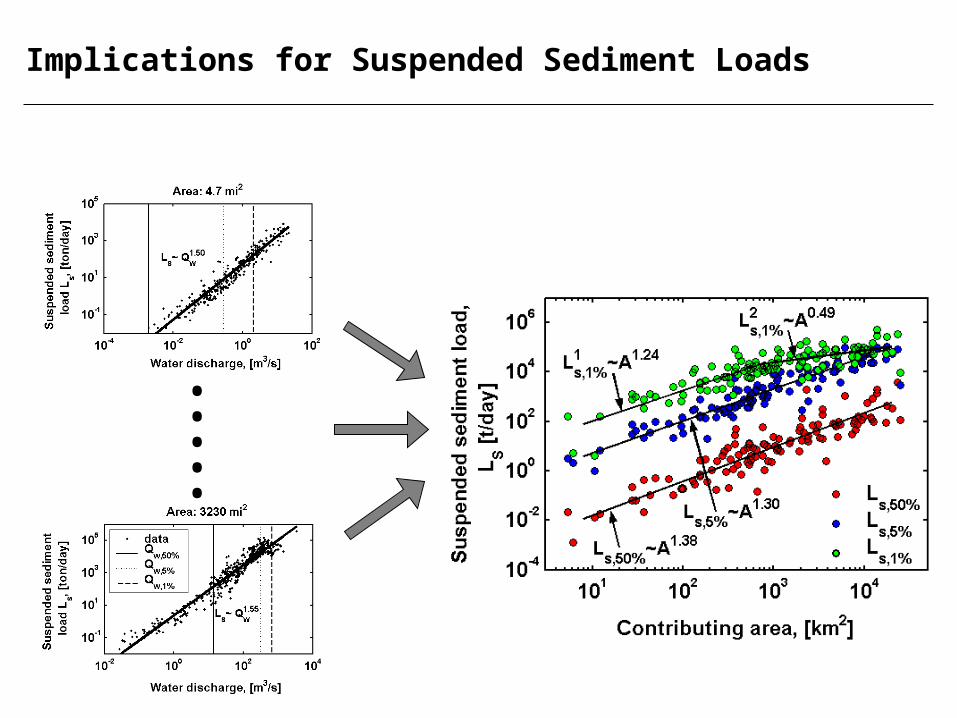
Implications for Suspended Sediment Loads
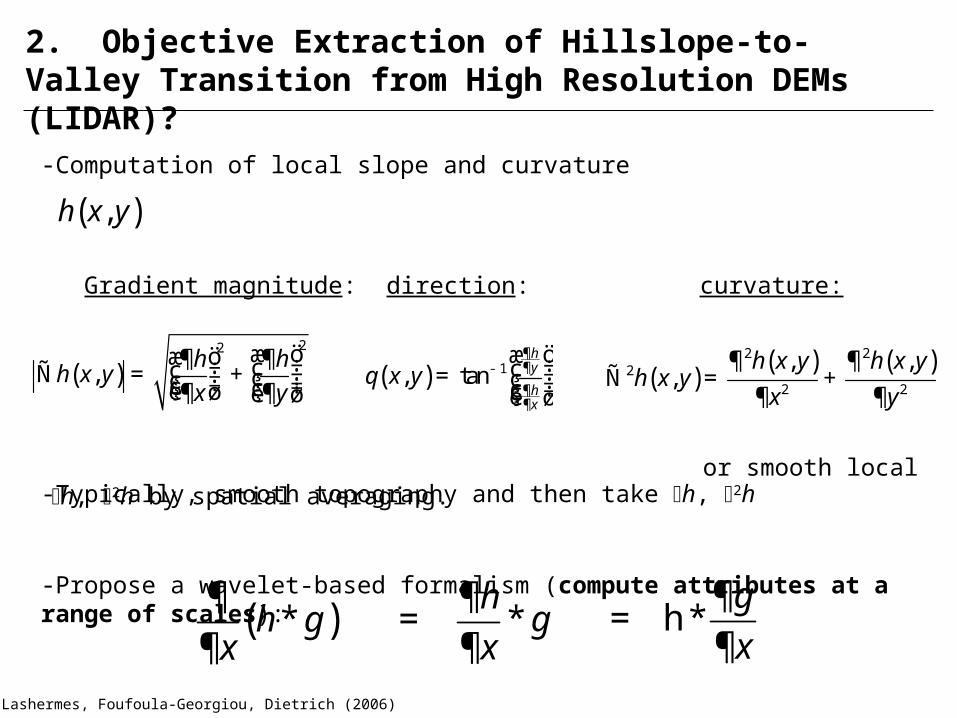
or smooth local h, 2h by spatial averaging.
Ref: Lashermes, Foufoula-Georgiou, Dietrich (2006)
-Computation of local slope and curvature
-Typically, smooth topography and then take h, 2h
-Propose a wavelet-based formalism (compute attributes at a range of scales):
( ),h x y
Gradient magnitude:
( )22
,h h
h x yx y
æ öæ ö¶ ¶ ÷ç÷çÑ = + ÷÷ çç ÷÷ç ç ÷è ø¶ ¶è ø
direction:
( ) 1, tanhy
hx
x yq¶¶-
¶¶
öæ ÷ç ÷= ç ÷ç ÷çè ø
curvature:
( )( ) ( )2 2
22 2
, ,,
h x y h x yh x y
x y
¶ ¶Ñ = +
¶ 
( )h gx
¶*
¶ hg
x
¶= *
¶ h
g
x
¶= *
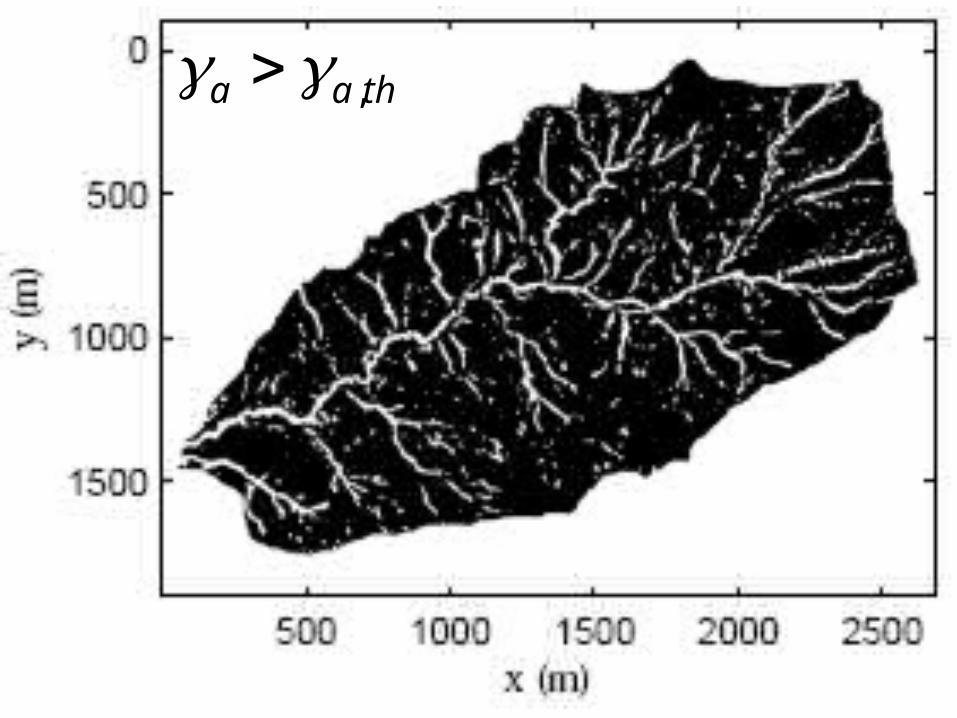
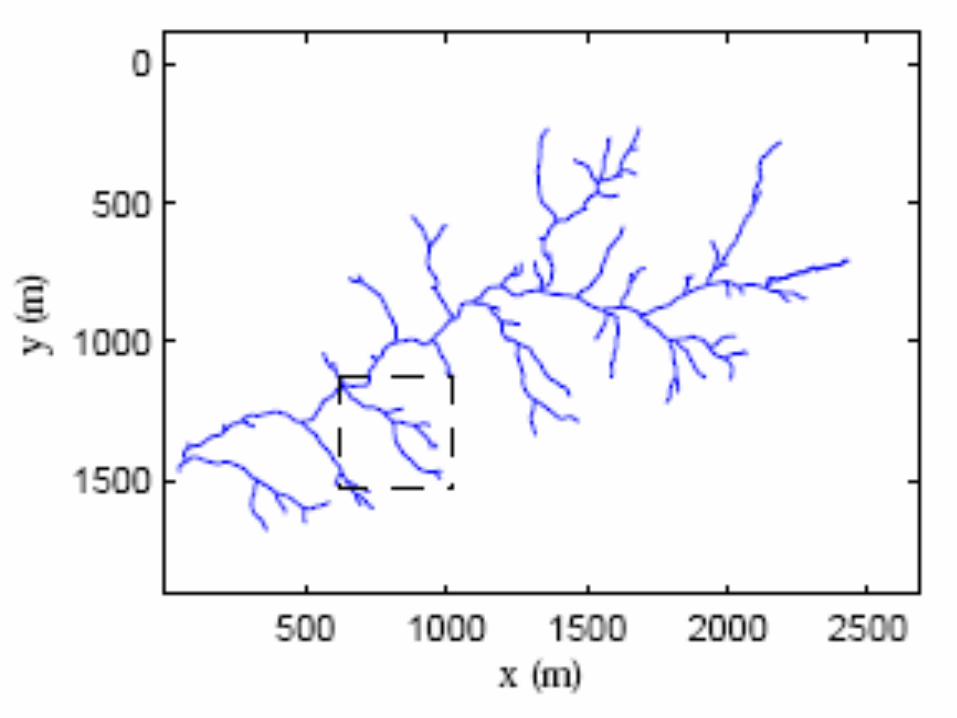
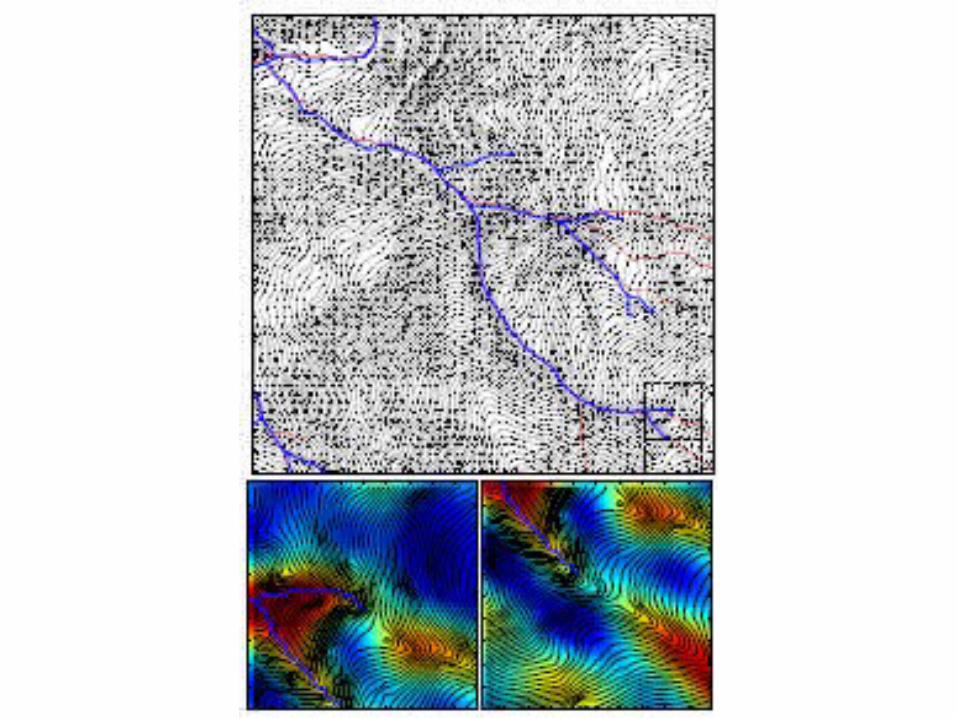
2. Objective Extraction of Hillslope-to-Valley Transition from High Resolution DEMs (LIDAR)?

Angelo Coast Reserve

a ~ 71.1m35.5m26.7m17.8m
11.6m
slope = -0.82
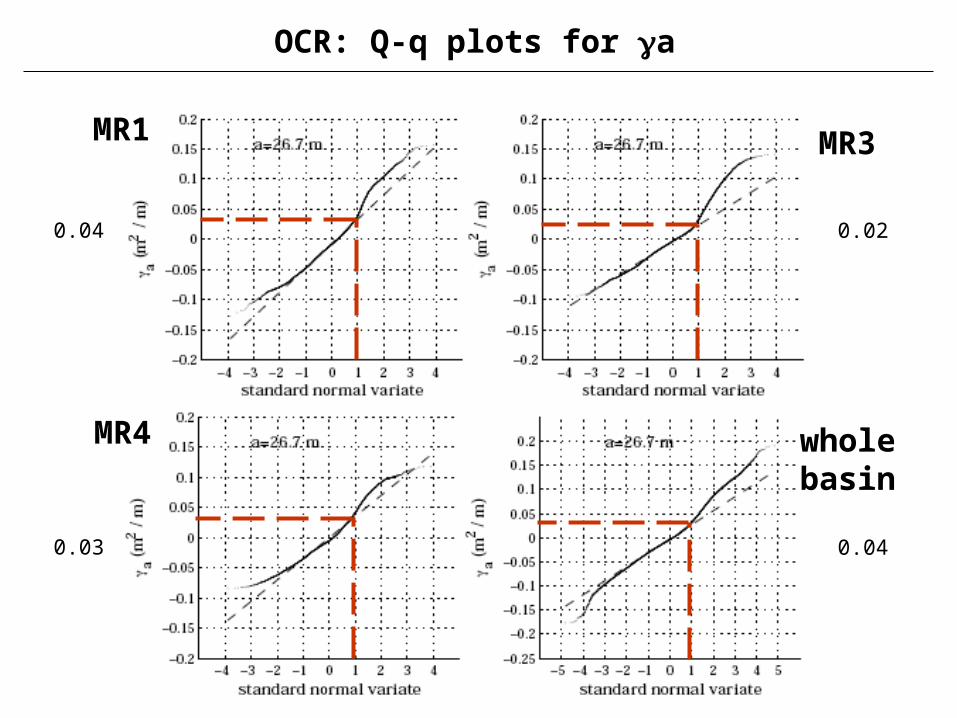
Minimum Scale for Curvature Interpretation?
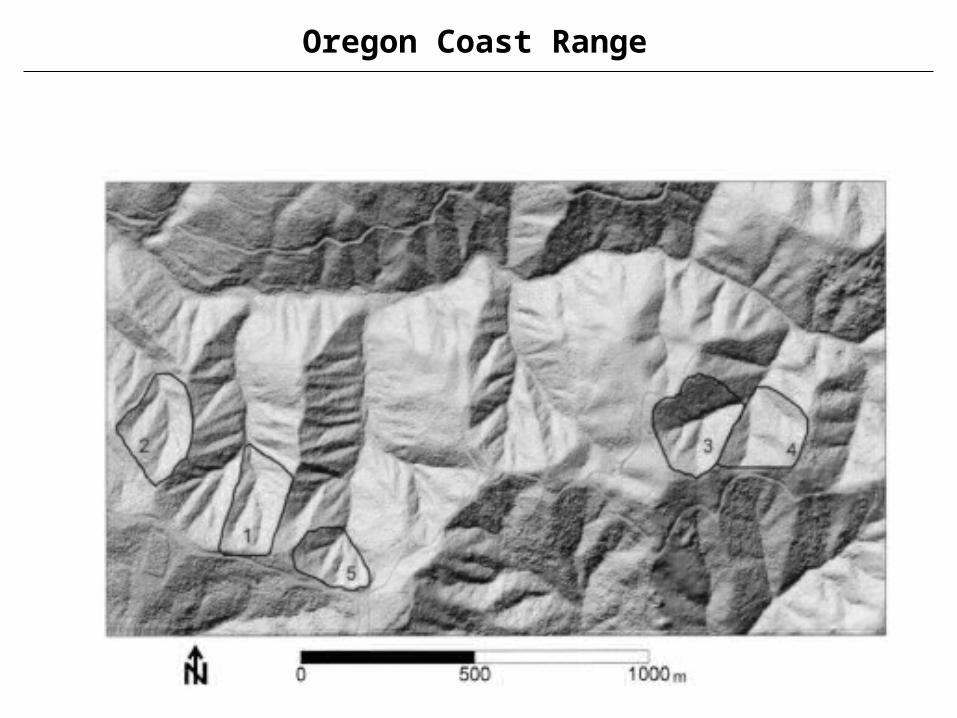
Oregon Coast Range
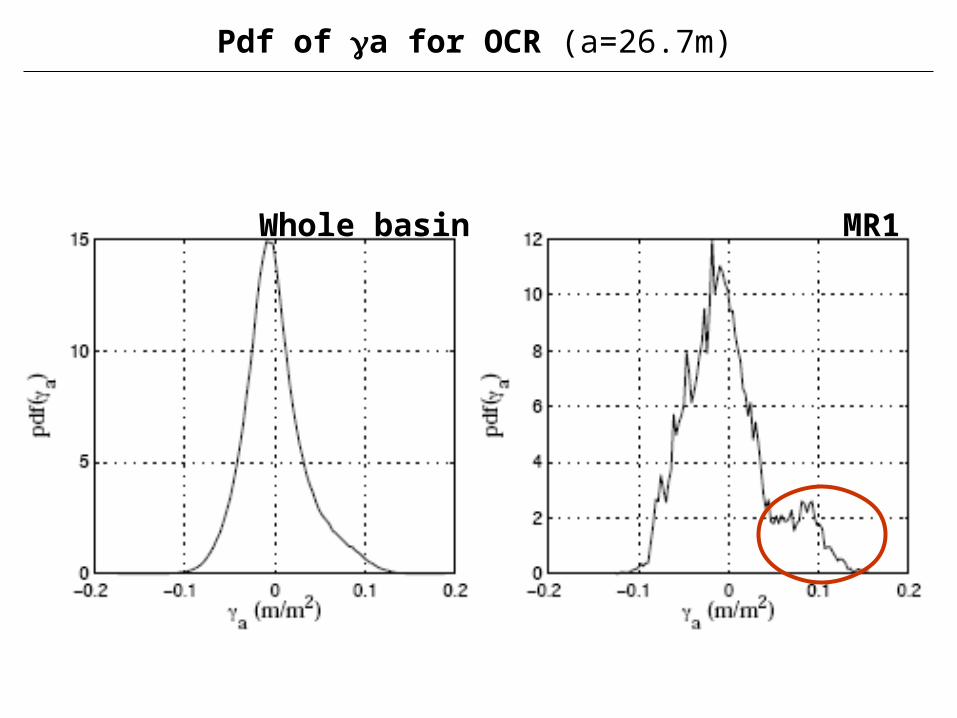
MR1Whole basin
Pdf of a for OCR (a=26.7m)
MR3
wholebasin
MR1
MR4
0.04
0.03
0.02
0.04
OCR: Q-q plots for a

a
thaa ,
MR1 Subbasin
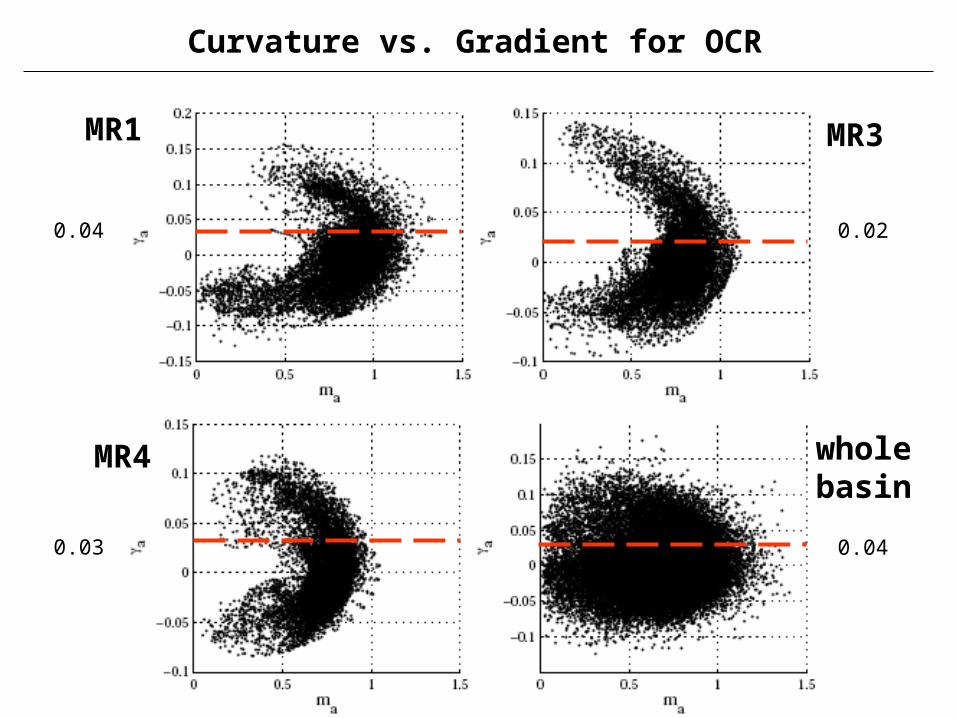
MR3
wholebasin
MR1
MR4
0.04
0.03
0.02
0.04
Curvature vs. Gradient for OCR
thaa ,
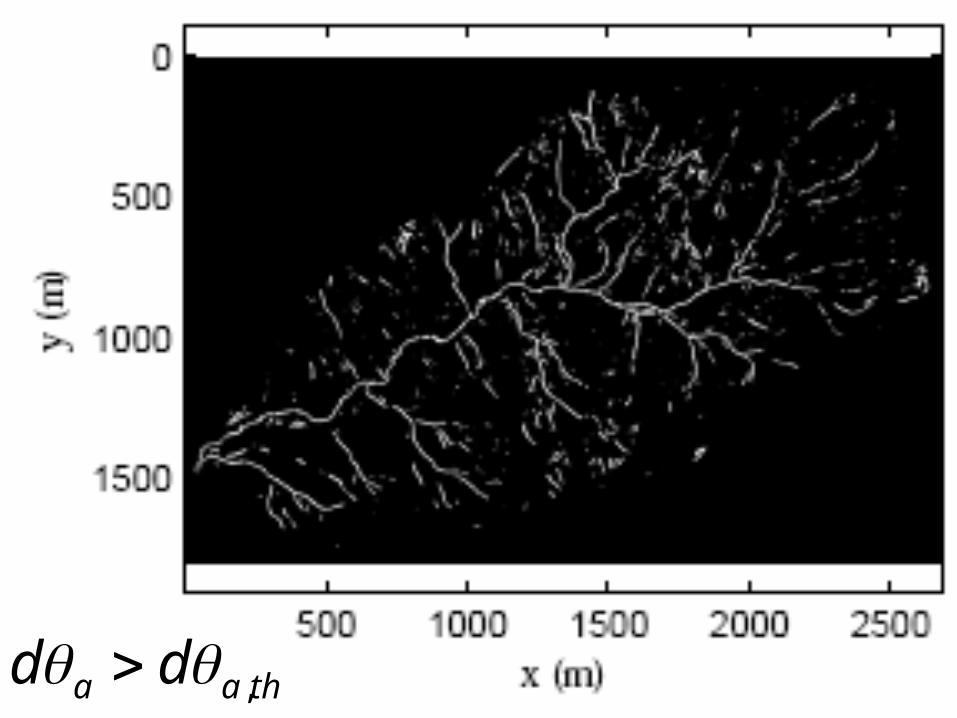
thaa dd ,
Ref: Sklar L. S., W. E. Dietrich, E. Foufoula-Georgiou, B. Lashermes, D. Bellugi, Do gravel bed river size distributions record channel network structure?, Water Resources Research, 42, W06D18,
doi:10.1029/2006WR005035, 2006.
3. Bedload size distributions: Importance of hillslope sediment production
Do gravel bed size distributions record channel network structure?
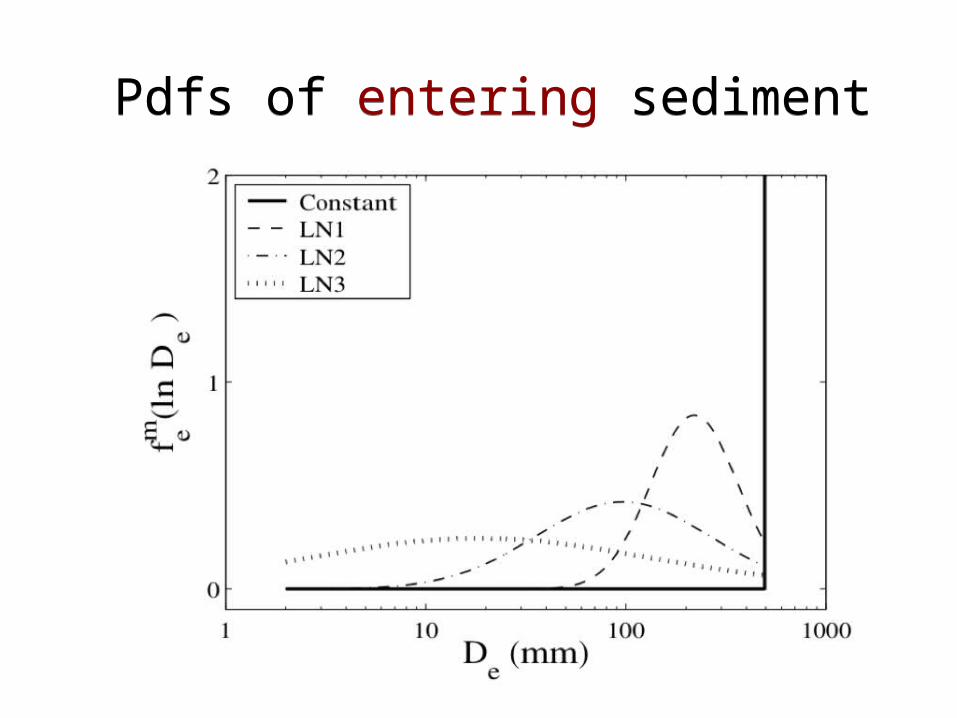
Pdfs of entering sedimentPdfs of entering sediment

Pdfs of entering sediment & steady-state bedload
sediment
Pdfs of entering sediment & steady-state bedload
sedimentAs variance of
entering sediment distribution increases,
bedload steady-state pdf
approaches entering pdf

Bedload mass flux equilibrates with supply over length scale of 1/alpha, and then it becomes independent of drainage area
How do channel cross sections develop under flow which scales with area but bedload mass flux that is constant?
The bedload steady-state grain size distribution differs little from the hillslope supply distribution in the case of poorly sorted hillslope sediments
Large-scale variability in bed material is due primarily to spatial gradients in hillslope sediment production and transport characteristics
Need theory and data to predict the grain size distribution supplied to channels by hillslopes
Conclusions and Implications

Ref: Gangodagomage, Bamer, Foufoula-Georgiou, et al.
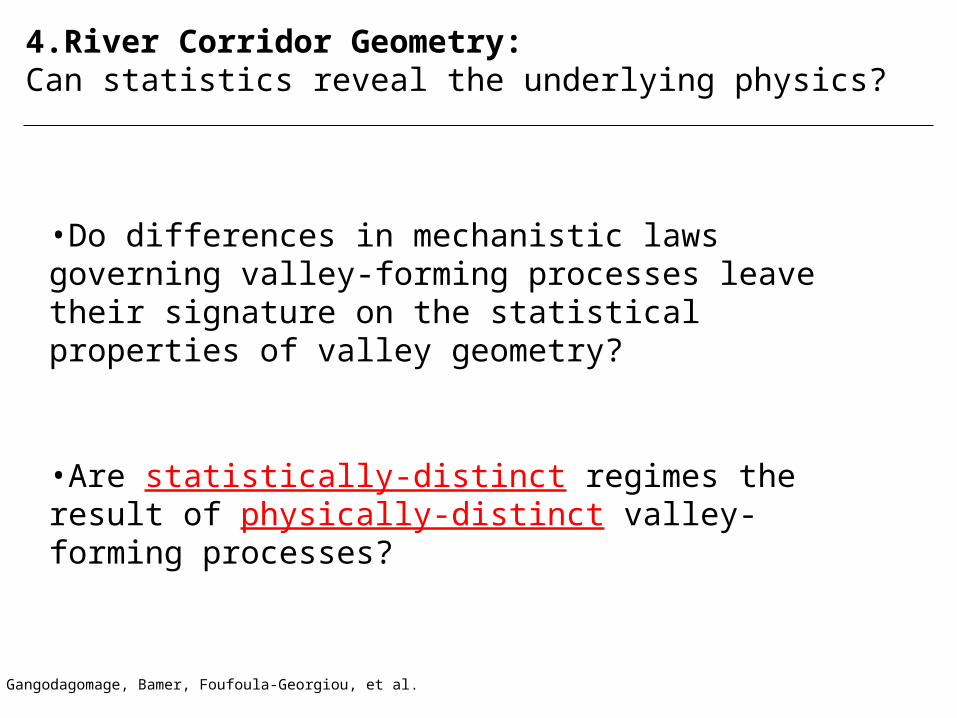
4. River Corridor Geometry:Can statistics reveal the underlying physics?
Ref: Gangodagomage, Bamer, Foufoula-Georgiou, et al.
4. River Corridor Geometry:Can statistics reveal the underlying physics?
•Do differences in mechanistic laws governing valley-forming processes leave their signature on the statistical properties of valley geometry?
•Are statistically-distinct regimes the result of physically-distinct valley-forming processes?
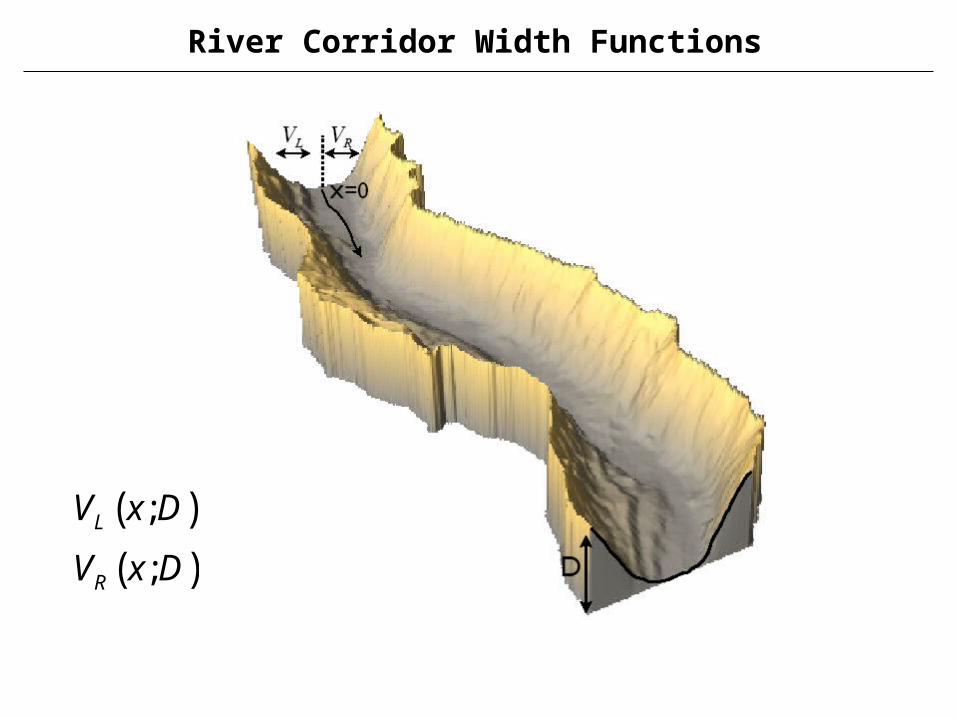
River Corridor Width Functions
( )( )
;
;
L
R
V x D
V x D

Area = 351 km2
South Fork Eel River, CA

River Corridor Width Function (D=5m)
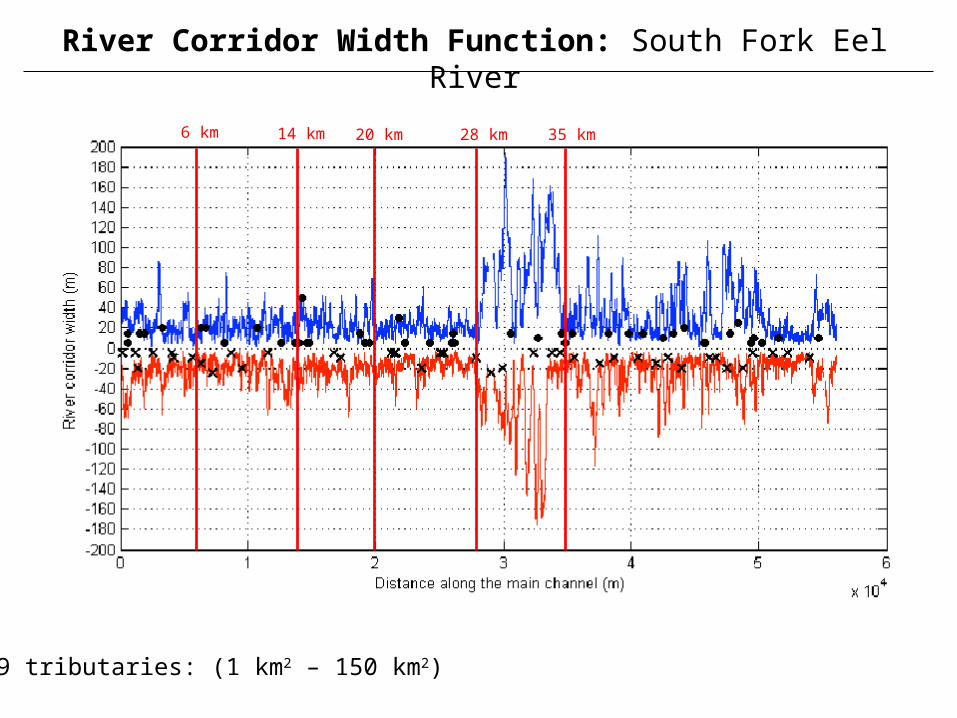
89 tributaries: (1 km2 – 150 km2)
River Corridor Width Function: South Fork Eel River
6 km 14 km 20 km 28 km 35 km

River Reach: 0-6 Km
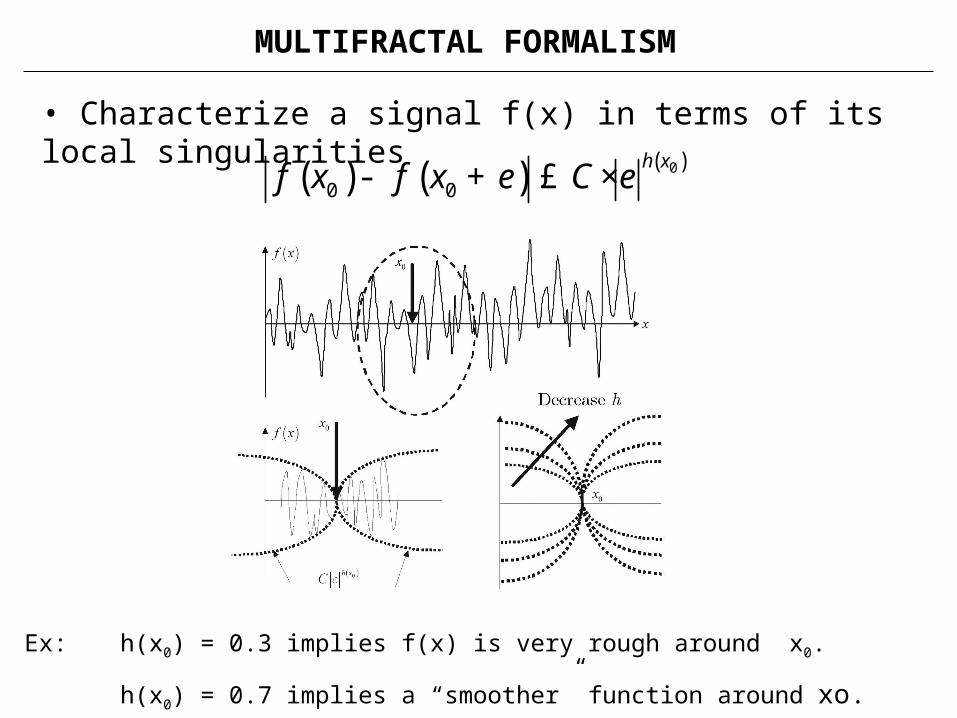
• Characterize a signal f(x) in terms of its local singularities
( ) ( ) ( )0
0 0
h xf x f x Ce e- + £ ×
Ex: h(x0) = 0.3 implies f(x) is very rough around x0.
h(x0) = 0.7 implies a “smoother” function around xo.
MULTIFRACTAL FORMALISM
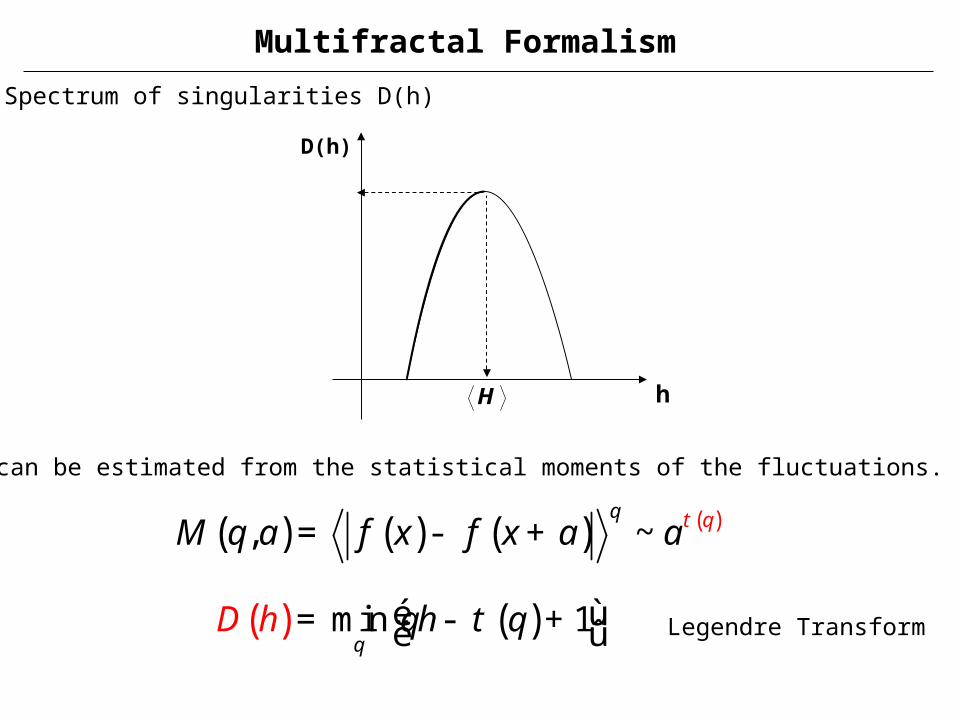
• Spectrum of singularities D(h)
• D(h) can be estimated from the statistical moments of the fluctuations.
( ) ( ) ( ) ( ), ~ qqM q a f x f x a at= - +
( ) ( )min 1qqh h qD té ù= - +ë û Legendre Transform
Multifractal Formalism
h
D(h)
H
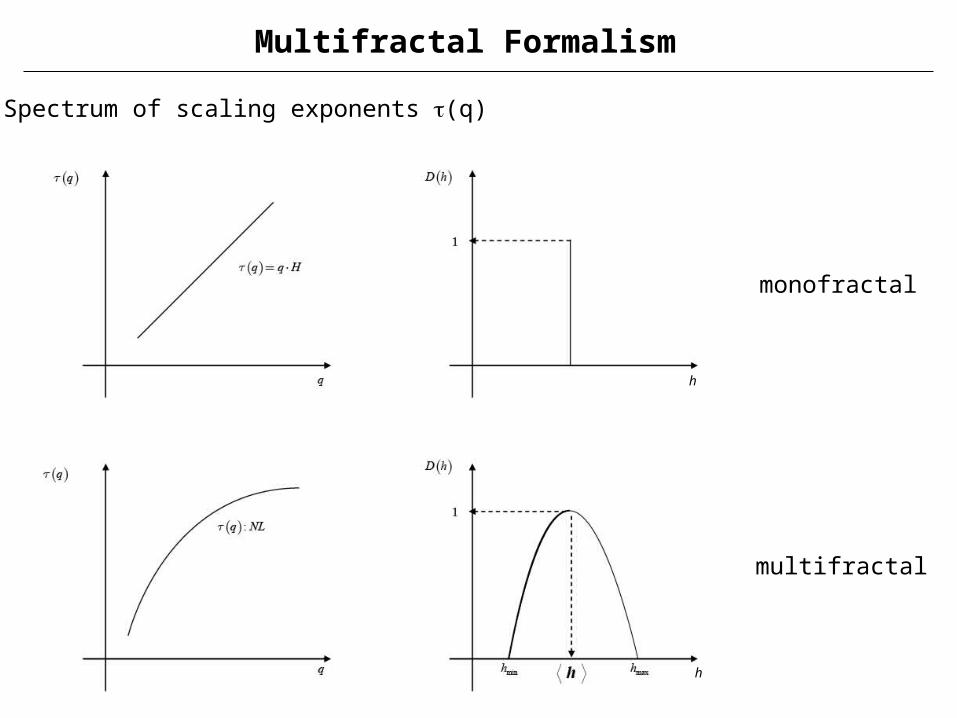
Multifractal Formalism
• Spectrum of scaling exponents (q)
monofractal
multifractal
h
h
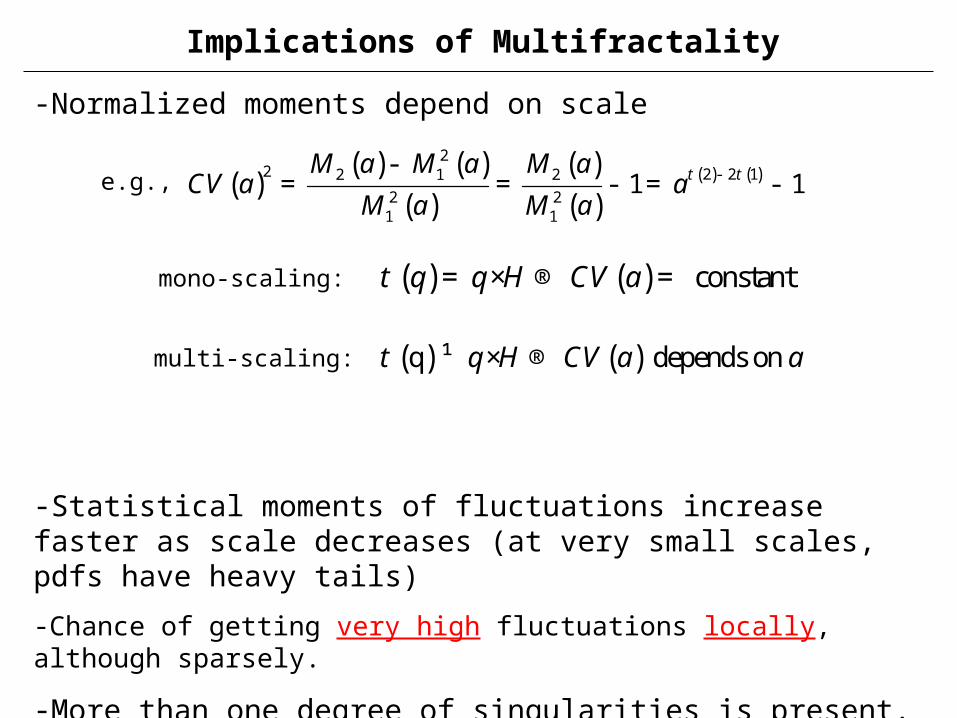
Implications of Multifractality
-Normalized moments depend on scale
-Statistical moments of fluctuations increase faster as scale decreases (at very small scales, pdfs have heavy tails)
-Chance of getting very high fluctuations locally, although sparsely.
-More than one degree of singularities is present.
-These singularities are spread throughout the signal intermittently
( )( ) ( )
( )( )( )
( ) ( )2
2 2 2 12 1 2
2 21 1
1 1M a M a M a
CV a aM a M a
t t--= = - = -e.g.,
mono-scaling: ( ) ( ) constantq q H CV at = × ® =
multi-scaling: ( ) ( )q depends on q H CV a at ¹ × ®
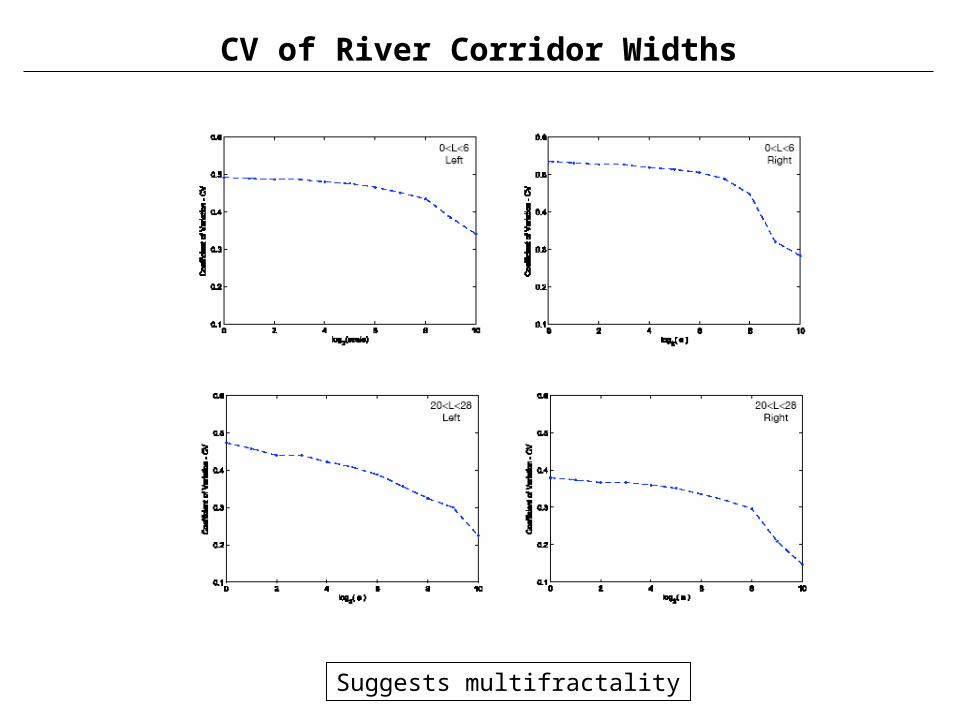
CV of River Corridor Widths
Suggests multifractality

River Reach: 0-6 km
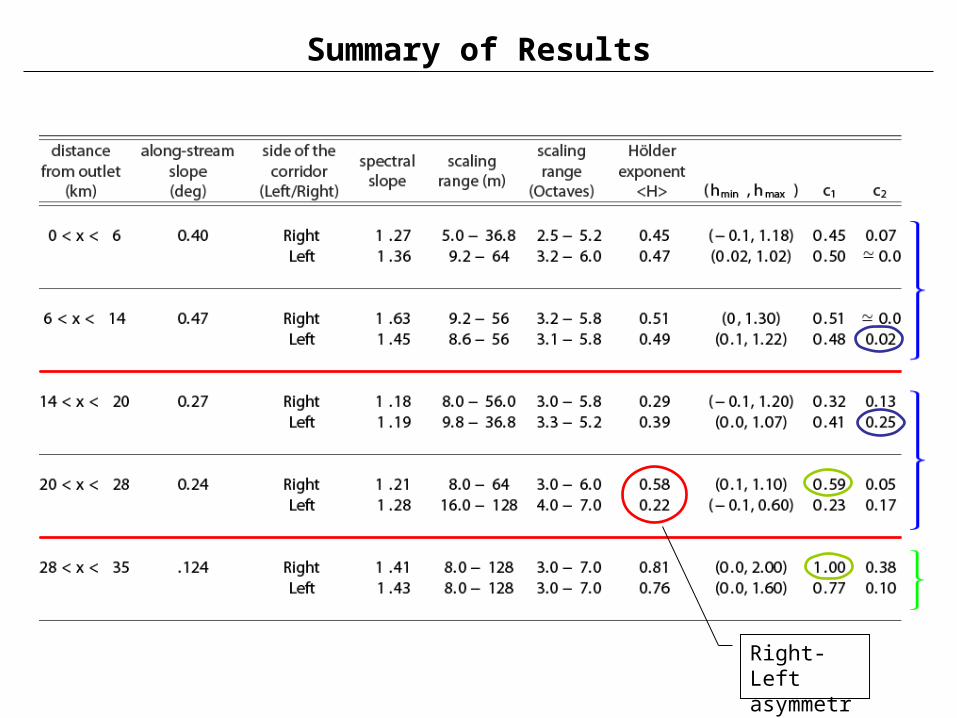
Summary of Results
Right-Left asymmetry

Physical interpretation of statistical signatures?
More localized transport mechanism
More localized on R than L side?
Smoother overall valleys?
Presence of more terraces in R than L?

1. How much of the physical/mechanistic behavior of the coupled hydrologic/geomorphologic system is reflected in the observed statistical patterns?
2. Are statistical patterns distinct across physical boundaries and how can they be used in assisting modeling, prediction and observatory design across scales and across environments?
3. Where/what to sample to get the most out of a limited number of observations?
Summary of Overarching Questions