comprehensive annual financial report - lane county · we are pleased to submit the comprehensive...
TRANSCRIPT
Comprehensive Annual Financial Report
Lane County, Oregon
Responsibly managing limited resources to deliver vital, customer-focused services with passion, innovation, and integrity.
For the Fiscal Year Ended June 30, 2016

COMPREHENSIVE ANNUAL FINANCIAL REPORT LANE COUNTY, OREGON
FOR THE FISCAL YEAR ENDED JUNE 30, 2016
REPORT PREPARED BY LANE COUNTY OPERATIONS DIVISION - FINANCIAL SERVICES

INTRODUCTORY SECTION
INTRODUCTORY SECTION Page(s)
Letter of Transmittal 1 - 5Organizational Chart 6 - 7GFOA Certificate of Achievement 8Listing of Principal Officials 9
FINANCIAL SECTION
Report of Independent Auditor 11 - 13Management’s Discussion and Analysis 14 - 26
Basic Financial Statements:
Government-wide Financial Statements:Statement of Net Position 27Statement of Activities 28 - 29
Fund Financial Statements:Balance Sheet – Governmental Funds 30 - 31
Reconciliation of the Balance Sheet of Governmental Fundsto the Statement of Net Position 33
Statement of Revenues, Expenditures, and Changes in Fund Balances – Governmental Funds 34 - 35
Reconciliation of the Statement of Revenues, Expenditures,and Changes in Fund Balances of Governmental Fundsto the Statement of Activities 37
Statement of Fund Net Position – Proprietary Funds 38
Statement of Revenues, Expenses, and Changes in FundNet Position – Proprietary Funds 39
Statement of Cash Flows – Proprietary Funds 40
Statement of Fiduciary Net Position 41
Notes to Basic Financial Statements 43 - 89
Required Supplementary Information:Schedule of Revenues, Expenditures, and Changes in Fund
Balance – Budget and Actual:
General Fund 91Road Fund 92Special Revenue / Services Fund 93Health and Human Services Fund 94Trillium Behavioral Health 95Local Option Tax Levy Fund 96
Schedule of OPEB Funding Progress 97Schedule of County Contributions 98Schedule of the County's Proportionate Share of the Net Pension Liability 99
Notes to Required Supplementary Information 100
Lane County, OregonLane County, OregonComprehensive Annual Financial ReportFor the Fiscal Year Ended June 30, 2016
TABLE OF CONTENTS
i
FINANCIAL SECTION, continued: Page(s)
Other Supplementary Information:Nonmajor Governmental Funds Combining Statements:
Combining Balance Sheet – Nonmajor Governmental Funds 101
Combining Statement of Revenues, Expenditures, and Changes in Fund Balances – Nonmajor Governmental Funds 102
Special Revenue Funds:
Combining Balance Sheet – Nonmajor Special Revenue Funds 104 - 105
Combining Statement of Revenues, Expenditures, and Changes in Fund Balances – Nonmajor Special Revenue Funds 106 - 107
Schedule of Revenues, Expenditures, and Changes in Fund Balance – Budget and Actual:
Parks and Open Spaces Fund 108Law Library Fund 109Liquor Law Enforcement Fund 110Public Land Corner Preservation Fund 111County Schools Fund 112County Clerk Records Fund 113Title III Projects Fund 114Intergovernmental Human Services Fund 115
Debt Service Funds:
Combining Balance Sheet – Nonmajor Debt Service Funds 117
Combining Statement of Revenues, Expenditures, and Changes inFund Balances – Nonmajor Debt Service Funds 118
Schedule of Revenues, Expenditures, and Changes in Fund Balance – Budget and Actual:
Lane Events Center Debt Service Fund 119Special Obligation Bond Retirement Fund 120Notes Payable Debt Service Fund 121
Capital Projects Funds:
Combining Balance Sheet – Nonmajor Capital Projects Funds 123
Combining Statement of Revenues, Expenditures, and Changes in Fund Balances – Nonmajor Capital Projects Funds 124
Lane County, OregonComprehensive Annual Financial ReportFor the Fiscal Year Ended June 30, 2016
Table of Contents, Continued
ii
Lane County, OregonComprehensive Annual Financial ReportFor the Fiscal Year Ended June 30, 2016
Table of Contents, Continued
FINANCIAL SECTION, continued: Page(s)
Other Supplementary Information, continued:Capital Projects Funds, continued:
Schedule of Revenues, Expenditures, and Changes in Fund Balance – Budget and Actual:
Capital Improvements Fund 125Juvenile Justice Center Construction Fund 126
Enterprise Funds:
Combining Statement of Fund Net Position – Nonmajor Enterprise Funds 127
Combining Statement of Revenues, Expenses, and Changes in Fund Net Position – Nonmajor Enterprise Funds 128
Combining Statement of Cash Flows – Nonmajor Enterprise Funds 129
Schedule of Revenues, Expenditures, and Changes in Fund Balance – Budget and Actual:
Lane Events Center Fund 130Corrections Commissary Fund 131Land Management Fund 132Solid Waste Disposal Fund 133
Internal Service Funds:
Combining Statement of Fund Net Position – All Internal Service Funds 136 - 137
Combining Statement of Revenues, Expenses, and Changes in Fund Net Position – All Internal Service Funds 138 - 139
Combining Statement of Cash Flows – All Internal Service Funds 140 - 141
Schedule of Revenues, Expenditures, and Changes in Fund Balance – Budget and Actual:
Self Insurance Fund 142Employee Benefits Fund 143Pension Bond Fund 144Motor and Equipment Pool Fund 145Intergovernmental Services Fund 146PC Replacement Fund 147Information Services Fund 148Retiree Medical Benefit Trust Fund 149
Fiduciary Funds:Statement of Changes in Assets and Liabilities - Property Tax Agency Fund 151
iii
FINANCIAL SECTION, continued: Page(s)
Other Supplementary Schedules:
Schedule of Cash Receipts and Turnovers – Elected Officials 153Schedule of Property Tax Transactions 154Schedule of Property Taxes Receivable by Levy Year by Fund 155Schedule of Property Tax Collections by Levy Year by Fund 156
STATISTICAL SECTION
Exhibit 1 – Net Position by Component 158 - 159Exhibit 2 – Changes in Net Position 160 - 163Exhibit 3 – Fund Balances, Governmental Funds 164 - 165Exhibit 4 – Change in Fund Balances, Governmental Funds 166 - 167Exhibit 5 – Assessed Value and Estimated Actual Value of Taxable Property 168 - 169Exhibit 6 – Direct and Overlapping Property Tax Rates 170 - 173Exhibit 7 – Principal Property Tax Payers 174 - 175Exhibit 8 – Property Tax Levies and Collections 176 - 177Exhibit 9 – Ratios of Outstanding Debt by Type 178 - 179Exhibit 10 – Ratios of General Bonded/Gross Direct,
Net Direct, and Overlapping Debt Outstanding 180 - 181Exhibit 11 – Legal Debt Margin - General Obligation Bonded Indebtedness 182 - 183Exhibit 12 – Legal Debt Margin - Limited Tax Bonded Indebtedness 184 - 185Exhibit 13 – Demographic and Economic Statistics 187Exhibit 14 – Principal Employers 188 - 189Exhibit 15 – Authorized Number of Employees by Function/Program 190 - 191Exhibit 16 – Operating Indicators by Function/Program 192 - 193Exhibit 17 – Capital Asset Statistics by Function/Program 194 - 195
AUDIT COMMENTS AND GOVERNMENT AUDITING STANDARDS SECTIONS
Audit Comments:
Report of Independent Auditors on Compliance and on Internal Control Over FinancialReporting Based on an Audit of Financial Statements Performed in Accordance with Oregon Minimum Audit Standards 199 - 200
Government Auditing Standards:
Report of Independent Auditors on Internal Control Over Financial Reporting and onCompliance and Other Matters Based on an Audit of Financial StatementsPerformed in Accordance with Government Auditing Standards 203 - 204
Report of Independent Auditors on Compliance for Each Major Federal Program and Report on Internal Control over Compliance Required by the Uniform Guidance 206 - 207
Schedule of Expenditures of Federal Awards 208 - 211Notes to Schedule of Expenditures of Federal Awards 212Schedule of Findings and Questioned Costs 213 - 214
Summary Schedule of Prior Audit Findings 215
iv
Table of Contents, Continued
Comprehensive Annual Financial ReportFor the Fiscal Year Ended June 30, 2016
Lane County, Oregon
December 12, 2016 To the Board of County Commissioners and the Citizens of Lane County, Oregon We are pleased to submit the Comprehensive Annual Financial Report (CAFR) of Lane County, Oregon for the fiscal year ended June 30, 2016, together with the report of our independent certified public accountants, Moss Adams LLP. Financial Services, as part of the Operations Division of County Administration, prepares this report. This report is published to provide the Board of County Commissioners, citizens, County staff, and other readers with detailed information about the financial position and results of operations of the County, and to demonstrate fiscal and operational accountability in the use of County resources. The report consists of management’s representations concerning the finances of Lane County. Consequently, management assumes full responsibility for the completeness and reliability of all information presented in this report. To provide a reasonable basis for making these representations, County management has established a comprehensive internal control framework designed to protect Lane County’s assets from loss, theft, or misuse, and to compile sufficient reliable information for the preparation of the County’s financial statements. Because the cost of internal controls should not outweigh their benefits, the County’s comprehensive framework of internal controls is designed to provide reasonable assurance that the financial statements will be free from material misstatement. As management, we assert that, to the best of our knowledge and belief, this financial report is complete and reliable in all material respects.
THE REPORT In accordance with Oregon law and Lane County Code, Moss Adams, LLP has audited the County’s basic financial statements. The objective of the audit is to provide reasonable assurance that the financial statements of the County for the fiscal year ended June 30, 2016, are free of material misstatement. The audit was conducted in accordance with auditing standards generally accepted in the United States of America, standards applicable to financial audits contained in Government Auditing Standards issued by the Comptroller General of the United States, and Minimum Standards for Audits of Oregon Municipal Corporations as prescribed by the Secretary of State, State of Oregon. The unmodified opinion rendered in this report indicates that the financial statements were prepared in accordance with generally accepted accounting principles (GAAP) accepted in the United States of America and meet the standards prescribed by the Secretary of State. The auditor’s report on these financial statements is located in the Financial Section of this report. The independent audit of the financial statements is part of a broader, federally mandated “Single Audit”. The Single Audit standards require that the independent auditor report not only on the fair presentation of the basic financial statements, but also on the County’s internal controls and legal requirements involving the administration of federal grant awards. Those reports are included in the Government Auditing Standards Section of this report. GAAP requires that management provide a narrative introduction, overview, and analysis to accompany the basic financial statements in the form of Management’s Discussion and Analysis (MD&A). This letter of transmittal is designed to complement MD&A and should be read in conjunction with it. Lane County’s MD&A can be found immediately following the independent auditors’ report.
PROFILE OF THE COUNTY Lane County was established in 1851 and is geographically situated on the west side of Oregon, about midway down the state’s coastline. The County encompasses 4,722 square miles and, in many ways, typifies Oregon. The county’s lands are geographically a microcosm of the state, ranging from rugged glaciated mountains in the east, through a broad valley spreading across the Willamette River mid-county, to a beautiful and rugged coastline along the western edge. Portland State University’s Population Research Center’s estimate of the 2015 population for Lane County is 362,150. Lane County’s population is increasing, with an estimated growth rate of 3 percent since 2010. Lane County is the fourth most populous county in Oregon and the third most populous metropolitan statistical area (MSA) in the state.
1
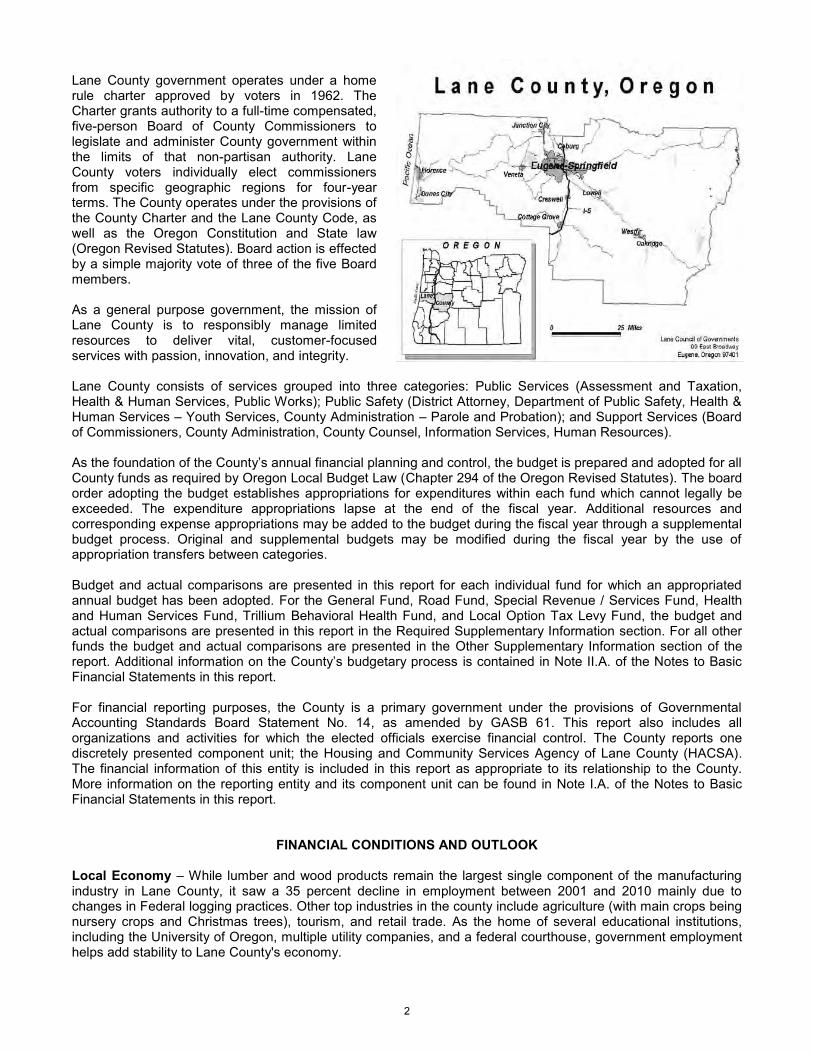
Lane County government operates under a home rule charter approved by voters in 1962. The Charter grants authority to a full-time compensated, five-person Board of County Commissioners to legislate and administer County government within the limits of that non-partisan authority. Lane County voters individually elect commissioners from specific geographic regions for four-year terms. The County operates under the provisions of the County Charter and the Lane County Code, as well as the Oregon Constitution and State law (Oregon Revised Statutes). Board action is effected by a simple majority vote of three of the five Board members. As a general purpose government, the mission of Lane County is to responsibly manage limited resources to deliver vital, customer-focused services with passion, innovation, and integrity. Lane County consists of services grouped into three categories: Public Services (Assessment and Taxation, Health & Human Services, Public Works); Public Safety (District Attorney, Department of Public Safety, Health & Human Services – Youth Services, County Administration – Parole and Probation); and Support Services (Board of Commissioners, County Administration, County Counsel, Information Services, Human Resources). As the foundation of the County’s annual financial planning and control, the budget is prepared and adopted for all County funds as required by Oregon Local Budget Law (Chapter 294 of the Oregon Revised Statutes). The board order adopting the budget establishes appropriations for expenditures within each fund which cannot legally be exceeded. The expenditure appropriations lapse at the end of the fiscal year. Additional resources and corresponding expense appropriations may be added to the budget during the fiscal year through a supplemental budget process. Original and supplemental budgets may be modified during the fiscal year by the use of appropriation transfers between categories. Budget and actual comparisons are presented in this report for each individual fund for which an appropriated annual budget has been adopted. For the General Fund, Road Fund, Special Revenue / Services Fund, Health and Human Services Fund, Trillium Behavioral Health Fund, and Local Option Tax Levy Fund, the budget and actual comparisons are presented in this report in the Required Supplementary Information section. For all other funds the budget and actual comparisons are presented in the Other Supplementary Information section of the report. Additional information on the County’s budgetary process is contained in Note II.A. of the Notes to Basic Financial Statements in this report. For financial reporting purposes, the County is a primary government under the provisions of Governmental Accounting Standards Board Statement No. 14, as amended by GASB 61. This report also includes all organizations and activities for which the elected officials exercise financial control. The County reports one discretely presented component unit; the Housing and Community Services Agency of Lane County (HACSA). The financial information of this entity is included in this report as appropriate to its relationship to the County. More information on the reporting entity and its component unit can be found in Note I.A. of the Notes to Basic Financial Statements in this report.
FINANCIAL CONDITIONS AND OUTLOOK Local Economy – While lumber and wood products remain the largest single component of the manufacturing industry in Lane County, it saw a 35 percent decline in employment between 2001 and 2010 mainly due to changes in Federal logging practices. Other top industries in the county include agriculture (with main crops being nursery crops and Christmas trees), tourism, and retail trade. As the home of several educational institutions, including the University of Oregon, multiple utility companies, and a federal courthouse, government employment helps add stability to Lane County's economy.
2
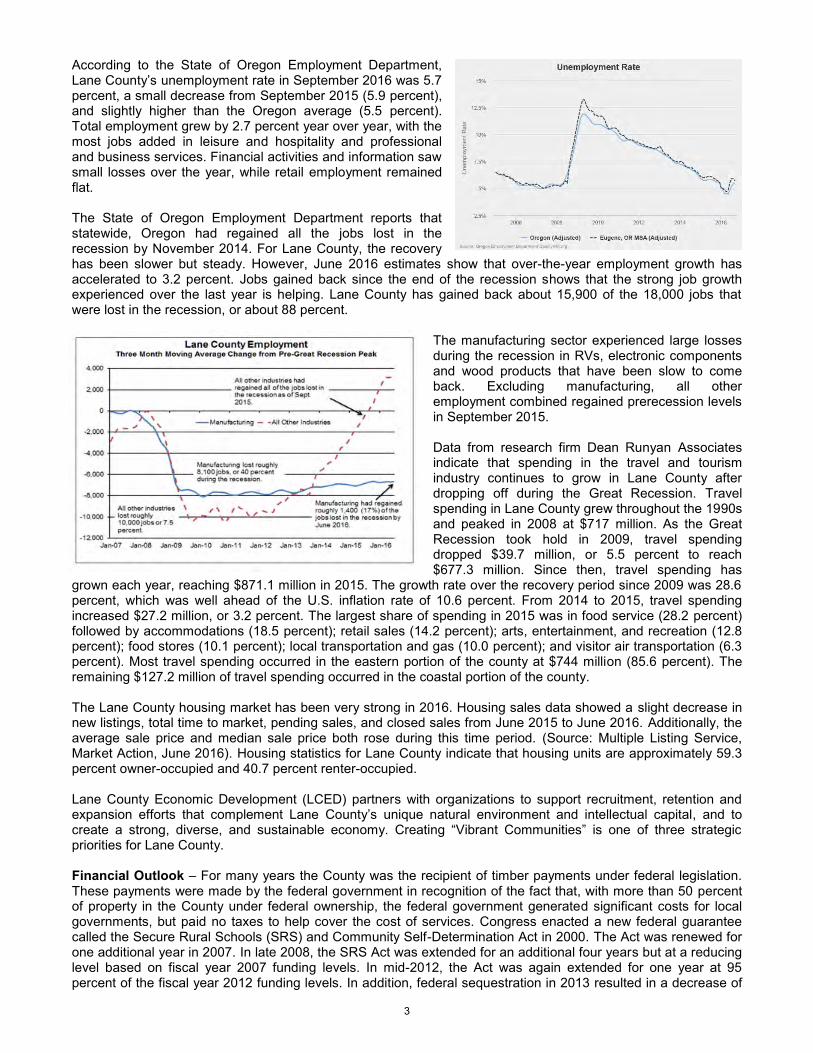
According to the State of Oregon Employment Department, Lane County’s unemployment rate in September 2016 was 5.7 percent, a small decrease from September 2015 (5.9 percent), and slightly higher than the Oregon average (5.5 percent). Total employment grew by 2.7 percent year over year, with the most jobs added in leisure and hospitality and professional and business services. Financial activities and information saw small losses over the year, while retail employment remained flat. The State of Oregon Employment Department reports that statewide, Oregon had regained all the jobs lost in the recession by November 2014. For Lane County, the recovery has been slower but steady. However, June 2016 estimates show that over-the-year employment growth has accelerated to 3.2 percent. Jobs gained back since the end of the recession shows that the strong job growth experienced over the last year is helping. Lane County has gained back about 15,900 of the 18,000 jobs that were lost in the recession, or about 88 percent.
The manufacturing sector experienced large losses during the recession in RVs, electronic components and wood products that have been slow to come back. Excluding manufacturing, all other employment combined regained prerecession levels in September 2015. Data from research firm Dean Runyan Associates indicate that spending in the travel and tourism industry continues to grow in Lane County after dropping off during the Great Recession. Travel spending in Lane County grew throughout the 1990s and peaked in 2008 at $717 million. As the Great Recession took hold in 2009, travel spending dropped $39.7 million, or 5.5 percent to reach $677.3 million. Since then, travel spending has
grown each year, reaching $871.1 million in 2015. The growth rate over the recovery period since 2009 was 28.6 percent, which was well ahead of the U.S. inflation rate of 10.6 percent. From 2014 to 2015, travel spending increased $27.2 million, or 3.2 percent. The largest share of spending in 2015 was in food service (28.2 percent) followed by accommodations (18.5 percent); retail sales (14.2 percent); arts, entertainment, and recreation (12.8 percent); food stores (10.1 percent); local transportation and gas (10.0 percent); and visitor air transportation (6.3 percent). Most travel spending occurred in the eastern portion of the county at $744 million (85.6 percent). The remaining $127.2 million of travel spending occurred in the coastal portion of the county. The Lane County housing market has been very strong in 2016. Housing sales data showed a slight decrease in new listings, total time to market, pending sales, and closed sales from June 2015 to June 2016. Additionally, the average sale price and median sale price both rose during this time period. (Source: Multiple Listing Service, Market Action, June 2016). Housing statistics for Lane County indicate that housing units are approximately 59.3 percent owner-occupied and 40.7 percent renter-occupied. Lane County Economic Development (LCED) partners with organizations to support recruitment, retention and expansion efforts that complement Lane County’s unique natural environment and intellectual capital, and to create a strong, diverse, and sustainable economy. Creating “Vibrant Communities” is one of three strategic priorities for Lane County. Financial Outlook – For many years the County was the recipient of timber payments under federal legislation. These payments were made by the federal government in recognition of the fact that, with more than 50 percent of property in the County under federal ownership, the federal government generated significant costs for local governments, but paid no taxes to help cover the cost of services. Congress enacted a new federal guarantee called the Secure Rural Schools (SRS) and Community Self-Determination Act in 2000. The Act was renewed for one additional year in 2007. In late 2008, the SRS Act was extended for an additional four years but at a reducing level based on fiscal year 2007 funding levels. In mid-2012, the Act was again extended for one year at 95 percent of the fiscal year 2012 funding levels. In addition, federal sequestration in 2013 resulted in a decrease of
3
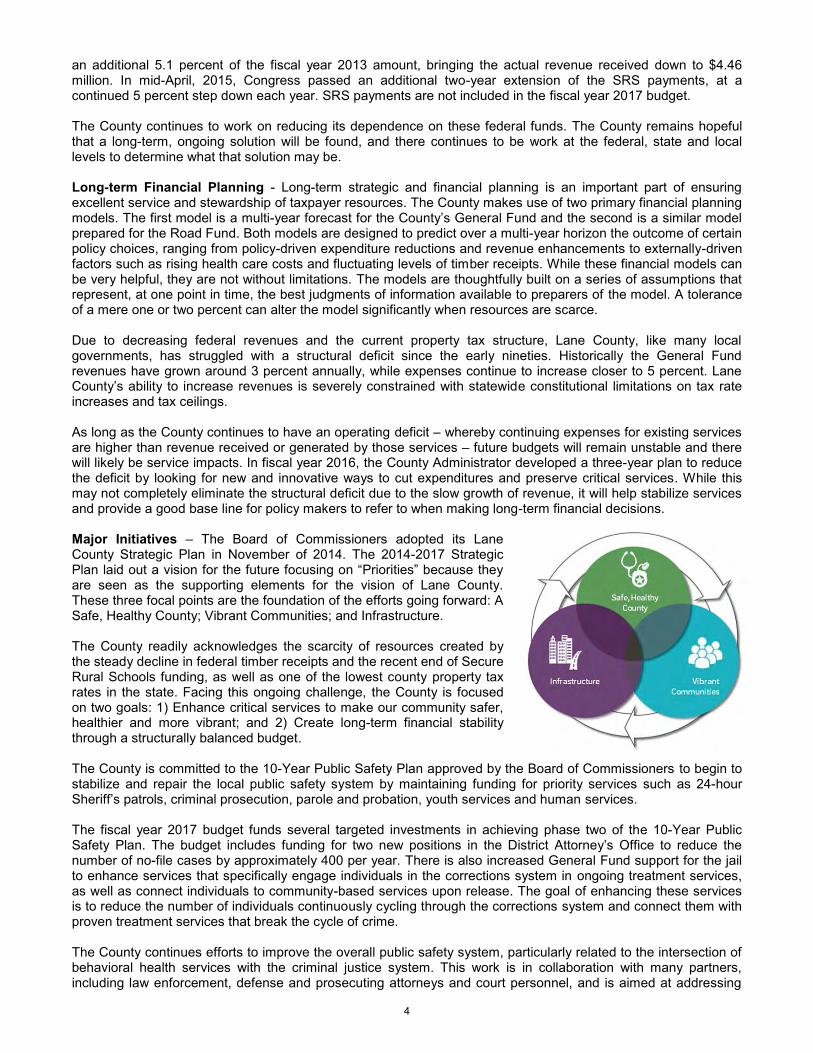
an additional 5.1 percent of the fiscal year 2013 amount, bringing the actual revenue received down to $4.46 million. In mid-April, 2015, Congress passed an additional two-year extension of the SRS payments, at a continued 5 percent step down each year. SRS payments are not included in the fiscal year 2017 budget. The County continues to work on reducing its dependence on these federal funds. The County remains hopeful that a long-term, ongoing solution will be found, and there continues to be work at the federal, state and local levels to determine what that solution may be. Long-term Financial Planning - Long-term strategic and financial planning is an important part of ensuring excellent service and stewardship of taxpayer resources. The County makes use of two primary financial planning models. The first model is a multi-year forecast for the County’s General Fund and the second is a similar model prepared for the Road Fund. Both models are designed to predict over a multi-year horizon the outcome of certain policy choices, ranging from policy-driven expenditure reductions and revenue enhancements to externally-driven factors such as rising health care costs and fluctuating levels of timber receipts. While these financial models can be very helpful, they are not without limitations. The models are thoughtfully built on a series of assumptions that represent, at one point in time, the best judgments of information available to preparers of the model. A tolerance of a mere one or two percent can alter the model significantly when resources are scarce. Due to decreasing federal revenues and the current property tax structure, Lane County, like many local governments, has struggled with a structural deficit since the early nineties. Historically the General Fund revenues have grown around 3 percent annually, while expenses continue to increase closer to 5 percent. Lane County’s ability to increase revenues is severely constrained with statewide constitutional limitations on tax rate increases and tax ceilings. As long as the County continues to have an operating deficit – whereby continuing expenses for existing services are higher than revenue received or generated by those services – future budgets will remain unstable and there will likely be service impacts. In fiscal year 2016, the County Administrator developed a three-year plan to reduce the deficit by looking for new and innovative ways to cut expenditures and preserve critical services. While this may not completely eliminate the structural deficit due to the slow growth of revenue, it will help stabilize services and provide a good base line for policy makers to refer to when making long-term financial decisions. Major Initiatives – The Board of Commissioners adopted its Lane County Strategic Plan in November of 2014. The 2014-2017 Strategic Plan laid out a vision for the future focusing on “Priorities” because they are seen as the supporting elements for the vision of Lane County. These three focal points are the foundation of the efforts going forward: A Safe, Healthy County; Vibrant Communities; and Infrastructure. The County readily acknowledges the scarcity of resources created by the steady decline in federal timber receipts and the recent end of Secure Rural Schools funding, as well as one of the lowest county property tax rates in the state. Facing this ongoing challenge, the County is focused on two goals: 1) Enhance critical services to make our community safer, healthier and more vibrant; and 2) Create long-term financial stability through a structurally balanced budget. The County is committed to the 10-Year Public Safety Plan approved by the Board of Commissioners to begin to stabilize and repair the local public safety system by maintaining funding for priority services such as 24-hour Sheriff’s patrols, criminal prosecution, parole and probation, youth services and human services. The fiscal year 2017 budget funds several targeted investments in achieving phase two of the 10-Year Public Safety Plan. The budget includes funding for two new positions in the District Attorney’s Office to reduce the number of no-file cases by approximately 400 per year. There is also increased General Fund support for the jail to enhance services that specifically engage individuals in the corrections system in ongoing treatment services, as well as connect individuals to community-based services upon release. The goal of enhancing these services is to reduce the number of individuals continuously cycling through the corrections system and connect them with proven treatment services that break the cycle of crime. The County continues efforts to improve the overall public safety system, particularly related to the intersection of behavioral health services with the criminal justice system. This work is in collaboration with many partners, including law enforcement, defense and prosecuting attorneys and court personnel, and is aimed at addressing
4
the needs of individuals who are frequent utilizers of crisis, jail and emergency services. Advances in this work include:
A new community crisis center will address the needs of individuals experiencing a mental health crisis that would otherwise be utilizing the emergency rooms or jail
Expansion of other crisis services including CAHOOTS and crisis respite housing options Expansion of the Jail Intercept program for individuals in the jail system that can be better served at Lane
County Behavioral Health; the goal of this program is to reduce the number of individuals cycling through the criminal justice system by engaging them in ongoing mental health services
In May 2013, voters passed a limited local option levy property tax in the amount of $0.55 per $1,000 maximum assessed value to restore jail beds and critical youth service for a period of five years. The purpose of the levy is to rebuild the public safety system and a means of finding funding sources other than the decreasing timber funds to provide critical services to residents. Due to reduced expenses during the first two years, in 2016, the tax rate was lowered to $0.38 per $1,000 maximum assessed value, thus reducing the costs to the taxpayers. The County continues to focus on reducing internal costs, such as health insurance, debt, vehicles and other expenses. Health insurance costs in the marketplace are projected to increase nearly ten percent next year. Lane County’s health insurance costs, however, are estimated to be nearly flat at approximately 1.5 percent growth from the prior year. This is due to the shift to a self-funded health insurance model in 2015 and the continued investment in various wellness initiatives that seek to improve health and control costs. The County also targeted and successfully achieved cost reductions for County vehicles, as well as reduced costs for computers. The County goal is to reduce the vehicle fleet by 10 percent over the next two years to continue to shrink costs. Also, the County will use one-time reserves to reduce debt obligations to reduce ongoing costs. Relevant Financial Policies – The County has adopted financial and budget policies to support the County’s strategic goals, ensure stability in service delivery and promote the efficient use of public funds. It is Lane County’s policy to establish reserve funds which can be used to reduce the impact of substantial revenue fluctuations, thus providing for a more stable delivery of services to Lane County citizens. Reserves can be observed as part of cash and cash equivalents, as well as fund balance.
AWARDS AND ACKNOWLEDGEMENTS Certificate of Achievement – The Government Finance Officers Association of the United States and Canada (GFOA) awarded a Certificate of Achievement for Excellence in Financial Reporting to Lane County, Oregon for its comprehensive annual financial report for the fiscal year ended June 30, 2015. This was the thirteenth consecutive year that Lane County has achieved this award. In order to be awarded a Certificate of Achievement, a government must publish an easily readable and efficiently organized comprehensive annual financial report. This report must satisfy both generally accepted accounting principles and applicable legal requirements. A Certificate of Achievement is valid for a period of one year only. We believe that our current comprehensive annual financial report continues to meet the Certificate of Achievement Program’s requirements and we are submitting it to the GFOA to determine its eligibility for another certificate. Acknowledgements - The preparation of this CAFR would not have been possible without the dedicated services of the Financial Services staff. We extend our sincere appreciation for their assistance in the preparation of this report. We also acknowledge the cooperation and assistance of other County staff contributing to this effort. Finally, we extend appreciation to the County Administrator, the members of the Finance & Audit Committee and the Board of County Commissioners for their interest and support in managing the financial operations of Lane County. Respectfully submitted,
Greg Rikhoff Robert Tintle Director of Operations Financial Services Manager
5

6
7
8
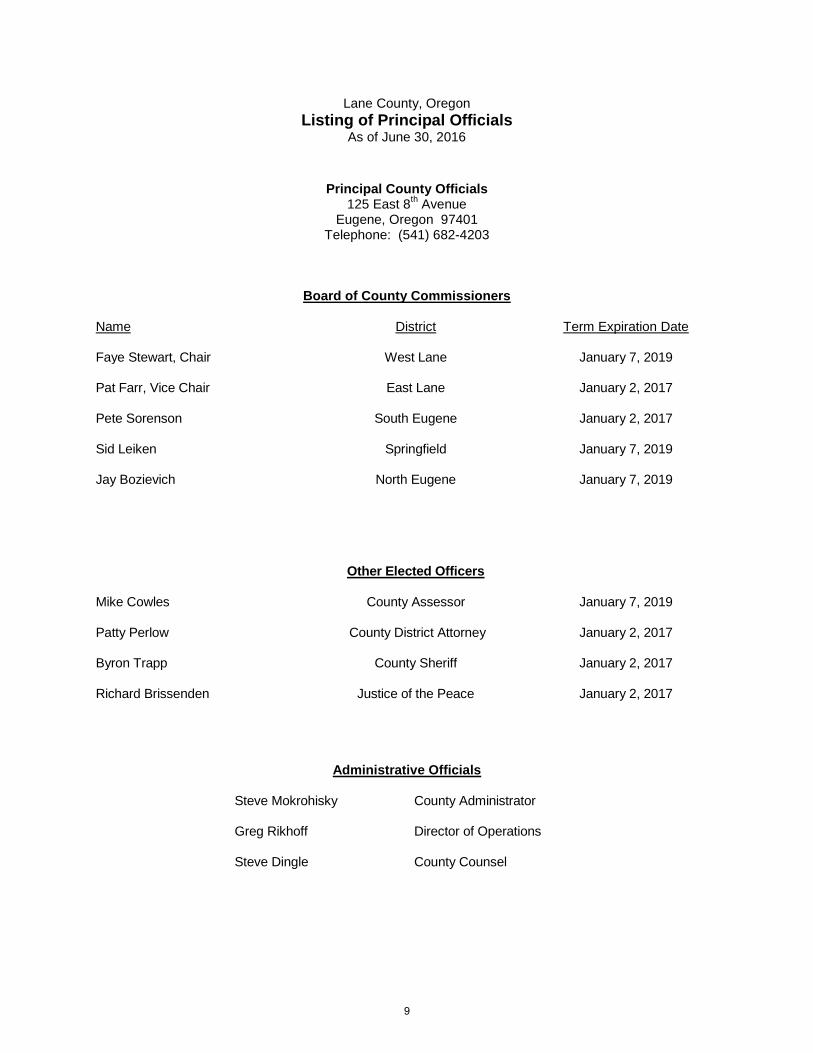
Lane County, Oregon Listing of Principal Officials
As of June 30, 2016
Principal County Officials 125 East 8th Avenue
Eugene, Oregon 97401 Telephone: (541) 682-4203
Board of County Commissioners Name District Term Expiration Date Faye Stewart, Chair West Lane January 7, 2019 Pat Farr, Vice Chair East Lane January 2, 2017 Pete Sorenson South Eugene January 2, 2017 Sid Leiken Springfield January 7, 2019 Jay Bozievich North Eugene January 7, 2019 Other Elected Officers Mike Cowles County Assessor January 7, 2019 Patty Perlow County District Attorney January 2, 2017 Byron Trapp County Sheriff January 2, 2017 Richard Brissenden Justice of the Peace January 2, 2017
Administrative Officials Steve Mokrohisky
Greg Rikhoff
County Administrator Director of Operations
Steve Dingle County Counsel
9

10

FINANCIAL SECTION
INDEPENDENT AUDITOR’S REPORT

REPORTOFINDEPENDENTAUDITORSBoardofCountyCommissionersLaneCounty,OregonReportontheFinancialStatementsWe have audited the accompanying financial statements of the governmental activities, the business‐typeactivities, the discretely presented component unit, each major fund, and the aggregate remaining fundinformationofLaneCounty,Oregon(the“County”)asofandfortheyearendedJune30,2016,andtherelatednotestothefinancialstatements,whichcollectivelycomprisetheCounty’sbasicfinancialstatementsaslistedinthetableofcontents.Management’sResponsibilityfortheFinancialStatementsManagement is responsible for the preparation and fair presentation of these financial statements inaccordancewithaccountingprinciplesgenerallyaccepted intheUnitedStatesofAmerica;this includesthedesign,implementation,andmaintenanceofinternalcontrolrelevanttothepreparationandfairpresentationoffinancialstatementsthatarefreefrommaterialmisstatement,whetherduetofraudorerror.Auditor’sResponsibilityOurresponsibilityistoexpressopinionsonthesefinancialstatementsbasedonouraudit.Wedidnotauditthe financial statementsof theHousingandCommunityServicesAgencyofLaneCounty (“HACSA”),whichrepresent100%oftheassets,netposition,andrevenuesofthediscretelypresentedcomponentunitoftheCounty. Thosestatementswereauditedbyotherauditors,whosereporthasbeenfurnishedtous,andouropinion, insofaras it relates to theamounts included forHACSA, isbasedsolelyon thereportof theotherauditors.We conducted our audit in accordancewith auditing standards generally accepted in theUnitedStates of America and the standards applicable to financial audits contained in Government AuditingStandards,issuedbytheComptrollerGeneraloftheUnitedStates.Thosestandardsrequirethatweplanandperform the audit to obtain reasonable assurance about whether the financial statements are free frommaterialmisstatement.Anauditinvolvesperformingprocedurestoobtainauditevidenceabouttheamountsanddisclosuresinthefinancialstatements.Theproceduresselecteddependontheauditor’sjudgment,includingtheassessmentoftherisksofmaterialmisstatementofthefinancialstatements,whetherduetofraudorerror.Inmakingthoserisk assessments, the auditor considers internal control relevant to the entity’s preparation and fairpresentation of the financial statements in order to design audit procedures that are appropriate in thecircumstances,butnotforthepurposeofexpressinganopinionontheeffectivenessoftheentity’sinternalcontrol.Accordingly,weexpressnosuchopinion.Anauditalso includesevaluating theappropriatenessofaccountingpoliciesusedandthereasonablenessofsignificantaccountingestimatesmadebymanagement,aswellasevaluatingtheoverallpresentationofthefinancialstatements.Webelievethattheauditevidencewehaveobtainedissufficientandappropriatetoprovideabasisforourauditopinions.
11
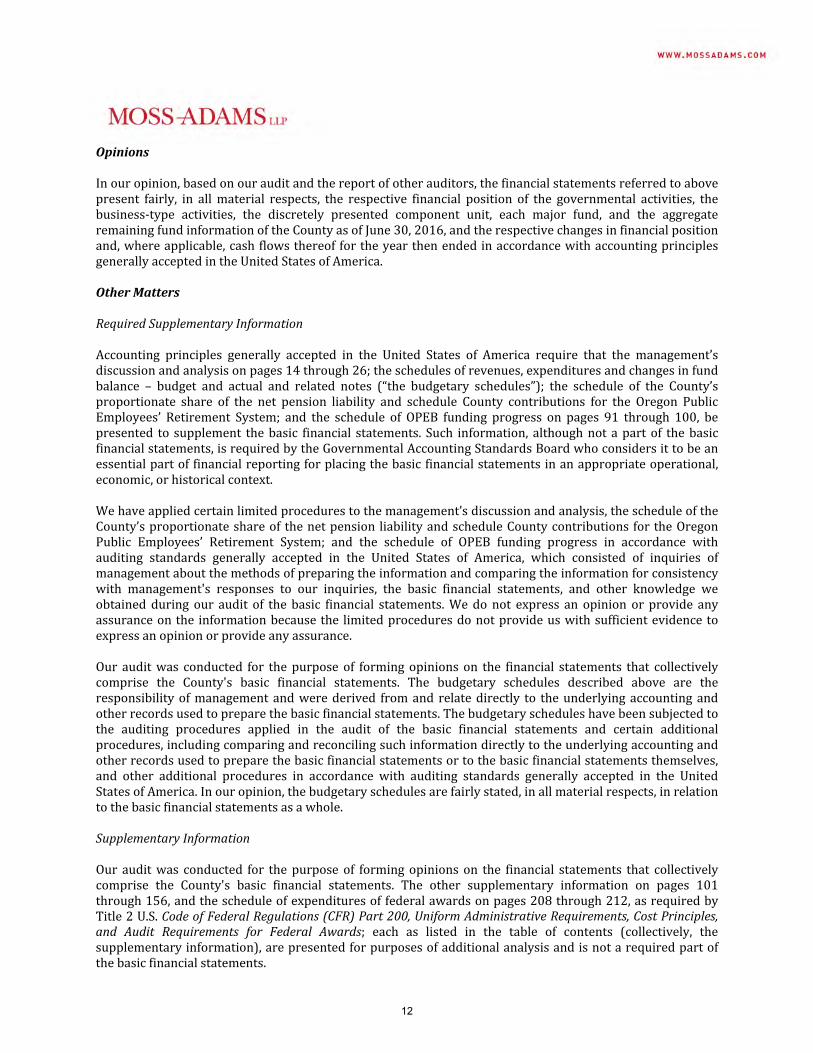
OpinionsInouropinion,basedonourauditandthereportofotherauditors,thefinancialstatementsreferredtoabovepresent fairly, in allmaterial respects, the respective financial position of the governmental activities, thebusiness‐type activities, the discretely presented component unit, each major fund, and the aggregateremainingfundinformationoftheCountyasofJune30,2016,andtherespectivechangesinfinancialpositionand,whereapplicable,cashflowsthereoffortheyearthenendedinaccordancewithaccountingprinciplesgenerallyacceptedintheUnitedStatesofAmerica.OtherMattersRequiredSupplementaryInformationAccounting principles generally accepted in the United States of America require that the management’sdiscussionandanalysisonpages14through26;theschedulesofrevenues,expendituresandchangesinfundbalance – budget and actual and related notes (“the budgetary schedules”); the schedule of the County’sproportionate share of the net pension liability and schedule County contributions for the Oregon PublicEmployees’ Retirement System; and the schedule of OPEB funding progress on pages 91 through 100, bepresented to supplement thebasic financial statements. Such information, althoughnot apartof thebasicfinancialstatements,isrequiredbytheGovernmentalAccountingStandardsBoardwhoconsidersittobeanessentialpartoffinancialreportingforplacingthebasicfinancialstatementsinanappropriateoperational,economic,orhistoricalcontext.Wehaveappliedcertainlimitedprocedurestothemanagement’sdiscussionandanalysis,thescheduleoftheCounty’sproportionateshareof thenetpension liabilityandscheduleCountycontributionsfortheOregonPublic Employees’ Retirement System; and the schedule of OPEB funding progress in accordance withauditing standards generally accepted in the United States of America, which consisted of inquiries ofmanagementaboutthemethodsofpreparingtheinformationandcomparingtheinformationforconsistencywith management's responses to our inquiries, the basic financial statements, and other knowledge weobtained during our audit of the basic financial statements.Wedo not express an opinion or provide anyassuranceonthe informationbecausethe limitedproceduresdonotprovideuswithsufficientevidencetoexpressanopinionorprovideanyassurance.Our auditwas conducted for thepurpose of formingopinionson the financial statements that collectivelycomprise the County's basic financial statements. The budgetary schedules described above are theresponsibilityofmanagementandwerederived fromand relatedirectly to theunderlyingaccountingandotherrecordsusedtopreparethebasicfinancialstatements.Thebudgetaryscheduleshavebeensubjectedtothe auditing procedures applied in the audit of the basic financial statements and certain additionalprocedures,includingcomparingandreconcilingsuchinformationdirectlytotheunderlyingaccountingandotherrecordsusedtopreparethebasicfinancialstatementsortothebasicfinancialstatementsthemselves,and other additional procedures in accordance with auditing standards generally accepted in the UnitedStatesofAmerica.Inouropinion,thebudgetaryschedulesarefairlystated,inallmaterialrespects,inrelationtothebasicfinancialstatementsasawhole.SupplementaryInformationOur auditwas conducted for thepurpose of formingopinionson the financial statements that collectivelycomprise the County's basic financial statements. The other supplementary information on pages 101through156,andthescheduleofexpendituresoffederalawardsonpages208through212,asrequiredbyTitle2U.S.CodeofFederalRegulations(CFR)Part200,UniformAdministrativeRequirements,CostPrinciples,and Audit Requirements for Federal Awards; each as listed in the table of contents (collectively, thesupplementaryinformation),arepresentedforpurposesofadditionalanalysisandisnotarequiredpartofthebasicfinancialstatements.
12
The supplementary information is the responsibility of management and was derived from and relatesdirectlytotheunderlyingaccountingandotherrecordsusedtopreparethebasicfinancialstatements.Suchinformation has been subjected to the auditing procedures applied in the audit of the basic financialstatementsandcertainadditionalprocedures,includingcomparingandreconcilingsuchinformationdirectlytotheunderlyingaccountingandotherrecordsusedtopreparethebasicfinancialstatementsortothebasicfinancial statements themselves, and other additional procedures in accordance with auditing standardsgenerally accepted in the United States of America. In our opinion, the other supplementary information,other financial schedules, and schedule of expenditures of federal awards are fairly stated, in allmaterialrespects,inrelationtothebasicfinancialstatementsasawhole.OtherInformation
Our auditwas conducted for thepurpose of formingopinionson the financial statements that collectivelycomprise the County’s basic financial statements. The introductory section and statistical section arepresentedforpurposesofadditionalanalysisandarenotarequiredpartofthebasicfinancialstatements.Theintroductorysectionandstatisticalsectionhavenotbeensubjectedtotheauditingproceduresappliedinthe audit of the basic financial statements, and accordingly,we do not express on opinion or provide anyassuranceonit.
ReportsofOtherLegalandRegulatoryRequirementsOtherReportingRequiredbyGovernmentAuditingStandardsInaccordancewithGovernmentAuditingStandards,wehavealsoissuedourreportdatedDecember12,2016on our consideration of the County's internal control over financial reporting and on our tests of itscompliancewithcertainprovisionsoflaws,regulations,contracts,andgrantagreementsandothermatters.Thepurposeofthatreportistodescribethescopeofourtestingofinternalcontroloverfinancialreportingandcomplianceandtheresultsofthattesting,andnottoprovideanopiniononinternalcontroloverfinancialreporting or on compliance. That report is an integral part of an audit performed in accordance withGovernment Auditing Standards in considering the County's internal control over financial reporting andcompliance.OtherReportingRequiredbyMinimumStandardsforAuditsofOregonMunicipalCorporationsInaccordancewiththeMinimumStandardsforAuditsofOregonMunicipalCorporations,wehaveissuedourreportdatedDecember12,2016,onourconsiderationoftheCounty’scompliancewithcertainprovisionsoflaws and regulations, including the provisions of Oregon Revised Statutes as specified in OregonAdministrativeRules.Thepurposeofthatreportistodescribethescopeofourtestingofcomplianceandtheresultsofthattestingandnottoprovideanopiniononcompliance.
ForMossAdamsLLPEugene,OregonDecember12,2016
13

Management’s Discussion and Analysis The management of Lane County, Oregon (County) presents this narrative overview to facilitate both a short-term and long-term analysis of the financial activities of the County for the fiscal year ended June 30, 2016. This Management’s Discussions and Analysis (MD&A) is based on currently known facts, decisions, and conditions that existed as of the date of the independent auditor’s report. Additional information outside the scope of this analysis can be found in the Letter of Transmittal.
Financial Highlights
The assets and deferred outflows of resources of Lane County exceeded its liabilities and deferred inflows of resources at June 30, 2016, by $431.9 million (total net position). The County’s unrestricted portion of net position is $23.5 million, while restricted net position is $80.5 million, both of which may be used to meet the County’s ongoing obligations to citizens and creditors.
Net Position decreased from $454.8 million to $431.9, a decrease of $22.9 million. The decrease is mainly
due to the recognition of the County’s portion of the OPERS net pension liability. The Oregon Supreme Court decision in Moro v. State of Oregon, issued on April 30, 2015, reversed a significant portion of the reductions in the 2013 Oregon Legislature made to future system Cost of Living Adjustments (COLA) through Senate Bills 822 and 861. This reversal increased the benefits projected to be paid by employers compared to those developed in the prior actuarial valuation, and consequently increased plan liabilities and resulted in a significant increase in the County’s pension expense and net pension liability. Adjusting for the impact of the Moro Decision, the County recognized net pension expense of $61.2 million. This amount was allocated to the functions on the Statement of Activities based on their share of the pension obligation, resulting in a significant increase in the overall direct expenses and decrease in net position. Additionally, at June 30, 2015, the County reported a net pension asset of $25 million. Conversely, at June 30, 2016, the County reported a net pension liability of $63.6 million.
At June 30, 2016, the County’s governmental funds reported combined ending fund balances of $139.4 million, an increase of $23.3 million. The majority of the increase is a direct result of the public safety local option tax levy that generated $6.2 million in additional spendable fund balances by year end and $8.4 million from the administration of the behavioral health benefits to Oregon Health Plan members, funded through a contract with Trillium Community Health. Approximately $67.8 million is available for spending by the board.
Spendable, non-restricted fund balance for the General Fund is $15.3 million at the end of the current fiscal
year, or 23.3 percent of General Fund total revenues.
Overview of the Financial Statements The following discussion and analysis is intended to serve as an introduction to Lane County’s basic financial statements. The County’s basic financial statements comprise three components: 1) government-wide financial statements, 2) fund financial statements and 3) notes to basic financial statements. This report also contains other supplementary information in addition to the basic financial statements. Government-wide financial statements. The government-wide financial statements are designed to provide readers with a broad overview of the Lane County’s finances, in a manner similar to a private-sector business. The Statement of Net Position presents information on all of the Lane County’s assets, deferred outflows of resources, liabilities and deferred inflows of resources. Assets and deferred outflows of resources less liabilities and deferred inflows of resources are reported as total net position. Over time, increases or decreases in net position may serve as a useful indicator of whether the financial position of the County is improving or deteriorating.
14
Lane County, Oregon Management’s Discussion and Analysis June 30, 2016
The Statement of Activities presents information showing how the County’s net position changed during fiscal year ended June 30, 2016. Changes in net position are reported when the underlying event giving rise to the change occurs, regardless of the timing of related cash flows. Thus, revenues and expenses are reported in this statement for some items that will result in cash flows in a future fiscal period. Examples include property taxes and accrued compensated absences. Each of these government-wide financial statements, Statement of Net Position and Statement of Activities, distinguish functions of the County that are principally supported by taxes and intergovernmental revenues (governmental activities) from other functions that are intended to recover all, or a significant portion of, their costs through charges for services (business-type activities). The governmental activities of the County include the following:
General government Public health and welfare Roads and bridges
Public safety Parks Community development
The business-type activities of the County include the following:
Lane events center Corrections commissary
Solid waste disposal Land management
The government-wide financial statements include not only Lane County, the primary government, but also the legally separate Housing and Community Services Agency of Lane County (HACSA), for which Lane County is financially accountable. Although HACSA is legally separate and provides no financial benefit or burden to Lane County, HACSA’s governing body is substantially identical to Lane County’s. As a result HACSA’s financial statements are discretely presented in the County’s financial statements. There was no change to the governing body of HACSA during fiscal year 2016. See pages 43-44 and 71-73 of this report for more information. The government-wide financial statements also include the Lane Events Center, a division of Public Works. The operation of the Lane Events Center is managed by a director who reports to the county administrator, while the County Fair is governed by a separate Fair Board appointed by the Board of County Commissioners. The government-wide financial statements can be found on pages 27-29 of this report. Fund financial statements. A fund is a grouping of related accounts that is used to maintain control over resources that have been segregated for specific activities or objectives. Lane County, like other state and local governmental entities, uses fund accounting to ensure and demonstrate compliance with finance-related legal requirements. All of the funds of the County can be divided into three categories: governmental funds, proprietary funds, and fiduciary funds. Governmental funds. Governmental funds are used to account for many of the same functions reported as governmental activities in the government-wide financial statements. However, unlike the government-wide financial statements, governmental fund financial statements focus on the acquisition and use of current spendable resources, as well as on balances of spendable resources available at the end of the fiscal year. Such information may be useful in evaluating the County’s near-term requirements. Because the focus of governmental funds is narrower than that of the government-wide financial statements, it is useful to compare the information presented for governmental funds with similar information presented for governmental activities in the government-wide financial statements. By doing so, readers may better understand the long-term impact of the County’s near-term financial decisions. Both the governmental fund balance sheet and statements of revenues, expenditures, and changes in fund balances provide a reconciliation to facilitate this comparison between governmental funds and governmental activities. These reconciliations can be found on pages 33 and 37 of this report. The County maintains 19 individual governmental funds made up of 1 general fund, 13 special revenue funds, 3 debt service funds, and 2 capital projects funds. Information is presented separately in the governmental fund balance sheet and in the governmental fund statements of revenues, expenditures, and changes in fund balances for the General Fund, Road, Special Revenue/Services, Health and Human Services, Trillium Behavioral Health, and Local Option Tax Levy special revenue funds, all of which are considered to be major funds. Data from the other 16 governmental funds are combined into a single, aggregated presentation. Summary data by fund-type for these nonmajor governmental funds is provided in the form of combining statements on pages 101-102 of this
15
Lane County, Oregon Management’s Discussion and Analysis June 30, 2016
report. Individual fund data for each of these nonmajor governmental funds is provided in the form of combining statements on pages 104-107, 117-118 and 123-124. The basic governmental fund financial statements can be found on pages 30-31 and 34-35. Proprietary funds. The County maintains two different types of proprietary funds – enterprise funds and internal service funds. Enterprise funds are used to report the same functions presented as business-type activities in the governmental-wide financial statements. The County uses enterprise funds to account for the events center, solid waste disposal operations, corrections commissary operations, and land management functions. Internal service funds are an accounting device used to accumulate and allocate costs internally among the County’s various functions. The County uses internal service funds to account for its self-insurance and employee benefits activities, pension bond servicing, motor pool operations, intergovernmental services activities, technology (PC) replacement and information services activities, and retiree medical benefits. Because internal service funds predominantly benefit governmental rather than business-type functions, these fund assets, deferred outflows, liabilities, and deferred inflows have been included with governmental activities in the government-wide financial statements. Proprietary funds provide the same type of information as reported for the business-type activities in the government-wide financial statements, but in more detail. The proprietary fund financial statements provide separate information for the solid waste disposal operations, which is considered to be a major fund of the County. Conversely, the three remaining enterprise funds are combined into a single, aggregated presentation in the proprietary fund financial statements, as are all internal service funds. Individual fund data for the three nonmajor enterprise funds and each of the internal service funds is provided in the form of combining statements on pages 127-129 and 136-141 of this report. The basic proprietary fund financial statements can be found on pages 38-40 of this report. Fiduciary funds. Fiduciary funds are used to account for resources held for the benefit of parties outside the County. Fiduciary funds are not reflected in the government-wide financial statements because the resources are not available to support the County’s own programs. The accounting used for fiduciary funds is similar to that used for proprietary funds. The basic fiduciary fund financial statements can be found on page 41 of this report. The statement of changes in assets and liabilities in agency funds can be found on page 151. Budgetary comparisons. The County adopts an annual appropriated budget for all its funds except for agency funds. To demonstrate compliance, budgetary comparison statements have been provided for major funds as part of the basic financial statements on pages 91-96 of this report. Budgetary comparisons for all other funds are provided on pages 108-115, 119-121, 125-126,130-133 and 142-149 of this report. Notes to basic financial statements. The notes provide additional information that is essential to a full understanding of the data provided in the government-wide and fund financial statements. The notes to the financial statements can be found on pages 43-89 of this report. Other information. In addition to the basic financial statements and accompanying notes, this report also presents certain required supplementary information. Budget-to-actual comparisons for the General Fund and the Road, Special Revenue/Services, Health and Human Services, Trillium Behavioral Health, and Local Option Tax Levy special revenue funds are presented in this section, along with reconciliations between the budgetary basis of accounting and Generally Accepted Accounting Principles (GAAP). The schedule of OPEB funding progress is presented in this section concerning the County’s progress in funding its obligation to provide other post-employment benefits (OPEB) to its employees. The information related to the pension plan is also presented as the schedule of County contributions, and the schedule of the County’s proportionate share of the net pension liability. This required supplementary information is found on pages 98-99 of this report. The combining statements for the nonmajor governmental funds, enterprise funds, and internal service funds are presented immediately following the required supplementary information as Other Supplementary Information.
16
Lane County, Oregon Management’s Discussion and Analysis June 30, 2016
Government-wide Financial Analysis
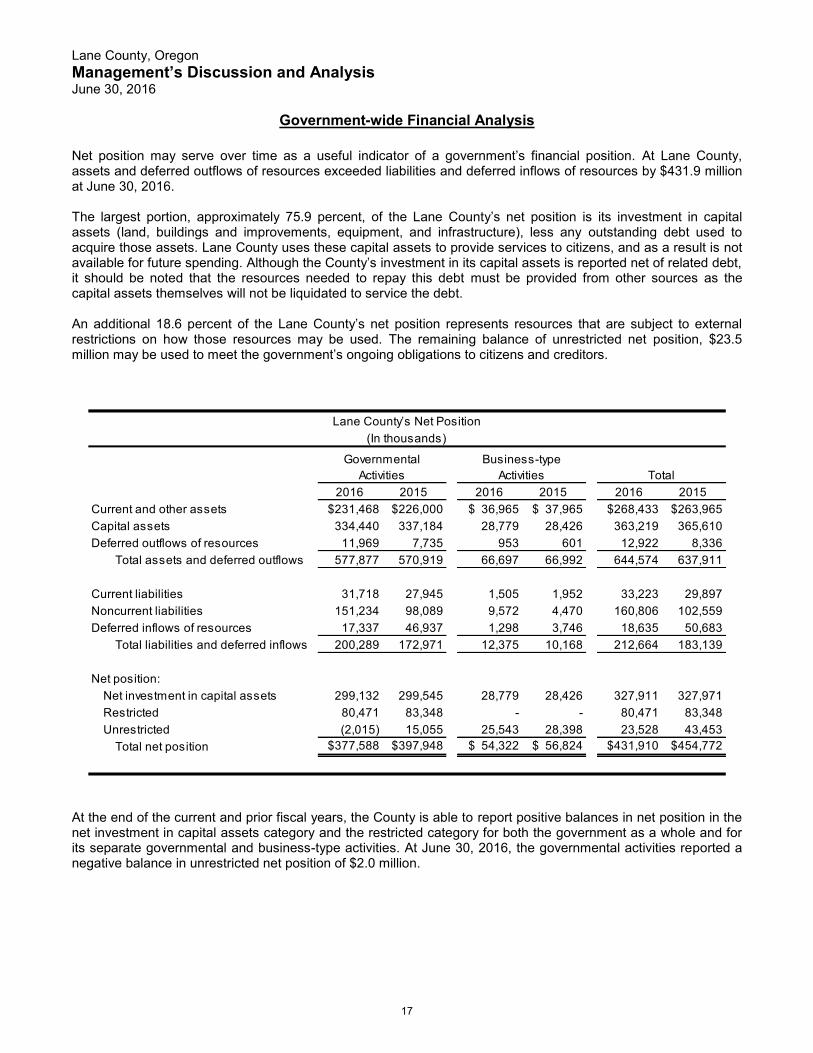
Net position may serve over time as a useful indicator of a government’s financial position. At Lane County, assets and deferred outflows of resources exceeded liabilities and deferred inflows of resources by $431.9 million at June 30, 2016. The largest portion, approximately 75.9 percent, of the Lane County’s net position is its investment in capital assets (land, buildings and improvements, equipment, and infrastructure), less any outstanding debt used to acquire those assets. Lane County uses these capital assets to provide services to citizens, and as a result is not available for future spending. Although the County’s investment in its capital assets is reported net of related debt, it should be noted that the resources needed to repay this debt must be provided from other sources as the capital assets themselves will not be liquidated to service the debt. An additional 18.6 percent of the Lane County’s net position represents resources that are subject to external restrictions on how those resources may be used. The remaining balance of unrestricted net position, $23.5 million may be used to meet the government’s ongoing obligations to citizens and creditors.
2016 2015 2016 2015 2016 2015Current and other assets $231,468 $226,000 $ 36,965 $ 37,965 $268,433 $263,965 Capital assets 334,440 337,184 28,779 28,426 363,219 365,610 Deferred outflows of resources 11,969 7,735 953 601 12,922 8,336
Total assets and deferred outflows 577,877 570,919 66,697 66,992 644,574 637,911
Current liabilities 31,718 27,945 1,505 1,952 33,223 29,897 Noncurrent liabilities 151,234 98,089 9,572 4,470 160,806 102,559 Deferred inflows of resources 17,337 46,937 1,298 3,746 18,635 50,683
Total liabilities and deferred inflows 200,289 172,971 12,375 10,168 212,664 183,139
Net position:Net investment in capital assets 299,132 299,545 28,779 28,426 327,911 327,971 Restricted 80,471 83,348 - - 80,471 83,348 Unrestricted (2,015) 15,055 25,543 28,398 23,528 43,453
Total net position $377,588 $397,948 $ 54,322 $ 56,824 $431,910 $454,772
Governmental Activities Total
Lane County’s Net Position (In thousands)
Business-type Activities
At the end of the current and prior fiscal years, the County is able to report positive balances in net position in the net investment in capital assets category and the restricted category for both the government as a whole and for its separate governmental and business-type activities. At June 30, 2016, the governmental activities reported a negative balance in unrestricted net position of $2.0 million.
17
Lane County, Oregon Management’s Discussion and Analysis June 30, 2016
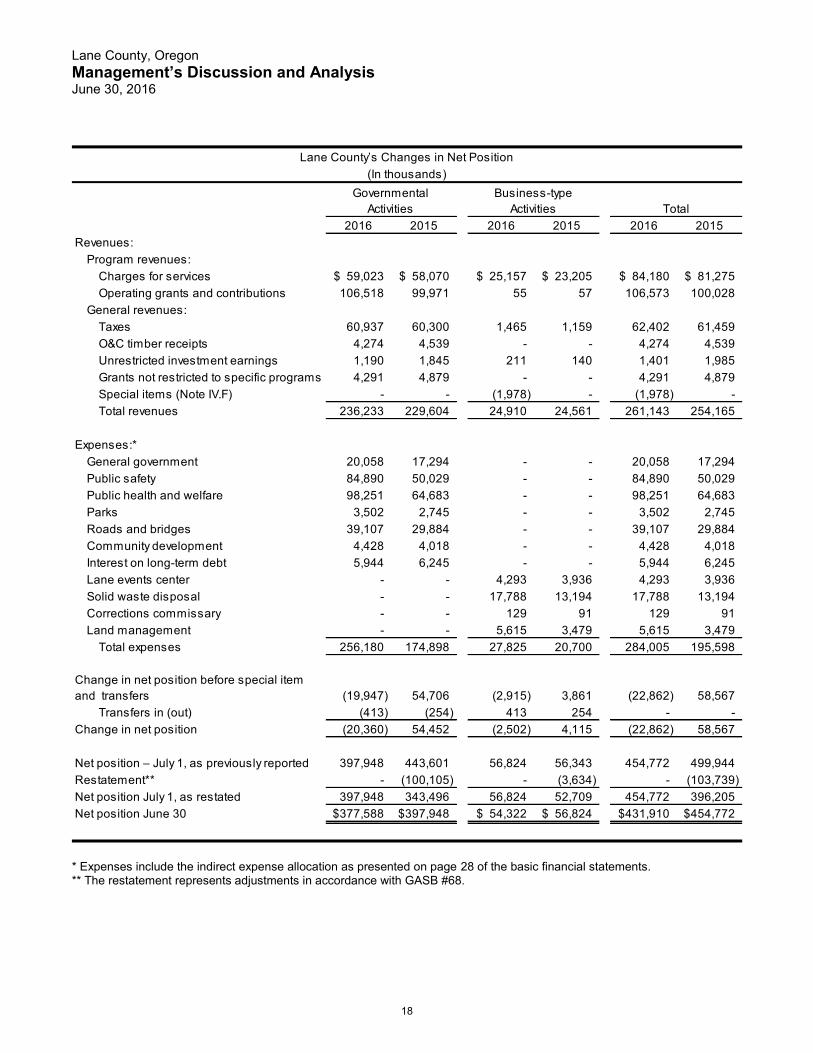
2016 2015 2016 2015 2016 2015Revenues:
Program revenues:Charges for services 59,023$ 58,070$ 25,157$ 23,205$ 84,180$ 81,275$ Operating grants and contributions 106,518 99,971 55 57 106,573 100,028
General revenues:Taxes 60,937 60,300 1,465 1,159 62,402 61,459 O&C timber receipts 4,274 4,539 - - 4,274 4,539 Unrestricted investment earnings 1,190 1,845 211 140 1,401 1,985 Grants not restricted to specific programs 4,291 4,879 - - 4,291 4,879 Special items (Note IV.F) - - (1,978) - (1,978) - Total revenues 236,233 229,604 24,910 24,561 261,143 254,165
Expenses:*General government 20,058 17,294 - - 20,058 17,294 Public safety 84,890 50,029 - - 84,890 50,029 Public health and welfare 98,251 64,683 - - 98,251 64,683 Parks 3,502 2,745 - - 3,502 2,745 Roads and bridges 39,107 29,884 - - 39,107 29,884 Community development 4,428 4,018 - - 4,428 4,018 Interest on long-term debt 5,944 6,245 - - 5,944 6,245 Lane events center - - 4,293 3,936 4,293 3,936 Solid waste disposal - - 17,788 13,194 17,788 13,194 Corrections commissary - - 129 91 129 91 Land management - - 5,615 3,479 5,615 3,479
Total expenses 256,180 174,898 27,825 20,700 284,005 195,598
Change in net position before special item and transfers (19,947) 54,706 (2,915) 3,861 (22,862) 58,567
Transfers in (out) (413) (254) 413 254 - - Change in net position (20,360) 54,452 (2,502) 4,115 (22,862) 58,567
Net position – July 1, as previously reported 397,948 443,601 56,824 56,343 454,772 499,944 Restatement** - (100,105) - (3,634) - (103,739) Net position July 1, as restated 397,948 343,496 56,824 52,709 454,772 396,205 Net position June 30 377,588$ 397,948$ 54,322$ 56,824$ 431,910$ 454,772$
Governmental Activities
Business-type Activities Total
Lane County’s Changes in Net Position(In thousands)
* Expenses include the indirect expense allocation as presented on page 28 of the basic financial statements. ** The restatement represents adjustments in accordance with GASB #68.
18
Lane County, Oregon Management’s Discussion and Analysis June 30, 2016
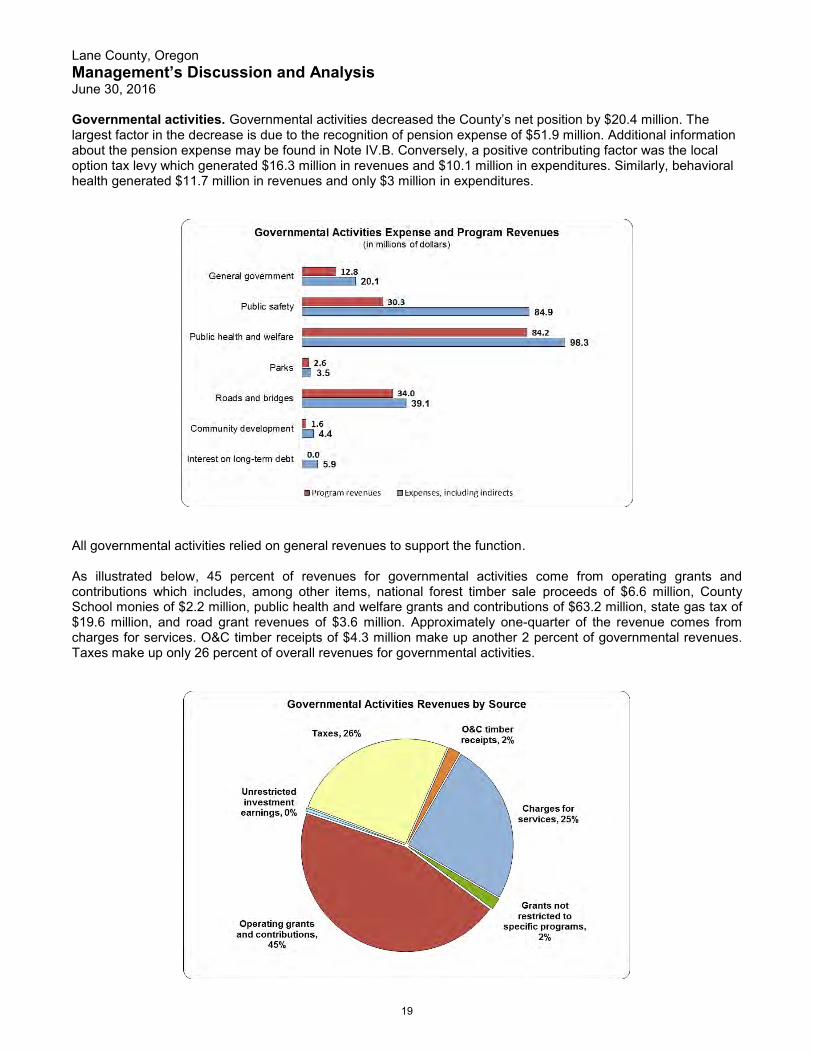
Governmental activities. Governmental activities decreased the County’s net position by $20.4 million. The largest factor in the decrease is due to the recognition of pension expense of $51.9 million. Additional information about the pension expense may be found in Note IV.B. Conversely, a positive contributing factor was the local option tax levy which generated $16.3 million in revenues and $10.1 million in expenditures. Similarly, behavioral health generated $11.7 million in revenues and only $3 million in expenditures.
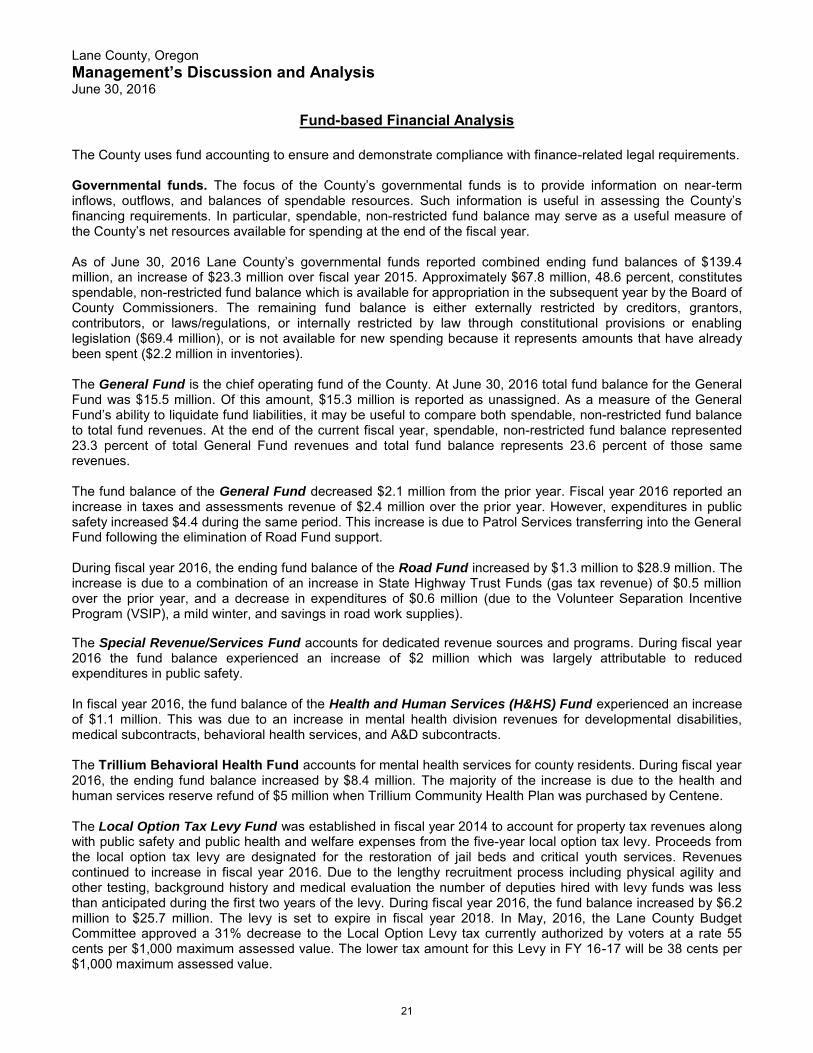
All governmental activities relied on general revenues to support the function. As illustrated below, 45 percent of revenues for governmental activities come from operating grants and contributions which includes, among other items, national forest timber sale proceeds of $6.6 million, County School monies of $2.2 million, public health and welfare grants and contributions of $63.2 million, state gas tax of $19.6 million, and road grant revenues of $3.6 million. Approximately one-quarter of the revenue comes from charges for services. O&C timber receipts of $4.3 million make up another 2 percent of governmental revenues. Taxes make up only 26 percent of overall revenues for governmental activities.
19

Lane County, Oregon Management’s Discussion and Analysis June 30, 2016
Business-type activities. Business–type activities decreased the County’s net position by $2.5 million. The major component of the decrease came from the Solid Waste Disposal fund due to an equipment write-off of $2 million for a reverse osmosis wastewater treatment system intended to treat all of the landfill’s leachate on-site. The system was discontinued due to the failed performance and an uncompleted residuals management system. Also contributing to an overall net position decrease in business-type activities is due to the recognition of pension expense of $4.7 million for the fiscal year.
Within the business-type activities, only corrections commissary and land management activities generated sufficient operating revenues during fiscal year 2016 to cover operating expenses. Approximately 94 percent of the revenues for business-type activities come from charges for services, as illustrated below, with only about 5 percent generated by transient room taxes.
20
Lane County, Oregon Management’s Discussion and Analysis June 30, 2016
Fund-based Financial Analysis
The County uses fund accounting to ensure and demonstrate compliance with finance-related legal requirements. Governmental funds. The focus of the County’s governmental funds is to provide information on near-term inflows, outflows, and balances of spendable resources. Such information is useful in assessing the County’s financing requirements. In particular, spendable, non-restricted fund balance may serve as a useful measure of the County’s net resources available for spending at the end of the fiscal year. As of June 30, 2016 Lane County’s governmental funds reported combined ending fund balances of $139.4 million, an increase of $23.3 million over fiscal year 2015. Approximately $67.8 million, 48.6 percent, constitutes spendable, non-restricted fund balance which is available for appropriation in the subsequent year by the Board of County Commissioners. The remaining fund balance is either externally restricted by creditors, grantors, contributors, or laws/regulations, or internally restricted by law through constitutional provisions or enabling legislation ($69.4 million), or is not available for new spending because it represents amounts that have already been spent ($2.2 million in inventories). The General Fund is the chief operating fund of the County. At June 30, 2016 total fund balance for the General Fund was $15.5 million. Of this amount, $15.3 million is reported as unassigned. As a measure of the General Fund’s ability to liquidate fund liabilities, it may be useful to compare both spendable, non-restricted fund balance to total fund revenues. At the end of the current fiscal year, spendable, non-restricted fund balance represented 23.3 percent of total General Fund revenues and total fund balance represents 23.6 percent of those same revenues. The fund balance of the General Fund decreased $2.1 million from the prior year. Fiscal year 2016 reported an increase in taxes and assessments revenue of $2.4 million over the prior year. However, expenditures in public safety increased $4.4 during the same period. This increase is due to Patrol Services transferring into the General Fund following the elimination of Road Fund support. During fiscal year 2016, the ending fund balance of the Road Fund increased by $1.3 million to $28.9 million. The increase is due to a combination of an increase in State Highway Trust Funds (gas tax revenue) of $0.5 million over the prior year, and a decrease in expenditures of $0.6 million (due to the Volunteer Separation Incentive Program (VSIP), a mild winter, and savings in road work supplies).
The Special Revenue/Services Fund accounts for dedicated revenue sources and programs. During fiscal year 2016 the fund balance experienced an increase of $2 million which was largely attributable to reduced expenditures in public safety. In fiscal year 2016, the fund balance of the Health and Human Services (H&HS) Fund experienced an increase of $1.1 million. This was due to an increase in mental health division revenues for developmental disabilities, medical subcontracts, behavioral health services, and A&D subcontracts. The Trillium Behavioral Health Fund accounts for mental health services for county residents. During fiscal year 2016, the ending fund balance increased by $8.4 million. The majority of the increase is due to the health and human services reserve refund of $5 million when Trillium Community Health Plan was purchased by Centene. The Local Option Tax Levy Fund was established in fiscal year 2014 to account for property tax revenues along with public safety and public health and welfare expenses from the five-year local option tax levy. Proceeds from the local option tax levy are designated for the restoration of jail beds and critical youth services. Revenues continued to increase in fiscal year 2016. Due to the lengthy recruitment process including physical agility and other testing, background history and medical evaluation the number of deputies hired with levy funds was less than anticipated during the first two years of the levy. During fiscal year 2016, the fund balance increased by $6.2 million to $25.7 million. The levy is set to expire in fiscal year 2018. In May, 2016, the Lane County Budget Committee approved a 31% decrease to the Local Option Levy tax currently authorized by voters at a rate 55 cents per $1,000 maximum assessed value. The lower tax amount for this Levy in FY 16-17 will be 38 cents per $1,000 maximum assessed value.
21
Lane County, Oregon Management’s Discussion and Analysis June 30, 2016
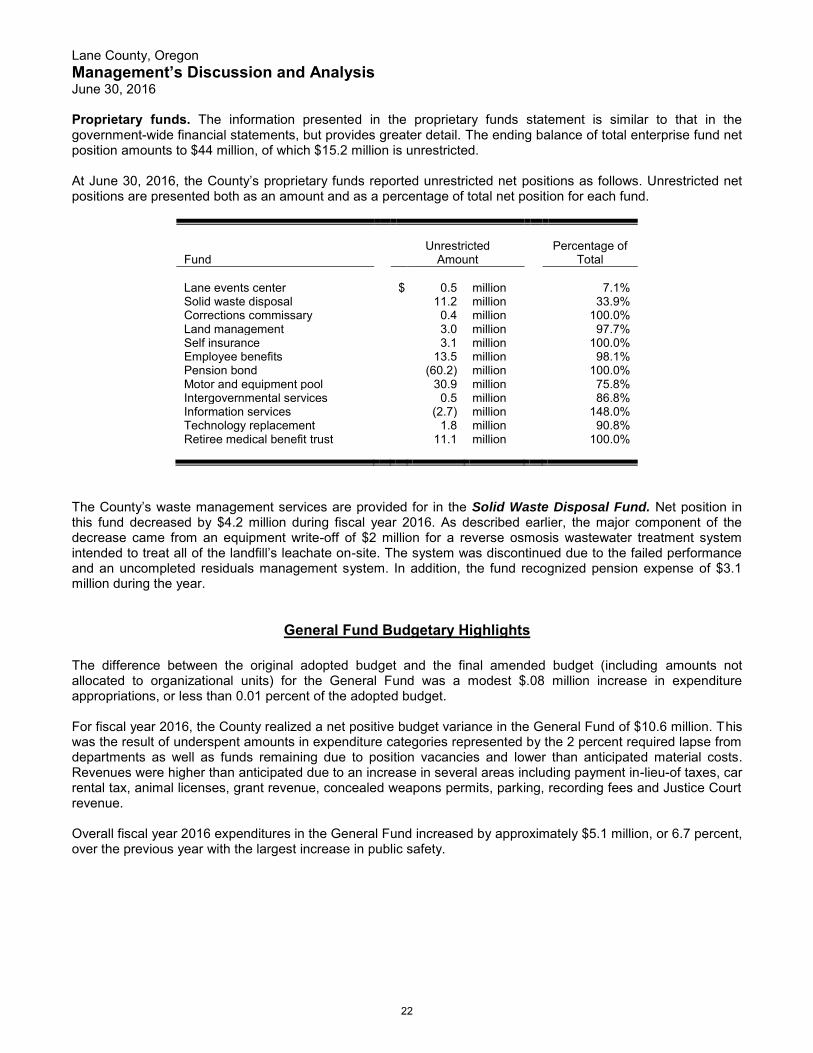
Proprietary funds. The information presented in the proprietary funds statement is similar to that in the government-wide financial statements, but provides greater detail. The ending balance of total enterprise fund net position amounts to $44 million, of which $15.2 million is unrestricted. At June 30, 2016, the County’s proprietary funds reported unrestricted net positions as follows. Unrestricted net positions are presented both as an amount and as a percentage of total net position for each fund.
Fund
Unrestricted
Amount
Percentage of
Total Lane events center
$
0.5
million
7.1%
Solid waste disposal 11.2 million 33.9% Corrections commissary 0.4 million 100.0% Land management 3.0 million 97.7% Self insurance 3.1 million 100.0% Employee benefits 13.5 million 98.1% Pension bond (60.2) million 100.0% Motor and equipment pool 30.9 million 75.8% Intergovernmental services 0.5 million 86.8% Information services (2.7) million 148.0% Technology replacement 1.8 million 90.8% Retiree medical benefit trust 11.1 million 100.0%
The County’s waste management services are provided for in the Solid Waste Disposal Fund. Net position in this fund decreased by $4.2 million during fiscal year 2016. As described earlier, the major component of the decrease came from an equipment write-off of $2 million for a reverse osmosis wastewater treatment system intended to treat all of the landfill’s leachate on-site. The system was discontinued due to the failed performance and an uncompleted residuals management system. In addition, the fund recognized pension expense of $3.1 million during the year.
General Fund Budgetary Highlights
The difference between the original adopted budget and the final amended budget (including amounts not allocated to organizational units) for the General Fund was a modest $.08 million increase in expenditure appropriations, or less than 0.01 percent of the adopted budget. For fiscal year 2016, the County realized a net positive budget variance in the General Fund of $10.6 million. This was the result of underspent amounts in expenditure categories represented by the 2 percent required lapse from departments as well as funds remaining due to position vacancies and lower than anticipated material costs. Revenues were higher than anticipated due to an increase in several areas including payment in-lieu-of taxes, car rental tax, animal licenses, grant revenue, concealed weapons permits, parking, recording fees and Justice Court revenue. Overall fiscal year 2016 expenditures in the General Fund increased by approximately $5.1 million, or 6.7 percent, over the previous year with the largest increase in public safety.
22
Lane County, Oregon Management’s Discussion and Analysis June 30, 2016
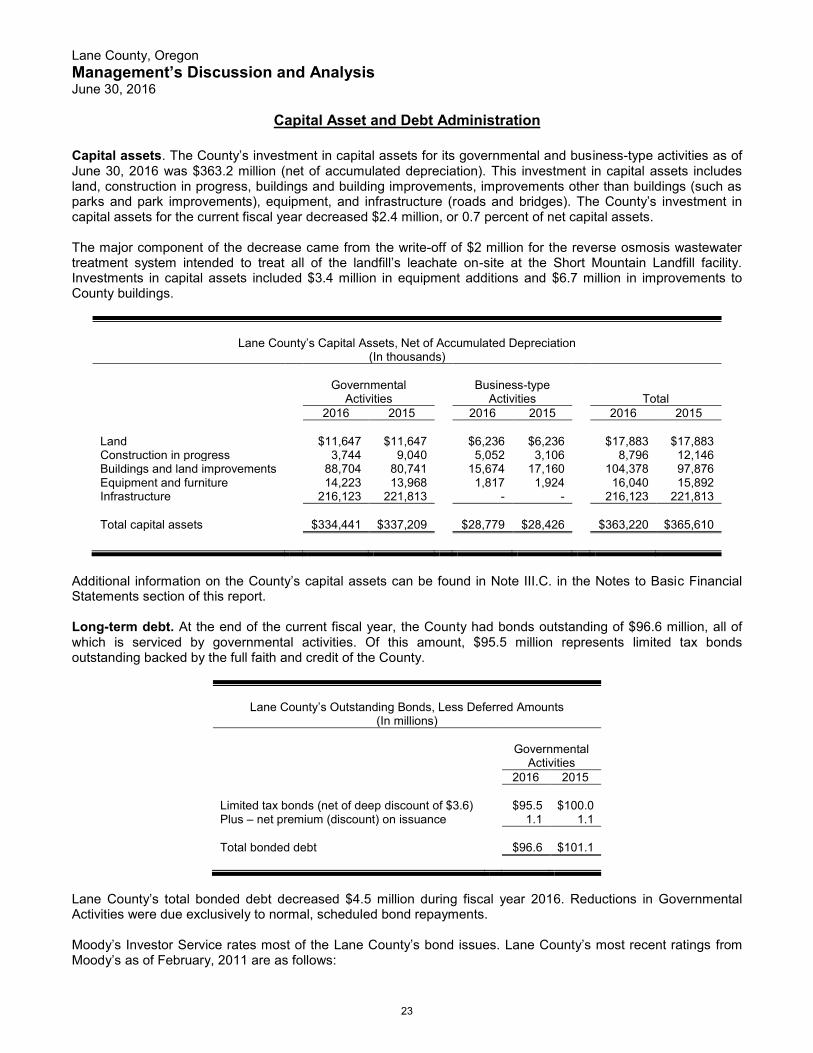
Capital Asset and Debt Administration
Capital assets. The County’s investment in capital assets for its governmental and business-type activities as of June 30, 2016 was $363.2 million (net of accumulated depreciation). This investment in capital assets includes land, construction in progress, buildings and building improvements, improvements other than buildings (such as parks and park improvements), equipment, and infrastructure (roads and bridges). The County’s investment in capital assets for the current fiscal year decreased $2.4 million, or 0.7 percent of net capital assets.
The major component of the decrease came from the write-off of $2 million for the reverse osmosis wastewater treatment system intended to treat all of the landfill’s leachate on-site at the Short Mountain Landfill facility. Investments in capital assets included $3.4 million in equipment additions and $6.7 million in improvements to County buildings.
Lane County’s Capital Assets, Net of Accumulated Depreciation
(In thousands)
Governmental
Activities
Business-type
Activities
Total 2016 2015 2016 2015 2016 2015
Land $11,647 $11,647 $6,236 $6,236 $17,883 $17,883 Construction in progress 3,744 9,040 5,052 3,106 8,796 12,146 Buildings and land improvements 88,704 80,741 15,674 17,160 104,378 97,876 Equipment and furniture 14,223 13,968 1,817 1,924 16,040 15,892 Infrastructure 216,123 221,813 - - 216,123 221,813 Total capital assets
$334,441
$337,209
$28,779
$28,426
$363,220
$365,610
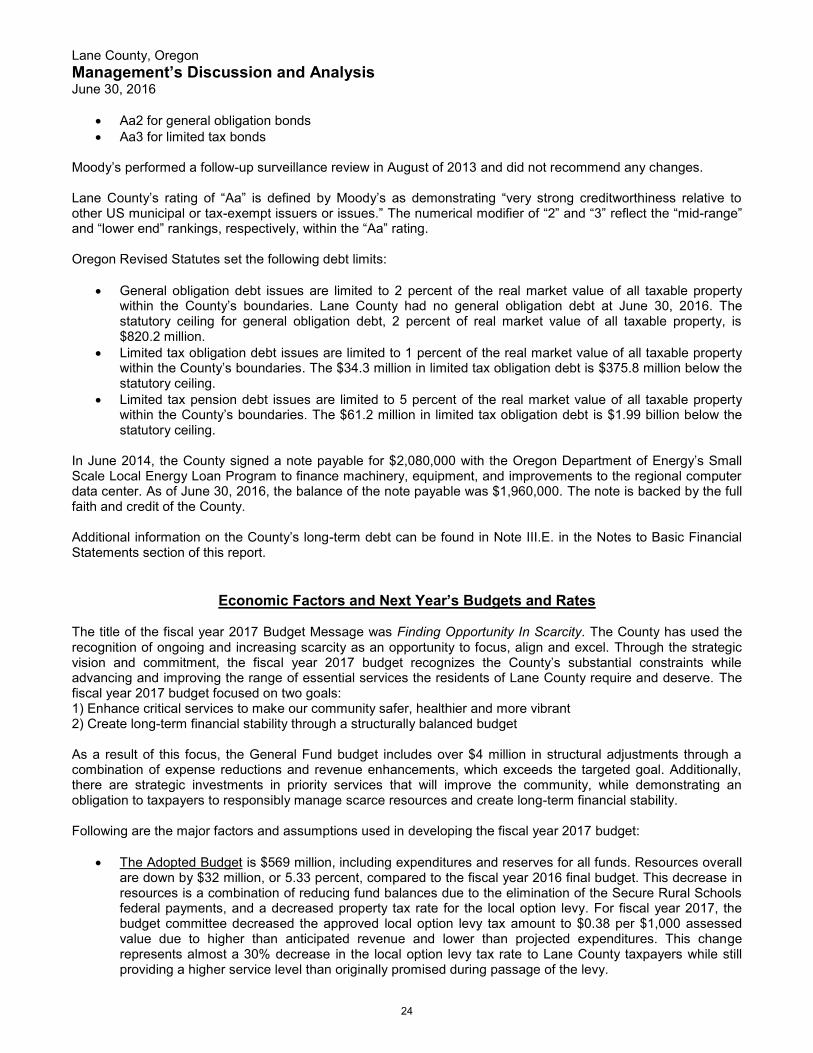
Additional information on the County’s capital assets can be found in Note III.C. in the Notes to Basic Financial Statements section of this report. Long-term debt. At the end of the current fiscal year, the County had bonds outstanding of $96.6 million, all of which is serviced by governmental activities. Of this amount, $95.5 million represents limited tax bonds outstanding backed by the full faith and credit of the County.
Lane County’s Outstanding Bonds, Less Deferred Amounts
(In millions)
Governmental Activities
2016 2015 Limited tax bonds (net of deep discount of $3.6) $95.5 $100.0 Plus – net premium (discount) on issuance 1.1 1.1 Total bonded debt
$96.6
$101.1
Lane County’s total bonded debt decreased $4.5 million during fiscal year 2016. Reductions in Governmental Activities were due exclusively to normal, scheduled bond repayments. Moody’s Investor Service rates most of the Lane County’s bond issues. Lane County’s most recent ratings from Moody’s as of February, 2011 are as follows:
23
Lane County, Oregon Management’s Discussion and Analysis June 30, 2016
Aa2 for general obligation bonds Aa3 for limited tax bonds
Moody’s performed a follow-up surveillance review in August of 2013 and did not recommend any changes.
Lane County’s rating of “Aa” is defined by Moody’s as demonstrating “very strong creditworthiness relative to other US municipal or tax-exempt issuers or issues.” The numerical modifier of “2” and “3” reflect the “mid-range” and “lower end” rankings, respectively, within the “Aa” rating.
Oregon Revised Statutes set the following debt limits:
General obligation debt issues are limited to 2 percent of the real market value of all taxable property within the County’s boundaries. Lane County had no general obligation debt at June 30, 2016. The statutory ceiling for general obligation debt, 2 percent of real market value of all taxable property, is $820.2 million.
Limited tax obligation debt issues are limited to 1 percent of the real market value of all taxable property within the County’s boundaries. The $34.3 million in limited tax obligation debt is $375.8 million below the statutory ceiling.
Limited tax pension debt issues are limited to 5 percent of the real market value of all taxable property within the County’s boundaries. The $61.2 million in limited tax obligation debt is $1.99 billion below the statutory ceiling.
In June 2014, the County signed a note payable for $2,080,000 with the Oregon Department of Energy’s Small Scale Local Energy Loan Program to finance machinery, equipment, and improvements to the regional computer data center. As of June 30, 2016, the balance of the note payable was $1,960,000. The note is backed by the full faith and credit of the County. Additional information on the County’s long-term debt can be found in Note III.E. in the Notes to Basic Financial Statements section of this report.
Economic Factors and Next Year’s Budgets and Rates
The title of the fiscal year 2017 Budget Message was Finding Opportunity In Scarcity. The County has used the recognition of ongoing and increasing scarcity as an opportunity to focus, align and excel. Through the strategic vision and commitment, the fiscal year 2017 budget recognizes the County’s substantial constraints while advancing and improving the range of essential services the residents of Lane County require and deserve. The fiscal year 2017 budget focused on two goals: 1) Enhance critical services to make our community safer, healthier and more vibrant 2) Create long-term financial stability through a structurally balanced budget As a result of this focus, the General Fund budget includes over $4 million in structural adjustments through a combination of expense reductions and revenue enhancements, which exceeds the targeted goal. Additionally, there are strategic investments in priority services that will improve the community, while demonstrating an obligation to taxpayers to responsibly manage scarce resources and create long-term financial stability. Following are the major factors and assumptions used in developing the fiscal year 2017 budget:
The Adopted Budget is $569 million, including expenditures and reserves for all funds. Resources overall are down by $32 million, or 5.33 percent, compared to the fiscal year 2016 final budget. This decrease in resources is a combination of reducing fund balances due to the elimination of the Secure Rural Schools federal payments, and a decreased property tax rate for the local option levy. For fiscal year 2017, the budget committee decreased the approved local option levy tax amount to $0.38 per $1,000 assessed value due to higher than anticipated revenue and lower than projected expenditures. This change represents almost a 30% decrease in the local option levy tax rate to Lane County taxpayers while still providing a higher service level than originally promised during passage of the levy.
24

Lane County, Oregon Management’s Discussion and Analysis June 30, 2016
Property tax collections are based on the County’s permanent tax rate under voter approved Measure 50 is $1.2793 per $1,000 of Assessed Value (AV). The County also has two local option levies appearing within its budget. The first one was passed by voters in 2013 for restoration of jail beds and critical youth services. In May 2016, voters also passed 4H Extension Service levy of $0.015 cents per $1,000 AV. While the 4H funds appear within the Lane County budget they are paid directly to the OSU Extension Service which is a separate entity for Lane County government to provide the services. Overall, Lane County is seeing the growth of property tax revenue from its permanent rate exceed the statutory 3 percent growth due to a strong housing market.
State revenue consists of 24.17% of total County revenue and comes primarily in in the form of specific use grants. Total state revenue is decreasing by $1.6 million, or 1.83 percent, as compared to fiscal year 2016 due to one-time projected related funds received from the Department of Transportation and the Coordinated Care Organization. State shared revenues (cigarette, liquor, and amusement device tax, video lottery proceeds and a recreational vehicle fee) total $4.47 million, or 5.2 percent, of total state revenues. Video lottery, which must be spent on economic development, is projected to grow by over 5 percent from original state projections. Cigarette tax revenue continues to decline in recent years, while liquor tax shows modest increases. The State legislature changed the distribution of the recreation vehicle fee which will result in an additional $64,000 in revenue for County Parks.
Federal revenue, $45 million or 12.69 percent of overall County revenue, is projected to decrease by $6.2 million due to elimination of the Secure Rural Schools payments, which have not been renewed by the U.S. Congress. The County continues to see declining Federal revenue. The resulting decrease over the past 6 years is 37.8 percent, not adjusted for inflation. This reduction in revenue has the largest impact within the General Fund.
Fees and charges for services rendered to residents, a few examples being Short Mountain Landfill fees, Land Management permit fees and recording fees within Deeds and Records, will total $36.4 million in fiscal year 2017. The decrease from 2016 is due to several one-time reimbursements. Recording fees, which saw a substantial decrease three years ago, has rebounded and has returned to prior revenue amounts due in part to continued low mortgage interest rates and a strong local real estate market. The trend for that revenue source is dependent on decisions made by the Federal Reserve and long-term interest rates.
Personnel services which consists of employee wages and benefits, totals $165.2 million, or 43 percent of the County’s total expenditure budget. This represents growth of 2.49 percent when compared to the fiscal year 2016 budget. The County's services, like most governmental agencies, are labor intensive. Of this amount, $65.5 million is for taxes and benefit costs such as social security, Medicare, medical insurance, retirement, and other provided benefits. Health insurance costs are projected to stay relatively flat due to the change to a self-funded model and lower than projected medical claims in fiscal year 2016.
Materials and services total $188.1 million and represents 50 percent of the overall expenditure budget, a decrease of $25 million, or 12 percent from fiscal year 2016. This decrease is attributed to one-time expenses in fiscal year 2016, as well as a continued focus on reduction of internal expenses and other material and services to maintain the personnel needed to provide direct services to citizens. The continued decrease within the Road Fund of available funding for road improvements and maintenance due to the loss of Secure Rural Schools also impacts this expense category.
Capital outlay and projects expenditures are cyclical and can vary greatly from year to year. Capital outlay is budgeted at $5.3 million for various equipment purchases that make up 1.4 percent of the County’s overall expenditure budget. The major types of equipment purchased include heavy equipment for the Public Works department along with vehicles and data processing equipment for a variety of departments. The capital outlay budget will decrease by 12.7% in fiscal year 2017. Capital projects are budgeted at $10.3 million and represent 2.7 percent of the total fiscal year 2017 budget. This reflects a reduction of $4.7 million, or 2.72 percent, primarily due to shrinking Road Fund resources and the completion of projects.
Debt service (bond principal and interest payments) are budgeted at $10.9 million. Payments are currently being made for the following major bonds: Heating, Ventilating and Air Conditioning (HVAC) and Fairgrounds’ capital improvements bonds; Mental Health Building; Public Health Building; the PERS
25
Lane County, Oregon Management’s Discussion and Analysis June 30, 2016
Limited Tax Pension bond; and 2011 Improvements (Riverstone, Marina, Customer Service Center, Lane Events Center roof and PSB HVAC).
Lane County faces an ongoing structural deficit, in that expenses are increasing at a faster rate than revenues. Due to decreasing federal revenues and the current property tax structure, Lane County, like many local governments, has struggled with a structural deficit since the early nineties. Historically, General Fund revenues have grown between 3 - 3.5 percent a year while expenses have grown at between 5 and 6 percent. The County is developing a plan to eliminate the remaining deficit in fiscal year 2018 by continued review of all expenditures, maximizing of reserves and a look at existing budgeting practices, especially in the area of vacant position budgeting.
Consistent with County financial policy, 5 percent of general revenues are set aside as a “prudent person reserve” to cover unanticipated circumstances in all funds. Additionally, the policy requires a minimum of 10 percent reserve in the General Fund, which is also met in the fiscal year 2017 budget.
Requests for Information This financial report is designed to provide a general overview of the County’s finances. Questions concerning any of the information provided in this report or requests for additional financial information should be addressed to: Robert Tintle, Financial Services Manager Email: [email protected] Lane County Financial Services Website: www.lanecounty.org/finance 125 East 8th Avenue Eugene, OR 97401
26

BASIC FINANCIAL STATEMENTS
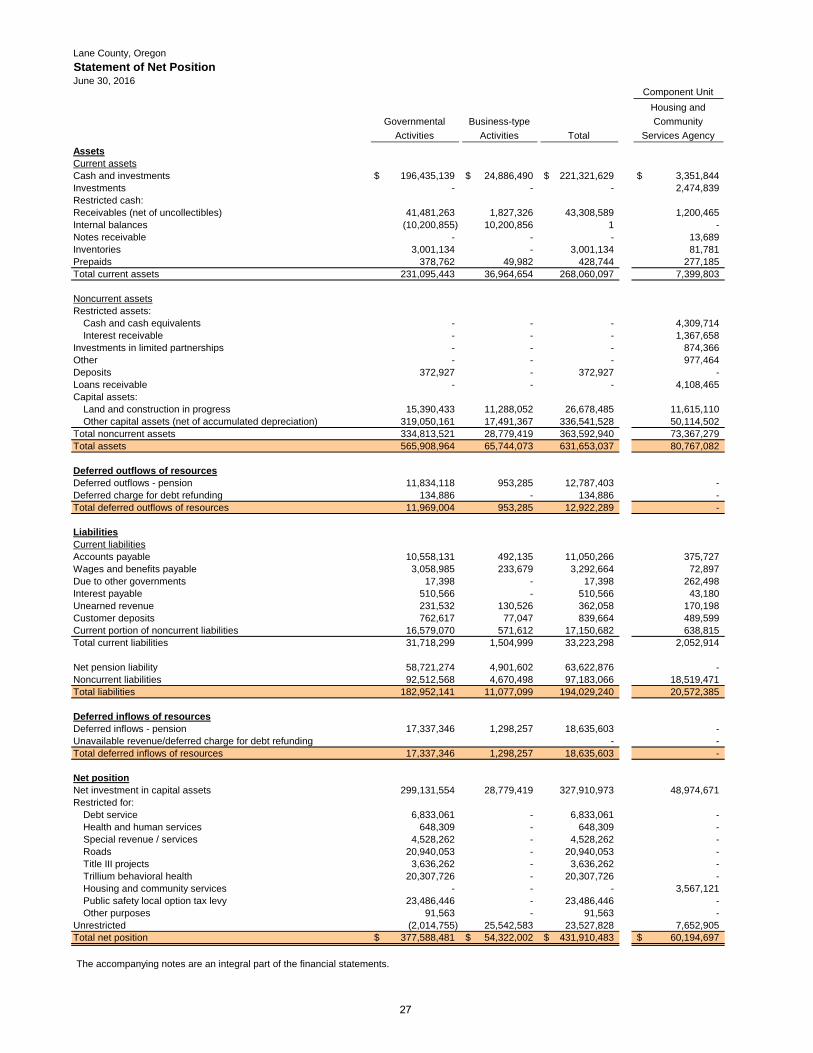
Lane County, OregonStatement of Net PositionJune 30, 2016
Component Unit
Governmental Activities
Business-type Activities Total
Housing and Community
Services AgencyAssetsCurrent assetsCash and investments 196,435,139$ 24,886,490$ 221,321,629$ 3,351,844$ Investments - - - 2,474,839 Restricted cash:Receivables (net of uncollectibles) 41,481,263 1,827,326 43,308,589 1,200,465 Internal balances (10,200,855) 10,200,856 1 - Notes receivable - - - 13,689 Inventories 3,001,134 - 3,001,134 81,781 Prepaids 378,762 49,982 428,744 277,185 Total current assets 231,095,443 36,964,654 268,060,097 7,399,803
Noncurrent assetsRestricted assets:
Cash and cash equivalents - - - 4,309,714 Interest receivable - - - 1,367,658
Investments in limited partnerships - - - 874,366 Other - - - 977,464 Deposits 372,927 - 372,927 - Loans receivable - - - 4,108,465 Capital assets:
Land and construction in progress 15,390,433 11,288,052 26,678,485 11,615,110 Other capital assets (net of accumulated depreciation) 319,050,161 17,491,367 336,541,528 50,114,502
Total noncurrent assets 334,813,521 28,779,419 363,592,940 73,367,279 Total assets 565,908,964 65,744,073 631,653,037 80,767,082
Deferred outflows of resourcesDeferred outflows - pension 11,834,118 953,285 12,787,403 - Deferred charge for debt refunding 134,886 - 134,886 - Total deferred outflows of resources 11,969,004 953,285 12,922,289 -
LiabilitiesCurrent liabilitiesAccounts payable 10,558,131 492,135 11,050,266 375,727 Wages and benefits payable 3,058,985 233,679 3,292,664 72,897 Due to other governments 17,398 - 17,398 262,498 Interest payable 510,566 - 510,566 43,180 Unearned revenue 231,532 130,526 362,058 170,198 Customer deposits 762,617 77,047 839,664 489,599 Current portion of noncurrent liabilities 16,579,070 571,612 17,150,682 638,815 Total current liabilities 31,718,299 1,504,999 33,223,298 2,052,914
Net pension liability 58,721,274 4,901,602 63,622,876 - Noncurrent liabilities 92,512,568 4,670,498 97,183,066 18,519,471 Total liabilities 182,952,141 11,077,099 194,029,240 20,572,385
Deferred inflows of resourcesDeferred inflows - pension 17,337,346 1,298,257 18,635,603 - Unavailable revenue/deferred charge for debt refunding - - Total deferred inflows of resources 17,337,346 1,298,257 18,635,603 -
Net positionNet investment in capital assets 299,131,554 28,779,419 327,910,973 48,974,671 Restricted for:
Debt service 6,833,061 - 6,833,061 - Health and human services 648,309 - 648,309 - Special revenue / services 4,528,262 - 4,528,262 - Roads 20,940,053 - 20,940,053 - Title III projects 3,636,262 - 3,636,262 - Trillium behavioral health 20,307,726 - 20,307,726 - Housing and community services - - - 3,567,121 Public safety local option tax levy 23,486,446 - 23,486,446 - Other purposes 91,563 - 91,563 -
Unrestricted (2,014,755) 25,542,583 23,527,828 7,652,905 Total net position 377,588,481$ 54,322,002$ 431,910,483$ 60,194,697$
The accompanying notes are an integral part of the financial statements.
27
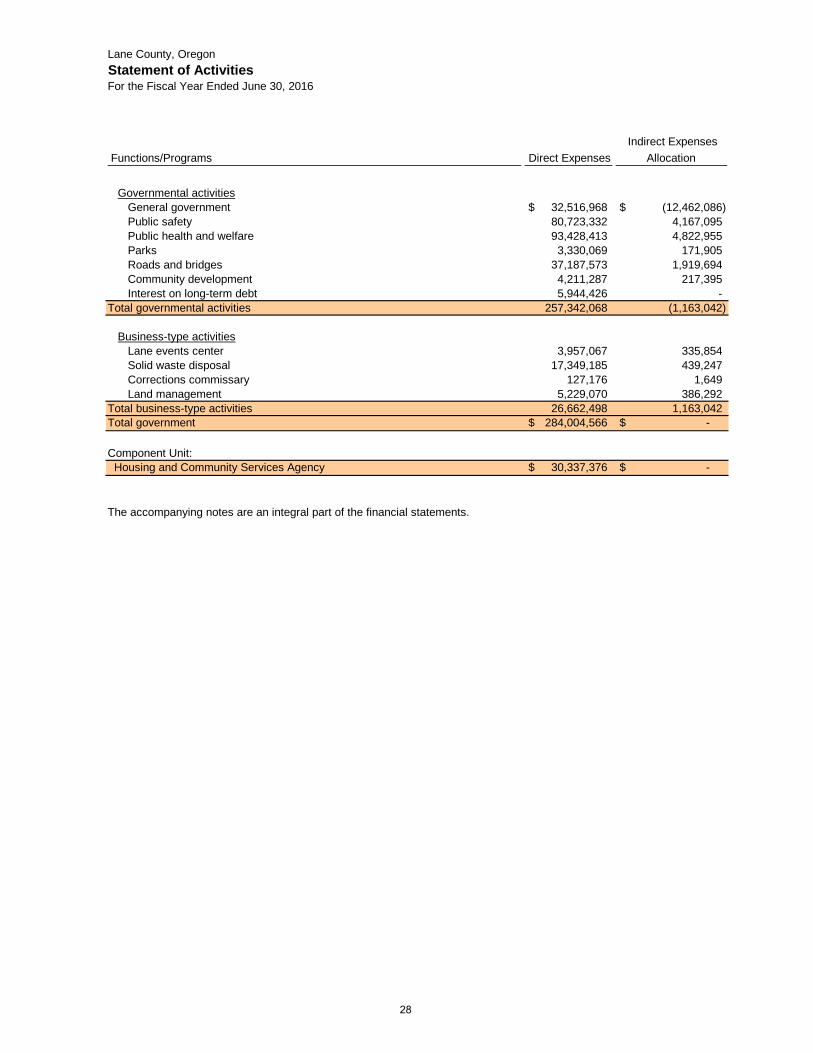
Lane County, OregonStatement of ActivitiesFor the Fiscal Year Ended June 30, 2016
Functions/Programs Direct Expenses Indirect Expenses
Allocation
Governmental activitiesGeneral government 32,516,968$ (12,462,086)$ Public safety 80,723,332 4,167,095 Public health and welfare 93,428,413 4,822,955 Parks 3,330,069 171,905 Roads and bridges 37,187,573 1,919,694 Community development 4,211,287 217,395 Interest on long-term debt 5,944,426 -
Total governmental activities 257,342,068 (1,163,042)
Business-type activitiesLane events center 3,957,067 335,854 Solid waste disposal 17,349,185 439,247 Corrections commissary 127,176 1,649 Land management 5,229,070 386,292
Total business-type activities 26,662,498 1,163,042 Total government 284,004,566$ -$
Component Unit: Housing and Community Services Agency 30,337,376$ -$
The accompanying notes are an integral part of the financial statements.
28
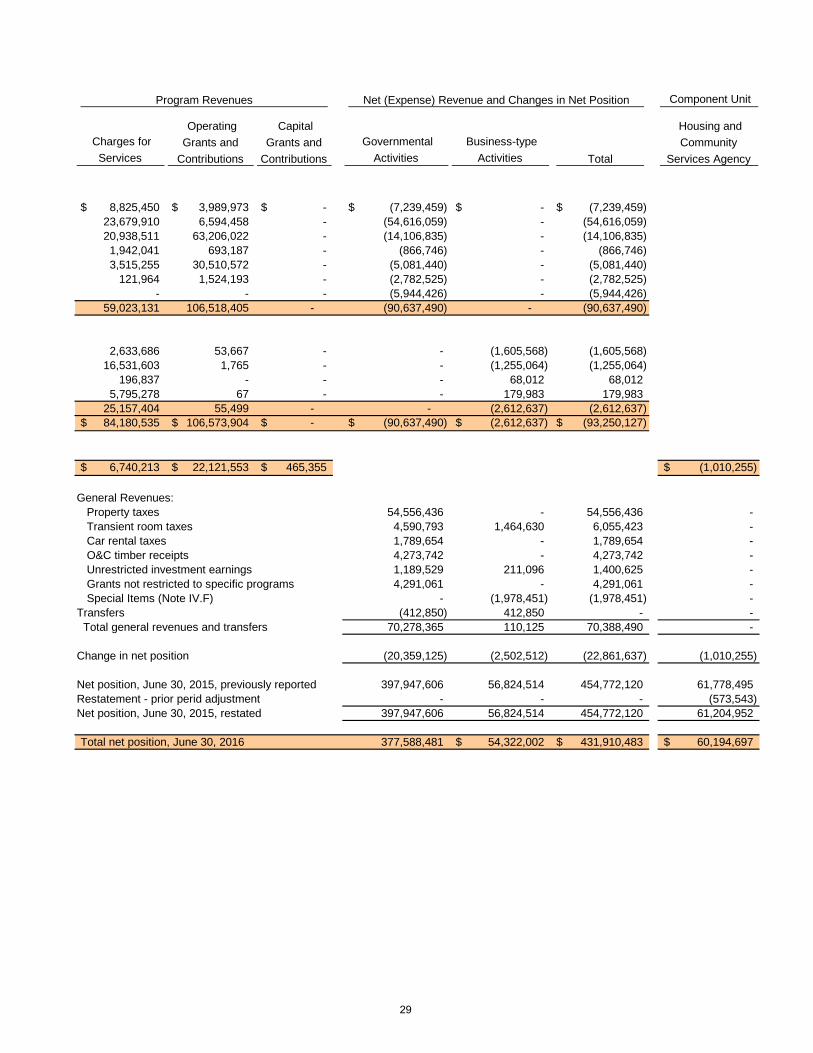
Component Unit
Charges for Services
Governmental Activities
Business-type Activities Total
8,825,450$ 3,989,973$ -$ (7,239,459)$ -$ (7,239,459)$ 23,679,910 6,594,458 - (54,616,059) - (54,616,059) 20,938,511 63,206,022 - (14,106,835) - (14,106,835) 1,942,041 693,187 - (866,746) - (866,746) 3,515,255 30,510,572 - (5,081,440) - (5,081,440)
121,964 1,524,193 - (2,782,525) - (2,782,525) - - - (5,944,426) - (5,944,426)
59,023,131 106,518,405 - (90,637,490) - (90,637,490)
2,633,686 53,667 - - (1,605,568) (1,605,568) 16,531,603 1,765 - - (1,255,064) (1,255,064)
196,837 - - - 68,012 68,012 5,795,278 67 - - 179,983 179,983
25,157,404 55,499 - - (2,612,637) (2,612,637) 84,180,535$ 106,573,904$ -$ (90,637,490)$ (2,612,637)$ (93,250,127)$
6,740,213$ 22,121,553$ 465,355$ (1,010,255)$
General Revenues:Property taxes 54,556,436 - 54,556,436 - Transient room taxes 4,590,793 1,464,630 6,055,423 - Car rental taxes 1,789,654 - 1,789,654 - O&C timber receipts 4,273,742 - 4,273,742 - Unrestricted investment earnings 1,189,529 211,096 1,400,625 - Grants not restricted to specific programs 4,291,061 - 4,291,061 - Special Items (Note IV.F) - (1,978,451) (1,978,451) -
Transfers (412,850) 412,850 - - Total general revenues and transfers 70,278,365 110,125 70,388,490 -
Change in net position (20,359,125) (2,502,512) (22,861,637) (1,010,255)
Net position, June 30, 2015, previously reported 397,947,606 56,824,514 454,772,120 61,778,495 Restatement - prior perid adjustment - - - (573,543) Net position, June 30, 2015, restated 397,947,606 56,824,514 454,772,120 61,204,952
Total net position, June 30, 2016 377,588,481 54,322,002$ 431,910,483$ 60,194,697$
Program Revenues Net (Expense) Revenue and Changes in Net Position
Housing and Community
Services Agency
Capital Grants and
Contributions
Operating Grants and
Contributions
29

Lane County, OregonBalance SheetGovernmental FundsJune 30, 2016
General RoadSpecial Revenue /
ServicesAssetsCash and cash equivalents 15,849,104$ 26,777,526$ 9,978,525$ Receivables (net of uncollectibles):
Investment earnings 70,815 69,414 25,992 Property taxes 3,164,387 - - Accounts 6,834,995 466,331 947,713 Intergovernmental 1,649,497 1,900,767 1,388,756 Interest on balances 8,375,788 - -
Inventories 201,911 1,829,970 - Total assets 36,146,497$ 31,044,008$ 12,340,986$
LiabilitiesAccounts payable 1,277,787$ 1,122,498$ 971,276$ Wages and benefits payable 997,699 357,506 173,261 Due to other funds 567,889 193,822 110,076 Due to other governments 17,398 - - Unearned revenue - 136,510 61,250 Interfund loans payable - - - Customer deposits 324,430 321,927 - Total liabilities 3,185,203 2,132,263 1,315,863
Deferred inflows of resourcesDeferred inflows of resources - other 17,509,286 - - Total deferred inflows of resources 17,509,286 - -
Fund balancesNonspendable 201,911 1,829,970 - Restricted - 9,442,247 4,649,693 Committed - - - Assigned - 17,639,528 6,375,430 Unassigned 15,250,097 - - Total fund balances 15,452,008 28,911,745 11,025,123 Total liabilities, deferred inflows of resources, and fund balances 36,146,497$ 31,044,008$ 12,340,986$
The accompanying notes are an integral part of the financial statements.
30
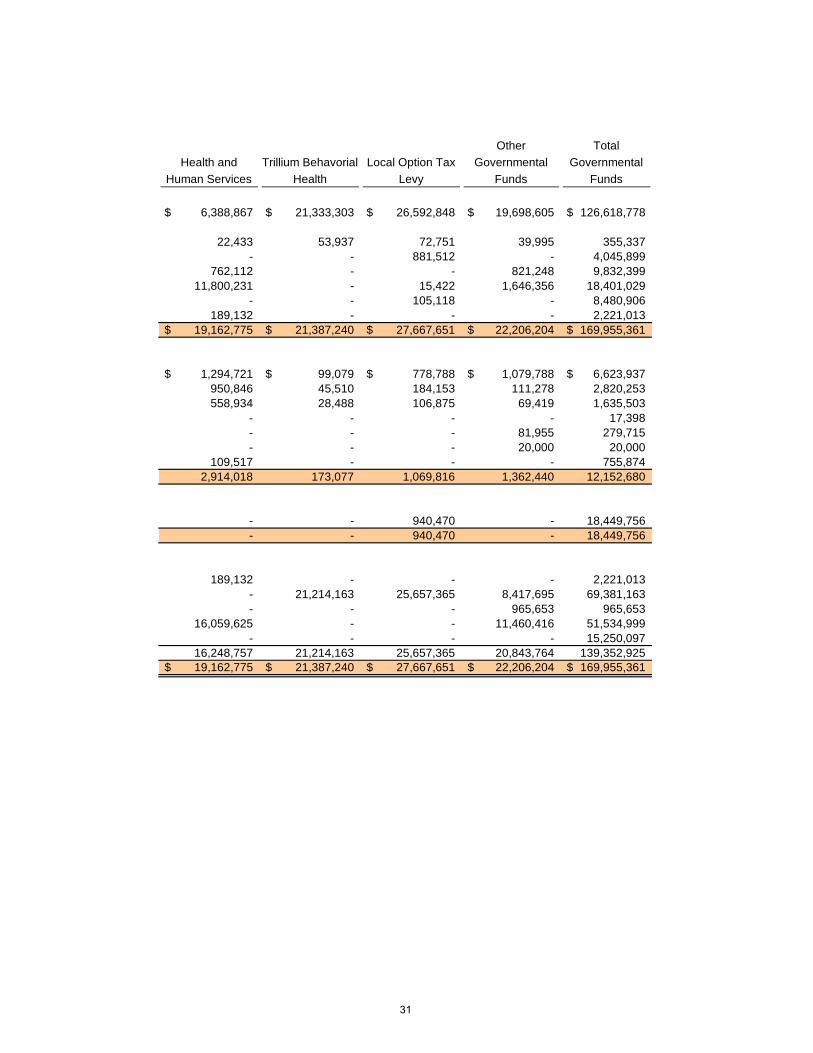
Health and Human Services
Trillium Behavorial Health
Local Option Tax Levy
Other Governmental
Funds
Total Governmental
Funds
6,388,867$ 21,333,303$ 26,592,848$ 19,698,605$ 126,618,778$
22,433 53,937 72,751 39,995 355,337 - - 881,512 - 4,045,899
762,112 - - 821,248 9,832,399 11,800,231 - 15,422 1,646,356 18,401,029
- - 105,118 - 8,480,906 189,132 - - - 2,221,013
19,162,775$ 21,387,240$ 27,667,651$ 22,206,204$ 169,955,361$
1,294,721$ 99,079$ 778,788$ 1,079,788$ 6,623,937$ 950,846 45,510 184,153 111,278 2,820,253 558,934 28,488 106,875 69,419 1,635,503
- - - - 17,398 - - - 81,955 279,715 - - - 20,000 20,000
109,517 - - - 755,874 2,914,018 173,077 1,069,816 1,362,440 12,152,680
- - 940,470 - 18,449,756 - - 940,470 - 18,449,756
189,132 - - - 2,221,013 - 21,214,163 25,657,365 8,417,695 69,381,163 - - - 965,653 965,653
16,059,625 - - 11,460,416 51,534,999 - - - - 15,250,097
16,248,757 21,214,163 25,657,365 20,843,764 139,352,925 19,162,775$ 21,387,240$ 27,667,651$ 22,206,204$ 169,955,361$
31

32

Lane County, OregonReconciliation of the Balance Sheet of Governmental Fundsto the Statement of Net PositionFor the Fiscal Year Ended June 30, 2016
Total fund balances - governmental funds (page 31) 139,352,925$
Amounts reported for governmental activities in the statement of net positionare different because:
Internal service funds are used by management to charge the costs ofcertain activities to individual funds. The assets and liabilities of theinternal service funds are included in governmental activities in thestatement of net position. 9,477,497$
An adjustment is required to eliminate change in net position of internal service funds back to the governmental activities that helped finance them. The adjustment related to enterprise activities is required in this reconciliation. (10,341,586) (864,089)
Capital assets are not financial resources in governmental funds, but arereported in the statement of net position at their depreciable value:
Land 11,646,873 Construction in progress 3,743,560 Buildings and land improvements 163,634,649 Equipment and furniture 17,326,588 Infrastructure 350,187,373
546,539,043 Less accumulated depreciation (223,371,427) 323,167,616
Prepaid expenses are not financial assets in governmental funds, but are reported in the statement of net position. 86,374
Certain assets will be collected after year-end but are not available soon enough to pay for the current period's expenditures, and therefore aredeferred inflows of resources in governmental funds:
Receivables: Property taxes and interest- general fund 4,025,733 Court fines 13,483,553 Property taxes and interest - public safety local option tax levy 940,470 18,449,756
Road assessments - unearned 48,184
Deferred amounts on refunded debt in governmental funds are expensed in the year paid, but are capitalized on the statement of net position asdeferred outflows of resources and amortized over the life of the debt. 134,886
Deferred inflows - pension (15,882,935) Deferred outflows - pension 10,863,589
Certain liabilities are not due and payable in the current period, and aretherefore not reported in governmental funds: Net pension liability (53,962,865)
Compensated absences payable (6,340,456) Interest payable (233,769) Notes payable (1,960,000) Bonds payable, net of premiums and discounts (35,270,735) (97,767,825)
Net Position - governmental activities (page 29) 377,588,481$
The accompanying notes are an integral part of the financial statements.
33
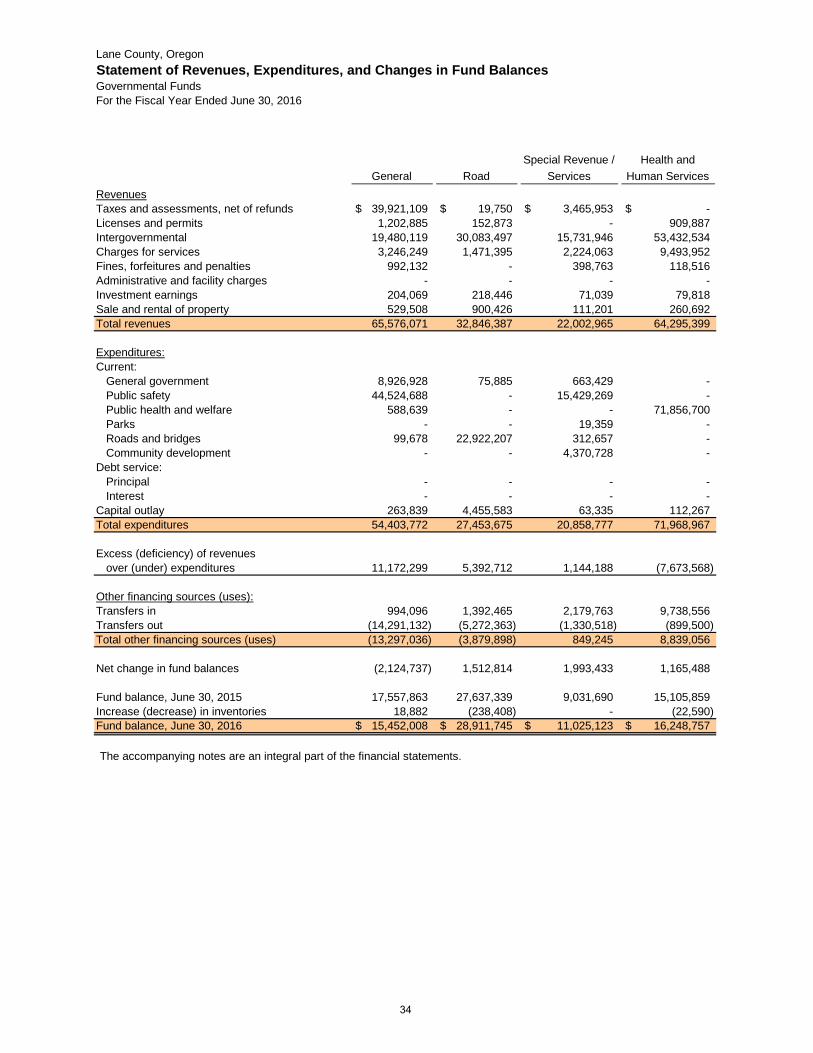
Lane County, OregonStatement of Revenues, Expenditures, and Changes in Fund BalancesGovernmental FundsFor the Fiscal Year Ended June 30, 2016
General RoadSpecial Revenue /
ServicesHealth and
Human ServicesRevenuesTaxes and assessments, net of refunds 39,921,109$ 19,750$ 3,465,953$ -$ Licenses and permits 1,202,885 152,873 - 909,887 Intergovernmental 19,480,119 30,083,497 15,731,946 53,432,534 Charges for services 3,246,249 1,471,395 2,224,063 9,493,952 Fines, forfeitures and penalties 992,132 - 398,763 118,516 Administrative and facility charges - - - - Investment earnings 204,069 218,446 71,039 79,818 Sale and rental of property 529,508 900,426 111,201 260,692 Total revenues 65,576,071 32,846,387 22,002,965 64,295,399
Expenditures:Current:
General government 8,926,928 75,885 663,429 - Public safety 44,524,688 - 15,429,269 - Public health and welfare 588,639 - - 71,856,700 Parks - - 19,359 - Roads and bridges 99,678 22,922,207 312,657 - Community development - - 4,370,728 -
Debt service:Principal - - - - Interest - - - -
Capital outlay 263,839 4,455,583 63,335 112,267 Total expenditures 54,403,772 27,453,675 20,858,777 71,968,967
Excess (deficiency) of revenuesover (under) expenditures 11,172,299 5,392,712 1,144,188 (7,673,568)
Other financing sources (uses):Transfers in 994,096 1,392,465 2,179,763 9,738,556 Transfers out (14,291,132) (5,272,363) (1,330,518) (899,500) Total other financing sources (uses) (13,297,036) (3,879,898) 849,245 8,839,056
Net change in fund balances (2,124,737) 1,512,814 1,993,433 1,165,488
Fund balance, June 30, 2015 17,557,863 27,637,339 9,031,690 15,105,859 Increase (decrease) in inventories 18,882 (238,408) - (22,590) Fund balance, June 30, 2016 15,452,008$ 28,911,745$ 11,025,123$ 16,248,757$
The accompanying notes are an integral part of the financial statements.
34
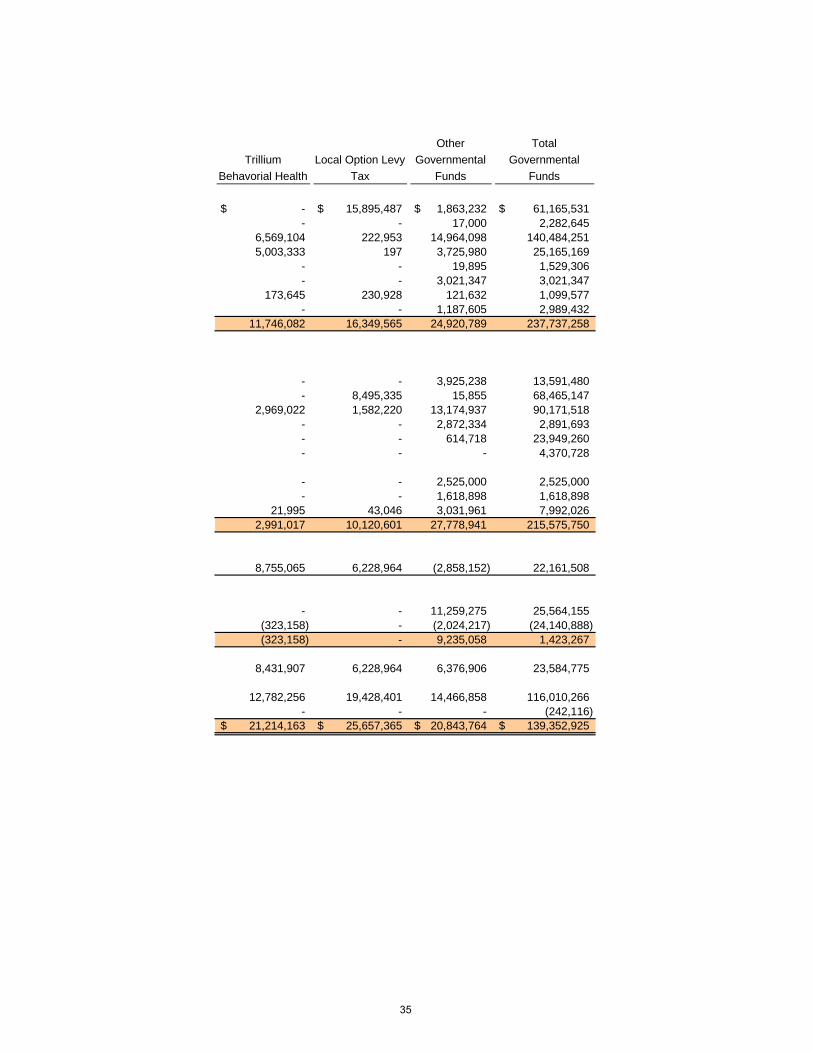
Trillium Behavorial Health
Local Option Levy Tax
Other Governmental
Funds
Total Governmental
Funds
-$ 15,895,487$ 1,863,232$ 61,165,531$ - - 17,000 2,282,645
6,569,104 222,953 14,964,098 140,484,251 5,003,333 197 3,725,980 25,165,169
- - 19,895 1,529,306 - - 3,021,347 3,021,347
173,645 230,928 121,632 1,099,577 - - 1,187,605 2,989,432
11,746,082 16,349,565 24,920,789 237,737,258
- - 3,925,238 13,591,480 - 8,495,335 15,855 68,465,147
2,969,022 1,582,220 13,174,937 90,171,518 - - 2,872,334 2,891,693 - - 614,718 23,949,260 - - - 4,370,728
- - 2,525,000 2,525,000 - - 1,618,898 1,618,898
21,995 43,046 3,031,961 7,992,026 2,991,017 10,120,601 27,778,941 215,575,750
8,755,065 6,228,964 (2,858,152) 22,161,508
- - 11,259,275 25,564,155 (323,158) - (2,024,217) (24,140,888) (323,158) - 9,235,058 1,423,267
8,431,907 6,228,964 6,376,906 23,584,775
12,782,256 19,428,401 14,466,858 116,010,266 - - - (242,116)
21,214,163$ 25,657,365$ 20,843,764$ 139,352,925$
35

36
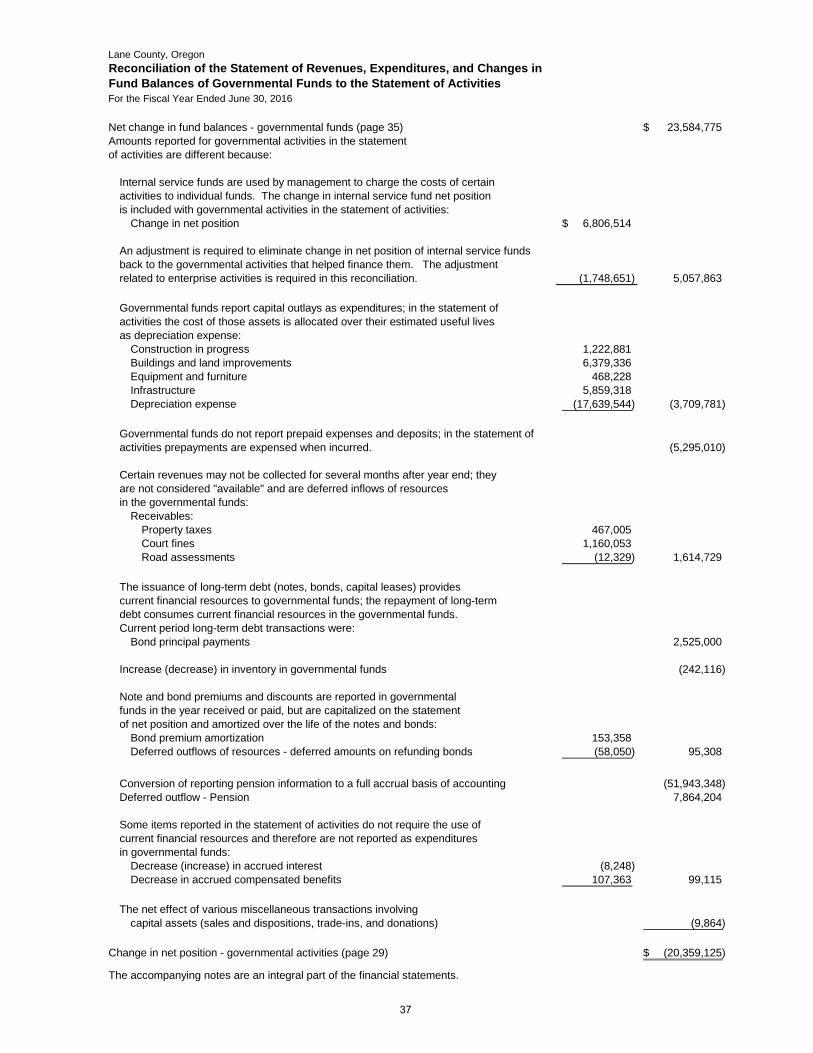
Lane County, OregonReconciliation of the Statement of Revenues, Expenditures, and Changes in Fund Balances of Governmental Funds to the Statement of ActivitiesFor the Fiscal Year Ended June 30, 2016
Net change in fund balances - governmental funds (page 35) 23,584,775$ Amounts reported for governmental activities in the statementof activities are different because:
Internal service funds are used by management to charge the costs of certainactivities to individual funds. The change in internal service fund net positionis included with governmental activities in the statement of activities:
Change in net position 6,806,514$
An adjustment is required to eliminate change in net position of internal service funds back to the governmental activities that helped finance them. The adjustmentrelated to enterprise activities is required in this reconciliation. (1,748,651) 5,057,863
Governmental funds report capital outlays as expenditures; in the statement ofactivities the cost of those assets is allocated over their estimated useful livesas depreciation expense:
Construction in progress 1,222,881 Buildings and land improvements 6,379,336 Equipment and furniture 468,228 Infrastructure 5,859,318 Depreciation expense (17,639,544) (3,709,781)
Governmental funds do not report prepaid expenses and deposits; in the statement of activities prepayments are expensed when incurred. (5,295,010)
Certain revenues may not be collected for several months after year end; theyare not considered "available" and are deferred inflows of resources in the governmental funds:
Receivables: Property taxes 467,005 Court fines 1,160,053 Road assessments (12,329) 1,614,729
The issuance of long-term debt (notes, bonds, capital leases) providescurrent financial resources to governmental funds; the repayment of long-termdebt consumes current financial resources in the governmental funds.Current period long-term debt transactions were:
Bond principal payments 2,525,000
Increase (decrease) in inventory in governmental funds (242,116)
Note and bond premiums and discounts are reported in governmentalfunds in the year received or paid, but are capitalized on the statementof net position and amortized over the life of the notes and bonds:
Bond premium amortization 153,358 Deferred outflows of resources - deferred amounts on refunding bonds (58,050) 95,308
Conversion of reporting pension information to a full accrual basis of accounting (51,943,348) Deferred outflow - Pension 7,864,204
Some items reported in the statement of activities do not require the use ofcurrent financial resources and therefore are not reported as expendituresin governmental funds:
Decrease (increase) in accrued interest (8,248) Decrease in accrued compensated benefits 107,363 99,115
The net effect of various miscellaneous transactions involving
capital assets (sales and dispositions, trade-ins, and donations) (9,864)
Change in net position - governmental activities (page 29) (20,359,125)$
The accompanying notes are an integral part of the financial statements.
37

Lane County, OregonStatement of Fund Net PositionProprietary FundsJune 30, 2016
Solid Waste Disposal
Other Enterprise Funds
Total Enterprise Funds
Governmental Activities-Internal
Service FundsAssetsCurrent assetsCash and cash equivalents 19,094,898$ 5,791,592$ 24,886,490$ 69,816,361$ Receivables (net of uncollectibles):
Investment earnings 55,334 13,763 69,097 190,061 Accounts 1,306,454 451,775 1,758,229 175,632
Due from other funds - - - 1,924,758 Interfund loans receivable 20,000 - 20,000 - Inventories - - - 780,121 Prepaids - 49,982 49,982 292,387 Total current assets 20,476,686 6,307,112 26,783,798 73,179,320
Noncurrent assetsDeposits - - - 372,927 Capital assets:
Land 5,103,911 1,132,569 6,236,480 - Buildings and land improvements 20,436,613 23,908,016 44,344,629 525,371 Equipment and furniture 3,806,312 2,020,325 5,826,637 33,707,637 Construction in progress 5,051,572 - 5,051,572 -
Accumulated depreciation (12,453,908) (20,225,991) (32,679,899) (22,960,030) Total noncurrent assets 21,944,500 6,834,919 28,779,419 11,645,905 Total assets 42,421,186 13,142,031 55,563,217 84,825,225
Deferred outflows of resourcesDeferred outflows - pension 647,673 305,612 953,285 970,529 Total deferred outflows of resources 647,673 305,612 953,285 970,529
LiabilitiesCurrent liabilitiesAccounts payable 342,074 150,061 492,135 3,934,194 Wages and benefits payable 149,278 84,401 233,679 238,732 Compensated absences payable 400,351 171,261 571,612 514,614 Claims payable - - - 3,724,000 Due to other funds 106,606 54,124 160,730 128,525 Interest payable - - - 276,797 Unearned revenue 1,850 128,676 130,526 - Customer deposits 45 77,002 77,047 6,742 Bonds payable - - - 3,385,000 Total current liabilities 1,000,204 665,525 1,665,729 12,208,604
Noncurrent liabilitiesNet OPEB obligation - - - 125,404 Net pension liability 3,289,193 1,612,409 4,901,602 4,758,409 Bonds payable (net of unamortized discounts) - - - 57,771,429 Landfill closure and postclosure care liability 4,670,498 - 4,670,498 - Total noncurrent liabilities 7,959,691 1,612,409 9,572,100 62,655,242 Total liabilities 8,959,895 2,277,934 11,237,829 74,863,846
Deferred inflows of resourcesDeferred inflows - pension 905,594 392,663 1,298,257 1,454,411 Total deferred inflows of resources 905,594 392,663 1,298,257 1,454,411
Net positionNet investment in capital assets 21,944,500 6,834,919 28,779,419 11,272,978 Unrestricted 11,258,870 3,942,127 15,200,997 (1,795,481) Total net position 33,203,370$ 10,777,046$ 43,980,416 9,477,497$
Adjustment to reflect consolidation of internal service fund activities related to enterprise fund 10,341,586 Net position of business-type activities 54,322,002$
The accompanying notes are an integral part of the financial statements.
38
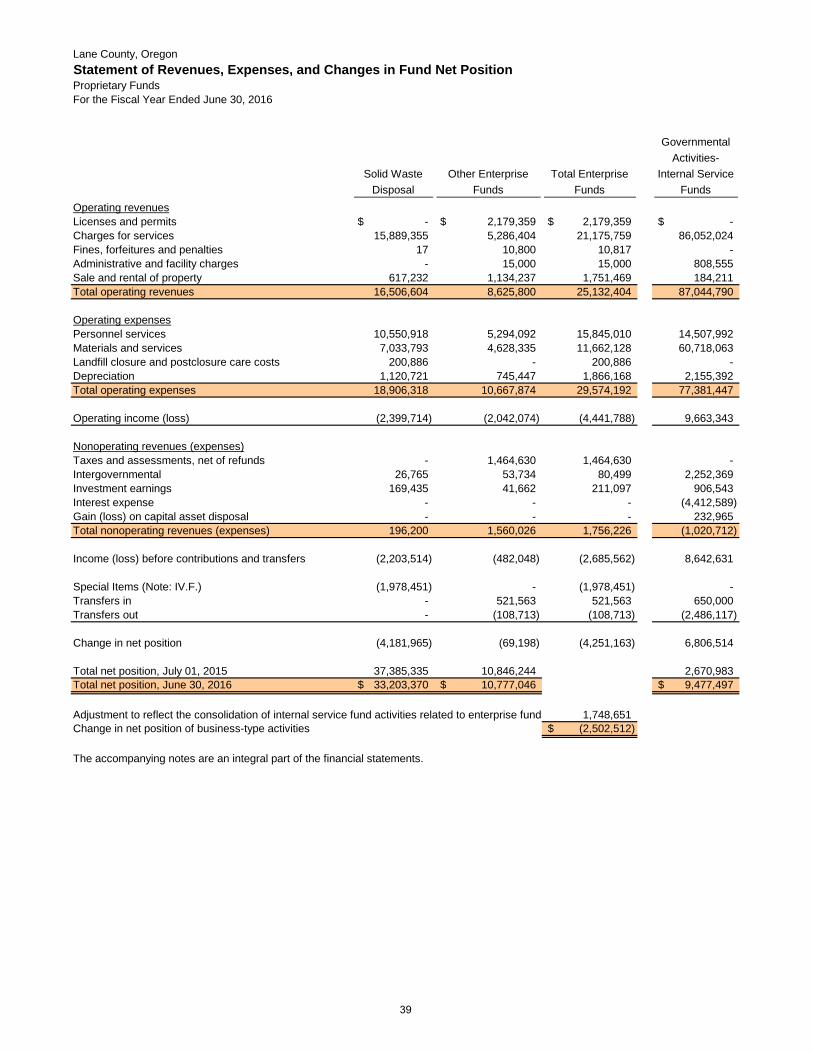
Lane County, OregonStatement of Revenues, Expenses, and Changes in Fund Net PositionProprietary FundsFor the Fiscal Year Ended June 30, 2016
Solid Waste Disposal
Other Enterprise Funds
Total Enterprise Funds
Governmental Activities-
Internal Service Funds
Operating revenuesLicenses and permits -$ 2,179,359$ 2,179,359$ -$ Charges for services 15,889,355 5,286,404 21,175,759 86,052,024 Fines, forfeitures and penalties 17 10,800 10,817 - Administrative and facility charges - 15,000 15,000 808,555 Sale and rental of property 617,232 1,134,237 1,751,469 184,211 Total operating revenues 16,506,604 8,625,800 25,132,404 87,044,790
Operating expensesPersonnel services 10,550,918 5,294,092 15,845,010 14,507,992 Materials and services 7,033,793 4,628,335 11,662,128 60,718,063 Landfill closure and postclosure care costs 200,886 - 200,886 - Depreciation 1,120,721 745,447 1,866,168 2,155,392 Total operating expenses 18,906,318 10,667,874 29,574,192 77,381,447
Operating income (loss) (2,399,714) (2,042,074) (4,441,788) 9,663,343
Nonoperating revenues (expenses)Taxes and assessments, net of refunds - 1,464,630 1,464,630 - Intergovernmental 26,765 53,734 80,499 2,252,369 Investment earnings 169,435 41,662 211,097 906,543 Interest expense - - - (4,412,589) Gain (loss) on capital asset disposal - - - 232,965 Total nonoperating revenues (expenses) 196,200 1,560,026 1,756,226 (1,020,712)
Income (loss) before contributions and transfers (2,203,514) (482,048) (2,685,562) 8,642,631
Special Items (Note: IV.F.) (1,978,451) - (1,978,451) - Transfers in - 521,563 521,563 650,000 Transfers out - (108,713) (108,713) (2,486,117)
Change in net position (4,181,965) (69,198) (4,251,163) 6,806,514
Total net position, July 01, 2015 37,385,335 10,846,244 2,670,983 Total net position, June 30, 2016 33,203,370$ 10,777,046$ 9,477,497$
Adjustment to reflect the consolidation of internal service fund activities related to enterprise fund 1,748,651 Change in net position of business-type activities (2,502,512)$
The accompanying notes are an integral part of the financial statements.
39
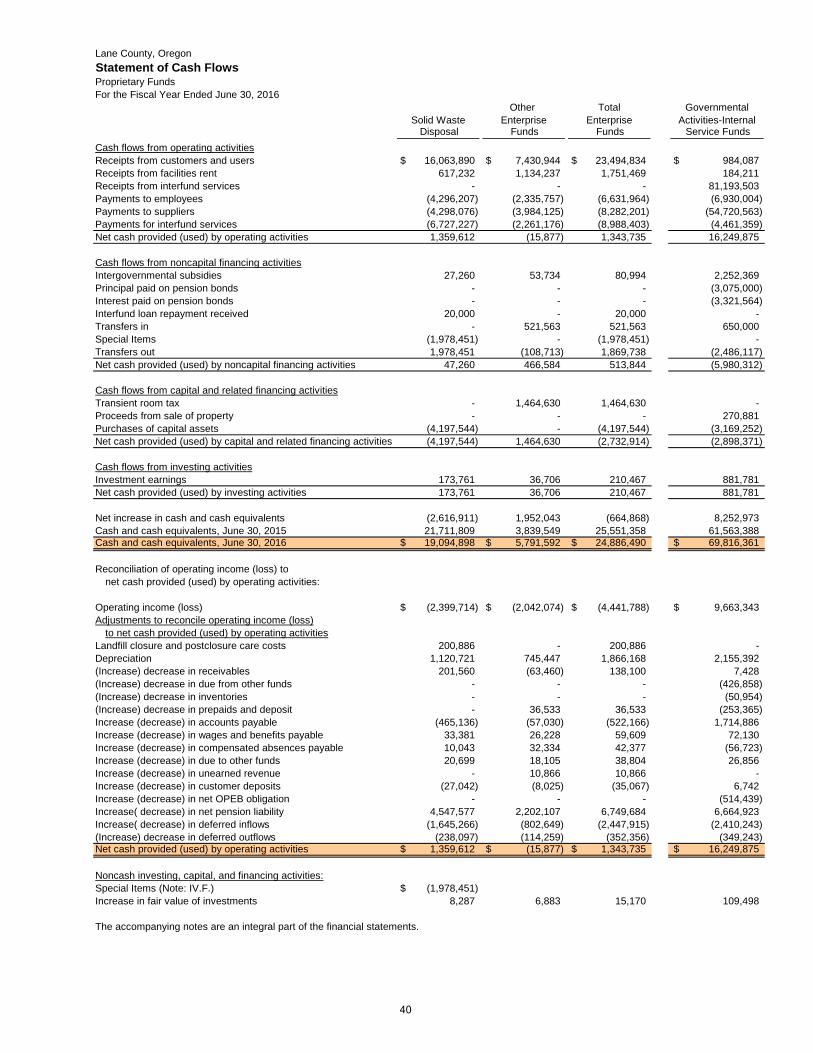
Lane County, OregonStatement of Cash FlowsProprietary FundsFor the Fiscal Year Ended June 30, 2016
Other Total GovernmentalSolid Waste Enterprise Enterprise Activities-Internal
Disposal Funds Funds Service Funds Cash flows from operating activitiesReceipts from customers and users 16,063,890$ 7,430,944$ 23,494,834$ 984,087$ Receipts from facilities rent 617,232 1,134,237 1,751,469 184,211 Receipts from interfund services - - - 81,193,503 Payments to employees (4,296,207) (2,335,757) (6,631,964) (6,930,004) Payments to suppliers (4,298,076) (3,984,125) (8,282,201) (54,720,563) Payments for interfund services (6,727,227) (2,261,176) (8,988,403) (4,461,359) Net cash provided (used) by operating activities 1,359,612 (15,877) 1,343,735 16,249,875
Cash flows from noncapital financing activitiesIntergovernmental subsidies 27,260 53,734 80,994 2,252,369 Principal paid on pension bonds - - - (3,075,000) Interest paid on pension bonds - - - (3,321,564) Interfund loan repayment received 20,000 - 20,000 - Transfers in - 521,563 521,563 650,000 Special Items (1,978,451) - (1,978,451) - Transfers out 1,978,451 (108,713) 1,869,738 (2,486,117) Net cash provided (used) by noncapital financing activities 47,260 466,584 513,844 (5,980,312)
Cash flows from capital and related financing activitiesTransient room tax - 1,464,630 1,464,630 - Proceeds from sale of property - - - 270,881 Purchases of capital assets (4,197,544) - (4,197,544) (3,169,252) Net cash provided (used) by capital and related financing activities (4,197,544) 1,464,630 (2,732,914) (2,898,371)
Cash flows from investing activitiesInvestment earnings 173,761 36,706 210,467 881,781 Net cash provided (used) by investing activities 173,761 36,706 210,467 881,781
Net increase in cash and cash equivalents (2,616,911) 1,952,043 (664,868) 8,252,973 Cash and cash equivalents, June 30, 2015 21,711,809 3,839,549 25,551,358 61,563,388 Cash and cash equivalents, June 30, 2016 19,094,898$ 5,791,592$ 24,886,490$ 69,816,361$
Reconciliation of operating income (loss) tonet cash provided (used) by operating activities:
Operating income (loss) (2,399,714)$ (2,042,074)$ (4,441,788)$ 9,663,343$ Adjustments to reconcile operating income (loss)
to net cash provided (used) by operating activitiesLandfill closure and postclosure care costs 200,886 - 200,886 - Depreciation 1,120,721 745,447 1,866,168 2,155,392 (Increase) decrease in receivables 201,560 (63,460) 138,100 7,428 (Increase) decrease in due from other funds - - - (426,858) (Increase) decrease in inventories - - - (50,954) (Increase) decrease in prepaids and deposit - 36,533 36,533 (253,365) Increase (decrease) in accounts payable (465,136) (57,030) (522,166) 1,714,886 Increase (decrease) in wages and benefits payable 33,381 26,228 59,609 72,130 Increase (decrease) in compensated absences payable 10,043 32,334 42,377 (56,723) Increase (decrease) in due to other funds 20,699 18,105 38,804 26,856 Increase (decrease) in unearned revenue - 10,866 10,866 - Increase (decrease) in customer deposits (27,042) (8,025) (35,067) 6,742 Increase (decrease) in net OPEB obligation - - - (514,439) Increase( decrease) in net pension liability 4,547,577 2,202,107 6,749,684 6,664,923 Increase( decrease) in deferred inflows (1,645,266) (802,649) (2,447,915) (2,410,243) (Increase) decrease in deferred outflows (238,097) (114,259) (352,356) (349,243) Net cash provided (used) by operating activities 1,359,612$ (15,877)$ 1,343,735$ 16,249,875$
Noncash investing, capital, and financing activities:Special Items (Note: IV.F.) (1,978,451)$ Increase in fair value of investments 8,287 6,883 15,170 109,498
The accompanying notes are an integral part of the financial statements.
40
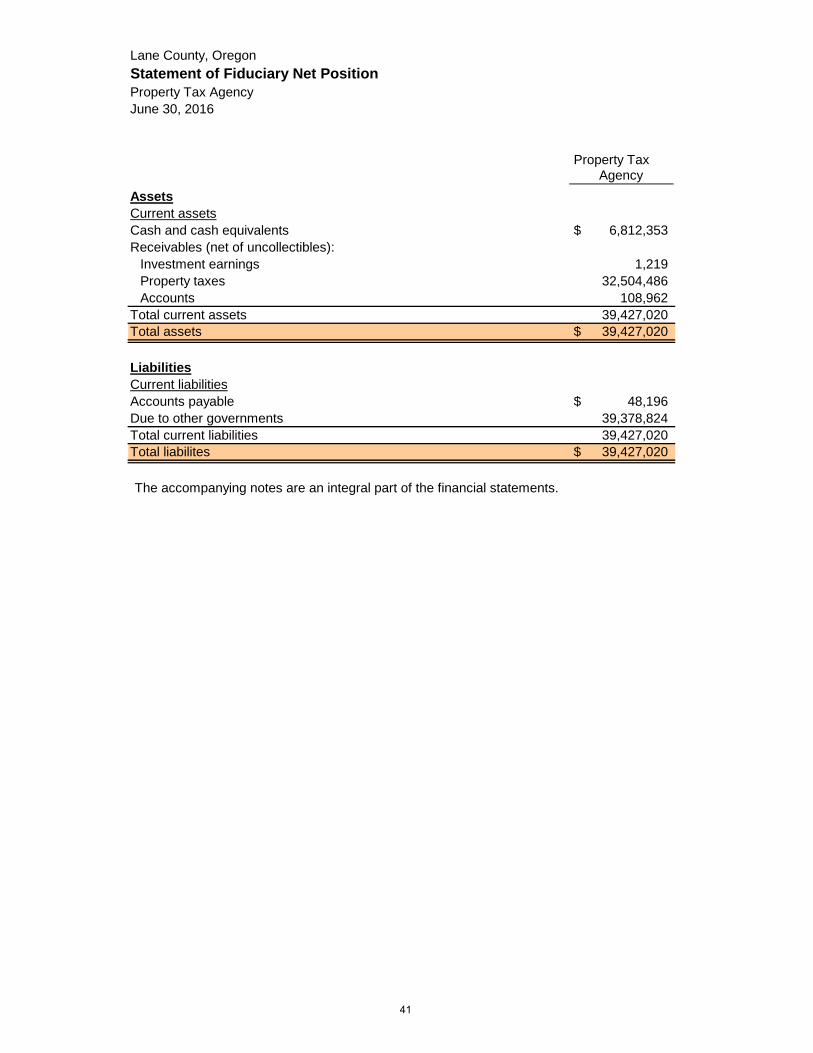
Lane County, OregonStatement of Fiduciary Net PositionProperty Tax AgencyJune 30, 2016
Property TaxAgency
AssetsCurrent assetsCash and cash equivalents 6,812,353$ Receivables (net of uncollectibles):
Investment earnings 1,219 Property taxes 32,504,486 Accounts 108,962
Total current assets 39,427,020 Total assets 39,427,020$
LiabilitiesCurrent liabilitiesAccounts payable 48,196$ Due to other governments 39,378,824 Total current liabilities 39,427,020 Total liabilites 39,427,020$
The accompanying notes are an integral part of the financial statements.
41

42
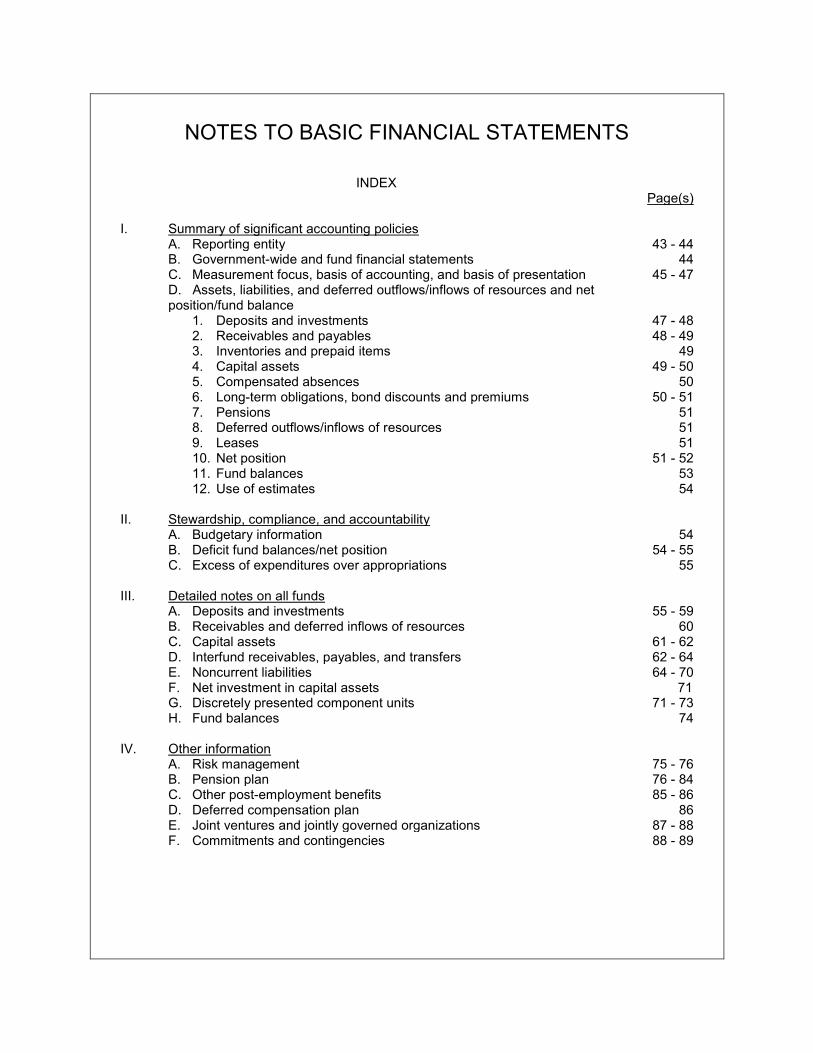
NOTES TO BASIC FINANCIAL STATEMENTS
INDEX Page(s) I. Summary of significant accounting policies
A. Reporting entity 43 - 44 B. Government-wide and fund financial statements 44 C. Measurement focus, basis of accounting, and basis of presentation 45 - 47 D. Assets, liabilities, and deferred outflows/inflows of resources and net position/fund balance
1. Deposits and investments 47 - 48 2. Receivables and payables 48 - 49 3. Inventories and prepaid items 49 4. Capital assets 49 - 50 5. Compensated absences 50 6. Long-term obligations, bond discounts and premiums 7. Pensions 8. Deferred outflows/inflows of resources
50 - 51 51 51
9. Leases 51 10. Net position 51 - 52 11. Fund balances 53 12. Use of estimates 54
II. Stewardship, compliance, and accountability
A. Budgetary information 54 B. Deficit fund balances/net position C. Excess of expenditures over appropriations
54 - 55 55
III. Detailed notes on all funds
A. Deposits and investments 55 - 59 B. Receivables and deferred inflows of resources 60 C. Capital assets 61 - 62 D. Interfund receivables, payables, and transfers 62 - 64 E. Noncurrent liabilities 64 - 70 F. Net investment in capital assets 71 G. Discretely presented component units 71 - 73 H. Fund balances 74
IV. Other information
A. Risk management 75 - 76 B. Pension plan 76 - 84 C. Other post-employment benefits 85 - 86 D. Deferred compensation plan 86 E. Joint ventures and jointly governed organizations 87 - 88 F. Commitments and contingencies
88 - 89
Lane County, Oregon Notes to Basic Financial Statements June 30, 2016
I. Summary of Significant Accounting Policies
A. Reporting Entity
Lane County, Oregon (the County) was established in 1851 and is organized under the Oregon Revised Statutes (ORS) as a municipal corporation. In 1962 Lane County voters approved a Home Rule Charter under which to operate. Under that Charter, a Board of County Commissioners governs the County and consists of five independently elected members who serve full-time and are compensated.
The financial statements of the County have been prepared in conformity with generally accepted accounting principles (GAAP) as applied to governmental units. The Governmental Accounting Standards Board (GASB) is the accepted standard-setting body for establishing governmental accounting and financial reporting standards. New Accounting Pronouncements Effective July 1, 2015, the County adopted the following accounting and financial reporting standards: • GASB Statement No. 72 – Fair Value Measurement and Application. The purpose of this Statement is
to provide guidance for determining a fair value measurement for financial reporting purposes and to provide guidance for applying fair value to certain investments and disclosures related to all fair value measurements. See Note III. A for more information.
• GASB Statement No. 76 – The Hierarchy of Generally Accepted Accounting Principles for State and
Local Governments. The purpose of this Statement is to identify, in the context of the current governmental financial reporting environment, the hierarchy of generally accepted accounting principles (GAAP). The County is not aware of the use of any non-authoritative literature in the establishment of the accounting treatment for a transaction or other event not specified within a source of authoritative GAAP. As a result there is no impact on the financial statements in the current year as a result of the application of this Statement.
• GASB Statement No. 78 – Pensions Provided Through Certain Multiple-Employer Defined Benefit Pension Plans. The objective of this Statement is to exclude from the scope of Statement 68, Accounting and Financial Reporting for Pensions, certain pensions provided to employees of state or local governmental employers that meet certain criteria. The County’s pension plans do not meet the criteria established. As a result there is no impact on the financial statements in the current year as a result of the application of this Statement.
• GASB Statement No. 79 – Certain External Investment Pools and Pool Participants. The objective of
this Statement is to establish criteria for certain external investment pools to qualify for making the election to measure all of its investments at amortized cost for financial reporting purposes. The County has determined that the County’s external investment pool, LGIP, does not meet the criteria established. As a result there is no impact on the financial statements in the current year as a result of the application of this Statement.
• GASB Statements No. 73, 74, 75, 77, 80, 81, and 82 – These are other pronouncements that have
been issued by the GASB but not yet implemented by the County.
Component Units As required by GAAP, these financial statements present the County and its component units -- legally separate entities for which the County is considered to be financially accountable. Financial accountability is defined as appointment of a voting majority of the component unit’s board, and either
43
Lane County, Oregon Notes to Basic Financial Statements June 30, 2016
I. Summary of Significant Accounting Policies, continued
A. Reporting Entity, continued
Component Units, continued a) the ability to impose its will on the organization, or b) the possibility that the component unit will provide a financial benefit or impose a financial burden on the primary government. Component units may be either blended into the County’s operations or reported discretely in a separate column based on the closeness of their relationship to the County. The County reports the following component units:
Discretely Presented Component Units The Housing and Community Services Agency of Lane County (“HACSA”) is the public housing authority for the City of Eugene, City of Springfield, and Lane County. Its mission is to provide affordable, decent, safe, and sanitary housing to low and moderate income families and households. The County Board of Commissioners and two resident members govern the Agency. Although the HACSA governing body is substantially the same as Lane County’s, there is no financial benefit or burden relationship between Lane County and HACSA, nor does Lane County management exercise operational responsibility over HACSA. Therefore, the financial statements of HACSA are discretely presented from those of the County for its fiscal year ended September 30, 2015.
Complete financial statements may be obtained at the following administrative office:
Housing and Community Services Agency 177 Day Island Road Eugene, Oregon 97401
B. Government-wide and Fund Financial Statements
The government-wide financial statements (i.e., the statement of net position and the statement of activities) report information on all of the non-fiduciary activities of the County and its component units. Governmental activities, which normally are supported by taxes and intergovernmental revenues, are reported separately from business-type activities, which rely to a significant extent on charges for services.
The statement of activities demonstrates the degree to which the direct and allocated indirect expenses of a given function or program are offset by program revenues. Direct expenses are those clearly identifiable with a specific function or program. Indirect expenses are those costs, usually administrative in nature, that support all County functions and enable direct services to be provided. Indirect expenses are allocated to business-type activities in an amount equal to their actual indirect charges paid. The balance of indirect expense is allocated to governmental activities as a percentage of direct expenses. Program revenues include 1) charges to customers or applicants who purchase, use, or directly benefit from goods, services, or privileges provided by a given function or program and 2) grants and contributions that are restricted to meeting the operational or capital requirements of a particular function or program. Taxes and other items not included in program revenues are reported as general revenues. Separate financial statements are provided for governmental funds, proprietary funds, and fiduciary funds, even though fiduciary funds are excluded from the government-wide financial statements. Major individual governmental funds and major individual enterprise funds are reported as separate columns in the fund financial statements.
44

Lane County, Oregon Notes to Basic Financial Statements June 30, 2016
I. Summary of Significant Accounting Policies, continued C. Measurement Focus, Basis of Accounting, and Basis of Presentation
Measurement focus refers to “what” is being measured by a fund. Basis of accounting refers to “when” revenues and expenditures or expenses are recognized in the accounts and reported in the financial statements. Basis of presentation refers to the application of measurement focus and basis of accounting to financial statement types. Government-wide, Proprietary, and Fiduciary Fund Financial Statements The government-wide financial statements are reported using the economic resources measurement focus and the accrual basis of accounting, as are the proprietary and the fiduciary fund financial statements. Revenues are recorded when earned and expenses are recorded when a liability is incurred, regardless of the timing of related cash flows. Property taxes are recognized as revenues in the year for which they are levied. Grants and similar items are recognized as revenue as soon as all the eligibility requirements imposed by the provider have been met. An exception to these rules exists for agency funds (a type of fiduciary fund) which account for resources held in a purely custodial capacity. Although agency funds use the accrual basis of accounting and are reported in the Statement of Fiduciary Net Position, they have no measurement focus and do not present a Statement of Changes in Fiduciary Net Position. As a general rule, the effect of interfund activity has been eliminated from the government-wide financial statements. An exception to this general rule is charges between County proprietary funds and various other functions of the government. Elimination of these charges would distort the direct costs and program revenues reported for the various functions concerned. Amounts reported as program revenues include 1) charges to customers or applicants for goods, services, or privileges provided, including exchange transactions with other governments, 2) operating grants and contributions, and 3) capital grants and contributions. Internally dedicated resources are reported as general revenues rather than as program revenues. Likewise, general revenues include all taxes. Proprietary funds distinguish operating revenues and expenses from nonoperating items. Operating revenues and expenses generally result from providing services and producing and delivering goods in connection with a proprietary fund’s principal ongoing operations. The principal operating revenue of the County’s proprietary funds is charges to customers for services. The County also recognizes as operating revenue admissions, concessions, fees, and rental of property. Operating expenses for the proprietary funds include the cost of services, administrative expenses, and depreciation on capital assets. All revenues and expenses not meeting these definitions are reported as nonoperating revenues and expenses. The County has the following major proprietary fund:
• Solid Waste Disposal Fund – This fund accounts for waste management services provided to
County residents through a network of one landfill and 16 transfer stations.
45

Lane County, Oregon Notes to Basic Financial Statements June 30, 2016
I. Summary of Significant Accounting Policies, continued C. Measurement Focus, Basis of Accounting, and Basis of Presentation, continued
Government-wide, Proprietary, and Fiduciary Fund Financial Statements, continued
Additionally, the County reports the following fund types:
• Internal Service – These funds account for operations that provide services primarily to other
departments or agencies of the County, or to other governments, on a cost-reimbursement basis. The County’s internal service funds provide risk management, employee benefits, pension bond debt service, motor and equipment pool, intergovernmental services, internal and regional computer information and replacement services, and retiree medical benefits.
• Fiduciary – The County’s fiduciary fund consists of a property tax agency fund that accounts for property taxes and timber receipts collected, held, and distributed by the County as an agent on behalf of other governments.
Governmental Fund Financial Statements Governmental fund financial statements are reported using the current financial resources measurement focus and the modified accrual basis of accounting. Revenues are recognized as soon as they are both measurable and available. Revenues are considered to be available when they are collectible within the current period or soon enough thereafter to pay liabilities of the current period. Expenditures are recorded when the related fund liability is incurred, except for principal and interest on general long-term debt, claims and judgments, and vested compensated absences. Taxes and assessments are recognized as revenues of the current fiscal period if received within 60 days of year-end. Intergovernmental revenues (exchange transactions, entitlements, shared revenues, and grants from other governmental entities) are recorded at the time of receipt or earlier if susceptible to accrual. Revenues on expenditure-driven grants are recognized when both the eligibility requirements have been met by the incurrence of qualifying expenditures, and the revenue is received soon enough after year end to liquidate grant related payables recorded as of year-end. Investment earnings are recognized when earned since they are considered both measurable and available at that time. All other receipts are recognized as revenues of the current fiscal period if susceptible to accrual and received within 45 days of year-end. The County has the following major governmental funds:
• General Fund – This is the County’s primary operating fund. It accounts for all the financial
resources of the general government, except those that are accounted for and reported in another fund(s).
• Road Fund – This fund accounts for the receipt and expenditure of resources dedicated to the
construction, operation, maintenance, and preservation of the County’s road and bridge system. Major revenues are the state gas tax and highway user fees.
46
Lane County, Oregon Notes to Basic Financial Statements June 30, 2016
I. Summary of Significant Accounting Policies, continued C. Measurement Focus, Basis of Accounting, and Basis of Presentation, continued
Governmental Fund Financial Statements, continued
• Special Revenue/Services Fund – This fund accounts for several dedicated revenue sources and
programs:
o Transient Room Tax for tourism programs o Sale of tax-foreclosed real property for the management of affected properties o Intergovernmental revenues for the Short Mountain training facility, drug enforcement,
and rural and community development projects o Courthouse security operations o Grants awarded to the District Attorney and Sheriff’s Office departments o Video lottery revenue for economic development projects o Systems development charges for park improvements o Permitting for manufactured structures o Elections equipment replacement
• Health and Human Services Fund – This fund accounts for resources received from Federal,
state, and local governments, enabling the County to provide a wide variety of health and human services to the community.
• Trillium Behavioral Health Fund – This fund accounts for the administration of behavioral health
services for Lane County individuals enrolled in the Oregon Health Plan. Trillium Behavioral Health is funded by Trillium Community Health Plan, which is the Coordinated Care Organization (CCO) for Lane County.
• Local Option Tax Levy Fund – This fund was created following the passage of a five-year local
option tax levy for the restoration of jail beds and critical youth services in May, 2013. This fund contains property tax revenue received from the approved levy of $.055 per $1,000 in assessed value. The levy will provide services through FY17-18.
D. Assets, Liabilities, Deferred Outflows/Inflows of Resources, and Net Position/
Fund Balance
1. Deposits and Investments
The County’s cash and cash equivalents consist of cash on hand, demand deposits, short-term investments with original maturities of three months or less from the date of acquisition, and equity in the County’s common cash and investments pool. The County’s common cash and investments pool is utilized by all County funds. Interest earned on the pool is allocated monthly based on each fund's average daily cash and investment balance in proportion to the County’s total pooled cash and investments. For purposes of the statement of cash flows, the County considers “cash and cash equivalents” to include pooled cash and investments since the pool has the general characteristics of a demand deposit account, in that any participating fund may deposit additional cash at any time and also may withdraw cash at any time without prior notice or penalty. ORS 294.035 authorizes the County to invest in general obligations of the United States and its agencies, debt obligations of the state of Oregon, California, Idaho, and Washington and their political subdivisions, banker’s acceptances, corporate indebtedness, commercial paper, repurchase agreements, time certificates of deposit, fixed or variable life insurance contracts, and the State
47

Lane County, Oregon Notes to Basic Financial Statements June 30, 2016
I. Summary of Significant Accounting Policies, continued
D. Assets, Liabilities, Deferred Outflows/Inflows of Resources, and Net Position/ Fund Balance, continued 1. Deposit and Investments, continued
Treasurer’s Local Government Investment Pool. For bank balances in excess of federal depository insurance, the County participates in Oregon’s Public Funds Collateralization Program and the Oregon Credit Union Public Funds Collateralization Program. The County reports, at amortized cost, all short-term highly liquid money market investments and participating interest-bearing investment contracts with a remaining maturity at purchase of one year or less. Such investments are stated at cost, increased by the accretion of discounts and reduced by amortization of premiums; both computed using the straight-line method. Investments with a remaining maturity at time of purchase of more than one year are valued at fair value using quoted market prices.
2. Receivables and Payables
Receivables represent claims held against others for money, goods, or services. The County carries receivables for investment earnings, property taxes, accounts, intergovernmental, other, and interest on balances, all net of an allowance for uncollectibles when appropriate. Property tax receivables are deemed to be substantially collectible or recoverable through foreclosure. Accordingly, no allowance for doubtful tax accounts is deemed necessary. As of June 30, 2016, an allowance was recorded in the General Fund equal to 25% of outstanding justice court receivables not turned over to a collection agent and an average of 64% turned over to a collection agent. All adjustments to the allowance accounts are charged against the related revenues of the current period. Intergovernmental receivables include uncollected grant revenues where all eligibility and timing requirements have been met. Eligibility requirements usually mandate monies be expended on the specific purpose or project before any amounts will be paid to the County; therefore, all eligibility requirements are considered met when the underlying expenditures are recorded. Timing requirements are usually met at the time when the allowable use of the monies has begun. In the course of operations, numerous transactions occur between individual funds for goods provided or services rendered. These receivables and payables are classified as “due from/to other funds”. Transactions between funds that are representative of lending/borrowing arrangements outstanding at the end of the fiscal year are referred to as either “interfund receivable/payable” (i.e., the current portion of interfund loans) or “advances from/to other funds” (i.e., the noncurrent portion of interfund loans). Any residual balances outstanding between the governmental activities and business-type activities are reported in the government-wide financial statements as “internal balances”. Advances between funds reported in the governmental fund financial statements are offset by nonspendable fund balance to indicate that they are not available for appropriation and are not expendable available financial resources.
Real and personal property taxes attach as an enforceable lien on July 1 for each fiscal year on values assessed as of January 1. Taxes are levied July 1 and are payable in three installments on November 15, February 15, and May 15. The County levies, collects, and distributes property taxes for all taxing jurisdictions within its boundaries, and reports the activity in an agency fund. Taxes unpaid as of May 16 are considered delinquent. In the governmental fund financial statements, property taxes are reflected as revenues in the fiscal period for which they were levied, provided they are due, or past due and receivable within the current period, and collected within the current period or expected to be collected soon enough thereafter to be used to pay liabilities of the current period (60 days). Otherwise, they are reported as deferred inflows of resources.
48
Lane County, Oregon Notes to Basic Financial Statements June 30, 2016
Summary of Significant Accounting Policies, continued D. Assets, Liabilities, Deferred Outflows/Inflows of Resources, and Net Position/
Fund Balance, continued
2. Receivables and Payables, continued
Property Tax Limitations: In 1997 taxing districts in Oregon were given permanent operating tax rates according to a formula set out by constitutional amendment, Measure 50, and are expressed as a tax rate per thousand dollars of assessed value. Rates cannot be increased, but a district can levy less. An amendment to Measure 50 established a maximum assessed value for each property equal to its 1995 real market value less 10%. The growth of a property's maximum assessed value is limited to no more than 3 percent per year, with exceptions for specific situations including but not limited to new improvements; renovations and other construction to existing improvements above a certain threshold; subdivisions or partitions of land; removal from an exemption or special assessment program; rezoning; and new use of the property. Tax is levied on the taxable value of the property which is the lesser of the maximum assessed value or the real market value minus any exemptions. As of the 2016 tax roll, taxable property values in the County are currently 79% of real market values. The Oregon Constitution also sets limits on the amount of property taxes that can be billed to each property tax account at $10 per $1,000 of real market value for general government taxes. General obligation bond levies are exempt from this limitation. If taxes exceed the limit for that property, the taxes are reduced proportionately for all general government levies, or "compressed", until the limit is reached.
3. Inventories and Prepaid Items
All inventories are valued at the lower of cost or market using the first in/first out (FIFO) method. Inventories of governmental funds are recorded as expenditures when purchased. However, significant inventories in governmental funds are reported as an asset with a corresponding offset to nonspendable fund balance. In the government-wide and proprietary fund financial statements, inventory is capitalized upon purchase and expensed as the materials and supplies are used.
Certain payments to vendors reflect costs applicable to future accounting periods and are recorded as expenditures in governmental funds and prepaid items in the government-wide and proprietary fund financial statements.
4. Capital Assets
Capital assets, which include land, buildings and improvements, machinery and equipment, and infrastructure assets, are reported in the applicable governmental or business-type activities columns in the government-wide financial statements. Capital assets are defined as assets with an initial, individual cost of $5,000 or more and an estimated useful life in excess of one year. Such assets are recorded at historical cost or estimated historical cost if purchased or constructed. Donated capital assets are recorded at estimated fair value at the date of donation.
Infrastructure, which includes bridges and culverts, roads and road improvements, and right-of-ways are those capital assets that are stationary in nature and can be preserved for a significantly greater number of years than most other capital assets. As permitted by GASB, the County has limited the retroactive capitalization of governmental fund infrastructure to fiscal years ending after June 30, 1980. Although the majority of infrastructure was placed in service before that date, it has not been included in these financial statements.
49

Lane County, Oregon Notes to Basic Financial Statements June 30, 2016
I. Summary of Significant Accounting Policies, continued
D. Assets, Liabilities, Deferred Outflows/Inflows of Resources, and Net Position/ Fund Balance, continued
4. Capital Assets, continued Additions, improvements, and other capital outlays that significantly extend the useful life of an asset are capitalized. The costs of normal maintenance and repairs that do not add to the value of the asset or materially extend assets lives are not capitalized. Interest incurred during the construction phase of capital assets of business-type activities is included as part of the capitalized value of the assets constructed. No interest expense incurred in enterprise funds during fiscal year 2016 was required to be capitalized. Capital assets are depreciated unless they are inexhaustible in nature (e.g., land and right-of-ways). Depreciation is an accounting process used to allocate the cost of capital assets in a systematic and rational manner to those periods expected to benefit from the use of capital assets. Depreciation is not intended to represent an estimate in the decline of fair value, nor is capital assets, net of accumulated depreciation, intended to represent an estimate of the current condition of the assets, or the maintenance requirements needed to maintain the assets at their current level of condition.
Capital assets of the County are depreciated using the straight-line method over the following estimated lives:
Capital AssetBuildings and related improvements 24 - 60Certain other improvements 8 - 30Machinery and equipment 3 - 10Infrastructure: Bridges and culverts 80 Roads 7 - 40
Years
5. Compensated Absences
Vested vacation and time management benefits are recognized as a liability when earned in the government-wide and proprietary fund financial statements. In the governmental funds, the liability is recognized only when due and payable, i.e. as a result of employee resignations and retirements.
6. Long-Term Obligations and Bond Discounts/Premiums
Long-term obligations and rebatable arbitrage are reported in the government-wide and proprietary fund financial statements as liabilities. The governmental fund financial statements do not report long-term obligations because they do not require the use of current financial resources. Rebatable arbitrage is only reported in the governmental fund financial statements when due and payable.
Bond premiums and discounts are deferred and amortized over the term of the bonds using the bonds-outstanding method in the government-wide and proprietary fund financial statements, but are recognized during the current period in the governmental fund financial statements. The bonds-outstanding method does not differ significantly from the effective interest rate method. Bond issuance costs, other than prepaid insurance, are reported as expenses/expenditures when incurred.
50
Lane County, Oregon Notes to Basic Financial Statements June 30, 2016
I. Summary of Significant Accounting Policies, continued
D. Assets, Liabilities, Deferred Outflows/Inflows of Resources, and Net Position/ Fund Balance, continued
6. Long-Term Obligations and Bond Discounts/Premiums, continued
Interest accretion on deep discount obligations is calculated based on the initial yield to maturity as set forth in the bond’s Official Statement. Accreted interest increases bonds payable and interest expense as reported in the government-wide and proprietary fund financial statements. Interest accretion is not reported in the governmental fund financial statements.
7. Pensions The County is a participating employer in the Oregon Public Employee Retirement System (PERS), a cost-sharing multiple-employer defined public employee pension plan, and maintains a defined contribution plan for the purpose of individual retirement savings through PERS. For purposes of measuring the net pension liability, deferred outflows of resources and deferred inflows of resources related to pensions, and pension expense, information about the fiduciary net position of PERS, and additions to/deductions from PERS’s fiduciary net position have been determined on the same basis as they are reported by PERS. For this purpose, benefit payments (including refunds of employee contributions) are recognized when due and payable in accordance with the benefit terms. Investments are reported at fair value.
8. Deferred Outflows/Inflows of Resources In addition to assets and liabilities, the statement of financial position reports separate sections for deferred outflows of resources and deferred inflows of resources. The separate financial statement element, deferred outflows of resources, represents a consumption of net position that applies to a future period and so will not be recognized as an outflow of resources (expense/expenditure) until then. The separate financial statement element, deferred inflows of resources, represents a generation of net position that applies to a future period and so will not be recognized as an inflow of resources (revenue) until then.
9. Leases Leases which meet certain criteria established by the Governmental Accounting Standards Board are classified as capital leases, and the assets and related liabilities are recorded at amounts equal to the lesser of the present value of minimum lease payments or the fair value of the leased property at the beginning of the respective lease term. Leases which do not meet the criteria of a capital lease are classified as operating leases. The County recorded two capital leases in this fiscal year, Delta Oaks Medical Clinic and Wellness Center, in the amount of $2,091,205 and $289,774 respectively. Both capital leases are amortized over the term of the lease.
10. Net Position Net position represents the difference between assets plus deferred outflows of resources less liabilities and deferred inflows of resources. The County reports the following subcategories of net position:
51
Lane County, Oregon Notes to Basic Financial Statements June 30, 2016
I. Summary of Significant Accounting Policies, continued
D. Assets, Liabilities, Deferred Outflows/Inflows of Resources, and Net Position/ Fund Balance, continued
10. Net Position, continued Net investment in capital assets – Represents the difference between capital assets less accumulated depreciation, deferred outflows of resources, and the outstanding balance of debt (excluding unexpended proceeds) directly attributable to the acquisition, construction, or improvement of those assets. See note III.F for a detailed computation. Restricted net positions – Net positions are reported as restricted when there are limitations imposed on their use either through enabling legislation adopted by the County or through external restrictions imposed by creditors, grantors, laws, or regulations of other governments. The following are major classes of restricted net positions:
Capital projects – Represents capital project funds legally restricted by debt covenants for the acquisition, construction, or improvement of specified capital assets. Debt service – Represents debt service funds legally restricted by Oregon statute for payment of principal and interest on outstanding general obligation and limited tax bonds.
Health and human services – Represents Health and Human Services funds generated by grant revenue restricted to approved activities. Special revenue / services – Represents Special Revenue / Services funds generated by Federal, state, and local grants restricted to approved activities. Roads – Represents Road funds generated by fuel tax and related revenues legally restricted by Oregon statute for road and road related projects.
Title III projects – Represents the Title III Projects funds generated by grant revenue legally restricted by Federal law to services on federally owned forest land within the County.
Trillium Behavioral Health – Represents Trillium Behavioral Health funds generated by per capita revenue legally restricted by State statue to mental health services for County residents participating in the Oregon Health Plan. Housing and Community Services – Represents HACSA funds generated by Federal grants restricted to approved activities. Public Safety Local Option Tax Levy – Represents Local Option Tax Levy funds legally restricted to the restoration of jail beds and critical youth services.
Other purposes – Represents other restrictions for all other funds of the County.
Unrestricted – Represents all other net positions that are not restricted and do not meet the definition of net investment in capital assets.
52

Lane County, Oregon Notes to Basic Financial Statements June 30, 2016
I. Summary of Significant Accounting Policies, continued
D. Assets, Liabilities, Deferred Outflows/Inflows of Resources, and Net Position/ Fund Balance, continued
11. Fund Balances
In the fund financial statements, the fund balance for governmental funds is reported in classifications that comprise a hierarchy based on the extent to which the government is bound to honor constraints on the specific purposes for which amounts in those funds can be spent. The County Board of Commissioners approved the following fund balance polices as documented in Lane Manual Chapter 4.010, Section 6: • Fund balance is reported as nonspendable when the resources cannot be spent because they
are either in a nonspendable form or legally or contractually required to be maintained intact. Resources in nonspendable form are all inventories.
• Fund balance is reported as restricted when the constraints placed on the use of resources are
either: (a) externally imposed by creditors (such as through debt covenants), grantors, contributors, or laws or regulations of other governments; or (b) imposed by law through constitutional provision or enabling legislation.
• Lane County’s highest decision-making level of authority rests with the five-member Board of
County Commissioners. As such, fund balance is reported as committed when the Board passes a Board Order that places specific constraints on how the resources may be used. The Board can modify or rescind the Order at any time through passage of an additional Order.
• It is the policy of the Board of County Commissioners to report as assigned fund balance any
unrestricted or uncommitted resources that are constrained by the government’s intent to use them for a specific purpose. Intent may be expressed by the Board of Commissioners, Lane County advisory committees or boards, or officials the Board has delegated authority to. All Budget Committee and Finance Committee decisions and policies in the Administrative Procedures Manual are considered Assigned.
• Unassigned fund balance is the residual classification for the General Fund. This classification
represents fund balance that has not been restricted, committed or assigned within the General Fund. This classification is also used to report any negative fund balance amounts in other governmental funds.
When expenditures are incurred and both restricted and unrestricted resources are available, it is the County’s policy to use restricted resources first, then unrestricted resources in the order of committed, assigned, and then unassigned as they are needed. The County has a budgetary fund balance reserve policy that directs the General Fund to maintain a reserve fund balance of at least 10% of General Fund operating revenues. All other funds are directed to have a minimum 5% prudent person reserve. A summary of fund balances by fund and specific purpose can be found at Note III.H.
53
Lane County, Oregon Notes to Basic Financial Statements June 30, 2016
I. Summary of Significant Accounting Policies, continued
D. Assets, Liabilities, Deferred Outflows/Inflows of Resources, and Net Position/ Fund Balance, continued
12. Use of Estimates The preparation of financial statements in conformity with U.S. generally accepted accounting principles requires management to make estimates and assumptions that affect the reported amounts of assets and liabilities and disclosure of contingent assets and liabilities at the date of the financial statements, and the reported amounts of revenues and expenses during the reporting period. Actual results could differ from those estimates.
II. Stewardship, Compliance, and Accountability
A. Budgetary Information
Legally required budgets are adopted for all funds. The Property Tax Agency Fund is exempted from Oregon Local Budget Law under ORS 294.316(8). The budget is adopted on a modified accrual basis with the exception of the following:
• Unrealized changes in the fair value of investments are not recognized on a budget basis. • Investment earnings are not accrued on a budget basis. • Intrafund transfers are recognized on a budget basis. • The Lane Events Center reports prepaid expenditures for the County Fair on a budget basis.
The Board of County Commissioners adopts a resolution by June 30 of each year authorizing appropriations for the next fiscal year beginning July 1. This resolution establishes appropriations at the department level within each fund and sets the spending level by which expenditures cannot legally be exceeded. A detailed budget is also prepared, containing more in-depth information than the above-mentioned expenditure appropriation categories. Unexpected additional resources may be added to the budget through the use of a supplemental budget as allowed by state statute. A supplemental budget follows Oregon Local Budget Law requirements found in ORS 294 with regard to specific changes allowable in the form of a Resolution approved by the County Commissioners and is based on the type of funding and level of fund change which further determines whether a public hearing and/or special publication of meeting is required. The County’s department directors may transfer appropriations between categories within a department so long as the overall appropriation does not exceed that authorized by the original budget resolution plus any supplemental budget. Transfers of appropriations between departments or funds require a resolution or ordinance adopted by the governing board. For fiscal year 2016, the County Commissioners adopted three supplemental budget resolutions. Appropriations lapse at fiscal year-end. The County does not utilize encumbrance accounting.
B. Deficit Fund Balances/Net Position
The Pension Bond internal service fund reported negative net position of $60,174,470. A large portion of the negative net position is related to the implementation of GASB 68, which effectively removed deposits with PERS from the Statement of Fund Net Position previously reported as a “net pension asset”. This also resulted from timing differences between the amortization of the deep discount on pension bonds and net pension asset, and actual revenues required to meet debt service requirements. The deficit does not affect the fund’s ability to pay debt service because departmental charges are budgeted and collected
54

Lane County, Oregon Notes to Basic Financial Statements June 30, 2016
II. Stewardship, Compliance, and Accountability, continued B. Deficit Fund Balances/Net Position, continued
to coincide with debt service requirements. Over the life of the bond as debt service increases, the deficit will be eliminated. Additionally, the Information Services fund also reported negative net positon of $1,793,240 due primarily to the implementation of GASB68, which resulted in $3.76 million net pension liability for the fund.
C. Excess of Expenditures over Appropriations There are no excess of expenditures over appropriations as of June 30, 2016.
III. Detailed Notes on All Funds
A. Deposits and Investments
Total deposits and investments by financial statement reporting unit at June 30, 2016 are as follows:
Govvernment-wide Statement of Net
Position
Statement of Fiduciary Net
Position Total
Total Cash and Investments 221,321,629$ 6,812,353$ 228,133,982$
Total cash and investments at June 30, 2016 are comprised of the following:
Cash and cash equivalents Cash on hand 89,415$
Deposits: Demand deposits 3,126,045 Certificates of deposit 7,733,000 Money market accounts 6,558,473
Total deposits 17,417,518
Investments 210,627,049
Total cash and investments 228,133,982$
Investments Measured at Fair Value As per GASB 72, various inputs are used in determining the fair value of investments. The County categorizes its fair value measurements with the fair value hierarchy consisting of three broad levels. The County has recorded its investments at fair value, and primarily uses the Market Approach to valuing each security. Assets are categorized by asset type, which is a key component of determining hierarchy levels. Assets types allowed per the County’s investment policy generally fall within hierarchy level 1 and level 2. The following table classifies the fair value of the County’s investments at June 30, 2016:
55
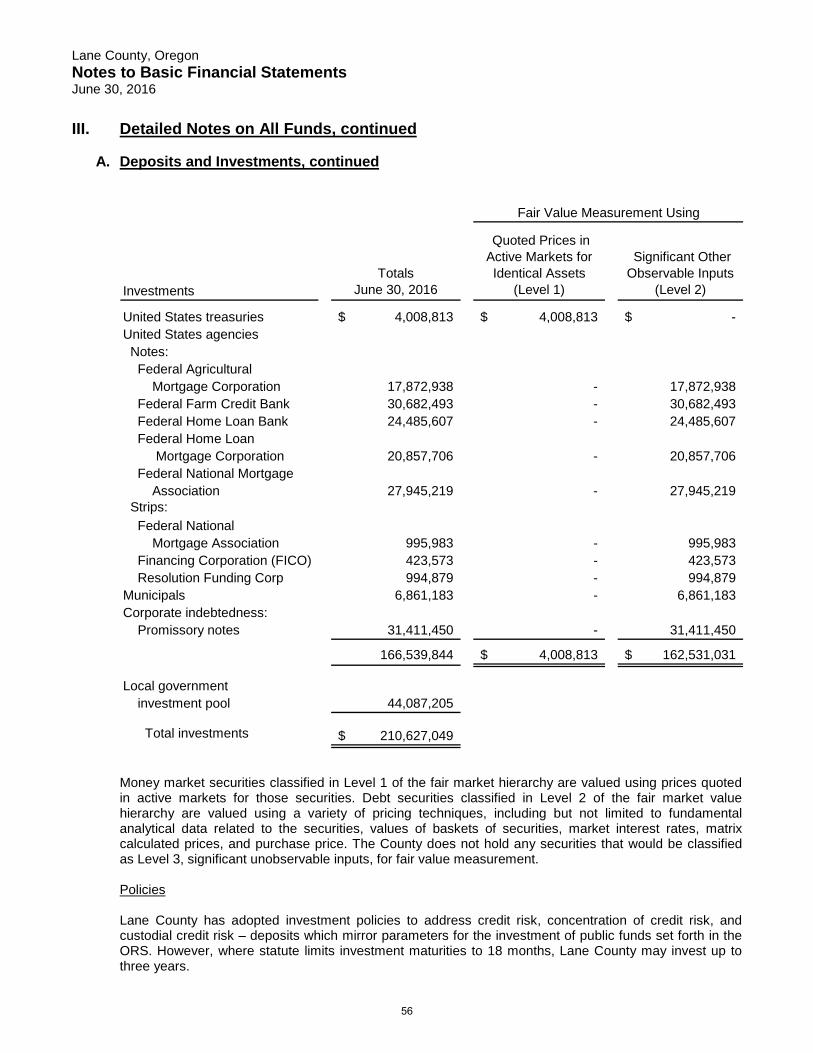
Lane County, Oregon Notes to Basic Financial Statements June 30, 2016
III. Detailed Notes on All Funds, continued
A. Deposits and Investments, continued
Investments Totals
June 30, 2016
Quoted Prices in Active Markets for Identical Assets
(Level 1)
Significant Other Observable Inputs
(Level 2)
United States treasuries 4,008,813$ 4,008,813$ -$ United States agencies Notes: Federal Agricultural Mortgage Corporation 17,872,938 - 17,872,938 Federal Farm Credit Bank 30,682,493 - 30,682,493 Federal Home Loan Bank 24,485,607 - 24,485,607 Federal Home Loan Mortgage Corporation 20,857,706 - 20,857,706 Federal National Mortgage Association 27,945,219 - 27,945,219 Strips: Federal National Mortgage Association 995,983 - 995,983 Financing Corporation (FICO) 423,573 - 423,573 Resolution Funding Corp 994,879 - 994,879 Municipals 6,861,183 - 6,861,183 Corporate indebtedness: Promissory notes 31,411,450 - 31,411,450
166,539,844 4,008,813$ 162,531,031$
Local government investment pool 44,087,205
Total investments 210,627,049$
Fair Value Measurement Using
Money market securities classified in Level 1 of the fair market hierarchy are valued using prices quoted in active markets for those securities. Debt securities classified in Level 2 of the fair market value hierarchy are valued using a variety of pricing techniques, including but not limited to fundamental analytical data related to the securities, values of baskets of securities, market interest rates, matrix calculated prices, and purchase price. The County does not hold any securities that would be classified as Level 3, significant unobservable inputs, for fair value measurement. Policies Lane County has adopted investment policies to address credit risk, concentration of credit risk, and custodial credit risk – deposits which mirror parameters for the investment of public funds set forth in the ORS. However, where statute limits investment maturities to 18 months, Lane County may invest up to three years.
56

Lane County, Oregon Notes to Basic Financial Statements June 30, 2016
III. Detailed Notes on All Funds, continued
A. Deposits and Investments, continued
Interest Rate Risk
The County reports the following investments and maturities at June 30, 2016. For purpose of this schedule, the County assumes its callable investments will not be called.
Investments Fair Value 0 to 6 months 6 - 12 months 1 - 2 years 2 - 3 years United States treasuries 4,008,813$ -$ 4,008,813$ -$ United States agencies Notes: Federal Agricultural Mortgage Corporation 17,872,938 5,004,953 2,002,877 6,337,139 4,527,969 Federal Farm Credit Bank 30,682,493 2,514,434 4,001,305 7,545,416 16,621,338 Federal Home Loan Bank 24,485,607 1,800,467 5,004,476 9,883,064 7,797,600 Federal Home Loan Mortgage Corporation 20,857,706 4,252,446 3,006,872 9,596,095 4,002,293 Federal National Mortgage Association 27,945,219 2,850,159 5,432,872 11,489,037 8,173,151 Strips: Federal National Mortgage Association 995,983 - 995,983 - - Financing Corporation (FICO) 423,573 423,573 - - - Resolution Funding Corp 994,879 - 994,879 - - Municipals 6,861,183 390,831 4,521,848 - 1,948,504 Corporate indebtedness: Promissory notes 31,411,450 12,540,019 8,088,501 7,354,761 3,428,169
166,539,844 29,776,882$ 38,058,426$ 52,205,512$ 46,499,024$
Local government investment pool 44,087,205
Total investments 210,627,049$
Investment Maturities
As a means of limiting exposure to fair value losses arising from rising interest rates, the County’s investment policy limits its investment maturities to a percent of the investment portfolio, which includes total investments plus unrestricted certificates of deposit and money market accounts. For purposes of the computation, 100% of the amounts in Oregon’s local government investment pool are considered to be less than 180 days to maturity.
Maturity
Less than 6 months 20% 37.0%Less than 1 year 30% 54.8%Less than 2 years 50% 78.0%Less than 3 years 100% 100.0%
Minimum PercentActual Percent at
June 30, 2016
57

Lane County, Oregon Notes to Basic Financial Statements June 30, 2016
III. Detailed Notes on All Funds, continued
A. Deposits and Investments, continued Credit Risk
The County relies on both Standard and Poor’s and Moody’s Investor Service to rate certain debt securities to assess risk and reflect the ability of the debtor to meet promised principal and interest payments. The upper echelons of ratings are defined as follows: “AAA” = Highest Quality, “AA” = High Quality, and “A” = Upper medium quality. All ratings below “A” are considered medium or low grade investments. State law and County policy require that minimum ratings be maintained for certain debt securities. At June 30, 2016, the minimum ratings and actual ratings for the County’s investment portfolio are:
Debt Security Minimum Rating Actual Rating United States treasuries None AAA United States agencies: Federal Agricultural Mortgage Corporation None None Federal Farm Credit Bank None AAA Federal Home Loan Bank None AAA Federal Home Loan Mortgage Corporation None None Federal National Mortgage Association None AAA Financing Corporation (FICO) None None Resolution Funding Corp None None State of Oregon and its political subdivisions A A to AA States of Washington and California and their political subdivisions AA AA
Corporate Indebtedness: Promissory notes: Oregon A A to AA Non-Oregon AA AA
The Local Government Investment Pool is unrated. Concentration of Credit Risk State law and County policy require investments not exceed the following as a percent of all monies available for investment in the investment portfolio as determined on the settlement date:
• 33% in general obligations of the United States or any one of its agencies • 25% in bankers acceptances • 35% in corporate indebtedness, or 5% in any single corporate issuer
The County does not hold any securities in a single organization in excess of 5% of net investments.
58
Lane County, Oregon Notes to Basic Financial Statements June 30, 2016
III. Detailed Notes on All Funds, continued
A. Deposits and Investments, continued Custodial Credit Risk - Deposits
Custodial credit risk on deposits is the risk that in the event of a bank or credit union failure, the County’s deposits may not be returned. In order to minimize this risk, Lane County policy and state statutes require banks and credit unions holding public funds become members of the Oregon Public Funds Collateralization Program (PFCP), a multiple financial institution collateral pool created by the Office of the State Treasurer. To qualify, participating banks and credit unions must pledge collateral against any public fund deposits in excess of deposit insurance. The amount of collateral is set by the PFCP between 10% and 110% of each bank’s public fund deposits based on their net worth and level of capitalization. Although the PFCP creates a shared liability structure for participating bank and credit union depositories, it does not guarantee that all funds are 100% protected. Of the County’s June 30, 2016 bank balance of $19,222,604, $1,045,595 was insured by the FDIC and $18,177,009 was collateralized by the PFCP. Custodial Credit Risk - Investments Custodial credit risk on investments is the risk that in the event of a failure of the counterparty, the County will not be able to recover the value of its investments that are in the possession of an outside party. The County does not have an investment policy for custodial credit risk. All investments were held by a third-party safe-keeper in the County’s own name.
Local Government Investment Pool The State Treasurer of the State of Oregon maintains the Oregon Short-term Fund (OSTF), of which the Local Government Investment Pool (LGIP) is a part. The OSTF is a cash and investment pool available for use by all state funds and eligible local governments. The OSTF is managed by the Investment Division of the Oregon State Treasury within the guidelines established in the OSTF Portfolio Rules. The LGIP is an open-ended, no-load diversified portfolio offered to eligible participants who by law are made custodian of, or have control over, any public funds. At June 30, 2016, the fair value of the County’s position in the pool is the same as the value of the pool shares, which approximates cost. The OSTF financial statements and the OSTF Portfolio Rules can be obtained at www.oregon.gov/treasury/Divisions/Investment.
59
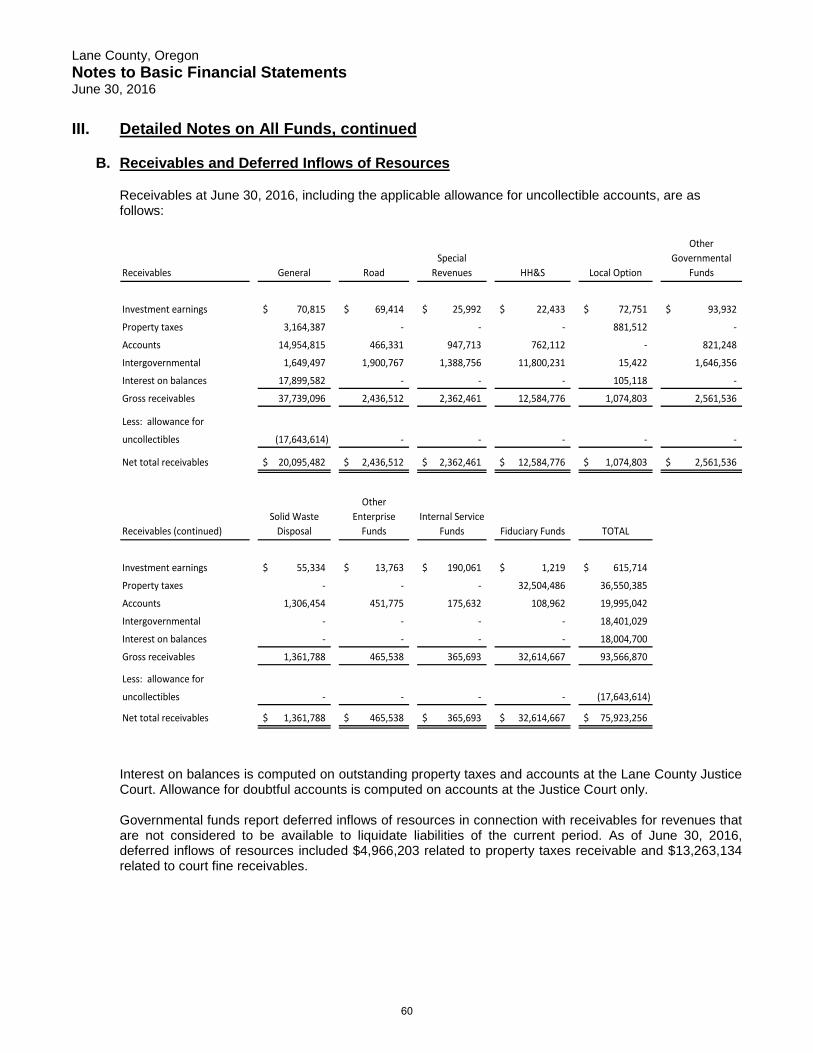
Lane County, Oregon Notes to Basic Financial Statements June 30, 2016
III. Detailed Notes on All Funds, continued B. Receivables and Deferred Inflows of Resources
Receivables at June 30, 2016, including the applicable allowance for uncollectible accounts, are as follows:
Receivables General RoadSpecial
Revenues HH&S Local Option
Other Governmental
Funds
Investment earnings 70,815$ 69,414$ 25,992$ 22,433$ 72,751$ 93,932$
Property taxes 3,164,387 - - - 881,512 -
Accounts 14,954,815 466,331 947,713 762,112 - 821,248
Intergovernmental 1,649,497 1,900,767 1,388,756 11,800,231 15,422 1,646,356
Interest on balances 17,899,582 - - - 105,118 -
Gross receivables 37,739,096 2,436,512 2,362,461 12,584,776 1,074,803 2,561,536
Less: allowance for
uncollectibles (17,643,614) - - - - -
Net total receivables 20,095,482$ 2,436,512$ 2,362,461$ 12,584,776$ 1,074,803$ 2,561,536$
Receivables (continued)Solid Waste
Disposal
Other Enterprise
FundsInternal Service
Funds Fiduciary Funds TOTAL
Investment earnings 55,334$ 13,763$ 190,061$ 1,219$ 615,714$
Property taxes - - - 32,504,486 36,550,385
Accounts 1,306,454 451,775 175,632 108,962 19,995,042
Intergovernmental - - - - 18,401,029
Interest on balances - - - - 18,004,700
Gross receivables 1,361,788 465,538 365,693 32,614,667 93,566,870
Less: allowance for
uncollectibles - - - - (17,643,614)
Net total receivables 1,361,788$ 465,538$ 365,693$ 32,614,667$ 75,923,256$
Interest on balances is computed on outstanding property taxes and accounts at the Lane County Justice Court. Allowance for doubtful accounts is computed on accounts at the Justice Court only. Governmental funds report deferred inflows of resources in connection with receivables for revenues that are not considered to be available to liquidate liabilities of the current period. As of June 30, 2016, deferred inflows of resources included $4,966,203 related to property taxes receivable and $13,263,134 related to court fine receivables.
60
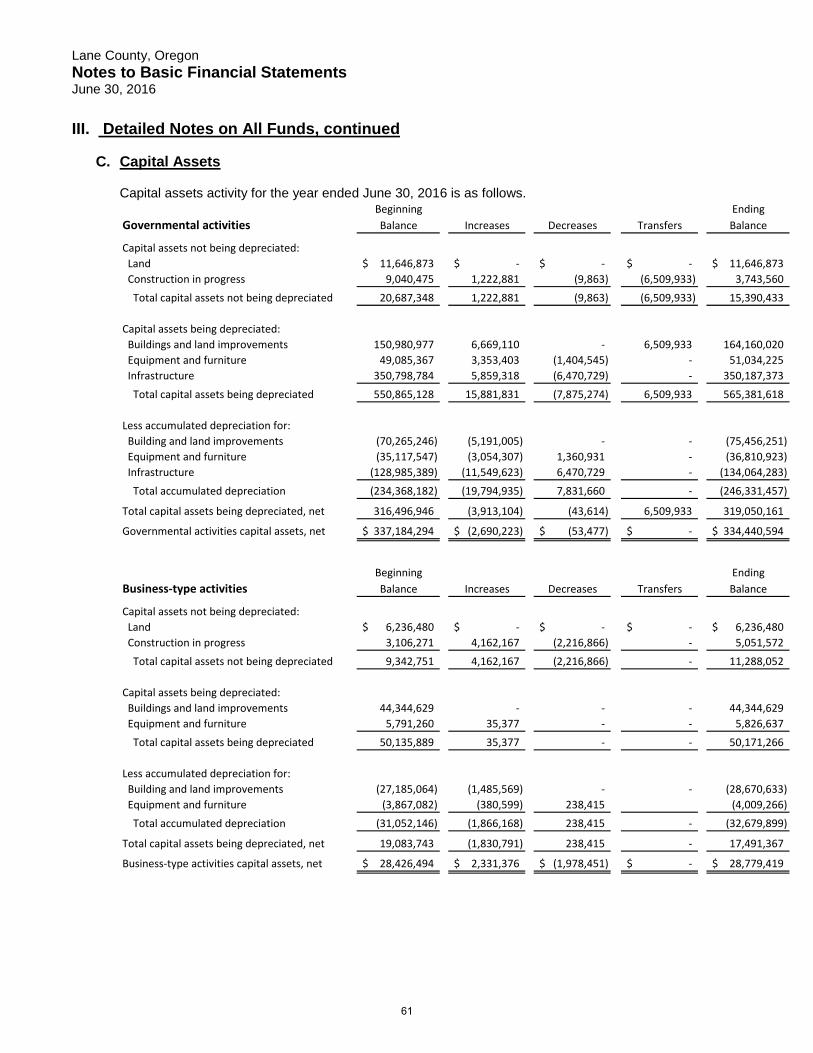
Lane County, Oregon Notes to Basic Financial Statements June 30, 2016
III. Detailed Notes on All Funds, continued
C. Capital Assets Capital assets activity for the year ended June 30, 2016 is as follows.
Beginning EndingGovernmental activities Balance Increases Decreases Transfers Balance
Capital assets not being depreciated: Land 11,646,873$ -$ -$ -$ 11,646,873$ Construction in progress 9,040,475 1,222,881 (9,863) (6,509,933) 3,743,560 Total capital assets not being depreciated 20,687,348 1,222,881 (9,863) (6,509,933) 15,390,433
Capital assets being depreciated: Buildings and land improvements 150,980,977 6,669,110 - 6,509,933 164,160,020 Equipment and furniture 49,085,367 3,353,403 (1,404,545) - 51,034,225 Infrastructure 350,798,784 5,859,318 (6,470,729) - 350,187,373 Total capital assets being depreciated 550,865,128 15,881,831 (7,875,274) 6,509,933 565,381,618
Less accumulated depreciation for: Building and land improvements (70,265,246) (5,191,005) - - (75,456,251) Equipment and furniture (35,117,547) (3,054,307) 1,360,931 - (36,810,923) Infrastructure (128,985,389) (11,549,623) 6,470,729 - (134,064,283) Total accumulated depreciation (234,368,182) (19,794,935) 7,831,660 - (246,331,457)
Total capital assets being depreciated, net 316,496,946 (3,913,104) (43,614) 6,509,933 319,050,161
Governmental activities capital assets, net 337,184,294$ (2,690,223)$ (53,477)$ -$ 334,440,594$
Beginning EndingBusiness-type activities Balance Increases Decreases Transfers Balance
Capital assets not being depreciated: Land 6,236,480$ -$ -$ -$ 6,236,480$ Construction in progress 3,106,271 4,162,167 (2,216,866) - 5,051,572 Total capital assets not being depreciated 9,342,751 4,162,167 (2,216,866) - 11,288,052
Capital assets being depreciated: Buildings and land improvements 44,344,629 - - - 44,344,629 Equipment and furniture 5,791,260 35,377 - - 5,826,637 Total capital assets being depreciated 50,135,889 35,377 - - 50,171,266
Less accumulated depreciation for: Building and land improvements (27,185,064) (1,485,569) - - (28,670,633) Equipment and furniture (3,867,082) (380,599) 238,415 (4,009,266) Total accumulated depreciation (31,052,146) (1,866,168) 238,415 - (32,679,899)
Total capital assets being depreciated, net 19,083,743 (1,830,791) 238,415 - 17,491,367
Business-type activities capital assets, net 28,426,494$ 2,331,376$ (1,978,451)$ -$ 28,779,419$
61
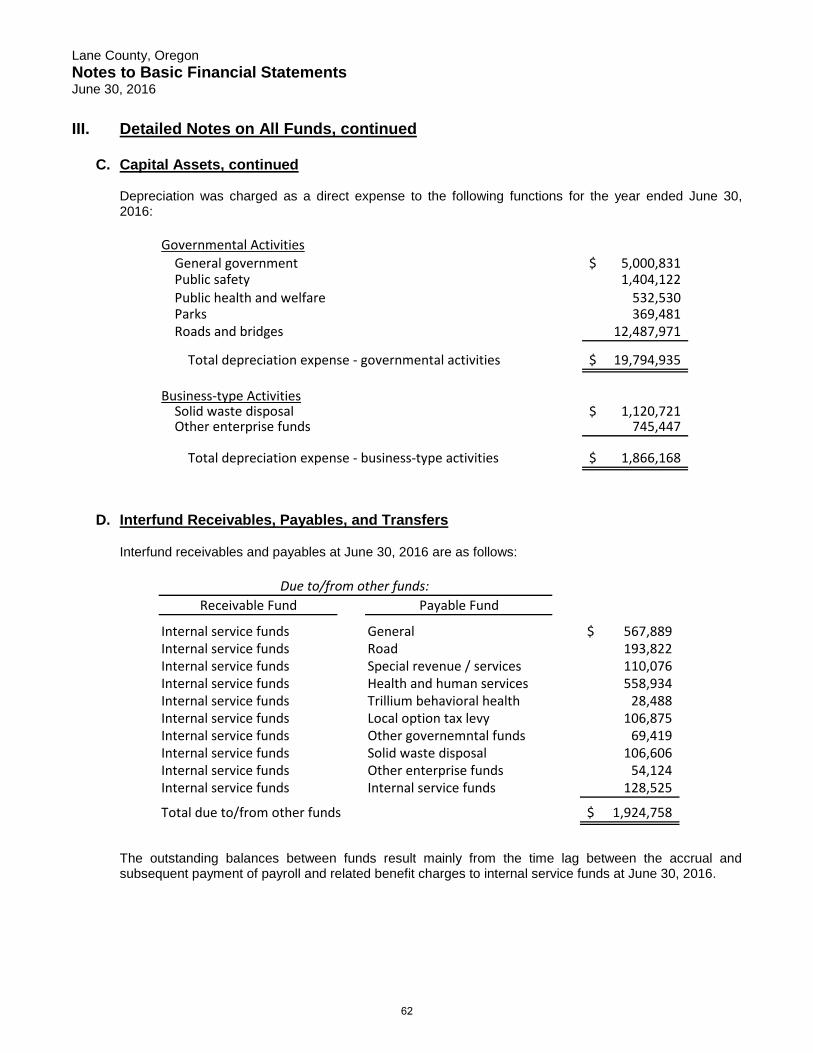
Lane County, Oregon Notes to Basic Financial Statements June 30, 2016
III. Detailed Notes on All Funds, continued
C. Capital Assets, continued Depreciation was charged as a direct expense to the following functions for the year ended June 30, 2016:
Governmental Activities General government 5,000,831$ Public safety 1,404,122 Public health and welfare 532,530 Parks 369,481 Roads and bridges 12,487,971
Total depreciation expense - governmental activities 19,794,935$
Business-type Activities Solid waste disposal 1,120,721$ Other enterprise funds 745,447
Total depreciation expense - business-type activities 1,866,168$
D. Interfund Receivables, Payables, and Transfers
Interfund receivables and payables at June 30, 2016 are as follows:
Receivable Fund Payable Fund
Internal service funds General 567,889$ Internal service funds Road 193,822 Internal service funds Special revenue / services 110,076 Internal service funds Health and human services 558,934 Internal service funds Trillium behavioral health 28,488 Internal service funds Local option tax levy 106,875 Internal service funds Other governemntal funds 69,419 Internal service funds Solid waste disposal 106,606 Internal service funds Other enterprise funds 54,124 Internal service funds Internal service funds 128,525
Total due to/from other funds 1,924,758$
Due to/from other funds:
The outstanding balances between funds result mainly from the time lag between the accrual and subsequent payment of payroll and related benefit charges to internal service funds at June 30, 2016.
62

Lane County, Oregon Notes to Basic Financial Statements June 30, 2016
III. Detailed Notes on All Funds, continued
D. Interfund Receivables, Payables, and Transfers, continued
Interfund loans receivable/payable: Receivable Fund Payable Fund Solid Waste Disposal Other governmental funds $ 20,000 $ 20,000
Advances to/from other funds:
• There were no new inter-fund loans either granted or received in FY16.
• The Solid Waste Disposal enterprise fund loaned $60,000 to the Parks and Open Spaces special
revenue fund for the construction of a restroom and laundry facility at the Armitage Park Campground. The loan is a three-year capital loan and is being repaid in three annual installments of $20,000 plus interest. The last payment will be made no later than June 30, 2017.
Interfund transfers are defined as the flow of assets, such as cash or goods and services, without equivalent flows of assets in return. Interfund transfers for the year ended June 30, 2016 are as follows:
Fund General Road
Special Revenue / Services
Heath and Human
Services General $ 14,470 $ - $ 1,112,971 $ 8,907,510 Road - - - - Special revenue/services 157,377 - 976,544 154,000 Health and human services - - - - Trillium Behavioral Health - - - 323,158 Other governmental funds 378,597 - 90,248 353,888 Other enterprise funds - - - - Interal service funds 443,652 1,392,465 - - Total transfers in $ 994,096 $ 1,392,465 $ 2,179,763 $ 9,738,556
Fund (continued)
Other Governmental
Funds
Other Enterprise
Funds Internal
Service Funds Total General $ 4,256,181 $ - $ - $ 14,291,132 Road 5,272,363 - - 5,272,363 Special revenue/services - 42,596 - 1,330,517 Health and human services 899,500 - - 899,500 Trillium Behavioral Health - - - 323,158 Other governmental funds - - - 2,024,218 Other enterprise funds 722,518 478,967 - 108,713 Interal service funds 108,713 - 650,000 2,486,117 Total transfers in $ 11,259,275 $ 521,563 $ 650,000 $ 26,735,718
63
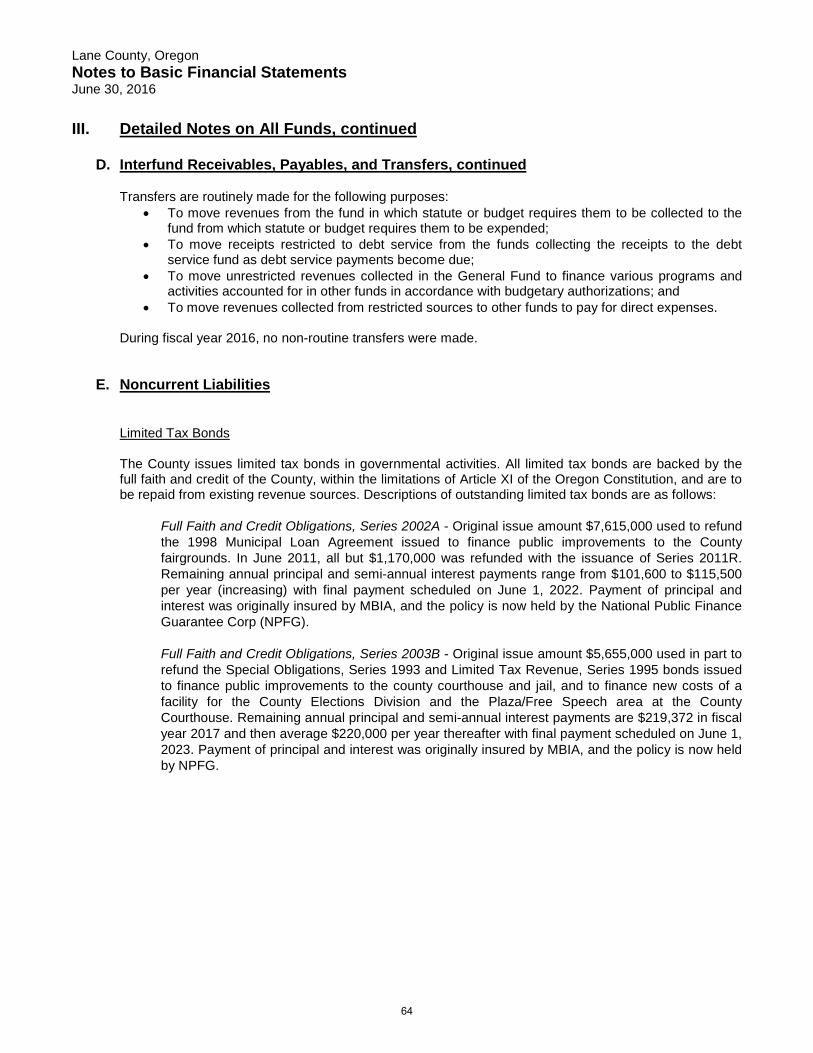
Lane County, Oregon Notes to Basic Financial Statements June 30, 2016
III. Detailed Notes on All Funds, continued
D. Interfund Receivables, Payables, and Transfers, continued
Transfers are routinely made for the following purposes: • To move revenues from the fund in which statute or budget requires them to be collected to the
fund from which statute or budget requires them to be expended; • To move receipts restricted to debt service from the funds collecting the receipts to the debt
service fund as debt service payments become due; • To move unrestricted revenues collected in the General Fund to finance various programs and
activities accounted for in other funds in accordance with budgetary authorizations; and • To move revenues collected from restricted sources to other funds to pay for direct expenses.
During fiscal year 2016, no non-routine transfers were made.
E. Noncurrent Liabilities
Limited Tax Bonds
The County issues limited tax bonds in governmental activities. All limited tax bonds are backed by the full faith and credit of the County, within the limitations of Article XI of the Oregon Constitution, and are to be repaid from existing revenue sources. Descriptions of outstanding limited tax bonds are as follows:
Full Faith and Credit Obligations, Series 2002A - Original issue amount $7,615,000 used to refund the 1998 Municipal Loan Agreement issued to finance public improvements to the County fairgrounds. In June 2011, all but $1,170,000 was refunded with the issuance of Series 2011R. Remaining annual principal and semi-annual interest payments range from $101,600 to $115,500 per year (increasing) with final payment scheduled on June 1, 2022. Payment of principal and interest was originally insured by MBIA, and the policy is now held by the National Public Finance Guarantee Corp (NPFG). Full Faith and Credit Obligations, Series 2003B - Original issue amount $5,655,000 used in part to refund the Special Obligations, Series 1993 and Limited Tax Revenue, Series 1995 bonds issued to finance public improvements to the county courthouse and jail, and to finance new costs of a facility for the County Elections Division and the Plaza/Free Speech area at the County Courthouse. Remaining annual principal and semi-annual interest payments are $219,372 in fiscal year 2017 and then average $220,000 per year thereafter with final payment scheduled on June 1, 2023. Payment of principal and interest was originally insured by MBIA, and the policy is now held by NPFG.
64
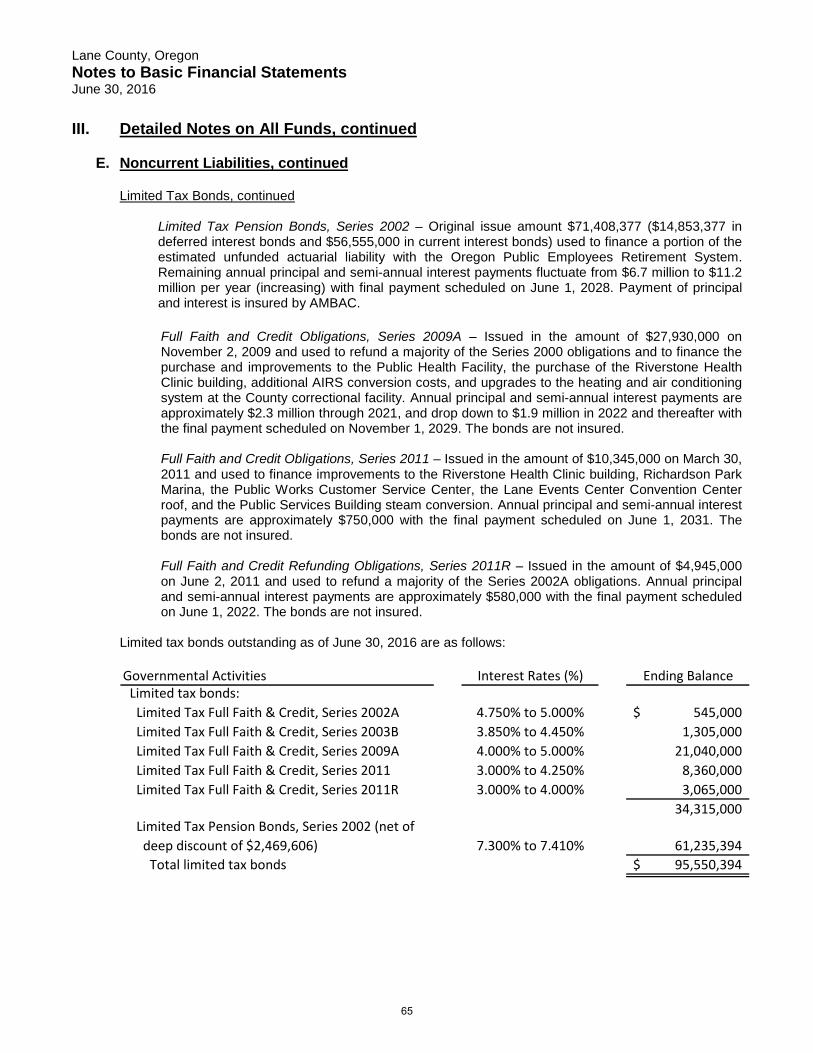
Lane County, Oregon Notes to Basic Financial Statements June 30, 2016
III. Detailed Notes on All Funds, continued E. Noncurrent Liabilities, continued
Limited Tax Bonds, continued
Limited Tax Pension Bonds, Series 2002 – Original issue amount $71,408,377 ($14,853,377 in deferred interest bonds and $56,555,000 in current interest bonds) used to finance a portion of the estimated unfunded actuarial liability with the Oregon Public Employees Retirement System. Remaining annual principal and semi-annual interest payments fluctuate from $6.7 million to $11.2 million per year (increasing) with final payment scheduled on June 1, 2028. Payment of principal and interest is insured by AMBAC.
Full Faith and Credit Obligations, Series 2009A – Issued in the amount of $27,930,000 on November 2, 2009 and used to refund a majority of the Series 2000 obligations and to finance the purchase and improvements to the Public Health Facility, the purchase of the Riverstone Health Clinic building, additional AIRS conversion costs, and upgrades to the heating and air conditioning system at the County correctional facility. Annual principal and semi-annual interest payments are approximately $2.3 million through 2021, and drop down to $1.9 million in 2022 and thereafter with the final payment scheduled on November 1, 2029. The bonds are not insured. Full Faith and Credit Obligations, Series 2011 – Issued in the amount of $10,345,000 on March 30, 2011 and used to finance improvements to the Riverstone Health Clinic building, Richardson Park Marina, the Public Works Customer Service Center, the Lane Events Center Convention Center roof, and the Public Services Building steam conversion. Annual principal and semi-annual interest payments are approximately $750,000 with the final payment scheduled on June 1, 2031. The bonds are not insured. Full Faith and Credit Refunding Obligations, Series 2011R – Issued in the amount of $4,945,000 on June 2, 2011 and used to refund a majority of the Series 2002A obligations. Annual principal and semi-annual interest payments are approximately $580,000 with the final payment scheduled on June 1, 2022. The bonds are not insured.
Limited tax bonds outstanding as of June 30, 2016 are as follows: Governmental Activities Interest Rates (%) Ending Balance Limited tax bonds: Limited Tax Full Faith & Credit, Series 2002A 4.750% to 5.000% 545,000$ Limited Tax Full Faith & Credit, Series 2003B 3.850% to 4.450% 1,305,000 Limited Tax Full Faith & Credit, Series 2009A 4.000% to 5.000% 21,040,000 Limited Tax Full Faith & Credit, Series 2011 3.000% to 4.250% 8,360,000 Limited Tax Full Faith & Credit, Series 2011R 3.000% to 4.000% 3,065,000
34,315,000 Limited Tax Pension Bonds, Series 2002 (net of deep discount of $2,469,606) 7.300% to 7.410% 61,235,394 Total limited tax bonds 95,550,394$
65
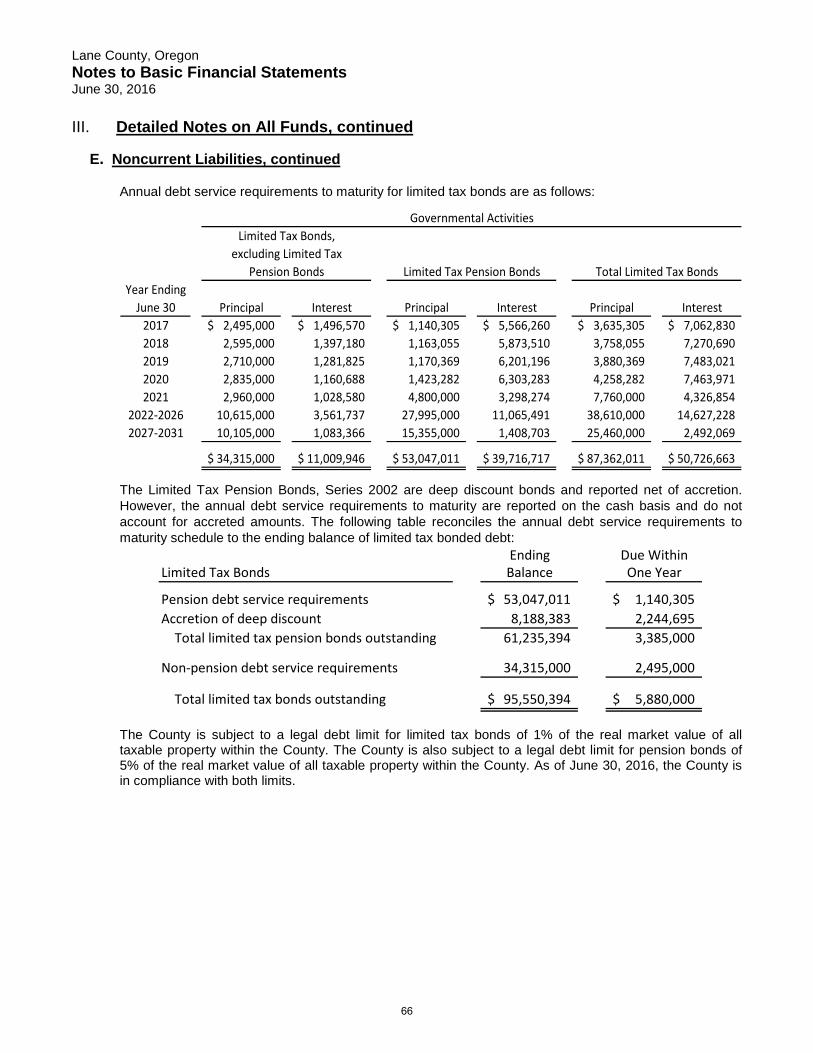
Lane County, Oregon Notes to Basic Financial Statements June 30, 2016
III. Detailed Notes on All Funds, continued E. Noncurrent Liabilities, continued
Annual debt service requirements to maturity for limited tax bonds are as follows:
Year EndingJune 30 Principal Interest Principal Interest Principal Interest
2017 2,495,000$ 1,496,570$ 1,140,305$ 5,566,260$ 3,635,305$ 7,062,830$ 2018 2,595,000 1,397,180 1,163,055 5,873,510 3,758,055 7,270,690 2019 2,710,000 1,281,825 1,170,369 6,201,196 3,880,369 7,483,021 2020 2,835,000 1,160,688 1,423,282 6,303,283 4,258,282 7,463,971 2021 2,960,000 1,028,580 4,800,000 3,298,274 7,760,000 4,326,854
2022-2026 10,615,000 3,561,737 27,995,000 11,065,491 38,610,000 14,627,228 2027-2031 10,105,000 1,083,366 15,355,000 1,408,703 25,460,000 2,492,069
34,315,000$ 11,009,946$ 53,047,011$ 39,716,717$ 87,362,011$ 50,726,663$
Limited Tax Bonds,excluding Limited Tax
Pension Bonds
Governmental Activities
Limited Tax Pension Bonds Total Limited Tax Bonds
The Limited Tax Pension Bonds, Series 2002 are deep discount bonds and reported net of accretion. However, the annual debt service requirements to maturity are reported on the cash basis and do not account for accreted amounts. The following table reconciles the annual debt service requirements to maturity schedule to the ending balance of limited tax bonded debt:
Ending Due WithinLimited Tax Bonds Balance One Year
Pension debt service requirements 53,047,011$ 1,140,305$ Accretion of deep discount 8,188,383 2,244,695 Total limited tax pension bonds outstanding 61,235,394 3,385,000
Non-pension debt service requirements 34,315,000 2,495,000
Total limited tax bonds outstanding 95,550,394$ 5,880,000$
The County is subject to a legal debt limit for limited tax bonds of 1% of the real market value of all taxable property within the County. The County is also subject to a legal debt limit for pension bonds of 5% of the real market value of all taxable property within the County. As of June 30, 2016, the County is in compliance with both limits.
66

Lane County, Oregon Notes to Basic Financial Statements June 30, 2016
III. Detailed Notes on All Funds, continued E. Noncurrent Liabilities, continued
Notes Payable The County issues notes to finance major construction projects in governmental activities. Descriptions of outstanding notes payable are as follows:
Oregon Department of Energy’s Small Scale Local Energy Loan Program – Original issue amount of $2,080,000 to finance machinery, equipment, and improvements to the regional computer data center that will provide energy savings to the County. The note terms required the County to transfer its Qualified Energy Conservation Bond (QECB) authority ($2,041,695) to the State which the Oregon Department Energy used to finance the notes. Although the QECB’s are not issued in the County’s name, the County is responsible to apply for the interest subsidy with the Internal Revenue Service. Annual principal and semi-annual interest payments are approximately $200,000 per year with final payment scheduled on October 1, 2029. Notes payable are backed by the full faith and credit of the County and are to be repaid from existing revenue sources. In fiscal year 2016, the County made one principal payment of $120,000 and two interest payments on the loan in the amount of $80,972.50 and received interest subsidy in the amount of $47,593.31. Application for interest subsidy for fiscal year 2017 has been made with the Internal Revenue Service.
Notes payable outstanding as of June 30, 2016 is as follows:
Governmental Activities Interest Rates (%) Ending Balance Notes payable: Oregon Department of Revenue 1.650% to 5.150% 1,960,000$
Annual debt service requirements to maturity for notes payable are as follows:
Year EndingJune 30 Principal Interest
2017 120,000$ 78,783$ 2018 120,000 76,083 2019 120,000 72,873 2020 125,000 69,131 2021 125,000 64,913
2022-2026 700,000 243,075 2027-2031 650,000 67,113
1,960,000$ 671,971$
Governmental Activities
Rebatable Arbitrage
Arbitrage reviews are performed annually on all County tax-exempt bonds and obligations, and rebates of interest earned on arbitrage are made as required by the federal tax code. Liabilities are reported in the government-wide and proprietary fund financial statements when incurred, but liabilities are not reported in the governmental fund financial statements until due and payable. As of June 30, 2016, there were no rebatable arbitrage liabilities to report.
67

Lane County, Oregon Notes to Basic Financial Statements June 30, 2016
III. Detailed Notes on All Funds, continued E. Noncurrent Liabilities, continued
Landfill Closure and Postclosure Care Cost
The County operates the Short Mountain Landfill under a Solid Waste Disposal Permit (No. 290) from the Oregon Department of Environment Quality (DEQ). The current permit was issued on August 5, 2011 and will expire on June 30, 2021. State and federal laws and regulations require the County to place a final cover on its landfill when it stops accepting waste and to perform certain maintenance and monitoring functions at the site for 30 years after closure. Although final closure and postclosure care costs will be paid only near or after the date that the landfill stops accepting waste, the County reports a portion of these final closure and postclosure care costs as an operating expense in each period based on landfill capacity used as of each balance sheet date. The $4,670,498 reported as the landfill closure and postclosure care liability at June 30, 2016 represents current cost estimates based on the use of 21.3% of the estimated capacity of the landfill. The County will recognize the remaining estimated cost of final closure and post-closure care of $17,219,945 as the remaining estimated capacity is filled. Cost estimates are based on what it would cost to perform all final closure and post-closure care in 2016. Actual costs may be different due to inflation, deflation, changes in technology, or changes in regulations. The County expects to close the landfill in approximately 71 years, or the year 2087. Site Development Plan: In July 2006, the County updated its Site Development Plan (SDP). The plan was reviewed and approved by the ODEQ in July 2007. The ultimate footprint at full build-out is 219 acres. Financial Assurance: Each year the County demonstrates financial assurance in connection with the closure and postclosure care activities for the Short Mountain Landfill by using the local government financial assurance test described in Title 40 of the Code of Federal Regulations, paragraph 258.74. As of June 30, 2015 (the most recent analysis), the County is in compliance with the local government financial assurance test as required by Oregon Administrative Rule 340-94-0140. Internal Service Fund Debt
Based on an analysis of billings, governmental activities have been determined to be the predominant source of revenue for all internal service funds. Therefore, long-term debt in governmental activities includes those in internal service funds. As of June 30, 2016, internal service fund debt includes the Limited Tax Pension Bonds of $61,235,394, less deferred bond discounts of $78,965.
68
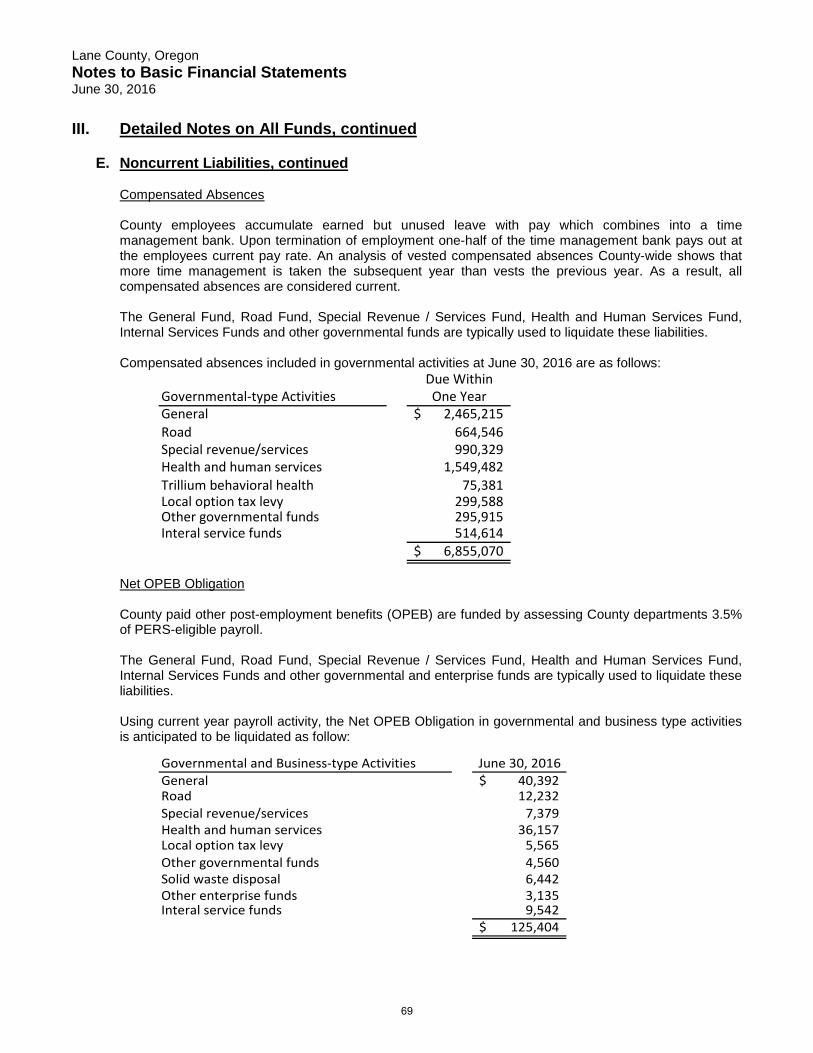
Lane County, Oregon Notes to Basic Financial Statements June 30, 2016
III. Detailed Notes on All Funds, continued E. Noncurrent Liabilities, continued
Compensated Absences
County employees accumulate earned but unused leave with pay which combines into a time management bank. Upon termination of employment one-half of the time management bank pays out at the employees current pay rate. An analysis of vested compensated absences County-wide shows that more time management is taken the subsequent year than vests the previous year. As a result, all compensated absences are considered current. The General Fund, Road Fund, Special Revenue / Services Fund, Health and Human Services Fund, Internal Services Funds and other governmental funds are typically used to liquidate these liabilities. Compensated absences included in governmental activities at June 30, 2016 are as follows:
Due WithinGovernmental-type Activities One YearGeneral 2,465,215$ Road 664,546 Special revenue/services 990,329 Health and human services 1,549,482 Trillium behavioral health 75,381 Local option tax levy 299,588 Other governmental funds 295,915 Interal service funds 514,614
6,855,070$
Net OPEB Obligation
County paid other post-employment benefits (OPEB) are funded by assessing County departments 3.5% of PERS-eligible payroll. The General Fund, Road Fund, Special Revenue / Services Fund, Health and Human Services Fund, Internal Services Funds and other governmental and enterprise funds are typically used to liquidate these liabilities. Using current year payroll activity, the Net OPEB Obligation in governmental and business type activities is anticipated to be liquidated as follow:
Governmental and Business-type Activities June 30, 2016General 40,392$ Road 12,232 Special revenue/services 7,379 Health and human services 36,157 Local option tax levy 5,565 Other governmental funds 4,560 Solid waste disposal 6,442 Other enterprise funds 3,135 Interal service funds 9,542
125,404$
69
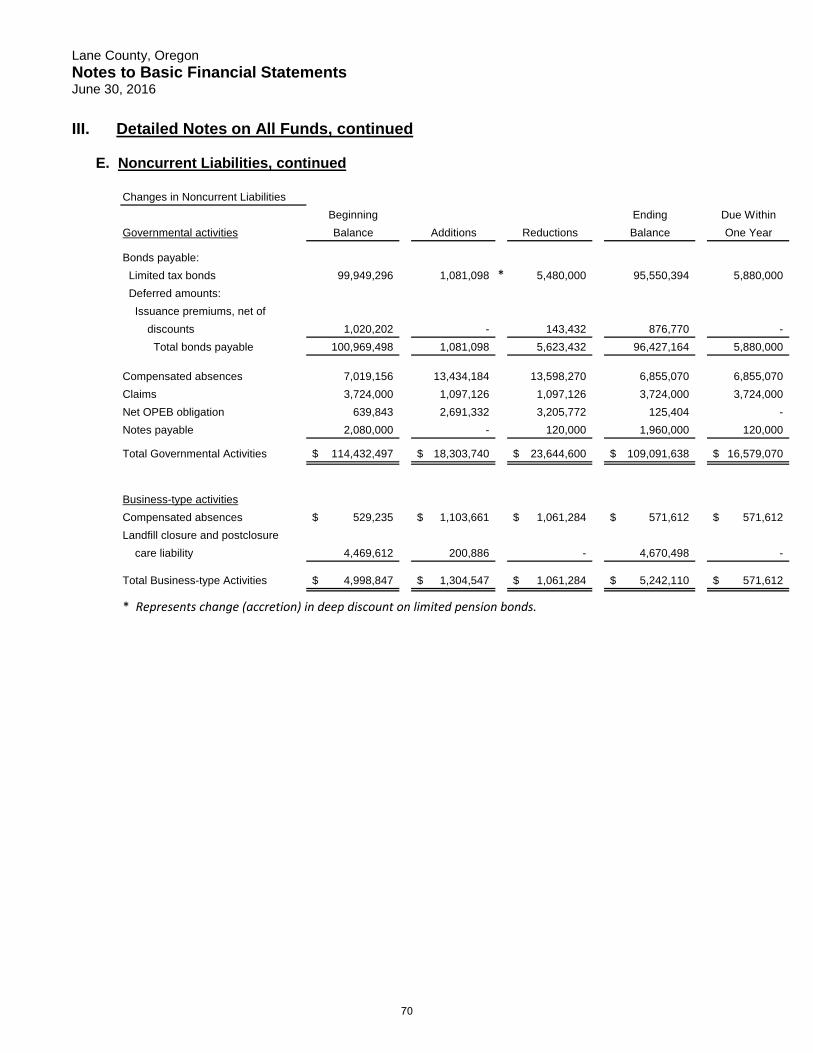
Lane County, Oregon Notes to Basic Financial Statements June 30, 2016
III. Detailed Notes on All Funds, continued E. Noncurrent Liabilities, continued
Changes in Noncurrent Liabilities
Beginning Ending Due WithinGovernmental activities Balance Additions Reductions Balance One Year
Bonds payable: Limited tax bonds 99,949,296 1,081,098 * 5,480,000 95,550,394 5,880,000 Deferred amounts: Issuance premiums, net of discounts 1,020,202 - 143,432 876,770 - Total bonds payable 100,969,498 1,081,098 5,623,432 96,427,164 5,880,000
Compensated absences 7,019,156 13,434,184 13,598,270 6,855,070 6,855,070 Claims 3,724,000 1,097,126 1,097,126 3,724,000 3,724,000 Net OPEB obligation 639,843 2,691,332 3,205,772 125,404 - Notes payable 2,080,000 - 120,000 1,960,000 120,000
Total Governmental Activities 114,432,497$ 18,303,740$ 23,644,600$ 109,091,638$ 16,579,070$
Business-type activitiesCompensated absences 529,235$ 1,103,661$ 1,061,284$ 571,612$ 571,612$ Landfill closure and postclosure care liability 4,469,612 200,886 - 4,670,498 -
Total Business-type Activities 4,998,847$ 1,304,547$ 1,061,284$ 5,242,110$ 571,612$
* Represents change (accretion) in deep discount on limited pension bonds.
70
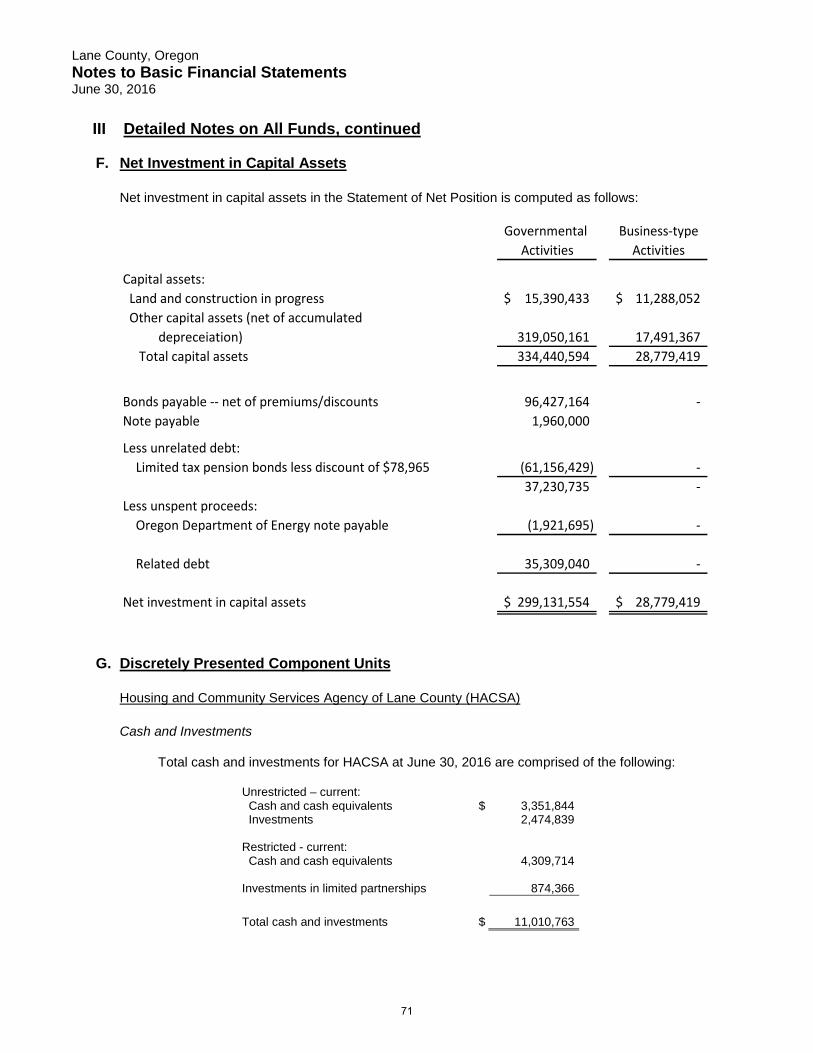
Lane County, Oregon Notes to Basic Financial Statements June 30, 2016
III Detailed Notes on All Funds, continued F. Net Investment in Capital Assets
Net investment in capital assets in the Statement of Net Position is computed as follows:
Governmental Business-typeActivities Activities
Capital assets: Land and construction in progress 15,390,433$ 11,288,052$ Other capital assets (net of accumulated depreceiation) 319,050,161 17,491,367 Total capital assets 334,440,594 28,779,419
Bonds payable -- net of premiums/discounts 96,427,164 - Note payable 1,960,000
Less unrelated debt: Limited tax pension bonds less discount of $78,965 (61,156,429) -
37,230,735 - Less unspent proceeds: Oregon Department of Energy note payable (1,921,695) -
Related debt 35,309,040 -
Net investment in capital assets 299,131,554$ 28,779,419$
G. Discretely Presented Component Units
Housing and Community Services Agency of Lane County (HACSA)
Cash and Investments
Total cash and investments for HACSA at June 30, 2016 are comprised of the following:
Unrestricted – current: Cash and cash equivalents $ 3,351,844 Investments 2,474,839 Restricted - current: Cash and cash equivalents 4,309,714 Investments in limited partnerships 874,366 Total cash and investments $ 11,010,763
71
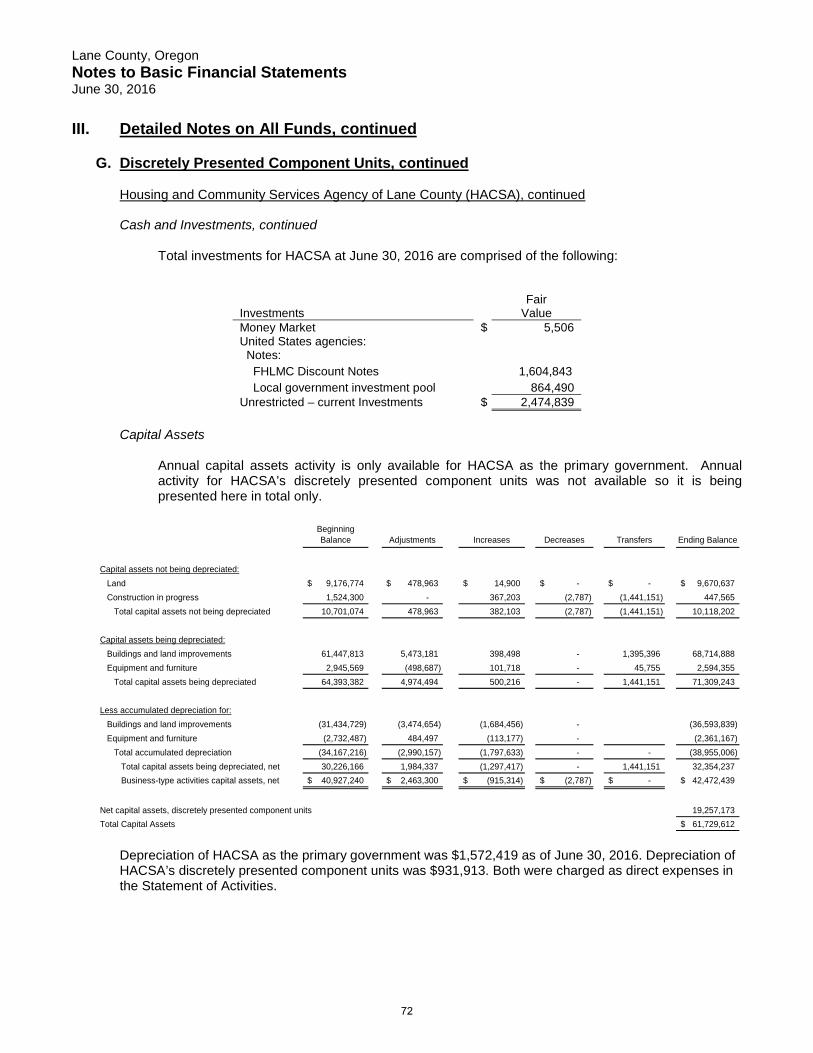
Lane County, Oregon Notes to Basic Financial Statements June 30, 2016
III. Detailed Notes on All Funds, continued G. Discretely Presented Component Units, continued
Housing and Community Services Agency of Lane County (HACSA), continued Cash and Investments, continued
Total investments for HACSA at June 30, 2016 are comprised of the following:
Investments
Fair Value
Money Market United States agencies:
$ 5,506
Notes: FHLMC Discount Notes 1,604,843 Local government investment pool 864,490 Unrestricted – current Investments $ 2,474,839
Capital Assets
Annual capital assets activity is only available for HACSA as the primary government. Annual activity for HACSA’s discretely presented component units was not available so it is being presented here in total only.
Beginning Balance Adjustments Increases Decreases Transfers Ending Balance
Capital assets not being depreciated:
Land 9,176,774$ 478,963$ 14,900$ -$ -$ 9,670,637$ Construction in progress 1,524,300 - 367,203 (2,787) (1,441,151) 447,565
Total capital assets not being depreciated 10,701,074 478,963 382,103 (2,787) (1,441,151) 10,118,202
Capital assets being depreciated:Buildings and land improvements 61,447,813 5,473,181 398,498 - 1,395,396 68,714,888 Equipment and furniture 2,945,569 (498,687) 101,718 - 45,755 2,594,355
Total capital assets being depreciated 64,393,382 4,974,494 500,216 - 1,441,151 71,309,243
Less accumulated depreciation for:Buildings and land improvements (31,434,729) (3,474,654) (1,684,456) - (36,593,839) Equipment and furniture (2,732,487) 484,497 (113,177) - (2,361,167)
Total accumulated depreciation (34,167,216) (2,990,157) (1,797,633) - - (38,955,006) Total capital assets being depreciated, net 30,226,166 1,984,337 (1,297,417) - 1,441,151 32,354,237 Business-type activities capital assets, net 40,927,240$ 2,463,300$ (915,314)$ (2,787)$ -$ 42,472,439$
Net capital assets, discretely presented component units 19,257,173 Total Capital Assets 61,729,612$
Depreciation of HACSA as the primary government was $1,572,419 as of June 30, 2016. Depreciation of HACSA’s discretely presented component units was $931,913. Both were charged as direct expenses in the Statement of Activities.
72
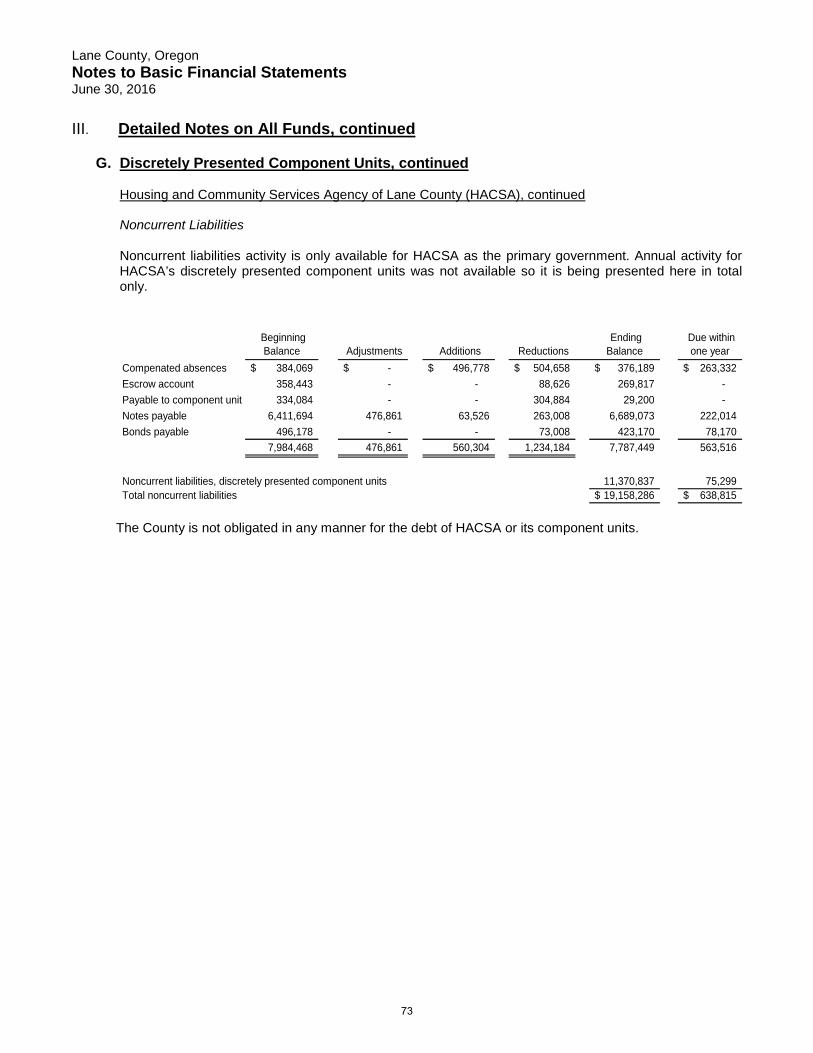
Lane County, Oregon Notes to Basic Financial Statements June 30, 2016
III. Detailed Notes on All Funds, continued G. Discretely Presented Component Units, continued
Housing and Community Services Agency of Lane County (HACSA), continued Noncurrent Liabilities
Noncurrent liabilities activity is only available for HACSA as the primary government. Annual activity for HACSA’s discretely presented component units was not available so it is being presented here in total only.
Beginning Balance Adjustments Additions Reductions
Ending Balance
Due within one year
Compenated absences 384,069$ -$ 496,778$ 504,658$ 376,189$ 263,332$ Escrow account 358,443 - - 88,626 269,817 - Payable to component unit 334,084 - - 304,884 29,200 - Notes payable 6,411,694 476,861 63,526 263,008 6,689,073 222,014 Bonds payable 496,178 - - 73,008 423,170 78,170
7,984,468 476,861 560,304 1,234,184 7,787,449 563,516
Noncurrent liabilities, discretely presented component units 11,370,837 75,299 Total noncurrent liabilities 19,158,286$ 638,815$
The County is not obligated in any manner for the debt of HACSA or its component units.
73

Lane County, Oregon Notes to Basic Financial Statements June 30, 2016
III. Detailed Notes on All funds, continued
H. Fund Balances Fund balances by specific purpose for the year ended June 30, 2016 were as follows:
Fund balances: General RoadSpecial Revenue &
ServicesHealth and Human
ServicesNonspendable: Inventories 201,911$ 1,829,970$ -$ 189,132$ Restricted: Capital Projects - - - - Debt Service - - - - General government - - 4,385,505 - Public Safety - - - - Public Safety - - - - Public health & welfare - - - - Roads and bridges - 9,442,247 264,188 - Community development - - - - Committed: Capital Projects - - - - Assigned: Capital Projects - - - - Debt Service - - - - General government - - 2,468,733 - Public Safety - - 3,363,291 - Public health & welfare - - - 16,059,625 Parks - - - - Roads and bridges - 17,639,528 543,406 - Community development - - - - Unassigned 15,250,097 - - - Total fund balances 15,452,008$ 28,911,745$ 11,025,123$ 16,248,757$
Fund balances, continued:Trillium Behavior
HealthLocal Option Tax
LevyOther Governmental
FundsTotal Governmental
FundsNonspendable: Inventories -$ -$ -$ 2,221,013$ Restricted: Capital Projects - - - - Debt Service - - 3,517,445 3,517,445 General government - - 4,212,449 8,597,954 Public Safety - - - -
Public Safety - 25,657,365 - 25,657,365 Public health & welfare 21,214,163 - - 21,214,163 Roads and bridges - - 687,801 10,394,236 Community development - - - - Committed: Capital Projects - - 965,653 965,653 Assigned: Capital Projects - - 6,222,923 6,222,923 Debt Service - - 3,414,500 3,414,500 General government - - 922 2,469,655 Public Safety - - 78,482 3,441,773 Public health & welfare - - 1,128,366 17,187,991 Parks - - 615,223 615,223 Roads and bridges - - - 18,182,934 Community development - - - - Unassigned - - - 15,250,097 Total fund balances 21,214,163$ 25,657,365$ 20,843,764$ 139,352,925$
74
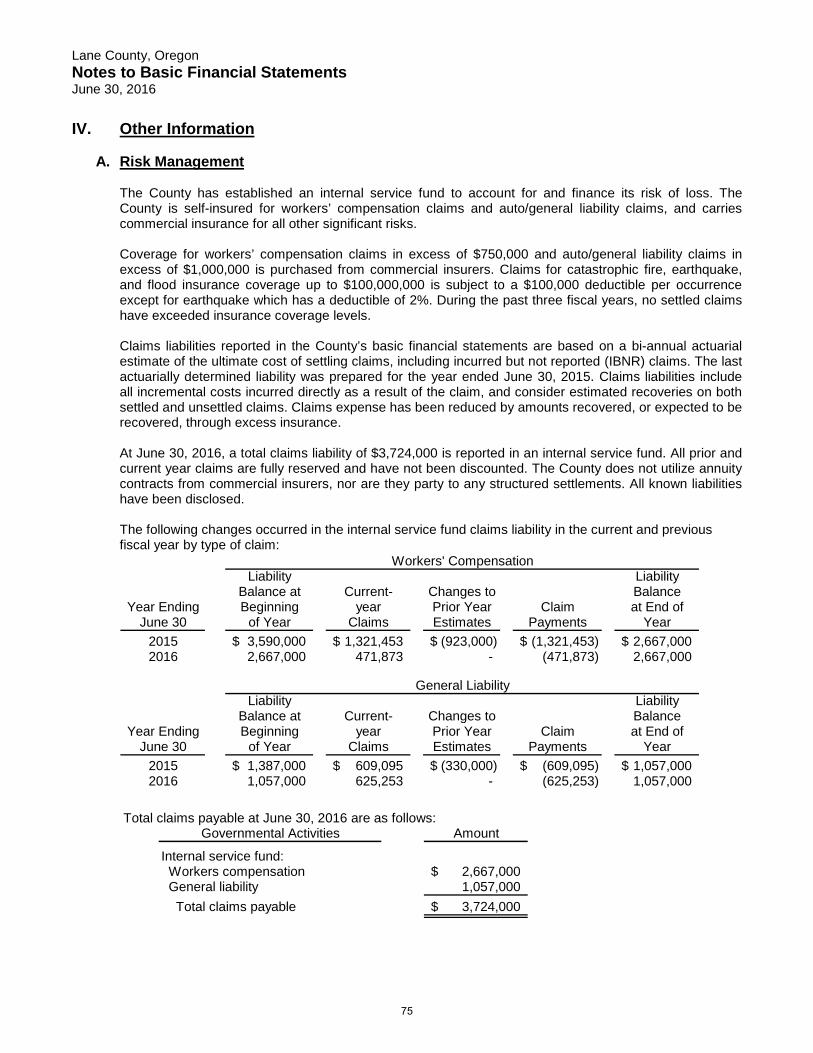
Lane County, Oregon Notes to Basic Financial Statements June 30, 2016
IV. Other Information
A. Risk Management
The County has established an internal service fund to account for and finance its risk of loss. The County is self-insured for workers’ compensation claims and auto/general liability claims, and carries commercial insurance for all other significant risks.
Coverage for workers’ compensation claims in excess of $750,000 and auto/general liability claims in excess of $1,000,000 is purchased from commercial insurers. Claims for catastrophic fire, earthquake, and flood insurance coverage up to $100,000,000 is subject to a $100,000 deductible per occurrence except for earthquake which has a deductible of 2%. During the past three fiscal years, no settled claims have exceeded insurance coverage levels.
Claims liabilities reported in the County’s basic financial statements are based on a bi-annual actuarial estimate of the ultimate cost of settling claims, including incurred but not reported (IBNR) claims. The last actuarially determined liability was prepared for the year ended June 30, 2015. Claims liabilities include all incremental costs incurred directly as a result of the claim, and consider estimated recoveries on both settled and unsettled claims. Claims expense has been reduced by amounts recovered, or expected to be recovered, through excess insurance. At June 30, 2016, a total claims liability of $3,724,000 is reported in an internal service fund. All prior and current year claims are fully reserved and have not been discounted. The County does not utilize annuity contracts from commercial insurers, nor are they party to any structured settlements. All known liabilities have been disclosed.
The following changes occurred in the internal service fund claims liability in the current and previous fiscal year by type of claim:
Liability LiabilityBalance at Current- Changes to Balance
Year Ending Beginning year Prior Year Claim at End ofJune 30 of Year Claims Estimates Payments Year
2015 3,590,000$ 1,321,453$ (923,000)$ (1,321,453)$ 2,667,000$ 2016 2,667,000 471,873 - (471,873) 2,667,000
Liability LiabilityBalance at Current- Changes to Balance
Year Ending Beginning year Prior Year Claim at End ofJune 30 of Year Claims Estimates Payments Year
2015 1,387,000$ 609,095$ (330,000)$ (609,095)$ 1,057,000$ 2016 1,057,000 625,253 - (625,253) 1,057,000
Workers' Compensation
General Liability
Total claims payable at June 30, 2016 are as follows:
Governmental Activities Amount
Internal service fund: Workers compensation 2,667,000$ General liability 1,057,000 Total claims payable 3,724,000$
75
Lane County, Oregon Notes to Basic Financial Statements June 30, 2016
IV. Other Information, continued
A. Risk Management, continued
The County has entered into a one year agreement with PacificSource Health Plans to administer claims. An internal service fund is established to set aside the reserve and account for its risk of loss. Additionally the County purchased Stop/Loss coverage for large claims. After the initial one year term, the County decided to renew its self-funded medical plans with PacificSource, and fully insured dental plans with Moda and Willamette Dental, for the policy year beginning August 1, 2016 through July 31, 2017. The medical plans are considered non-grandfathered for purposes of the Affordable Care Act.
B. Pension Plan
Plan Description The County is a participating employer in the Oregon Public Employee Retirement System (PERS), a cost-sharing employer multiple- defined public employee pension plan, and maintains a defined contribution plan for the purpose of individual retirement savings through PERS. PERS is administered under Oregon Revised Statues Chapter 238 and Internal Revenue Service 401 (a) by the Public Employees Retirement Board (PERB). The authority to establish and amend the benefit provisions of the plan rests with the Oregon Legislature. County employees are eligible to participate in PERS after six months of employment and benefits vest after completing at least 600 hours in each of five years (the years do not need to be consecutive) or at normal retirement age provided the employee is an active member at the time. PERS, a component unit of the State of Oregon, issues an independently audited comprehensive annual financial report, which may be obtained by writing to Oregon Public Employees Retirement System, P.O. Box 23700, Tigard, Oregon 97281, by calling (503) 598-7377, or by accessing the PERS web site at http://www.oregon.gov/PERS/. Plan Benefits
All benefits of PERS are established by the legislature pursuant to ORS Chapters 238 and 238A.
Tier One/Tier Two Retirement Benefit (Chapter 238). Tier One/Tier Two Retirement Benefit plan is closed to new members hired on or after August 29, 2003. Chapter 238 plan provides pension, disability, and death benefits.
• Pension Benefits. The retirement benefits may be selected from 13 options including survivorship benefits and lump-sum refunds. The basic benefit is based on years of service and final average salary. A percentage (2.0 percent for police and fire employees, 1.67 percent for general service employees) is multiplied by the number of years of service and the final average salary. A member is considered vested and will be eligible at minimum retirement age for a service retirement allowance if he or she has had a contribution in each of five calendar years or has reached at least 50 years of age (age 45 for police and fire employees) before ceasing employment with a participating employer. General service employees may retire after reaching age 55 (age 50 for police and fire employees). Tier One general service employee benefits are reduced if retirement occurs prior to age 58 with fewer than 30 years of service. Police and fire member benefits are reduced if retirement occurs prior to age 55 with fewer than 25 years of service. Tier two members are eligible for full benefits at age 60.
• Death Benefits. Upon the death of a non-retired member, the beneficiary receives a lump-sum refund of the member’s account balance (accumulated contributions and interest). In addition, the beneficiary will receive a lump-sum payment from employer funds equal to the account balance, provided the member was employed by a PERS employer at the time of death or certain other conditions are met.
76

Lane County, Oregon Notes to Basic Financial Statements June 30, 2016
IV. Other Information, continued
B. Pension Plan, continued
• Disability Benefits. A member with 10 or more years of creditable service who becomes disabled from other than duty-connected causes may receive a non-duty disability benefit. A disability resulting from a job-incurred injury or illness qualifies a member for disability benefits regardless of the length of PERS-covered service. Upon qualifying for either a non-duty or duty disability, service time is computed to age 58 (55 for police and fire employees) when determining the monthly benefit.
• Benefit Changes After Retirement. Members may choose to continue participation in a variable equities investment account after retiring and may experience annual benefit fluctuations due to changes in the market value of equity investments. Under ORS 238.360, monthly benefits are adjusted annually through cost-of-living changes.
OPSRP Pension Program (ORS Chapter 238A) provides pension, death, and disability benefits to members hired on or after August 29, 2003.
• Pension Benefits. This portion of OPSRP provides a life pension funded by employer contributions. Benefits are calculated with the following formula for members who attain normal retirement age:
o Police and fire: 1.8 percent multiplied by the number of years of service and the final average salary. Normal retirement age is 60, or age 53 with 25 years retirement credit. To be classified as a police or fire member, the individual must have been employed continuously as a police and fire member for at least five years immediately preceding retirement.
o General service: 1.5 percent is multiplied by the number of years of service and the final average salary. Normal retirement age for general service members is age 65, or age 58 with 30 years of retirement credit.
o A member of the OPSRP Pension Program becomes vested on the earliest of the following dates: the date the member completes 600 hours of service in each of five calendar years, the date the member reaches normal retirement age, and, if the pension program is terminated, the date on which termination becomes effective.
• Death Benefits. Upon the death of a non-retired member, the spouse, or other person who is constitutionally required to be treated in the same manner as the spouse, receives for life 50 percent of the pension that should otherwise have been paid to the deceased member.
• Disability Benefits. A member who has accrued 10 or more years of retirement credits before the member becomes disabled or a member who becomes disabled due to job-related injury shall receive a disability benefit of 45 percent of the member’s salary determined as to the last full month of employment before the disability occurred.
• Benefit Changes After Retirement. Under ORS 238A.210, monthly benefits are adjusted annually though cost-of-living changes.
77
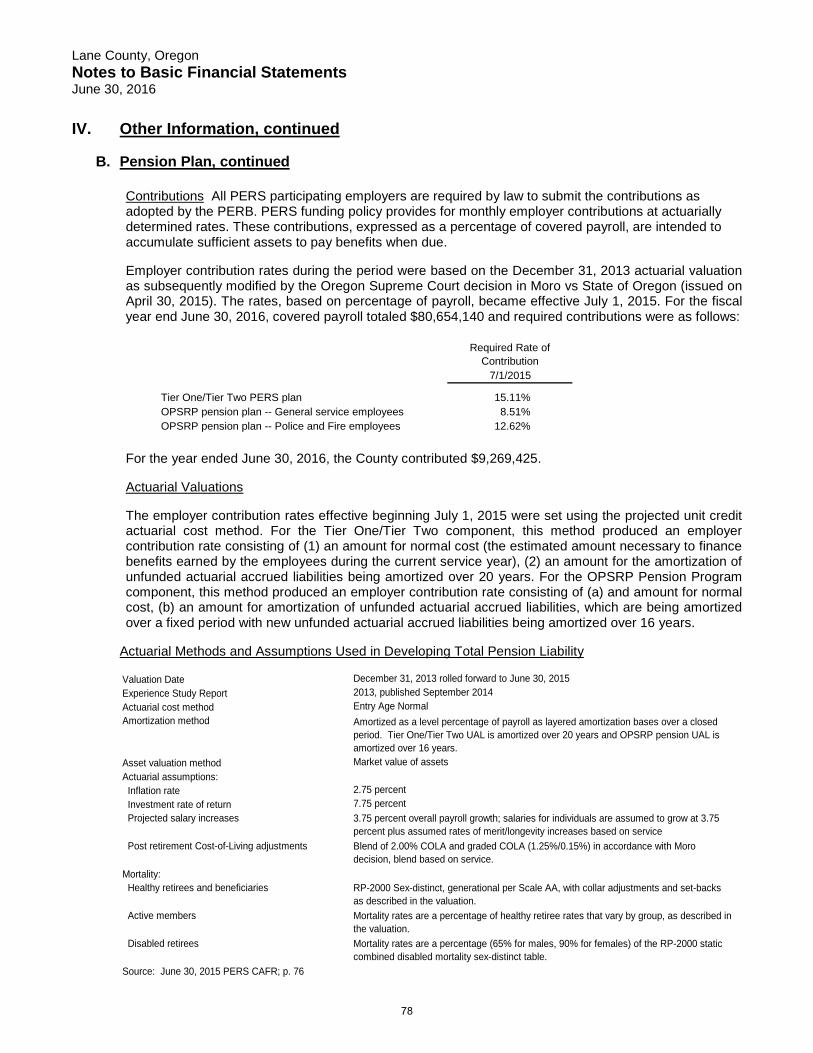
Lane County, Oregon Notes to Basic Financial Statements June 30, 2016
IV. Other Information, continued
B. Pension Plan, continued
Contributions All PERS participating employers are required by law to submit the contributions as adopted by the PERB. PERS funding policy provides for monthly employer contributions at actuarially determined rates. These contributions, expressed as a percentage of covered payroll, are intended to accumulate sufficient assets to pay benefits when due.
Employer contribution rates during the period were based on the December 31, 2013 actuarial valuation as subsequently modified by the Oregon Supreme Court decision in Moro vs State of Oregon (issued on April 30, 2015). The rates, based on percentage of payroll, became effective July 1, 2015. For the fiscal year end June 30, 2016, covered payroll totaled $80,654,140 and required contributions were as follows:
Tier One/Tier Two PERS plan 15.11%OPSRP pension plan -- General service employees 8.51%OPSRP pension plan -- Police and Fire employees 12.62%
Required Rate of Contribution
7/1/2015
For the year ended June 30, 2016, the County contributed $9,269,425.
Actuarial Valuations
The employer contribution rates effective beginning July 1, 2015 were set using the projected unit credit actuarial cost method. For the Tier One/Tier Two component, this method produced an employer contribution rate consisting of (1) an amount for normal cost (the estimated amount necessary to finance benefits earned by the employees during the current service year), (2) an amount for the amortization of unfunded actuarial accrued liabilities being amortized over 20 years. For the OPSRP Pension Program component, this method produced an employer contribution rate consisting of (a) and amount for normal cost, (b) an amount for amortization of unfunded actuarial accrued liabilities, which are being amortized over a fixed period with new unfunded actuarial accrued liabilities being amortized over 16 years.
Actuarial Methods and Assumptions Used in Developing Total Pension Liability
Valuation Date December 31, 2013 rolled forward to June 30, 2015Experience Study Report 2013, published September 2014Actuarial cost method Entry Age NormalAmortization method Amortized as a level percentage of payroll as layered amortization bases over a closed
period. Tier One/Tier Two UAL is amortized over 20 years and OPSRP pension UAL is amortized over 16 years.
Asset valuation method Market value of assetsActuarial assumptions: Inflation rate 2.75 percent Investment rate of return 7.75 percent Projected salary increases 3.75 percent overall payroll growth; salaries for individuals are assumed to grow at 3.75
percent plus assumed rates of merit/longevity increases based on service Post retirement Cost-of-Living adjustments Blend of 2.00% COLA and graded COLA (1.25%/0.15%) in accordance with Moro
decision, blend based on service.Mortality: Healthy retirees and beneficiaries RP-2000 Sex-distinct, generational per Scale AA, with collar adjustments and set-backs
as described in the valuation. Active members Mortality rates are a percentage of healthy retiree rates that vary by group, as described in
the valuation. Disabled retirees Mortality rates are a percentage (65% for males, 90% for females) of the RP-2000 static
combined disabled mortality sex-distinct table.Source: June 30, 2015 PERS CAFR; p. 76
78

Lane County, Oregon Notes to Basic Financial Statements June 30, 2016
IV. Other Information, continued
B. Pension Plan, continued Actuarial valuations of an ongoing plan involve estimates of the value of projected benefits and assumptions about the probability of events far into the future. Actuarially determined amounts are subject to continual revision as actual results are compared to past expectations and new estimates are made about the future. Experience studies are performed as of December 31 of even number years. The methods and assumptions shown above are based on the 2014 Experience Study which reviewed experience for the four-year period ending on December 31, 2014.
Discount Rate
As disclosed on page 57 in the June 30, 2015 PERS CAFR, the discount rate used to measure the total pension liability was 7.75 percent for the Defined Benefit Pension Plan. The projection of cash flows used to determine the discount rate assumed that contributions from plan members and those of the contributing employers are made at the contractually required rates, as actuarially determined. Based on those assumptions, the pension plan’s fiduciary net position was projected to be available to make all projected future benefit payments of current plan members. Therefore, the long-term expected rate of return on pension plan investments for the Defined Benefit Pension Plan was applied to all periods of projected benefit payments to determine the total pension liability.
In the opinion of the PERS independent actuary, the detailed depletion date projects outlined in generally accepted accounting principles would clearly indicate that the Fiduciary Net Position is always projected to be sufficient to cover benefit payments and administrative expenses. Detailed discussion of the alternative evaluation of sufficiency for Oregon PERS may be reviewed in the June 30, 2015 PERS CAFR; page 56-58.
Assumed Asset Allocation
Asset Class/Oregon Investment Council (OIC) StrategyLow
RangeHigh
RangeOIC
TargetCash 0.0% 3.0% 0.0%Debt Securities 15.0% 25.0% 20.0%Public Equity 32.5% 42.5% 37.5%Private Equity 16.0% 24.0% 20.0%Real Estate 9.5% 15.5% 12.5%Alternative Equity 0.0% 10.0% 10.0%Opportunity Portfolio 0.0% 3.0% 0.0% Total 100.0%Source: June 30, 2015 PERS CAFR; p. 76
Long-Term Expected Rate of Return
To develop an analytical basis for the selection of the long-term expected rate of return assumption, in July 2013, the PERS Board reviewed long-term assumptions developed by both Milliman’s capital market assumptions team and the Oregon Investment Council’s (OIC) investment advisors. The table below shows Milliman’s assumptions for each of the asset classes in which the plan was invested at that time based on the OIC long-term target asset allocation. The OIC’s description of each asset class was used to map the target allocation to the asset classes. Each asset class assumption is based on a consistent set of underlying assumptions, and includes adjustment for the inflation assumption. These assumptions are not based on historical returns, but instead are based on a forward-looking capital market economic model.
79
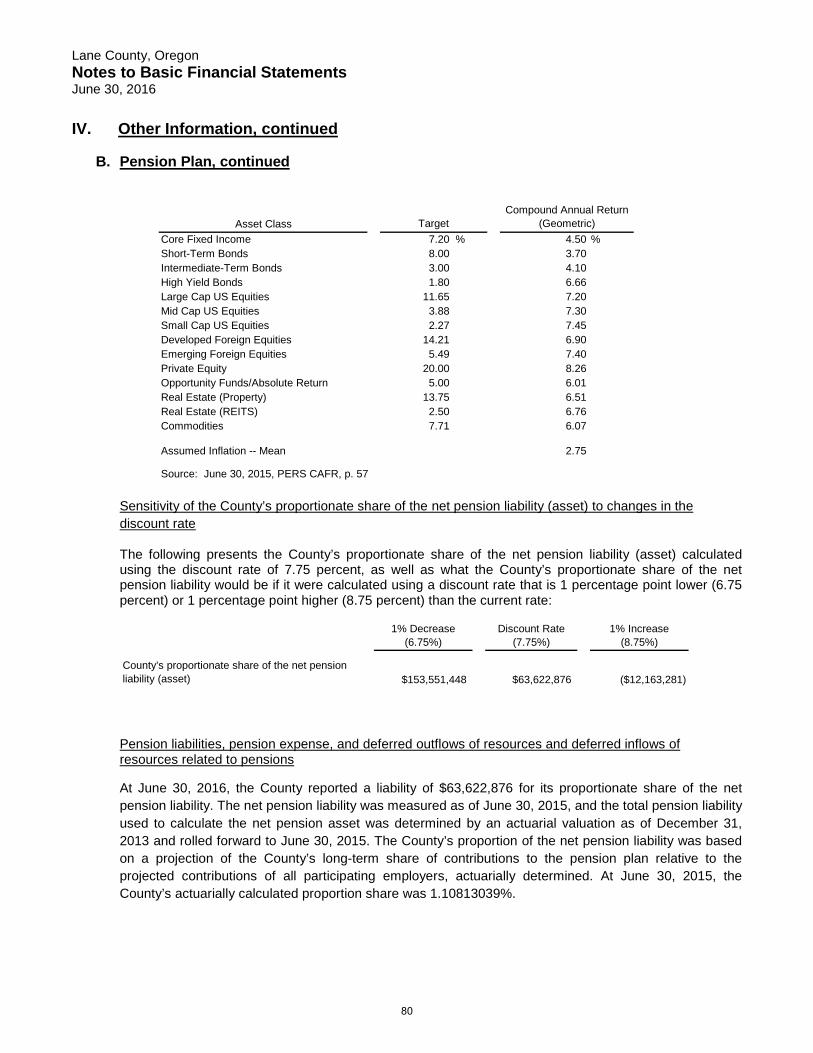
Lane County, Oregon Notes to Basic Financial Statements June 30, 2016
IV. Other Information, continued B. Pension Plan, continued
Asset ClassCore Fixed Income 7.20 % 4.50 %Short-Term Bonds 8.00 3.70Intermediate-Term Bonds 3.00 4.10High Yield Bonds 1.80 6.66Large Cap US Equities 11.65 7.20Mid Cap US Equities 3.88 7.30Small Cap US Equities 2.27 7.45Developed Foreign Equities 14.21 6.90Emerging Foreign Equities 5.49 7.40Private Equity 20.00 8.26Opportunity Funds/Absolute Return 5.00 6.01Real Estate (Property) 13.75 6.51Real Estate (REITS) 2.50 6.76Commodities 7.71 6.07
Assumed Inflation -- Mean 2.75
Source: June 30, 2015, PERS CAFR, p. 57
Compound Annual Return (Geometric)Target
Sensitivity of the County’s proportionate share of the net pension liability (asset) to changes in the discount rate
The following presents the County’s proportionate share of the net pension liability (asset) calculated using the discount rate of 7.75 percent, as well as what the County’s proportionate share of the net pension liability would be if it were calculated using a discount rate that is 1 percentage point lower (6.75 percent) or 1 percentage point higher (8.75 percent) than the current rate:
1% Decrease (6.75%)
Discount Rate (7.75%)
1% Increase (8.75%)
County's proportionate share of the net pension liability (asset) $153,551,448 $63,622,876 ($12,163,281)
Pension liabilities, pension expense, and deferred outflows of resources and deferred inflows of resources related to pensions
At June 30, 2016, the County reported a liability of $63,622,876 for its proportionate share of the net pension liability. The net pension liability was measured as of June 30, 2015, and the total pension liability used to calculate the net pension asset was determined by an actuarial valuation as of December 31, 2013 and rolled forward to June 30, 2015. The County’s proportion of the net pension liability was based on a projection of the County’s long-term share of contributions to the pension plan relative to the projected contributions of all participating employers, actuarially determined. At June 30, 2015, the County’s actuarially calculated proportion share was 1.10813039%.
80

Lane County, Oregon Notes to Basic Financial Statements June 30, 2016
IV. Other Information, continued
B. Pension Plan, continued
Detailed information about the pension plan’s fiduciary net position and the Schedules of Employer Allocation and Pension Amounts by Employer is available in separately issued OPERS financial reports and on line at www.oregon.gov/PERS.
Changes in Plan Provisions
The Oregon Supreme Court decision in Moro vs State of Oregon (issued on April 30, 2015) occurred after the December 31, 2013 valuation date but affected the plan provisions for financial reporting purposes. The Moro decision modified the COLA related changes of Senate Bill 822 and 861, creating a blended COLA for members who earned service years both before and after the effective dates of the legislation. Due to the timing of the Supreme Court decision, the COLA change due to Moro is reflected in the June 30, 2015 measurement date net pension liability but not in the June 30, 2014 measurement date net pension liability.
Pension Expense
For the year ended June 30, 2016, the County recognized pension expense of $61,203,427. For the fiscal year, this amount was allocated to functions on the Statement of Activities based on share of employer contribution as follows:
Functions/Programs Pension Expense
Governmental activities General government $8,856,139 Public safety 18,618,081 Public health and welfare 17,320,569 Parks 495,748 Roads and bridges 6,530,405 Community development 122,406Total 51,943,348
Business-type activities Lane events center 385,582 Solid waste disposal 3,139,736 Land management 1,132,263Total 4,657,581
Included in indirect expenses allocation 4,602,498
Total pension expense $61,203,427
81
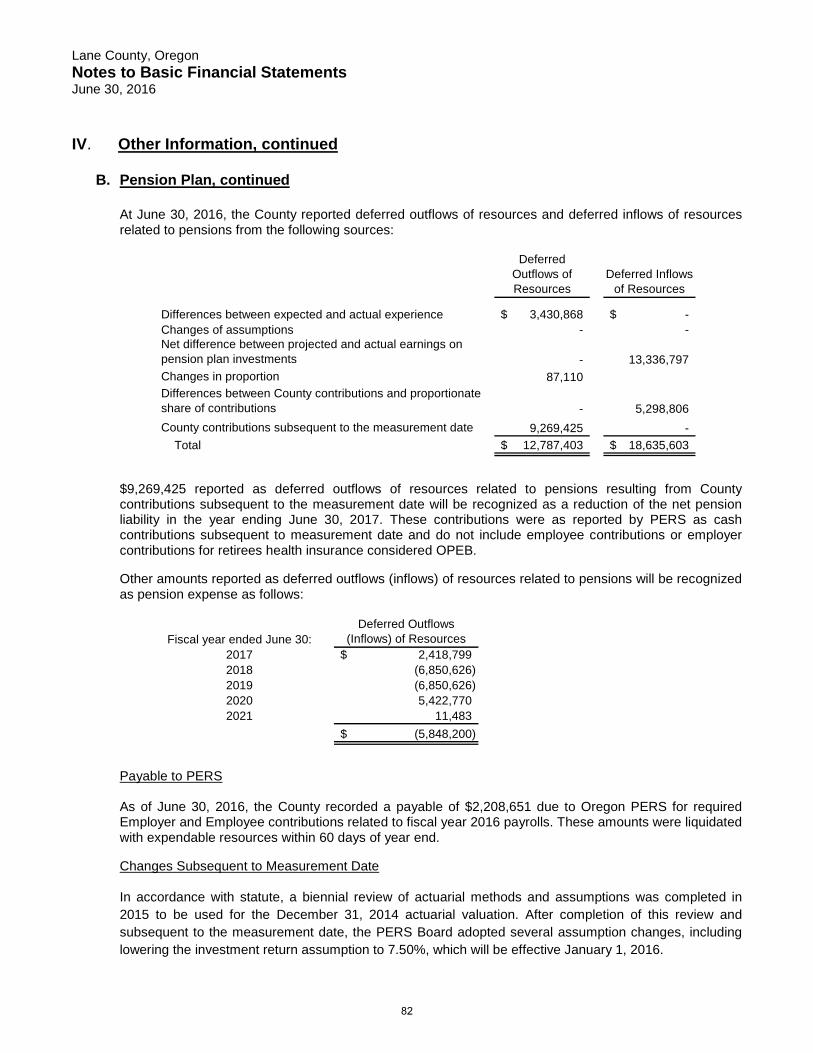
Lane County, Oregon Notes to Basic Financial Statements June 30, 2016
IV. Other Information, continued
B. Pension Plan, continued
At June 30, 2016, the County reported deferred outflows of resources and deferred inflows of resources related to pensions from the following sources:
Deferred Outflows of Resources
Deferred Inflows of Resources
Differences between expected and actual experience 3,430,868$ -$ Changes of assumptions - - Net difference between projected and actual earnings on pension plan investments - 13,336,797 Changes in proportion 87,110 Differences between County contributions and proportionate share of contributions - 5,298,806 County contributions subsequent to the measurement date 9,269,425 - Total 12,787,403$ 18,635,603$
$9,269,425 reported as deferred outflows of resources related to pensions resulting from County contributions subsequent to the measurement date will be recognized as a reduction of the net pension liability in the year ending June 30, 2017. These contributions were as reported by PERS as cash contributions subsequent to measurement date and do not include employee contributions or employer contributions for retirees health insurance considered OPEB.
Other amounts reported as deferred outflows (inflows) of resources related to pensions will be recognized as pension expense as follows:
Fiscal year ended June 30:Deferred Outflows
(Inflows) of Resources2017 2,418,799$ 2018 (6,850,626) 2019 (6,850,626) 2020 5,422,770 2021 11,483
(5,848,200)$
Payable to PERS
As of June 30, 2016, the County recorded a payable of $2,208,651 due to Oregon PERS for required Employer and Employee contributions related to fiscal year 2016 payrolls. These amounts were liquidated with expendable resources within 60 days of year end.
Changes Subsequent to Measurement Date
In accordance with statute, a biennial review of actuarial methods and assumptions was completed in 2015 to be used for the December 31, 2014 actuarial valuation. After completion of this review and subsequent to the measurement date, the PERS Board adopted several assumption changes, including lowering the investment return assumption to 7.50%, which will be effective January 1, 2016.
82
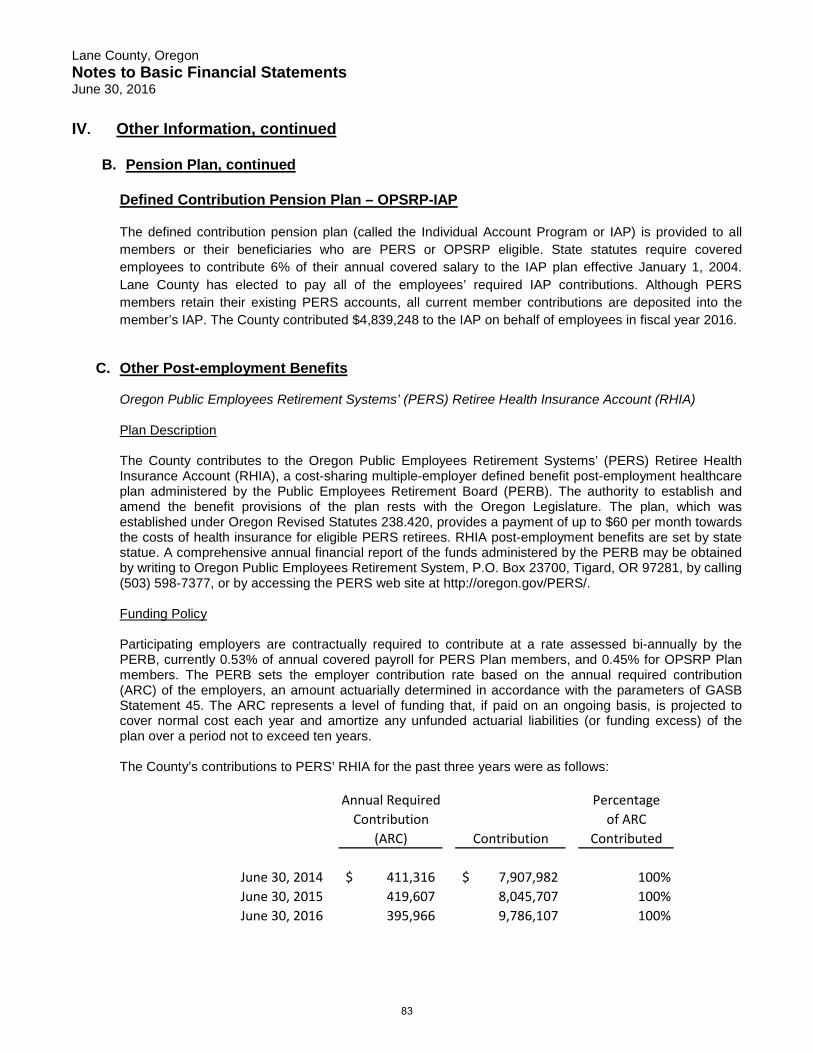
Lane County, Oregon Notes to Basic Financial Statements June 30, 2016
IV. Other Information, continued
B. Pension Plan, continued
Defined Contribution Pension Plan – OPSRP-IAP
The defined contribution pension plan (called the Individual Account Program or IAP) is provided to all members or their beneficiaries who are PERS or OPSRP eligible. State statutes require covered employees to contribute 6% of their annual covered salary to the IAP plan effective January 1, 2004. Lane County has elected to pay all of the employees’ required IAP contributions. Although PERS members retain their existing PERS accounts, all current member contributions are deposited into the member’s IAP. The County contributed $4,839,248 to the IAP on behalf of employees in fiscal year 2016.
C. Other Post-employment Benefits
Oregon Public Employees Retirement Systems’ (PERS) Retiree Health Insurance Account (RHIA) Plan Description The County contributes to the Oregon Public Employees Retirement Systems’ (PERS) Retiree Health Insurance Account (RHIA), a cost-sharing multiple-employer defined benefit post-employment healthcare plan administered by the Public Employees Retirement Board (PERB). The authority to establish and amend the benefit provisions of the plan rests with the Oregon Legislature. The plan, which was established under Oregon Revised Statutes 238.420, provides a payment of up to $60 per month towards the costs of health insurance for eligible PERS retirees. RHIA post-employment benefits are set by state statue. A comprehensive annual financial report of the funds administered by the PERB may be obtained by writing to Oregon Public Employees Retirement System, P.O. Box 23700, Tigard, OR 97281, by calling (503) 598-7377, or by accessing the PERS web site at http://oregon.gov/PERS/. Funding Policy Participating employers are contractually required to contribute at a rate assessed bi-annually by the PERB, currently 0.53% of annual covered payroll for PERS Plan members, and 0.45% for OPSRP Plan members. The PERB sets the employer contribution rate based on the annual required contribution (ARC) of the employers, an amount actuarially determined in accordance with the parameters of GASB Statement 45. The ARC represents a level of funding that, if paid on an ongoing basis, is projected to cover normal cost each year and amortize any unfunded actuarial liabilities (or funding excess) of the plan over a period not to exceed ten years. The County’s contributions to PERS’ RHIA for the past three years were as follows:
Annual Required PercentageContribution of ARC
(ARC) Contribution Contributed
June 30, 2014 411,316$ 7,907,982$ 100%June 30, 2015 419,607 8,045,707 100%June 30, 2016 395,966 9,786,107 100%
83
Lane County, Oregon Notes to Basic Financial Statements June 30, 2016
IV. Other Information, continued C. Other Post-employment Benefits, continued
County Retiree Healthcare Plan Plan Description Lane County administers a single-employer defined benefit healthcare plan that provides for payment of medical insurance premiums for eligible retirees under age 65, and for payment of Medicare Part B and supplemental premiums for eligible retirees who are covered by Medicare. Benefits under the plan are limited to participants employed prior to certain dates who meet certain service and age requirements, depending on the employee’s collective bargaining agreement. The age requirement is tied to eligibility for retirement under PERS, and is generally age 55 for general service employees, or age 50 for police and fire employees. Authority for the Plan can be found in Lane Code Chapter 2.500.
Eligible participants may purchase dependent coverage for the pre-Medicare coverage at the County’s premium rate. Eligible participants who meet the service requirements, but not the age requirements, for county-paid coverage, may “self-pay” continuously until the age requirement is met. Eligibility for these benefits has been phased out since 1997. Non-represented employees who worked in permanent positions on or before March 5, 1991, and who worked ten continuous years of service, become eligible for the benefits upon retirement. Eligibility for represented employees is also based on hire date and continuous years of service, with some modifications. Employees hired after June 30, 1997 will not be eligible for the benefits, thus the plan is closed to new employees. The County’s post-retirement healthcare benefits are provided in accordance with Oregon Revised Statutes (ORS) 243.303. ORS stipulate that for the purpose of establishing healthcare premiums, the rate must be based on all plan members, including both active employees and retirees. The difference between retiree claims costs, which are generally higher in comparison to all plan members due to age, and the amount of retiree healthcare premiums represents the County’s implicit employer contribution. At the time of the most recent actuarial valuation (June 30, 2016), there were 785 retirees receiving benefits under the plan; 258 pre-Medicare retirees and 527 retirees receiving Medicare Part B reimbursements and participating in the Medicare supplement insurance plan. In addition, there were 157 active employees who meet the criteria but have not yet retired. There were also 1,140 active employees who are not eligible for the benefit but could receive the implicit employer contribution should they self-pay medical insurance upon retirement. Lane County has not established an irrevocable trust (or equivalent arrangement) to account for the retiree health insurance plan. Instead, the activities of the plan are reported in the County’s Retiree Medical Benefit Trust Fund that is classified as an internal service fund for financial reporting purposes. The retiree health insurance plan does not issue a separate report.
Funding Policy The County has the authority to establish and amend contribution requirements. Lane County has adopted a pay-as-you-go approach to fund retiree healthcare by assessing County departments 3.5 percent of PERS-eligible payroll. Resources received in excess of pay-as-you-go expenditures are set aside for the payment of future benefits. For the fiscal year ending June 30, 2016, revenues to the Retiree Medical Benefit Trust Fund, an internal service fund, totaled $2,733,435 and contributions made to insurers or payments directly to retirees totaled $3,205,772.
84
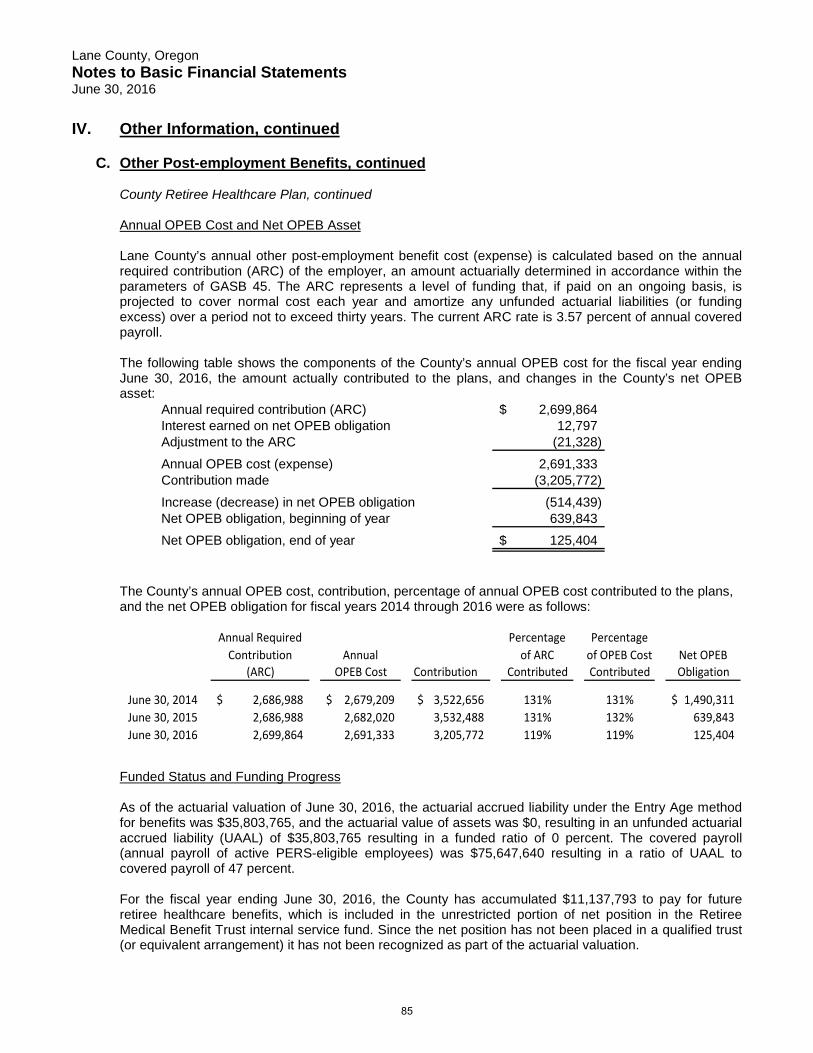
Lane County, Oregon Notes to Basic Financial Statements June 30, 2016
IV. Other Information, continued C. Other Post-employment Benefits, continued
County Retiree Healthcare Plan, continued Annual OPEB Cost and Net OPEB Asset Lane County’s annual other post-employment benefit cost (expense) is calculated based on the annual required contribution (ARC) of the employer, an amount actuarially determined in accordance within the parameters of GASB 45. The ARC represents a level of funding that, if paid on an ongoing basis, is projected to cover normal cost each year and amortize any unfunded actuarial liabilities (or funding excess) over a period not to exceed thirty years. The current ARC rate is 3.57 percent of annual covered payroll. The following table shows the components of the County’s annual OPEB cost for the fiscal year ending June 30, 2016, the amount actually contributed to the plans, and changes in the County’s net OPEB asset:
Annual required contribution (ARC) 2,699,864$ Interest earned on net OPEB obligation 12,797 Adjustment to the ARC (21,328) Annual OPEB cost (expense) 2,691,333 Contribution made (3,205,772) Increase (decrease) in net OPEB obligation (514,439) Net OPEB obligation, beginning of year 639,843 Net OPEB obligation, end of year 125,404$
The County’s annual OPEB cost, contribution, percentage of annual OPEB cost contributed to the plans, and the net OPEB obligation for fiscal years 2014 through 2016 were as follows:
Annual Required Contribution Annual
Percentage of ARC
Percentage of OPEB Cost Net OPEB
(ARC) OPEB Cost Contribution Contributed Contributed Obligation
June 30, 2014 2,686,988$ 2,679,209$ 3,522,656$ 131% 131% 1,490,311$ June 30, 2015 2,686,988 2,682,020 3,532,488 131% 132% 639,843 June 30, 2016 2,699,864 2,691,333 3,205,772 119% 119% 125,404
Funded Status and Funding Progress As of the actuarial valuation of June 30, 2016, the actuarial accrued liability under the Entry Age method for benefits was $35,803,765, and the actuarial value of assets was $0, resulting in an unfunded actuarial accrued liability (UAAL) of $35,803,765 resulting in a funded ratio of 0 percent. The covered payroll (annual payroll of active PERS-eligible employees) was $75,647,640 resulting in a ratio of UAAL to covered payroll of 47 percent. For the fiscal year ending June 30, 2016, the County has accumulated $11,137,793 to pay for future retiree healthcare benefits, which is included in the unrestricted portion of net position in the Retiree Medical Benefit Trust internal service fund. Since the net position has not been placed in a qualified trust (or equivalent arrangement) it has not been recognized as part of the actuarial valuation.
85
Lane County, Oregon Notes to Basic Financial Statements June 30, 2016
IV. Other Information, continued C. Other Post-employment Benefits, continued
County Retiree Healthcare Plan, continued Actuarial valuations of an ongoing plan involve estimates of the value of reported amounts and assumptions about the probability of occurrence of events far into the future. Examples include assumptions about future employment, mortality, and the healthcare cost trend. Amounts determined regarding the funded status of the plan and the annual required contributions of the employer are subject to continual revision as actual results are compared with past expectations and new estimates are made about the future. The schedule of funding progress, presented as required supplementary information following the notes to the financial statements, presents multiyear trend information that shows whether the actuarial value of plan assets is increasing or decreasing over time relative to the actuarial accrued liabilities for benefits. Actuarial Assumptions Projections of benefits for financial reporting purposes are based on the substantive plan (the plan as understood by the employer and plan members) and include the types of benefits provided at the time of each valuation and the historical pattern of sharing of benefit costs between the employer and plan members to that point. The actuarial methods and assumptions used include techniques that are designed to reduce short-term volatility in actuarial accrued liabilities and the actuarial value of assets, consistent with the long-term perspective of the calculations. The June 30, 2016 actuarial valuation utilized the projected entry age method due to a change in the assumed health care inflation rate after age 65 from a long-term rate of 5.5% to 2%. This year’s accrued liability is considerably lower than that in the valuation report two years ago. It’s assumed that individual medical benefits paid after July 1, 2016 would average 8% higher than those paid during the fiscal year ending June 30, 2016, increasing in future years by 7.5%, grading down by 0.5% per year to a long-term rate of 5.0% by 2021. It’s also assumed that costs for Medicare premiums covered by the Plan would increase 2% per year.
The unfunded actuarially accrued liability is amortized as a level percent of payroll over an open period of 30 years.
D. Deferred Compensation Plan The County offers its employees a deferred compensation plan created in accordance with the Internal Revenue Code, Section 457(b) and Section 401(a). The 457(b) plan is available to all County-paid employees and allows them to defer a portion of their current earnings up to the IRS deferral limits. The County contributes between zero (0.0) percent and seven (7.0) percent of each employee’s wage to the 401(a) Plan depending on their represented status and their respective bargaining unit. The Plan’s participants have the right to designate how the funds are invested. The Plan’s assets are held in trust for the exclusive benefit of the Plan’s participants and their beneficiaries and are considered property of the Plans’ participants, not subject to the County’s general creditors. As a result, Plan balances and activities are not reflected in these financial statements and the County has no liability for losses under the Plan. TIAA-CREF is the record keeper for the Lane County Deferred Compensation Plan 457(b) and 401(a) plans. TIAA provides the contracted services in accordance with the provisions of each plan.
86
Lane County, Oregon Notes to Basic Financial Statements June 30, 2016
IV. Other Information, continued
E. Joint Ventures and Jointly Governed Organizations
Joint Ventures A joint venture is a legal entity or other organization that results from a contractual arrangement and that is owned, operated, or governed by two or more participants as a separate and specific activity subject to ongoing control in which the participants retain (a) an ongoing financial interest or (b) an ongoing financial responsibility. For the fiscal year ended June 30, 2016, the County participates in the following joint ventures:
Metropolitan Wastewater Management Commission - The County is a participant with the City of Eugene and the City of Springfield in the Metropolitan Wastewater Management Commission (MWMC), a joint venture established by intergovernmental agreement to construct, maintain, and operate regional sewer facilities. The MWMC consists of a seven-member Commission to which the County appoints two voting members. The County does not have an ongoing financial interest in MWMC nor is it obligated for its debts, but the County does have an ongoing financial responsibility in that it is required to adopt rates and charges not less than those required by the commission. MWMC, which is reflected as a component unit of the City of Springfield, reported an increase in net position of $5,610,691 and a total net position of $145,936,915 for the fiscal year ended June 30, 2016. Separate financial statements for MWMC can be obtained from the City of Springfield Finance Department. Regional Fiber Consortium - The County is a participant with the cities of Cottage Grove, Drain, Eugene, Klamath Falls, Oakridge, and Springfield in the Regional Fiber Consortium (RFC), a joint venture established by intergovernmental agreement to develop, own, and control fiber optic cable to serve the public interest within the jurisdictional territories of the member governments. The RFC consists of a seven-member Board of Directors to which the County appoints one voting member. The County does not have access to RFC assets, nor is it obligated for its debts, but the County does have an ongoing financial interest in the RFC in that it has rights to revenues in excess of operation costs. For the fiscal year ended June 30, 2016, the RFC reported an increase in net position of $67,649 and a total net position of $242,995. Separate financial statements for the RFC can be obtained from the City of Springfield Finance Department, the administrative arm of the RFC.
Human Services Commission - The County is a participant with the City of Eugene and the City of Springfield in the Human Services Commission (HSC). The HSC is governed by seven Members consisting of the representatives of each of the participating governments. The HSC is a joint venture established by intergovernmental agreement dedicated to helping the County’s neediest residents achieve stability, improved health, greater independence and a higher quality of life. The County has an ongoing financial responsibility to the HSC as the administrator and a major purchaser of services. The HSC does not prepare separately issued financial statements. Lane County’s Department of Health and Human Services is responsible for the general administration of the HSC and accounts for all its financial activity as a program within the Health and Human Services fund, a major special revenue fund of the County.
Jointly Governed Organizations A jointly governed organization is a regional government or other multi-governmental arrangement that is governed by representatives from each of the governments that create the organization, yet is not a joint venture because the participants do not retain an ongoing financial interest or responsibility. For the fiscal year ended June 30, 2016, the County was a member of the following jointly governed organizations:
87
Lane County, Oregon Notes to Basic Financial Statements June 30, 2016
IV. Other Information, continued
E. Joint Ventures and Jointly Governed Organizations, continued Lane Regional Air Protection Agency - The County in conjunction with the cities of Eugene, Springfield, Cottage Grove and Oakridge created the Lane Regional Air Protection Agency (LRAPA) in accordance with ORS 468A, an organization dedicated to protecting public health, community well-being, and the environment for the improvement and maintenance of air quality in Lane County. LRAPA’s board is composed of 9 members of whom the County has one vote. The county paid $43,344 in annual dues to LRAPA during the current fiscal year. Separate financial statements for LRAPA can be obtained from the LRAPA Finance Department.
F. Commitments and Contingencies City of Florence During 1994, Lane County entered into an Intergovernmental Agreement with the City of Florence to pay the City $200,000 per year for a period of 20 years for payment of debt related to the construction of the City of Florence All Events Center, a new conference and meeting facility. The funding was to be appropriated from transient room tax revenues and paid semi-annually up to a total amount of $4,000,000. In 2004 the agreement was amended to reduce the annual payment to $190,000, $40,000 of which may be used for operational purposes. This change reduced the total amount to $3,900,000. Effective for fiscal year ended June 30, 2008, their annual payment was temporarily reduced to $182,171 due to budget reductions. That reduction was reversed and as of June 30, 2014 the entire $3,900,000 was paid and no amount remained appropriable and available under the agreement. During 2014, the County entered into a new agreement with the City of Florence to grant an additional two years of transient room tax revenues to pay the remaining debt on the bonds. The grant is for $192,000 ($96,000 per year) and expires June 30, 2016. As of June 30, 2016, this commitment has been fully completed with no remaining funds owed. Grants Amounts received or receivable from grantor agencies are subject to audit and adjustments by grantor agencies, principally the federal and state government. Any unforeseen disallowed claims, including amounts already collected, could become a liability of the General Fund or other applicable funds. Management believes that adjustments, if any, will not materially affect the County’s financial position. Lawsuits The County is a defendant in various lawsuits. Although the outcome of these lawsuits is not presently determinable, in the opinion of County Counsel the resolution of these matters will not have a material adverse effect on the financial condition of the County. Subsequent events In May, 2016, the Lane County Budget Committee approved a 31% decrease to the Local Option Levy tax currently authorized by voters at a rate 55 cents per $1,000 maximum assessed value. The lower tax amount for this Levy in FY 16-17 will be 38 cents per $1,000 maximum assessed value and be distributed as follow: 35 cents to Jail Services and 8 cents to Youth Services. This represents a 15 cent decrease to Jail Service sand 3 cent increase to Youth Services from prior years.
The County is currently in negotiations with the City of Eugene to determine the location of a future State Courthouse and City Hall. Oregon counties are mandated to provide space for the State Courts. Final
88

Lane County, Oregon Notes to Basic Financial Statements June 30, 2016
IV. Other Information, continued F. Commitments and Contingencies, continued
location will determine size and occupants of the new Courthouse, which would potentially house public safety related County services. The funding source for the new Courthouse is still undetermined but will likely include bonded debt which will impact future debt levels.
Special Items In 1998 the County executed a contract for the construction and operation of a Reverse Osmosis wastewater treatment system to treat all of the landfill’s leachate on-site. Over the years the system has repeatedly failed trail performance milestones because a satisfactory residuals management system was never completed. The contract has been terminated. $1,978,451 represents the write-off of the remaining book value of this system less scrape value of the equipment.
89

90

REQUIRED SUPPLEMENTARY INFORMATION
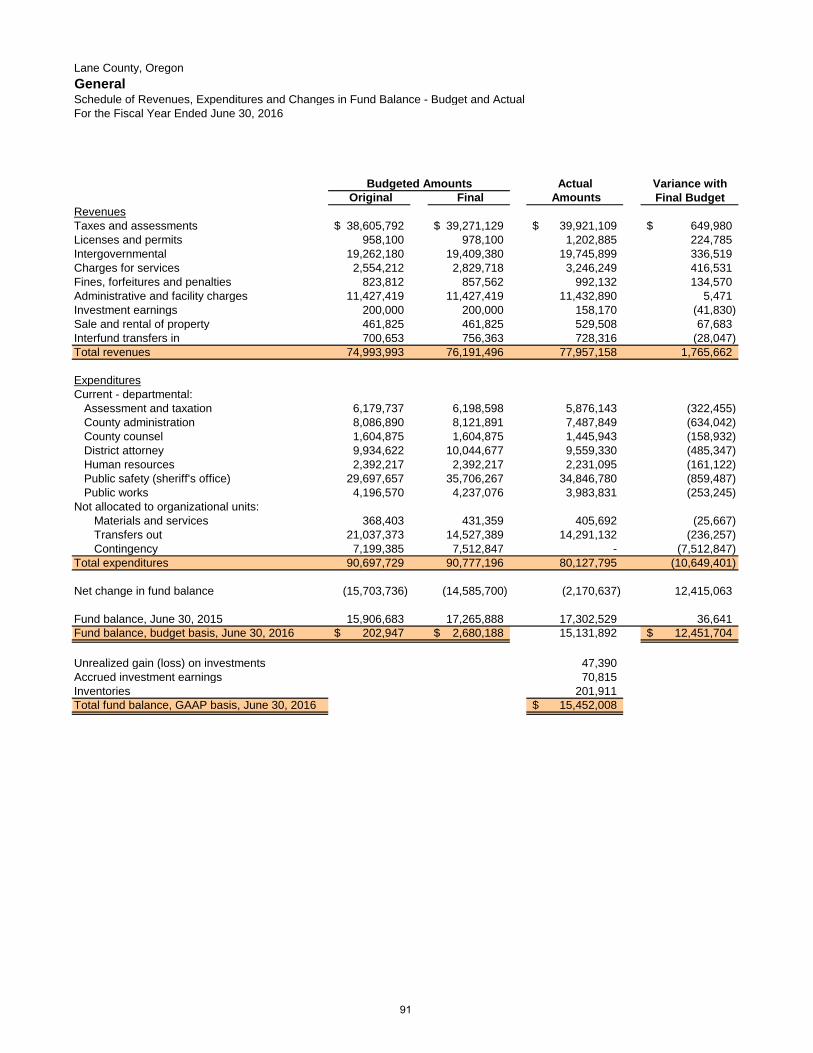
Lane County, OregonGeneralSchedule of Revenues, Expenditures and Changes in Fund Balance - Budget and ActualFor the Fiscal Year Ended June 30, 2016
Actual Variance with Original Final Amounts Final Budget
RevenuesTaxes and assessments 38,605,792$ 39,271,129$ 39,921,109$ 649,980$ Licenses and permits 958,100 978,100 1,202,885 224,785 Intergovernmental 19,262,180 19,409,380 19,745,899 336,519 Charges for services 2,554,212 2,829,718 3,246,249 416,531 Fines, forfeitures and penalties 823,812 857,562 992,132 134,570 Administrative and facility charges 11,427,419 11,427,419 11,432,890 5,471 Investment earnings 200,000 200,000 158,170 (41,830) Sale and rental of property 461,825 461,825 529,508 67,683 Interfund transfers in 700,653 756,363 728,316 (28,047) Total revenues 74,993,993 76,191,496 77,957,158 1,765,662
ExpendituresCurrent - departmental:
Assessment and taxation 6,179,737 6,198,598 5,876,143 (322,455) County administration 8,086,890 8,121,891 7,487,849 (634,042) County counsel 1,604,875 1,604,875 1,445,943 (158,932) District attorney 9,934,622 10,044,677 9,559,330 (485,347) Human resources 2,392,217 2,392,217 2,231,095 (161,122) Public safety (sheriff's office) 29,697,657 35,706,267 34,846,780 (859,487) Public works 4,196,570 4,237,076 3,983,831 (253,245)
Not allocated to organizational units:Materials and services 368,403 431,359 405,692 (25,667) Transfers out 21,037,373 14,527,389 14,291,132 (236,257) Contingency 7,199,385 7,512,847 - (7,512,847)
Total expenditures 90,697,729 90,777,196 80,127,795 (10,649,401)
Net change in fund balance (15,703,736) (14,585,700) (2,170,637) 12,415,063
Fund balance, June 30, 2015 15,906,683 17,265,888 17,302,529 36,641 Fund balance, budget basis, June 30, 2016 202,947$ 2,680,188$ 15,131,892 12,451,704$
Unrealized gain (loss) on investments 47,390 Accrued investment earnings 70,815 Inventories 201,911 Total fund balance, GAAP basis, June 30, 2016 15,452,008$
Budgeted Amounts
91
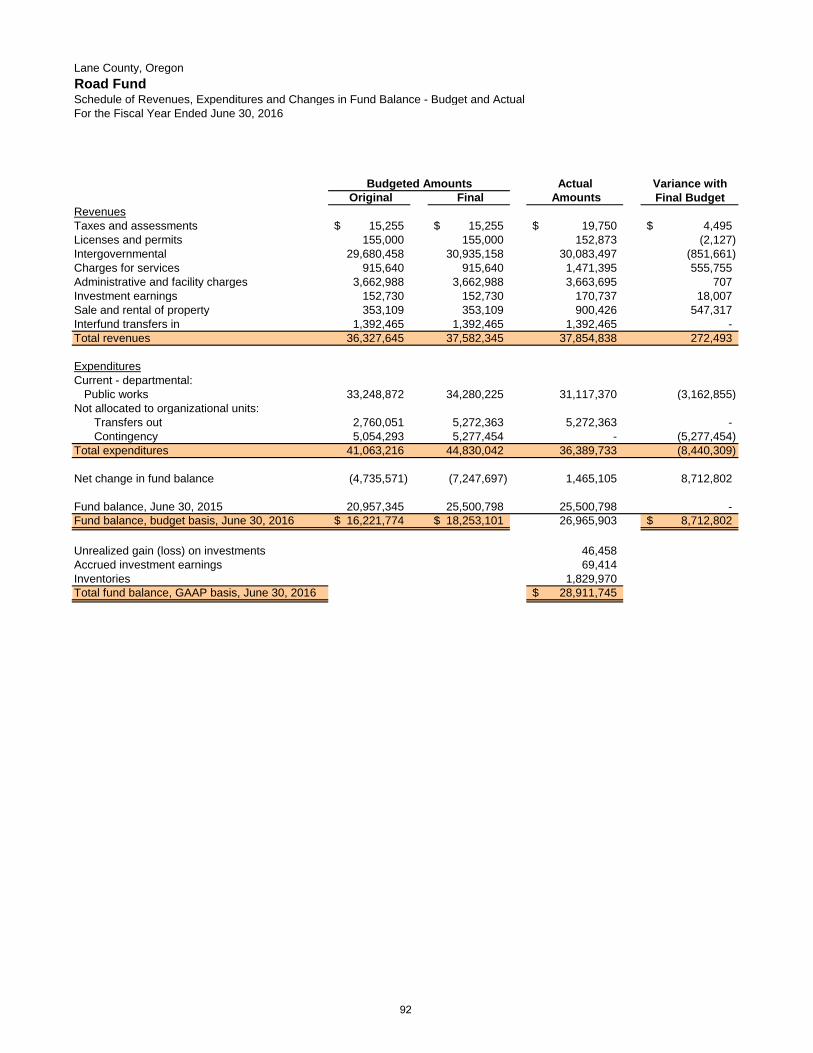
Lane County, OregonRoad FundSchedule of Revenues, Expenditures and Changes in Fund Balance - Budget and ActualFor the Fiscal Year Ended June 30, 2016
Actual Variance with Original Final Amounts Final Budget
RevenuesTaxes and assessments 15,255$ 15,255$ 19,750$ 4,495$ Licenses and permits 155,000 155,000 152,873 (2,127) Intergovernmental 29,680,458 30,935,158 30,083,497 (851,661) Charges for services 915,640 915,640 1,471,395 555,755 Administrative and facility charges 3,662,988 3,662,988 3,663,695 707 Investment earnings 152,730 152,730 170,737 18,007 Sale and rental of property 353,109 353,109 900,426 547,317 Interfund transfers in 1,392,465 1,392,465 1,392,465 - Total revenues 36,327,645 37,582,345 37,854,838 272,493
ExpendituresCurrent - departmental:
Public works 33,248,872 34,280,225 31,117,370 (3,162,855) Not allocated to organizational units:
Transfers out 2,760,051 5,272,363 5,272,363 - Contingency 5,054,293 5,277,454 - (5,277,454)
Total expenditures 41,063,216 44,830,042 36,389,733 (8,440,309)
Net change in fund balance (4,735,571) (7,247,697) 1,465,105 8,712,802
Fund balance, June 30, 2015 20,957,345 25,500,798 25,500,798 - Fund balance, budget basis, June 30, 2016 16,221,774$ 18,253,101$ 26,965,903 8,712,802$
Unrealized gain (loss) on investments 46,458 Accrued investment earnings 69,414 Inventories 1,829,970 Total fund balance, GAAP basis, June 30, 2016 28,911,745$
Budgeted Amounts
92
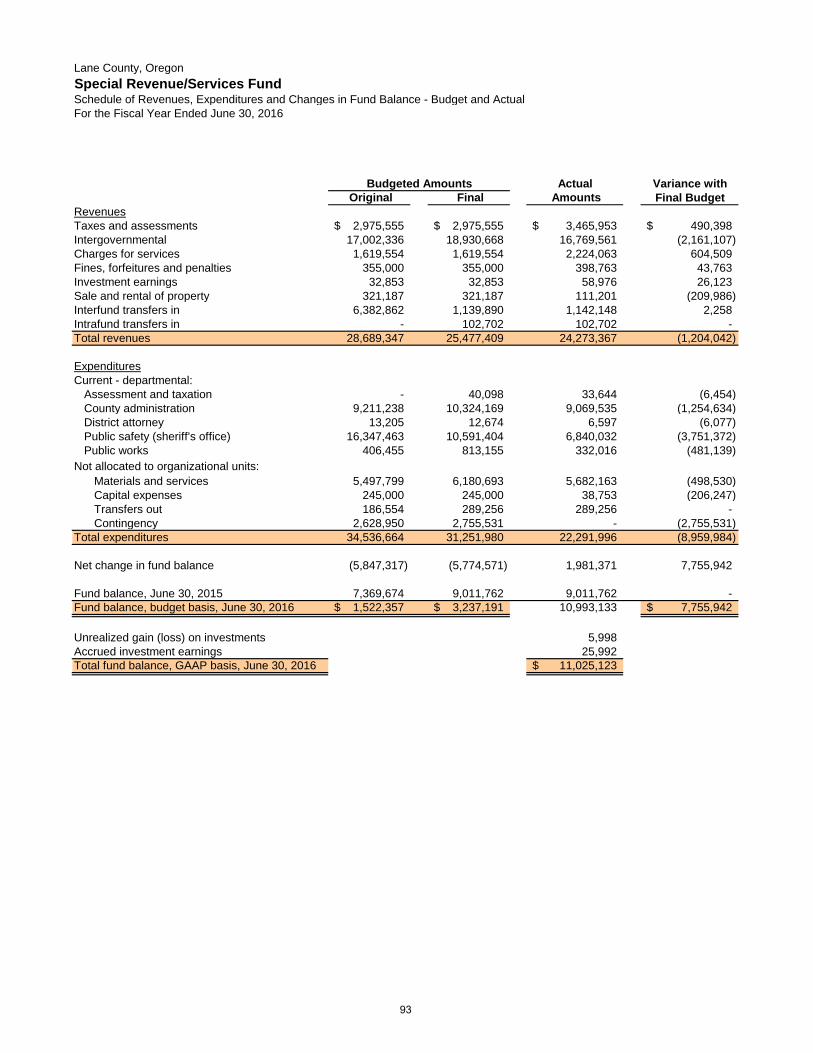
Lane County, OregonSpecial Revenue/Services FundSchedule of Revenues, Expenditures and Changes in Fund Balance - Budget and ActualFor the Fiscal Year Ended June 30, 2016
Actual Variance with Original Final Amounts Final Budget
RevenuesTaxes and assessments 2,975,555$ 2,975,555$ 3,465,953$ 490,398$ Intergovernmental 17,002,336 18,930,668 16,769,561 (2,161,107) Charges for services 1,619,554 1,619,554 2,224,063 604,509 Fines, forfeitures and penalties 355,000 355,000 398,763 43,763 Investment earnings 32,853 32,853 58,976 26,123 Sale and rental of property 321,187 321,187 111,201 (209,986) Interfund transfers in 6,382,862 1,139,890 1,142,148 2,258 Intrafund transfers in - 102,702 102,702 - Total revenues 28,689,347 25,477,409 24,273,367 (1,204,042)
ExpendituresCurrent - departmental:
Assessment and taxation - 40,098 33,644 (6,454) County administration 9,211,238 10,324,169 9,069,535 (1,254,634) District attorney 13,205 12,674 6,597 (6,077) Public safety (sheriff's office) 16,347,463 10,591,404 6,840,032 (3,751,372) Public works 406,455 813,155 332,016 (481,139)
Not allocated to organizational units:Materials and services 5,497,799 6,180,693 5,682,163 (498,530) Capital expenses 245,000 245,000 38,753 (206,247) Transfers out 186,554 289,256 289,256 - Contingency 2,628,950 2,755,531 - (2,755,531)
Total expenditures 34,536,664 31,251,980 22,291,996 (8,959,984)
Net change in fund balance (5,847,317) (5,774,571) 1,981,371 7,755,942
Fund balance, June 30, 2015 7,369,674 9,011,762 9,011,762 - Fund balance, budget basis, June 30, 2016 1,522,357$ 3,237,191$ 10,993,133 7,755,942$
Unrealized gain (loss) on investments 5,998 Accrued investment earnings 25,992 Total fund balance, GAAP basis, June 30, 2016 11,025,123$
Budgeted Amounts
93
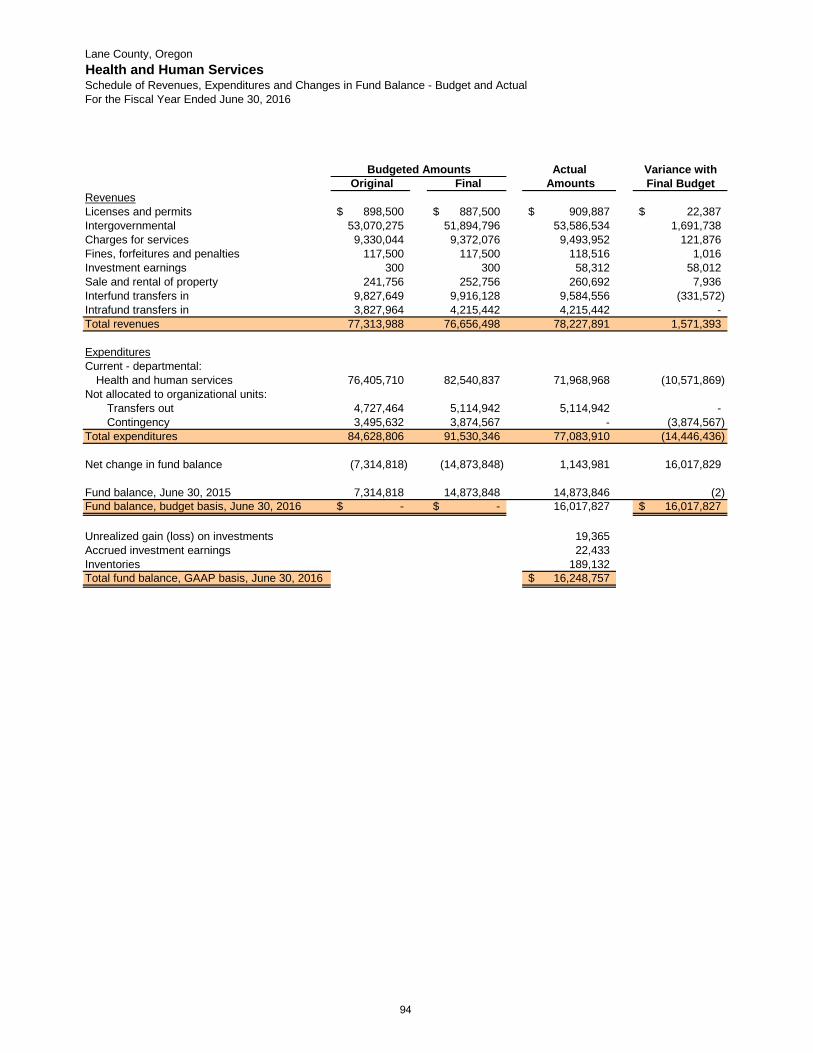
Lane County, OregonHealth and Human ServicesSchedule of Revenues, Expenditures and Changes in Fund Balance - Budget and ActualFor the Fiscal Year Ended June 30, 2016
Actual Variance with Original Final Amounts Final Budget
RevenuesLicenses and permits 898,500$ 887,500$ 909,887$ 22,387$ Intergovernmental 53,070,275 51,894,796 53,586,534 1,691,738 Charges for services 9,330,044 9,372,076 9,493,952 121,876 Fines, forfeitures and penalties 117,500 117,500 118,516 1,016 Investment earnings 300 300 58,312 58,012 Sale and rental of property 241,756 252,756 260,692 7,936 Interfund transfers in 9,827,649 9,916,128 9,584,556 (331,572) Intrafund transfers in 3,827,964 4,215,442 4,215,442 - Total revenues 77,313,988 76,656,498 78,227,891 1,571,393
ExpendituresCurrent - departmental:
Health and human services 76,405,710 82,540,837 71,968,968 (10,571,869) Not allocated to organizational units:
Transfers out 4,727,464 5,114,942 5,114,942 - Contingency 3,495,632 3,874,567 - (3,874,567)
Total expenditures 84,628,806 91,530,346 77,083,910 (14,446,436)
Net change in fund balance (7,314,818) (14,873,848) 1,143,981 16,017,829
Fund balance, June 30, 2015 7,314,818 14,873,848 14,873,846 (2) Fund balance, budget basis, June 30, 2016 -$ -$ 16,017,827 16,017,827$
Unrealized gain (loss) on investments 19,365 Accrued investment earnings 22,433 Inventories 189,132 Total fund balance, GAAP basis, June 30, 2016 16,248,757$
Budgeted Amounts
94
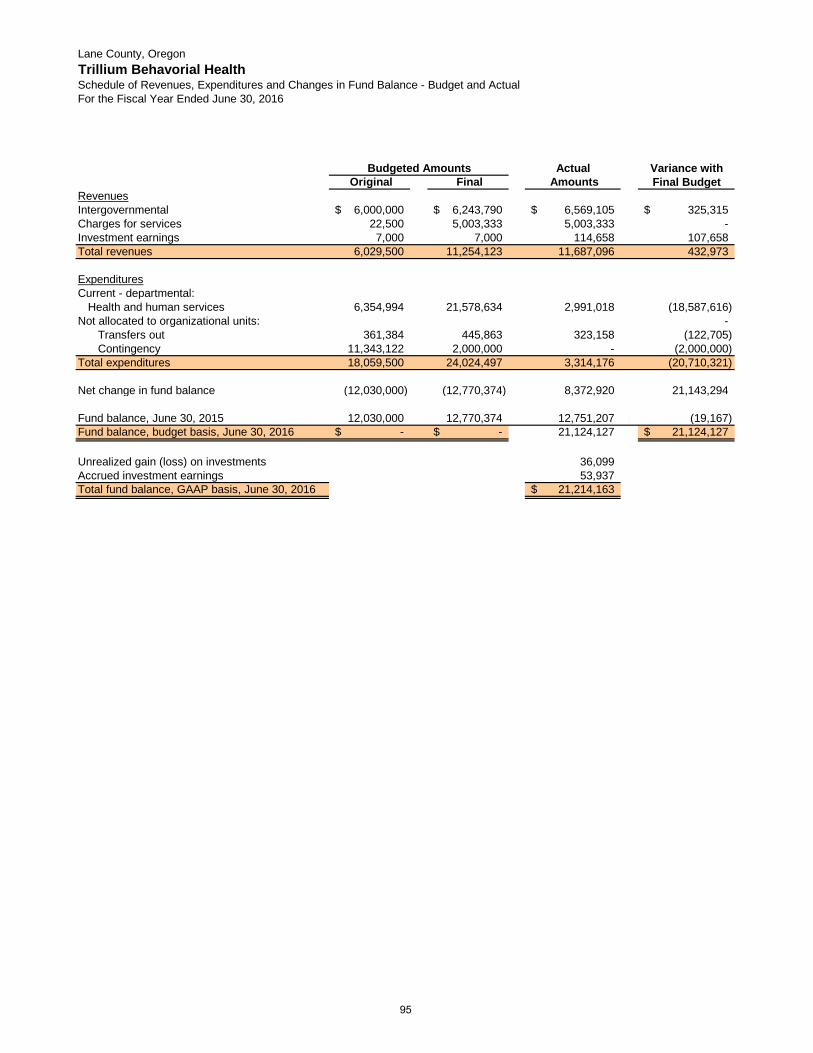
Lane County, OregonTrillium Behavorial HealthSchedule of Revenues, Expenditures and Changes in Fund Balance - Budget and ActualFor the Fiscal Year Ended June 30, 2016
Actual Variance with Original Final Amounts Final Budget
RevenuesIntergovernmental 6,000,000$ 6,243,790$ 6,569,105$ 325,315$ Charges for services 22,500 5,003,333 5,003,333 - Investment earnings 7,000 7,000 114,658 107,658 Total revenues 6,029,500 11,254,123 11,687,096 432,973
ExpendituresCurrent - departmental:
Health and human services 6,354,994 21,578,634 2,991,018 (18,587,616) Not allocated to organizational units: -
Transfers out 361,384 445,863 323,158 (122,705) Contingency 11,343,122 2,000,000 - (2,000,000)
Total expenditures 18,059,500 24,024,497 3,314,176 (20,710,321)
Net change in fund balance (12,030,000) (12,770,374) 8,372,920 21,143,294
Fund balance, June 30, 2015 12,030,000 12,770,374 12,751,207 (19,167) Fund balance, budget basis, June 30, 2016 -$ -$ 21,124,127 21,124,127$
Unrealized gain (loss) on investments 36,099 Accrued investment earnings 53,937 Total fund balance, GAAP basis, June 30, 2016 21,214,163$
Budgeted Amounts
95
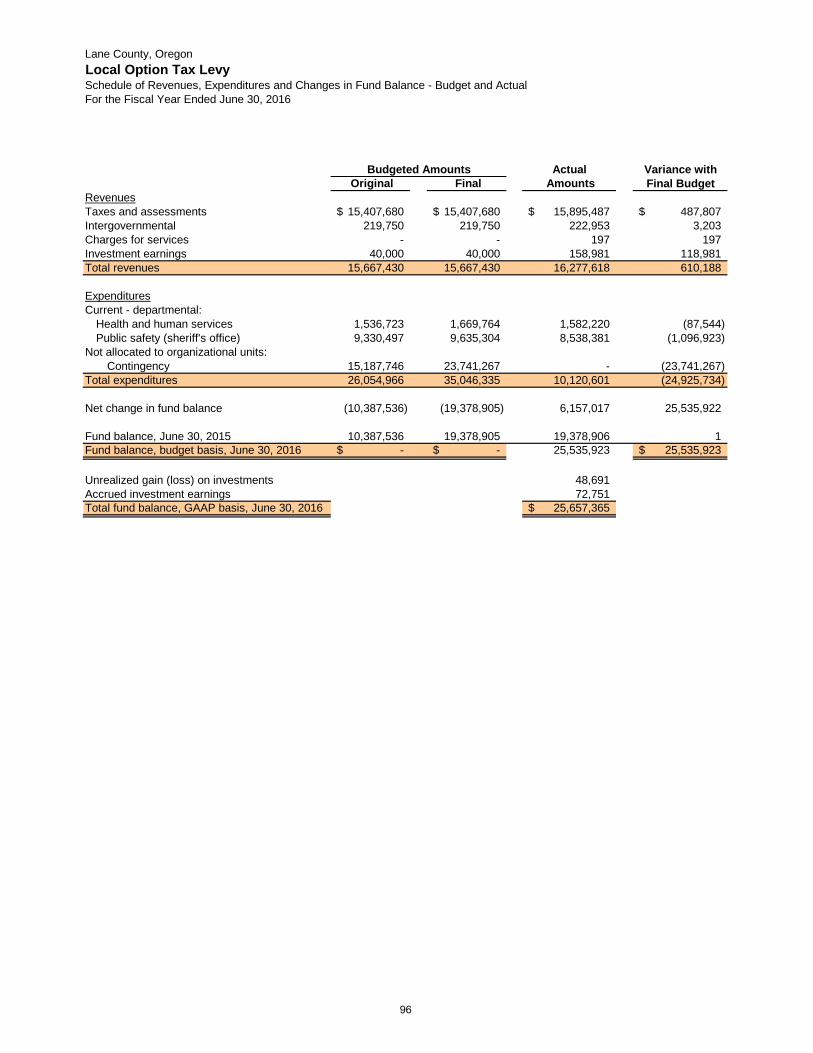
Lane County, OregonLocal Option Tax LevySchedule of Revenues, Expenditures and Changes in Fund Balance - Budget and ActualFor the Fiscal Year Ended June 30, 2016
Actual Variance with Original Final Amounts Final Budget
RevenuesTaxes and assessments 15,407,680$ 15,407,680$ 15,895,487$ 487,807$ Intergovernmental 219,750 219,750 222,953 3,203 Charges for services - - 197 197 Investment earnings 40,000 40,000 158,981 118,981 Total revenues 15,667,430 15,667,430 16,277,618 610,188
ExpendituresCurrent - departmental:
Health and human services 1,536,723 1,669,764 1,582,220 (87,544) Public safety (sheriff's office) 9,330,497 9,635,304 8,538,381 (1,096,923)
Not allocated to organizational units:Contingency 15,187,746 23,741,267 - (23,741,267)
Total expenditures 26,054,966 35,046,335 10,120,601 (24,925,734)
Net change in fund balance (10,387,536) (19,378,905) 6,157,017 25,535,922
Fund balance, June 30, 2015 10,387,536 19,378,905 19,378,906 1 Fund balance, budget basis, June 30, 2016 -$ -$ 25,535,923 25,535,923$
Unrealized gain (loss) on investments 48,691 Accrued investment earnings 72,751 Total fund balance, GAAP basis, June 30, 2016 25,657,365$
Budgeted Amounts
96
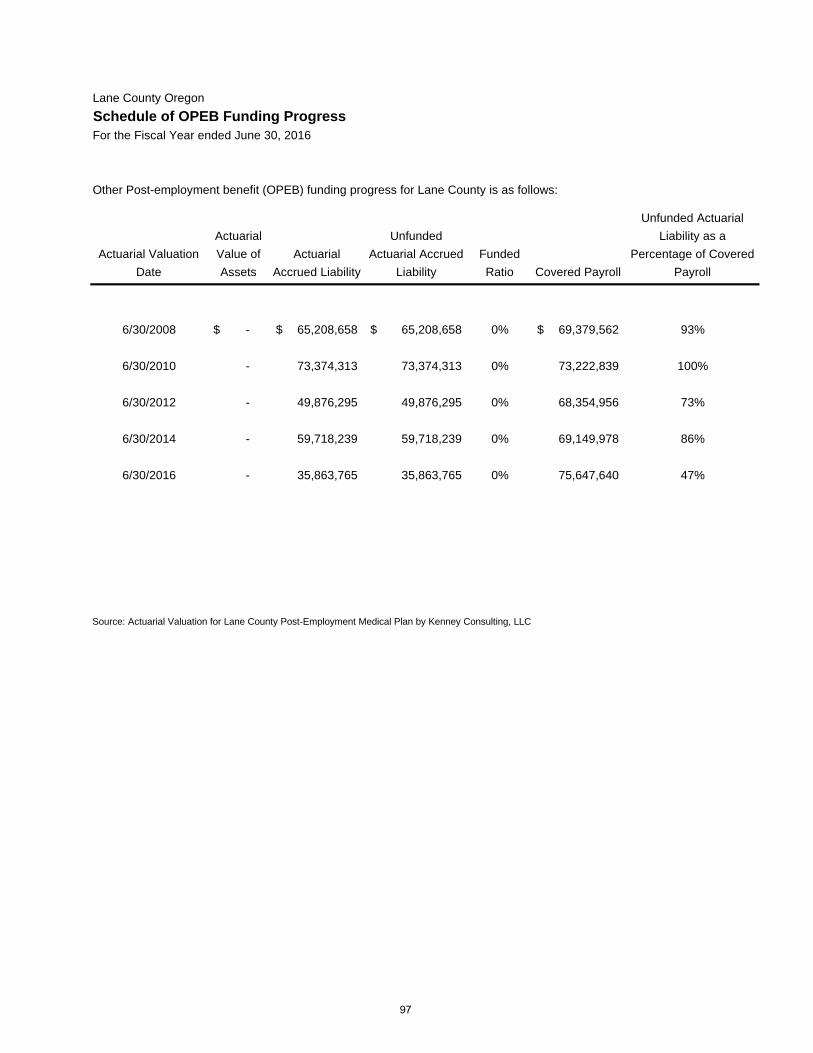
Lane County Oregon Schedule of OPEB Funding ProgressFor the Fiscal Year ended June 30, 2016
Other Post-employment benefit (OPEB) funding progress for Lane County is as follows:
Actuarial Valuation Date
Actuarial Value of Assets
Actuarial Accrued Liability
Unfunded Actuarial Accrued
LiabilityFunded Ratio Covered Payroll
Unfunded Actuarial Liability as a
Percentage of Covered Payroll
6/30/2008 -$ 65,208,658$ 65,208,658$ 0% 69,379,562$ 93%
6/30/2010 - 73,374,313 73,374,313 0% 73,222,839 100%
6/30/2012 - 49,876,295 49,876,295 0% 68,354,956 73%
6/30/2014 - 59,718,239 59,718,239 0% 69,149,978 86%
6/30/2016 - 35,863,765 35,863,765 0% 75,647,640 47%
Source: Actuarial Valuation for Lane County Post-Employment Medical Plan by Kenney Consulting, LLC
97

Lane County, OregonSchedule of County Contributions
Oregon Public Employees Retirement System
Last Two Fiscal Years
2016 2015
Contractually required contribution 9,269,425$ 8,142,668$
Contributions in relation to the contractually required contribution 9,269,425 8,142,668
Contribution deficiency (excess) - -
County's covered-employee payroll 80,654,140 76,688,823
Contributions as a percentage of covered-employee payroll 11.49% 10.62%
98
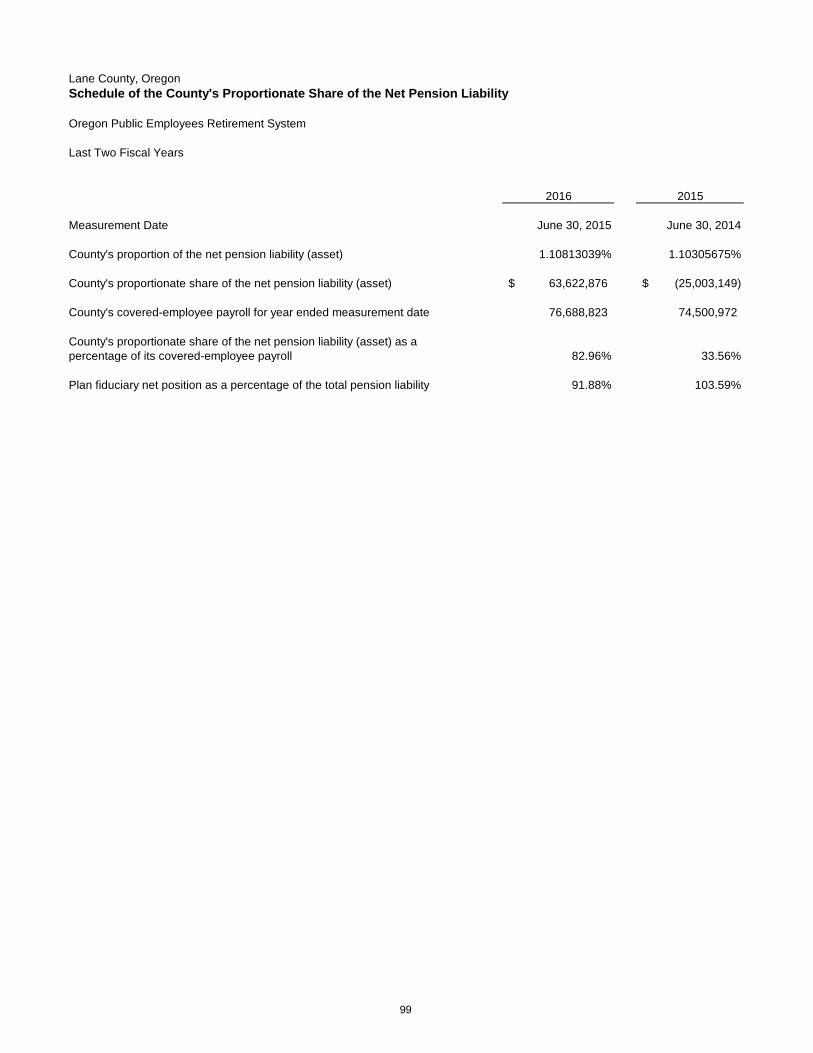
Lane County, OregonSchedule of the County's Proportionate Share of the Net Pension Liability
Oregon Public Employees Retirement System
Last Two Fiscal Years
2016 2015
Measurement Date June 30, 2015 June 30, 2014
County's proportion of the net pension liability (asset) 1.10813039% 1.10305675%
County's proportionate share of the net pension liability (asset) 63,622,876$ (25,003,149)$
County's covered-employee payroll for year ended measurement date 76,688,823 74,500,972
County's proportionate share of the net pension liability (asset) as a percentage of its covered-employee payroll 82.96% 33.56%
Plan fiduciary net position as a percentage of the total pension liability 91.88% 103.59%
99

Lane County, Oregon Notes to Required Supplementary Information For the Fiscal Year Ended June 30, 2016 Budget to GAAP Reconciliation Sections of Oregon Revised Statutes (Oregon Budget Law) require most transactions be budgeted on the modified accrual basis of accounting. However, there are certain transactions where statutory budget requirements conflict with generally accepted accounting principles (GAAP). The following discusses the differences between the budget basis and GAAP basis of accounting for the General Fund and the Road, Special Revenue/Services, Health and Human Services, Trillium Behavioral Health, and Local Option Tax Levy special revenue funds.
General
Road
Special Revenue / Services
Health and Human
Services
Trillium Behavioral
Health
Local Option Tax Levy
Net change in fund balance – budget basis $ (2,170,637) $ 1,465,105 $ 1,981,371 $ 1,143,981
$ 8,372,920 $ 6,157,017
Revenues and other financing sources required by GAAP not qualifying as budget resources:
The adjustment to record accrued investment income and adjust investments to fair value is reported as an addition or reduction of revenue on a GAAP basis in accordance with GASB 31. However, the accrued investment income and the fair value adjustment do not affect budgetary resources that are available for expenditure. Therefore, the current year accrued investment income and fair value adjustments are reported as a budget to GAAP difference.
45,900 47,709 12,062 21,507 58,987
71,947
Net change in fund balance – GAAP basis. $
(2,124,737)
$
1,512,814
$
1,993,433
$
1,165,488
$
8,431,907
$
6,228,964 Pension Plan Changes in Plan Provisions The Oregon Supreme Court decision in Moro vs State of Oregon (issued on April 30, 2015) occurred after the December 31, 2013 valuation date but affected the plan provisions for financial reporting purposes. The Moro decision modified the COLA related changes of Senate Bill 822 and 861, creating a blended COLA for members who earned service years both before and after the effective dates of the legislation. Due to the timing of the Supreme Court decision, the COLA change due to Moro is reflected in the June 30, 2015 measurement date net pension liability but not in the June 30, 2014 measurement date net pension liability.
100

OTHER SUPPLEMENTARY INFORMATION

NONMAJOR GOVERNMENTAL FUNDS COMBINING STATEMENTS
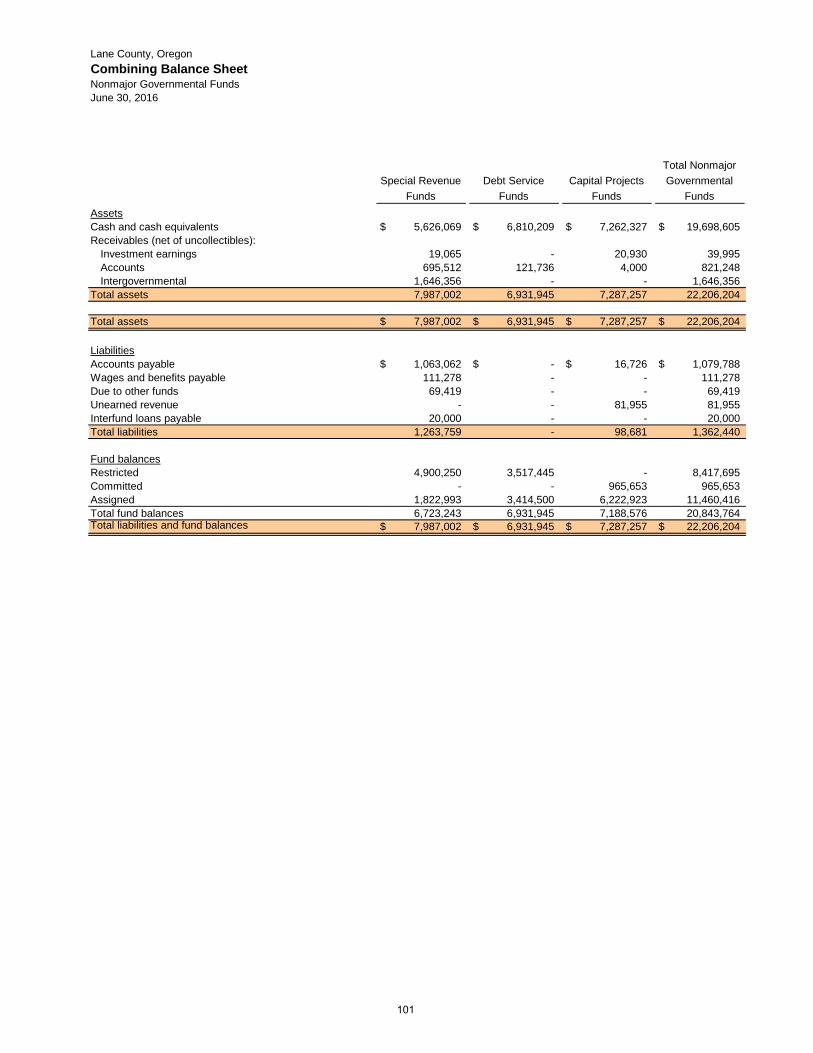
Lane County, OregonCombining Balance SheetNonmajor Governmental FundsJune 30, 2016
Special Revenue Funds
Debt Service Funds
Capital Projects Funds
Total Nonmajor Governmental
FundsAssetsCash and cash equivalents 5,626,069$ 6,810,209$ 7,262,327$ 19,698,605$ Receivables (net of uncollectibles):
Investment earnings 19,065 - 20,930 39,995 Accounts 695,512 121,736 4,000 821,248 Intergovernmental 1,646,356 - - 1,646,356
Total assets 7,987,002 6,931,945 7,287,257 22,206,204
Total assets 7,987,002$ 6,931,945$ 7,287,257$ 22,206,204$
LiabilitiesAccounts payable 1,063,062$ -$ 16,726$ 1,079,788$ Wages and benefits payable 111,278 - - 111,278 Due to other funds 69,419 - - 69,419 Unearned revenue - - 81,955 81,955 Interfund loans payable 20,000 - - 20,000 Total liabilities 1,263,759 - 98,681 1,362,440
Fund balancesRestricted 4,900,250 3,517,445 - 8,417,695 Committed - - 965,653 965,653 Assigned 1,822,993 3,414,500 6,222,923 11,460,416 Total fund balances 6,723,243 6,931,945 7,188,576 20,843,764 Total liabilities and fund balances 7,987,002$ 6,931,945$ 7,287,257$ 22,206,204$
101
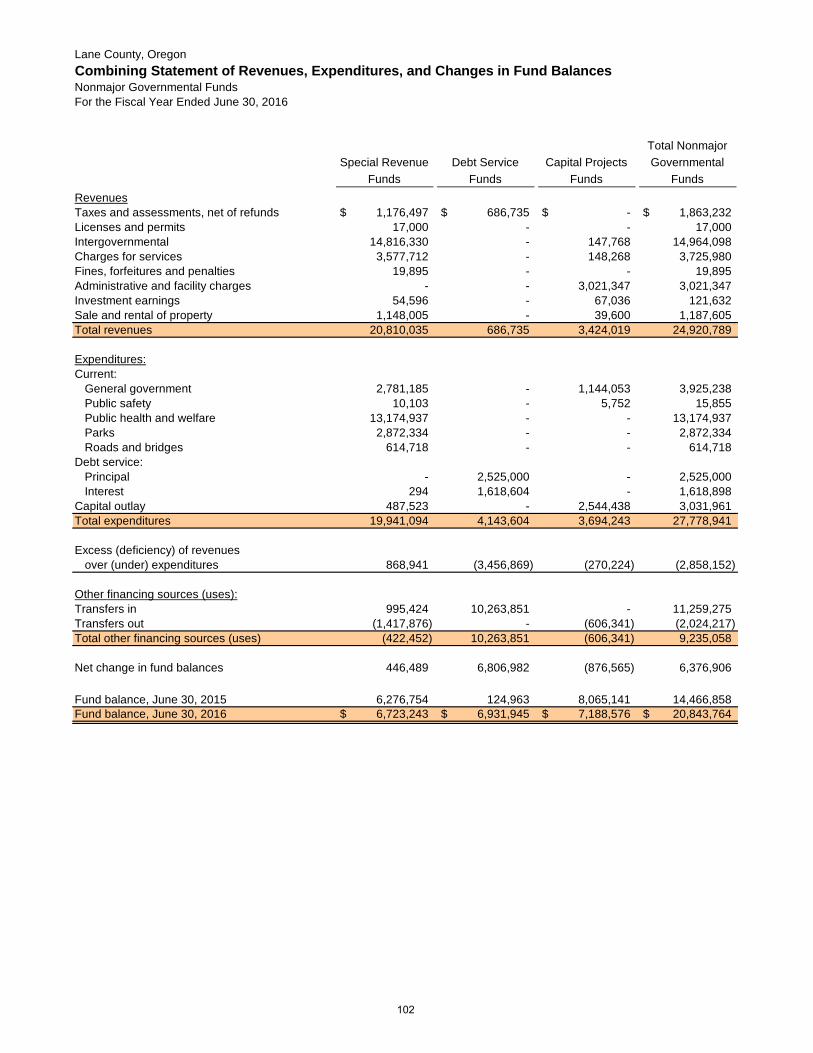
Lane County, OregonCombining Statement of Revenues, Expenditures, and Changes in Fund BalancesNonmajor Governmental FundsFor the Fiscal Year Ended June 30, 2016
Special Revenue Funds
Debt Service Funds
Capital Projects Funds
Total Nonmajor Governmental
FundsRevenuesTaxes and assessments, net of refunds 1,176,497$ 686,735$ -$ 1,863,232$ Licenses and permits 17,000 - - 17,000 Intergovernmental 14,816,330 - 147,768 14,964,098 Charges for services 3,577,712 - 148,268 3,725,980 Fines, forfeitures and penalties 19,895 - - 19,895 Administrative and facility charges - - 3,021,347 3,021,347 Investment earnings 54,596 - 67,036 121,632 Sale and rental of property 1,148,005 - 39,600 1,187,605 Total revenues 20,810,035 686,735 3,424,019 24,920,789
Expenditures:Current:
General government 2,781,185 - 1,144,053 3,925,238 Public safety 10,103 - 5,752 15,855 Public health and welfare 13,174,937 - - 13,174,937 Parks 2,872,334 - - 2,872,334 Roads and bridges 614,718 - - 614,718
Debt service:Principal - 2,525,000 - 2,525,000 Interest 294 1,618,604 - 1,618,898
Capital outlay 487,523 - 2,544,438 3,031,961 Total expenditures 19,941,094 4,143,604 3,694,243 27,778,941
Excess (deficiency) of revenuesover (under) expenditures 868,941 (3,456,869) (270,224) (2,858,152)
Other financing sources (uses):Transfers in 995,424 10,263,851 - 11,259,275 Transfers out (1,417,876) - (606,341) (2,024,217) Total other financing sources (uses) (422,452) 10,263,851 (606,341) 9,235,058
Net change in fund balances 446,489 6,806,982 (876,565) 6,376,906
Fund balance, June 30, 2015 6,276,754 124,963 8,065,141 14,466,858 Fund balance, June 30, 2016 6,723,243$ 6,931,945$ 7,188,576$ 20,843,764$
102
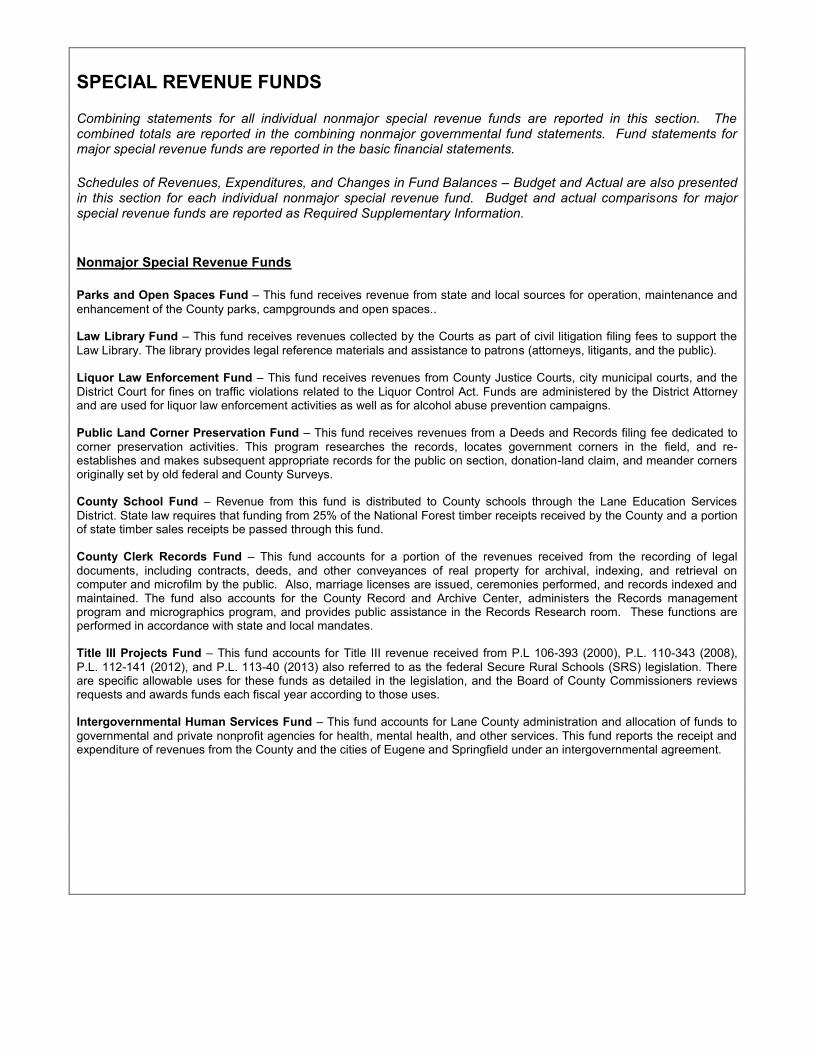
SPECIAL REVENUE FUNDS Combining statements for all individual nonmajor special revenue funds are reported in this section. The combined totals are reported in the combining nonmajor governmental fund statements. Fund statements for major special revenue funds are reported in the basic financial statements. Schedules of Revenues, Expenditures, and Changes in Fund Balances – Budget and Actual are also presented in this section for each individual nonmajor special revenue fund. Budget and actual comparisons for major special revenue funds are reported as Required Supplementary Information. Nonmajor Special Revenue Funds Parks and Open Spaces Fund – This fund receives revenue from state and local sources for operation, maintenance and enhancement of the County parks, campgrounds and open spaces.. Law Library Fund – This fund receives revenues collected by the Courts as part of civil litigation filing fees to support the Law Library. The library provides legal reference materials and assistance to patrons (attorneys, litigants, and the public). Liquor Law Enforcement Fund – This fund receives revenues from County Justice Courts, city municipal courts, and the District Court for fines on traffic violations related to the Liquor Control Act. Funds are administered by the District Attorney and are used for liquor law enforcement activities as well as for alcohol abuse prevention campaigns. Public Land Corner Preservation Fund – This fund receives revenues from a Deeds and Records filing fee dedicated to corner preservation activities. This program researches the records, locates government corners in the field, and re-establishes and makes subsequent appropriate records for the public on section, donation-land claim, and meander corners originally set by old federal and County Surveys. County School Fund – Revenue from this fund is distributed to County schools through the Lane Education Services District. State law requires that funding from 25% of the National Forest timber receipts received by the County and a portion of state timber sales receipts be passed through this fund. County Clerk Records Fund – This fund accounts for a portion of the revenues received from the recording of legal documents, including contracts, deeds, and other conveyances of real property for archival, indexing, and retrieval on computer and microfilm by the public. Also, marriage licenses are issued, ceremonies performed, and records indexed and maintained. The fund also accounts for the County Record and Archive Center, administers the Records management program and micrographics program, and provides public assistance in the Records Research room. These functions are performed in accordance with state and local mandates. Title III Projects Fund – This fund accounts for Title III revenue received from P.L 106-393 (2000), P.L. 110-343 (2008), P.L. 112-141 (2012), and P.L. 113-40 (2013) also referred to as the federal Secure Rural Schools (SRS) legislation. There are specific allowable uses for these funds as detailed in the legislation, and the Board of County Commissioners reviews requests and awards funds each fiscal year according to those uses. Intergovernmental Human Services Fund – This fund accounts for Lane County administration and allocation of funds to governmental and private nonprofit agencies for health, mental health, and other services. This fund reports the receipt and expenditure of revenues from the County and the cities of Eugene and Springfield under an intergovernmental agreement.

103

Lane County, OregonCombining Balance SheetNonmajor Special Revenue FundsJune 30, 2016
Parks and Open Spaces Law Library
Liquor Law Enforcement
AssetsCash and cash equivalents 368,110$ 211,154$ 77,890$ Receivables:
Investment earnings 425 787 - Accounts 254,726 - 592 Intergovernmental 173,720 - -
Total assets 796,981 211,941 78,482
Total assets and deferred outflows of resources 796,981$ 211,941$ 78,482$
LiabilitiesAccounts payable 115,909$ 1,463$ -$ Wages and benefits payable 30,917 1,980 - Due to other funds 14,932 1,422 - Interfund loans payable 20,000 - - Total liabilities 181,758 4,865 -
Fund balancesRestricted - 206,154 - Assigned 615,223 922 78,482 Total fund balances 615,223 207,076 78,482 Total liabilities, deferred inflows of resources, and fund balances 796,981$ 211,941$ 78,482$
104
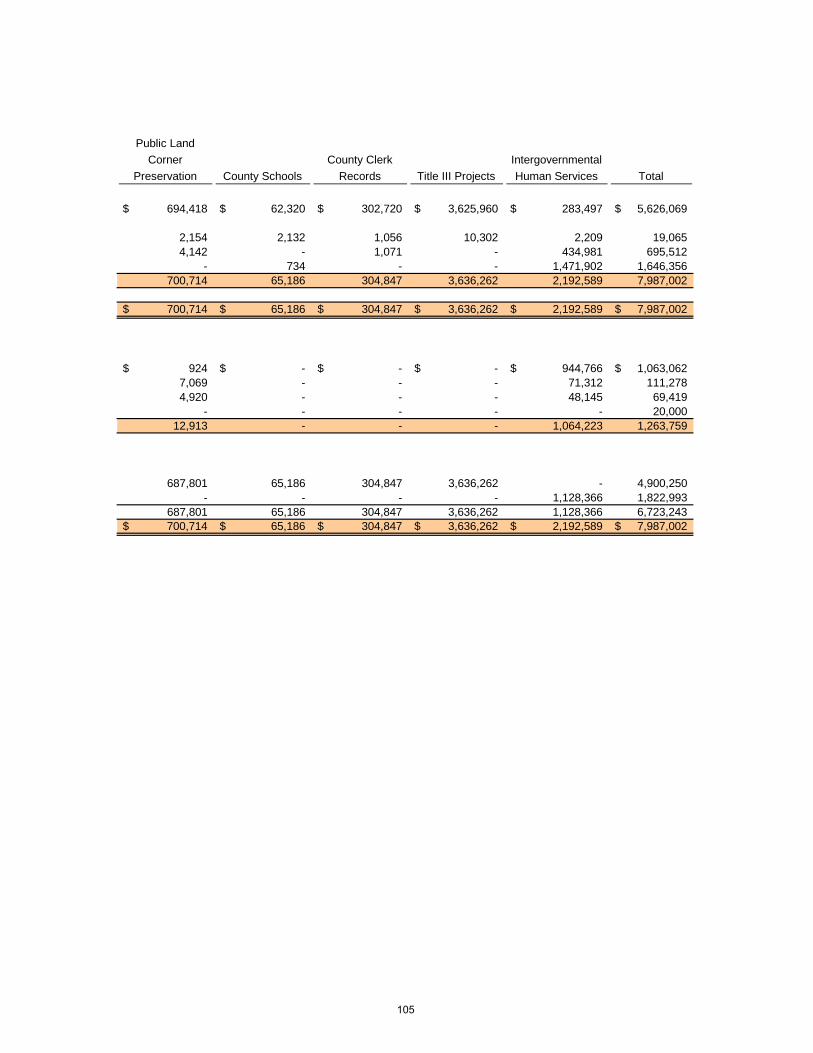
Public Land Corner
Preservation County SchoolsCounty Clerk
Records Title III ProjectsIntergovernmental Human Services Total
694,418$ 62,320$ 302,720$ 3,625,960$ 283,497$ 5,626,069$
2,154 2,132 1,056 10,302 2,209 19,065 4,142 - 1,071 - 434,981 695,512
- 734 - - 1,471,902 1,646,356 700,714 65,186 304,847 3,636,262 2,192,589 7,987,002
700,714$ 65,186$ 304,847$ 3,636,262$ 2,192,589$ 7,987,002$
924$ -$ -$ -$ 944,766$ 1,063,062$ 7,069 - - - 71,312 111,278 4,920 - - - 48,145 69,419
- - - - - 20,000 12,913 - - - 1,064,223 1,263,759
687,801 65,186 304,847 3,636,262 - 4,900,250 - - - - 1,128,366 1,822,993
687,801 65,186 304,847 3,636,262 1,128,366 6,723,243 700,714$ 65,186$ 304,847$ 3,636,262$ 2,192,589$ 7,987,002$
105
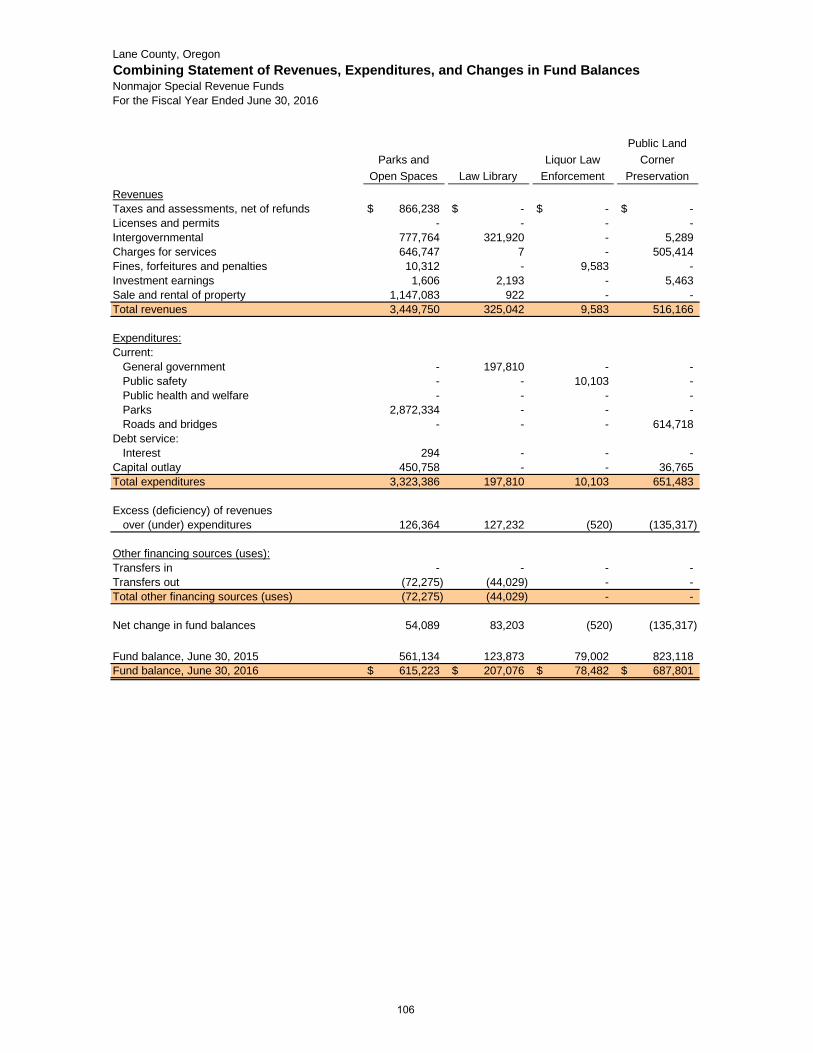
Lane County, OregonCombining Statement of Revenues, Expenditures, and Changes in Fund BalancesNonmajor Special Revenue FundsFor the Fiscal Year Ended June 30, 2016
Parks and Open Spaces Law Library
Liquor Law Enforcement
Public Land Corner
PreservationRevenuesTaxes and assessments, net of refunds 866,238$ -$ -$ -$ Licenses and permits - - - - Intergovernmental 777,764 321,920 - 5,289 Charges for services 646,747 7 - 505,414 Fines, forfeitures and penalties 10,312 - 9,583 - Investment earnings 1,606 2,193 - 5,463 Sale and rental of property 1,147,083 922 - - Total revenues 3,449,750 325,042 9,583 516,166
Expenditures:Current:
General government - 197,810 - - Public safety - - 10,103 - Public health and welfare - - - - Parks 2,872,334 - - - Roads and bridges - - - 614,718
Debt service:Interest 294 - - -
Capital outlay 450,758 - - 36,765 Total expenditures 3,323,386 197,810 10,103 651,483
Excess (deficiency) of revenuesover (under) expenditures 126,364 127,232 (520) (135,317)
Other financing sources (uses):Transfers in - - - - Transfers out (72,275) (44,029) - - Total other financing sources (uses) (72,275) (44,029) - -
Net change in fund balances 54,089 83,203 (520) (135,317)
Fund balance, June 30, 2015 561,134 123,873 79,002 823,118 Fund balance, June 30, 2016 615,223$ 207,076$ 78,482$ 687,801$
106
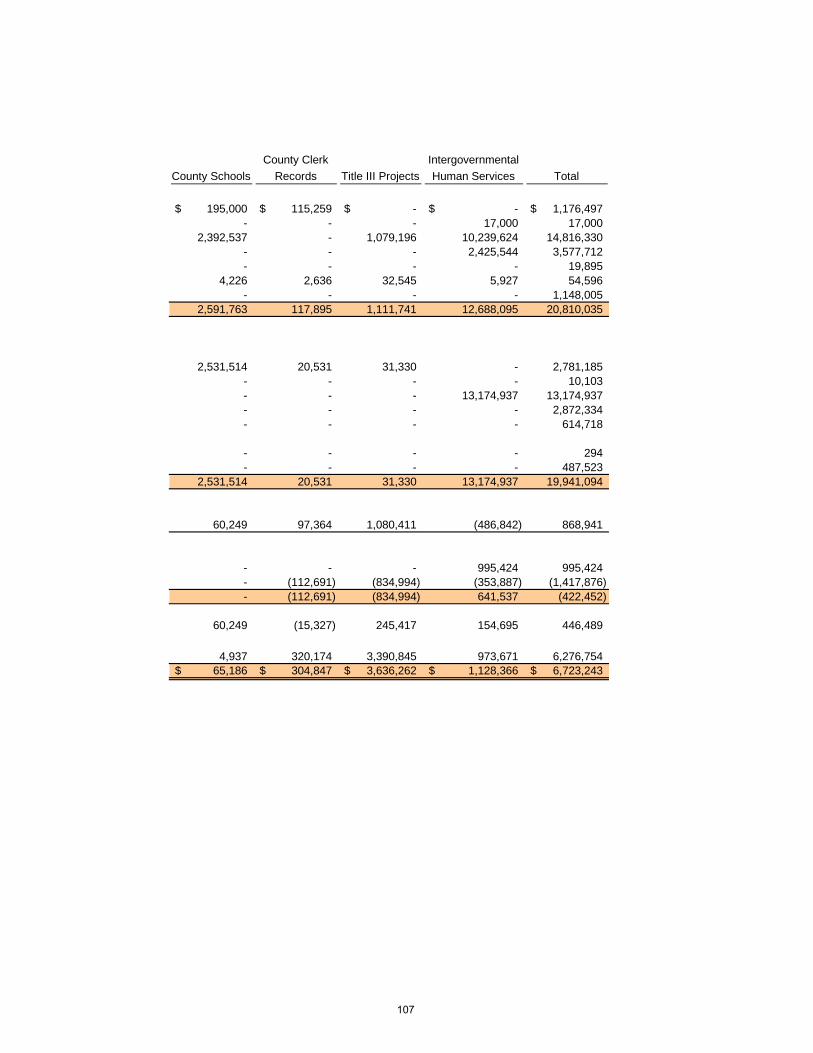
County SchoolsCounty Clerk
Records Title III ProjectsIntergovernmental Human Services Total
195,000$ 115,259$ -$ -$ 1,176,497$ - - - 17,000 17,000
2,392,537 - 1,079,196 10,239,624 14,816,330 - - - 2,425,544 3,577,712 - - - - 19,895
4,226 2,636 32,545 5,927 54,596 - - - - 1,148,005
2,591,763 117,895 1,111,741 12,688,095 20,810,035
2,531,514 20,531 31,330 - 2,781,185 - - - - 10,103 - - - 13,174,937 13,174,937 - - - - 2,872,334 - - - - 614,718
- - - - 294 - - - - 487,523
2,531,514 20,531 31,330 13,174,937 19,941,094
60,249 97,364 1,080,411 (486,842) 868,941
- - - 995,424 995,424 - (112,691) (834,994) (353,887) (1,417,876) - (112,691) (834,994) 641,537 (422,452)
60,249 (15,327) 245,417 154,695 446,489
4,937 320,174 3,390,845 973,671 6,276,754 65,186$ 304,847$ 3,636,262$ 1,128,366$ 6,723,243$
107
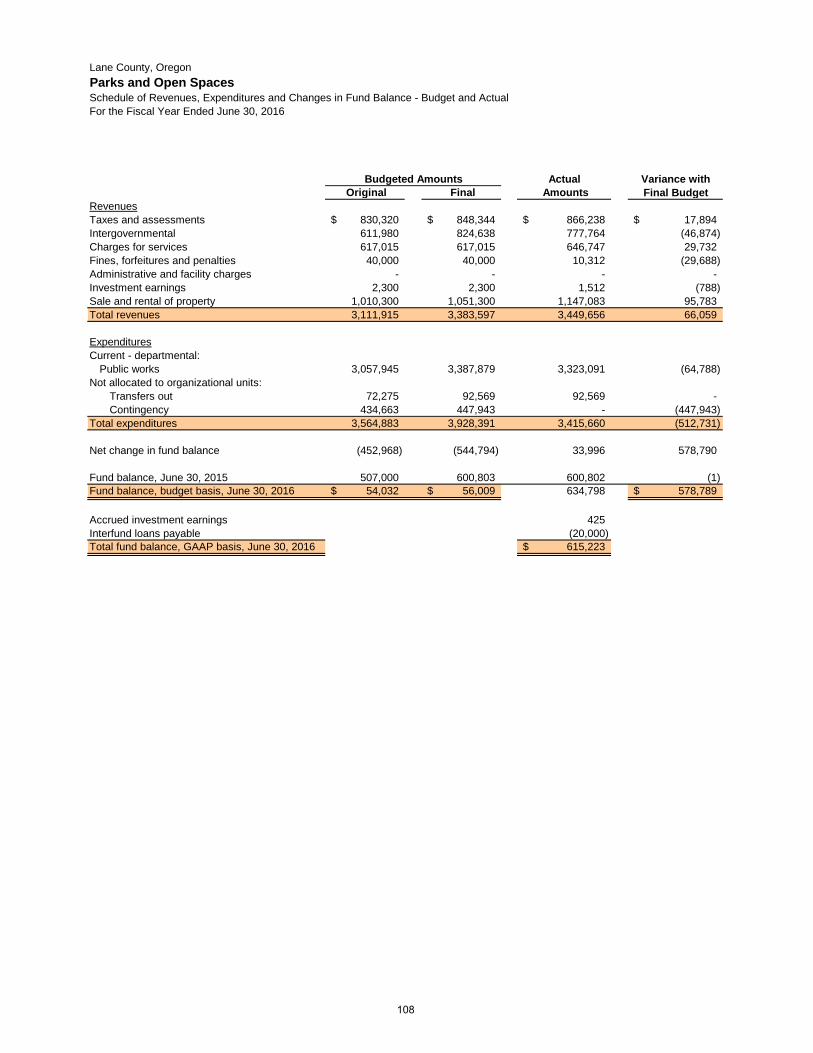
Lane County, OregonParks and Open SpacesSchedule of Revenues, Expenditures and Changes in Fund Balance - Budget and ActualFor the Fiscal Year Ended June 30, 2016
Actual Variance with Original Final Amounts Final Budget
RevenuesTaxes and assessments 830,320$ 848,344$ 866,238$ 17,894$ Intergovernmental 611,980 824,638 777,764 (46,874) Charges for services 617,015 617,015 646,747 29,732 Fines, forfeitures and penalties 40,000 40,000 10,312 (29,688) Administrative and facility charges - - - - Investment earnings 2,300 2,300 1,512 (788) Sale and rental of property 1,010,300 1,051,300 1,147,083 95,783 Total revenues 3,111,915 3,383,597 3,449,656 66,059
ExpendituresCurrent - departmental:
Public works 3,057,945 3,387,879 3,323,091 (64,788) Not allocated to organizational units:
Transfers out 72,275 92,569 92,569 - Contingency 434,663 447,943 - (447,943)
Total expenditures 3,564,883 3,928,391 3,415,660 (512,731)
Net change in fund balance (452,968) (544,794) 33,996 578,790
Fund balance, June 30, 2015 507,000 600,803 600,802 (1) Fund balance, budget basis, June 30, 2016 54,032$ 56,009$ 634,798 578,789$
Accrued investment earnings 425 Interfund loans payable (20,000) Total fund balance, GAAP basis, June 30, 2016 615,223$
Budgeted Amounts
108

Lane County, OregonLaw LibrarySchedule of Revenues, Expenditures and Changes in Fund Balance - Budget and ActualFor the Fiscal Year Ended June 30, 2016
Actual Variance with Original Final Amounts Final Budget
RevenuesIntergovernmental 292,000$ 321,920$ 321,920$ - Charges for services - - 7 7 Investment earnings 2,000 2,000 1,869 (131) Sale and rental of property - - 922 922 Total revenues 294,000 323,920 324,718 798
ExpendituresCurrent - departmental:
County administration 203,720 214,258 197,810 (16,448) Not allocated to organizational units: -
Transfers out - 52,849 44,029 (8,820) Contingency 14,700 14,700 - (14,700)
Total expenditures 218,420 281,807 241,839 (39,968)
Net change in fund balance 75,580 42,113 82,879 40,766
Fund balance, June 30, 2015 123,000 123,410 123,410 - Fund balance, budget basis, June 30, 2016 198,580$ 165,523$ 206,289 40,766$
Accrued investment earnings 787 Total fund balance, GAAP basis, June 30, 2016 207,076$
Budgeted Amounts
109

Lane County, OregonLiquor Law EnforcementSchedule of Revenues, Expenditures and Changes in Fund Balance - Budget and ActualFor the Fiscal Year Ended June 30, 2016
Actual Variance with Original Final Amounts Final Budget
RevenuesFines, forfeitures and penalties 2,900$ 2,900$ 9,583$ 6,683$ Total revenues 2,900 2,900 9,583 6,683
ExpendituresCurrent - departmental:
District attorney 12,603 32,605 10,103 (22,502) Not allocated to organizational units:
Contingency 29,297 49,297 - (49,297) Total expenditures 41,900 81,902 10,103 (71,799)
Net change in fund balance (39,000) (79,002) (520) 78,482
Fund balance, June 30, 2015 39,000 79,002 79,002 - Fund balance, budget basis, June 30, 2016 -$ -$ 78,482$ 78,482$
Budgeted Amounts
110
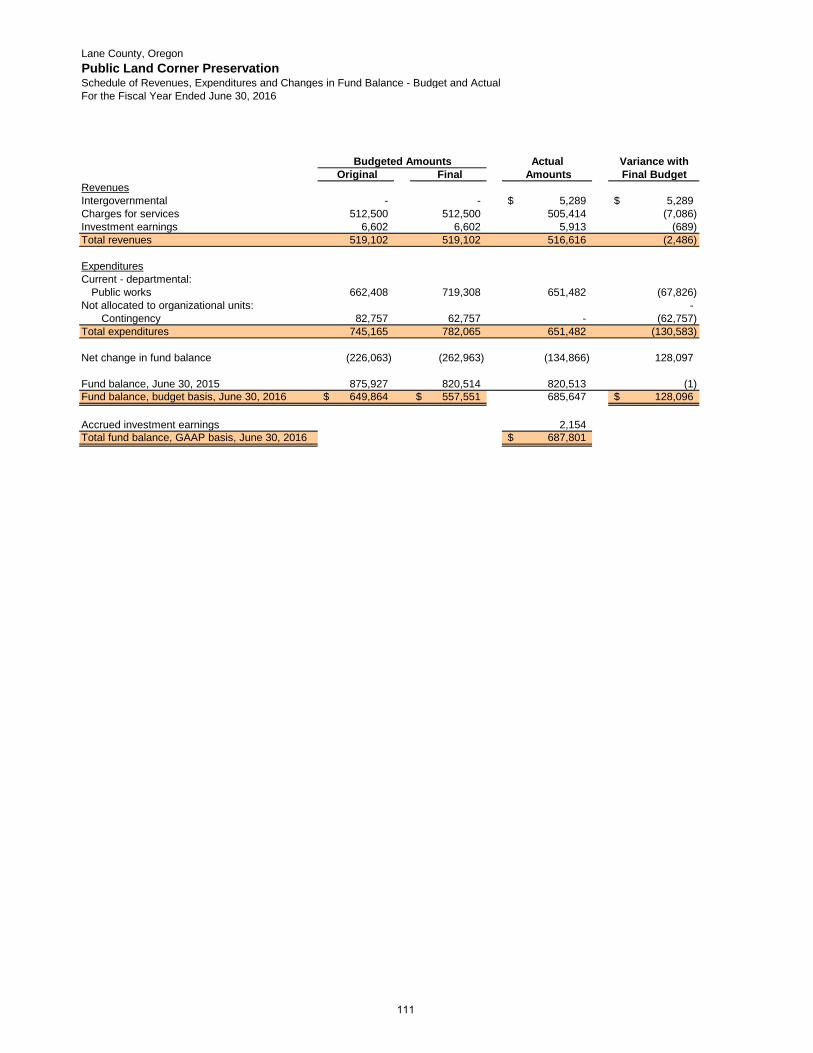
Lane County, OregonPublic Land Corner PreservationSchedule of Revenues, Expenditures and Changes in Fund Balance - Budget and ActualFor the Fiscal Year Ended June 30, 2016
Actual Variance with Original Final Amounts Final Budget
RevenuesIntergovernmental - - 5,289$ 5,289$ Charges for services 512,500 512,500 505,414 (7,086) Investment earnings 6,602 6,602 5,913 (689) Total revenues 519,102 519,102 516,616 (2,486)
ExpendituresCurrent - departmental:
Public works 662,408 719,308 651,482 (67,826) Not allocated to organizational units: -
Contingency 82,757 62,757 - (62,757) Total expenditures 745,165 782,065 651,482 (130,583)
Net change in fund balance (226,063) (262,963) (134,866) 128,097
Fund balance, June 30, 2015 875,927 820,514 820,513 (1) Fund balance, budget basis, June 30, 2016 649,864$ 557,551$ 685,647 128,096$
Accrued investment earnings 2,154 Total fund balance, GAAP basis, June 30, 2016 687,801$
Budgeted Amounts
111
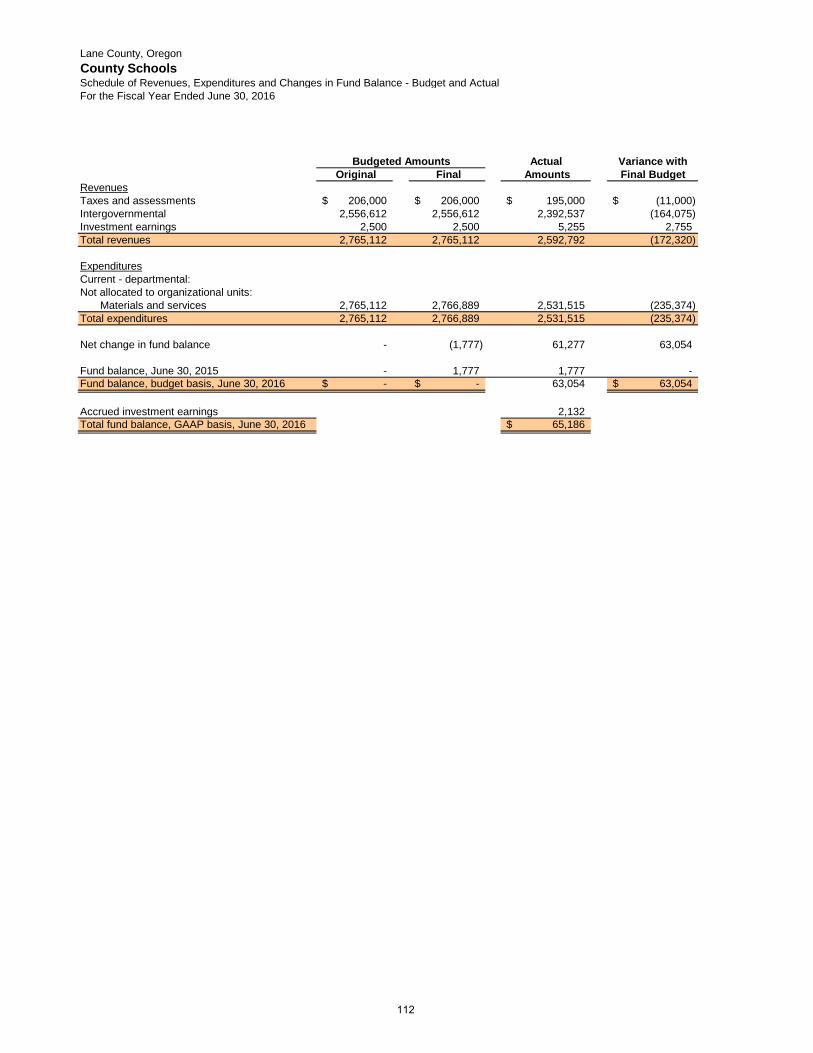
Lane County, OregonCounty SchoolsSchedule of Revenues, Expenditures and Changes in Fund Balance - Budget and ActualFor the Fiscal Year Ended June 30, 2016
Actual Variance with Original Final Amounts Final Budget
RevenuesTaxes and assessments 206,000$ 206,000$ 195,000$ (11,000)$ Intergovernmental 2,556,612 2,556,612 2,392,537 (164,075) Investment earnings 2,500 2,500 5,255 2,755 Total revenues 2,765,112 2,765,112 2,592,792 (172,320)
ExpendituresCurrent - departmental:Not allocated to organizational units:
Materials and services 2,765,112 2,766,889 2,531,515 (235,374) Total expenditures 2,765,112 2,766,889 2,531,515 (235,374)
Net change in fund balance - (1,777) 61,277 63,054
Fund balance, June 30, 2015 - 1,777 1,777 - Fund balance, budget basis, June 30, 2016 -$ -$ 63,054 63,054$
Accrued investment earnings 2,132 Total fund balance, GAAP basis, June 30, 2016 65,186$
Budgeted Amounts
112

Lane County, OregonCounty Clerk RecordsSchedule of Revenues, Expenditures and Changes in Fund Balance - Budget and ActualFor the Fiscal Year Ended June 30, 2016
Actual Variance with Original Final Amounts Final Budget
RevenuesTaxes and assessments 93,000$ 93,000$ 115,259$ 22,259$ Investment earnings 2,000 2,000 2,554 554 Total revenues 95,000 95,000 117,813 22,813
ExpendituresCurrent - departmental:
County administration 53,709 53,709 20,531 (33,178) Not allocated to organizational units:
Transfers out 112,691 112,691 112,691 - Contingency 229,700 247,800 - (247,800)
Total expenditures 396,100 414,200 133,222 (280,978)
Net change in fund balance (301,100) (319,200) (15,409) 303,791
Fund balance, June 30, 2015 301,100 319,200 319,200 - Fund balance, budget basis, June 30, 2016 -$ -$ 303,791 303,791$
Accrued investment earnings 1,056 Total fund balance, GAAP basis, June 30, 2016 304,847$
Budgeted Amounts
113
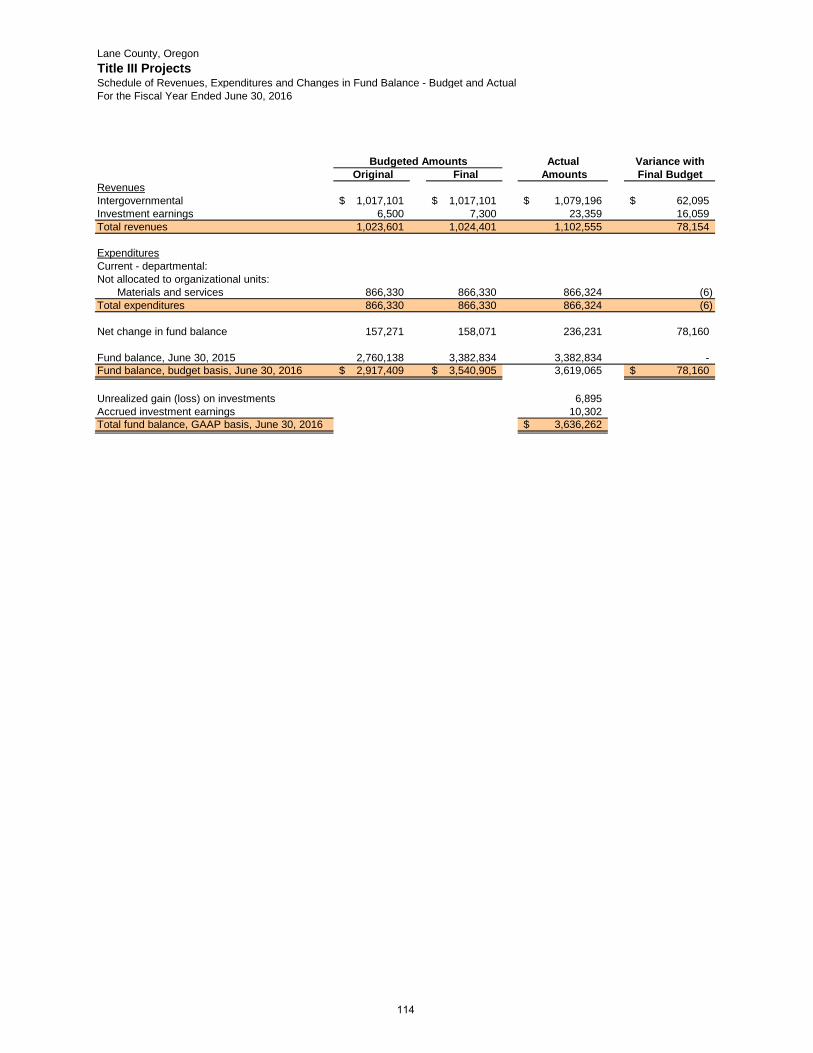
Lane County, OregonTitle III ProjectsSchedule of Revenues, Expenditures and Changes in Fund Balance - Budget and ActualFor the Fiscal Year Ended June 30, 2016
Actual Variance with Original Final Amounts Final Budget
RevenuesIntergovernmental 1,017,101$ 1,017,101$ 1,079,196$ 62,095$ Investment earnings 6,500 7,300 23,359 16,059 Total revenues 1,023,601 1,024,401 1,102,555 78,154
ExpendituresCurrent - departmental:Not allocated to organizational units:
Materials and services 866,330 866,330 866,324 (6) Total expenditures 866,330 866,330 866,324 (6)
Net change in fund balance 157,271 158,071 236,231 78,160
Fund balance, June 30, 2015 2,760,138 3,382,834 3,382,834 - Fund balance, budget basis, June 30, 2016 2,917,409$ 3,540,905$ 3,619,065 78,160$
Unrealized gain (loss) on investments 6,895 Accrued investment earnings 10,302 Total fund balance, GAAP basis, June 30, 2016 3,636,262$
Budgeted Amounts
114
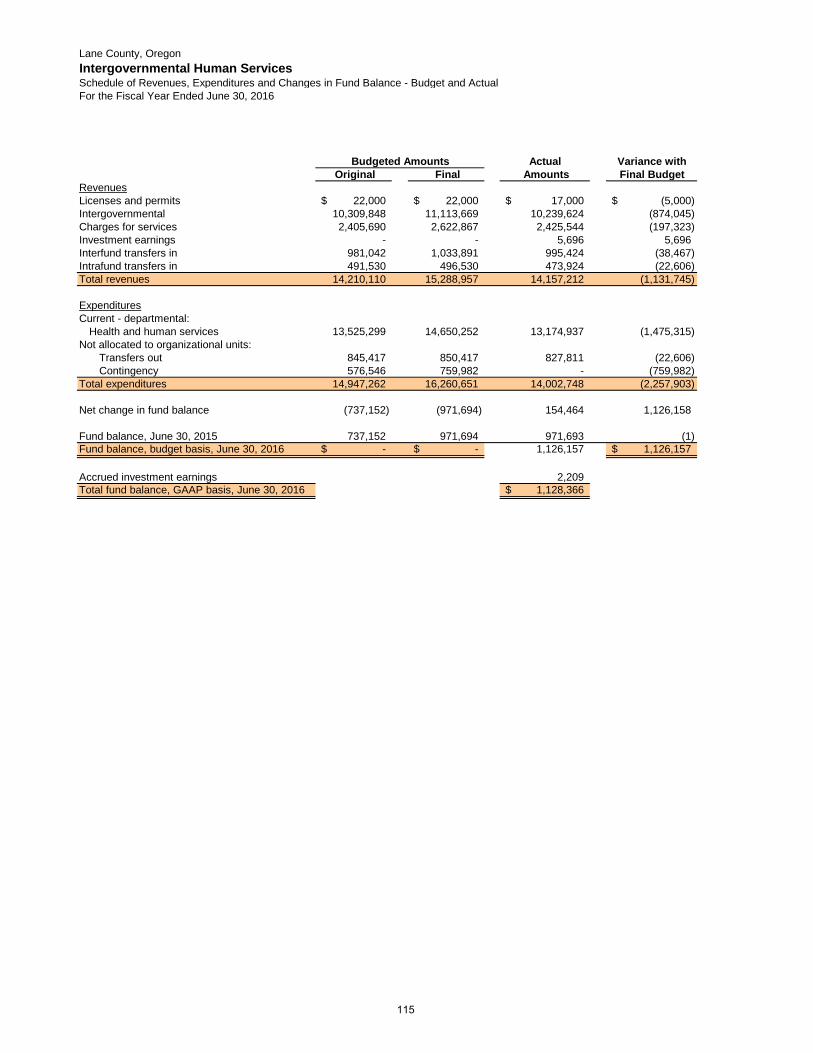
Lane County, OregonIntergovernmental Human ServicesSchedule of Revenues, Expenditures and Changes in Fund Balance - Budget and ActualFor the Fiscal Year Ended June 30, 2016
Actual Variance with Original Final Amounts Final Budget
RevenuesLicenses and permits 22,000$ 22,000$ 17,000$ (5,000)$ Intergovernmental 10,309,848 11,113,669 10,239,624 (874,045) Charges for services 2,405,690 2,622,867 2,425,544 (197,323) Investment earnings - - 5,696 5,696 Interfund transfers in 981,042 1,033,891 995,424 (38,467) Intrafund transfers in 491,530 496,530 473,924 (22,606) Total revenues 14,210,110 15,288,957 14,157,212 (1,131,745)
ExpendituresCurrent - departmental:
Health and human services 13,525,299 14,650,252 13,174,937 (1,475,315) Not allocated to organizational units:
Transfers out 845,417 850,417 827,811 (22,606) Contingency 576,546 759,982 - (759,982)
Total expenditures 14,947,262 16,260,651 14,002,748 (2,257,903)
Net change in fund balance (737,152) (971,694) 154,464 1,126,158
Fund balance, June 30, 2015 737,152 971,694 971,693 (1) Fund balance, budget basis, June 30, 2016 -$ -$ 1,126,157 1,126,157$
Accrued investment earnings 2,209 Total fund balance, GAAP basis, June 30, 2016 1,128,366$
Budgeted Amounts
115

116

DEBT SERVICE FUNDS None of the County’s debt service funds meet the criteria for major fund reporting. Therefore, the combining statements for all individual debt service funds are reported in this section. The combined totals are reported in the combining nonmajor governmental fund statements. Schedules of Revenues, Expenditures, and Changes in Fund Balances – Budget and Actual are also presented in this section for each individual debt service fund. Nonmajor Debt Service Funds
Lane Events Center Debt Service Fund – This fund accounts for the accumulation of resources for and payment of debt service for the construction and renovation of selected facilities at the Fairgrounds site. Fund resources come from County transient room tax receipts. Special Obligation Bond Retirement Fund – This fund accounts for the accumulation of resources for and payment of interest and principal on bonds sold to finance capital improvements and equipment purchases, using pledged revenue as the source of repayment. The sources of funding for the debt service payments are General Fund, Health and Human Services, Trillium Behavioral Health, Parks and Open Spaces, Road, and Capital Improvement transfers. Notes Payable Debt Service Fund – This fund accounts for the accumulation of resources for and the payment of interest and principal to retire notes issued to finance the Information Services data center remodel. These notes are held by the Department of Energy (ODOE).
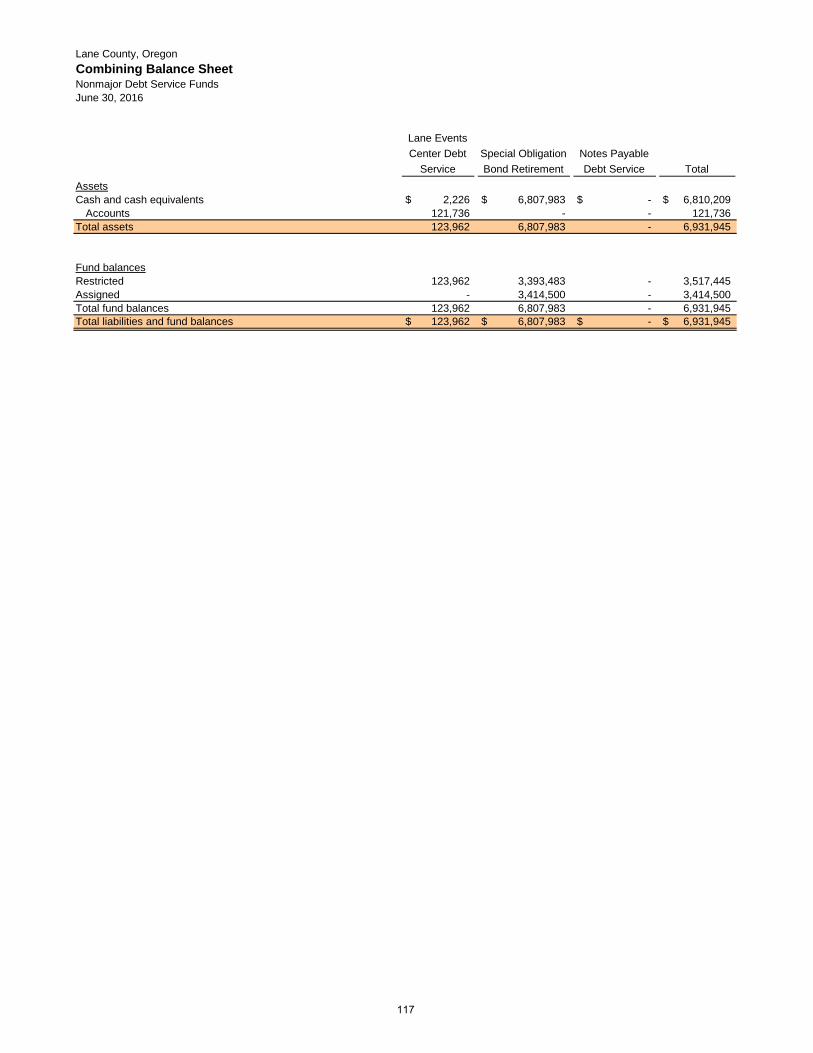
Lane County, OregonCombining Balance SheetNonmajor Debt Service FundsJune 30, 2016
Lane Events Center Debt
ServiceSpecial Obligation Bond Retirement
Notes Payable Debt Service Total
AssetsCash and cash equivalents 2,226$ 6,807,983$ -$ 6,810,209$
Accounts 121,736 - - 121,736 Total assets 123,962 6,807,983 - 6,931,945
Fund balancesRestricted 123,962 3,393,483 - 3,517,445 Assigned - 3,414,500 - 3,414,500 Total fund balances 123,962 6,807,983 - 6,931,945 Total liabilities and fund balances 123,962$ 6,807,983$ -$ 6,931,945$
117
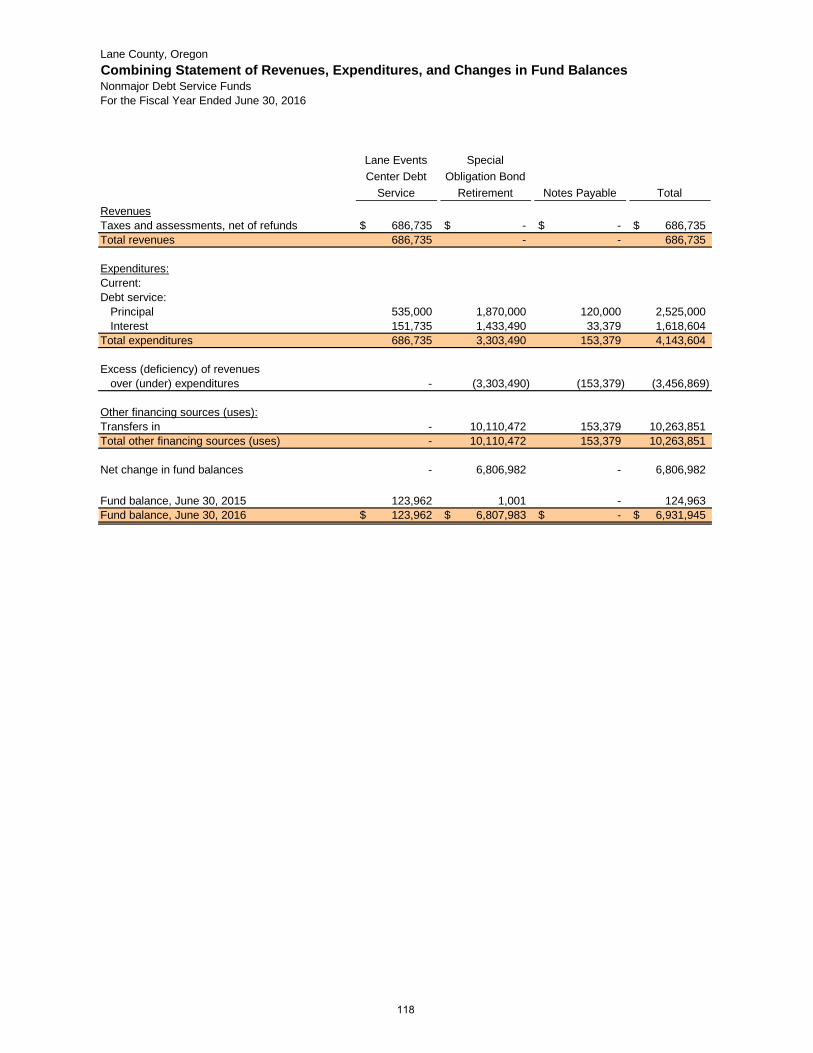
Lane County, OregonCombining Statement of Revenues, Expenditures, and Changes in Fund BalancesNonmajor Debt Service FundsFor the Fiscal Year Ended June 30, 2016
Lane Events Center Debt
Service
Special Obligation Bond
Retirement Notes Payable TotalRevenuesTaxes and assessments, net of refunds 686,735$ -$ -$ 686,735$ Total revenues 686,735 - - 686,735
Expenditures:Current:Debt service:
Principal 535,000 1,870,000 120,000 2,525,000 Interest 151,735 1,433,490 33,379 1,618,604
Total expenditures 686,735 3,303,490 153,379 4,143,604
Excess (deficiency) of revenuesover (under) expenditures - (3,303,490) (153,379) (3,456,869)
Other financing sources (uses):Transfers in - 10,110,472 153,379 10,263,851 Total other financing sources (uses) - 10,110,472 153,379 10,263,851
Net change in fund balances - 6,806,982 - 6,806,982
Fund balance, June 30, 2015 123,962 1,001 - 124,963 Fund balance, June 30, 2016 123,962$ 6,807,983$ -$ 6,931,945$
118
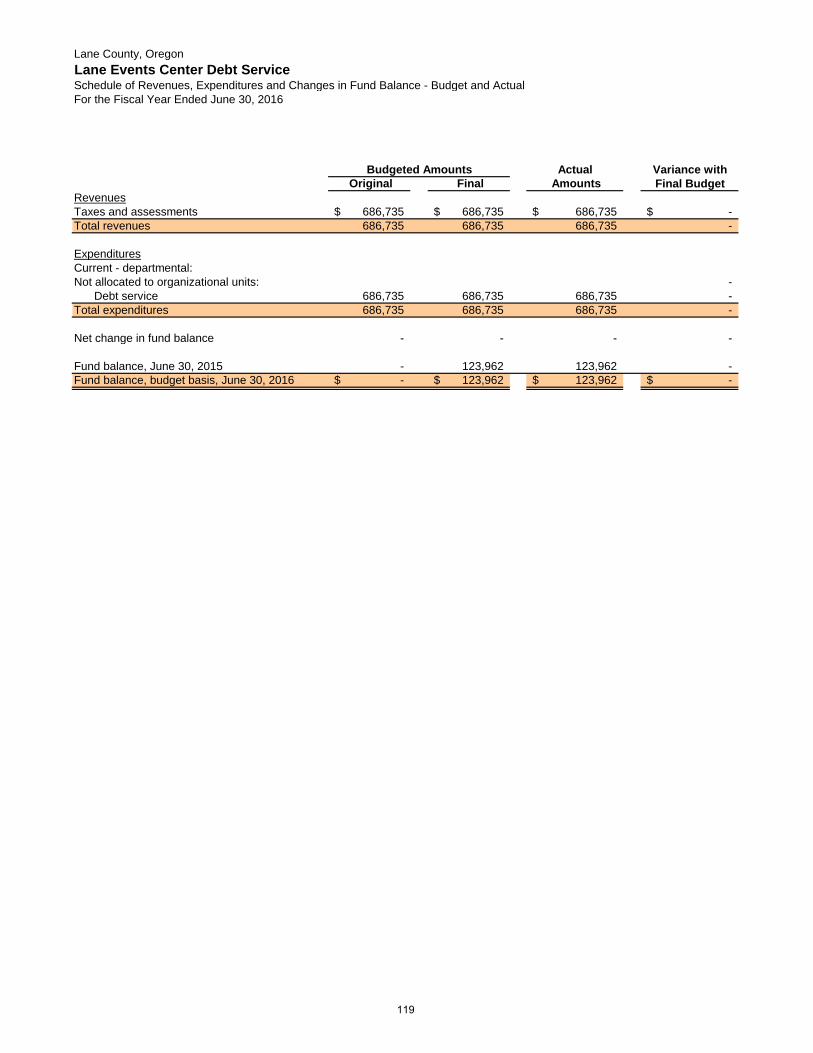
Lane County, OregonLane Events Center Debt ServiceSchedule of Revenues, Expenditures and Changes in Fund Balance - Budget and ActualFor the Fiscal Year Ended June 30, 2016
Actual Variance with Original Final Amounts Final Budget
RevenuesTaxes and assessments 686,735$ 686,735$ 686,735$ -$ Total revenues 686,735 686,735 686,735 -
ExpendituresCurrent - departmental:Not allocated to organizational units: -
Debt service 686,735 686,735 686,735 - Total expenditures 686,735 686,735 686,735 -
Net change in fund balance - - - -
Fund balance, June 30, 2015 - 123,962 123,962 - Fund balance, budget basis, June 30, 2016 -$ 123,962$ 123,962$ -$
Budgeted Amounts
119
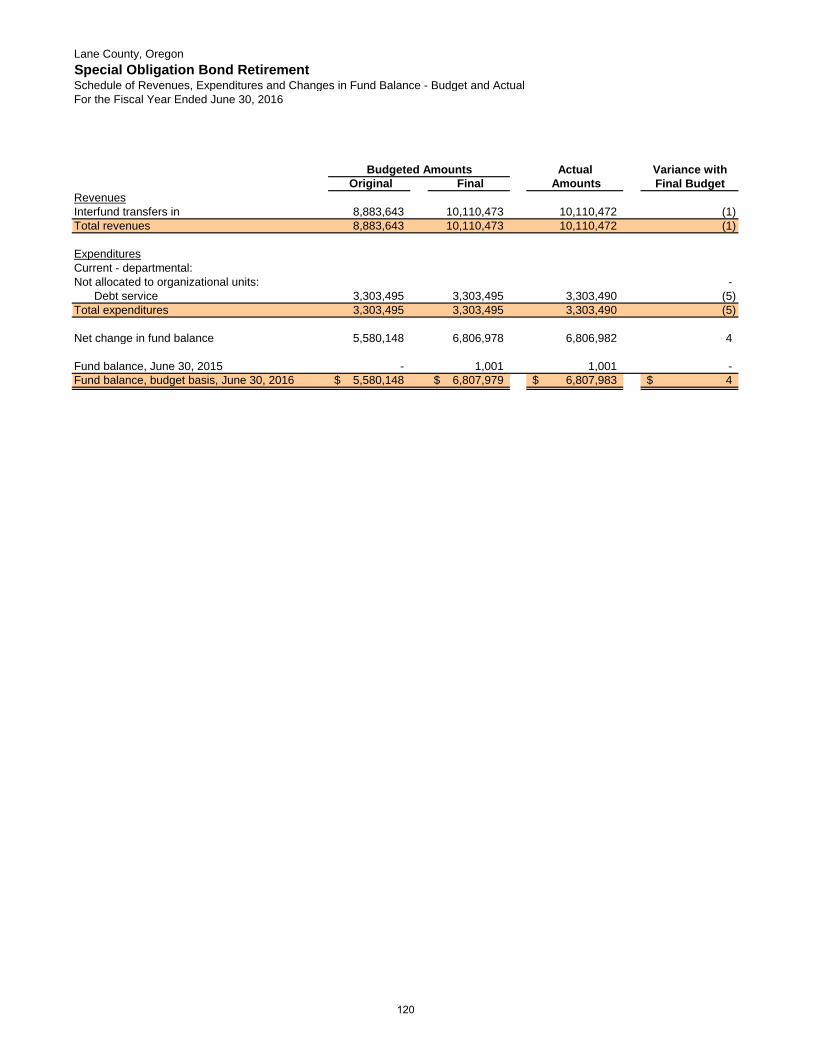
Lane County, OregonSpecial Obligation Bond RetirementSchedule of Revenues, Expenditures and Changes in Fund Balance - Budget and ActualFor the Fiscal Year Ended June 30, 2016
Actual Variance with Original Final Amounts Final Budget
RevenuesInterfund transfers in 8,883,643 10,110,473 10,110,472 (1) Total revenues 8,883,643 10,110,473 10,110,472 (1)
ExpendituresCurrent - departmental:Not allocated to organizational units: -
Debt service 3,303,495 3,303,495 3,303,490 (5) Total expenditures 3,303,495 3,303,495 3,303,490 (5)
Net change in fund balance 5,580,148 6,806,978 6,806,982 4
Fund balance, June 30, 2015 - 1,001 1,001 - Fund balance, budget basis, June 30, 2016 5,580,148$ 6,807,979$ 6,807,983$ 4$
Budgeted Amounts
120

Lane County, OregonNotes Payable Debt ServiceSchedule of Revenues, Expenditures and Changes in Fund Balance - Budget and ActualFor the Fiscal Year Ended June 30, 2016
Actual Variance with Original Final Amounts Final Budget
RevenuesInterfund transfers in 200,973$ 200,973$ 153,379$ (47,594)$ Total revenues 200,973 200,973 153,379 (47,594)
ExpendituresCurrent - departmental:Not allocated to organizational units: -
Debt service 200,973 200,973 153,379 (47,594) Total expenditures 200,973 200,973 153,379 (47,594)
Net change in fund balance - - - -
Fund balance, June 30, 2015 - - - - Fund balance, budget basis, June 30, 2016 -$ -$ -$ -$
Budgeted Amounts
121

122
CAPITAL PROJECTS FUNDS None of the County’s capital projects funds meet the criteria for major fund reporting. Therefore, the combining statements for all individual capital projects funds are reported in this section. The combined totals are reported in the combining nonmajor governmental fund statements. Schedules of Revenues, Expenditures, and Changes in Fund Balances – Budget and Actual are also presented in this section for each individual capital project fund. Nonmajor Capital Projects Funds Capital Improvements Fund – This fund receives proceeds from the sale of County property and internal receipts through the County’s indirect cost allocation plan for major capital improvements and equipment. Juvenile Justice Center Construction Fund – This fund accounts for the construction of a Juvenile Justice Center, which was financed by a $38.9 million voter-approved general obligation bonds issued in 1995. The project included a new detention facility, courtroom, and two residential facilities.
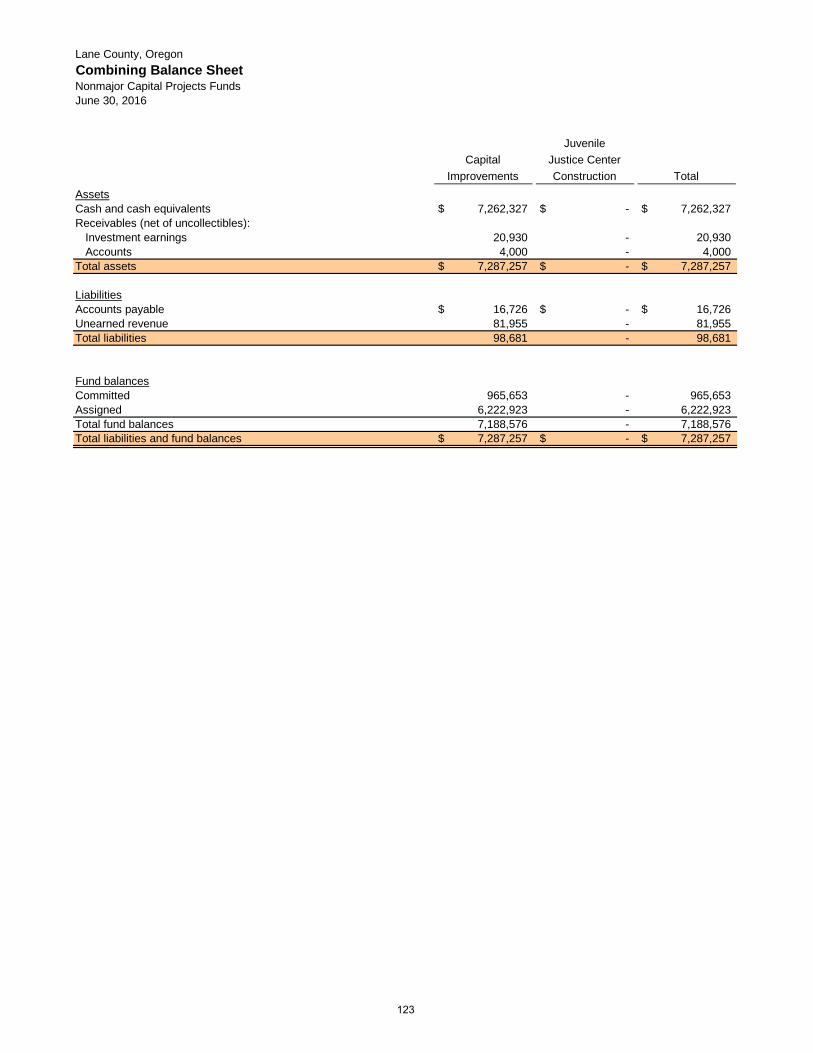
Lane County, OregonCombining Balance SheetNonmajor Capital Projects FundsJune 30, 2016
Capital Improvements
JuvenileJustice Center Construction Total
AssetsCash and cash equivalents 7,262,327$ -$ 7,262,327$ Receivables (net of uncollectibles):
Investment earnings 20,930 - 20,930 Accounts 4,000 - 4,000
Total assets 7,287,257$ -$ 7,287,257$
LiabilitiesAccounts payable 16,726$ -$ 16,726$ Unearned revenue 81,955 - 81,955 Total liabilities 98,681 - 98,681
Fund balancesCommitted 965,653 - 965,653 Assigned 6,222,923 - 6,222,923 Total fund balances 7,188,576 - 7,188,576 Total liabilities and fund balances 7,287,257$ -$ 7,287,257$
123

Lane County, OregonCombining Statement of Revenues, Expenditures, and Changes in Fund BalancesNonmajor Capital Projects FundsFor the Fiscal Year Ended June 30, 2016
Capital Improvements
Juvenile Justice Center
Construction TotalRevenuesIntergovernmental 147,768$ -$ 147,768$ Charges for services 148,268 - 148,268 Administrative and facility charges 3,021,347 - 3,021,347 Investment earnings 68,467 (1,431) 67,036 Sale and rental of property 39,600 - 39,600 Total revenues 3,425,450 (1,431) 3,424,019
Expenditures:Current:
General government 1,144,053 - 1,144,053 Public safety - 5,752 5,752
Capital outlay 2,120,457 423,981 2,544,438 Total expenditures 3,264,510 429,733 3,694,243
Excess (deficiency) of revenuesover (under) expenditures 160,940 (431,164) (270,224)
Other financing sources (uses):Transfers out (606,341) - (606,341) Total other financing sources (uses) (606,341) - (606,341)
Net change in fund balances (445,401) (431,164) (876,565)
Fund balance, June 30, 2015 7,633,977 431,164 8,065,141 Fund balance, June 30, 2016 7,188,576$ -$ 7,188,576$
124
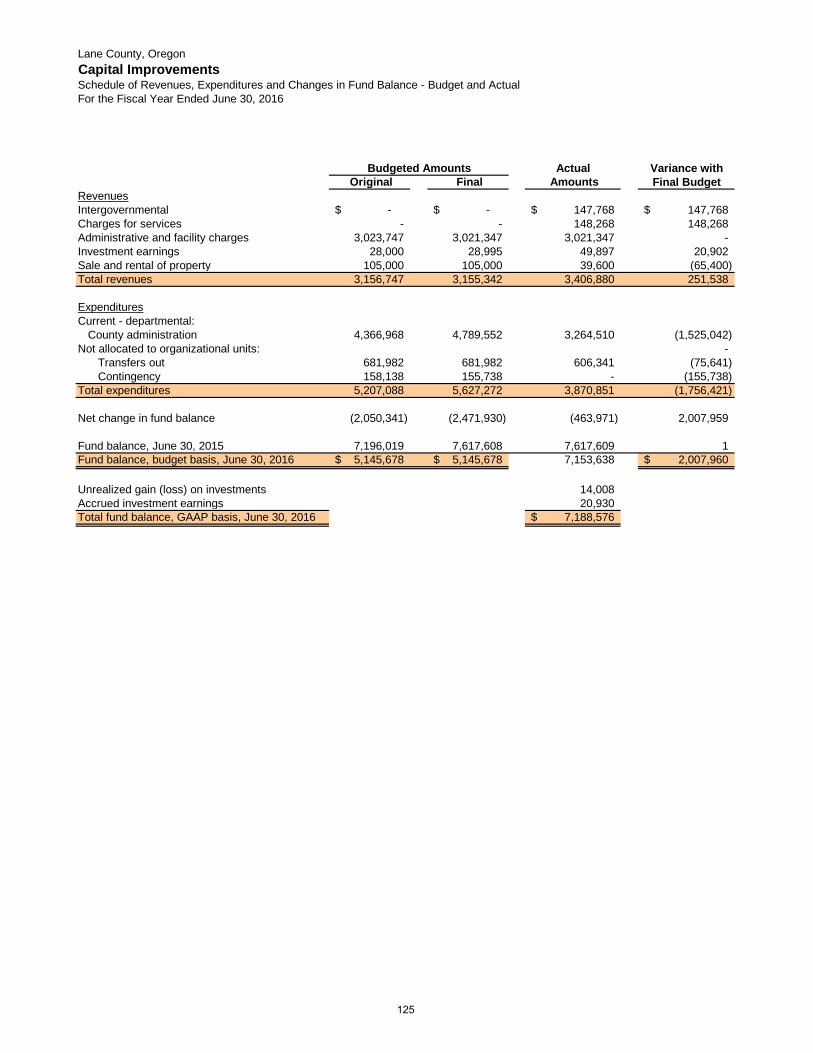
Lane County, OregonCapital ImprovementsSchedule of Revenues, Expenditures and Changes in Fund Balance - Budget and ActualFor the Fiscal Year Ended June 30, 2016
Actual Variance with Original Final Amounts Final Budget
RevenuesIntergovernmental -$ -$ 147,768$ 147,768$ Charges for services - - 148,268 148,268 Administrative and facility charges 3,023,747 3,021,347 3,021,347 - Investment earnings 28,000 28,995 49,897 20,902 Sale and rental of property 105,000 105,000 39,600 (65,400) Total revenues 3,156,747 3,155,342 3,406,880 251,538
ExpendituresCurrent - departmental:
County administration 4,366,968 4,789,552 3,264,510 (1,525,042) Not allocated to organizational units: -
Transfers out 681,982 681,982 606,341 (75,641) Contingency 158,138 155,738 - (155,738)
Total expenditures 5,207,088 5,627,272 3,870,851 (1,756,421)
Net change in fund balance (2,050,341) (2,471,930) (463,971) 2,007,959
Fund balance, June 30, 2015 7,196,019 7,617,608 7,617,609 1 Fund balance, budget basis, June 30, 2016 5,145,678$ 5,145,678$ 7,153,638 2,007,960$
Unrealized gain (loss) on investments 14,008 Accrued investment earnings 20,930 Total fund balance, GAAP basis, June 30, 2016 7,188,576$
Budgeted Amounts
125
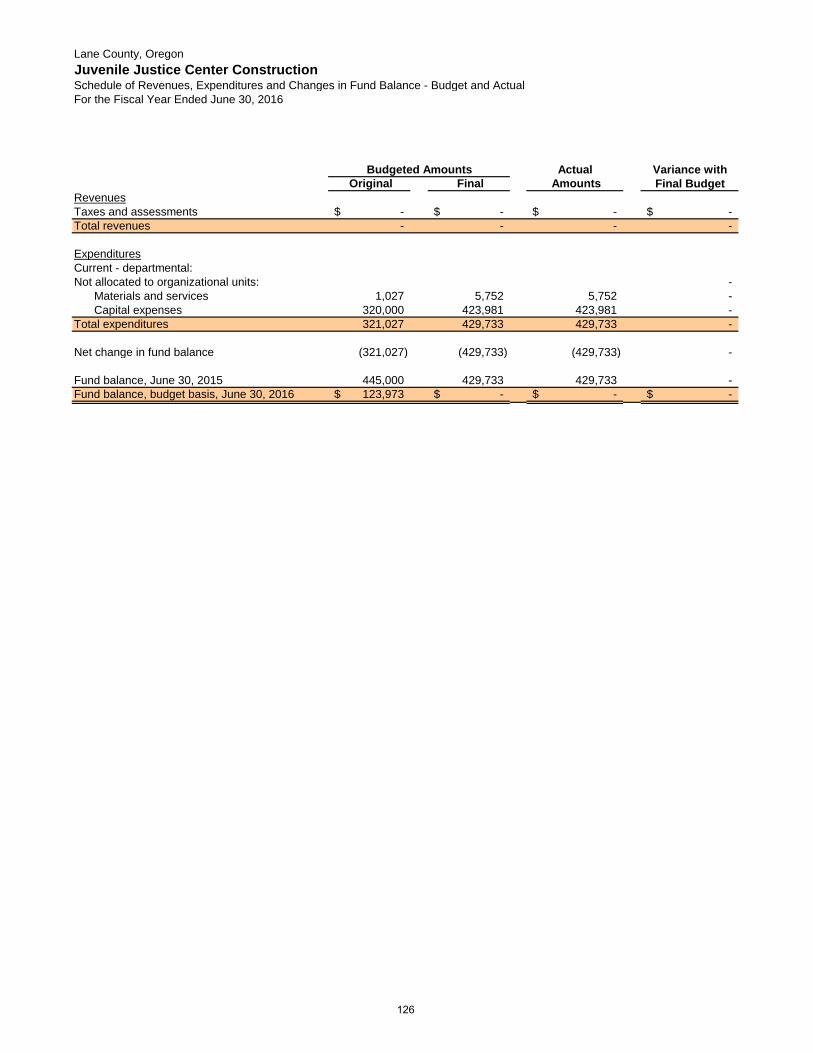
Lane County, OregonJuvenile Justice Center ConstructionSchedule of Revenues, Expenditures and Changes in Fund Balance - Budget and ActualFor the Fiscal Year Ended June 30, 2016
Actual Variance with Original Final Amounts Final Budget
RevenuesTaxes and assessments -$ -$ -$ -$ Total revenues - - - -
ExpendituresCurrent - departmental:Not allocated to organizational units: -
Materials and services 1,027 5,752 5,752 - Capital expenses 320,000 423,981 423,981 -
Total expenditures 321,027 429,733 429,733 -
Net change in fund balance (321,027) (429,733) (429,733) -
Fund balance, June 30, 2015 445,000 429,733 429,733 - Fund balance, budget basis, June 30, 2016 123,973$ -$ -$ -$
Budgeted Amounts
126
ENTERPRISE FUNDS Combining statements for all individual nonmajor enterprise funds are reported in this section. Fund statements for major enterprise funds are reported in the basic financial statements. Schedules of Revenues, Expenditures, and Changes in Fund Balances – Budget and Actual are also presented in this section for each individual enterprise fund. Major Enterprise Funds Solid Waste Disposal Fund – This fund accounts for the operations of the County’s solid waste disposal sites and facilities, for which the principal source of revenue is user fees. The fund allocates a portion of the user fees collected for the construction of County solid waste sites and facilities such as landfill replacements and transfer sites. Additionally, the fund accumulates long-term resources for the payment of future costs related to closure and post-closure care of County solid waste sites. Nonmajor Enterprise Funds Lane Events Center Fund – This fund accounts for the operations and construction activities of the fairground facility. The fund operates on revenues generated by fairground activities (primarily County Fair admission, Convention Center rental fees, and building use fees) and from County transient room tax revenues. Corrections Commissary Fund – This fund accounts for the sales of sundries to corrections facility inmates. All commissary profits are used to provide recreational equipment for inmate use within the corrections facility. Land Management Fund – This fund accounts for the operations necessary for land use planning, building, subsurface sanitation and code compliance, for which the principal source of revenue is user fees. These revenues are used to provide citizens and communities land use planning and zoning, building, subsurface sanitation, and compliance assistance and services.
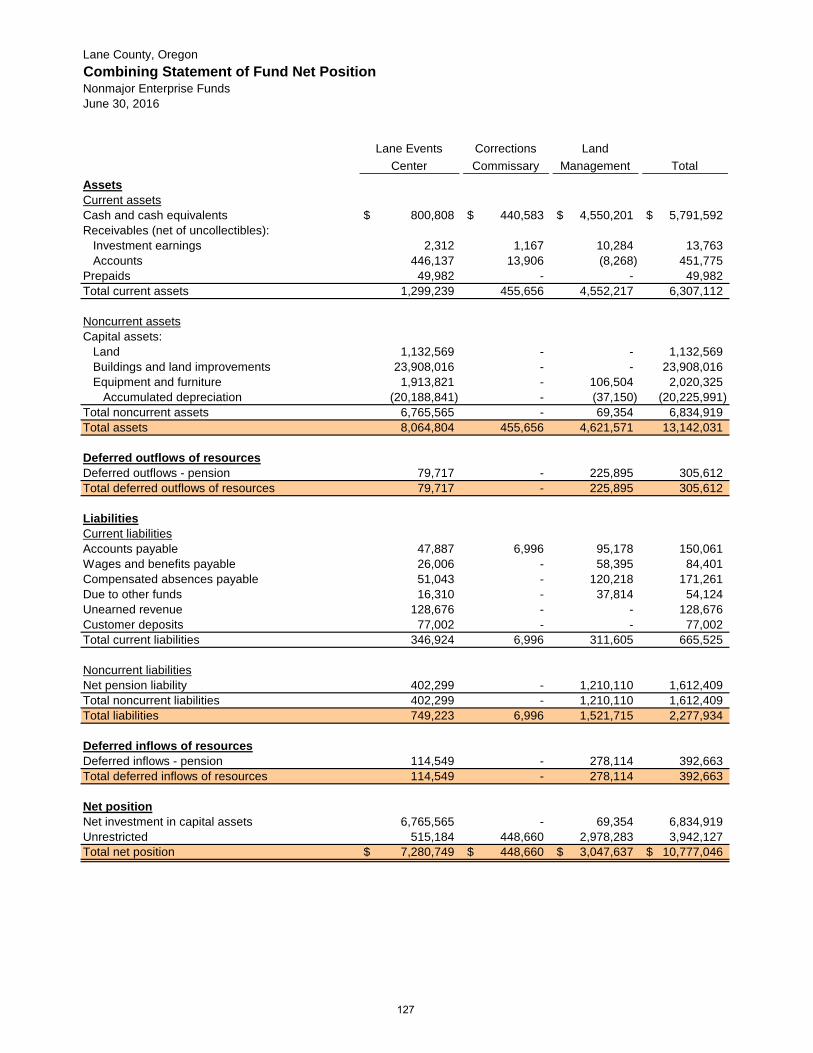
Lane County, OregonCombining Statement of Fund Net PositionNonmajor Enterprise FundsJune 30, 2016
Lane Events Center
Corrections Commissary
Land Management Total
AssetsCurrent assetsCash and cash equivalents 800,808$ 440,583$ 4,550,201$ 5,791,592$ Receivables (net of uncollectibles):
Investment earnings 2,312 1,167 10,284 13,763 Accounts 446,137 13,906 (8,268) 451,775
Prepaids 49,982 - - 49,982 Total current assets 1,299,239 455,656 4,552,217 6,307,112
Noncurrent assetsCapital assets:
Land 1,132,569 - - 1,132,569 Buildings and land improvements 23,908,016 - - 23,908,016 Equipment and furniture 1,913,821 - 106,504 2,020,325
Accumulated depreciation (20,188,841) - (37,150) (20,225,991) Total noncurrent assets 6,765,565 - 69,354 6,834,919 Total assets 8,064,804 455,656 4,621,571 13,142,031
Deferred outflows of resourcesDeferred outflows - pension 79,717 - 225,895 305,612 Total deferred outflows of resources 79,717 - 225,895 305,612
LiabilitiesCurrent liabilitiesAccounts payable 47,887 6,996 95,178 150,061 Wages and benefits payable 26,006 - 58,395 84,401 Compensated absences payable 51,043 - 120,218 171,261 Due to other funds 16,310 - 37,814 54,124 Unearned revenue 128,676 - - 128,676 Customer deposits 77,002 - - 77,002 Total current liabilities 346,924 6,996 311,605 665,525
Noncurrent liabilitiesNet pension liability 402,299 - 1,210,110 1,612,409 Total noncurrent liabilities 402,299 - 1,210,110 1,612,409 Total liabilities 749,223 6,996 1,521,715 2,277,934
Deferred inflows of resourcesDeferred inflows - pension 114,549 - 278,114 392,663 Total deferred inflows of resources 114,549 - 278,114 392,663
Net positionNet investment in capital assets 6,765,565 - 69,354 6,834,919 Unrestricted 515,184 448,660 2,978,283 3,942,127 Total net position 7,280,749$ 448,660$ 3,047,637$ 10,777,046$
127
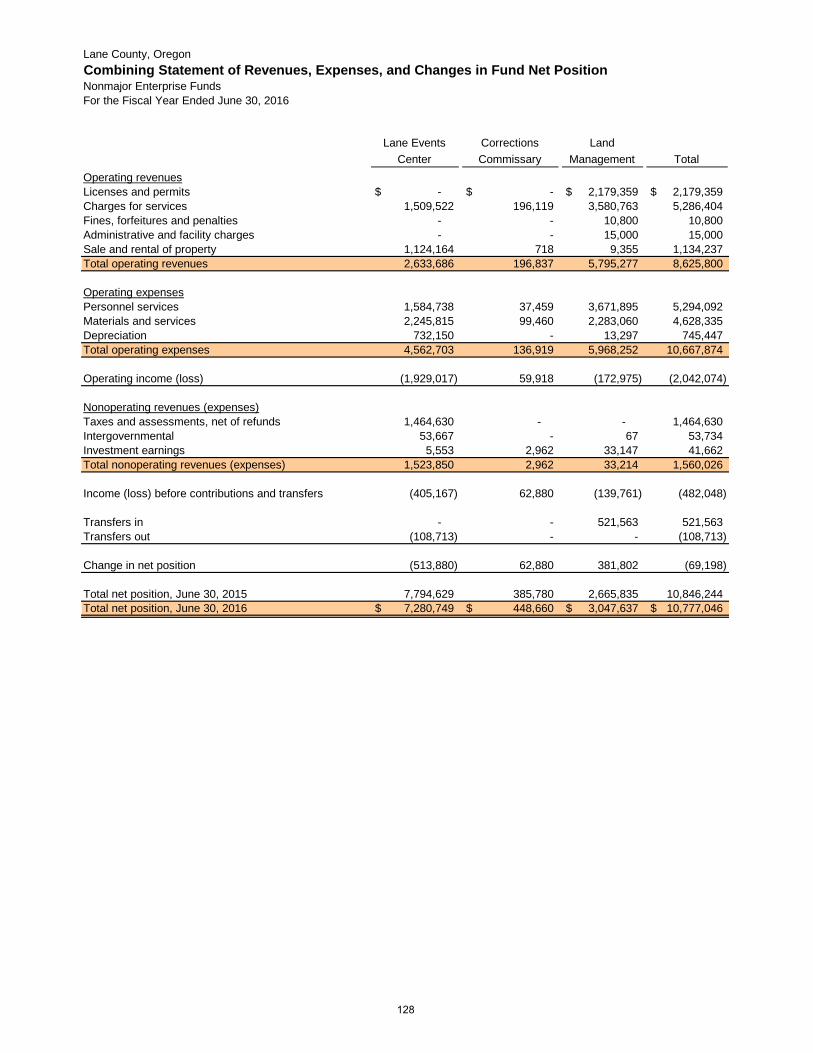
Lane County, OregonCombining Statement of Revenues, Expenses, and Changes in Fund Net PositionNonmajor Enterprise FundsFor the Fiscal Year Ended June 30, 2016
Lane Events Center
Corrections Commissary
Land Management Total
Operating revenuesLicenses and permits -$ -$ 2,179,359$ 2,179,359$ Charges for services 1,509,522 196,119 3,580,763 5,286,404 Fines, forfeitures and penalties - - 10,800 10,800 Administrative and facility charges - - 15,000 15,000 Sale and rental of property 1,124,164 718 9,355 1,134,237 Total operating revenues 2,633,686 196,837 5,795,277 8,625,800
Operating expensesPersonnel services 1,584,738 37,459 3,671,895 5,294,092 Materials and services 2,245,815 99,460 2,283,060 4,628,335 Depreciation 732,150 - 13,297 745,447 Total operating expenses 4,562,703 136,919 5,968,252 10,667,874
Operating income (loss) (1,929,017) 59,918 (172,975) (2,042,074)
Nonoperating revenues (expenses)Taxes and assessments, net of refunds 1,464,630 - - 1,464,630 Intergovernmental 53,667 - 67 53,734 Investment earnings 5,553 2,962 33,147 41,662 Total nonoperating revenues (expenses) 1,523,850 2,962 33,214 1,560,026
Income (loss) before contributions and transfers (405,167) 62,880 (139,761) (482,048)
Transfers in - - 521,563 521,563 Transfers out (108,713) - - (108,713)
Change in net position (513,880) 62,880 381,802 (69,198)
Total net position, June 30, 2015 7,794,629 385,780 2,665,835 10,846,244 Total net position, June 30, 2016 7,280,749$ 448,660$ 3,047,637$ 10,777,046$
128

Lane County, OregonCombining Statement of Cash FlowsNonmajor Enterprise FundsFor the Fiscal Year Ended June 30, 2016
Total Cash flows from operating activitiesReceipts from customers and users 1,450,324$ 196,056$ 5,784,564$ 7,430,944$ Receipts from facilities rent 1,124,164 718 9,355 1,134,237 Payments to employees (752,110) (3,013) (1,580,634) (2,335,757) Payments to suppliers (2,209,776) (79,755) (1,694,594) (3,984,125) Payments for interfund services (542,798) (65,248) (1,653,130) (2,261,176) Net cash provided (used) by operating activities (930,196) 48,758 865,561 (15,877)
Cash flows from noncapital financing activitiesIntergovernmental subsidies 53,667 - 67 53,734 Transfers in - - 521,563 521,563 Transfers out (108,713) - - (108,713) Net cash provided (used) by noncapital financing activities (55,046) - 521,630 466,584
Cash flows from capital and related financing activitiesTransient room tax 1,464,630 - - 1,464,630 Net cash provided (used) by capital and related financing activities 1,464,630 - - 1,464,630
Cash flows from investing activitiesInvestment earnings 4,666 2,725 29,315 36,706 Net cash provided (used) by investing activities 4,666 2,725 29,315 36,706
Net increase (decrease) in cash and cash equivalents 484,054 51,483 1,416,506 1,952,043 Cash and cash equivalents, July 01, 2015 316,754 389,100 3,133,695 3,839,549 Cash and cash equivalents, June 30, 2016 800,808$ 440,583$ 4,550,201$ 5,791,592$
Reconciliation of operating income (loss) tonet cash provided (used) by operating activities:
Operating income (loss) (1,929,017)$ 59,918$ (172,975)$ (2,042,074)$ Adjustments to reconcile operating income (loss)
to net cash provided (used) by operating activitiesDepreciation 732,150 - 13,297 745,447 (Increase) decrease in receivables (62,039) (63) (1,358) (63,460) (Increase) decrease in prepaids 36,533 - - 36,533 (Increase) decrease in deferred outflows (29,232) 814 (85,841) (114,259) Increase (decrease) in accounts payable (53,633) (7,873) 4,476 (57,030) Increase (decrease) in wages and benefits payable 5,002 (248) 21,474 26,228 Increase (decrease) in compensated absences payable 6,796 - 25,538 32,334 Increase (decrease) in due to other funds 3,986 (211) 14,330 18,105 Increase (decrease) in unearned revenue 10,866 - - 10,866 Increase (decrease) in customer deposits (8,025) - - (8,025) Increase (decrease) in net pension liability 558,518 3,499 1,640,090 2,202,107 Increase (decrease) in deferred inflows (202,101) (7,078) (593,470) (802,649) Net cash provided (used) by operating activities (930,196)$ 48,758$ 865,561$ (15,877)$
Noncash investing, capital, and financing activities:Increase (decrease) in fair value of investments - - 6,883$ 6,883$
Land Management
Corrections Commissary
Lane Events Center
129

Lane County, OregonLane Events CenterSchedule of Revenues, Expenditures and Changes in Fund Balance - Budget and ActualFor the Fiscal Year Ended June 30, 2016
Actual Variance with Original Final Amounts Final Budget
RevenuesTaxes and assessments 1,060,530$ 1,410,530$ 1,464,630$ 54,100$ Intergovernmental 50,000 50,000 53,667 3,667 Charges for services 1,322,450 1,322,450 1,509,522 187,072 Investment earnings 9,730 9,730 4,665 (5,065) Sale and rental of property 1,050,280 1,050,280 1,124,164 73,884 Total revenues 3,492,990 3,842,990 4,156,648 313,658
ExpendituresCurrent - departmental:
Public works 3,547,876 3,628,517 3,496,571 (131,946) Not allocated to organizational units:
Transfers out 108,713 108,713 108,713 - Contingency 255,442 555,442 - (555,442)
Total expenditures 3,912,031 4,292,672 3,605,284 (687,388)
Net change in fund balance (419,041) (449,682) 551,364 1,001,046
Fund balance, June 30, 2015 419,041 449,682 449,682 - Fund balance, budget basis, June 30, 2016 -$ -$ 1,001,046 1,001,046$
Accrued investment earnings 2,312 Capital assets (net of accumulated depreciation) 6,765,565 Accrued compensated benefits (51,043) Net pension liability (asset) (402,299) Deferred outflows of resources 79,717 Deferred inflows of resources (114,549) Total net position, GAAP basis, June 30, 2016 7,280,749$
Budgeted Amounts
130
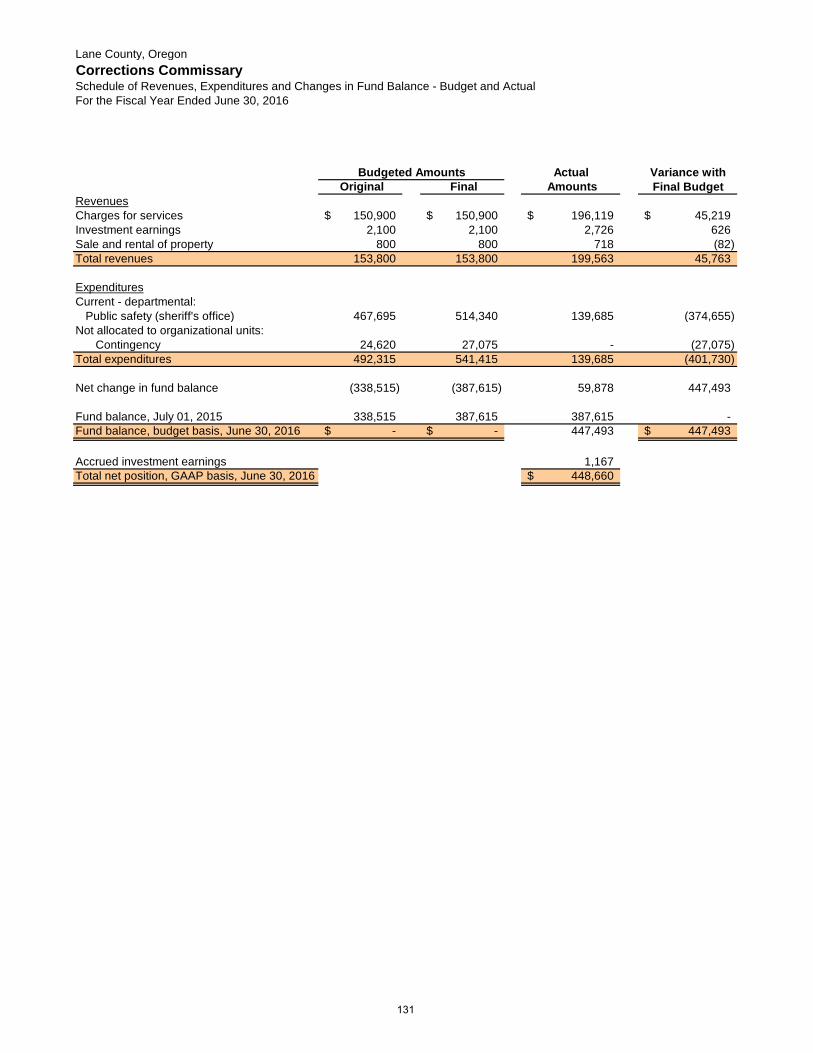
Lane County, OregonCorrections CommissarySchedule of Revenues, Expenditures and Changes in Fund Balance - Budget and ActualFor the Fiscal Year Ended June 30, 2016
Actual Variance with Original Final Amounts Final Budget
RevenuesCharges for services 150,900$ 150,900$ 196,119$ 45,219$ Investment earnings 2,100 2,100 2,726 626 Sale and rental of property 800 800 718 (82) Total revenues 153,800 153,800 199,563 45,763
ExpendituresCurrent - departmental:
Public safety (sheriff's office) 467,695 514,340 139,685 (374,655) Not allocated to organizational units:
Contingency 24,620 27,075 - (27,075) Total expenditures 492,315 541,415 139,685 (401,730)
Net change in fund balance (338,515) (387,615) 59,878 447,493
Fund balance, July 01, 2015 338,515 387,615 387,615 - Fund balance, budget basis, June 30, 2016 -$ -$ 447,493 447,493$
Accrued investment earnings 1,167 Total net position, GAAP basis, June 30, 2016 448,660$
Budgeted Amounts
131

Lane County, OregonLand ManagementSchedule of Revenues, Expenditures and Changes in Fund Balance - Budget and ActualFor the Fiscal Year Ended June 30, 2016
Actual Variance with Original Final Amounts Final Budget
RevenuesLicenses and permits 1,575,000$ 1,807,900$ 2,179,359$ 371,459$ Intergovernmental 555,105 805,105 521,629 (283,476) Charges for services 2,890,000 2,953,000 3,580,763 627,763 Fines, forfeitures and penalties 20,000 20,000 10,800 (9,200) Administrative and facility charges 15,000 15,000 15,000 - Investment earnings 10,000 10,000 22,431 12,431 Sale and rental of property 2,000 2,000 9,355 7,355 Total revenues 5,067,105 5,613,005 6,339,337 726,332
ExpendituresCurrent - departmental:
Public works 4,779,242 5,333,547 4,968,635 (364,912) Not allocated to organizational units:
Contingency 835,242 1,975,589 - (1,975,589) Total expenditures 5,614,484 7,309,136 4,968,635 (2,340,501)
Net change in fund balance (547,379) (1,696,131) 1,370,702 3,066,833
Fund balance, June 30, 2015 1,830,789 2,972,961 2,972,961 - Fund balance, budget basis, June 30, 2016 1,283,410$ 1,276,830$ 4,343,663 3,066,833$
Unrealized gain (loss) on investments 6,883 Accrued investment earnings 10,284 Capital assets (net of accumulated depreciation) 69,354 Accrued compensated benefits (120,218) Net pension liability (asset) (1,210,110) Deferred outflows of resources 225,895 Deferred inflows of resources (278,114) Total net position, GAAP basis, June 30, 2016 3,047,637$
Budgeted Amounts
132
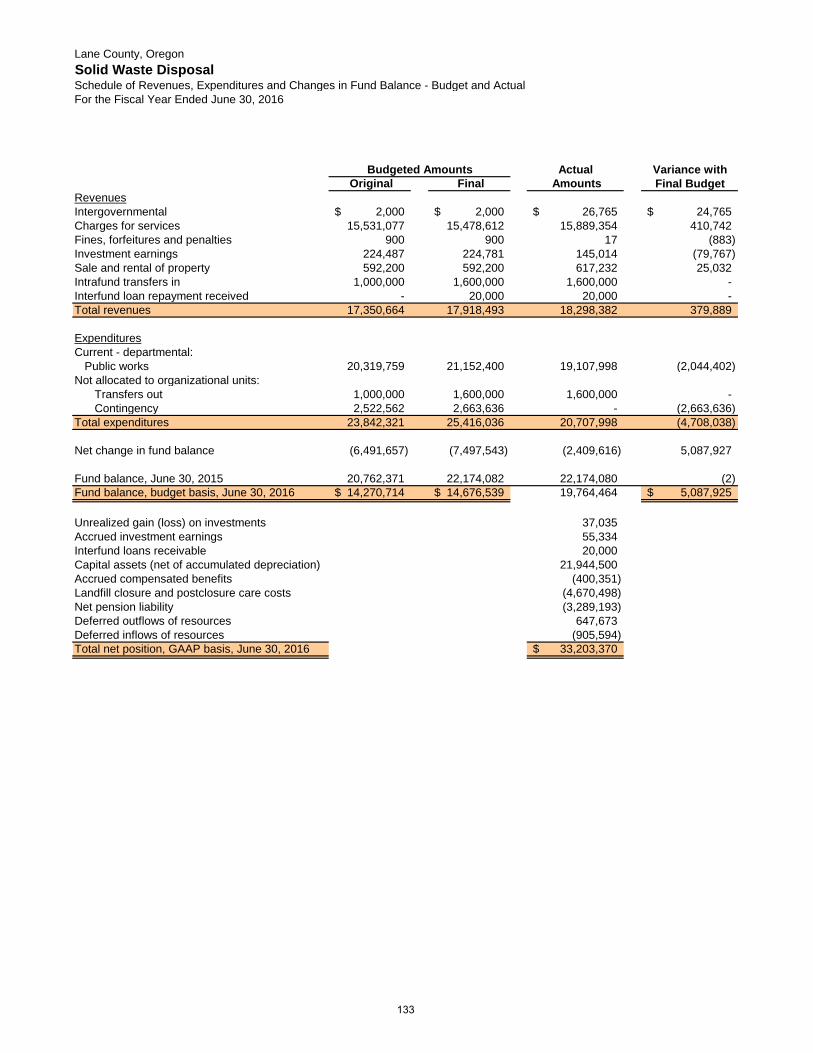
Lane County, OregonSolid Waste DisposalSchedule of Revenues, Expenditures and Changes in Fund Balance - Budget and ActualFor the Fiscal Year Ended June 30, 2016
Actual Variance with Original Final Amounts Final Budget
RevenuesIntergovernmental 2,000$ 2,000$ 26,765$ 24,765$ Charges for services 15,531,077 15,478,612 15,889,354 410,742 Fines, forfeitures and penalties 900 900 17 (883) Investment earnings 224,487 224,781 145,014 (79,767) Sale and rental of property 592,200 592,200 617,232 25,032 Intrafund transfers in 1,000,000 1,600,000 1,600,000 - Interfund loan repayment received - 20,000 20,000 - Total revenues 17,350,664 17,918,493 18,298,382 379,889
ExpendituresCurrent - departmental:
Public works 20,319,759 21,152,400 19,107,998 (2,044,402) Not allocated to organizational units:
Transfers out 1,000,000 1,600,000 1,600,000 - Contingency 2,522,562 2,663,636 - (2,663,636)
Total expenditures 23,842,321 25,416,036 20,707,998 (4,708,038)
Net change in fund balance (6,491,657) (7,497,543) (2,409,616) 5,087,927
Fund balance, June 30, 2015 20,762,371 22,174,082 22,174,080 (2) Fund balance, budget basis, June 30, 2016 14,270,714$ 14,676,539$ 19,764,464 5,087,925$
Unrealized gain (loss) on investments 37,035 Accrued investment earnings 55,334 Interfund loans receivable 20,000 Capital assets (net of accumulated depreciation) 21,944,500 Accrued compensated benefits (400,351) Landfill closure and postclosure care costs (4,670,498) Net pension liability (3,289,193) Deferred outflows of resources 647,673 Deferred inflows of resources (905,594) Total net position, GAAP basis, June 30, 2016 33,203,370$
Budgeted Amounts
133

134
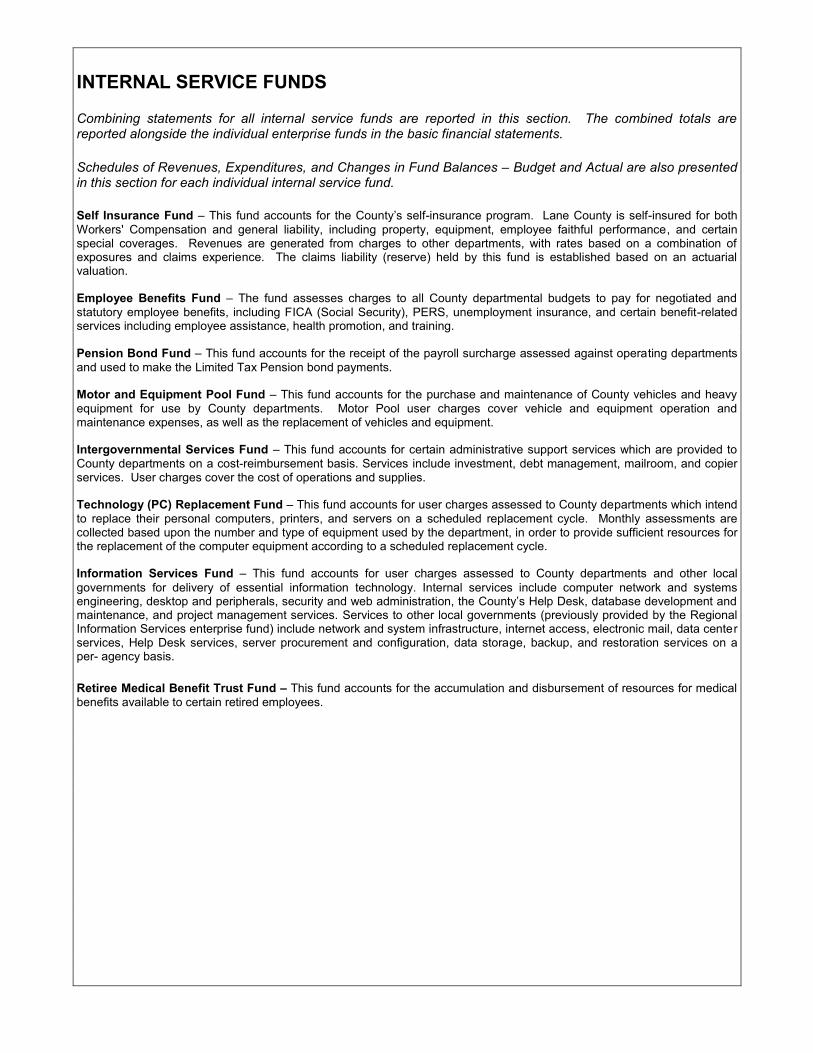
INTERNAL SERVICE FUNDS Combining statements for all internal service funds are reported in this section. The combined totals are reported alongside the individual enterprise funds in the basic financial statements. Schedules of Revenues, Expenditures, and Changes in Fund Balances – Budget and Actual are also presented in this section for each individual internal service fund. Self Insurance Fund – This fund accounts for the County’s self-insurance program. Lane County is self-insured for both Workers' Compensation and general liability, including property, equipment, employee faithful performance, and certain special coverages. Revenues are generated from charges to other departments, with rates based on a combination of exposures and claims experience. The claims liability (reserve) held by this fund is established based on an actuarial valuation. Employee Benefits Fund – The fund assesses charges to all County departmental budgets to pay for negotiated and statutory employee benefits, including FICA (Social Security), PERS, unemployment insurance, and certain benefit-related services including employee assistance, health promotion, and training. Pension Bond Fund – This fund accounts for the receipt of the payroll surcharge assessed against operating departments and used to make the Limited Tax Pension bond payments. Motor and Equipment Pool Fund – This fund accounts for the purchase and maintenance of County vehicles and heavy equipment for use by County departments. Motor Pool user charges cover vehicle and equipment operation and maintenance expenses, as well as the replacement of vehicles and equipment. Intergovernmental Services Fund – This fund accounts for certain administrative support services which are provided to County departments on a cost-reimbursement basis. Services include investment, debt management, mailroom, and copier services. User charges cover the cost of operations and supplies. Technology (PC) Replacement Fund – This fund accounts for user charges assessed to County departments which intend to replace their personal computers, printers, and servers on a scheduled replacement cycle. Monthly assessments are collected based upon the number and type of equipment used by the department, in order to provide sufficient resources for the replacement of the computer equipment according to a scheduled replacement cycle. Information Services Fund – This fund accounts for user charges assessed to County departments and other local governments for delivery of essential information technology. Internal services include computer network and systems engineering, desktop and peripherals, security and web administration, the County’s Help Desk, database development and maintenance, and project management services. Services to other local governments (previously provided by the Regional Information Services enterprise fund) include network and system infrastructure, internet access, electronic mail, data center services, Help Desk services, server procurement and configuration, data storage, backup, and restoration services on a per- agency basis. Retiree Medical Benefit Trust Fund – This fund accounts for the accumulation and disbursement of resources for medical benefits available to certain retired employees.

135
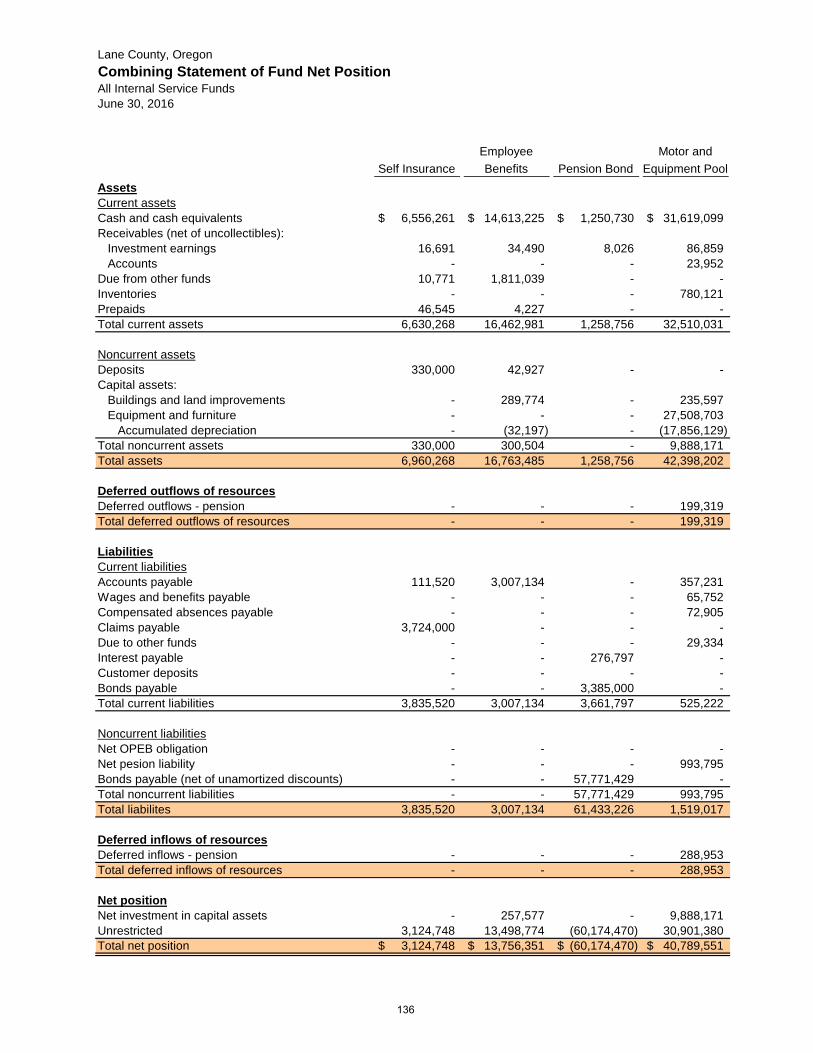
Lane County, OregonCombining Statement of Fund Net PositionAll Internal Service FundsJune 30, 2016
Self InsuranceEmployee Benefits Pension Bond
Motor and Equipment Pool
AssetsCurrent assetsCash and cash equivalents 6,556,261$ 14,613,225$ 1,250,730$ 31,619,099$ Receivables (net of uncollectibles):
Investment earnings 16,691 34,490 8,026 86,859 Accounts - - - 23,952
Due from other funds 10,771 1,811,039 - - Inventories - - - 780,121 Prepaids 46,545 4,227 - - Total current assets 6,630,268 16,462,981 1,258,756 32,510,031
Noncurrent assetsDeposits 330,000 42,927 - - Capital assets:
Buildings and land improvements - 289,774 - 235,597 Equipment and furniture - - - 27,508,703
Accumulated depreciation - (32,197) - (17,856,129) Total noncurrent assets 330,000 300,504 - 9,888,171 Total assets 6,960,268 16,763,485 1,258,756 42,398,202
Deferred outflows of resourcesDeferred outflows - pension - - - 199,319 Total deferred outflows of resources - - - 199,319
LiabilitiesCurrent liabilitiesAccounts payable 111,520 3,007,134 - 357,231 Wages and benefits payable - - - 65,752 Compensated absences payable - - - 72,905 Claims payable 3,724,000 - - - Due to other funds - - - 29,334 Interest payable - - 276,797 - Customer deposits - - - - Bonds payable - - 3,385,000 - Total current liabilities 3,835,520 3,007,134 3,661,797 525,222
Noncurrent liabilitiesNet OPEB obligation - - - - Net pesion liability - - - 993,795 Bonds payable (net of unamortized discounts) - - 57,771,429 - Total noncurrent liabilities - - 57,771,429 993,795 Total liabilites 3,835,520 3,007,134 61,433,226 1,519,017
Deferred inflows of resourcesDeferred inflows - pension - - - 288,953 Total deferred inflows of resources - - - 288,953
Net positionNet investment in capital assets - 257,577 - 9,888,171 Unrestricted 3,124,748 13,498,774 (60,174,470) 30,901,380 Total net position 3,124,748$ 13,756,351$ (60,174,470)$ 40,789,551$
136
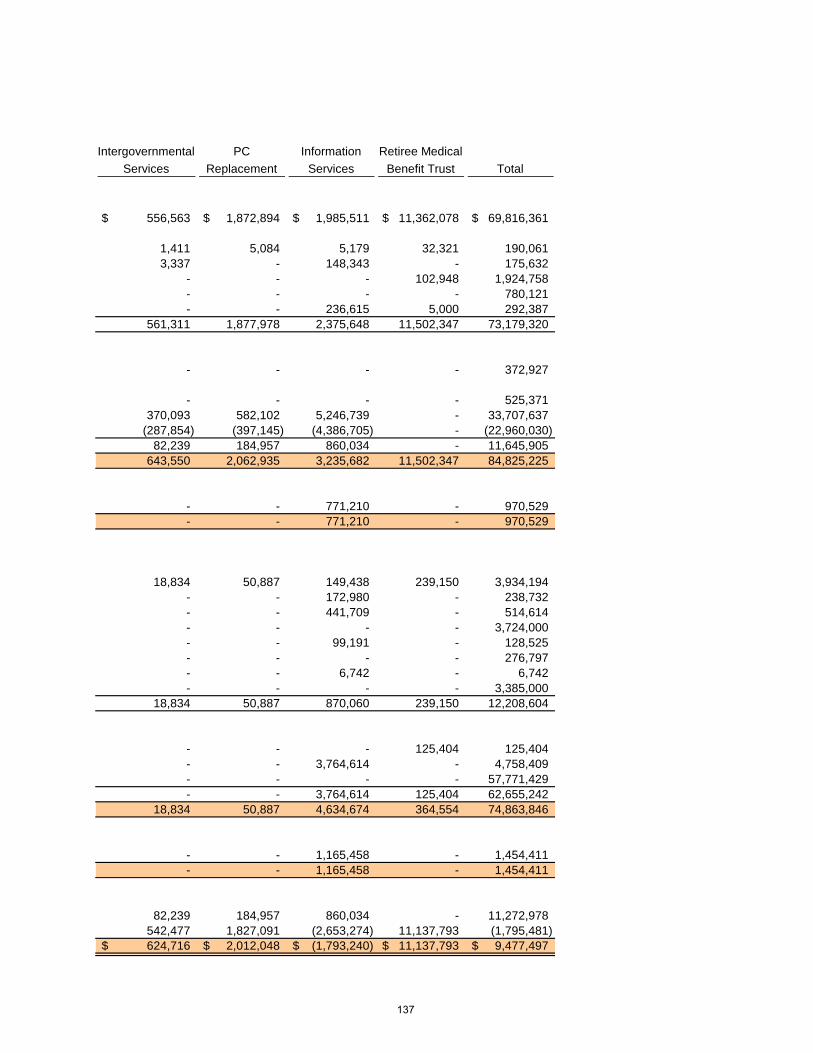
Intergovernmental Services
PC Replacement
Information Services
Retiree Medical Benefit Trust Total
556,563$ 1,872,894$ 1,985,511$ 11,362,078$ 69,816,361$
1,411 5,084 5,179 32,321 190,061 3,337 - 148,343 - 175,632
- - - 102,948 1,924,758 - - - - 780,121 - - 236,615 5,000 292,387
561,311 1,877,978 2,375,648 11,502,347 73,179,320
- - - - 372,927
- - - - 525,371 370,093 582,102 5,246,739 - 33,707,637
(287,854) (397,145) (4,386,705) - (22,960,030) 82,239 184,957 860,034 - 11,645,905
643,550 2,062,935 3,235,682 11,502,347 84,825,225
- - 771,210 - 970,529 - - 771,210 - 970,529
18,834 50,887 149,438 239,150 3,934,194 - - 172,980 - 238,732 - - 441,709 - 514,614 - - - - 3,724,000 - - 99,191 - 128,525 - - - - 276,797 - - 6,742 - 6,742 - - - - 3,385,000
18,834 50,887 870,060 239,150 12,208,604
- - - 125,404 125,404 - - 3,764,614 - 4,758,409 - - - - 57,771,429 - - 3,764,614 125,404 62,655,242
18,834 50,887 4,634,674 364,554 74,863,846
- - 1,165,458 - 1,454,411 - - 1,165,458 - 1,454,411
82,239 184,957 860,034 - 11,272,978 542,477 1,827,091 (2,653,274) 11,137,793 (1,795,481) 624,716$ 2,012,048$ (1,793,240)$ 11,137,793$ 9,477,497$
137
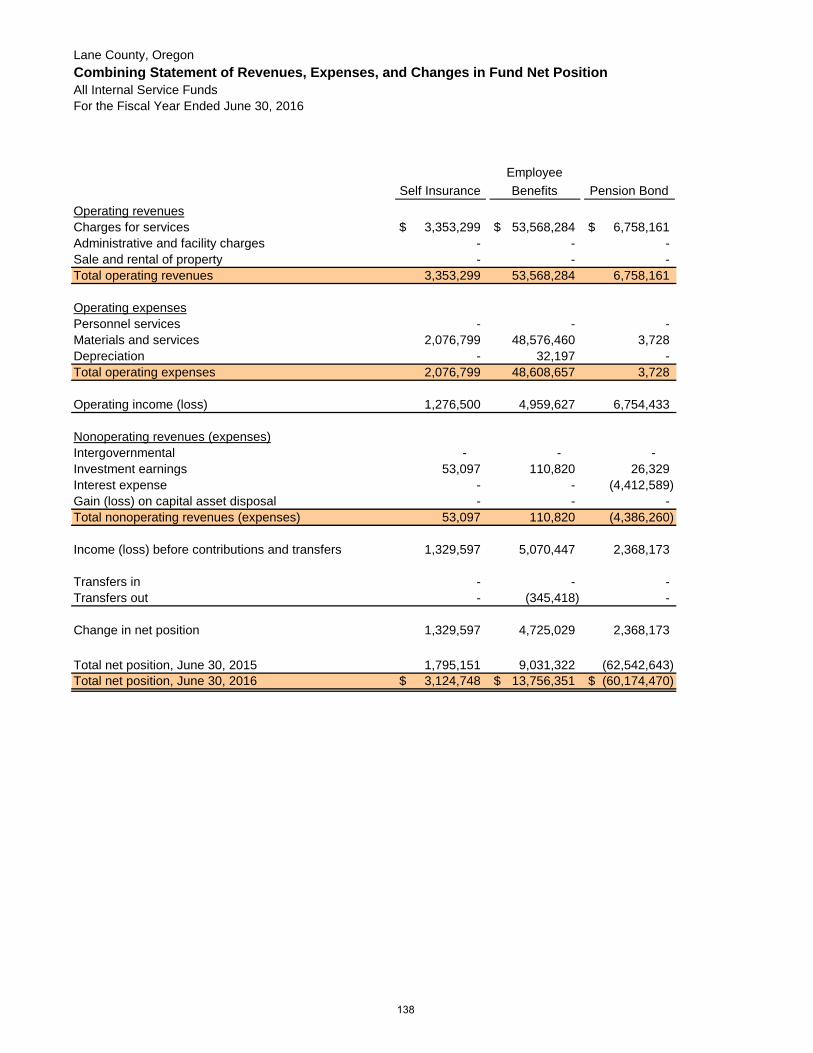
Lane County, OregonCombining Statement of Revenues, Expenses, and Changes in Fund Net PositionAll Internal Service FundsFor the Fiscal Year Ended June 30, 2016
Self InsuranceEmployee Benefits Pension Bond
Operating revenuesCharges for services 3,353,299$ 53,568,284$ 6,758,161$ Administrative and facility charges - - - Sale and rental of property - - - Total operating revenues 3,353,299 53,568,284 6,758,161
Operating expensesPersonnel services - - - Materials and services 2,076,799 48,576,460 3,728 Depreciation - 32,197 - Total operating expenses 2,076,799 48,608,657 3,728
Operating income (loss) 1,276,500 4,959,627 6,754,433
Nonoperating revenues (expenses)Intergovernmental - - - Investment earnings 53,097 110,820 26,329 Interest expense - - (4,412,589) Gain (loss) on capital asset disposal - - - Total nonoperating revenues (expenses) 53,097 110,820 (4,386,260)
Income (loss) before contributions and transfers 1,329,597 5,070,447 2,368,173
Transfers in - - - Transfers out - (345,418) -
Change in net position 1,329,597 4,725,029 2,368,173
Total net position, June 30, 2015 1,795,151 9,031,322 (62,542,643) Total net position, June 30, 2016 3,124,748$ 13,756,351$ (60,174,470)$
138
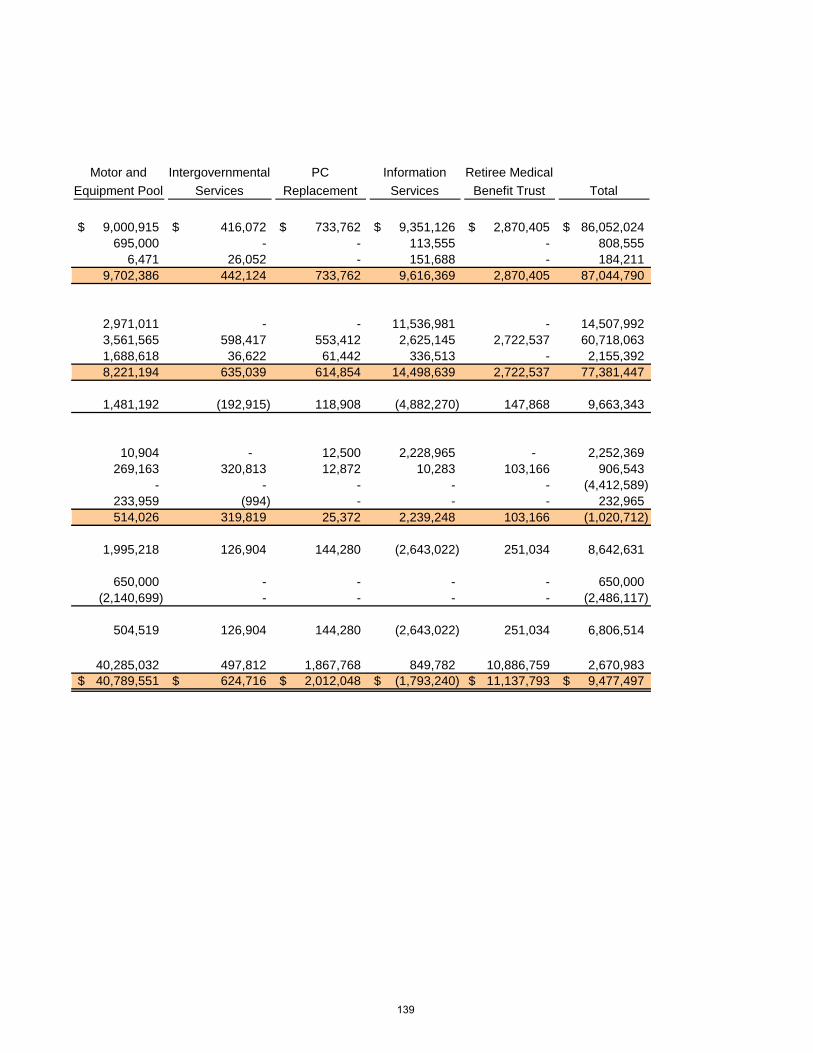
Motor and Equipment Pool
Intergovernmental Services
PC Replacement
Information Services
Retiree Medical Benefit Trust Total
9,000,915$ 416,072$ 733,762$ 9,351,126$ 2,870,405$ 86,052,024$ 695,000 - - 113,555 - 808,555
6,471 26,052 - 151,688 - 184,211 9,702,386 442,124 733,762 9,616,369 2,870,405 87,044,790
2,971,011 - - 11,536,981 - 14,507,992 3,561,565 598,417 553,412 2,625,145 2,722,537 60,718,063 1,688,618 36,622 61,442 336,513 - 2,155,392 8,221,194 635,039 614,854 14,498,639 2,722,537 77,381,447
1,481,192 (192,915) 118,908 (4,882,270) 147,868 9,663,343
10,904 - 12,500 2,228,965 - 2,252,369 269,163 320,813 12,872 10,283 103,166 906,543
- - - - - (4,412,589) 233,959 (994) - - - 232,965 514,026 319,819 25,372 2,239,248 103,166 (1,020,712)
1,995,218 126,904 144,280 (2,643,022) 251,034 8,642,631
650,000 - - - - 650,000 (2,140,699) - - - - (2,486,117)
504,519 126,904 144,280 (2,643,022) 251,034 6,806,514
40,285,032 497,812 1,867,768 849,782 10,886,759 2,670,983 40,789,551$ 624,716$ 2,012,048$ (1,793,240)$ 11,137,793$ 9,477,497$
139
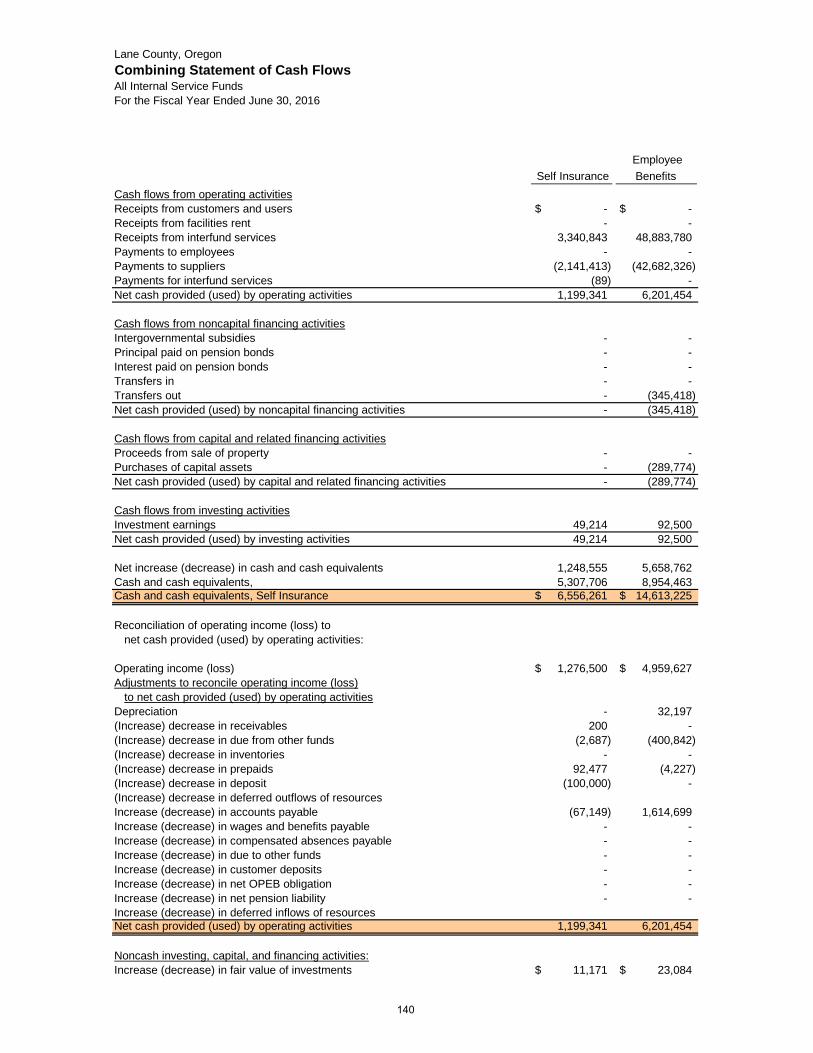
Lane County, OregonCombining Statement of Cash FlowsAll Internal Service FundsFor the Fiscal Year Ended June 30, 2016
Self Insurance Employee Benefits
Cash flows from operating activitiesReceipts from customers and users -$ -$ Receipts from facilities rent - - Receipts from interfund services 3,340,843 48,883,780 Payments to employees - - Payments to suppliers (2,141,413) (42,682,326) Payments for interfund services (89) - Net cash provided (used) by operating activities 1,199,341 6,201,454
Cash flows from noncapital financing activitiesIntergovernmental subsidies - - Principal paid on pension bonds - - Interest paid on pension bonds - - Transfers in - - Transfers out - (345,418) Net cash provided (used) by noncapital financing activities - (345,418)
Cash flows from capital and related financing activitiesProceeds from sale of property - - Purchases of capital assets - (289,774) Net cash provided (used) by capital and related financing activities - (289,774)
Cash flows from investing activitiesInvestment earnings 49,214 92,500 Net cash provided (used) by investing activities 49,214 92,500
Net increase (decrease) in cash and cash equivalents 1,248,555 5,658,762 Cash and cash equivalents, 5,307,706 8,954,463 Cash and cash equivalents, Self Insurance 6,556,261$ 14,613,225$
Reconciliation of operating income (loss) tonet cash provided (used) by operating activities:
Operating income (loss) 1,276,500$ 4,959,627$ Adjustments to reconcile operating income (loss)
to net cash provided (used) by operating activitiesDepreciation - 32,197 (Increase) decrease in receivables 200 - (Increase) decrease in due from other funds (2,687) (400,842) (Increase) decrease in inventories - - (Increase) decrease in prepaids 92,477 (4,227) (Increase) decrease in deposit (100,000) - (Increase) decrease in deferred outflows of resourcesIncrease (decrease) in accounts payable (67,149) 1,614,699 Increase (decrease) in wages and benefits payable - - Increase (decrease) in compensated absences payable - - Increase (decrease) in due to other funds - - Increase (decrease) in customer deposits - - Increase (decrease) in net OPEB obligation - - Increase (decrease) in net pension liability - - Increase (decrease) in deferred inflows of resourcesNet cash provided (used) by operating activities 1,199,341 6,201,454
Noncash investing, capital, and financing activities:Increase (decrease) in fair value of investments 11,171$ 23,084$
140
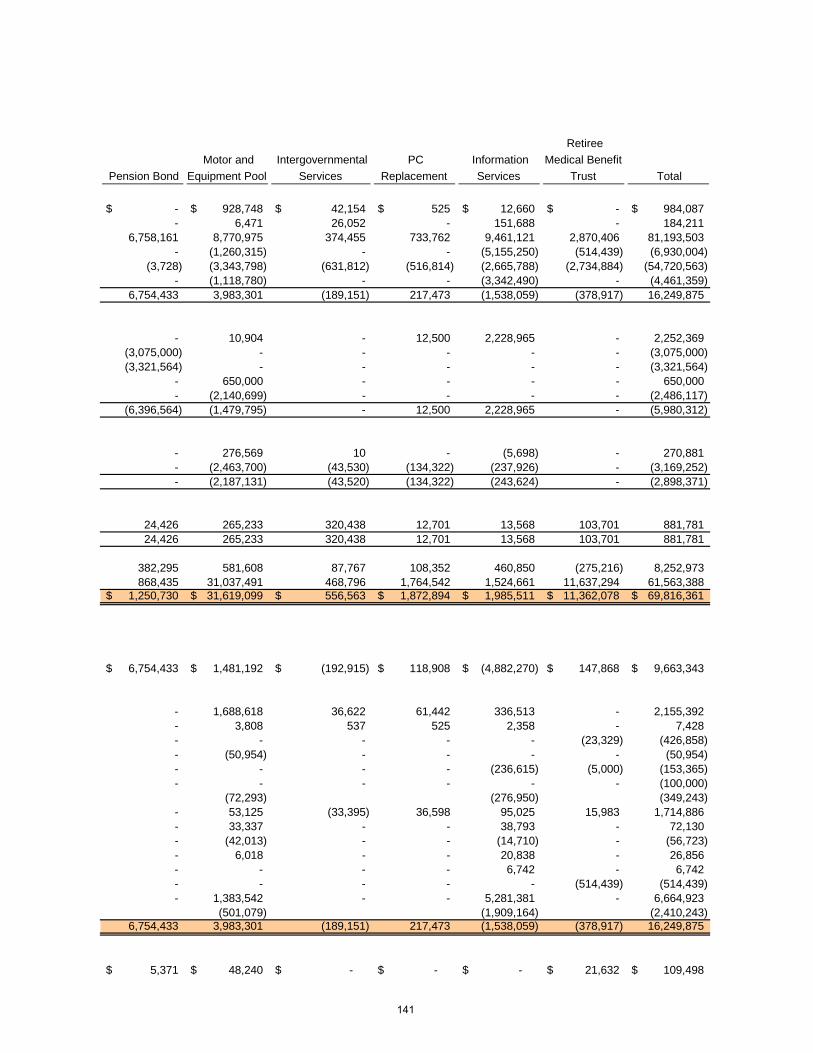
Pension Bond Motor and
Equipment Pool Intergovernmental
Services PC
Replacement Information
Services
Retiree Medical Benefit
Trust Total
-$ 928,748$ 42,154$ 525$ 12,660$ -$ 984,087$ - 6,471 26,052 - 151,688 - 184,211
6,758,161 8,770,975 374,455 733,762 9,461,121 2,870,406 81,193,503 - (1,260,315) - - (5,155,250) (514,439) (6,930,004)
(3,728) (3,343,798) (631,812) (516,814) (2,665,788) (2,734,884) (54,720,563) - (1,118,780) - - (3,342,490) - (4,461,359)
6,754,433 3,983,301 (189,151) 217,473 (1,538,059) (378,917) 16,249,875
- 10,904 - 12,500 2,228,965 - 2,252,369 (3,075,000) - - - - - (3,075,000) (3,321,564) - - - - - (3,321,564)
- 650,000 - - - - 650,000 - (2,140,699) - - - - (2,486,117)
(6,396,564) (1,479,795) - 12,500 2,228,965 - (5,980,312)
- 276,569 10 - (5,698) - 270,881 - (2,463,700) (43,530) (134,322) (237,926) - (3,169,252) - (2,187,131) (43,520) (134,322) (243,624) - (2,898,371)
24,426 265,233 320,438 12,701 13,568 103,701 881,781 24,426 265,233 320,438 12,701 13,568 103,701 881,781
382,295 581,608 87,767 108,352 460,850 (275,216) 8,252,973 868,435 31,037,491 468,796 1,764,542 1,524,661 11,637,294 61,563,388
1,250,730$ 31,619,099$ 556,563$ 1,872,894$ 1,985,511$ 11,362,078$ 69,816,361$
6,754,433$ 1,481,192$ (192,915)$ 118,908$ (4,882,270)$ 147,868$ 9,663,343$
- 1,688,618 36,622 61,442 336,513 - 2,155,392 - 3,808 537 525 2,358 - 7,428 - - - - - (23,329) (426,858) - (50,954) - - - - (50,954) - - - - (236,615) (5,000) (153,365) - - - - - - (100,000)
(72,293) (276,950) (349,243) - 53,125 (33,395) 36,598 95,025 15,983 1,714,886 - 33,337 - - 38,793 - 72,130 - (42,013) - - (14,710) - (56,723) - 6,018 - - 20,838 - 26,856 - - - - 6,742 - 6,742 - - - - - (514,439) (514,439) - 1,383,542 - - 5,281,381 - 6,664,923
(501,079) (1,909,164) (2,410,243) 6,754,433 3,983,301 (189,151) 217,473 (1,538,059) (378,917) 16,249,875
5,371$ 48,240$ -$ -$ -$ 21,632$ 109,498$
141
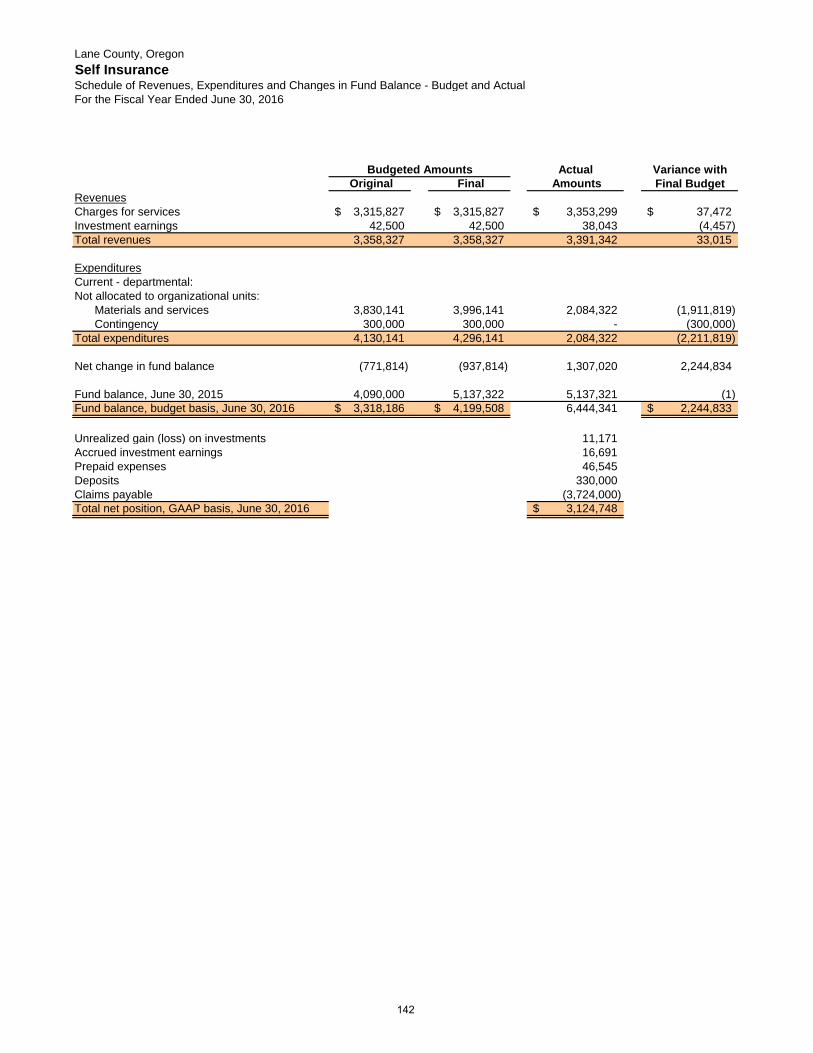
Lane County, OregonSelf InsuranceSchedule of Revenues, Expenditures and Changes in Fund Balance - Budget and ActualFor the Fiscal Year Ended June 30, 2016
Actual Variance with Original Final Amounts Final Budget
RevenuesCharges for services 3,315,827$ 3,315,827$ 3,353,299$ 37,472$ Investment earnings 42,500 42,500 38,043 (4,457) Total revenues 3,358,327 3,358,327 3,391,342 33,015
ExpendituresCurrent - departmental:Not allocated to organizational units:
Materials and services 3,830,141 3,996,141 2,084,322 (1,911,819) Contingency 300,000 300,000 - (300,000)
Total expenditures 4,130,141 4,296,141 2,084,322 (2,211,819)
Net change in fund balance (771,814) (937,814) 1,307,020 2,244,834
Fund balance, June 30, 2015 4,090,000 5,137,322 5,137,321 (1) Fund balance, budget basis, June 30, 2016 3,318,186$ 4,199,508$ 6,444,341 2,244,833$
Unrealized gain (loss) on investments 11,171 Accrued investment earnings 16,691 Prepaid expenses 46,545 Deposits 330,000 Claims payable (3,724,000) Total net position, GAAP basis, June 30, 2016 3,124,748$
Budgeted Amounts
142
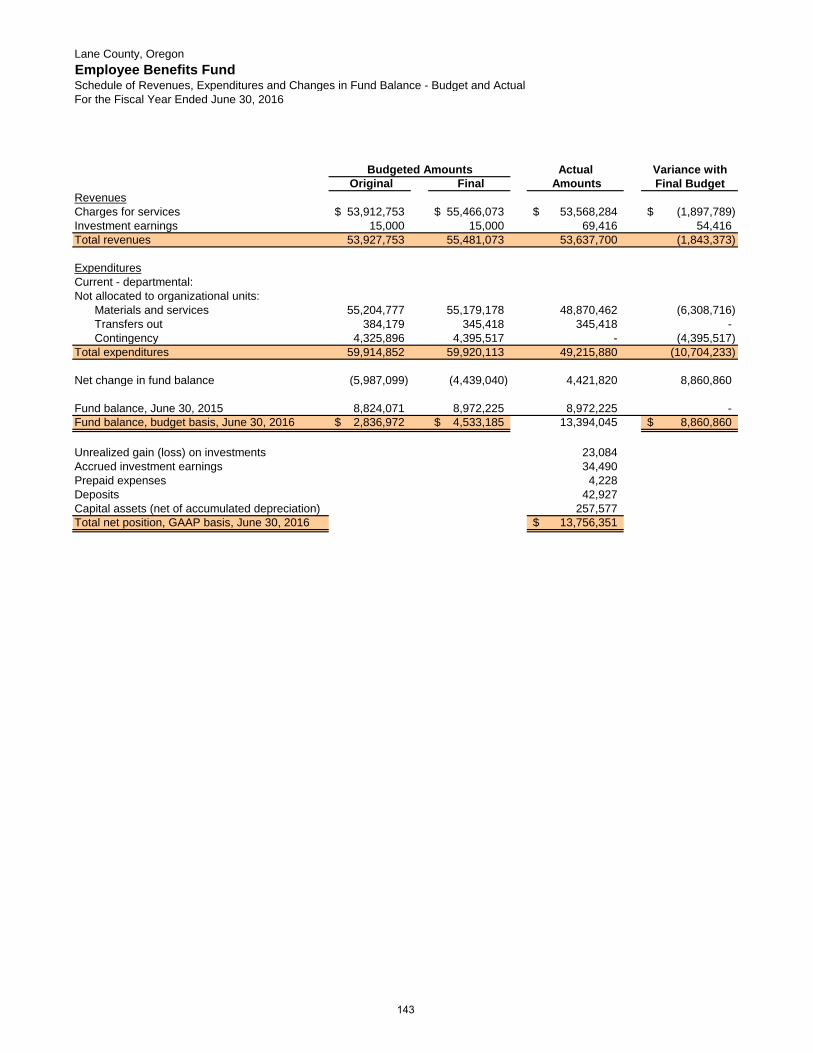
Lane County, OregonEmployee Benefits FundSchedule of Revenues, Expenditures and Changes in Fund Balance - Budget and ActualFor the Fiscal Year Ended June 30, 2016
Actual Variance with Original Final Amounts Final Budget
RevenuesCharges for services 53,912,753$ 55,466,073$ 53,568,284$ (1,897,789)$ Investment earnings 15,000 15,000 69,416 54,416 Total revenues 53,927,753 55,481,073 53,637,700 (1,843,373)
ExpendituresCurrent - departmental:Not allocated to organizational units:
Materials and services 55,204,777 55,179,178 48,870,462 (6,308,716) Transfers out 384,179 345,418 345,418 - Contingency 4,325,896 4,395,517 - (4,395,517)
Total expenditures 59,914,852 59,920,113 49,215,880 (10,704,233)
Net change in fund balance (5,987,099) (4,439,040) 4,421,820 8,860,860
Fund balance, June 30, 2015 8,824,071 8,972,225 8,972,225 - Fund balance, budget basis, June 30, 2016 2,836,972$ 4,533,185$ 13,394,045 8,860,860$
Unrealized gain (loss) on investments 23,084 Accrued investment earnings 34,490 Prepaid expenses 4,228 Deposits 42,927 Capital assets (net of accumulated depreciation) 257,577 Total net position, GAAP basis, June 30, 2016 13,756,351$
Budgeted Amounts
143
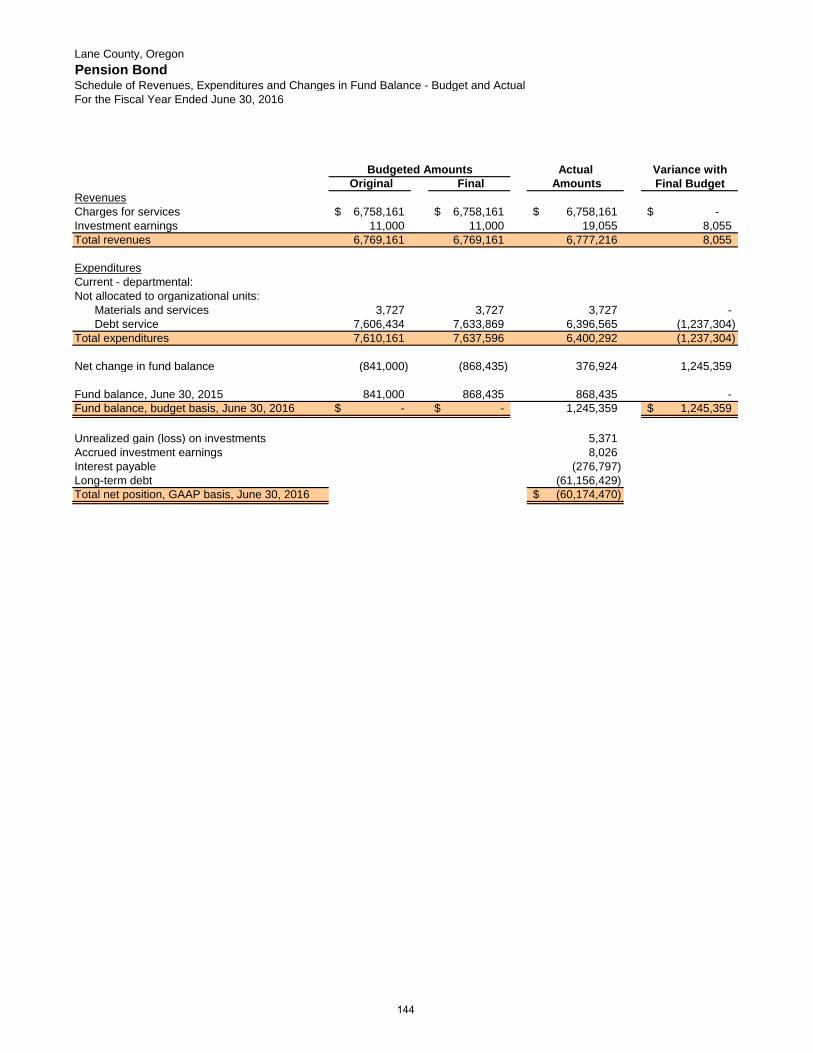
Lane County, OregonPension BondSchedule of Revenues, Expenditures and Changes in Fund Balance - Budget and ActualFor the Fiscal Year Ended June 30, 2016
Actual Variance with Original Final Amounts Final Budget
RevenuesCharges for services 6,758,161$ 6,758,161$ 6,758,161$ -$ Investment earnings 11,000 11,000 19,055 8,055 Total revenues 6,769,161 6,769,161 6,777,216 8,055
ExpendituresCurrent - departmental:Not allocated to organizational units:
Materials and services 3,727 3,727 3,727 - Debt service 7,606,434 7,633,869 6,396,565 (1,237,304)
Total expenditures 7,610,161 7,637,596 6,400,292 (1,237,304)
Net change in fund balance (841,000) (868,435) 376,924 1,245,359
Fund balance, June 30, 2015 841,000 868,435 868,435 - Fund balance, budget basis, June 30, 2016 -$ -$ 1,245,359 1,245,359$
Unrealized gain (loss) on investments 5,371 Accrued investment earnings 8,026 Interest payable (276,797) Long-term debt (61,156,429) Total net position, GAAP basis, June 30, 2016 (60,174,470)$
Budgeted Amounts
144
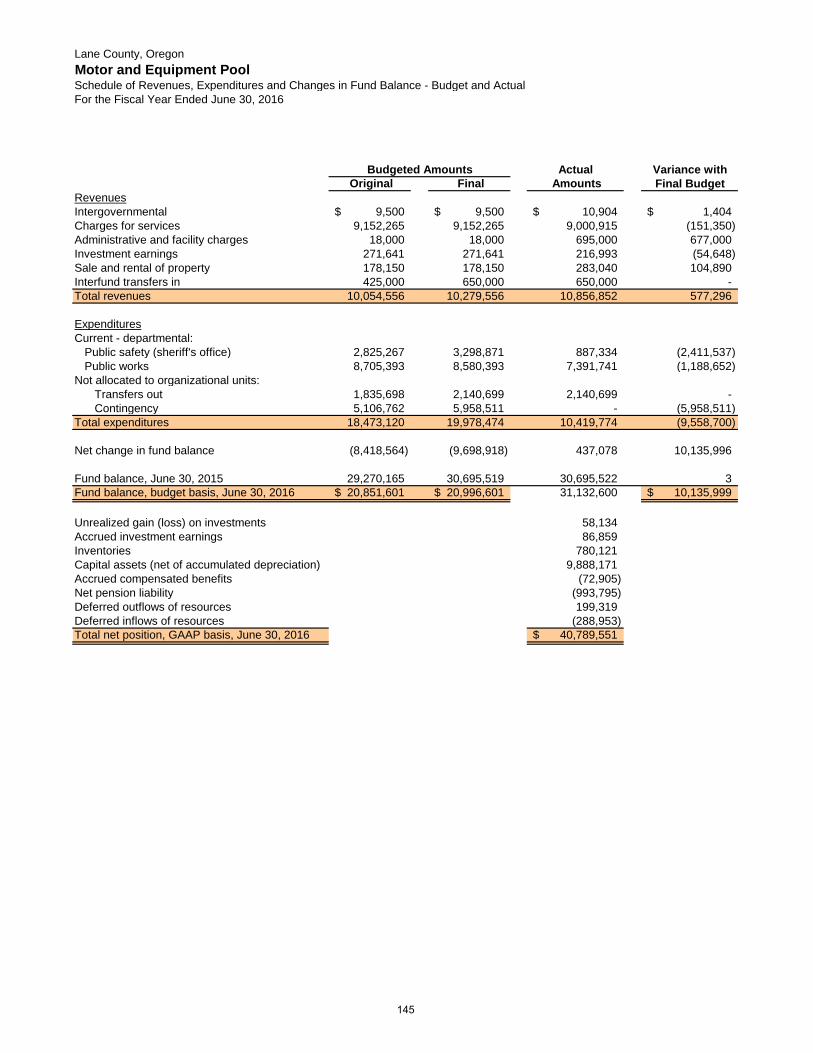
Lane County, OregonMotor and Equipment PoolSchedule of Revenues, Expenditures and Changes in Fund Balance - Budget and ActualFor the Fiscal Year Ended June 30, 2016
Actual Variance with Original Final Amounts Final Budget
RevenuesIntergovernmental 9,500$ 9,500$ 10,904$ 1,404$ Charges for services 9,152,265 9,152,265 9,000,915 (151,350) Administrative and facility charges 18,000 18,000 695,000 677,000 Investment earnings 271,641 271,641 216,993 (54,648) Sale and rental of property 178,150 178,150 283,040 104,890 Interfund transfers in 425,000 650,000 650,000 - Total revenues 10,054,556 10,279,556 10,856,852 577,296
ExpendituresCurrent - departmental:
Public safety (sheriff's office) 2,825,267 3,298,871 887,334 (2,411,537) Public works 8,705,393 8,580,393 7,391,741 (1,188,652)
Not allocated to organizational units:Transfers out 1,835,698 2,140,699 2,140,699 - Contingency 5,106,762 5,958,511 - (5,958,511)
Total expenditures 18,473,120 19,978,474 10,419,774 (9,558,700)
Net change in fund balance (8,418,564) (9,698,918) 437,078 10,135,996
Fund balance, June 30, 2015 29,270,165 30,695,519 30,695,522 3 Fund balance, budget basis, June 30, 2016 20,851,601$ 20,996,601$ 31,132,600 10,135,999$
Unrealized gain (loss) on investments 58,134 Accrued investment earnings 86,859 Inventories 780,121 Capital assets (net of accumulated depreciation) 9,888,171 Accrued compensated benefits (72,905) Net pension liability (993,795) Deferred outflows of resources 199,319 Deferred inflows of resources (288,953) Total net position, GAAP basis, June 30, 2016 40,789,551$
Budgeted Amounts
145
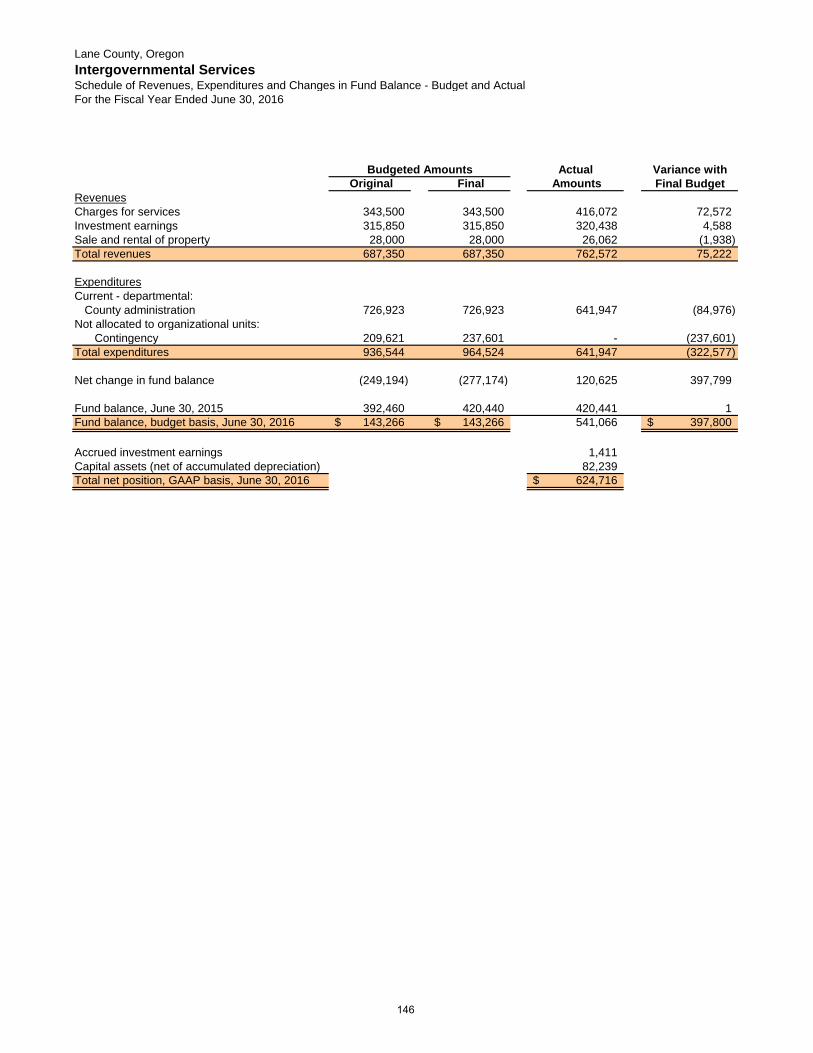
Lane County, OregonIntergovernmental ServicesSchedule of Revenues, Expenditures and Changes in Fund Balance - Budget and ActualFor the Fiscal Year Ended June 30, 2016
Actual Variance with Original Final Amounts Final Budget
RevenuesCharges for services 343,500 343,500 416,072 72,572 Investment earnings 315,850 315,850 320,438 4,588 Sale and rental of property 28,000 28,000 26,062 (1,938) Total revenues 687,350 687,350 762,572 75,222
ExpendituresCurrent - departmental:
County administration 726,923 726,923 641,947 (84,976) Not allocated to organizational units:
Contingency 209,621 237,601 - (237,601) Total expenditures 936,544 964,524 641,947 (322,577)
Net change in fund balance (249,194) (277,174) 120,625 397,799
Fund balance, June 30, 2015 392,460 420,440 420,441 1 Fund balance, budget basis, June 30, 2016 143,266$ 143,266$ 541,066 397,800$
Accrued investment earnings 1,411 Capital assets (net of accumulated depreciation) 82,239 Total net position, GAAP basis, June 30, 2016 624,716$
Budgeted Amounts
146
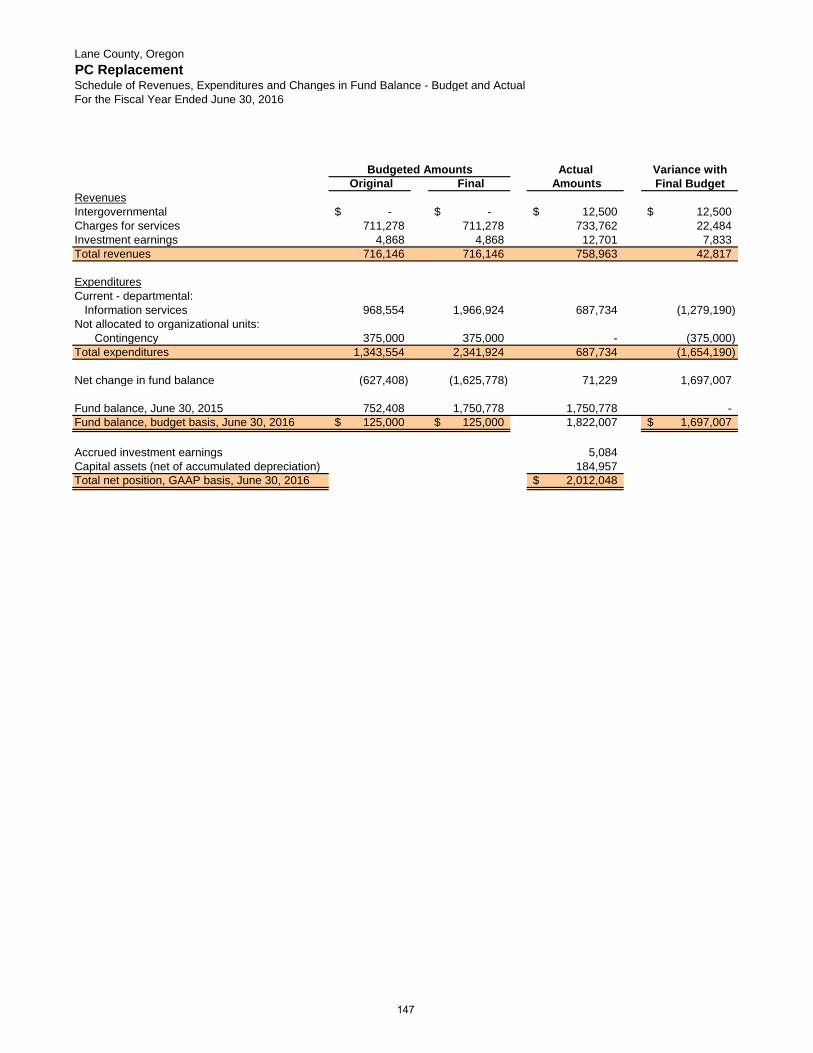
Lane County, OregonPC ReplacementSchedule of Revenues, Expenditures and Changes in Fund Balance - Budget and ActualFor the Fiscal Year Ended June 30, 2016
Actual Variance with Original Final Amounts Final Budget
RevenuesIntergovernmental -$ -$ 12,500$ 12,500$ Charges for services 711,278 711,278 733,762 22,484 Investment earnings 4,868 4,868 12,701 7,833 Total revenues 716,146 716,146 758,963 42,817
ExpendituresCurrent - departmental:
Information services 968,554 1,966,924 687,734 (1,279,190) Not allocated to organizational units:
Contingency 375,000 375,000 - (375,000) Total expenditures 1,343,554 2,341,924 687,734 (1,654,190)
Net change in fund balance (627,408) (1,625,778) 71,229 1,697,007
Fund balance, June 30, 2015 752,408 1,750,778 1,750,778 - Fund balance, budget basis, June 30, 2016 125,000$ 125,000$ 1,822,007 1,697,007$
Accrued investment earnings 5,084 Capital assets (net of accumulated depreciation) 184,957 Total net position, GAAP basis, June 30, 2016 2,012,048$
Budgeted Amounts
147
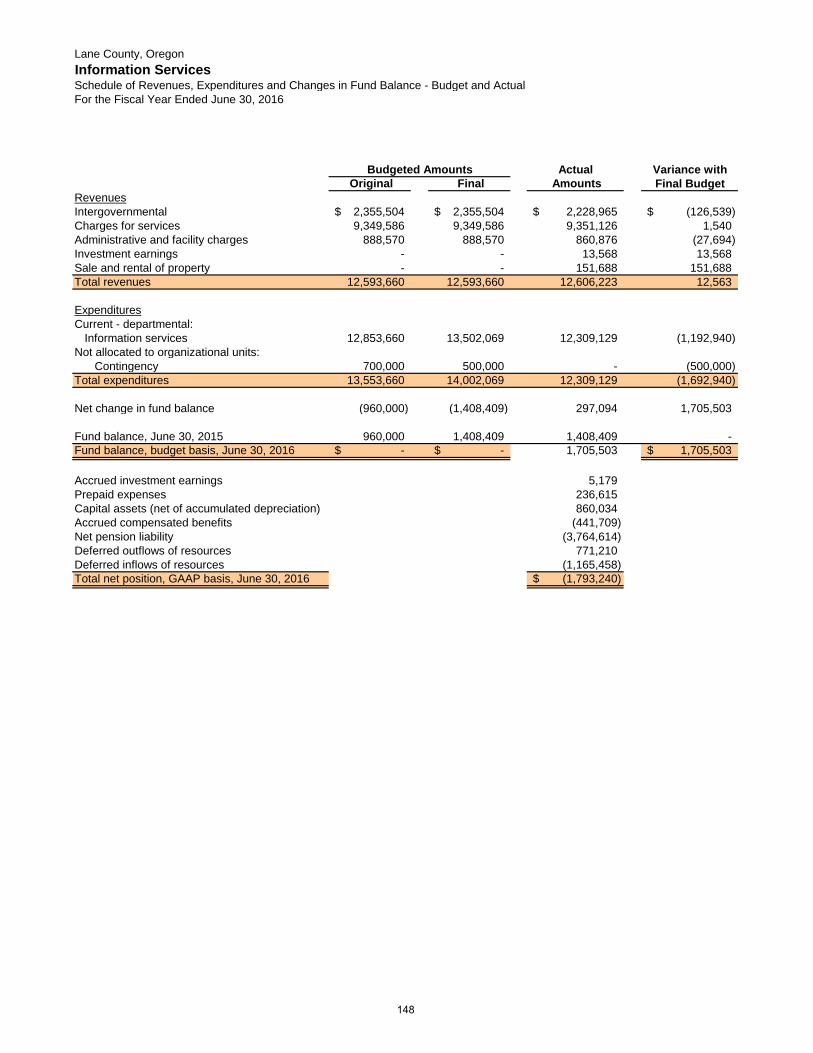
Lane County, OregonInformation ServicesSchedule of Revenues, Expenditures and Changes in Fund Balance - Budget and ActualFor the Fiscal Year Ended June 30, 2016
Actual Variance with Original Final Amounts Final Budget
RevenuesIntergovernmental 2,355,504$ 2,355,504$ 2,228,965$ (126,539)$ Charges for services 9,349,586 9,349,586 9,351,126 1,540 Administrative and facility charges 888,570 888,570 860,876 (27,694) Investment earnings - - 13,568 13,568 Sale and rental of property - - 151,688 151,688 Total revenues 12,593,660 12,593,660 12,606,223 12,563
ExpendituresCurrent - departmental:
Information services 12,853,660 13,502,069 12,309,129 (1,192,940) Not allocated to organizational units:
Contingency 700,000 500,000 - (500,000) Total expenditures 13,553,660 14,002,069 12,309,129 (1,692,940)
Net change in fund balance (960,000) (1,408,409) 297,094 1,705,503
Fund balance, June 30, 2015 960,000 1,408,409 1,408,409 - Fund balance, budget basis, June 30, 2016 -$ -$ 1,705,503 1,705,503$
Accrued investment earnings 5,179 Prepaid expenses 236,615 Capital assets (net of accumulated depreciation) 860,034 Accrued compensated benefits (441,709) Net pension liability (3,764,614) Deferred outflows of resources 771,210 Deferred inflows of resources (1,165,458) Total net position, GAAP basis, June 30, 2016 (1,793,240)$
Budgeted Amounts
148

Lane County, OregonRetiree Medical Benefit TrustSchedule of Revenues, Expenditures and Changes in Fund Balance - Budget and ActualFor the Fiscal Year Ended June 30, 2016
Actual Variance with Original Final Amounts Final Budget
RevenuesCharges for services 3,062,382$ 3,062,382$ 2,870,405$ (191,977)$ Investment earnings 70,000 70,000 82,068 12,068 Total revenues 3,132,382 3,132,382 2,952,473 (179,909)
ExpendituresCurrent - departmental:Not allocated to organizational units:
Materials and services 3,543,204 3,543,204 3,236,975 (306,229) Contingency 500,000 500,000 - (500,000)
Total expenditures 4,043,204 4,043,204 3,236,975 (806,229)
Net change in fund balance (910,822) (910,822) (284,502) 626,320
Fund balance, June 30, 2015 11,425,915 11,493,746 11,493,746 - Fund balance, budget basis, June 30, 2016 10,515,093$ 10,582,924$ 11,209,244 626,320$
Unrealized gain (loss) on investments 21,632 Accrued investment earnings 32,321 OPEB payable (125,404) Total net position, GAAP basis, June 30, 2016 11,137,793$
Budgeted Amounts
149

150
FIDUCIARY FUNDS The Statement of Fiduciary Net Position is reported in the basic financial statements. The Schedule of Changes in Assets and Liabilities for the Property Tax Agency Fund are presented in this section. Property Tax Agency Fund – This fund accounts for property taxes received and held by the County in a purely custodial capacity for other taxing jurisdictions within the County.
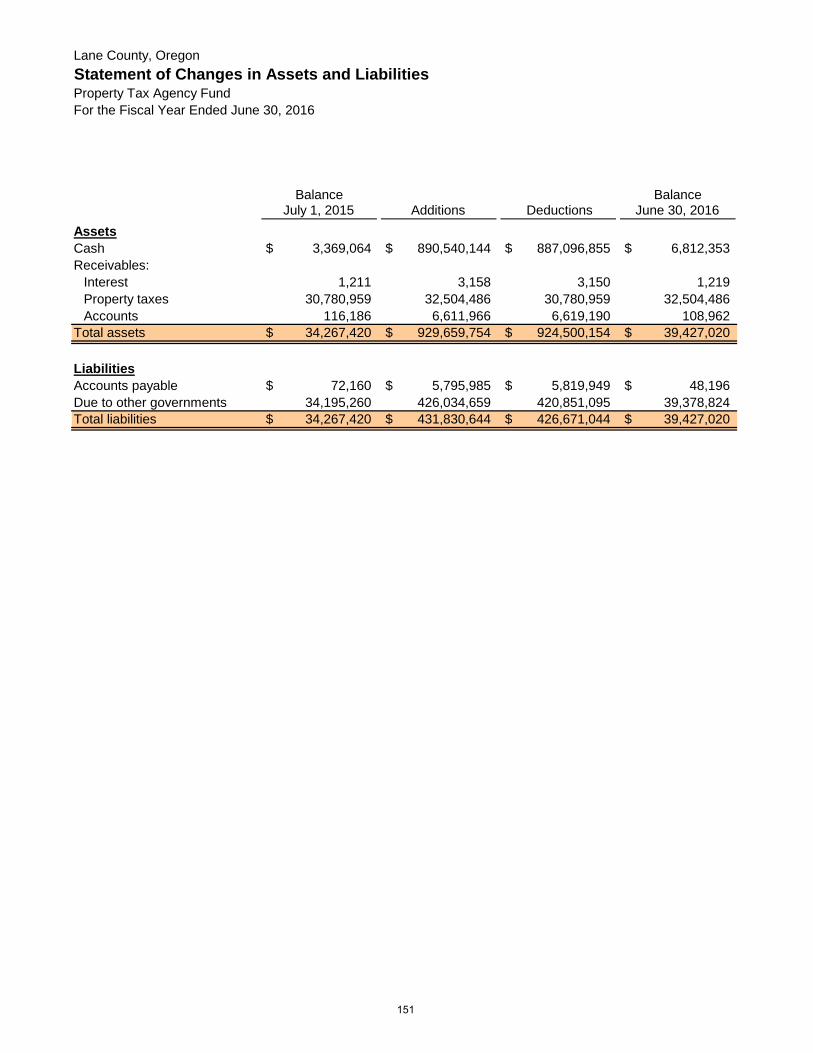
Lane County, OregonStatement of Changes in Assets and LiabilitiesProperty Tax Agency FundFor the Fiscal Year Ended June 30, 2016
Balance BalanceJuly 1, 2015 Additions Deductions June 30, 2016
AssetsCash 3,369,064$ 890,540,144$ 887,096,855$ 6,812,353$ Receivables:
Interest 1,211 3,158 3,150 1,219 Property taxes 30,780,959 32,504,486 30,780,959 32,504,486 Accounts 116,186 6,611,966 6,619,190 108,962
Total assets 34,267,420$ 929,659,754$ 924,500,154$ 39,427,020$
LiabilitiesAccounts payable 72,160$ 5,795,985$ 5,819,949$ 48,196$ Due to other governments 34,195,260 426,034,659 420,851,095 39,378,824 Total liabilities 34,267,420$ 431,830,644$ 426,671,044$ 39,427,020$
151

152

OTHER SUPPLEMENTARY SCHEDULES
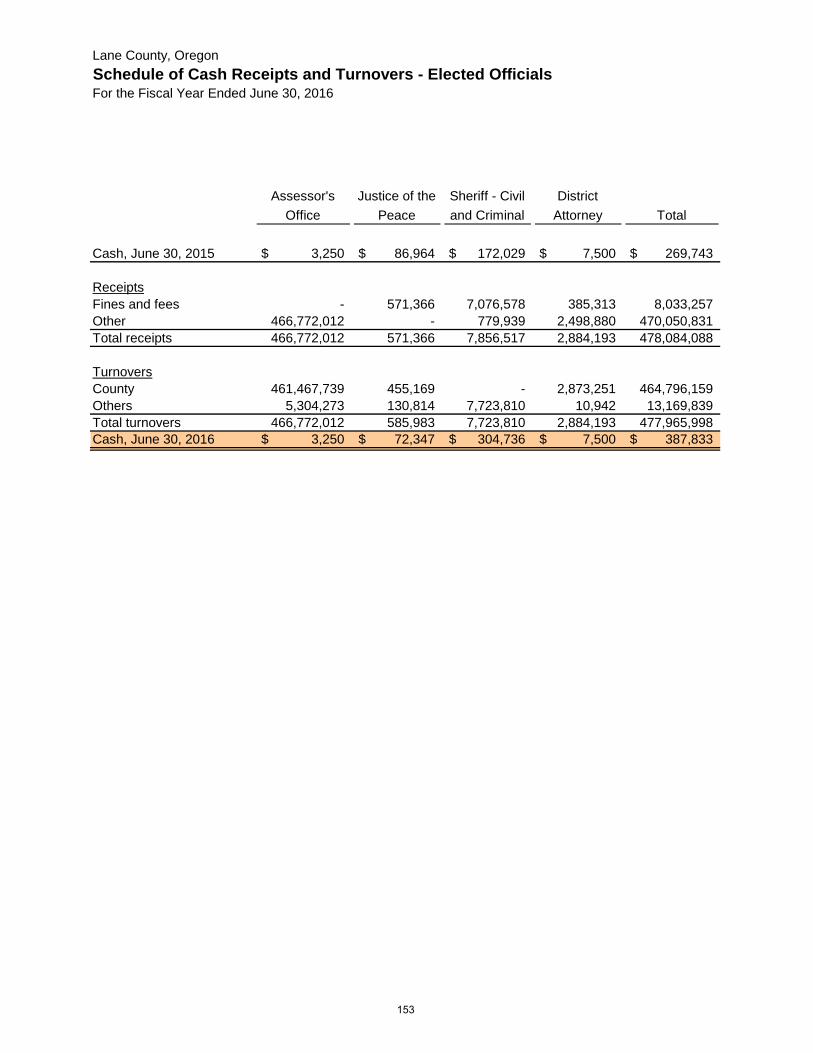
Lane County, OregonSchedule of Cash Receipts and Turnovers - Elected OfficialsFor the Fiscal Year Ended June 30, 2016
Assessor's Office
Justice of the Peace
Sheriff - Civil and Criminal
District Attorney Total
Cash, June 30, 2015 3,250$ 86,964$ 172,029$ 7,500$ 269,743$
ReceiptsFines and fees - 571,366 7,076,578 385,313 8,033,257 Other 466,772,012 - 779,939 2,498,880 470,050,831 Total receipts 466,772,012 571,366 7,856,517 2,884,193 478,084,088
TurnoversCounty 461,467,739 455,169 - 2,873,251 464,796,159 Others 5,304,273 130,814 7,723,810 10,942 13,169,839 Total turnovers 466,772,012 585,983 7,723,810 2,884,193 477,965,998 Cash, June 30, 2016 3,250$ 72,347$ 304,736$ 7,500$ 387,833$
153

Lane County, Oregon
For the Fiscal Year ended June 30, 2016
OLD BALANCE A&T line06 A&T line15 A&T line27 line16,27 A&T line13 SUM Taxes Add Deduct Add Interest Deduct Deduct Taxes Receivable Current Discounts on Delinquent Cash Corrections and Receivable
Tax Year June 30, 2015 Levy Allowed Taxes Collections Adjustments June 30, 2016
2015-16 -$ 478,089,746$ (12,353,882)$ 164,271$ (449,929,965)$ (3,067,366)$ 12,902,804$
2014-15 12,699,115 - 10,872 367,831 (4,915,306) (492,030) 7,670,482 2013-14 7,154,849 - 2,214 391,609 (2,334,684) (204,900) 5,009,088 2012-13 4,721,488 - 2,663 453,269 (1,846,079) (204,106) 3,127,235 2011-12 3,075,931 - 140 279,843 (1,056,143) (30,947) 2,268,824 2010-11 2,201,287 - 99 48,420 (140,829) (123,520) 1,985,457 2009-10 1,942,478 - 132 38,465 (99,204) (30,458) 1,851,413
Prior 2,745,772 - 277 75,762 (144,543) (942,186) 1,735,082
34,540,920 - 16,397 1,655,199 (10,536,788) (2,028,147) 23,647,581
34,540,920$ 478,089,746$ (12,337,485)$ 1,819,470$ (460,466,753)$ (5,095,513)$ 36,550,385$
Schedule of Property Tax Transactions
154
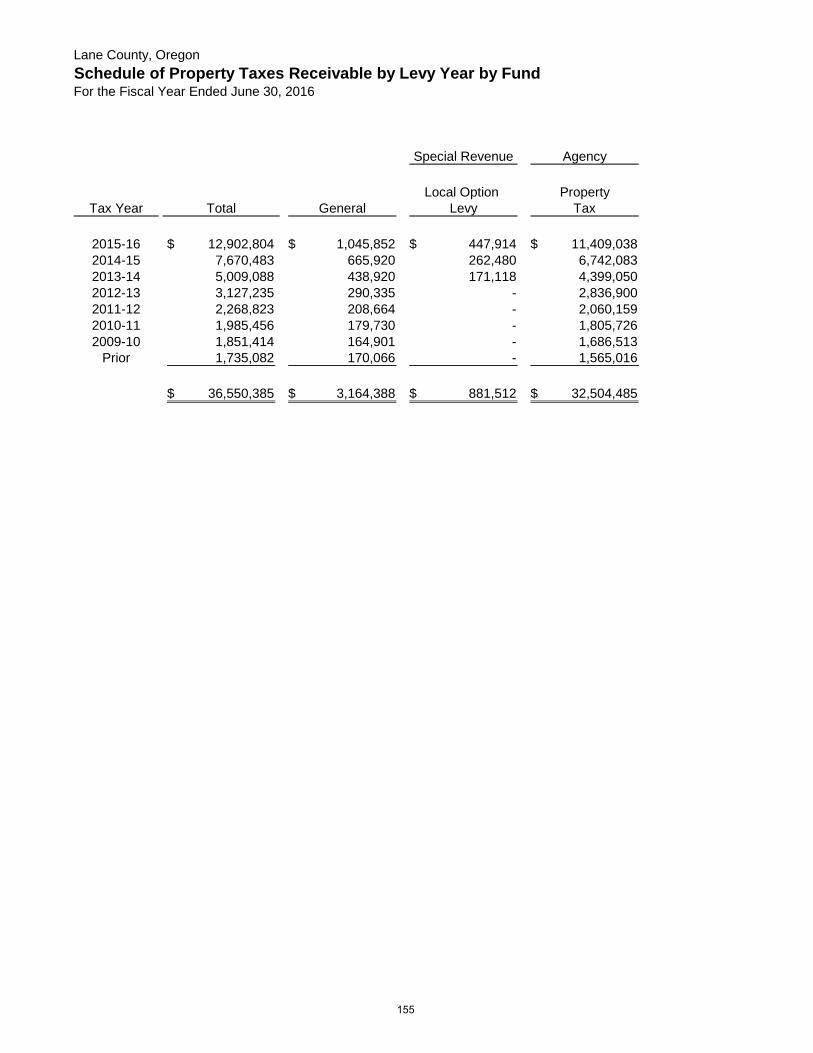
Lane County, OregonSchedule of Property Taxes Receivable by Levy Year by FundFor the Fiscal Year Ended June 30, 2016
Special Revenue Agency
Local Option PropertyTax Year Total General Levy Tax
2015-16 12,902,804$ 1,045,852$ 447,914$ 11,409,038$ 2014-15 7,670,483 665,920 262,480 6,742,083 2013-14 5,009,088 438,920 171,118 4,399,050 2012-13 3,127,235 290,335 - 2,836,900 2011-12 2,268,823 208,664 - 2,060,159 2010-11 1,985,456 179,730 - 1,805,726 2009-10 1,851,414 164,901 - 1,686,513
Prior 1,735,082 170,066 - 1,565,016
36,550,385$ 3,164,388$ 881,512$ 32,504,485$
155
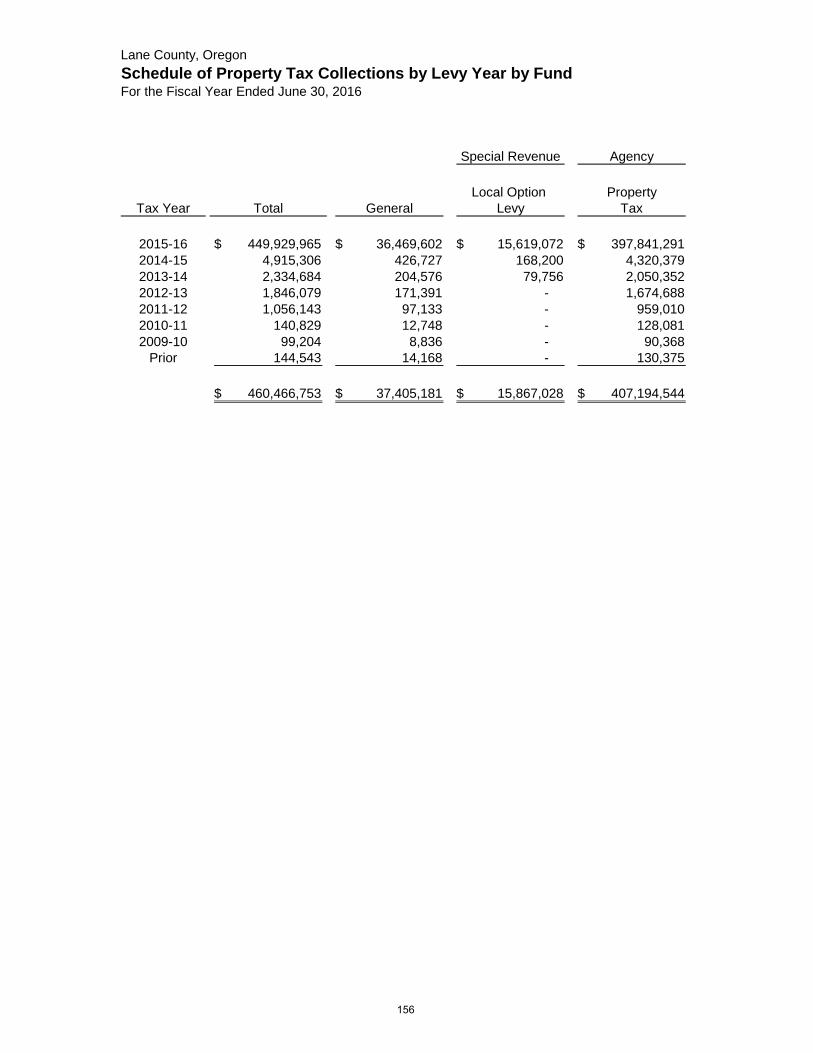
Lane County, OregonSchedule of Property Tax Collections by Levy Year by FundFor the Fiscal Year Ended June 30, 2016
Special Revenue Agency
Local Option PropertyTax Year Total General Levy Tax
2015-16 449,929,965$ 36,469,602$ 15,619,072$ 397,841,291$ 2014-15 4,915,306 426,727 168,200 4,320,379 2013-14 2,334,684 204,576 79,756 2,050,352 2012-13 1,846,079 171,391 - 1,674,688 2011-12 1,056,143 97,133 - 959,010 2010-11 140,829 12,748 - 128,081 2009-10 99,204 8,836 - 90,368
Prior 144,543 14,168 - 130,375
460,466,753$ 37,405,181$ 15,867,028$ 407,194,544$
156

STATISTICAL SECTION
STATISTICAL SECTION
This section of the County’s comprehensive annual financial report presents detailed information as a context for understanding what the information in the financial statements, note disclosures, and required supplementary information says about the County’s overall financial health. Contents
Page(s) Financial Trends - These schedules contain trend information to help the reader understand how the County’s financial performance and well-being have changed over time.
158 – 167 Revenue Capacity - These schedules contain information to help the reader assess the County’s most significant local revenue source, the property tax.
168 – 177 Debt Capacity - These schedules present information to help the reader assess the affordability of the County’s current levels of outstanding debt and its ability to issue additional debt in the future.
178 – 185 Demographic and Economic Information - These schedules offer demographic and economic indicators to help the reader understand the environment within which the County’s financial activities take place.
187 – 191 Operating Information - These schedules contain service and infrastructure data to help the reader understand how the information in the government’s financial report relates to the services the government provides and the activities it performs.
192 – 195

157

Lane County, OregonNet Position by Component cLast Ten Fiscal Years - Unaudited(Accrual Basis of Accounting)
2007 a 2008 a 2009 a 2010 a 2011 a
Governmental activities:Net investment in capital assets 270,548,421$ 280,364,178$ 303,124,109$ 292,767,770$ 295,107,779$ Restricted 66,396,137 68,603,080 72,830,234 77,672,275 85,578,785 Unrestricted e 41,648,113 46,688,141 46,065,805 59,736,037 56,434,134
Total governmental activities net position 378,592,671$ 395,655,399$ 422,020,148$ 430,176,082$ 437,120,698$
Business-type activities:Net investment in capital assets a, b 30,150,188$ 38,667,537$ 32,130,819$ 42,301,510$ 43,050,094$ Unrestricted a, b 26,644,731 26,445,461 37,657,583 30,357,189 31,065,278
Total business-type activities net position 56,794,919$ 65,112,998$ 69,788,402$ 72,658,699$ 74,115,372$
Primary government:Net investment in capital assets 300,698,609$ 319,031,715$ 335,254,928$ 335,069,280$ 338,157,873$ Restricted 66,396,137 68,603,080 72,830,234 77,672,275 85,578,785 Unrestricted 68,292,844 73,133,602 83,723,388 90,093,226 87,499,412
Total primary government net position 435,387,590$ 460,768,397$ 491,808,550$ 502,834,781$ 511,236,070$
Notesa. In accordance with GASB No. 61, the Housing and Community Services Agency (HACSA) has been reclassified
as a discretely presented component unit. In order to enhance comparability, HACSA has been removed from the business-type activities of the primary government for fiscal years 2011 and prior.
b. In 2012, the Regional Information Systems enterprise fund was closed, and residual assets and liabilities transferred to the Information Services internal service fund.
c. In 2013, GASB No. 63 changed the term "Net Assets" to be "Net Position". The term has been changed retroactively.d. In 2014, the first year of a five year local option tax was levied, increasing restricted net position in governmental activities dramatically.e. In 2016, an unrestricted credit balance of ($2,014,755) resulted from the application of GASB No. 68 and the increase in the
County's share of Net Pension Liaibity during the measurement period ended June 30, 2015. Source
Lane County Administration Operations Division - Financial Services
Fiscal Year
158
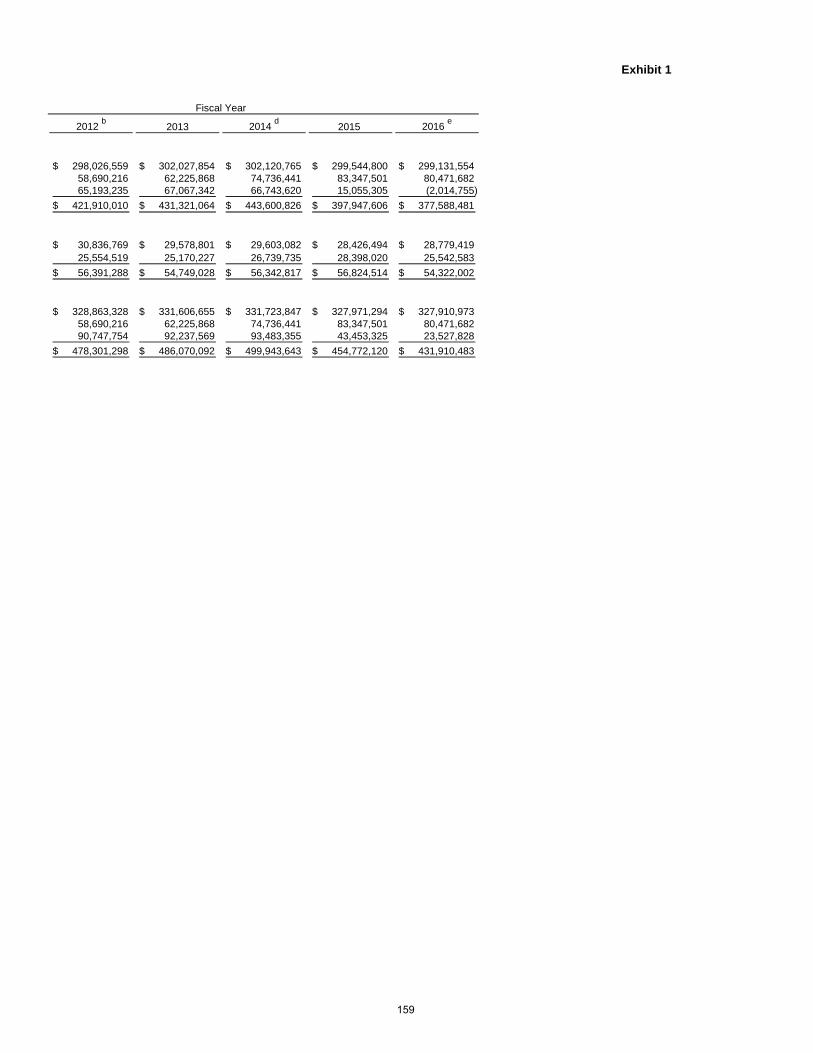
Exhibit 1
2012 b 2013 2014 d 2015 2016 e
298,026,559$ 302,027,854$ 302,120,765$ 299,544,800$ 299,131,554$ 58,690,216 62,225,868 74,736,441 83,347,501 80,471,682 65,193,235 67,067,342 66,743,620 15,055,305 (2,014,755)
421,910,010$ 431,321,064$ 443,600,826$ 397,947,606$ 377,588,481$
30,836,769$ 29,578,801$ 29,603,082$ 28,426,494$ 28,779,419$ 25,554,519 25,170,227 26,739,735 28,398,020 25,542,583 56,391,288$ 54,749,028$ 56,342,817$ 56,824,514$ 54,322,002$
328,863,328$ 331,606,655$ 331,723,847$ 327,971,294$ 327,910,973$ 58,690,216 62,225,868 74,736,441 83,347,501 80,471,682 90,747,754 92,237,569 93,483,355 43,453,325 23,527,828
478,301,298$ 486,070,092$ 499,943,643$ 454,772,120$ 431,910,483$
Fiscal Year
159

Lane County, Oregon
Changes in Net Position g
Last Ten Fiscal Years - Unaudited(Accrual Basis of Accounting)
2007 b 2008 b 2009 b 2010 b
Expenses a
Governmental activities:General government 23,343,136$ 24,314,130$ 23,707,850$ 22,969,227$ Public safety 72,512,429 69,773,674 68,306,961 72,156,772 Public health and welfare 77,823,153 65,143,716 72,141,928 80,727,605 Parks 2,098,591 2,034,627 2,228,917 2,265,231 Roads and bridges 38,152,445 34,269,244 36,963,176 38,029,493 Community development 10,243,725 6,735,178 6,833,436 6,436,605 Interest on long-term debt 6,811,425 7,087,061 6,764,497 6,981,018
Total governmental activities expenses 230,984,904 209,357,630 216,946,765 229,565,951
Business-type activities:Lane events center 5,652,510 5,487,557 4,624,038 3,940,841 Solid waste disposal 11,344,394 12,224,474 12,994,158 13,482,367 Corrections commissary 360,655 316,331 255,331 256,750 Regional information systems e 5,338,479 5,861,680 5,803,740 6,184,926 Land management d - 5,127,797 4,716,148 4,434,762
Total business-type activities expenses 22,696,038 29,017,839 28,393,415 28,299,646
Total primary government expenses 253,680,942$ 238,375,469$ 245,340,180$ 257,865,597$ Program revenuesGovernmental activities:
Charges for services:Public safety 26,060,493$ 20,311,315$ 19,587,163$ 19,303,348$ Public health and welfare 30,852,880 35,477,860 38,017,323 42,441,369 Other activities d 22,828,695 17,846,049 23,520,029 14,600,633
Operating grants and contributions 108,013,896 93,546,525 103,273,501 102,466,765 Total governmental activities program revenues 187,755,964 167,181,749 184,398,016 178,812,115
Business-type activities:Charges for services:
Lane events center 4,341,738 4,217,533 2,775,494 2,639,207 Solid waste disposal 12,794,524 16,722,858 15,375,416 15,197,089 Other activities d,e 7,062,225 12,757,558 11,882,552 11,711,600
Operating grants and contributions 216,420 343,594 287,460 229,937 Capital grants and contributions - - - -
Total business-type activities program revenues 24,414,907 34,041,543 30,320,922 29,777,833
Total primary government program revenues 212,170,871$ 201,223,292$ 214,718,938$ 208,589,948$
Net expense (revenue)Governmental activities (43,228,940)$ (42,175,881)$ (32,548,749)$ (50,753,836)$ Business-type activities 1,718,869 5,023,704 1,927,507 1,478,187
Total primary government net expense h(41,510,071)$ (37,152,177)$ (30,621,242)$ (49,275,649)$
General revenues and other changes in net positionGovernmental activities:
Property taxes, net of refunds h 31,184,338$ 32,435,442$ 34,349,397$ 36,042,688$ Transient room taxes 3,815,362 4,297,827 3,893,241 3,617,406 Car rental taxes 1,326,996 1,323,636 1,072,906 1,097,859 O&C timber receipts 15,068,243 15,037,319 13,561,419 12,205,277 Unrestricted investment earnings 3,329,094 3,195,356 2,567,673 1,745,829 Grants not restricted to specific programs 4,400,648 5,033,509 5,301,445 5,063,935 Special items f - - - - Transfers e (906,360) (2,084,480) (1,832,583) (863,224)
Total governmental activities 58,218,321 59,238,609 58,913,498 58,909,770
Business-type activities:Transient room taxes - - - - Unrestricted investment earnings 1,394,743 1,209,895 915,314 528,886 Special Items j - - - - Transfers e 906,360 2,084,480 1,832,583 863,224
Total business-type activities 2,301,103 3,294,375 2,747,897 1,392,110
Total primary government 60,519,424$ 62,532,984$ 61,661,395$ 60,301,880$
Fiscal Year
160
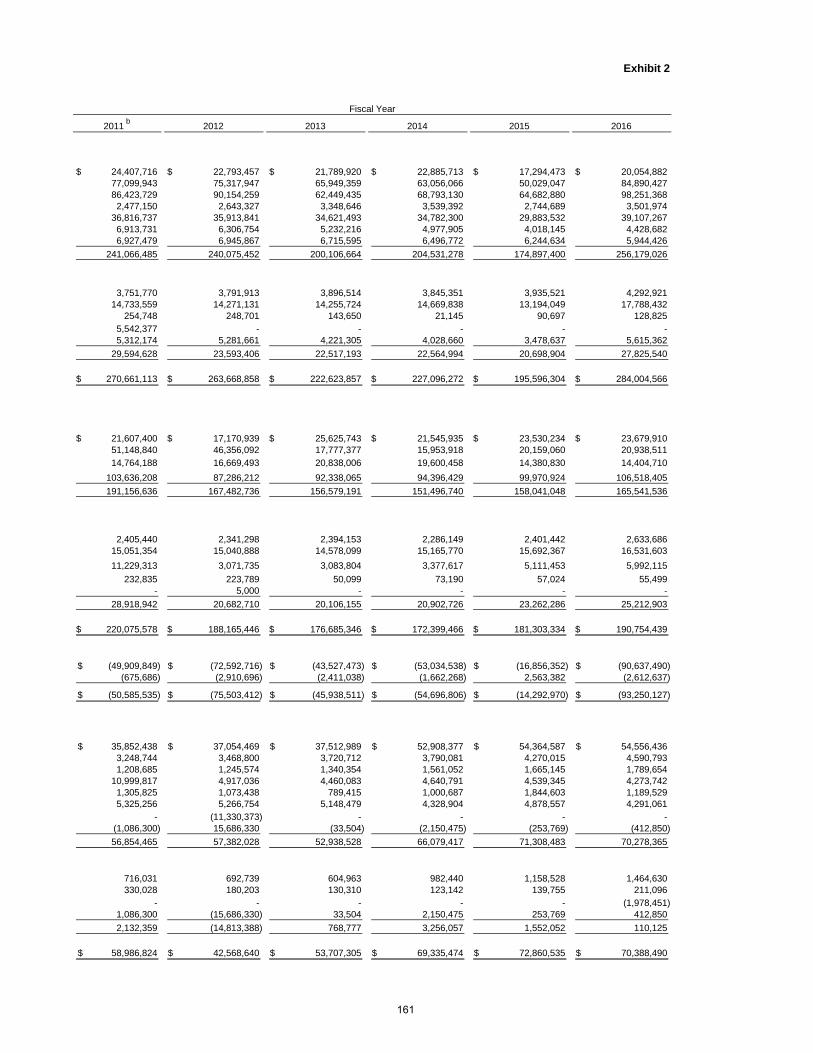
Exhibit 2
2011 b 2012 2013 2014 2015 2016
24,407,716$ 22,793,457$ 21,789,920$ 22,885,713$ 17,294,473$ 20,054,882$ 77,099,943 75,317,947 65,949,359 63,056,066 50,029,047 84,890,427 86,423,729 90,154,259 62,449,435 68,793,130 64,682,880 98,251,368 2,477,150 2,643,327 3,348,646 3,539,392 2,744,689 3,501,974
36,816,737 35,913,841 34,621,493 34,782,300 29,883,532 39,107,267 6,913,731 6,306,754 5,232,216 4,977,905 4,018,145 4,428,682 6,927,479 6,945,867 6,715,595 6,496,772 6,244,634 5,944,426
241,066,485 240,075,452 200,106,664 204,531,278 174,897,400 256,179,026
3,751,770 3,791,913 3,896,514 3,845,351 3,935,521 4,292,921 14,733,559 14,271,131 14,255,724 14,669,838 13,194,049 17,788,432
254,748 248,701 143,650 21,145 90,697 128,825 5,542,377 - - - - - 5,312,174 5,281,661 4,221,305 4,028,660 3,478,637 5,615,362
29,594,628 23,593,406 22,517,193 22,564,994 20,698,904 27,825,540
270,661,113$ 263,668,858$ 222,623,857$ 227,096,272$ 195,596,304$ 284,004,566$
21,607,400$ 17,170,939$ 25,625,743$ 21,545,935$ 23,530,234$ 23,679,910$ 51,148,840 46,356,092 17,777,377 15,953,918 20,159,060 20,938,511 14,764,188 16,669,493 20,838,006 19,600,458 14,380,830 14,404,710
103,636,208 87,286,212 92,338,065 94,396,429 99,970,924 106,518,405 191,156,636 167,482,736 156,579,191 151,496,740 158,041,048 165,541,536
2,405,440 2,341,298 2,394,153 2,286,149 2,401,442 2,633,686 15,051,354 15,040,888 14,578,099 15,165,770 15,692,367 16,531,603 11,229,313 3,071,735 3,083,804 3,377,617 5,111,453 5,992,115
232,835 223,789 50,099 73,190 57,024 55,499 - 5,000 - - - -
28,918,942 20,682,710 20,106,155 20,902,726 23,262,286 25,212,903
220,075,578$ 188,165,446$ 176,685,346$ 172,399,466$ 181,303,334$ 190,754,439$
(49,909,849)$ (72,592,716)$ (43,527,473)$ (53,034,538)$ (16,856,352)$ (90,637,490)$ (675,686) (2,910,696) (2,411,038) (1,662,268) 2,563,382 (2,612,637)
(50,585,535)$ (75,503,412)$ (45,938,511)$ (54,696,806)$ (14,292,970)$ (93,250,127)$
35,852,438$ 37,054,469$ 37,512,989$ 52,908,377$ 54,364,587$ 54,556,436$ 3,248,744 3,468,800 3,720,712 3,790,081 4,270,015 4,590,793 1,208,685 1,245,574 1,340,354 1,561,052 1,665,145 1,789,654
10,999,817 4,917,036 4,460,083 4,640,791 4,539,345 4,273,742 1,305,825 1,073,438 789,415 1,000,687 1,844,603 1,189,529 5,325,256 5,266,754 5,148,479 4,328,904 4,878,557 4,291,061
- (11,330,373) - - - - (1,086,300) 15,686,330 (33,504) (2,150,475) (253,769) (412,850) 56,854,465 57,382,028 52,938,528 66,079,417 71,308,483 70,278,365
716,031 692,739 604,963 982,440 1,158,528 1,464,630 330,028 180,203 130,310 123,142 139,755 211,096
- - - - - (1,978,451) 1,086,300 (15,686,330) 33,504 2,150,475 253,769 412,850 2,132,359 (14,813,388) 768,777 3,256,057 1,552,052 110,125
58,986,824$ 42,568,640$ 53,707,305$ 69,335,474$ 72,860,535$ 70,388,490$
Fiscal Year
161
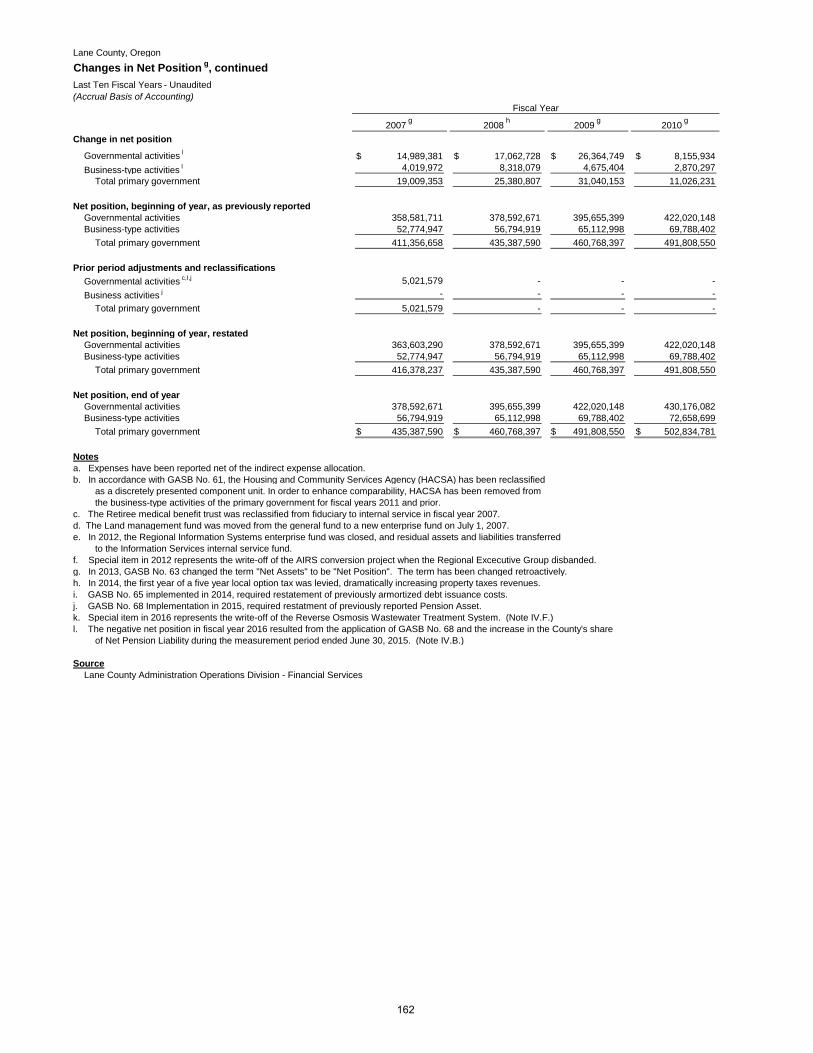
Lane County, Oregon
Changes in Net Position g, continuedLast Ten Fiscal Years - Unaudited(Accrual Basis of Accounting)
2007 g 2008 h 2009 g 2010 g
Change in net position
Governmental activities l 14,989,381$ 17,062,728$ 26,364,749$ 8,155,934$ Business-type activities l 4,019,972 8,318,079 4,675,404 2,870,297
Total primary government 19,009,353 25,380,807 31,040,153 11,026,231
Net position, beginning of year, as previously reportedGovernmental activities 358,581,711 378,592,671 395,655,399 422,020,148 Business-type activities 52,774,947 56,794,919 65,112,998 69,788,402
Total primary government 411,356,658 435,387,590 460,768,397 491,808,550
Prior period adjustments and reclassificationsGovernmental activities c,I,j 5,021,579 - - - Business activities j - - - -
Total primary government 5,021,579 - - -
Net position, beginning of year, restatedGovernmental activities 363,603,290 378,592,671 395,655,399 422,020,148 Business-type activities 52,774,947 56,794,919 65,112,998 69,788,402
Total primary government 416,378,237 435,387,590 460,768,397 491,808,550
Net position, end of yearGovernmental activities 378,592,671 395,655,399 422,020,148 430,176,082 Business-type activities 56,794,919 65,112,998 69,788,402 72,658,699
Total primary government 435,387,590$ 460,768,397$ 491,808,550$ 502,834,781$
Notesa. Expenses have been reported net of the indirect expense allocation.b. In accordance with GASB No. 61, the Housing and Community Services Agency (HACSA) has been reclassified
as a discretely presented component unit. In order to enhance comparability, HACSA has been removed from the business-type activities of the primary government for fiscal years 2011 and prior.
c. The Retiree medical benefit trust was reclassified from fiduciary to internal service in fiscal year 2007.d. The Land management fund was moved from the general fund to a new enterprise fund on July 1, 2007.e. In 2012, the Regional Information Systems enterprise fund was closed, and residual assets and liabilities transferred
to the Information Services internal service fund.f. Special item in 2012 represents the write-off of the AIRS conversion project when the Regional Excecutive Group disbanded.g. In 2013, GASB No. 63 changed the term "Net Assets" to be "Net Position". The term has been changed retroactively.h. In 2014, the first year of a five year local option tax was levied, dramatically increasing property taxes revenues.i. GASB No. 65 implemented in 2014, required restatement of previously armortized debt issuance costs.j. GASB No. 68 Implementation in 2015, required restatment of previously reported Pension Asset.k. Special item in 2016 represents the write-off of the Reverse Osmosis Wastewater Treatment System. (Note IV.F.) l. The negative net position in fiscal year 2016 resulted from the application of GASB No. 68 and the increase in the County's share
of Net Pension Liability during the measurement period ended June 30, 2015. (Note IV.B.)
SourceLane County Administration Operations Division - Financial Services
Fiscal Year
162

Exhibit 2, continued
2011 g 2012 g 2013 2014 2015 2016
6,944,616$ (15,210,688)$ 9,411,054$ 13,044,879$ 54,452,131$ (20,359,125)$ 1,456,673 (17,724,084) (1,642,260) 1,593,789 4,115,434 (2,502,512) 8,401,289 (32,934,772) 7,768,794 14,638,668 58,567,565 (22,861,637)
430,176,082 437,120,698 421,910,010 431,321,064 443,600,826 397,947,606 72,658,699 74,115,372 56,391,288 54,749,028 56,342,817 56,824,514
502,834,781 511,236,070 478,301,298 486,070,092 499,943,643 454,772,120
- - - (765,117) (100,105,351) - - - - - (3,633,737) - - - - (765,117) (103,739,088) -
430,176,082 437,120,698 421,910,010 430,555,947 343,495,475 397,947,606 72,658,699 74,115,372 56,391,288 54,749,028 52,709,080 56,824,514
502,834,781 511,236,070 478,301,298 485,304,975 396,204,555 454,772,120
437,120,698 421,910,010 431,321,064 443,600,826 397,947,606 377,588,481 74,115,372 56,391,288 54,749,028 56,342,817 56,824,514 54,322,002
511,236,070$ 478,301,298$ 486,070,092$ 499,943,643$ 454,772,120$ 431,910,483$
Fiscal Year
163
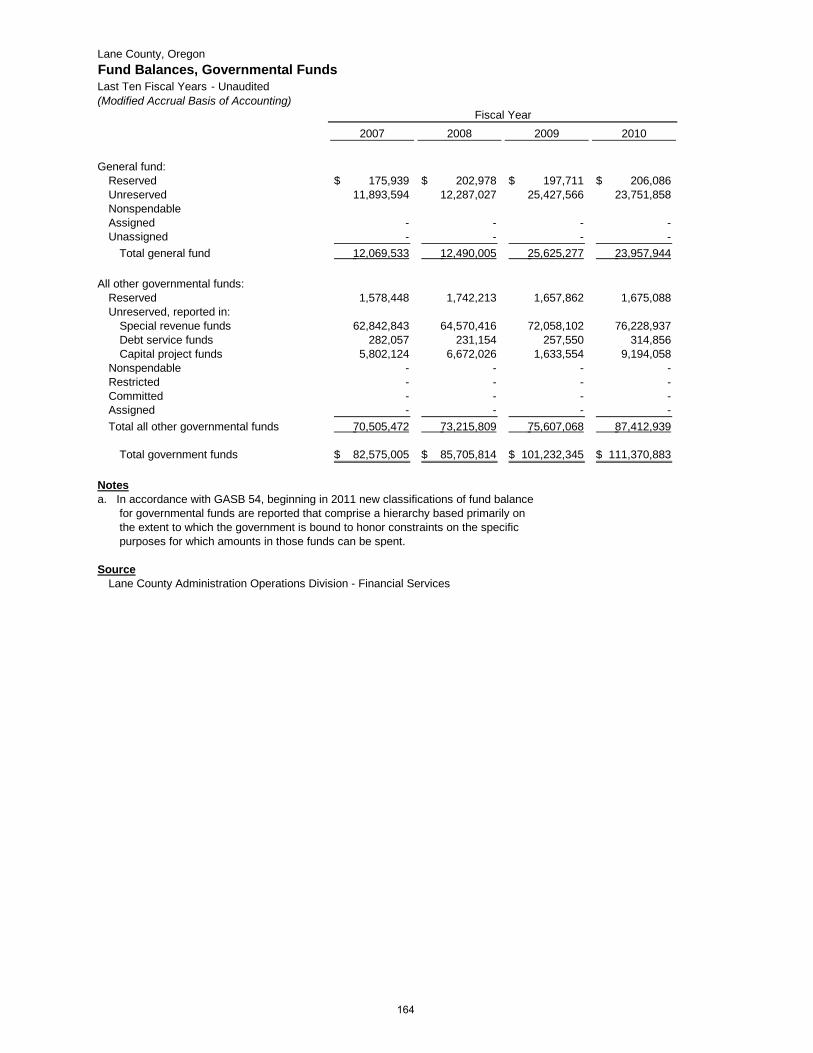
Lane County, OregonFund Balances, Governmental FundsLast Ten Fiscal Years - Unaudited(Modified Accrual Basis of Accounting)
2007 2008 2009 2010
General fund:Reserved 175,939$ 202,978$ 197,711$ 206,086$ Unreserved 11,893,594 12,287,027 25,427,566 23,751,858 NonspendableAssigned - - - - Unassigned - - - -
Total general fund 12,069,533 12,490,005 25,625,277 23,957,944
All other governmental funds:Reserved 1,578,448 1,742,213 1,657,862 1,675,088 Unreserved, reported in:
Special revenue funds 62,842,843 64,570,416 72,058,102 76,228,937 Debt service funds 282,057 231,154 257,550 314,856 Capital project funds 5,802,124 6,672,026 1,633,554 9,194,058
Nonspendable - - - - Restricted - - - - Committed - - - - Assigned - - - - Total all other governmental funds 70,505,472 73,215,809 75,607,068 87,412,939
Total government funds 82,575,005$ 85,705,814$ 101,232,345$ 111,370,883$
Notesa. In accordance with GASB 54, beginning in 2011 new classifications of fund balance
for governmental funds are reported that comprise a hierarchy based primarily onthe extent to which the government is bound to honor constraints on the specific purposes for which amounts in those funds can be spent.
SourceLane County Administration Operations Division - Financial Services
Fiscal Year
164
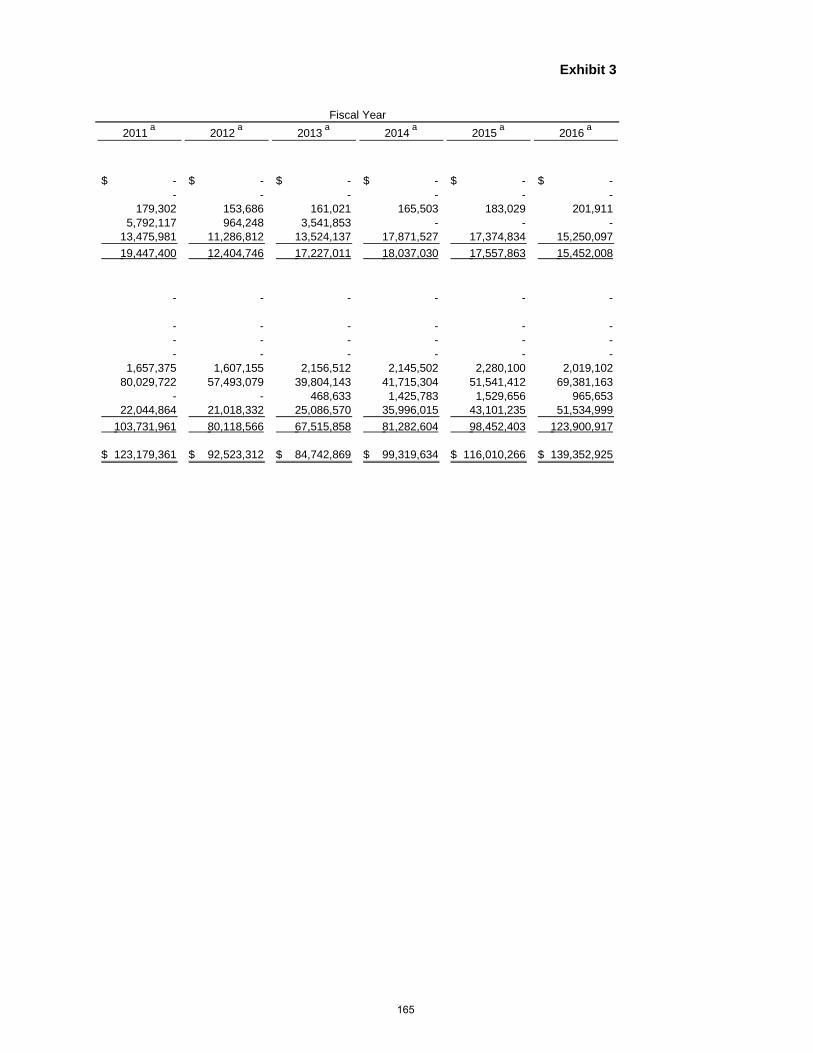
Exhibit 3
2011 a 2012 a 2013 a 2014 a 2015 a 2016 a
-$ -$ -$ -$ -$ -$ - - - - - -
179,302 153,686 161,021 165,503 183,029 201,911 5,792,117 964,248 3,541,853 - - -
13,475,981 11,286,812 13,524,137 17,871,527 17,374,834 15,250,097 19,447,400 12,404,746 17,227,011 18,037,030 17,557,863 15,452,008
- - - - - -
- - - - - - - - - - - - - - - - - -
1,657,375 1,607,155 2,156,512 2,145,502 2,280,100 2,019,102 80,029,722 57,493,079 39,804,143 41,715,304 51,541,412 69,381,163
- - 468,633 1,425,783 1,529,656 965,653 22,044,864 21,018,332 25,086,570 35,996,015 43,101,235 51,534,999
103,731,961 80,118,566 67,515,858 81,282,604 98,452,403 123,900,917
123,179,361$ 92,523,312$ 84,742,869$ 99,319,634$ 116,010,266$ 139,352,925$
Fiscal Year
165
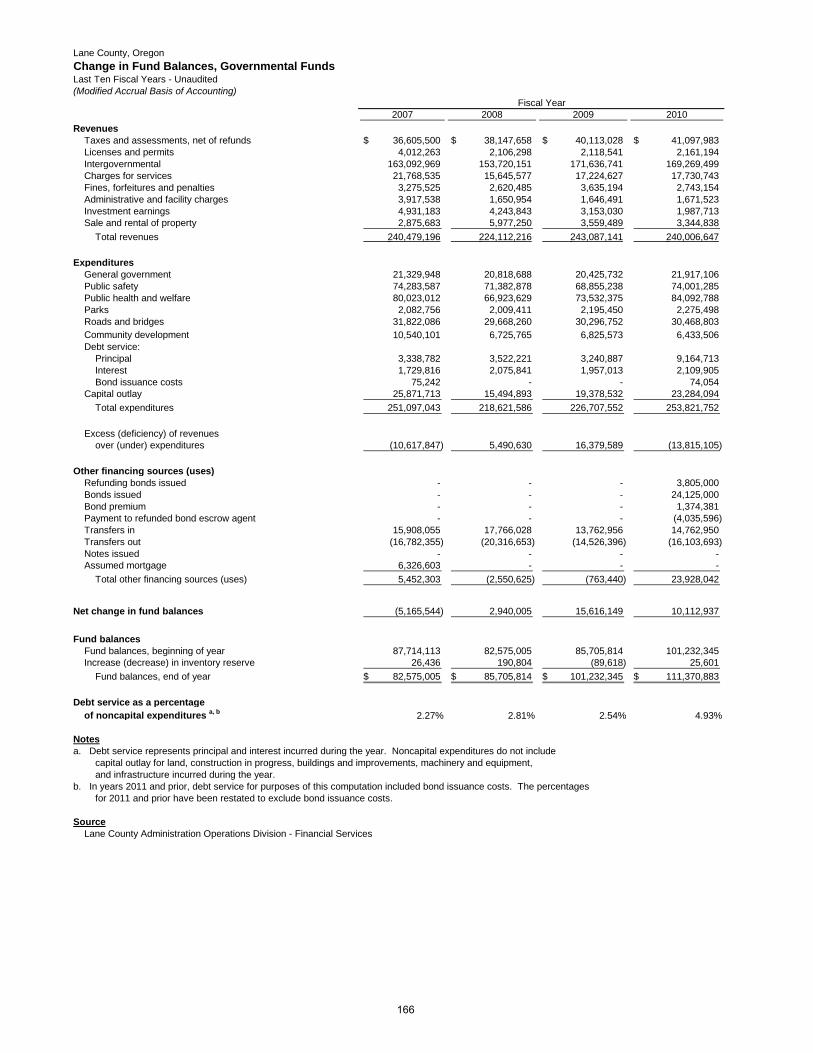
Lane County, OregonChange in Fund Balances, Governmental FundsLast Ten Fiscal Years - Unaudited(Modified Accrual Basis of Accounting)
2007 2008 2009 2010Revenues
Taxes and assessments, net of refunds 36,605,500$ 38,147,658$ 40,113,028$ 41,097,983$ Licenses and permits 4,012,263 2,106,298 2,118,541 2,161,194 Intergovernmental 163,092,969 153,720,151 171,636,741 169,269,499 Charges for services 21,768,535 15,645,577 17,224,627 17,730,743 Fines, forfeitures and penalties 3,275,525 2,620,485 3,635,194 2,743,154 Administrative and facility charges 3,917,538 1,650,954 1,646,491 1,671,523 Investment earnings 4,931,183 4,243,843 3,153,030 1,987,713 Sale and rental of property 2,875,683 5,977,250 3,559,489 3,344,838
Total revenues 240,479,196 224,112,216 243,087,141 240,006,647
ExpendituresGeneral government 21,329,948 20,818,688 20,425,732 21,917,106 Public safety 74,283,587 71,382,878 68,855,238 74,001,285 Public health and welfare 80,023,012 66,923,629 73,532,375 84,092,788 Parks 2,082,756 2,009,411 2,195,450 2,275,498 Roads and bridges 31,822,086 29,668,260 30,296,752 30,468,803 Community development 10,540,101 6,725,765 6,825,573 6,433,506 Debt service:
Principal 3,338,782 3,522,221 3,240,887 9,164,713 Interest 1,729,816 2,075,841 1,957,013 2,109,905 Bond issuance costs 75,242 - - 74,054
Capital outlay 25,871,713 15,494,893 19,378,532 23,284,094 Total expenditures 251,097,043 218,621,586 226,707,552 253,821,752
Excess (deficiency) of revenuesover (under) expenditures (10,617,847) 5,490,630 16,379,589 (13,815,105)
Other financing sources (uses)Refunding bonds issued - - - 3,805,000 Bonds issued - - - 24,125,000 Bond premium - - - 1,374,381 Payment to refunded bond escrow agent - - - (4,035,596) Transfers in 15,908,055 17,766,028 13,762,956 14,762,950 Transfers out (16,782,355) (20,316,653) (14,526,396) (16,103,693) Notes issued - - - - Assumed mortgage 6,326,603 - - -
Total other financing sources (uses) 5,452,303 (2,550,625) (763,440) 23,928,042
Net change in fund balances (5,165,544) 2,940,005 15,616,149 10,112,937
Fund balancesFund balances, beginning of year 87,714,113 82,575,005 85,705,814 101,232,345 Increase (decrease) in inventory reserve 26,436 190,804 (89,618) 25,601
Fund balances, end of year 82,575,005$ 85,705,814$ 101,232,345$ 111,370,883$
Debt service as a percentageof noncapital expenditures a, b 2.27% 2.81% 2.54% 4.93%
Notesa. Debt service represents principal and interest incurred during the year. Noncapital expenditures do not include
capital outlay for land, construction in progress, buildings and improvements, machinery and equipment,and infrastructure incurred during the year.
b. In years 2011 and prior, debt service for purposes of this computation included bond issuance costs. The percentagesfor 2011 and prior have been restated to exclude bond issuance costs.
SourceLane County Administration Operations Division - Financial Services
Fiscal Year
166
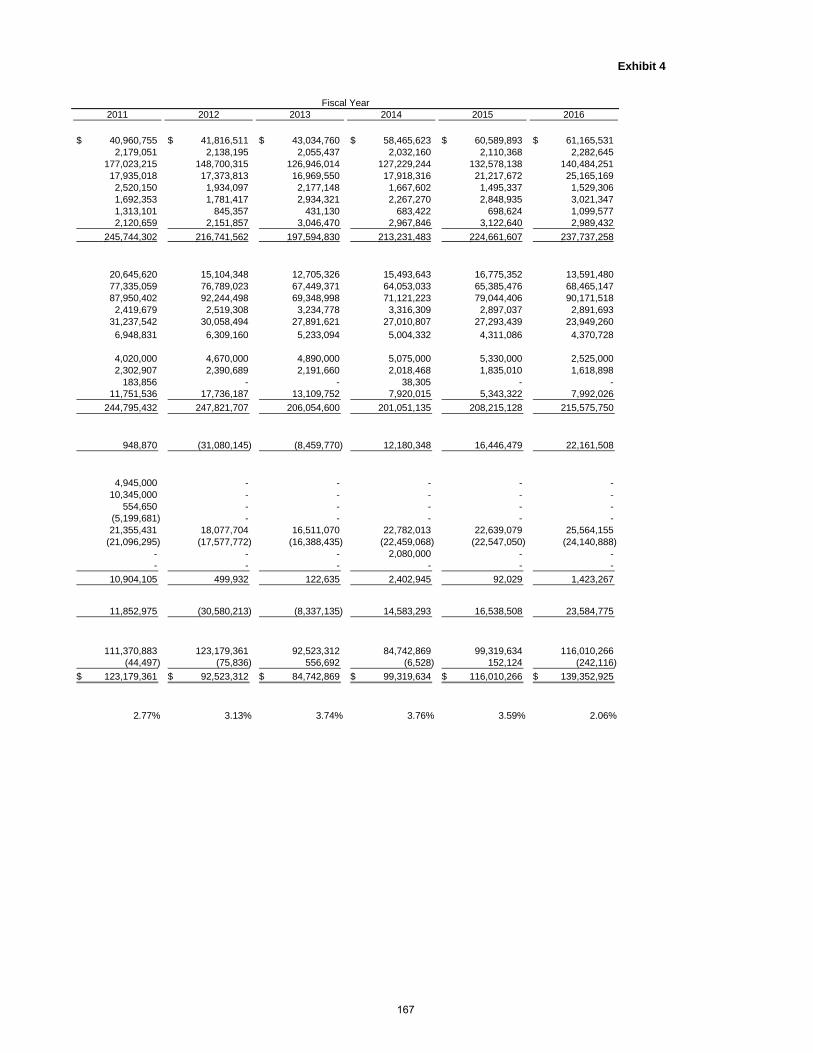
Exhibit 4
2011 2012 2013 2014 2015 2016
40,960,755$ 41,816,511$ 43,034,760$ 58,465,623$ 60,589,893$ 61,165,531$ 2,179,051 2,138,195 2,055,437 2,032,160 2,110,368 2,282,645
177,023,215 148,700,315 126,946,014 127,229,244 132,578,138 140,484,251 17,935,018 17,373,813 16,969,550 17,918,316 21,217,672 25,165,169 2,520,150 1,934,097 2,177,148 1,667,602 1,495,337 1,529,306 1,692,353 1,781,417 2,934,321 2,267,270 2,848,935 3,021,347 1,313,101 845,357 431,130 683,422 698,624 1,099,577 2,120,659 2,151,857 3,046,470 2,967,846 3,122,640 2,989,432
245,744,302 216,741,562 197,594,830 213,231,483 224,661,607 237,737,258
20,645,620 15,104,348 12,705,326 15,493,643 16,775,352 13,591,480 77,335,059 76,789,023 67,449,371 64,053,033 65,385,476 68,465,147 87,950,402 92,244,498 69,348,998 71,121,223 79,044,406 90,171,518 2,419,679 2,519,308 3,234,778 3,316,309 2,897,037 2,891,693
31,237,542 30,058,494 27,891,621 27,010,807 27,293,439 23,949,260 6,948,831 6,309,160 5,233,094 5,004,332 4,311,086 4,370,728
4,020,000 4,670,000 4,890,000 5,075,000 5,330,000 2,525,000 2,302,907 2,390,689 2,191,660 2,018,468 1,835,010 1,618,898
183,856 - - 38,305 - - 11,751,536 17,736,187 13,109,752 7,920,015 5,343,322 7,992,026
244,795,432 247,821,707 206,054,600 201,051,135 208,215,128 215,575,750
948,870 (31,080,145) (8,459,770) 12,180,348 16,446,479 22,161,508
4,945,000 - - - - - 10,345,000 - - - - -
554,650 - - - - - (5,199,681) - - - - - 21,355,431 18,077,704 16,511,070 22,782,013 22,639,079 25,564,155
(21,096,295) (17,577,772) (16,388,435) (22,459,068) (22,547,050) (24,140,888) - - - 2,080,000 - - - - - - - -
10,904,105 499,932 122,635 2,402,945 92,029 1,423,267
11,852,975 (30,580,213) (8,337,135) 14,583,293 16,538,508 23,584,775
111,370,883 123,179,361 92,523,312 84,742,869 99,319,634 116,010,266 (44,497) (75,836) 556,692 (6,528) 152,124 (242,116)
123,179,361$ 92,523,312$ 84,742,869$ 99,319,634$ 116,010,266$ 139,352,925$
2.77% 3.13% 3.74% 3.76% 3.59% 2.06%
Fiscal Year
167
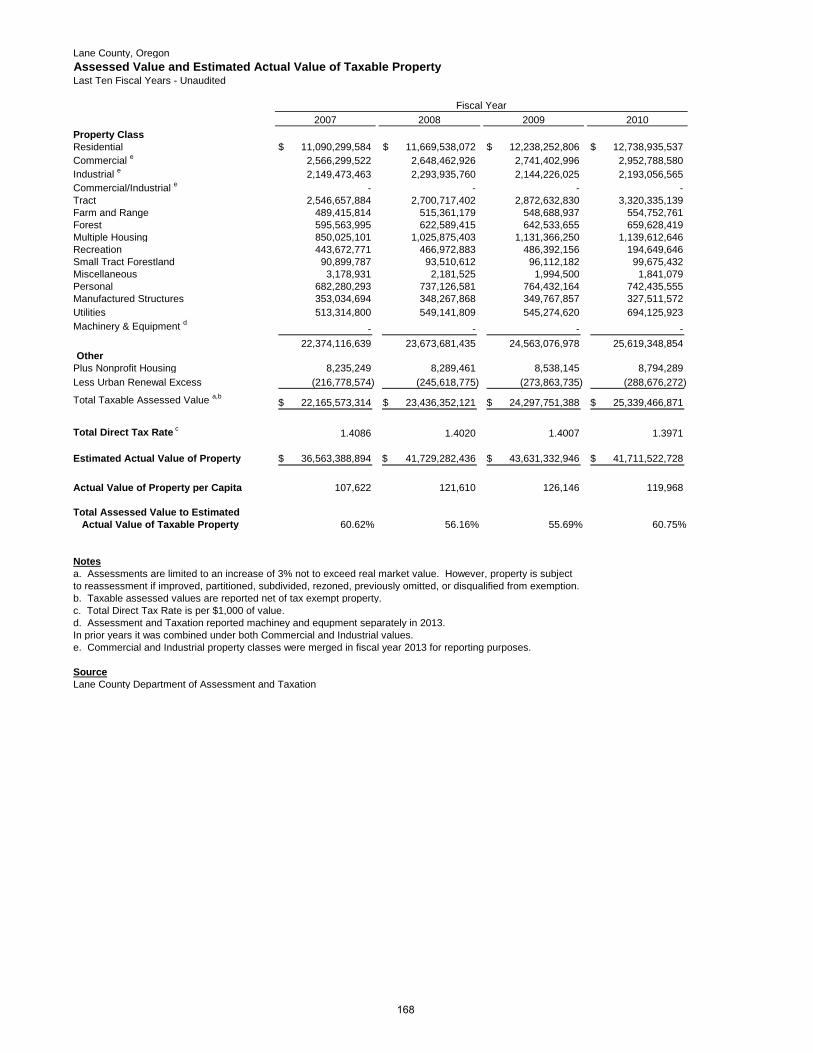
Lane County, OregonAssessed Value and Estimated Actual Value of Taxable PropertyLast Ten Fiscal Years - Unaudited
Fiscal Year 2007 2008 2009 2010
Property ClassResidential 11,090,299,584$ 11,669,538,072$ 12,238,252,806$ 12,738,935,537$ Commercial e 2,566,299,522 2,648,462,926 2,741,402,996 2,952,788,580 Industrial e 2,149,473,463 2,293,935,760 2,144,226,025 2,193,056,565 Commercial/Industrial e - - - - Tract 2,546,657,884 2,700,717,402 2,872,632,830 3,320,335,139 Farm and Range 489,415,814 515,361,179 548,688,937 554,752,761 Forest 595,563,995 622,589,415 642,533,655 659,628,419 Multiple Housing 850,025,101 1,025,875,403 1,131,366,250 1,139,612,646 Recreation 443,672,771 466,972,883 486,392,156 194,649,646 Small Tract Forestland 90,899,787 93,510,612 96,112,182 99,675,432 Miscellaneous 3,178,931 2,181,525 1,994,500 1,841,079 Personal 682,280,293 737,126,581 764,432,164 742,435,555 Manufactured Structures 353,034,694 348,267,868 349,767,857 327,511,572 Utilities 513,314,800 549,141,809 545,274,620 694,125,923 Machinery & Equipment d - - - - 22,374,116,639 23,673,681,435 24,563,076,978 25,619,348,854 Other
Plus Nonprofit Housing 8,235,249 8,289,461 8,538,145 8,794,289 Less Urban Renewal Excess (216,778,574) (245,618,775) (273,863,735) (288,676,272)
Total Taxable Assessed Value a,b22,165,573,314$ 23,436,352,121$ 24,297,751,388$ 25,339,466,871$
Total Direct Tax Rate c 1.4086 1.4020 1.4007 1.3971
Estimated Actual Value of Property 36,563,388,894$ 41,729,282,436$ 43,631,332,946$ 41,711,522,728$
Actual Value of Property per Capita 107,622 121,610 126,146 119,968
Total Assessed Value to Estimated Actual Value of Taxable Property 60.62% 56.16% 55.69% 60.75%
Notesa. Assessments are limited to an increase of 3% not to exceed real market value. However, property is subjectto reassessment if improved, partitioned, subdivided, rezoned, previously omitted, or disqualified from exemption.b. Taxable assessed values are reported net of tax exempt property.c. Total Direct Tax Rate is per $1,000 of value.d. Assessment and Taxation reported machiney and equpment separately in 2013.In prior years it was combined under both Commercial and Industrial values.e. Commercial and Industrial property classes were merged in fiscal year 2013 for reporting purposes.
SourceLane County Department of Assessment and Taxation
168
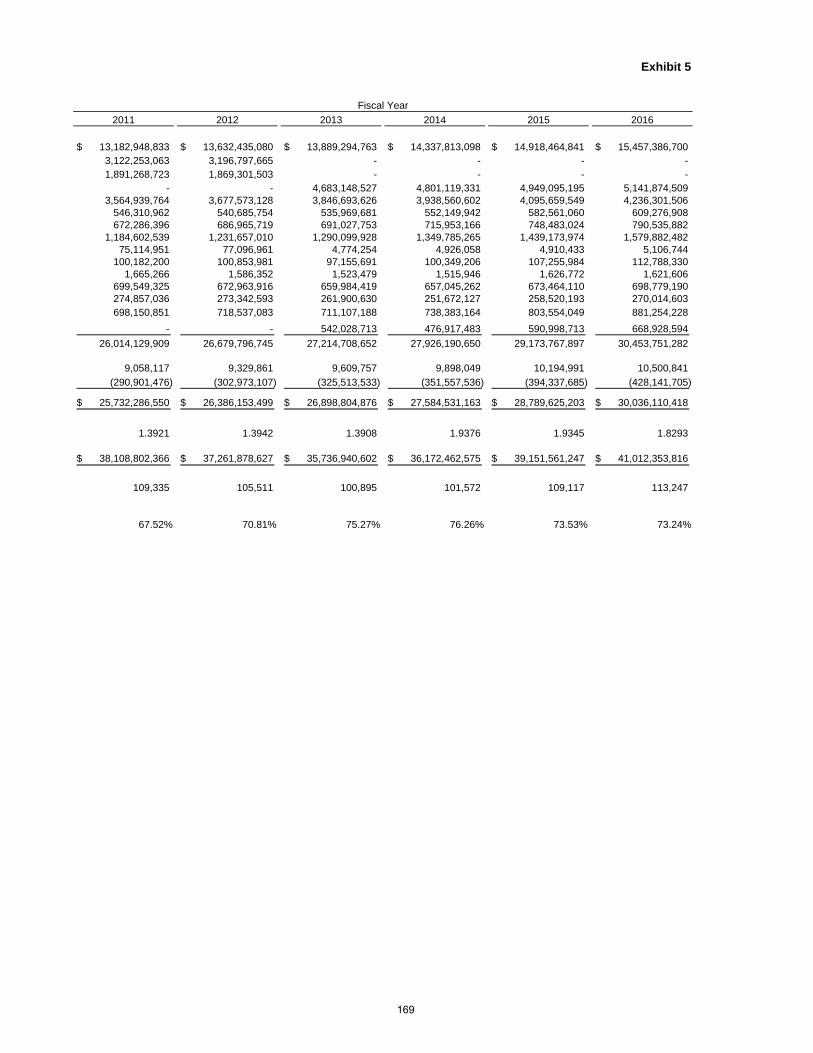
Exhibit 5
Fiscal Year2011 2012 2013 2014 2015 2016
13,182,948,833$ 13,632,435,080$ 13,889,294,763$ 14,337,813,098$ 14,918,464,841$ 15,457,386,700$ 3,122,253,063 3,196,797,665 - - - - 1,891,268,723 1,869,301,503 - - - -
- - 4,683,148,527 4,801,119,331 4,949,095,195 5,141,874,509 3,564,939,764 3,677,573,128 3,846,693,626 3,938,560,602 4,095,659,549 4,236,301,506
546,310,962 540,685,754 535,969,681 552,149,942 582,561,060 609,276,908 672,286,396 686,965,719 691,027,753 715,953,166 748,483,024 790,535,882
1,184,602,539 1,231,657,010 1,290,099,928 1,349,785,265 1,439,173,974 1,579,882,482 75,114,951 77,096,961 4,774,254 4,926,058 4,910,433 5,106,744
100,182,200 100,853,981 97,155,691 100,349,206 107,255,984 112,788,330 1,665,266 1,586,352 1,523,479 1,515,946 1,626,772 1,621,606
699,549,325 672,963,916 659,984,419 657,045,262 673,464,110 698,779,190 274,857,036 273,342,593 261,900,630 251,672,127 258,520,193 270,014,603 698,150,851 718,537,083 711,107,188 738,383,164 803,554,049 881,254,228
- - 542,028,713 476,917,483 590,998,713 668,928,594 26,014,129,909 26,679,796,745 27,214,708,652 27,926,190,650 29,173,767,897 30,453,751,282
9,058,117 9,329,861 9,609,757 9,898,049 10,194,991 10,500,841 (290,901,476) (302,973,107) (325,513,533) (351,557,536) (394,337,685) (428,141,705)
25,732,286,550$ 26,386,153,499$ 26,898,804,876$ 27,584,531,163$ 28,789,625,203$ 30,036,110,418$
1.3921 1.3942 1.3908 1.9376 1.9345 1.8293
38,108,802,366$ 37,261,878,627$ 35,736,940,602$ 36,172,462,575$ 39,151,561,247$ 41,012,353,816$
109,335 105,511 100,895 101,572 109,117 113,247
67.52% 70.81% 75.27% 76.26% 73.53% 73.24%
169
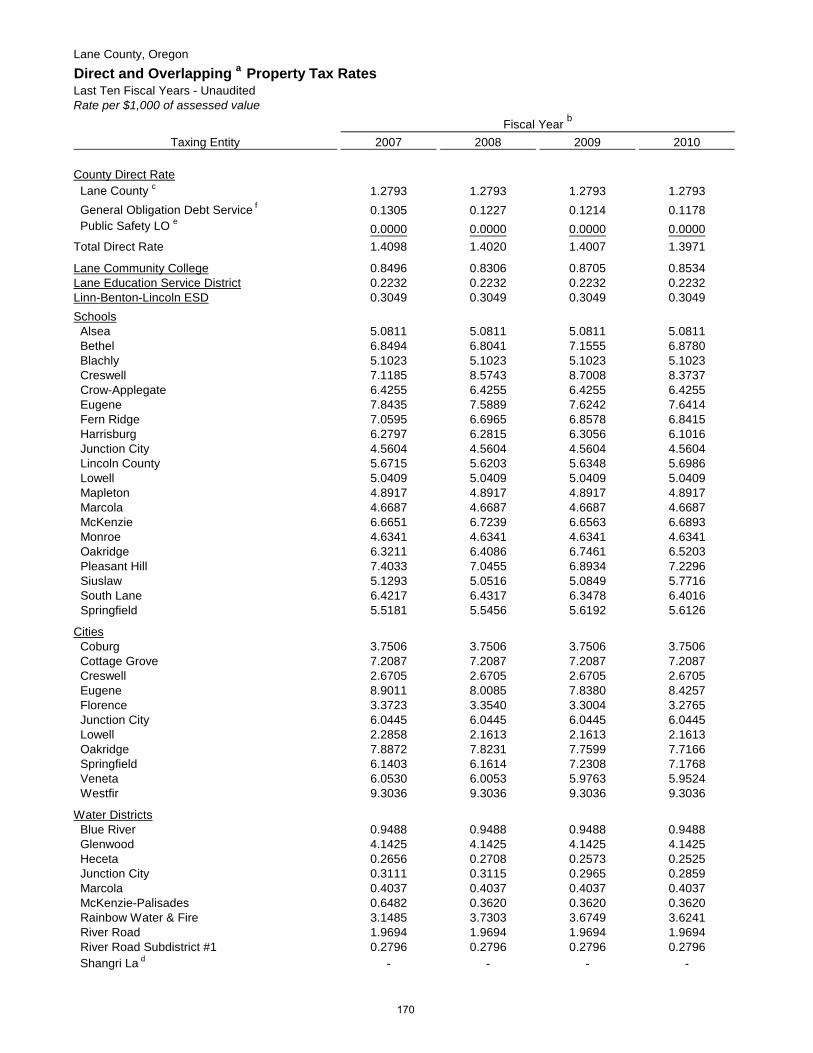
Lane County, OregonDirect and Overlapping a Property Tax RatesLast Ten Fiscal Years - UnauditedRate per $1,000 of assessed value
Fiscal Year b Taxing Entity 2007 2008 2009 2010
County Direct Rate Lane County c 1.2793 1.2793 1.2793 1.2793 General Obligation Debt Service f 0.1305 0.1227 0.1214 0.1178 Public Safety LO e 0.0000 0.0000 0.0000 0.0000Total Direct Rate 1.4098 1.4020 1.4007 1.3971
Lane Community College 0.8496 0.8306 0.8705 0.8534Lane Education Service District 0.2232 0.2232 0.2232 0.2232Linn-Benton-Lincoln ESD 0.3049 0.3049 0.3049 0.3049Schools Alsea 5.0811 5.0811 5.0811 5.0811 Bethel 6.8494 6.8041 7.1555 6.8780 Blachly 5.1023 5.1023 5.1023 5.1023 Creswell 7.1185 8.5743 8.7008 8.3737 Crow-Applegate 6.4255 6.4255 6.4255 6.4255 Eugene 7.8435 7.5889 7.6242 7.6414 Fern Ridge 7.0595 6.6965 6.8578 6.8415 Harrisburg 6.2797 6.2815 6.3056 6.1016 Junction City 4.5604 4.5604 4.5604 4.5604 Lincoln County 5.6715 5.6203 5.6348 5.6986 Lowell 5.0409 5.0409 5.0409 5.0409 Mapleton 4.8917 4.8917 4.8917 4.8917 Marcola 4.6687 4.6687 4.6687 4.6687 McKenzie 6.6651 6.7239 6.6563 6.6893 Monroe 4.6341 4.6341 4.6341 4.6341 Oakridge 6.3211 6.4086 6.7461 6.5203 Pleasant Hill 7.4033 7.0455 6.8934 7.2296 Siuslaw 5.1293 5.0516 5.0849 5.7716 South Lane 6.4217 6.4317 6.3478 6.4016 Springfield 5.5181 5.5456 5.6192 5.6126
Cities Coburg 3.7506 3.7506 3.7506 3.7506 Cottage Grove 7.2087 7.2087 7.2087 7.2087 Creswell 2.6705 2.6705 2.6705 2.6705 Eugene 8.9011 8.0085 7.8380 8.4257 Florence 3.3723 3.3540 3.3004 3.2765 Junction City 6.0445 6.0445 6.0445 6.0445 Lowell 2.2858 2.1613 2.1613 2.1613 Oakridge 7.8872 7.8231 7.7599 7.7166 Springfield 6.1403 6.1614 7.2308 7.1768 Veneta 6.0530 6.0053 5.9763 5.9524 Westfir 9.3036 9.3036 9.3036 9.3036
Water Districts Blue River 0.9488 0.9488 0.9488 0.9488 Glenwood 4.1425 4.1425 4.1425 4.1425 Heceta 0.2656 0.2708 0.2573 0.2525 Junction City 0.3111 0.3115 0.2965 0.2859 Marcola 0.4037 0.4037 0.4037 0.4037 McKenzie-Palisades 0.6482 0.3620 0.3620 0.3620 Rainbow Water & Fire 3.1485 3.7303 3.6749 3.6241 River Road 1.9694 1.9694 1.9694 1.9694 River Road Subdistrict #1 0.2796 0.2796 0.2796 0.2796 Shangri La d - - - -
170
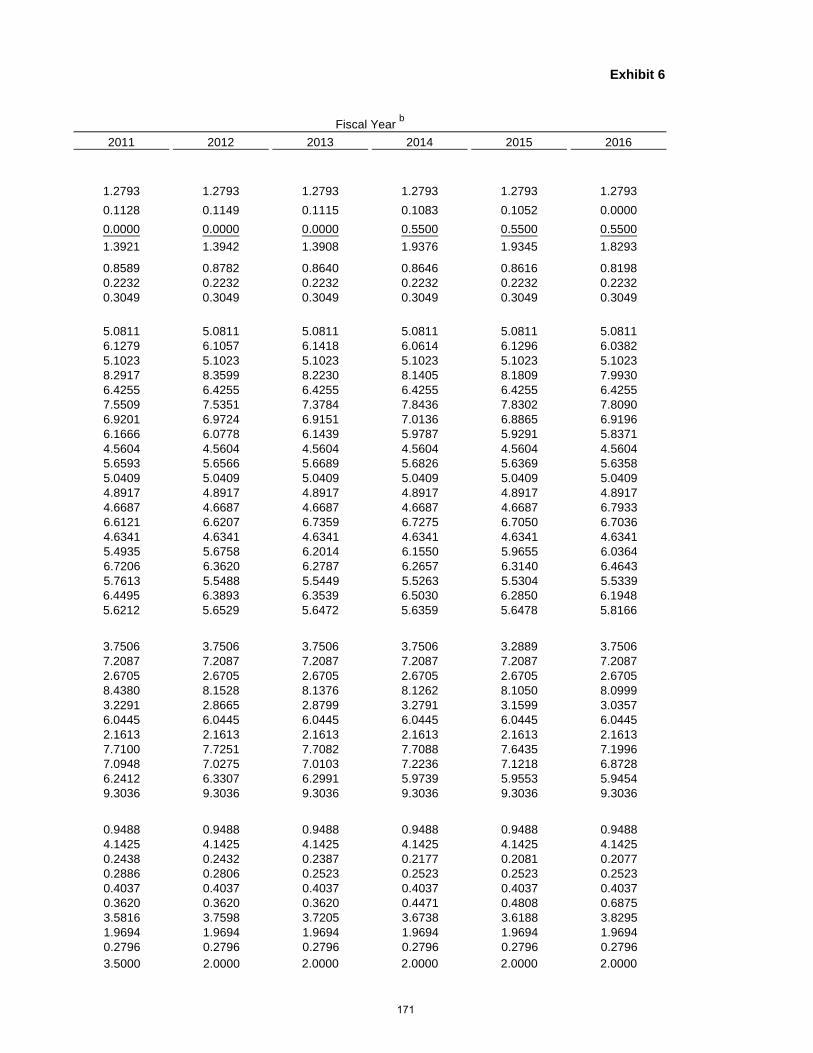
Exhibit 6
Fiscal Year b
2011 2012 2013 2014 2015 2016
1.2793 1.2793 1.2793 1.2793 1.2793 1.27930.1128 0.1149 0.1115 0.1083 0.1052 0.00000.0000 0.0000 0.0000 0.5500 0.5500 0.55001.3921 1.3942 1.3908 1.9376 1.9345 1.8293
0.8589 0.8782 0.8640 0.8646 0.8616 0.81980.2232 0.2232 0.2232 0.2232 0.2232 0.22320.3049 0.3049 0.3049 0.3049 0.3049 0.3049
5.0811 5.0811 5.0811 5.0811 5.0811 5.0811 6.1279 6.1057 6.1418 6.0614 6.1296 6.0382 5.1023 5.1023 5.1023 5.1023 5.1023 5.10238.2917 8.3599 8.2230 8.1405 8.1809 7.99306.4255 6.4255 6.4255 6.4255 6.4255 6.42557.5509 7.5351 7.3784 7.8436 7.8302 7.80906.9201 6.9724 6.9151 7.0136 6.8865 6.91966.1666 6.0778 6.1439 5.9787 5.9291 5.83714.5604 4.5604 4.5604 4.5604 4.5604 4.56045.6593 5.6566 5.6689 5.6826 5.6369 5.63585.0409 5.0409 5.0409 5.0409 5.0409 5.04094.8917 4.8917 4.8917 4.8917 4.8917 4.89174.6687 4.6687 4.6687 4.6687 4.6687 6.79336.6121 6.6207 6.7359 6.7275 6.7050 6.70364.6341 4.6341 4.6341 4.6341 4.6341 4.63415.4935 5.6758 6.2014 6.1550 5.9655 6.03646.7206 6.3620 6.2787 6.2657 6.3140 6.46435.7613 5.5488 5.5449 5.5263 5.5304 5.53396.4495 6.3893 6.3539 6.5030 6.2850 6.19485.6212 5.6529 5.6472 5.6359 5.6478 5.8166
3.7506 3.7506 3.7506 3.7506 3.2889 3.75067.2087 7.2087 7.2087 7.2087 7.2087 7.20872.6705 2.6705 2.6705 2.6705 2.6705 2.67058.4380 8.1528 8.1376 8.1262 8.1050 8.09993.2291 2.8665 2.8799 3.2791 3.1599 3.03576.0445 6.0445 6.0445 6.0445 6.0445 6.04452.1613 2.1613 2.1613 2.1613 2.1613 2.16137.7100 7.7251 7.7082 7.7088 7.6435 7.19967.0948 7.0275 7.0103 7.2236 7.1218 6.87286.2412 6.3307 6.2991 5.9739 5.9553 5.94549.3036 9.3036 9.3036 9.3036 9.3036 9.3036
0.9488 0.9488 0.9488 0.9488 0.9488 0.94884.1425 4.1425 4.1425 4.1425 4.1425 4.14250.2438 0.2432 0.2387 0.2177 0.2081 0.20770.2886 0.2806 0.2523 0.2523 0.2523 0.25230.4037 0.4037 0.4037 0.4037 0.4037 0.40370.3620 0.3620 0.3620 0.4471 0.4808 0.68753.5816 3.7598 3.7205 3.6738 3.6188 3.82951.9694 1.9694 1.9694 1.9694 1.9694 1.96940.2796 0.2796 0.2796 0.2796 0.2796 0.27963.5000 2.0000 2.0000 2.0000 2.0000 2.0000
171
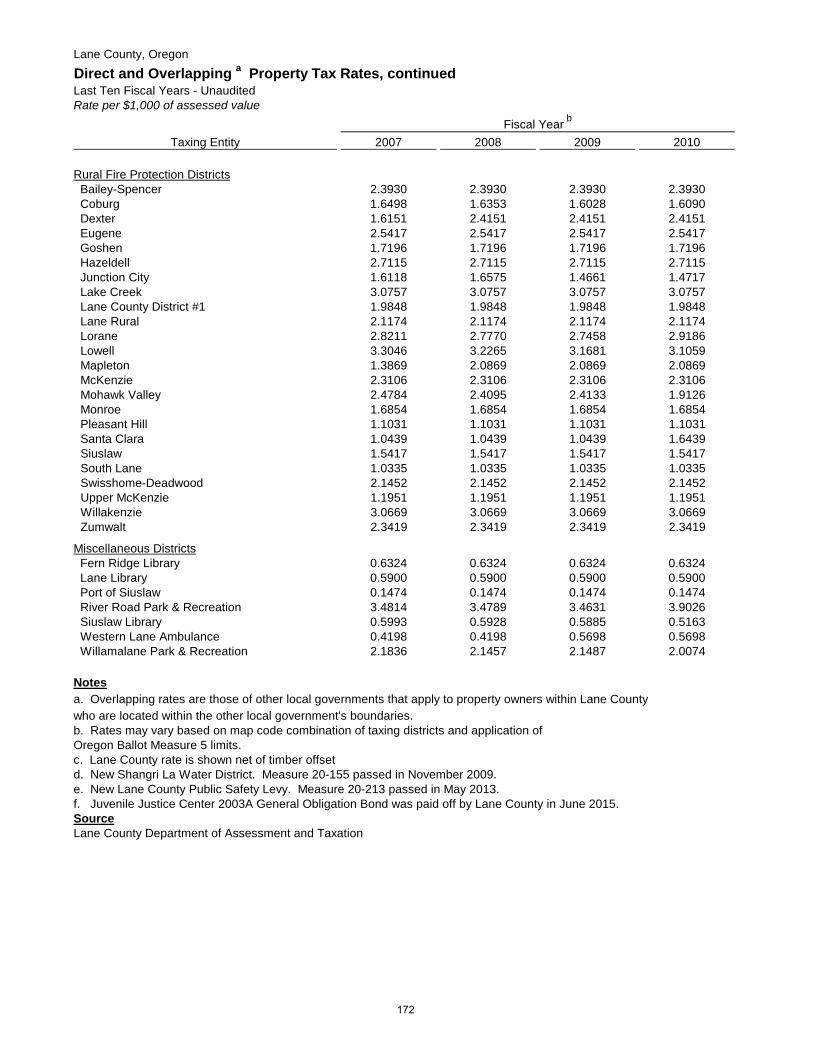
Lane County, OregonDirect and Overlapping a Property Tax Rates, continuedLast Ten Fiscal Years - UnauditedRate per $1,000 of assessed value
Fiscal Year b Taxing Entity 2007 2008 2009 2010
Rural Fire Protection Districts Bailey-Spencer 2.3930 2.3930 2.3930 2.3930 Coburg 1.6498 1.6353 1.6028 1.6090 Dexter 1.6151 2.4151 2.4151 2.4151 Eugene 2.5417 2.5417 2.5417 2.5417 Goshen 1.7196 1.7196 1.7196 1.7196 Hazeldell 2.7115 2.7115 2.7115 2.7115 Junction City 1.6118 1.6575 1.4661 1.4717 Lake Creek 3.0757 3.0757 3.0757 3.0757 Lane County District #1 1.9848 1.9848 1.9848 1.9848 Lane Rural 2.1174 2.1174 2.1174 2.1174 Lorane 2.8211 2.7770 2.7458 2.9186 Lowell 3.3046 3.2265 3.1681 3.1059 Mapleton 1.3869 2.0869 2.0869 2.0869 McKenzie 2.3106 2.3106 2.3106 2.3106 Mohawk Valley 2.4784 2.4095 2.4133 1.9126 Monroe 1.6854 1.6854 1.6854 1.6854 Pleasant Hill 1.1031 1.1031 1.1031 1.1031 Santa Clara 1.0439 1.0439 1.0439 1.6439 Siuslaw 1.5417 1.5417 1.5417 1.5417 South Lane 1.0335 1.0335 1.0335 1.0335 Swisshome-Deadwood 2.1452 2.1452 2.1452 2.1452 Upper McKenzie 1.1951 1.1951 1.1951 1.1951 Willakenzie 3.0669 3.0669 3.0669 3.0669 Zumwalt 2.3419 2.3419 2.3419 2.3419
Miscellaneous Districts Fern Ridge Library 0.6324 0.6324 0.6324 0.6324 Lane Library 0.5900 0.5900 0.5900 0.5900 Port of Siuslaw 0.1474 0.1474 0.1474 0.1474 River Road Park & Recreation 3.4814 3.4789 3.4631 3.9026 Siuslaw Library 0.5993 0.5928 0.5885 0.5163 Western Lane Ambulance 0.4198 0.4198 0.5698 0.5698 Willamalane Park & Recreation 2.1836 2.1457 2.1487 2.0074
Notesa. Overlapping rates are those of other local governments that apply to property owners within Lane Countywho are located within the other local government's boundaries.b. Rates may vary based on map code combination of taxing districts and application of Oregon Ballot Measure 5 limits.c. Lane County rate is shown net of timber offsetd. New Shangri La Water District. Measure 20-155 passed in November 2009.e. New Lane County Public Safety Levy. Measure 20-213 passed in May 2013.f. Juvenile Justice Center 2003A General Obligation Bond was paid off by Lane County in June 2015. SourceLane County Department of Assessment and Taxation
172

Exhibit 6, continued
Fiscal Year b
2011 2012 2013 2014 2015 2016
2.3930 2.3930 2.3930 2.3930 2.3930 2.39301.5885 1.5826 1.5750 1.5525 1.5231 1.48292.4151 2.4151 1.9151 1.9151 1.9151 1.91512.5417 1.8500 2.1000 2.3500 2.5417 2.54171.7196 1.7196 2.2196 2.2196 2.2196 2.21962.7115 2.7115 2.7115 2.7115 1.7998 2.71151.4357 1.4386 2.0858 2.0203 1.9538 1.58443.0757 3.0757 3.0757 3.0757 3.0757 3.07571.9848 1.9848 1.9848 1.9848 1.9848 1.98482.1174 2.1174 2.1174 2.1174 2.1174 2.11742.8854 2.8618 2.7573 2.7267 2.6931 2.66542.9855 2.6970 2.6970 2.6970 2.6970 2.69702.0869 2.0869 2.0869 2.0869 2.0869 2.08692.0606 2.0606 2.0606 2.0606 2.0606 2.06061.9126 1.9126 1.9126 1.9126 1.9126 1.91261.6854 1.6854 1.6854 1.6854 1.6854 1.68541.1031 1.1031 1.1031 1.1031 1.1031 1.10311.6439 1.6439 1.6439 1.6439 1.0439 1.49391.5417 0.8717 0.8891 0.9391 1.1391 1.13911.0335 1.0335 1.0335 1.5035 1.5035 1.50352.1452 2.1452 2.1452 2.1452 2.1452 2.14521.1951 1.1951 1.1951 1.6951 1.6951 1.69513.0669 3.0669 3.0669 3.0669 3.0669 3.06692.3419 2.3419 2.3419 2.3419 2.3419 2.3419
0.6324 0.6324 0.6324 0.6324 0.6324 0.63240.5900 0.5900 0.5900 0.5900 0.5900 0.59000.1474 0.1474 0.1474 0.1474 0.1474 0.14743.8946 3.8791 3.8730 3.8631 3.8535 3.52590.5163 0.5163 0.5163 0.5163 0.5163 0.51630.5698 0.5698 0.7698 0.7698 0.7698 0.76982.0074 2.0074 2.0074 2.4543 2.3701 2.3386
173
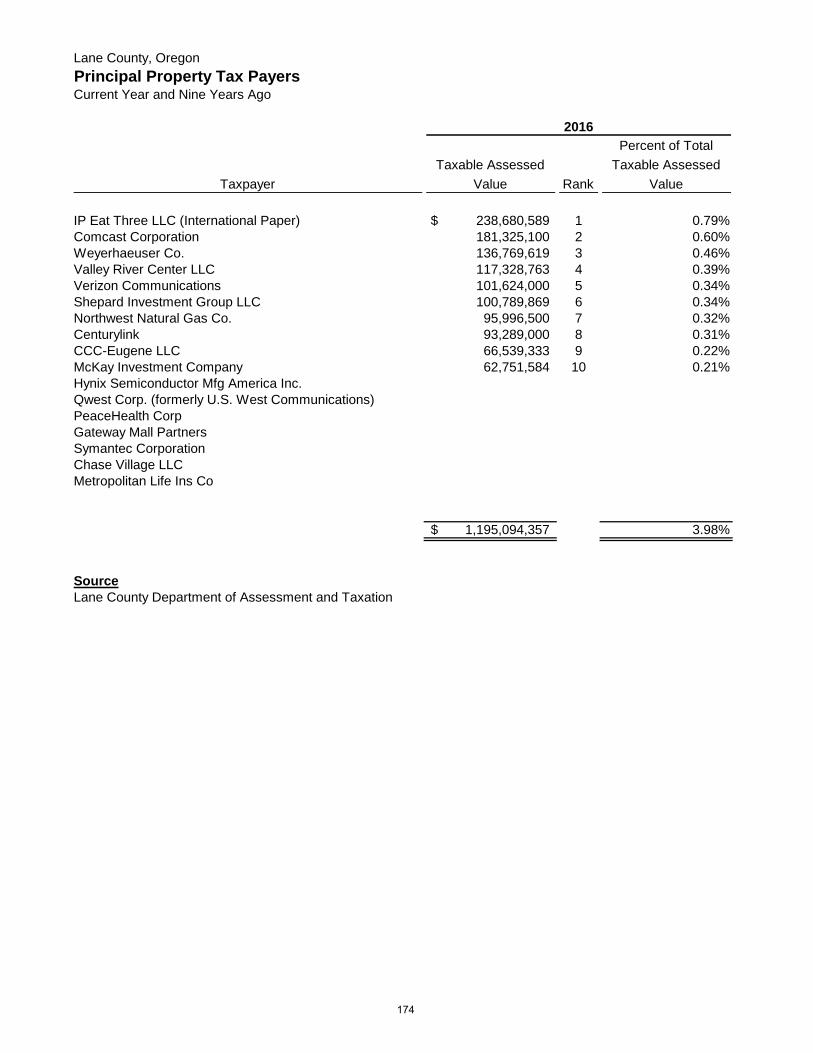
Lane County, OregonPrincipal Property Tax PayersCurrent Year and Nine Years Ago
2016
TaxpayerTaxable Assessed
Value Rank
Percent of Total Taxable Assessed
Value
IP Eat Three LLC (International Paper) 238,680,589$ 1 0.79%Comcast Corporation 181,325,100 2 0.60%Weyerhaeuser Co. 136,769,619 3 0.46%Valley River Center LLC 117,328,763 4 0.39%Verizon Communications 101,624,000 5 0.34%Shepard Investment Group LLC 100,789,869 6 0.34%Northwest Natural Gas Co. 95,996,500 7 0.32%Centurylink 93,289,000 8 0.31%CCC-Eugene LLC 66,539,333 9 0.22%McKay Investment Company 62,751,584 10 0.21%Hynix Semiconductor Mfg America Inc.Qwest Corp. (formerly U.S. West Communications)PeaceHealth CorpGateway Mall PartnersSymantec CorporationChase Village LLCMetropolitan Life Ins Co
1,195,094,357$ 3.98%
SourceLane County Department of Assessment and Taxation
174
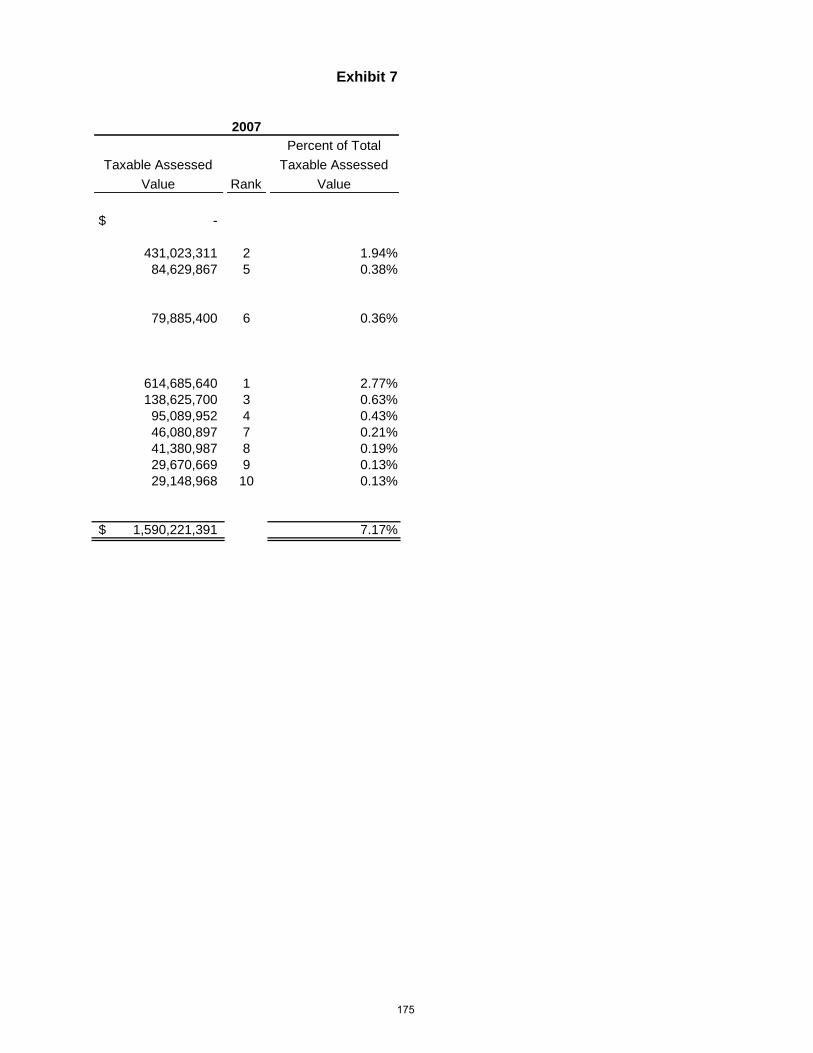
Exhibit 7
2007
Taxable Assessed Value Rank
Percent of Total Taxable Assessed
Value
-$
431,023,311 2 1.94%84,629,867 5 0.38%
79,885,400 6 0.36%
614,685,640 1 2.77%138,625,700 3 0.63%95,089,952 4 0.43%46,080,897 7 0.21%41,380,987 8 0.19%29,670,669 9 0.13%29,148,968 10 0.13%
1,590,221,391$ 7.17%
175
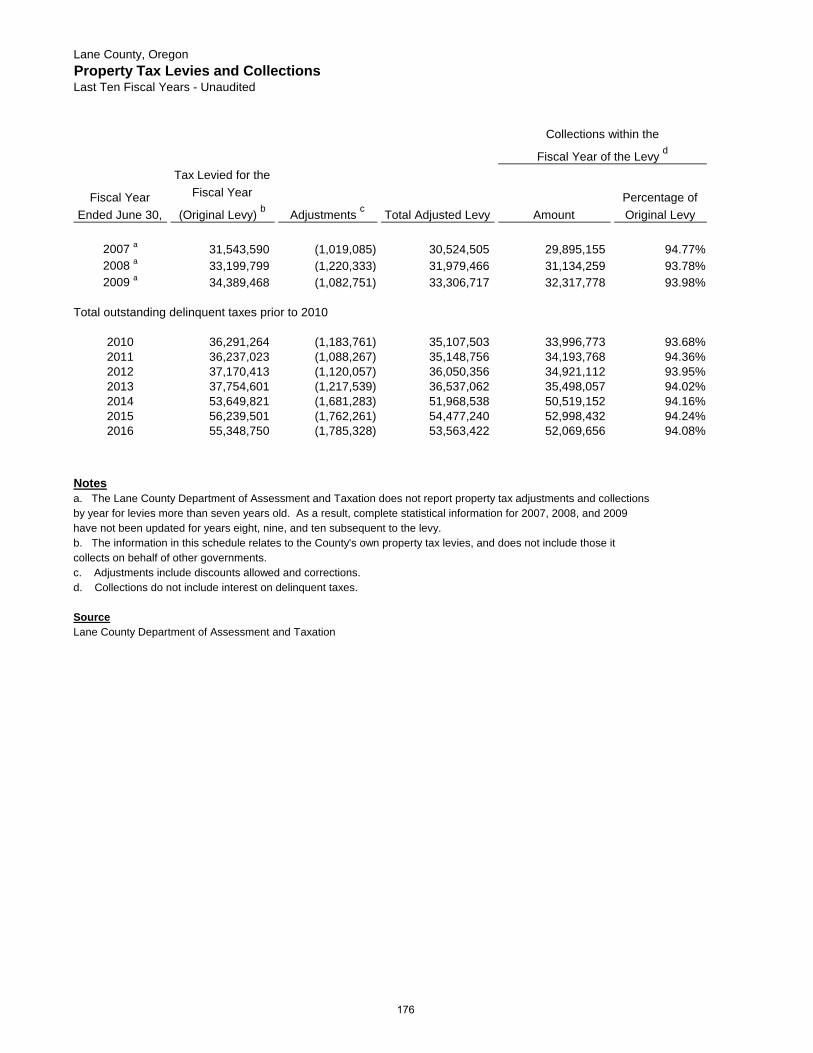
Lane County, OregonProperty Tax Levies and CollectionsLast Ten Fiscal Years - Unaudited
Collections within the
Fiscal Year of the Levy d
Fiscal Year Ended June 30,
Tax Levied for the Fiscal Year
(Original Levy) b Adjustments c Total Adjusted Levy AmountPercentage of Original Levy
2007 a 31,543,590 (1,019,085) 30,524,505 29,895,155 94.77%2008 a 33,199,799 (1,220,333) 31,979,466 31,134,259 93.78%2009 a 34,389,468 (1,082,751) 33,306,717 32,317,778 93.98%
Total outstanding delinquent taxes prior to 2010
2010 36,291,264 (1,183,761) 35,107,503 33,996,773 93.68%2011 36,237,023 (1,088,267) 35,148,756 34,193,768 94.36%2012 37,170,413 (1,120,057) 36,050,356 34,921,112 93.95%2013 37,754,601 (1,217,539) 36,537,062 35,498,057 94.02%2014 53,649,821 (1,681,283) 51,968,538 50,519,152 94.16%2015 56,239,501 (1,762,261) 54,477,240 52,998,432 94.24%2016 55,348,750 (1,785,328) 53,563,422 52,069,656 94.08%
Notesa. The Lane County Department of Assessment and Taxation does not report property tax adjustments and collectionsby year for levies more than seven years old. As a result, complete statistical information for 2007, 2008, and 2009have not been updated for years eight, nine, and ten subsequent to the levy.b. The information in this schedule relates to the County's own property tax levies, and does not include those it collects on behalf of other governments.c. Adjustments include discounts allowed and corrections.d. Collections do not include interest on delinquent taxes.
SourceLane County Department of Assessment and Taxation
176

Exhibit 8
Total Collections to Date d
Collections in Subsequent Years Total Tax Collections
Percentage of Adjusted Levy
Outstanding Delinquent Taxes
610,407 30,505,562 99.94%826,872 31,961,131 99.94%967,593 33,285,371 99.94%
170,066$
945,829 34,942,602 99.53% 164,901 775,258 34,969,026 99.49% 179,730 920,580 35,841,692 99.42% 208,664 748,670 36,246,727 99.21% 290,335 839,348 51,358,500 98.83% 610,038 550,408 53,548,840 98.30% 928,400
- 52,069,656 97.21% 1,493,766 4,045,900$
177

Lane County, OregonRatios of Outstanding Debt by TypeLast Ten Fiscal Years - Unaudited
Fiscal Year Governmental Activities a,b
2007 c 2008 c 2009 c 2010 c Notes Payable 6,307,821$ 6,225,600$ 6,134,713$ -$ General Obligation Bonds f 19,360,000 17,290,000 15,155,000 12,940,000 Limited Tax Bonds 91,702,530 84,205,039 83,368,661 106,229,085 Total Governmental Activities Debt 117,370,351 107,720,639 104,658,374 119,169,085 Business-Type Activites a,b,c
Notes Payable 271,820 204,892 114,732 42,304 Total Business Type Activities Debt 271,820 204,892 114,732 42,304
Total Primary Government Debt d117,642,171$ 107,925,531$ 104,773,106$ 119,211,389$
Ratios of Outstanding Debt
Total Primary Government Debt as a % of Personal Income e 1.04% 0.92% 0.89% 1.02%
Total Primary Government Debt Per Capita e 346 315 303 343
Notesa. Details regarding the County's outstanding debt can be found in the notes to the financial statements.b. All debt is shown net of unamortized premiums and discounts. c. In accordance with GASB No. 61, the Housing and Community Services Agency (HACSA) has been reclassified as a discretely presented component unit. In order to enhance comparability, HACSA has been removed from this exhibit for fiscal years 2011 and prior.d. Total Primary Government Debt is the sum of Governmental Activities Debt and Business-Type Activities Debt.e. Percentage of Personal Income and Total Debt Per Capita were calculated using personal income and population data located in the Exhibit 13 - Demographic and Economic Statistics. f. The GO bond was paid off in June 2015 as scheduled.
SourceLane County Administration Operations Division - Financial Services
178
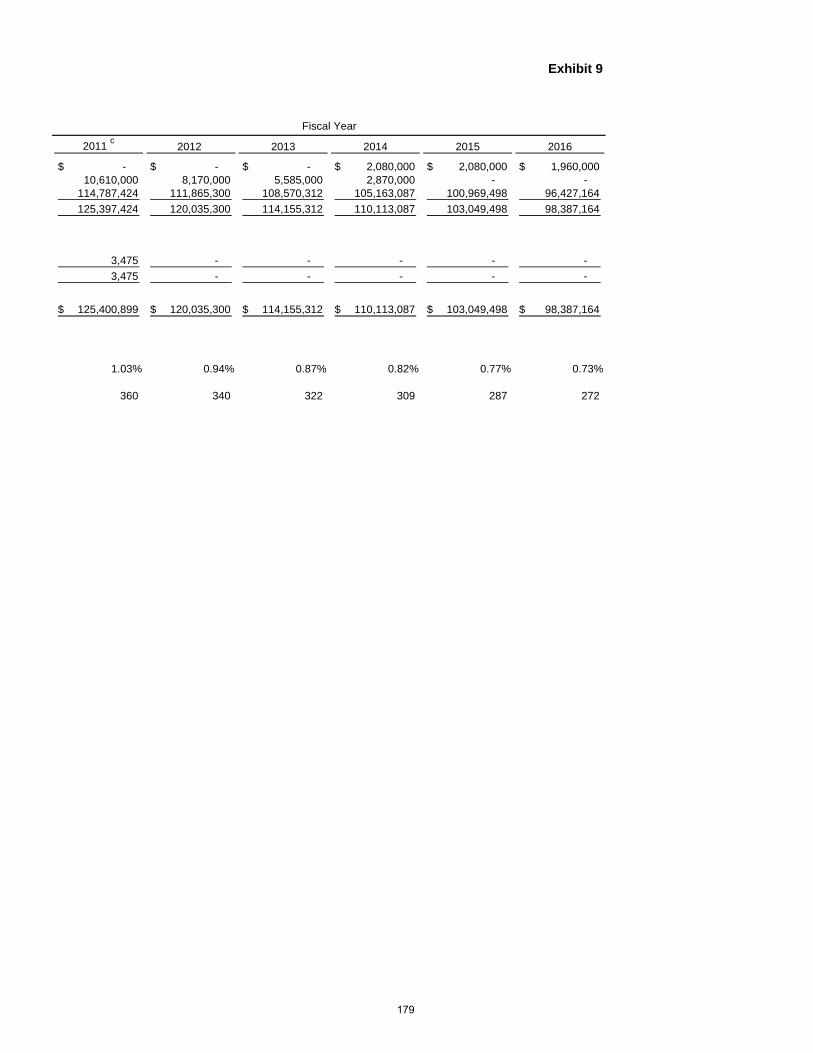
Exhibit 9
Fiscal Year
2011 c 2012 2013 2014 2015 2016
-$ -$ -$ 2,080,000$ 2,080,000$ 1,960,000$ 10,610,000 8,170,000 5,585,000 2,870,000 - -
114,787,424 111,865,300 108,570,312 105,163,087 100,969,498 96,427,164 125,397,424 120,035,300 114,155,312 110,113,087 103,049,498 98,387,164
3,475 - - - - - 3,475 - - - - -
125,400,899$ 120,035,300$ 114,155,312$ 110,113,087$ 103,049,498$ 98,387,164$
1.03% 0.94% 0.87% 0.82% 0.77% 0.73%
360 340 322 309 287 272
179
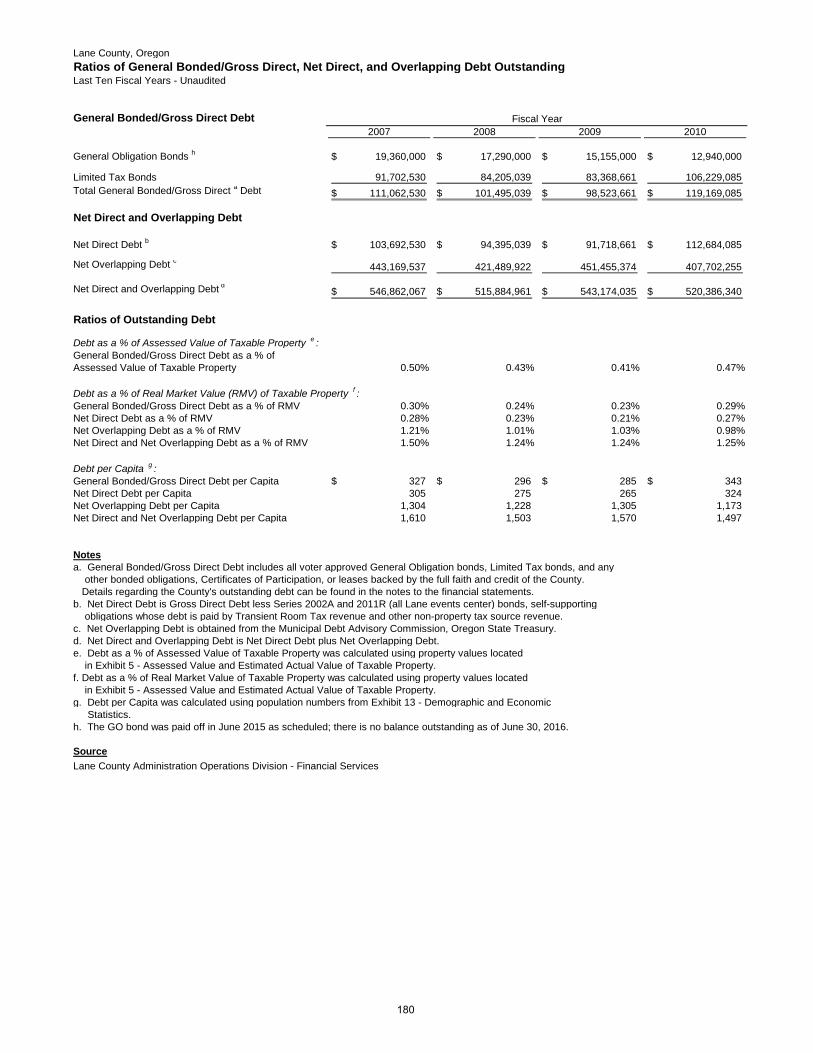
Lane County, OregonRatios of General Bonded/Gross Direct, Net Direct, and Overlapping Debt OutstandingLast Ten Fiscal Years - Unaudited
General Bonded/Gross Direct Debt Fiscal Year 2007 2008 2009 2010
General Obligation Bonds h 19,360,000$ 17,290,000$ 15,155,000$ 12,940,000$
Limited Tax Bonds 91,702,530 84,205,039 83,368,661 106,229,085 Total General Bonded/Gross Direct a Debt 111,062,530$ 101,495,039$ 98,523,661$ 119,169,085$ Net Direct and Overlapping Debt
Net Direct Debt b 103,692,530$ 94,395,039$ 91,718,661$ 112,684,085$ Net Overlapping Debt c 443,169,537 421,489,922 451,455,374 407,702,255
Net Direct and Overlapping Debt d 546,862,067$ 515,884,961$ 543,174,035$ 520,386,340$
Ratios of Outstanding Debt
Debt as a % of Assessed Value of Taxable Property e :General Bonded/Gross Direct Debt as a % ofAssessed Value of Taxable Property 0.50% 0.43% 0.41% 0.47%
Debt as a % of Real Market Value (RMV) of Taxable Property f :General Bonded/Gross Direct Debt as a % of RMV 0.30% 0.24% 0.23% 0.29%Net Direct Debt as a % of RMV 0.28% 0.23% 0.21% 0.27%Net Overlapping Debt as a % of RMV 1.21% 1.01% 1.03% 0.98%Net Direct and Net Overlapping Debt as a % of RMV 1.50% 1.24% 1.24% 1.25%
Debt per Capita g :General Bonded/Gross Direct Debt per Capita 327$ 296$ 285$ 343$ Net Direct Debt per Capita 305 275 265 324 Net Overlapping Debt per Capita 1,304 1,228 1,305 1,173 Net Direct and Net Overlapping Debt per Capita 1,610 1,503 1,570 1,497
Notesa. General Bonded/Gross Direct Debt includes all voter approved General Obligation bonds, Limited Tax bonds, and any other bonded obligations, Certificates of Participation, or leases backed by the full faith and credit of the County. Details regarding the County's outstanding debt can be found in the notes to the financial statements.b. Net Direct Debt is Gross Direct Debt less Series 2002A and 2011R (all Lane events center) bonds, self-supporting obligations whose debt is paid by Transient Room Tax revenue and other non-property tax source revenue.c. Net Overlapping Debt is obtained from the Municipal Debt Advisory Commission, Oregon State Treasury.d. Net Direct and Overlapping Debt is Net Direct Debt plus Net Overlapping Debt.e. Debt as a % of Assessed Value of Taxable Property was calculated using property values located in Exhibit 5 - Assessed Value and Estimated Actual Value of Taxable Property.f. Debt as a % of Real Market Value of Taxable Property was calculated using property values located in Exhibit 5 - Assessed Value and Estimated Actual Value of Taxable Property.g. Debt per Capita was calculated using population numbers from Exhibit 13 - Demographic and Economic Statistics.h. The GO bond was paid off in June 2015 as scheduled; there is no balance outstanding as of June 30, 2016.
SourceLane County Administration Operations Division - Financial Services
180
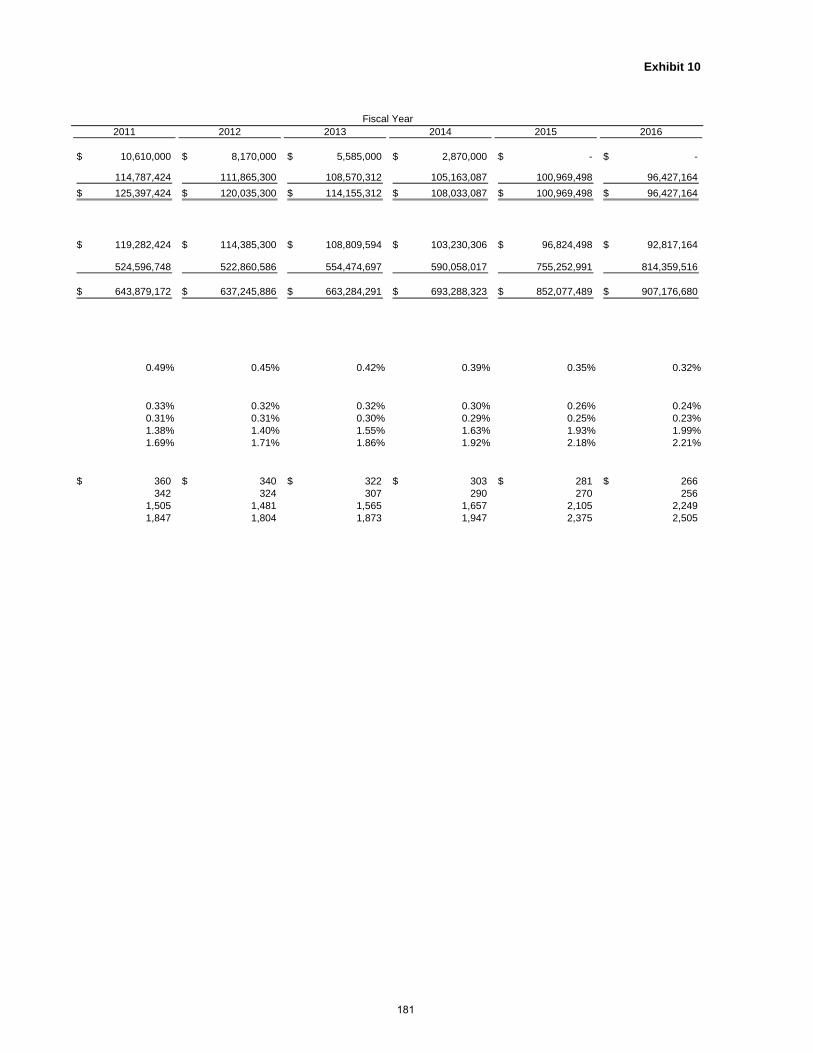
Exhibit 10
Fiscal Year2011 2012 2013 2014 2015 2016
10,610,000$ 8,170,000$ 5,585,000$ 2,870,000$ -$ -$
114,787,424 111,865,300 108,570,312 105,163,087 100,969,498 96,427,164 125,397,424$ 120,035,300$ 114,155,312$ 108,033,087$ 100,969,498$ 96,427,164$
119,282,424$ 114,385,300$ 108,809,594$ 103,230,306$ 96,824,498$ 92,817,164$
524,596,748 522,860,586 554,474,697 590,058,017 755,252,991 814,359,516
643,879,172$ 637,245,886$ 663,284,291$ 693,288,323$ 852,077,489$ 907,176,680$
0.49% 0.45% 0.42% 0.39% 0.35% 0.32%
0.33% 0.32% 0.32% 0.30% 0.26% 0.24%0.31% 0.31% 0.30% 0.29% 0.25% 0.23%1.38% 1.40% 1.55% 1.63% 1.93% 1.99%1.69% 1.71% 1.86% 1.92% 2.18% 2.21%
360$ 340$ 322$ 303$ 281$ 266$ 342 324 307 290 270 256
1,505 1,481 1,565 1,657 2,105 2,249 1,847 1,804 1,873 1,947 2,375 2,505
181
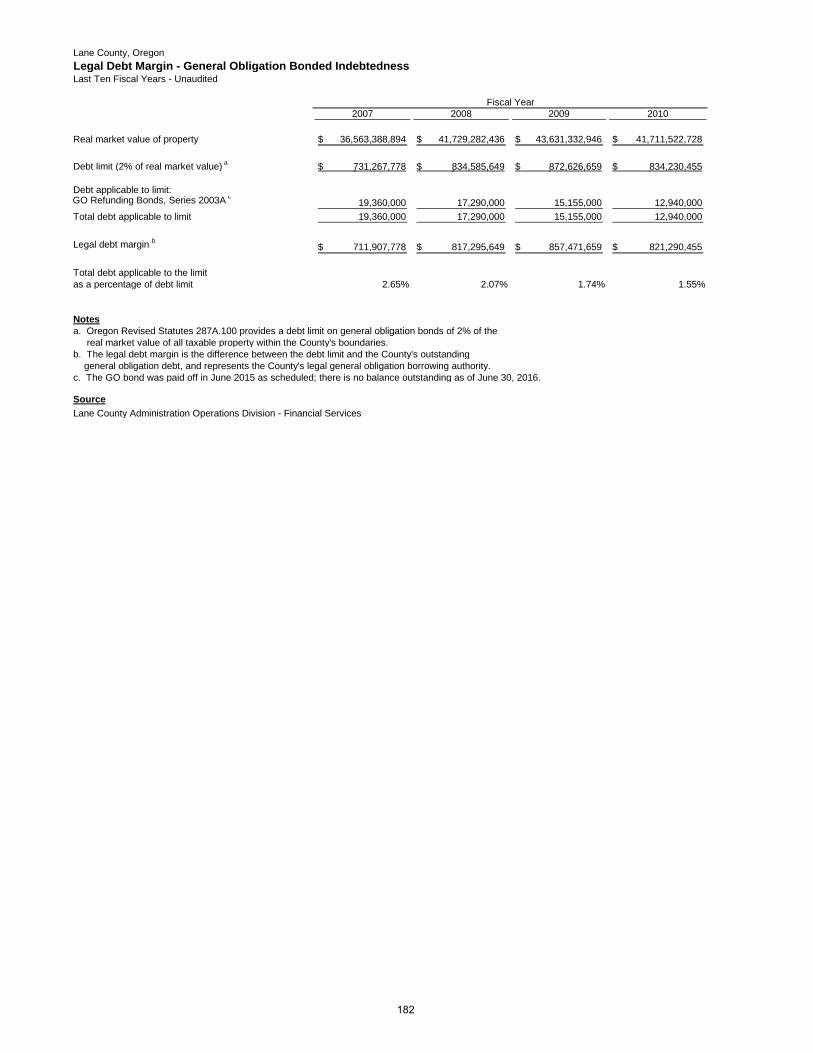
Lane County, OregonLegal Debt Margin - General Obligation Bonded IndebtednessLast Ten Fiscal Years - Unaudited
Fiscal Year 2007 2008 2009 2010
Real market value of property 36,563,388,894$ 41,729,282,436$ 43,631,332,946$ 41,711,522,728$ Debt limit (2% of real market value) a 731,267,778$ 834,585,649$ 872,626,659$ 834,230,455$ Debt applicable to limit:GO Refunding Bonds, Series 2003A c
19,360,000 17,290,000 15,155,000 12,940,000 Total debt applicable to limit 19,360,000 17,290,000 15,155,000 12,940,000
Legal debt margin b 711,907,778$ 817,295,649$ 857,471,659$ 821,290,455$
Total debt applicable to the limitas a percentage of debt limit 2.65% 2.07% 1.74% 1.55%
Notesa. Oregon Revised Statutes 287A.100 provides a debt limit on general obligation bonds of 2% of the real market value of all taxable property within the County's boundaries.b. The legal debt margin is the difference between the debt limit and the County's outstanding general obligation debt, and represents the County's legal general obligation borrowing authority.c. The GO bond was paid off in June 2015 as scheduled; there is no balance outstanding as of June 30, 2016.
SourceLane County Administration Operations Division - Financial Services
182
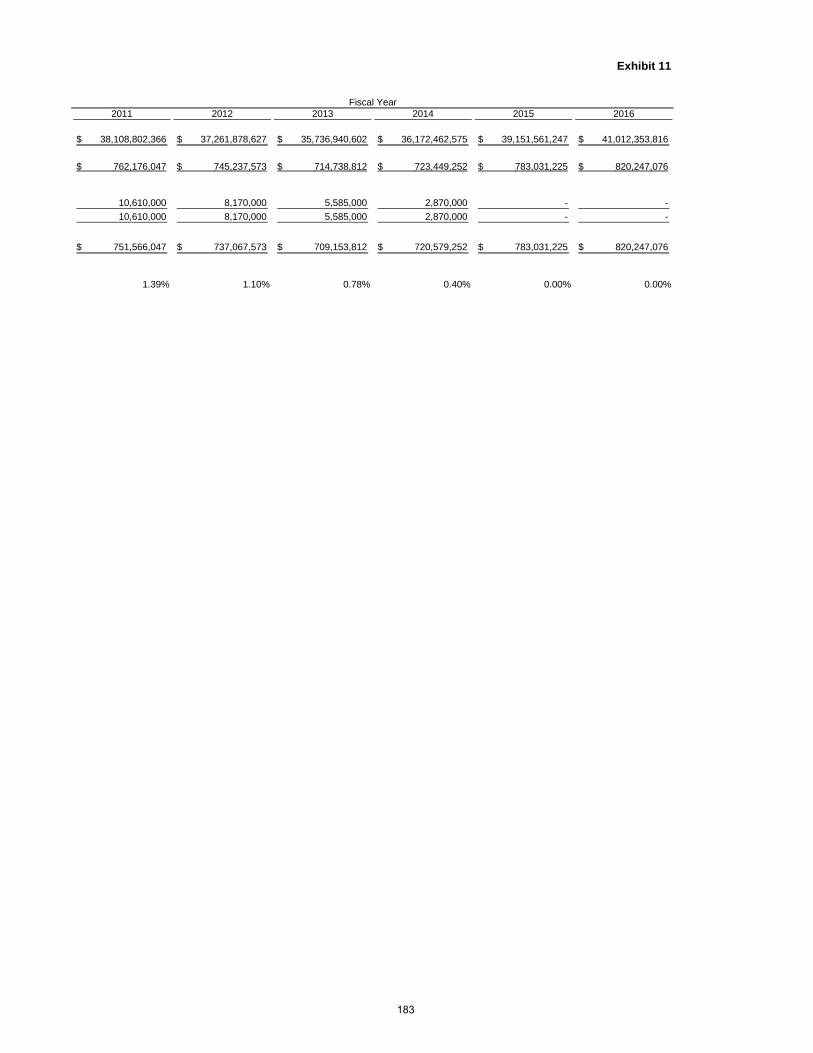
Exhibit 11
Fiscal Year2011 2012 2013 2014 2015 2016
38,108,802,366$ 37,261,878,627$ 35,736,940,602$ 36,172,462,575$ 39,151,561,247$ 41,012,353,816$
762,176,047$ 745,237,573$ 714,738,812$ 723,449,252$ 783,031,225$ 820,247,076$
10,610,000 8,170,000 5,585,000 2,870,000 - - 10,610,000 8,170,000 5,585,000 2,870,000 - -
751,566,047$ 737,067,573$ 709,153,812$ 720,579,252$ 783,031,225$ 820,247,076$
1.39% 1.10% 0.78% 0.40% 0.00% 0.00%
183
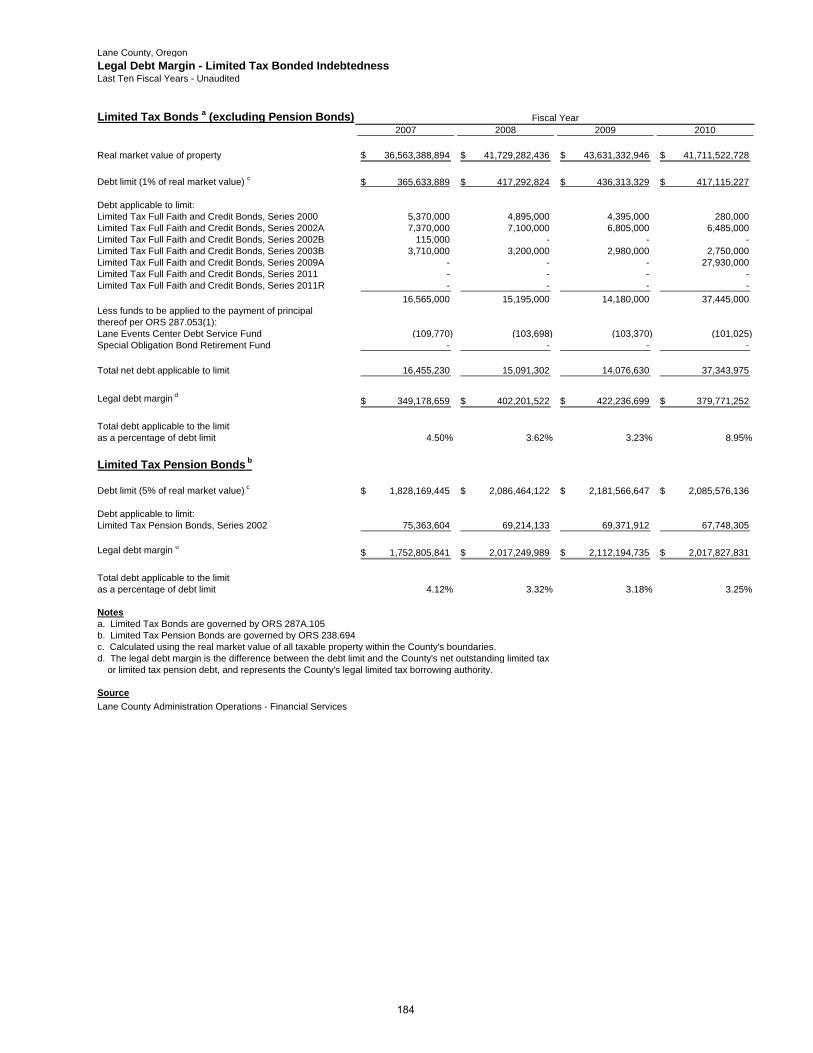
Lane County, OregonLegal Debt Margin - Limited Tax Bonded IndebtednessLast Ten Fiscal Years - Unaudited
Limited Tax Bonds a (excluding Pension Bonds) Fiscal Year 2007 2008 2009 2010
Real market value of property 36,563,388,894$ 41,729,282,436$ 43,631,332,946$ 41,711,522,728$ Debt limit (1% of real market value) c 365,633,889$ 417,292,824$ 436,313,329$ 417,115,227$ Debt applicable to limit:Limited Tax Full Faith and Credit Bonds, Series 2000 5,370,000 4,895,000 4,395,000 280,000 Limited Tax Full Faith and Credit Bonds, Series 2002A 7,370,000 7,100,000 6,805,000 6,485,000 Limited Tax Full Faith and Credit Bonds, Series 2002B 115,000 - - - Limited Tax Full Faith and Credit Bonds, Series 2003B 3,710,000 3,200,000 2,980,000 2,750,000 Limited Tax Full Faith and Credit Bonds, Series 2009A - - - 27,930,000 Limited Tax Full Faith and Credit Bonds, Series 2011 - - - - Limited Tax Full Faith and Credit Bonds, Series 2011R - - - -
16,565,000 15,195,000 14,180,000 37,445,000 Less funds to be applied to the payment of principalthereof per ORS 287.053(1):Lane Events Center Debt Service Fund (109,770) (103,698) (103,370) (101,025) Special Obligation Bond Retirement Fund - - - -
Total net debt applicable to limit 16,455,230 15,091,302 14,076,630 37,343,975
Legal debt margin d349,178,659$ 402,201,522$ 422,236,699$ 379,771,252$
Total debt applicable to the limitas a percentage of debt limit 4.50% 3.62% 3.23% 8.95%
Limited Tax Pension Bonds b
Debt limit (5% of real market value) c 1,828,169,445$ 2,086,464,122$ 2,181,566,647$ 2,085,576,136$ Debt applicable to limit:Limited Tax Pension Bonds, Series 2002 75,363,604 69,214,133 69,371,912 67,748,305
Legal debt margin d 1,752,805,841$ 2,017,249,989$ 2,112,194,735$ 2,017,827,831$
Total debt applicable to the limitas a percentage of debt limit 4.12% 3.32% 3.18% 3.25%
Notesa. Limited Tax Bonds are governed by ORS 287A.105b. Limited Tax Pension Bonds are governed by ORS 238.694c. Calculated using the real market value of all taxable property within the County's boundaries.d. The legal debt margin is the difference between the debt limit and the County's net outstanding limited tax or limited tax pension debt, and represents the County's legal limited tax borrowing authority.
SourceLane County Administration Operations - Financial Services
184
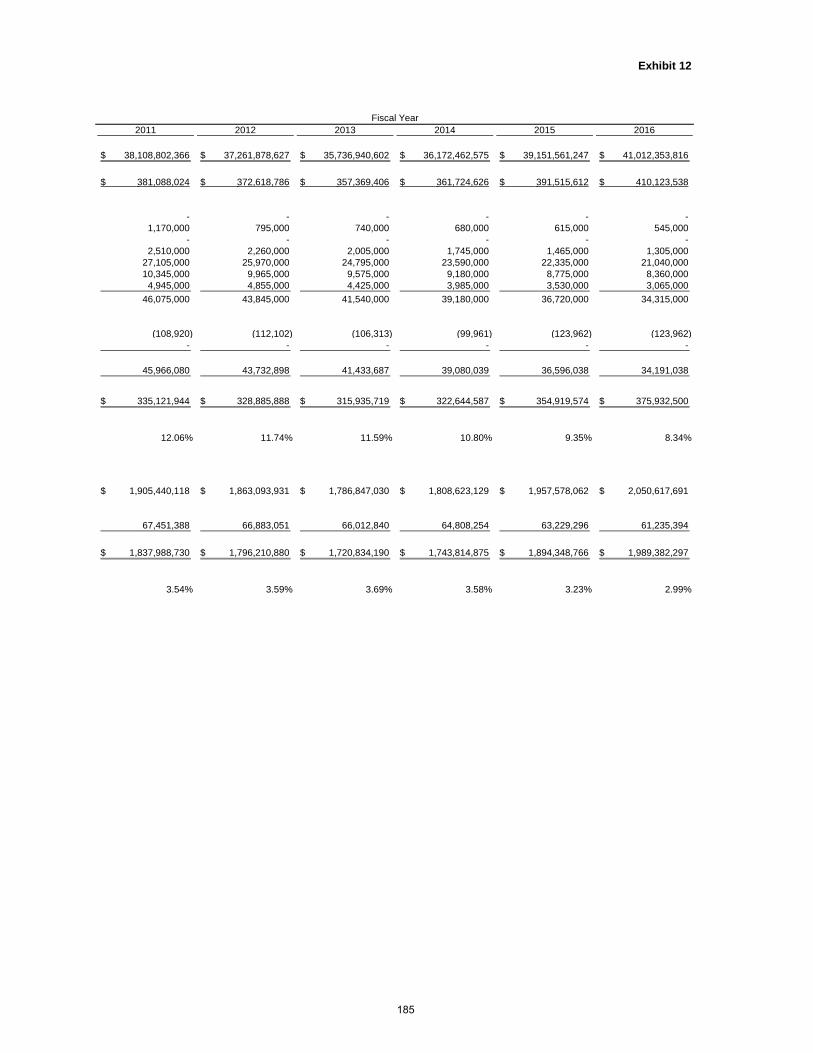
Exhibit 12
Fiscal Year2011 2012 2013 2014 2015 2016
38,108,802,366$ 37,261,878,627$ 35,736,940,602$ 36,172,462,575$ 39,151,561,247$ 41,012,353,816$
381,088,024$ 372,618,786$ 357,369,406$ 361,724,626$ 391,515,612$ 410,123,538$
- - - - - - 1,170,000 795,000 740,000 680,000 615,000 545,000
- - - - - - 2,510,000 2,260,000 2,005,000 1,745,000 1,465,000 1,305,000
27,105,000 25,970,000 24,795,000 23,590,000 22,335,000 21,040,000 10,345,000 9,965,000 9,575,000 9,180,000 8,775,000 8,360,000
4,945,000 4,855,000 4,425,000 3,985,000 3,530,000 3,065,000 46,075,000 43,845,000 41,540,000 39,180,000 36,720,000 34,315,000
(108,920) (112,102) (106,313) (99,961) (123,962) (123,962) - - - - - -
45,966,080 43,732,898 41,433,687 39,080,039 36,596,038 34,191,038
335,121,944$ 328,885,888$ 315,935,719$ 322,644,587$ 354,919,574$ 375,932,500$
12.06% 11.74% 11.59% 10.80% 9.35% 8.34%
1,905,440,118$ 1,863,093,931$ 1,786,847,030$ 1,808,623,129$ 1,957,578,062$ 2,050,617,691$
67,451,388 66,883,051 66,012,840 64,808,254 63,229,296 61,235,394
1,837,988,730$ 1,796,210,880$ 1,720,834,190$ 1,743,814,875$ 1,894,348,766$ 1,989,382,297$
3.54% 3.59% 3.69% 3.58% 3.23% 2.99%
185

186

Lane County, OregonDemographic and Economic Statistics Exhibit 13Last 10 Fiscal Years - Unaudited
Fiscal Year Population cPersonal Income
(in thousands) a, dPer Capita
Income b, d Unemployment Rate e
2007 339,740 11,269,508 32,877 5.5%2008 343,140 11,679,994 33,522 5.3%2009 345,880 11,783,941 33,562 6.6%2010 347,690 11,709,176 33,277 11.9%2011 348,550 12,214,306 34,561 11.1%2012 353,155 12,742,734 35,941 9.5%2013 354,200 13,047,961 36,630 8.6%2014 356,125 13,392,647 37,374 7.6%2015 358,805 13,409,978 37,374 7.1%2016 362,150 13,534,994 37,374 5.9%
Notesa. The 2015 and 2016 personal income was not available and has been estimated by multiplyingpopulation by per capita income. b. The 2015 and 2016 per capita income was not available and has been estimated to be the same as 2014.
Sourcec. Population Research Center, Portland State University. Estimates are for July 1 of the fiscal year.d. Bureau of Economic Analysis, U.S. Department of Commerce. e. Bureau of Labor Statistics, U.S. Department of Labor. Rates presented are annualized for the calendar year.
187
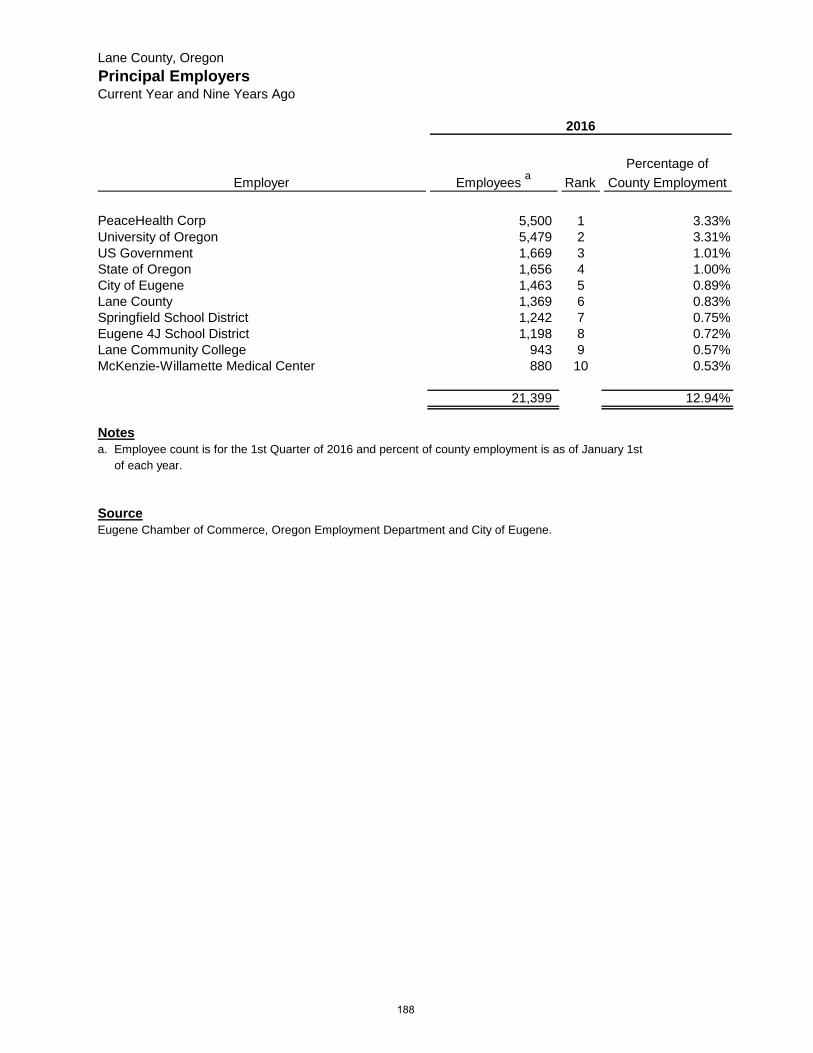
Lane County, OregonPrincipal EmployersCurrent Year and Nine Years Ago
2016
Employer Employees a RankPercentage of
County Employment
PeaceHealth Corp 5,500 1 3.33%University of Oregon 5,479 2 3.31%US Government 1,669 3 1.01%State of Oregon 1,656 4 1.00%City of Eugene 1,463 5 0.89%Lane County 1,369 6 0.83%Springfield School District 1,242 7 0.75%Eugene 4J School District 1,198 8 0.72%Lane Community College 943 9 0.57%McKenzie-Willamette Medical Center 880 10 0.53%
21,399 12.94%
Notesa. Employee count is for the 1st Quarter of 2016 and percent of county employment is as of January 1st of each year.
SourceEugene Chamber of Commerce, Oregon Employment Department and City of Eugene.
188
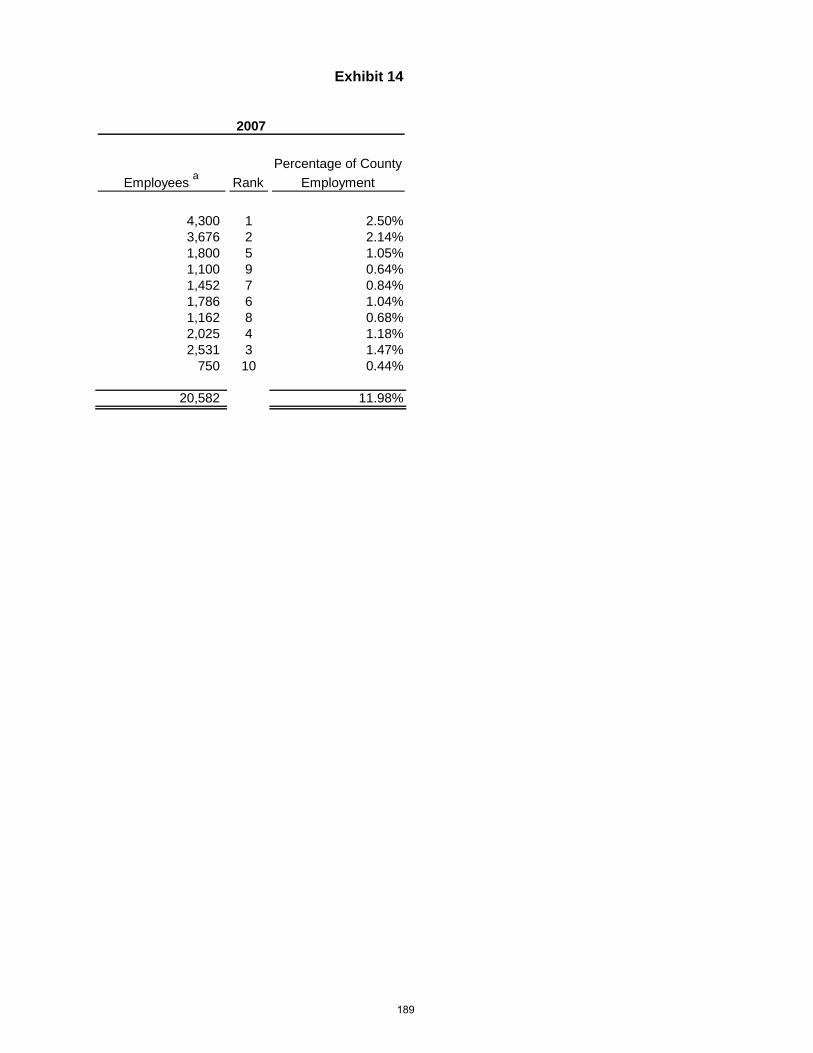
Exhibit 14
2007
Employees a RankPercentage of County
Employment
4,300 1 2.50%3,676 2 2.14%1,800 5 1.05%1,100 9 0.64%1,452 7 0.84%1,786 6 1.04%1,162 8 0.68%2,025 4 1.18%2,531 3 1.47%
750 10 0.44%
20,582 11.98%
189
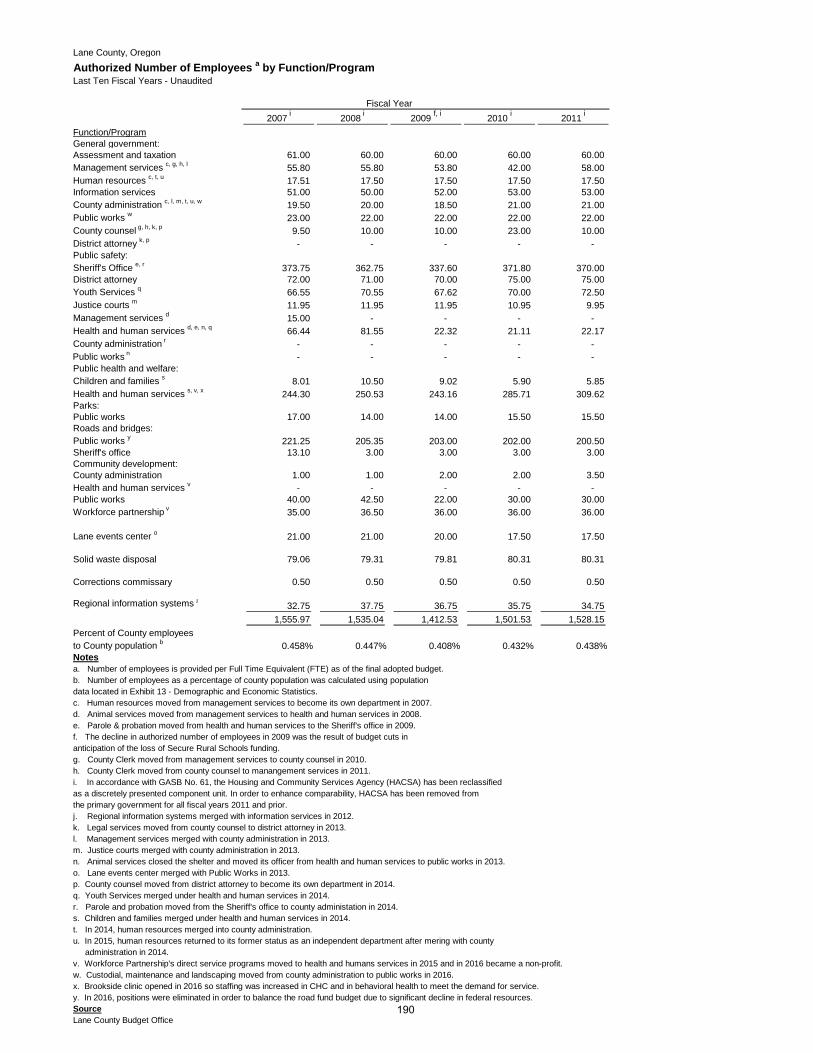
Lane County, Oregon
Authorized Number of Employees a by Function/ProgramLast Ten Fiscal Years - Unaudited
Fiscal Year 2007 i 2008 i 2009 f, i 2010 i 2011 i
Function/ProgramGeneral government:Assessment and taxation 61.00 60.00 60.00 60.00 60.00 Management services c, g, h, l 55.80 55.80 53.80 42.00 58.00 Human resources c, t, u 17.51 17.50 17.50 17.50 17.50 Information services 51.00 50.00 52.00 53.00 53.00 County administration c, l, m, t, u, w 19.50 20.00 18.50 21.00 21.00 Public works w 23.00 22.00 22.00 22.00 22.00 County counsel g, h, k, p 9.50 10.00 10.00 23.00 10.00 District attorney k, p - - - - - Public safety:Sheriff's Office e, r 373.75 362.75 337.60 371.80 370.00 District attorney 72.00 71.00 70.00 75.00 75.00 Youth Services q 66.55 70.55 67.62 70.00 72.50 Justice courts m 11.95 11.95 11.95 10.95 9.95 Management services d 15.00 - - - - Health and human services d, e, n, q 66.44 81.55 22.32 21.11 22.17 County administration r - - - - - Public works n - - - - - Public health and welfare:Children and families s 8.01 10.50 9.02 5.90 5.85 Health and human services s, v, x 244.30 250.53 243.16 285.71 309.62 Parks:Public works 17.00 14.00 14.00 15.50 15.50 Roads and bridges:Public works y 221.25 205.35 203.00 202.00 200.50 Sheriff's office 13.10 3.00 3.00 3.00 3.00 Community development:County administration 1.00 1.00 2.00 2.00 3.50 Health and human services v - - - - - Public works 40.00 42.50 22.00 30.00 30.00 Workforce partnership v 35.00 36.50 36.00 36.00 36.00
Lane events center o 21.00 21.00 20.00 17.50 17.50
Solid waste disposal 79.06 79.31 79.81 80.31 80.31
Corrections commissary 0.50 0.50 0.50 0.50 0.50
Regional information systems j 32.75 37.75 36.75 35.75 34.75 1,555.97 1,535.04 1,412.53 1,501.53 1,528.15
Percent of County employees to County population b 0.458% 0.447% 0.408% 0.432% 0.438%Notesa. Number of employees is provided per Full Time Equivalent (FTE) as of the final adopted budget.b. Number of employees as a percentage of county population was calculated using population data located in Exhibit 13 - Demographic and Economic Statistics.c. Human resources moved from management services to become its own department in 2007.d. Animal services moved from management services to health and human services in 2008. e. Parole & probation moved from health and human services to the Sheriff's office in 2009.f. The decline in authorized number of employees in 2009 was the result of budget cuts in anticipation of the loss of Secure Rural Schools funding.g. County Clerk moved from management services to county counsel in 2010.h. County Clerk moved from county counsel to manangement services in 2011.i. In accordance with GASB No. 61, the Housing and Community Services Agency (HACSA) has been reclassified as a discretely presented component unit. In order to enhance comparability, HACSA has been removed from the primary government for all fiscal years 2011 and prior.j. Regional information systems merged with information services in 2012.k. Legal services moved from county counsel to district attorney in 2013.l. Management services merged with county administration in 2013.m. Justice courts merged with county administration in 2013.n. Animal services closed the shelter and moved its officer from health and human services to public works in 2013.o. Lane events center merged with Public Works in 2013.p. County counsel moved from district attorney to become its own department in 2014.q. Youth Services merged under health and human services in 2014.r. Parole and probation moved from the Sheriff's office to county administation in 2014.s. Children and families merged under health and human services in 2014.t. In 2014, human resources merged into county administration.u. In 2015, human resources returned to its former status as an independent department after mering with county administration in 2014.v. Workforce Partnership's direct service programs moved to health and humans services in 2015 and in 2016 became a non-profit.w. Custodial, maintenance and landscaping moved from county administration to public works in 2016.x. Brookside clinic opened in 2016 so staffing was increased in CHC and in behavioral health to meet the demand for service.y. In 2016, positions were eliminated in order to balance the road fund budget due to significant decline in federal resources.SourceLane County Budget Office
190
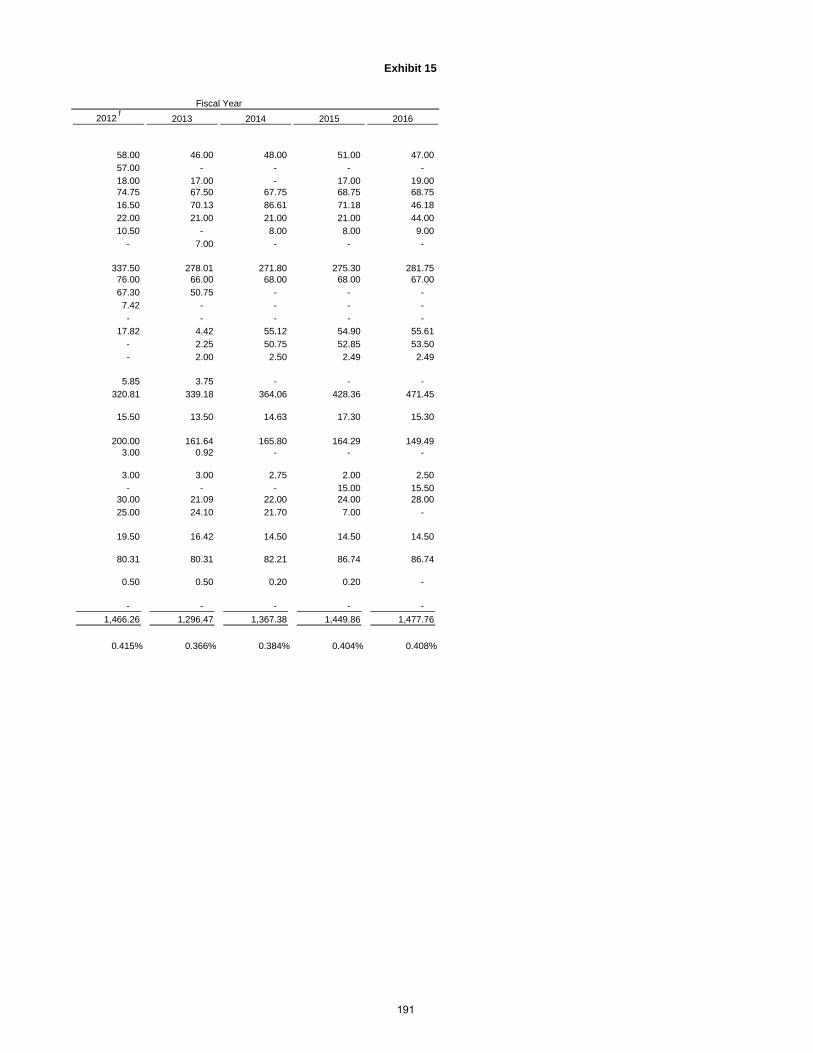
Exhibit 15
Fiscal Year2012 f 2013 2014 2015 2016
58.00 46.00 48.00 51.00 47.00 57.00 - - - - 18.00 17.00 - 17.00 19.00 74.75 67.50 67.75 68.75 68.75 16.50 70.13 86.61 71.18 46.18 22.00 21.00 21.00 21.00 44.00 10.50 - 8.00 8.00 9.00
- 7.00 - - -
337.50 278.01 271.80 275.30 281.75 76.00 66.00 68.00 68.00 67.00 67.30 50.75 - - - 7.42 - - - - - - - - -
17.82 4.42 55.12 54.90 55.61 - 2.25 50.75 52.85 53.50 - 2.00 2.50 2.49 2.49
5.85 3.75 - - - 320.81 339.18 364.06 428.36 471.45
15.50 13.50 14.63 17.30 15.30
200.00 161.64 165.80 164.29 149.49 3.00 0.92 - - -
3.00 3.00 2.75 2.00 2.50 - - - 15.00 15.50
30.00 21.09 22.00 24.00 28.00 25.00 24.10 21.70 7.00 -
19.50 16.42 14.50 14.50 14.50
80.31 80.31 82.21 86.74 86.74
0.50 0.50 0.20 0.20 -
- - - - - 1,466.26 1,296.47 1,367.38 1,449.86 1,477.76
0.415% 0.366% 0.384% 0.404% 0.408%
191

Lane County, OregonOperating Indicators by Function/ProgramLast Ten Fiscal Years - Unaudited
Fiscal Year 2007 c 2008 c 2009 c 2010 c
Function/Program
Public safetySheriff's office:Response to calls for service b 48,584 52,034 60,157 49,962Jail Book Ins 13,891 13,205 12,603 11,673Discretionary general fund contribution (in dollars) f f f f f
District attorney:Criminal cases processed 8,543 8,821 9,538 6,777Juvenile delinquency cases referred a 2,820 2,949 2,710 2,308Victim services volunteer hours 9,192 8,937 9,658 9,348Youth services:Juvenile referrals 2,820 2,592 2,308 2,306Justice courts:Citations processed d 21,562 20,320 25,502 15,467
Public health and welfareChildren and families:First-Birth familes screened g 634 747 889 1,109All Families screened g g g g
Health and human services:Community Health Centers:Medical, dental, and mental health encounters 22,167 25,159 28,220 33,649
Roads and bridgesMiles of road receiving surface maintenance 107 115 154 126Building permits issued 1,889 1,860 1,514 1,400
Lane events center County fair attendance e 169,373 162,542 151,763 150,000
Solid waste disposalTons of waste added to landfill 291,305 271,108 230,302 223,812
Notesa. Includes all delinquencies handled by the system. The juvenile intake team handles a large amount of work normally processed by a DA as only one prosecutor is assigned to juvenile.b. Represents the number of responses to priority calls 1-6.c. In accordance with GASB No. 61, the Housing and Community Services Agency (HACSA) has been reclassified as a discretely presented component unit. In order to enhance comparability, HACSA has been removed from this exhibit for fiscal years 2011 and prior.d. Central and Eastern Lane Justice Courts closed. Only the Florence Justice Court remains open in FY 2013.e. In fiscal year 2013, the Lane Events Center changed how it counts fair attendance. The new methodology is not comparable to prior years.f. Discretionary general fund contribution excludes intrafund transfers and lapse requirements. Years prior to 2013 are not been calculated.g. In July 2015, Oregon Revised Statue (ORS 417.795) allowed screening for all families, not just for the first birth families. First births screened are included in all families screened for FY 2015 reporting purposes.
SourceLane County Department Contacts
192
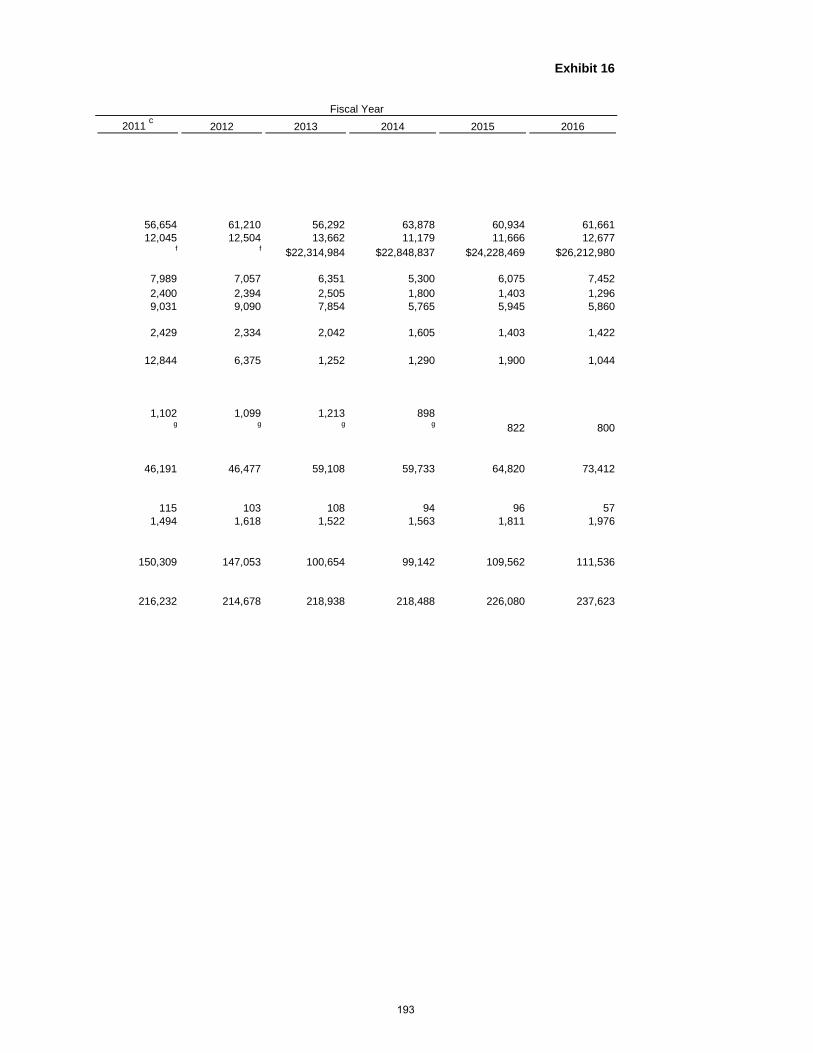
Exhibit 16
Fiscal Year2011 c 2012 2013 2014 2015 2016
56,654 61,210 56,292 63,878 60,934 61,66112,045 12,504 13,662 11,179 11,666 12,677
f f $22,314,984 $22,848,837 $24,228,469 $26,212,980
7,989 7,057 6,351 5,300 6,075 7,4522,400 2,394 2,505 1,800 1,403 1,2969,031 9,090 7,854 5,765 5,945 5,860
2,429 2,334 2,042 1,605 1,403 1,422
12,844 6,375 1,252 1,290 1,900 1,044
1,102 1,099 1,213 898g g g g 822 800
46,191 46,477 59,108 59,733 64,820 73,412
115 103 108 94 96 571,494 1,618 1,522 1,563 1,811 1,976
150,309 147,053 100,654 99,142 109,562 111,536
216,232 214,678 218,938 218,488 226,080 237,623
193

Lane County, OregonCapital Asset Statistics by Function/ProgramLast Ten Fiscal Years - Unaudited
2007 d 2008 d 2009 d 2010 d
Function/Program
Public safetySheriff's office:
Corrections:Capacity (beds) a
County jail 499 504 507 507Community corrections center 116 116 116 122Forest work camp c 95 100 0 0
Youth services:Youth detention/secure treatment beds 96 96 96 96Youth treatment beds b 42 42 42 42
ParksRecreation:
Acreage 4,528 4,528 4,528 4,528Recreational sites 73 73 73 73
Roads and bridgesMiles of Roads 1,440 1,444 1,447 1,446Number of Bridges 414 414 415 415
Solid waste disposalMunicipal solid waste landfill 1 1 1 1Public disposal sites 16 16 16 16
Notesa. Use of county jail beds is limited by the Federal Consent Decree Limitation to 93% capacity and further limited by
the closure of beds due to lack of adequate/safe staffing levels.b In FY 2013 the County no longer had access to Pathways treatment beds, which is now a state facility.c. The decline in Forest work camp beds in 2009 was the result of budget cuts in
anticipation of the loss of Secure Rural Schools funding.d. In accordance with GASB No. 61, the Housing and Community Services Agency (HACSA)
has been reclassified as a discretely presented component unit. In order to enhance comparability, HACSA has been removed the primary government for all fiscal years 2011 and prior.
SourceLane County Department Contacts
Fiscal Year
194

Exhibit 17
2011 d 2012 2013 2014 2015 2016
507 507 507 507 507 507122 33 33 36 39 390 0 0 0 0 0
96 96 96 96 96 9642 16 0 0 0 0
4,528 4,528 4,479 4,318 4,327 4,43073 73 71 70 68 71
1,443 1,443 1,443 1,443 1,443 1,443418 418 420 417 417 417
1 1 1 1 1 116 16 16 16 16 16
Fiscal Year
195

196
AUDIT COMMENTS AND GOVERNMENT AUDITING STANDARDS SECTIONS

AUDIT COMMENTS
AUDIT COMMENTS (Comments and Disclosure Required by State Regulators)
Oregon Administrative Rules 162-010-0000 through 162-010-0330, of the Minimum Standards for Audits of Oregon Municipal Corporations, prescribed by the Secretary of State in cooperation with the Oregon State Board of Accountancy, enumerate the financial statements, schedules, comments and disclosures required in audit reports. The required financial statements and schedules are set forth in preceding sections of this report. Required comments and disclosures related to the audit of such statements are set forth following.
197

198
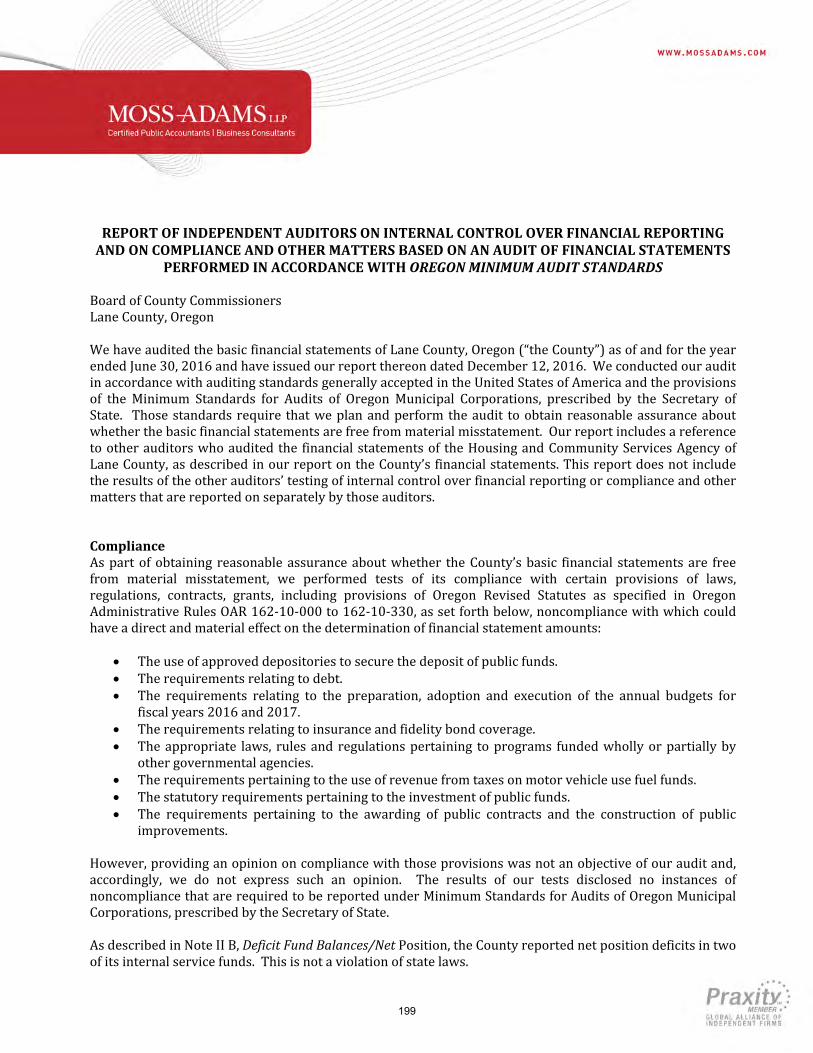
REPORTOFINDEPENDENTAUDITORSONINTERNALCONTROLOVERFINANCIALREPORTINGANDONCOMPLIANCEANDOTHERMATTERSBASEDONANAUDITOFFINANCIALSTATEMENTS
PERFORMEDINACCORDANCEWITHOREGONMINIMUMAUDITSTANDARDSBoardofCountyCommissionersLaneCounty,OregonWehaveauditedthebasicfinancialstatementsofLaneCounty,Oregon(“theCounty”)asofandfortheyearendedJune30,2016andhaveissuedourreportthereondatedDecember12,2016.WeconductedourauditinaccordancewithauditingstandardsgenerallyacceptedintheUnitedStatesofAmericaandtheprovisionsof the Minimum Standards for Audits of Oregon Municipal Corporations, prescribed by the Secretary ofState. Thosestandardsrequire thatweplanandperformtheaudit toobtainreasonableassuranceaboutwhetherthebasicfinancialstatementsarefreefrommaterialmisstatement.Ourreportincludesareferencetootherauditorswhoauditedthe financialstatementsof theHousingandCommunityServicesAgencyofLaneCounty,asdescribedinourreportontheCounty’sfinancialstatements.Thisreportdoesnotincludetheresultsoftheotherauditors’testingofinternalcontroloverfinancialreportingorcomplianceandothermattersthatarereportedonseparatelybythoseauditors.ComplianceAspartofobtaining reasonableassuranceaboutwhether theCounty’sbasic financial statementsare freefrom material misstatement, we performed tests of its compliance with certain provisions of laws,regulations, contracts, grants, including provisions of Oregon Revised Statutes as specified in OregonAdministrativeRulesOAR162‐10‐000to162‐10‐330,assetforthbelow,noncompliancewithwhichcouldhaveadirectandmaterialeffectonthedeterminationoffinancialstatementamounts:
Theuseofapproveddepositoriestosecurethedepositofpublicfunds. Therequirementsrelatingtodebt. The requirements relating to the preparation, adoption and execution of the annual budgets for
fiscalyears2016and2017. Therequirementsrelatingtoinsuranceandfidelitybondcoverage. Theappropriate laws, rulesandregulationspertaining toprograms fundedwhollyorpartiallyby
othergovernmentalagencies. Therequirementspertainingtotheuseofrevenuefromtaxesonmotorvehicleusefuelfunds. Thestatutoryrequirementspertainingtotheinvestmentofpublicfunds. The requirements pertaining to the awarding of public contracts and the construction of public
improvements.
However,providinganopiniononcompliancewiththoseprovisionswasnotanobjectiveofourauditand,accordingly, we do not express such an opinion. The results of our tests disclosed no instances ofnoncompliancethatarerequiredtobereportedunderMinimumStandardsforAuditsofOregonMunicipalCorporations,prescribedbytheSecretaryofState.AsdescribedinNoteIIB,DeficitFundBalances/NetPosition,theCountyreportednetpositiondeficitsintwoofitsinternalservicefunds.Thisisnotaviolationofstatelaws.
199
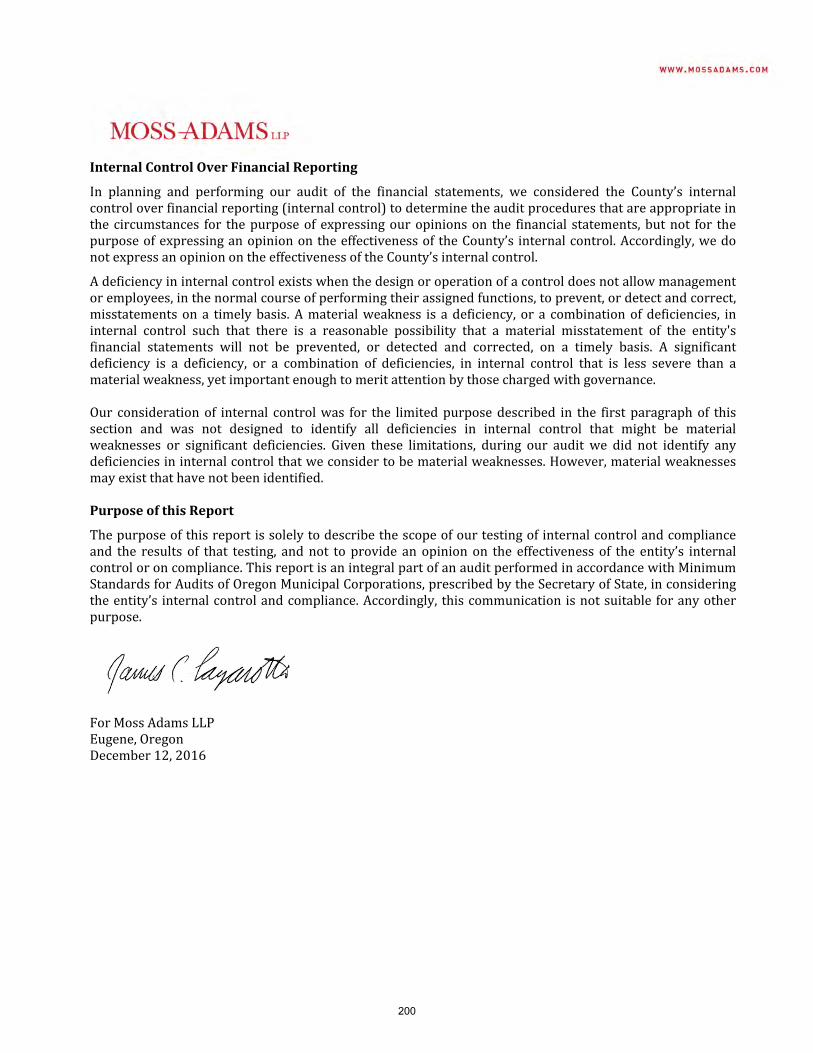
InternalControlOverFinancialReporting
In planning and performing our audit of the financial statements, we considered the County’s internalcontroloverfinancialreporting(internalcontrol)todeterminetheauditproceduresthatareappropriateinthecircumstances for thepurposeof expressingouropinionson the financial statements,butnot for thepurposeofexpressinganopinionontheeffectivenessoftheCounty’s internalcontrol.Accordingly,wedonotexpressanopinionontheeffectivenessoftheCounty’sinternalcontrol.
Adeficiencyininternalcontrolexistswhenthedesignoroperationofacontroldoesnotallowmanagementoremployees,inthenormalcourseofperformingtheirassignedfunctions,toprevent,ordetectandcorrect,misstatementsona timelybasis.Amaterialweakness is adeficiency, or a combinationofdeficiencies, ininternal control such that there is a reasonable possibility that a material misstatement of the entity'sfinancial statements will not be prevented, or detected and corrected, on a timely basis. A significantdeficiency is a deficiency, or a combination of deficiencies, in internal control that is less severe than amaterialweakness,yetimportantenoughtomeritattentionbythosechargedwithgovernance.Our considerationof internal controlwas for the limitedpurposedescribed in the first paragraphof thissection and was not designed to identify all deficiencies in internal control that might be materialweaknesses or significant deficiencies. Given these limitations, during our audit we did not identify anydeficienciesininternalcontrolthatweconsidertobematerialweaknesses.However,materialweaknessesmayexistthathavenotbeenidentified.PurposeofthisReport
Thepurposeofthisreportissolelytodescribethescopeofourtestingofinternalcontrolandcomplianceand the results of that testing, andnot to provide an opinionon the effectiveness of the entity’s internalcontroloroncompliance.ThisreportisanintegralpartofanauditperformedinaccordancewithMinimumStandardsforAuditsofOregonMunicipalCorporations,prescribedbytheSecretaryofState,inconsideringtheentity’s internalcontrolandcompliance.Accordingly, thiscommunicationisnotsuitableforanyotherpurpose.
ForMossAdamsLLPEugene,OregonDecember12,2016
200

GOVERNMENT AUDITING STANDARDS
Government Auditing Standards Report
201

202
REPORTOFINDEPENDENTAUDITORSONINTERNALCONTROLOVERFINANCIALREPORTING
ANDONCOMPLIANCEANDOTHERMATTERSBASEDONANAUDITOFFINANCIALSTATEMENTSPERFORMEDINACCORDANCEWITHGOVERNMENTAUDITINGSTANDARDS
BoardofCountyCommissionersLaneCounty,OregonWehaveaudited, inaccordancewiththeauditingstandardsgenerallyacceptedintheUnitedStatesofAmerica and the standards applicable to financial audits contained inGovernmentAuditingStandardsissued by the Comptroller General of theUnited States, the financial statements of the governmentalactivities, thebusiness‐typeactivities, theaggregatediscretelypresented componentunit, eachmajorfund,andtheaggregateremainingfundinformationofLaneCounty,Oregon(“theCounty”), asofandfor theyearended June30,2016,andtherelatednotesto the financialstatements,whichcollectivelycomprisetheCounty’sbasicfinancialstatements,andhaveissuedourreportthereondatedDecember12,2016.OurreportincludesareferencetootherauditorswhoauditedthefinancialstatementsoftheHousing andCommunity ServicesAgency of LaneCounty, as described in our report on theCounty’sfinancial statements.This reportdoesnot include the resultsof theotherauditors’ testingof internalcontrol over financial reporting or compliance and othermatters that are reported on separately bythoseauditors.InternalControlOverFinancialReportingInplanningandperformingourauditof the financialstatements,weconsideredtheCounty’s internalcontrol over financial reporting (internal control) to determine the audit procedures that areappropriateinthecircumstancesforthepurposeofexpressingouropinionsonthefinancialstatements,butnot for thepurposeofexpressinganopinionon theeffectivenessof theCounty’s internalcontrol.Accordingly,wedonotexpressanopinionontheeffectivenessoftheCounty’sinternalcontrol.A deficiency in internal control exists when the design or operation of a control does not allowmanagementoremployees,inthenormalcourseofperformingtheirassignedfunctions,toprevent,ordetect and correct, misstatements on a timely basis. A material weakness is a deficiency, or acombinationofdeficiencies,ininternalcontrolsuchthatthereisareasonablepossibilitythatamaterialmisstatementoftheentity'sfinancialstatementswillnotbeprevented,ordetectedandcorrected,onatimelybasis.Asignificantdeficiency isadeficiency,oracombinationofdeficiencies,ininternalcontrolthatislessseverethanamaterialweakness,yetimportantenoughtomeritattentionbythosechargedwithgovernance.Ourconsiderationofinternalcontrolwasforthelimitedpurposedescribedinthefirstparagraphofthissection and was not designed to identify all deficiencies in internal control that might be materialweaknessesorsignificantdeficiencies.Giventheselimitations,duringourauditwedidnotidentifyanydeficiencies in internal control that we consider to be material weaknesses. However, materialweaknessesmayexistthathavenotbeenidentified.
203
ComplianceandOtherMattersAspartofobtainingreasonableassuranceaboutwhethertheCounty’sfinancialstatementsarefreefrommaterial misstatement, we performed tests of its compliance with certain provisions of laws,regulations, contracts, and grant agreements, noncompliance with which could have a direct andmaterialeffectonthedeterminationoffinancialstatementamounts.However,providinganopiniononcompliancewiththoseprovisionswasnotanobjectiveofouraudit,andaccordingly,wedonotexpresssuchanopinion.TheresultsofourtestsdisclosednoinstancesofnoncomplianceorothermattersthatarerequiredtobereportedunderGovernmentAuditingStandards.PurposeofthisReportThe purpose of this report is solely to describe the scope of our testing of internal control andcompliance and the results of that testing, and not to provide an opinion on the effectiveness of theentity’s internal control or on compliance. This report is an integral part of an audit performed inaccordance with Government Auditing Standards in considering the entity’s internal control andcompliance.Accordingly,thiscommunicationisnotsuitableforanyotherpurpose.
Eugene,OregonDecember12,2016
204
The Uniform Guidance (Single Audit) Report
205
REPORTOFINDEPENDENTAUDITORSONCOMPLIANCEFOREACHMAJORFEDERALPROGRAMANDREPORTONINTERNALCONTROLOVERCOMPLIANCEREQUIREDBYTHEUNIFORM
GUIDANCEBoardofCountyCommissionersLaneCounty,OregonReportonComplianceforEachMajorFederalProgramWe have audited Lane County, Oregon’s (“the County”) compliance with the types of compliancerequirementsdescribedintheOMBComplianceSupplementthatcouldhaveadirectandmaterialeffectoneachoftheCounty'smajorfederalprogramsfortheyearendedJune30,2016. TheCounty'smajorfederal programs are identified in the summary of auditor's results section of the accompanyingscheduleoffindingsandquestionedcosts.TheCounty’sbasicfinancialstatementsincludetheoperationsoftheHousingandCommunityServicesAgencyofLaneCounty(“HACSA”),adiscretelypresentedcomponentunitoftheCounty,whichreceived$30,858,487 in federal awardswhich is not included in the schedule during the year ended June 30,2016.Ouraudit,describedbelow,didnotincludetheoperationsofHACSAbecausetheentityengagedotherauditorstoperformanauditinaccordancewithOMBCircularA‐133.Management’sResponsibilityManagement is responsible for compliance with federal statutes, regulations, and the terms andconditionsofitsfederalawardsapplicabletoitsfederalprograms.Auditor’sResponsibilityOur responsibility is to express an opinion on compliance for each of the County's major federalprogramsbasedonourauditofthetypesofcompliancerequirementsreferredtoabove.WeconductedourauditofcomplianceinaccordancewithauditingstandardsgenerallyacceptedintheUnitedStatesofAmerica; the standards applicable to financial audits contained in Government Auditing Standards,issuedbytheComptrollerGeneraloftheUnitedStates;andtheauditrequirementsofTitle2U.S.CodeofFederal Regulations Part 200, Uniform Administrative Requirements, Cost Principles, and AuditRequirements for Federal Awards (Uniform Guidance). Those standards and the Uniform Guidancerequire that we plan and perform the audit to obtain reasonable assurance about whethernoncompliancewith the typesof compliance requirements referred toabove that couldhaveadirectandmaterialeffectonamajorfederalprogramoccurred.Anaudit includesexamining,onatestbasis,evidence about the County's compliance with those requirements and performing such otherproceduresasweconsiderednecessaryinthecircumstances.We believe that our audit provides a reasonable basis for our opinion on compliance for eachmajorfederalprogram.However,ourauditdoesnotprovidealegaldeterminationoftheCounty'scompliance.
206
OpiniononEachMajorFederalProgramInouropinion,theCountycomplied,inallmaterialrespects,withthetypesofcompliancerequirementsreferredtoabovethatcouldhaveadirectandmaterialeffectoneachofitsmajorfederalprogramsfortheyearendedJune30,2016.ReportonInternalControlOverComplianceManagementoftheCountyisresponsibleforestablishingandmaintainingeffectiveinternalcontrolovercompliancewith the typesofcompliancerequirementsreferred toabove. Inplanningandperformingourauditofcompliance,weconsideredtheCounty'sinternalcontrolovercompliancewiththetypesofrequirementsthatcouldhaveadirectandmaterialeffectoneachmajorfederalprogramtodeterminethe auditing procedures that are appropriate in the circumstances for the purpose of expressing anopiniononcomplianceforeachmajorfederalprogramandtotestandreportoninternalcontrolovercomplianceinaccordancewiththeUniformGuidance,butnotforthepurposeofexpressinganopinionontheeffectivenessofinternalcontrolovercompliance.Accordingly,wedonotexpressanopinionontheeffectivenessoftheCounty'sinternalcontrolovercompliance.Adeficiency in internalcontrolovercomplianceexistswhen thedesignor operationof a control overcompliance does not allow management or employees, in the normal course of performing theirassigned functions, to prevent, or detect and correct, noncompliance with a type of compliancerequirement of a federal program on a timely basis. A material weakness in internal control overcomplianceisadeficiency,oracombinationofdeficiencies,ininternalcontrolovercompliancesuchthatthereisareasonablepossibilitythatmaterialnoncompliancewithatypeofcompliancerequirementofafederal program will not be prevented, or detected and corrected, on a timely basis. A significantdeficiencyininternalcontrolovercomplianceisadeficiency,oracombinationofdeficiencies,ininternalcontrolovercompliancewithatypeofcompliancerequirementofafederalprogramthatislessseverethanamaterialweaknessininternalcontrolovercompliance,yetimportantenoughtomeritattentionbythosechargedwithgovernance.Ourconsiderationofinternalcontrolovercompliancewasforthelimitedpurposedescribedinthefirstparagraph of this section and was not designed to identify all deficiencies in internal control overcompliance that might be material weaknesses or significant deficiencies. We did not identify anydeficienciesininternalcontrolovercompliancethatweconsidertobematerialweaknesses.However,materialweaknessesmayexistthathavenotbeenidentified.Thepurpose of this report on internal control over compliance is solely todescribe the scope of ourtestingofinternalcontrolovercomplianceandtheresultsofthattestingbasedontherequirementsoftheUniformGuidance.Accordingly,thisreportisnotsuitableforanyotherpurpose.
Eugene,OregonDecember12,2016
207

See notes to schedule of expenditures of federal awards
Lane County, OregonSchedule for Expenditures of Federal Awards For Fiscal Year ended June 30, 2016
Grantor and Program TitleCFDA
NumberIdentifying Pass Through
Entity NumberFederal
ExpendituresAmounts Provided to
Subrecipients
Child Nutrition ClusterUS DEPARTMENT OF AGRICULTURE
Passed through Oregon Department of Education:School Breakfast Program 10.553 22,049$ - National School Lunch Program 10.555 40,970 - National School Lunch Program - Commodities 10.555 2,722 -
Total Child Nutrition Cluster 65,741 -
Forest Service Schools and Roads ClusterUS DEPARTMENT OF AGRICULTURE
Direct Programs:Schools and Roads - Grants to States 10.665 105,298 -
Passed through Oregon Department of Administrative Services:Schools and Roads - Grants to States 10.665 9,345,152 -
Total Forest Service Schools and Roads Cluster 9,450,450 -
CDBG - Entitlement Grants ClusterUS DEPARTMENT OF HOUSING AND URBAN DEVELOPMENT
Passed through City of Eugene:Community Development Block Grants/Entitlement Grants 14.218 350,000 350,000
Passed through City of Springfield:Community Development Block Grants/Entitlement Grants 14.218 70,004 70,004
Total CDBG - Entitlement Grants Cluster 420,004 420,004
WIA/WIOA ClusterUS DEPARTMENT OF LABOR
Passed through Lane Workforce Partnership:WIA/WIOA Adult Program 17.258 499,659 - WIA/WIOA Youth Activities 17.259 31017 21,419 - WIA/WIOA Youth Activities 17.259 31044 56,112 - WIA/WIOA Dislocated Worker Formula Grants 17.278 719,816 -
Total WIA/WIOA Cluster 1,297,006 -
Highway Planning and Construction ClusterUS DEPARTMENT OF TRANSPORTATION
Passed through Oregon Department of Transportation:Highway Planning and Construction 20.205 28959 116,484 - Highway Planning and Construction 20.205 29434 36,500 - Highway Planning and Construction 20.205 29810 87,188 - Highway Planning and Construction 20.205 30313 118,215 - Highway Planning and Construction 20.205 30499 14,382 - Highway Planning and Construction 20.205 30957 154,649 - Highway Planning and Construction 20.205 DTFH7015E00017 747,794 - Highway Planning and Construction 20.205 DTFH7015E00018 94,812 - Highway Planning and Construction 20.205 17,900 -
Passed through Lane Council of Governments:Highway Planning and Construction 20.205 15-TransOps 5,398 - Highway Planning and Construction 20.205 16-TransOps 42,663 -
Total Highway Planning and Construction Cluster 1,435,985 -
Highway Safety ClusterUS DEPARTMENT OF TRANSPORTATION
Passed through Oregon State Sheriff's Association:National Priority Safety Programs 20.616 M1HVE-15-46-08 1,248 - National Priority Safety Programs 20.616 M1HVE-16-46-08 1,048 - National Priority Safety Programs 20.616 M5HVE-15-12-21 7,210 - National Priority Safety Programs 20.616 M5HVE-16-12-21 2,134 -
Total Highway Safety Cluster 11,640 -
Drinking Water State Revolving Fund ClusterUS ENVIRONMENTAL PROTECTION AGENCY
Passed through Oregon Health Authority:Capitalization Grants for Drinking Water State Revolving Funds 66.468 33,553 -
Total Drinking Water State Revolving Fund Cluster 33,553 -
208
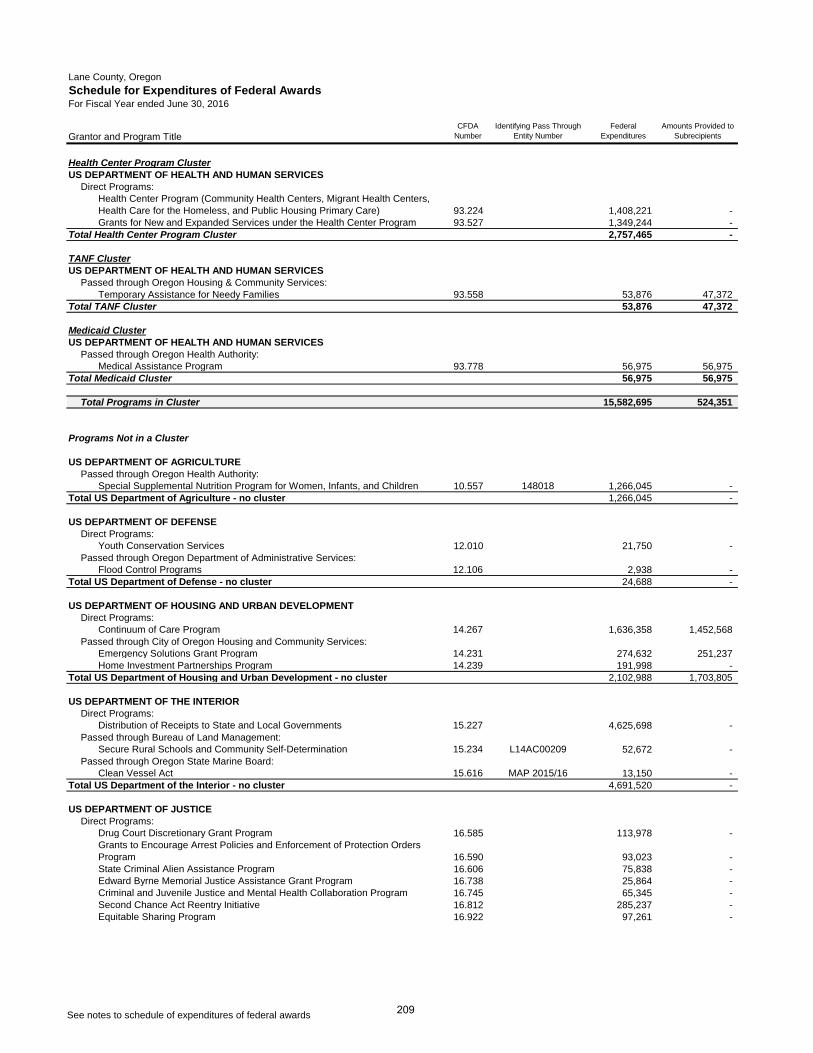
See notes to schedule of expenditures of federal awards
Lane County, OregonSchedule for Expenditures of Federal Awards For Fiscal Year ended June 30, 2016
Grantor and Program TitleCFDA
NumberIdentifying Pass Through
Entity NumberFederal
ExpendituresAmounts Provided to
Subrecipients
Health Center Program ClusterUS DEPARTMENT OF HEALTH AND HUMAN SERVICES
Direct Programs:Health Center Program (Community Health Centers, Migrant Health Centers, Health Care for the Homeless, and Public Housing Primary Care) 93.224 1,408,221 - Grants for New and Expanded Services under the Health Center Program 93.527 1,349,244 -
Total Health Center Program Cluster 2,757,465 -
TANF ClusterUS DEPARTMENT OF HEALTH AND HUMAN SERVICES
Passed through Oregon Housing & Community Services:Temporary Assistance for Needy Families 93.558 53,876 47,372
Total TANF Cluster 53,876 47,372
Medicaid ClusterUS DEPARTMENT OF HEALTH AND HUMAN SERVICES
Passed through Oregon Health Authority:Medical Assistance Program 93.778 56,975 56,975
Total Medicaid Cluster 56,975 56,975
Total Programs in Cluster 15,582,695 524,351
Programs Not in a Cluster
US DEPARTMENT OF AGRICULTUREPassed through Oregon Health Authority:
Special Supplemental Nutrition Program for Women, Infants, and Children 10.557 148018 1,266,045 - Total US Department of Agriculture - no cluster 1,266,045 -
US DEPARTMENT OF DEFENSEDirect Programs:
Youth Conservation Services 12.010 21,750 - Passed through Oregon Department of Administrative Services:
Flood Control Programs 12.106 2,938 - Total US Department of Defense - no cluster 24,688 -
US DEPARTMENT OF HOUSING AND URBAN DEVELOPMENTDirect Programs:
Continuum of Care Program 14.267 1,636,358 1,452,568 Passed through City of Oregon Housing and Community Services:
Emergency Solutions Grant Program 14.231 274,632 251,237 Home Investment Partnerships Program 14.239 191,998 -
Total US Department of Housing and Urban Development - no cluster 2,102,988 1,703,805
US DEPARTMENT OF THE INTERIORDirect Programs:
Distribution of Receipts to State and Local Governments 15.227 4,625,698 - Passed through Bureau of Land Management:
Secure Rural Schools and Community Self-Determination 15.234 L14AC00209 52,672 - Passed through Oregon State Marine Board:
Clean Vessel Act 15.616 MAP 2015/16 13,150 - Total US Department of the Interior - no cluster 4,691,520 -
US DEPARTMENT OF JUSTICEDirect Programs:
Drug Court Discretionary Grant Program 16.585 113,978 - Grants to Encourage Arrest Policies and Enforcement of Protection Orders Program 16.590 93,023 - State Criminal Alien Assistance Program 16.606 75,838 - Edward Byrne Memorial Justice Assistance Grant Program 16.738 25,864 - Criminal and Juvenile Justice and Mental Health Collaboration Program 16.745 65,345 - Second Chance Act Reentry Initiative 16.812 285,237 - Equitable Sharing Program 16.922 97,261 -
209
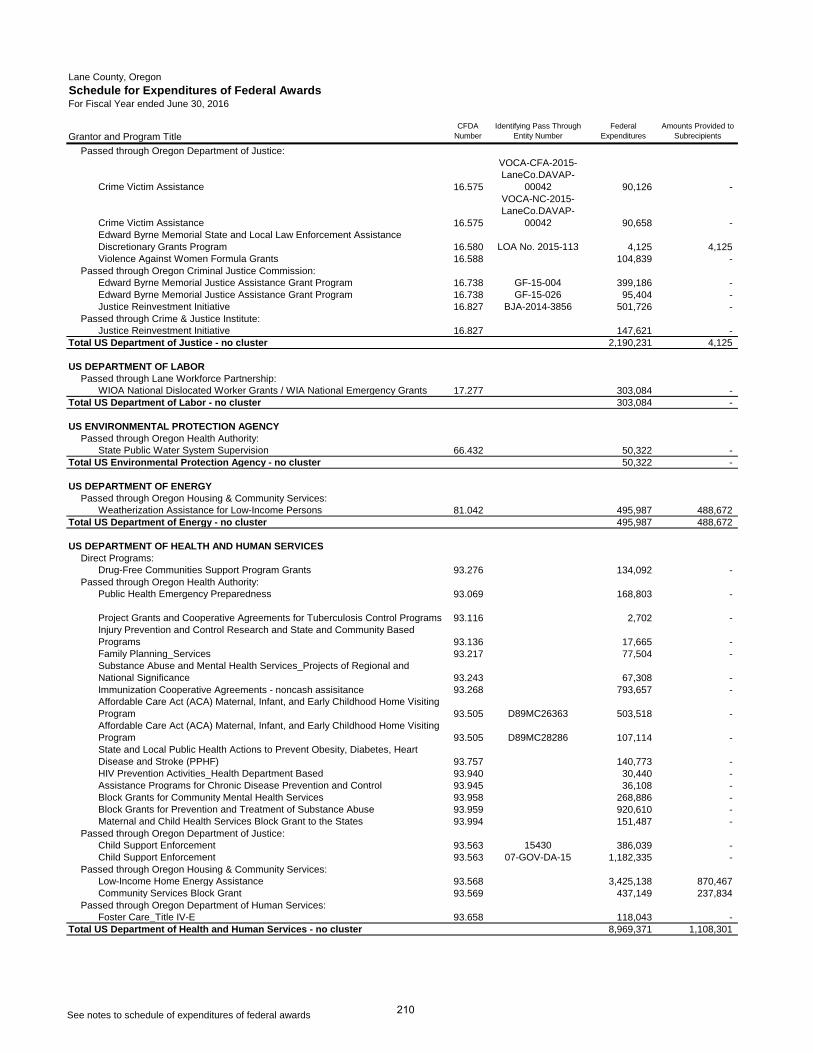
See notes to schedule of expenditures of federal awards
Lane County, OregonSchedule for Expenditures of Federal Awards For Fiscal Year ended June 30, 2016
Grantor and Program TitleCFDA
NumberIdentifying Pass Through
Entity NumberFederal
ExpendituresAmounts Provided to
Subrecipients
Passed through Oregon Department of Justice:
Crime Victim Assistance 16.575
VOCA-CFA-2015-LaneCo.DAVAP-
00042 90,126 -
Crime Victim Assistance 16.575
VOCA-NC-2015-LaneCo.DAVAP-
00042 90,658 - Edward Byrne Memorial State and Local Law Enforcement Assistance Discretionary Grants Program 16.580 LOA No. 2015-113 4,125 4,125 Violence Against Women Formula Grants 16.588 104,839 -
Passed through Oregon Criminal Justice Commission:Edward Byrne Memorial Justice Assistance Grant Program 16.738 GF-15-004 399,186 - Edward Byrne Memorial Justice Assistance Grant Program 16.738 GF-15-026 95,404 - Justice Reinvestment Initiative 16.827 BJA-2014-3856 501,726 -
Passed through Crime & Justice Institute:Justice Reinvestment Initiative 16.827 147,621 -
Total US Department of Justice - no cluster 2,190,231 4,125
US DEPARTMENT OF LABOR Passed through Lane Workforce Partnership:
WIOA National Dislocated Worker Grants / WIA National Emergency Grants 17.277 303,084 - Total US Department of Labor - no cluster 303,084 -
US ENVIRONMENTAL PROTECTION AGENCY Passed through Oregon Health Authority:
State Public Water System Supervision 66.432 50,322 - Total US Environmental Protection Agency - no cluster 50,322 -
US DEPARTMENT OF ENERGYPassed through Oregon Housing & Community Services:
Weatherization Assistance for Low-Income Persons 81.042 495,987 488,672 Total US Department of Energy - no cluster 495,987 488,672
US DEPARTMENT OF HEALTH AND HUMAN SERVICESDirect Programs:
Drug-Free Communities Support Program Grants 93.276 134,092 - Passed through Oregon Health Authority:
Public Health Emergency Preparedness 93.069 168,803 -
Project Grants and Cooperative Agreements for Tuberculosis Control Programs 93.116 2,702 - Injury Prevention and Control Research and State and Community Based Programs 93.136 17,665 - Family Planning_Services 93.217 77,504 - Substance Abuse and Mental Health Services_Projects of Regional and National Significance 93.243 67,308 - Immunization Cooperative Agreements - noncash assisitance 93.268 793,657 - Affordable Care Act (ACA) Maternal, Infant, and Early Childhood Home Visiting Program 93.505 D89MC26363 503,518 - Affordable Care Act (ACA) Maternal, Infant, and Early Childhood Home Visiting Program 93.505 D89MC28286 107,114 - State and Local Public Health Actions to Prevent Obesity, Diabetes, Heart Disease and Stroke (PPHF) 93.757 140,773 - HIV Prevention Activities_Health Department Based 93.940 30,440 - Assistance Programs for Chronic Disease Prevention and Control 93.945 36,108 - Block Grants for Community Mental Health Services 93.958 268,886 - Block Grants for Prevention and Treatment of Substance Abuse 93.959 920,610 - Maternal and Child Health Services Block Grant to the States 93.994 151,487 -
Passed through Oregon Department of Justice:Child Support Enforcement 93.563 15430 386,039 - Child Support Enforcement 93.563 07-GOV-DA-15 1,182,335 -
Passed through Oregon Housing & Community Services:Low-Income Home Energy Assistance 93.568 3,425,138 870,467 Community Services Block Grant 93.569 437,149 237,834
Passed through Oregon Department of Human Services:Foster Care_Title IV-E 93.658 118,043 -
Total US Department of Health and Human Services - no cluster 8,969,371 1,108,301
210

See notes to schedule of expenditures of federal awards
Lane County, OregonSchedule for Expenditures of Federal Awards For Fiscal Year ended June 30, 2016
Grantor and Program TitleCFDA
NumberIdentifying Pass Through
Entity NumberFederal
ExpendituresAmounts Provided to
Subrecipients
EXECUTIVE OFFICE OF THE PRESIDENTPassed through Oregon HIDTA:
High Intensity Drug Trafficking Areas Program 95.001 33882 77,596 - Total Executive Office of the President - no cluster 77,596 -
US DEPARTMENT OF HOMELAND SECURITYPassed through Oregon State Marine Board
Boating Safety Financial Assistance 97.012 434,252 - Passed through Oregon Military Department - Office of Emergency Management:
Hazard Mitigation Grant 97.039 HMGP 4169.0002 22,871 - Emergency Management Performance Grants 97.042 15-520 186,886 - Homeland Security Grant Program 97.067 15-226 52,896 - Homeland Security Grant Program 97.067 15-227 39,103 -
Total US Department of Homeland Security - no cluster 736,008 -
Total Programs Not in Cluster 20,907,840 3,304,903
TOTAL EXPENDITURES OF FEDERAL AWARDS 36,490,535$ 3,829,254$
211
Lane County, Oregon Notes to Schedule of Expenditures of Federal Awards For the Fiscal Year Ended June 30, 2016
1. Basis of Presentation The accompanying schedule of expenditures of federal awards includes federal award activity of Lane County under programs of the federal government for the fiscal year ended June 30, 2016. The information in this schedule is presented in accordance with the requirements Title 2 U.S. Code of Federal Regulations Part 200, "Uniform Administrative Requirements, Cost Principals, and Audit Requirements for Federal Awards" (Uniform Guidance). Because the Schedule presents only a selected portion of the operations of Lane County, it is not intended to and does not present the financial position, changes in net assets, or cash flows of Lane County.
2. Summary of Significant Accounting Policies Expenditures reported on the Schedule are reported on the modified accrual basis of accounting. Such expenditures are recognized following the cost principals contained in the Uniform Guidance, wherein certain types of expenditures are not allowable or are limited as to reimbursement. Negative amounts shown on the Schedule represent adjustments or credits made in the normal course of business to amounts reported as expenditures in prior years. Lane County has elected NOT to use the 10-percent de minimus indirect rate allowed under the Uniform Guidance.
212
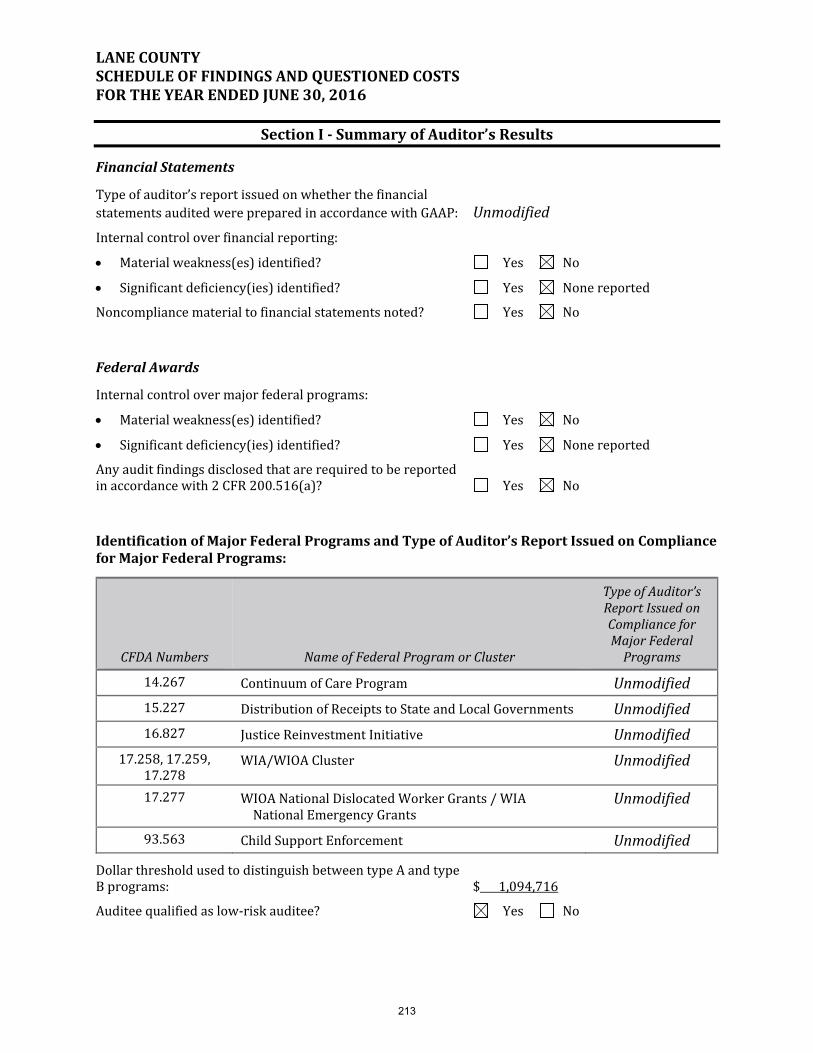
LANECOUNTYSCHEDULEOFFINDINGSANDQUESTIONEDCOSTSFORTHEYEARENDEDJUNE30,2016
SectionI‐SummaryofAuditor’sResults
FinancialStatements
Typeofauditor’sreportissuedonwhetherthefinancialstatementsauditedwerepreparedinaccordancewithGAAP: Unmodified
Internalcontroloverfinancialreporting:
Materialweakness(es)identified? Yes No
Significantdeficiency(ies)identified? Yes Nonereported
Noncompliancematerialtofinancialstatementsnoted? Yes No
FederalAwards
Internalcontrolovermajorfederalprograms:
Materialweakness(es)identified? Yes No
Significantdeficiency(ies)identified? Yes Nonereported
Anyauditfindingsdisclosedthatarerequiredtobereportedinaccordancewith2CFR200.516(a)? Yes No
IdentificationofMajorFederalProgramsandTypeofAuditor’sReportIssuedonComplianceforMajorFederalPrograms:
CFDANumbers NameofFederalProgramorCluster
TypeofAuditor’sReportIssuedonComplianceforMajorFederalPrograms
14.267 ContinuumofCareProgram Unmodified
15.227 DistributionofReceiptstoStateandLocalGovernments Unmodified
16.827 JusticeReinvestmentInitiative Unmodified
17.258,17.259,17.278
WIA/WIOACluster Unmodified
17.277 WIOANationalDislocatedWorkerGrants/WIANationalEmergencyGrants
Unmodified
93.563 ChildSupportEnforcement Unmodified
DollarthresholdusedtodistinguishbetweentypeAandtypeBprograms: $1,094,716
Auditeequalifiedaslow‐riskauditee? Yes No
213
LANECOUNTYSCHEDULEOFFINDINGSANDQUESTIONEDCOSTSFORTHEYEARENDEDJUNE30,2016
SectionII‐FinancialStatementFindingsNonereported
SectionIII‐FederalAwardFindingsandQuestionedCostsNonereported
214
LANE COUNTY SUMMARY SCHEDULE OF PRIOR AUDIT FINDINGS FOR THE YEAR ENDED JUNE 30, 2016 Financial Statement Findings FINDING 2015-001 – Accounting for Capital Assets (Significant Deficiency in Internal Controls over Financial Reporting) Condition: - Our audit procedures identified that approximately $1.78 million in costs related to a data center project were incorrectly coded as professional and consulting expenses and expensed when they should have been capitalized in accordance with the County’s capitalization policy. Recommendation: We recommend that the County revise the written year end close procedures to include a requirement for the formal communication between staff involved in the Capital Improvements Fund projects, and the accounting staff on expenditures that meet the County’s capitalization policies requirement, and to ensure those involved with the review procedures during the year-end close and reporting process to check that this occurs. Status of Finding: Corrective action was taken and fully resolved.
215