competition in the domestic airline sector in mexico - oecd · competition in the domestic airline...
TRANSCRIPT

Competition in the domestic airline sector in Mexico*
Agustin J. Ros Senior Economist, OECD April 23, 2010 * This work is output from the CFC-OECD Competition Assessment Project. Opinions expressed do not necessarily reflect official views of the OECD nor of the governments of its member countries nor the Mexican Competition Commission.
1

i. Summary of main results
ii. Review of competition concerns
iii. Structure of the market, 1989-2008
iv. Summary of 2009 econometric study
v. Policy recommendations & estimate of benefits
Outline of presentation
2

Summary of main results
1. Strong passenger growth, 1989-2008. Compound growth rate of 5.40%, economy grew at 3.00%
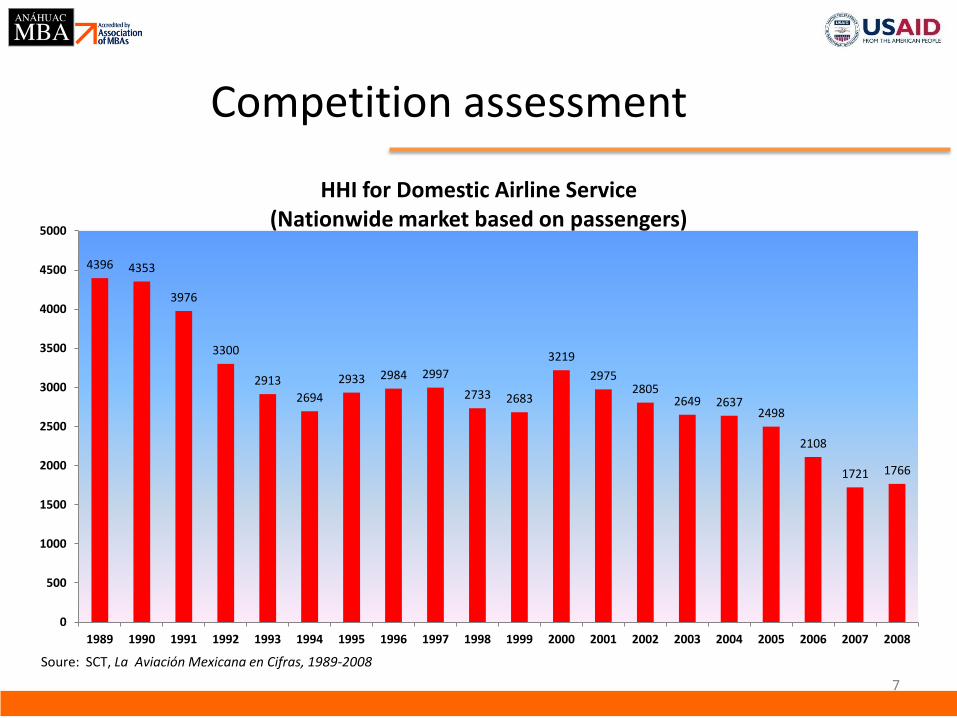
2. Declining concentration, 1989-2008.
1989 HHI of 4396, 2008 HHI of 1766
3. Emergence of low cost carrier as strong competition.
LCCs captured 1/3 of market within several years
3
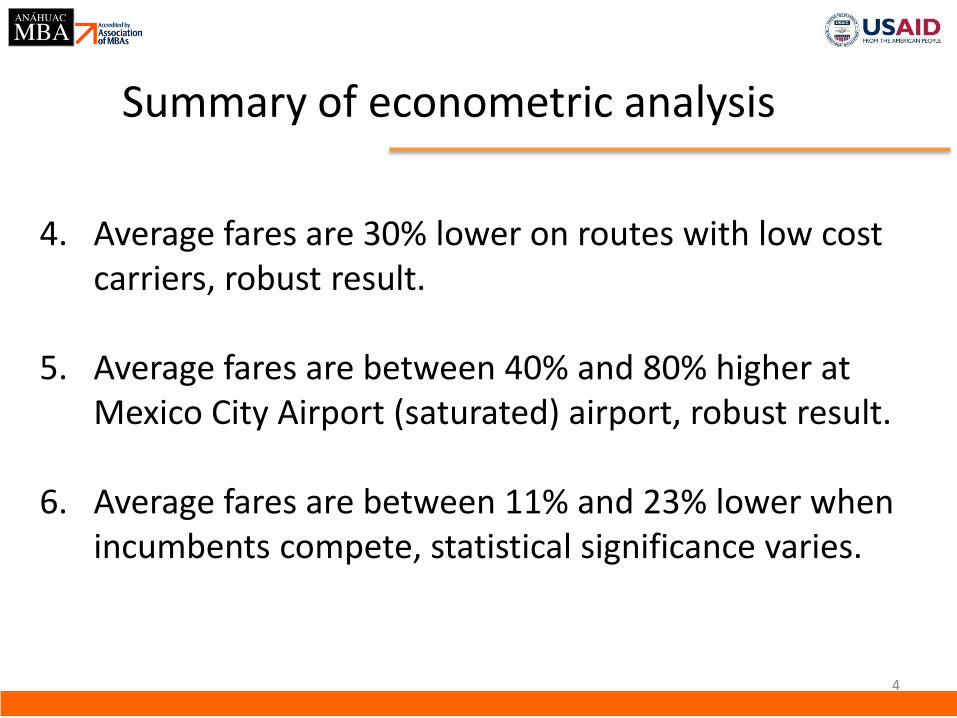
Summary of econometric analysis
4. Average fares are 30% lower on routes with low cost carriers, robust result.
5. Average fares are between 40% and 80% higher at Mexico City Airport (saturated) airport, robust result.
6. Average fares are between 11% and 23% lower when incumbents compete, statistical significance varies.
4

Competition concerns
5
COFECO has examined competition conditions in airlines on several occasions, barriers identified:
1. No cabotage service and 25% foreign ownership restriction. 2. Barriers to airport facilities, esp. in saturated airport.
3. SCT discretion in awarding concessions and additional
routes.
4. Structural barriers (sunk costs, attracting customers to new airline, etc).

Competition assessment
6
0
5,000
10,000
15,000
20,000
25,000
1989 1990 1991 1992 1993 1994 1995 1996 1997 1998 1999 2000 2001 2002 2003 2004 2005 2006 2007 2008
Number of Domestic Airline Passengers 1989-2008 (000)
Trunk Passengers
Regional Passengers
Soure: SCT, La Aviación Mexicana en Cifras, 1989-2008
CAGR = 4.1%
CAGR = 14.1%
Competition assessment
7
4396 4353
3976
3300
2913
2694
2933 2984 2997
2733 2683
3219
2975 2805
2649 2637 2498
2108
1721 1766
0
500
1000
1500
2000
2500
3000
3500
4000
4500
5000
1989 1990 1991 1992 1993 1994 1995 1996 1997 1998 1999 2000 2001 2002 2003 2004 2005 2006 2007 2008
HHI for Domestic Airline Service (Nationwide market based on passengers)
Soure: SCT, La Aviación Mexicana en Cifras, 1989-2008
Competition assessment
8
0.0%
10.0%
20.0%
30.0%
40.0%
50.0%
60.0%
1989 1990 1991 1992 1993 1994 1995 1996 1997 1998 1999 2000 2001 2002 2003 2004 2005 2006 2007 2008
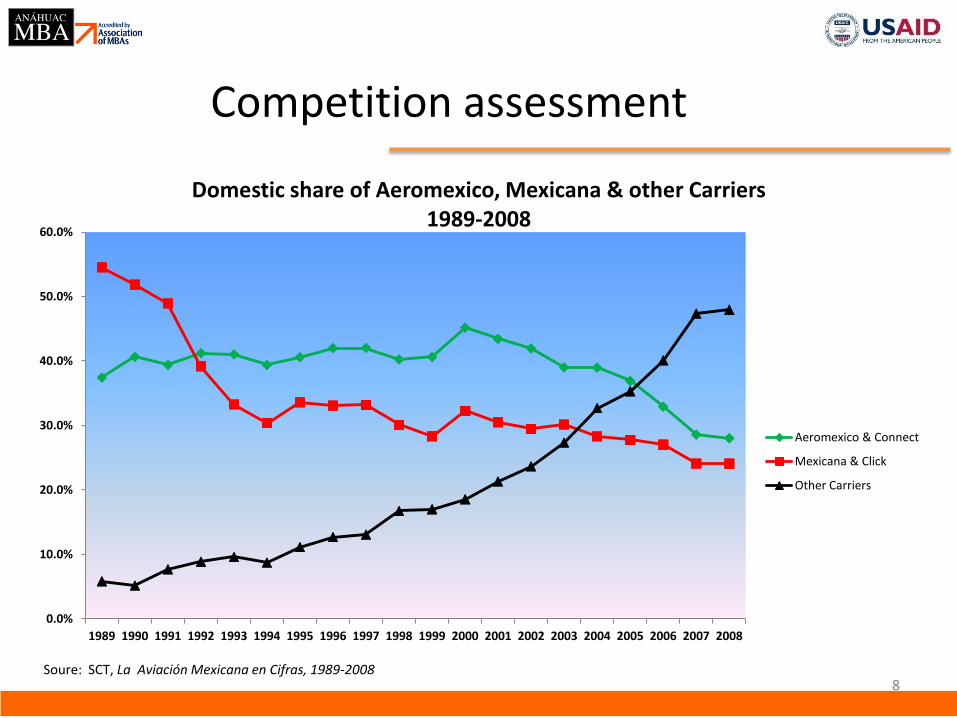
Domestic share of Aeromexico, Mexicana & other Carriers 1989-2008
Aeromexico & Connect
Mexicana & Click
Other Carriers
Soure: SCT, La Aviación Mexicana en Cifras, 1989-2008

Competition assessment
9
0.0%
2.0%
4.0%
6.0%
8.0%
10.0%
12.0%
14.0%
2005 2006 2007 2008
Growth of Low Cost Airlines Market Shares 2005-2008
Interjet
VivaAerobus
Volaris
Alma
Avolar
Soure: SCT, La Aviación Mexicana en Cifras, 1989-2008 Note: Avolar & Alma ceased operations in 2008

Summary
10
1. Strong output growth
2. Decreasing concentration
3. Strong performance by entrants

Data analysis, purpose
11
Investigate relationship between airline fares and:
1. Competition variables (# of airlines, # of low cost carriers, competition between incumbents).
2. Policy variables (airport “saturation,” airport fees, codesharing agreements).
3. Economic variables (economies of density, distance, demand, etc).
Use results to estimate impact of competition policy reforms.

Data analysis
12
Collected data on approximately 500 domestic routes, between April-August 2009. SCT database on: routes (origin-destination cities), 2008 demand and airlines in operation in 2008. 8 airlines: (5 traditional: Aeromexico, Mexicana, Aeromar, Aviacsa, Magnicharter: 3 LCC: Interjet, Vivaaerobus, Volaris). Obtained from SCT. Lowest-quoted fares collected from airlines’ respective websites.

Average fares by carriers
13
Airline Obs Average
distance/route
Mean Std. Dev. Min Max
“Traditional”
Carriers
Aeromexico 354 964 2.88 1.90 0.75 15.41
Mexicana 347 866 2.98 1.37 0.95 15.24
Aeromar 97 677 5.15 3.09 1.25 14.36
Aviacsar 10 869 2.90 1.37 0.95 5.20
Magnicharter 13 803 2.45 0.97 1.46 4.40
Average 465 3.05
“Low
Cost”Carriers
Interjet 145 977 2.01 0.91 0.90 4.70
Vivaaerobus 46 934 1.32 0.45 0.71 2.72
Volaris 82 1496 1.39 0.44 0.70 2.99
Average 207 1.78*

Low cost carrier impact
14
“Low
Cost”Carrier
Obs Mean Std.
Dev.
Min Max
0 LCC 290 3.44 2.46 0.64 14.29
1 LCC 157 2.17*
1.08 0.81 5.36
2 LCC 34 1.79*
0.49 0.91 2.98
3 LCC 16 1.61*
0.48 0.95 2.60
At least 1
LCC
207 2.06*
0.99 0.81 5.36

Incumbent competition & Mexico City impact
15
Obs Mean Std.
Dev.
Min Max
Incumbent
competition
present
237 2.81 1.88 0.82 12.46
Incumbent
competition not
present
260 2.92 2.27 0.64 14.29
Airport not
saturated
397 2.61 1.72 0.64 12.27
Airport saturated
(Mexico City)
100 3.89*
2.96 1.16 14.29

Summary, differences in means
16
1. Average prices 40% lower on routes with at least one LCC.
2. Average prices 33% lower on routes not involving the Mexico City airport.
3. Average prices 4% lower when incumbents compete.
4. Need econometric model to examine how robust are the results and control for factors affecting fares.

Econometric models
17
(1) Yi = Xβ + εi
Y is average airline price/km per route. X is N x k matrix of sample values of the independent variables and β are the k parameters to be estimated. Main policy variables are: LCC, airportsat (Mexico City) and incumbentcomp, all dichotomous variables.

Econometric models
18
Additional X variables included: distance, prior year’s demand, leisure/non-leisure, income of origin & destination city. Airportcost is added as a control: cost by airport of takeoff/landing fees, platform, security costs, etc. Thus the airportsat (Mexico City) variable measures the impact of high entry barriers and lack of potential competition.
Econometric models
19
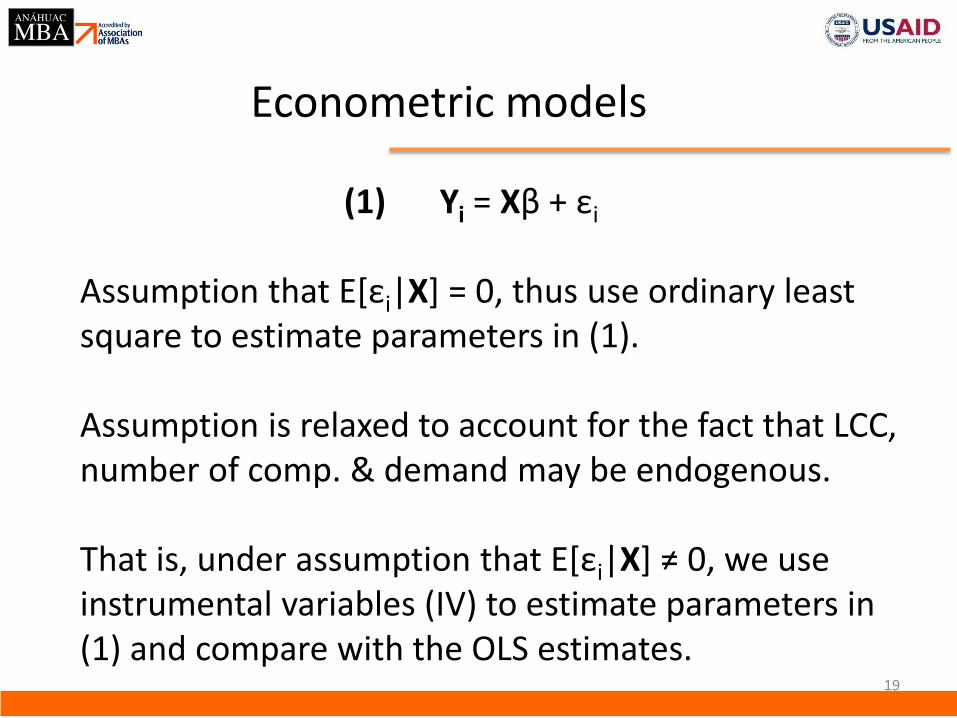
(1) Yi = Xβ + εi
Assumption that E[εi|X] = 0, thus use ordinary least square to estimate parameters in (1). Assumption is relaxed to account for the fact that LCC, number of comp. & demand may be endogenous. That is, under assumption that E[εi|X] ≠ 0, we use instrumental variables (IV) to estimate parameters in (1) and compare with the OLS estimates.
Econometric models
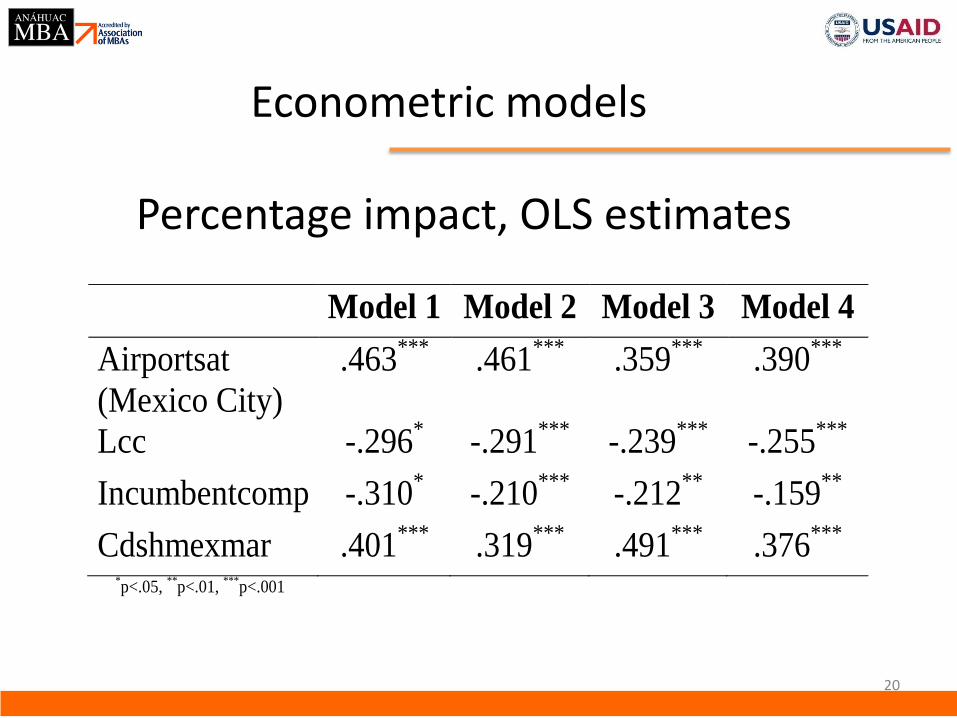
20
Model 1 Model 2 Model 3 Model 4
Airportsat
(Mexico City)
.463*** .461*** .359*** .390***
Lcc -.296* -.291*** -.239*** -.255***
Incumbentcomp -.310* -.210*** -.212** -.159**
Cdshmexmar .401*** .319*** .491*** .376***
*p<.05,
**p<.01,
***p<.001
Percentage impact, OLS estimates

Econometric models
21
Percentage impact, IV estimates
Model 5
IV
Model 6
IV
Airportsat (Mexico City) .795*** .706***
Lcc -.309* -.349**
Incumbentcomp -.113 -.229*
Cdshmexmar .365** .306**
*p<.05,
**p<.01,
***p<.001
Policy implications (airlines)
22
Importance of addressing the conditions at the Mexico City airport. Alleviate saturation conditions so that barriers to entering and expanding are lowered. Increases threat of entry and potential competition. Consumer benefits can be high: 39 billion pesos/year
Average prices $3,043 pesos, model ≈ 60% price reductions; 15.7 million passengers through Mexico City, 2008; Linear demand curve Q(p) = a – bP and price elasticity of -1.2

Policy implications (airports)
23
Remove regulatory obstacles to new carriers entering the market and carriers expanding on routes. Guarantee that any safe airline can enter and expand. Consumer benefits can be: 3.9 billion pesos/year
Average prices $3,151 pesos, model ≈ 30% price reductions; 7 million passengers on routes with 0 LCC, assume this lowered to 3.5 million; Linear demand curve Q(p) = a – bP and price elasticity of -1.2
Conclusions
24
1. Airline competition in Mexico is a success story. More passengers traveling, more options and lower prices.
2. Less concentrated market and declining trend, success of LCCs indicate barriers on certain routes are low.
3. Policymakers can improve situation by addressing bottleneck at Mexico City airport and making entry and expansion approval more transparent and timely.