competition in health care markets1 - wharton faculty … · 2017-07-12 · competition in health...
TRANSCRIPT

CHAPTER NINE
Competition in Health Care Markets1
Martin Gaynor� and Robert J. Town��TCarnegie Mellon University, USA and University of Bristol, NBER, UKTTUniversity of Pennsylvania, NBER, USA
Contents
1. Introduction 5011.1. Market Environment 501
2. Entry, Exit, and Technology Investments by Providers 5112.1. Structural Estimates of the Dynamic Behavior of Providers 5152.2. Reduced Form Studies of Dynamic Behavior of Providers 517
2.2.1. The Impact of the Introduction of New Classes of Providers 5213. Hospital Market Structure, Competition, and Prices 524
3.1. A Model of Hospital Insurer Negotiation 5243.2. Estimating the Impact of Hospital Market Power on Price 533
3.2.1. Reduced-form Estimates 5343.2.2. Estimates of the Impact of Consummated Mergers on Price 5373.2.3. Results from Structural and Semi-structural Approaches 5443.2.4. Not-for-profit Firm Behavior 5503.2.5. Impact of Hospital Mergers on Costs 551
3.3. Recent Developments in Antitrust Enforcement and Competition Policy in Health Care 5523.3.1. Antitrust Developments in the US 5523.3.2. Competition Policy towards Health Care in OECD Countries 558
4. Hospital Competition and Quality 5594.1. Hospital Choice of Quality 5604.2. Administratively Set Prices 561
4.2.1. Spillovers 5644.2.2. Non-profit Maximizing Behavior 565
4.3. Market Determined Prices 5664.4. Econometric Studies of Hospital Competition and Quality 568
4.4.1. Studies with Administered Prices 5704.4.2. Studies with Market Determined Prices 5804.4.3. Studies of the Volume�Outcome Relationship 593
1 We wish to thank participants at the Handbook of Health Economics meeting in Lisbon, Portugal, Pedro Pita Barros,
Rein Halbersman, and Cory Capps for helpful comments and suggestions. Misja Mikkers, Rein Halbersma, and
Ramsis Croes of the Netherlands Healthcare Authority graciously provided data on hospital and insurance market
structure in the Netherlands. David Emmons kindly provided aggregates of the American Medical Association’s
calculations of health insurance market structure. Leemore Dafny was kind enough to share her measures of market
concentration for the large employer segment of the US health insurance market. All opinions expressed here and
any errors are the sole responsibility of the authors. No endorsement or approval by any other individuals or
institutions is implied or should be inferred.
499Handbook of Health Economics, Volume 2ISSN: 1574-0064, DOI: 10.1016/B978-0-444-53592-4.00009-8
© 2012 Elsevier B.V.All rights reserved.
4.5. Summary 5965. Studies of Health Insurance Markets 597
5.1. Introduction 5975.2. Empirical Studies 598
5.2.1. Studies of the Impacts of Competition 5995.2.2. Studies of the Elasticity of Demand for Health Insurance 607
5.3. Summary 6096. Studies of Physician Services Markets 610
6.1. Introduction 6106.2. Empirical Studies of Physician Services Markets 611
6.2.1. Studies of Entry and Market Structure 6146.2.2. Studies of Pricing Conduct 615
6.3. Summary 6197. Vertical Restraints and Monopsony 619
7.1. Vertical Restraints 6197.1.1. Vertical Restraints—Theory 6197.1.2. A Model of Vertical Integration and Hospital Prices 6217.1.3. Empirical Evidence on Vertical Restraints 623
7.2. Health Care Providers and Monopsony Power 6248. Summary and Conclusions 626References 627
Abstract
This chapter reviews the literature devoted to studying markets for health care services and healthinsurance. There has been tremendous growth and progress in this field. A tremendous amount ofnew research has been done since the publication of the first volume of this Handbook. In addition,there has been increasing development and use of frontier industrial organization methods. Webegin by examining research on the determinants of market structure, considering both static anddynamic models. We then model the strategic determination of prices between health insurers andproviders where insurers market their products to consumers based, in part, on the quality andbreadth of their provider network. We then review the large empirical literature on the strategicdetermination of hospital prices through the lens of this model. Variation in the quality of healthcare clearly can have large welfare consequences. We therefore also describe the theoretical andempirical literature on the impact of market structure on quality of health care. The chapter thenmoves on to consider competition in health insurance markets and physician services markets. Weconclude by considering vertical restraints and monopsony power.
Keywords: health care; competition; markets; industrial organization; antitrust; competition policy;hospitals; health insurance; physicians
JEL Codes: I11; L13; L10; L40; I18; L30
500 Martin Gaynor and Robert J. Town
1. INTRODUCTION
The incentives provided by the competitive interactions of health care providers
are a central force that shapes their behavior, affecting the price, quantity and quality
of health care services. This is particularly true in the US, where 56 percent of total
health expenditures are privately financed (Martin et al., 2011), and hence prices,
quantities, and qualities for those services are determined by market interactions of
buyers and sellers. Even when prices are administratively set, as they are for most pub-
licly financed care,2 strategic interactions between providers affect quantity, quality
and access to care. In this chapter our goal is to review the state of knowledge on
competition in health care markets, focusing on the literature that has arisen since the
first volume of the Handbook of Health Economics published in 2000.3
The organizing principle for this chapter is loosely based on the Structure�Conduct�Performance (SCP) paradigm originating with Joseph Bain and Edward
Mason (see Schmalensee, 1989, for a review). From the 1950s to the 1970s this was
the dominant framework through which industrial organization economists conducted
their analyses. The rise of game theory and the new empirical industrial organization
displaced the SCP approach (Bresnahan, 1989). Nevertheless, the SCP framework is a
useful guide for structuring this chapter. First, in order to provide some context for
our discussion, we present data on recent trends in provider market structure and
some of the recent research on the underlying forces behind the trends. Section 2
then discusses the research on the determinants of health care provider market struc-
ture. This section examines the roles of entry, exit, mergers, and productivity.
Section 3 turns to the analysis of the consequences of differential market structure,
focusing on its impact on hospital prices. Section 4 examines the impacts of these
forces on hospital quality of care. Section 5 examines evidence on competition in
health insurance markets, while section 6 focuses on physician services markets. As
will be seen, the majority of the empirical literature on competition in health care
markets is on hospitals. This is due to the ready availability of hospital data, and the
paucity of data on insurance and physician markets. We conclude in section 8.
1.1. Market EnvironmentIn this section we consider the market environment in which health care firms oper-
ate. We document some facts about market structure, mainly for hospitals and mainly
for the US, but also for insurance and physician markets in the US and for hospital
2 This is true of the US Medicare program and most health systems outside the US.3 See the excellent chapters by Dranove and Satterthwaite (2000) and Gaynor and Vogt (2000) in that volume for
reviews of the literature to that point and for initial sketches of modeling strategies that have guided many of the
subsequent papers in the area.
501Competition in Health Care Markets
markets in England and the Netherlands. We then proceed in section 2 to discuss
models of market structure and empirical research evidence.
Hospital and physician services comprise a large component of US Gross Domestic
Product (GDP). In 2009, hospital care alone accounted for 5.4 percent of GDP—
roughly twice the size of automobile manufacturing, agriculture, or mining, and larger
than all manufacturing sectors except food and beverage and tobacco products, which is
approximately the same size. Physician services comprise 3.6 percent of GDP (Martin
et al., 2011).4 The share of the economy accounted for by these sectors has risen
dramatically over the last 30 years. In 1980, hospitals and physicians accounted for
3.6 percent and 1.7 percent of US GDP, respectively (Martin et al., 2011).5 The size of
these industries and their long-run trends suggest that understanding their structure,
conduct, and performance is not only important for the performance of the health care
industry, it is also important for understanding the economy as a whole.
Not only are these sectors large, but they have been undergoing significant struc-
tural shifts over the last several decades. The 1990s saw dramatic changes in the struc-
ture of hospital markets in the US, and this increase will likely have long-term
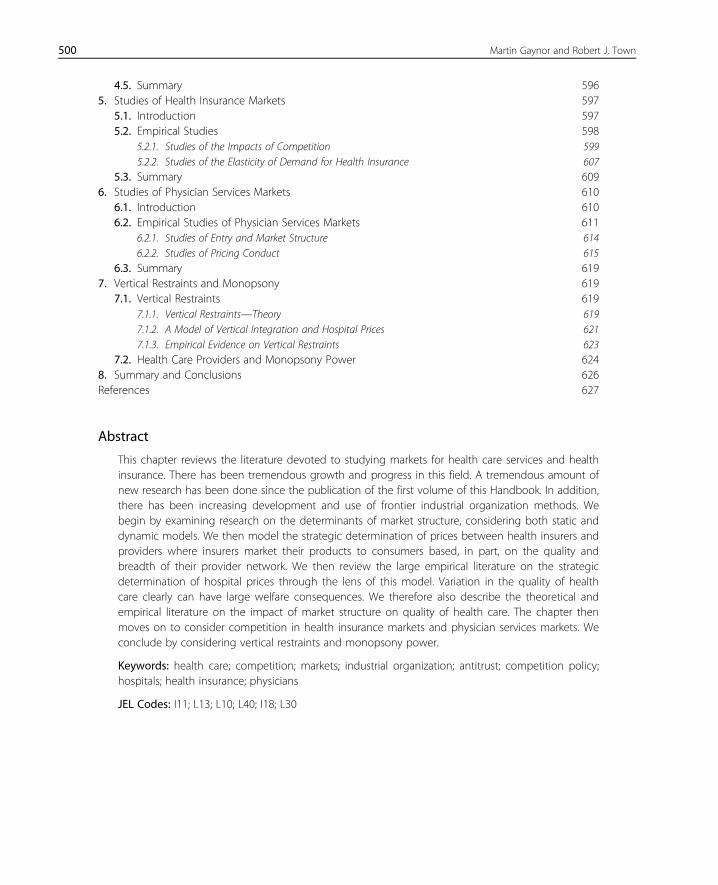
impacts on the behavior of hospitals. Table 9.1 presents numbers for the population-
weighted, Herfindahl�Hirschmann Index (HHI) for selected years from 1987 to
2006.6 Two things are clear from this table. US hospital markets are highly concen-
trated and have become even more concentrated over time. Figure 9.1 displays the
trends in the hospital HHI, the number of within-market hospital mergers and acqui-
sitions, and the percentage of the population enrolled in an HMO from 1990 to
Table 9.1 Hospital Market Concentration, US, 1987�2006a
Year Mean HHIb Changec
1987 2,340 �1992 2,440 100
1997 2,983 543
2002 3,236 253
2006 3,261 25
aSource: American Hospital Association. Data are for US Metropolitan Statistical Areas with population , 3 million.bHerfindahl�Hirschmann Index. Means weighted by MSA population.cTotal change from the previous year in the table.
4 The net cost of health insurance—current year premiums minus current year medical benefits paid—was 1 percent
of GDP in 2009.5 The net cost of health insurance in 1980 was 0.34 percent.6 The HHI is the sum of squared market shares in the market. It is the most commonly used measure of market
structure. We present population weighted averages for Metropolitan Statistical Areas (MSAs) (based on admissions).
We limit the sample of MSAs to those with a population less than 3million in 1990. We do this because it is likely
that in MSAs with more than 3million, there are multiple hospital markets and the HHI of that MSA is likely
mismeasured.
502 Martin Gaynor and Robert J. Town

2006. From the table and figure it is easily seen that hospital markets have become sig-
nificantly more concentrated. In 1987, the mean HHI was 2,340 and by 2006 the
HHI was 3,161—an increase of over 900 points.7 In 1992, the mean hospital concen-
tration levels (2,440) were (barely) below the recently updated Federal merger guide-
lines’ (Federal Trade Commission and Department of Justice, 1992) cut-off point for
classifying a market as “Highly Concentrated” (HHI$ 2,500), but by 2006 the mean
concentration level (3,261) rose to well above this threshold. Town et al. (2006) note
that mergers and acquisitions are the primary reason for the increase in hospital con-
centration over this period.
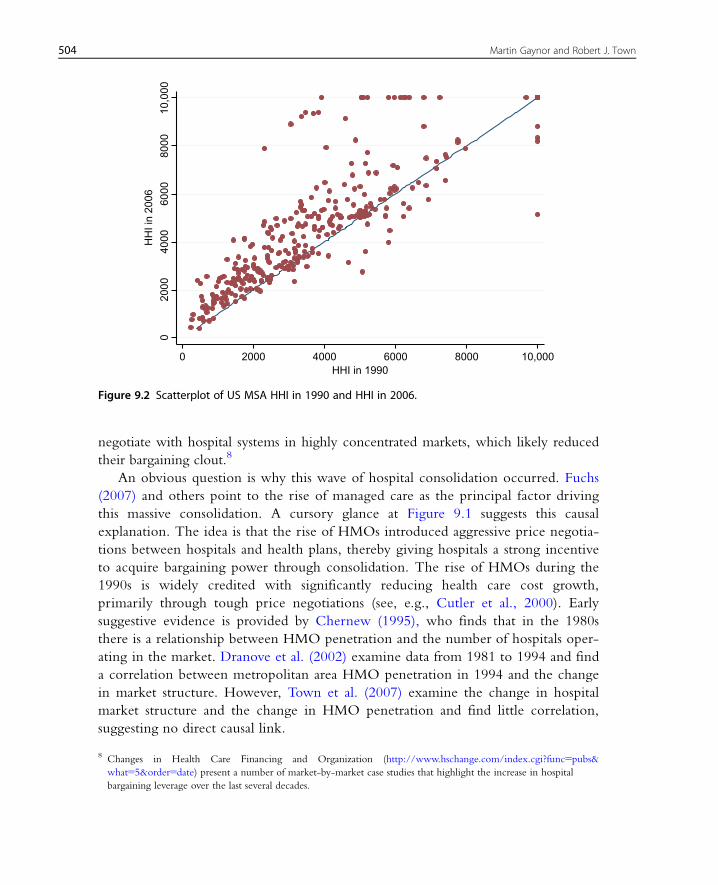
While hospital markets are highly concentrated on average, there is also wide
variation in concentration. Figure 9.2 shows a scatterplot of the MSA level market
concentration in 1990 and in 2006. This figure displays two phenomena. First, it
shows the distribution of HHIs across MSAs. Most MSAs are “Highly Concentrated.”
In 2006, of the 332 MSAs in the US, 250 had HHIs greater than 2,500. Second,
it is clear from Figure 9.2 that the increase in hospital concentration was a broad
phenomenon—the vast majority of MSAs became more concentrated over this period.
Particularly striking is the number of moderately concentrated MSAs in 1990 that by
2006 had become highly concentrated. By 2006, most health insurers now had to
0
10
20
30
40
50
60
70
80
90
0
0.05
0.1
0.15
0.2
0.25
0.3
0.35
1988 1990 1992 1994 1996 1998 2000 2002 2004 2006 2008
Nu
mb
er o
f M
&A
s
HH
I/HM
O P
enet
rati
on
Year
HHI HMO Penetration Number of MSA M&As
Figure 9.1 Trends in US hospital concentration, M&A activity and HMO penetration: 1990�2006.
7 It is interesting that over roughly the same period of time the nursing home industry did not see significant increases
in market concentration, even though it was also subject to a number of mergers and acquisitions.
503Competition in Health Care Markets
negotiate with hospital systems in highly concentrated markets, which likely reduced
their bargaining clout.8
An obvious question is why this wave of hospital consolidation occurred. Fuchs
(2007) and others point to the rise of managed care as the principal factor driving
this massive consolidation. A cursory glance at Figure 9.1 suggests this causal
explanation. The idea is that the rise of HMOs introduced aggressive price negotia-
tions between hospitals and health plans, thereby giving hospitals a strong incentive
to acquire bargaining power through consolidation. The rise of HMOs during the
1990s is widely credited with significantly reducing health care cost growth,
primarily through tough price negotiations (see, e.g., Cutler et al., 2000). Early
suggestive evidence is provided by Chernew (1995), who finds that in the 1980s
there is a relationship between HMO penetration and the number of hospitals oper-
ating in the market. Dranove et al. (2002) examine data from 1981 to 1994 and find
a correlation between metropolitan area HMO penetration in 1994 and the change
in market structure. However, Town et al. (2007) examine the change in hospital
market structure and the change in HMO penetration and find little correlation,
suggesting no direct causal link.
020
0040
0060
0080
0010
,000
HH
I in
2006
0 2000 4000 6000 8000 10,000HHI in 1990
Figure 9.2 Scatterplot of US MSA HHI in 1990 and HHI in 2006.
8 Changes in Health Care Financing and Organization (http://www.hschange.com/index.cgi?func5pubs&
what55&order5date) present a number of market-by-market case studies that highlight the increase in hospital
bargaining leverage over the last several decades.
504 Martin Gaynor and Robert J. Town
These results present a puzzle. Anecdotal evidence suggests that HMOs were an
important driver of the wave of hospital consolidation, yet the empirical evidence is
mixed. Some have suggested that it was not the realization of the rise of managed
care, but the anticipation (which in many cases was in error) that led hospitals to
consolidate. Work in progress by Town and Park (2011) provides support for this
hypothesis. They find that HMO exit, a measure of the exuberance of expectations
regarding the demand for managed care in a location, is correlated with hospital
consolidation.
The trend toward increasing concentration in hospital markets is not confined to
the US. Tables 9.2 and 9.3 provide information on market structure levels and trends
in England and the Netherlands. We see that the trends in these countries are very
similar to the US—the total number of hospitals in both countries declined
substantially over time. For England there are HHIs for local hospital markets for a
number of years. Those reflect substantial concentration, although declining slightly
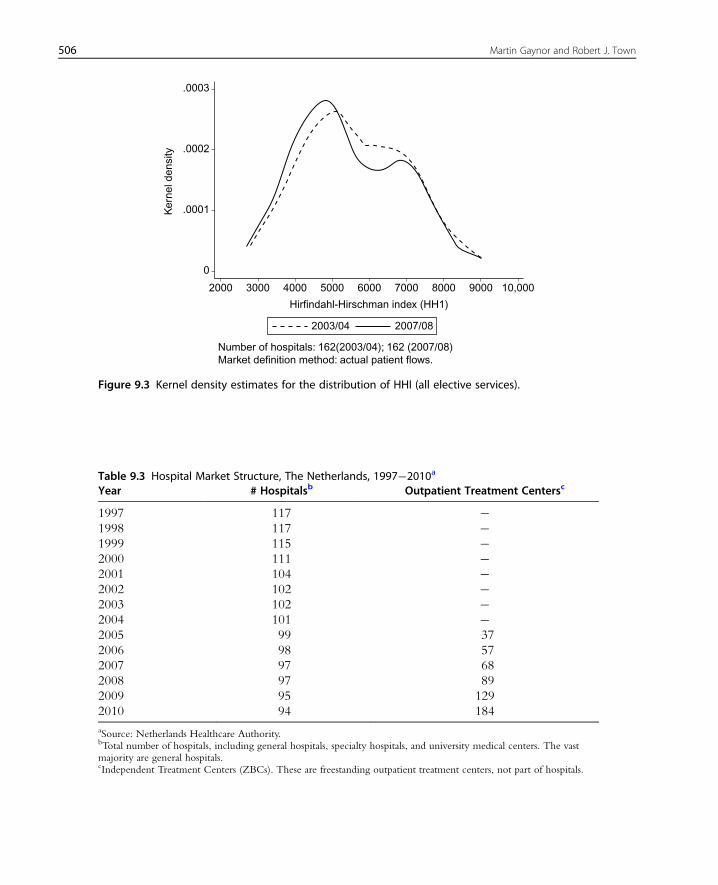
over time. Figure 9.3 illustrates the change in the distribution of the HHI between
2003/04 and 2007/08 (fiscal years). It can be seen that there is a shift of the
distribution from more concentrated to less concentrated markets. Most of the shift
is in the middle of the distribution, as opposed to the tails. The decline in the
hospital HHI in England documented here is most likely due to pro-competitive
reforms of the English National Health Service that occurred in 2006 (see Gaynor
et al., 2010).
Table 9.3 provides information on the total number of hospitals and independent
outpatient treatment centers in the Netherlands by year. There is a clear downward
Table 9.2 Hospital Market Structure, England, National Health Service, 1997�2007Year # NHS Hospitalsa # Mergers HHI # Private Hospitalsb
1997 227 26 � �1998 214 21 � �1999 202 17 � �2000 193 23 � �2001 188 25 � �2002 174 6 � �2003 171 0 5,573 �2004 171 0 5,561 3
2005 171 3 5,513 21
2006 168 3 5,459 32
2007 167 0 5,461 �Total � 124 � �aSource: UK Department of Health. Hospitals with fewer than 5,000 consultant episodes per year are excluded.bIndependent Sector Treatment Centres. These are private hospitals with contracts with the NHS.
505Competition in Health Care Markets
.0003
.0002
Ker
nel d
ensi
ty
.0001
2000 3000 4000 5000 6000
Hirfindahl-Hirschman index (HH1)
Number of hospitals: 162(2003/04); 162 (2007/08)Market definition method: actual patient flows.
2003/04 2007/08
7000 8000 9000 10,000
0
Figure 9.3 Kernel density estimates for the distribution of HHI (all elective services).
Table 9.3 Hospital Market Structure, The Netherlands, 1997�2010a
Year # Hospitalsb Outpatient Treatment Centersc
1997 117 �1998 117 �1999 115 �2000 111 �2001 104 �2002 102 �2003 102 �2004 101 �2005 99 37
2006 98 57
2007 97 68
2008 97 89
2009 95 129
2010 94 184
aSource: Netherlands Healthcare Authority.bTotal number of hospitals, including general hospitals, specialty hospitals, and university medical centers. The vastmajority are general hospitals.cIndependent Treatment Centers (ZBCs). These are freestanding outpatient treatment centers, not part of hospitals.
506 Martin Gaynor and Robert J. Town

trend in the number of hospitals—there were 23 fewer hospitals in 2010 than in 1997.
More recently, there has been a large increase in the number of independent outpa-
tient treatment centers. The number grew from 37 in 2005 to 184 by 2010.
Figure 9.4 shows the distribution of an alternative measure of market structure,
LOCI (for Logit Competition Index),9 for the Netherlands in 2010. LOCI is a mea-
sure of how much competition a firm faces in a differentiated products market. It var-
ies between zero and one, where zero is pure monopoly and one is perfect
competition. The graph shows the cumulative distribution of hospitals in the
Netherlands by their values of the inverse of LOCI. As can be seen, approximately 20
percent of hospitals have values of inverse LOCI of 2 or below. A value of 2 implies
the market is not very competitive—for example, a hospital in a duopoly that equally
split the market with its rival would have a LOCI value of 1/2, i.e. an inverse LOCI
of 2. One half of all hospitals have inverse LOCI values of 3 or less. This implies that
half of Dutch hospitals operate in markets where they face competition from the
equivalent of a triopoly or less.
Tables 9.4, 9.5, 9.6, and 9.7 provide information about health insurance market
structures for the US and the Netherlands. The US information shows consistently
high levels of concentration in health insurance markets. The levels of concentration
in the Netherlands are substantially lower than in the US, but have grown substantially
over time.
Cumulative Percentage of Hospitals
Inve
rse
LOC
I
14
12
10
8
6
4
2
00 20 40 60 80 100
Figure 9.4 Cumulative distribution of LOCI, Netherlands, 2010.
9 This is a competition index for differentiated products Bertrand oligopoly with logit demand. See Akosa Antwi
et al. (2006).
507Competition in Health Care Markets
The measures of HHI for HMO plus PPO markets in the US in Table 9.4 come
from reports from the American Medical Association (AMA). They show high levels
of concentration (although lower than for hospitals). The numbers show insurance
market concentration declining somewhat over time (although not monotonically).
However, there are some concerns about the accuracy of these numbers (see Capps,
2009; Dafny et al., 2011a).
Dafny (2010) and Dafny et al. (2011b), using data on the large employer segment
of the insurance market, also show increasing concentration in health insurance
markets. Dafny (2010, Figure 9.5) documents an increase in the percentage of
Table 9.4 Insurance Market Concentration, US, 2004�2008a,b
Year Median HHI Change Mean HHI Change
2004 3,544 2 3,939 22005 3,748 204 4,077 138
2006 2,986 2762 3,440 2637
2007 3,558 572 3,944 504
2008 3,276 2282 3,727 2217
aSource: These figures were graciously provided by David Emmons. See American Medical Association (2010) formore information on the data and calculations. American Medical Association (AMA) calculations for the combinedHMO1PPO markets using January 1st enrollment data from HealthLeaders-InterStudy’s (HLIS) Managed MarketSurveyors HealthLeaders-Inter-Study.bMSA-level HHIs for HMO1PPO markets.
Table 9.5 Large Employer Insurance Market Concentration, US, 1998�2009a
Self1 Fully Insured Fully Insured Only
Year Mean HHIb Change Mean HHIb Change
1998 2,172 2 2,984 �1999 1,997 2175 2,835
2000 2,175 178 3,092
2001 2,093 282 3,006
2002 2,280 187 3,158
2003 2,343 63 3,432
2004 2,519 176 3,706
2005 2,609 90 3,951
2006 2,740 131 4,072
2007 2,873 133 4,056
2008 2,916 43 4,201
2009 2,956 40 4,126
aSource: These figures were graciously provided by Leemore Dafny. The data are for large multisite employers and donot represent the totality of the insurance market. For more information on the data source, see Dafny (2010).bWeighted by number of enrollees.
508 Martin Gaynor and Robert J. Town
markets with 1�4, 5�6, or 7�9 insurance carriers in the US from 1998 to 2005,
and a decrease in the percentage of markets with 9�10 or more than 10 carriers.
Dafny et al. (2011b) state that the mean HHI in their sample increased from 2,286
to 2,984 from 1998 to 2006, the median four-firm concentration ratio increased
from 79 to 90 percent, and the mean number of carriers per market fell from 18.9
to 9.6. They show (Figure 9.1 in their paper) that 78 percent of the markets they
study had increases in the HHI of 100 points or more from 2002 to 2006, and 53
percent experienced increases of 500 points or more. Table 9.5 lists mean HHIs by
year from the data used in those papers. These numbers indicate that the large
employer segment of the health insurance market is concentrated and has grown
more so over time. These numbers are roughly similar in magnitude to those
calculated by the AMA. However, they show concentration increasing over time (by
about 400 points from 2004 to 2008), while the AMA numbers exhibit a slight
decrease over time.
A recent report by the US Government Accountability Office (Government
Accountability Office, 2009) compiled information on the market structure of the
small group health insurance market in the US. Table 9.6 reproduces numbers from
that report. As can be seen, those markets appear to be fairly heavily concentrated,
and increasing in concentration. A recent paper by Schneider et al. (2008a) utilizes a
unique data source for California to construct HHIs for insurance plans at the county
level for 2001. They find an average insurance HHI for California counties of 2,592.
Table 9.7 Insurance Market Structure, The Netherlands, 2005�2010a
Year Mean HHI
2005 1,346
2006 1,625
2007 1,630
2008 2,124
2009 2,119
2010 2,111
aSource: Netherlands Healthcare Authority.
Table 9.6 Small Group Insurance Market Structure, US, 2000�2003a
Year Median Market Share, Largest Carrier # of States with 5 Firm ConcentrationRatio $75 Percent
2002 33 percent 19 (of 34; 56 percent)
2005 43 percent 26 (of 34; 77 percent)
2008 47 percent 34 (of 39; 87 percent)
aSource: Government Accountability Office (2009).
509Competition in Health Care Markets
They report that 21 percent of counties have HHIs below 1,800,10 55 percent had
HHIs between 1,800 and 3,600, and 24 percent had HHIs above 3,600. The informa-
tion from these various data sources seems broadly consistent.
Table 9.7 contains information on the structure of the health insurance market in
the Netherlands. The mean HHI is not very high in 2005, but increased by nearly
800 points by 2010. The mean HHI in 2010 is slightly higher than the HHI for an
equally divided five-firm market (2,000). While not trivial, this is below the recently
revised Horizontal Merger Guidelines cut-off for considering a market highly concen-
trated (HHI5 2,500). What is most notable is the large increase in concentration over
the period, which may be a cause for concern.
There have also been substantial changes in market structure in US physician
markets. Liebhaber and Grossman (2007) report that the percentage of physicians in
solo or two-person practices declined from 40.7 percent in 1996�97 to 32.5 percent
in 2004�05. Further, the proportion in practices of 3�5 physicians fell over the same
period. The proportion of physicians practicing in groups of 6 or more grew from
15.9 to 21.8 percent. The number of physicians in other practice settings (primarily
employed by others) grew from 31.2 to 36.0 percent over this period. Since the number
of physicians per 1,000 persons has not really changed (B2.5) since 1997 (National
Center for Health Statistics, 2011), this represents an increase in concentration.
There is no good systematic information on the structure of local physician mar-
kets. Those markets, especially for specialized services, may be very concentrated, but
there is no information generally available at the national level. Schneider et al.
(2008a) constructed HHIs for physician organizations in California at the county level
for 2001. They find the average county HHI for physician organizations was 4,430,
implying a high degree of concentration on average. They found that 17 percent of
California counties had a physician organization HHI below 1,800, 33 percent had an
HHI between 1,800 and 3,600, and 50 percent had an HHI above 3,600.
In addition to information on market structure, there is some information on
trends in prices and the contribution of health care prices to overall health care cost
growth. Akosa Antwi et al. (2009) document a 100 percent increase in hospital prices
in California from 1999 to 2006, although they do not find market concentration to
be a contributor to the increase. Martin et al. (2011) decompose US health spending
growth into growth due to prices versus growth due to non-price factors (e.g. popula-
tion, intensity of care). They find that prices account for 60 percent of the increase in
overall spending from 2008 to 2009. The proportion of health spending growth due
to prices varies over time (see Exhibit 6 in Martin et al., 2011), but has been growing
steadily since 2001.
10 The old Federal merger guidelines cut-off for considering a market highly concentrated (Federal Trade
Commission and Department of Justice, 1992).
510 Martin Gaynor and Robert J. Town

Some recent reports from state governments document growth or variation in
health care prices. A report from the Massachusetts Attorney General’s office
(Massachusetts Attorney General, 2010) finds that price increases caused most of the
increases in health care spending in the state in recent years. The report also finds
significant variation in prices and that the variation is uncorrelated with quality of
care, but is correlated with market leverage. A report on Pennsylvania hospitals found
substantial variation in prices for heart surgery, but no correlation of prices with
quality (Pennsylvania Health Care Cost Containment Council, 2007).
Overall, the statistics presented here paint a picture of health care and health insur-
ance markets that are concentrated and becoming more so over time. There is also
some evidence that prices are rising faster than quantities, and that price variation is
not related to quality but may be due to market power. These statistics are not a
complete picture, however. In particular, they do not take account of the ease or diffi-
culty of market entry, nor of conduct in these markets. We discuss economic models
for thinking about these issues, and what we know at present from research, in what
follows as the main body of this chapter.
2. ENTRY, EXIT, AND TECHNOLOGY INVESTMENTSBY PROVIDERS
Health care policies, either through intent or as an unintended consequence,
often affect the incentives of health care providers to enter, exit, invest, merge, and
innovate. That is, health policy may affect provider market structure and thus change
outcomes influenced by market structure, such as price, quantity, or quality, that were
outside of the intent of the policy. These incentives may differ by ownership status
and thus policies may change the mix of not-for-profit (NFP), for-profit (FP), and
public organizations.
For example, the Hill�Burton program in the US provided subsidies to NFP
and public hospitals for construction and expansion. That policy affected the number
of hospitals, productive capacity, and ownership mix, and therefore also likely
affected market outcome such as price, quantity, and quality. Another example is
public payments to providers. Hospitals and most physicians earn a large percentage
of their revenue from providing care to publicly insured patients (in some countries
all, or nearly all, of their revenues) and those reimbursements are administratively
determined. Changes in those payments affect the returns to these providers to
enter, exit, invest, merge, and innovate. Thus, to fully understand the impact of a
given policy often requires an understanding of how the policy will affect market
structure through its impact on the behavior of providers. In this section, we briefly
511Competition in Health Care Markets

discuss recent developments in our understanding of evolution of provider market
structure.
Over the last decade significant methodological and theoretical advances have
occurred in the analysis of (dynamic) oligopoly models in which firms are making
entry, exit, and investment decisions. These decisions are dynamic in the sense that
they require upfront expenditures in which the organization will earn a return over a
span of time or the decisions are difficult to reverse. As long noted by economists,
understanding the dynamic implications of these models often requires estimating pol-
icy invariant parameters and the natural (albeit often challenging) way to do that is to
specify and estimate parameters from a model that captures the essential features of the
industry relevant for the question of interest. In this section we outline a basic frame-
work for examining entry, exit, and investment decisions as well as review the small
but growing literature devoted to understanding dynamic behavior of firms. Space
limitations prevent us from discussing the details on solving and estimating fully
dynamic models. However, there are several excellent summaries of this literature and
the interested reader is referred to Ackerberg et al. (2007), Doraszelski and Pakes
(2007), and the citations therein for a more complete presentation of these issues.
We present the outline of a simple model that is loosely based on the work of
Gowrisankaran and Town (1997), which in turn is heavily influenced by the work of
Ericson and Pakes (1995) and Pakes and McGuire (1994). Static returns to the organi-
zation are modeled as depending on the current state of the (potential) market partici-
pants, the actions they take in the period, and unobservables.11 More formally, we
denote the profits in period t, π(st, at, ξt), that hospitals earn from the vector of state
variables, one for each market participant, stAS, and actions, atAA (actions can be
investments, entry, exit, mergers, etc.), that affect the evolution of st.12 The probability
that a given action is successful is affected by i.i.d. shocks, ξt. Each hospital’s shock is
private information to the hospital. In this framework, st may represent the bargaining
leverage of the hospital, at technological investments made by the hospital, and ξt is ashock that affects the successful implementation of the investments. There are a num-
ber of approaches to modeling state transitions, but in general they allow the state to
evolve according to a first-order Markov process, where the actions of hospitals in
period t affect the distribution of the states in period t11. That is, st115 f(st, at, ξt)where f is a pdf of a distribution function that captures the relevant process through
which states are updated.
So far, this set-up is generic and is not specific to a given provider setting or to a
research question. However, we can incorporate a number of the institutional features
of the hospital (or other provider) setting into this framework. For example, to
11 There are many models of static firm behavior that are consistent with this representation, including the bargaining
model presented in section 3.1.12 We suppress individual firm subscripts for clarity in notation.
512 Martin Gaynor and Robert J. Town
endogenously account for the presence of NFP hospitals, the NFP hospital utility
function can be posited as a function of profits and its state and actions, St and at(Newhouse, 1970).13 NFP utility can operationalized as Ut(st, at, ξt)5π(st, at, ξt)1(12 γ)qt(st) where qt is the number of patients treated and γ is the relative weight the
hospital places on profits relative to the number of patients treated. In this framework
it is also easy to allow FP hospitals to face income and property taxes (from which
NFPs are exempt), which may differentially affect their investment decisions. The fact
that most hospitals treat both private and public pay patients with variation in pay-
ment generosity can also be incorporated into this model.
The state evolves according to a Markov process that depends on the actions of
the hospital and its competitors. Hospitals seek to maximize the present discounted
value of utility. The equilibrium concept that is generally employed in these settings is
Markov Perfect Equilibrium, which imposes that each hospital selects it actions in
order to maximize the present value of utility given its rational beliefs of the strategies
of the other hospitals and this simultaneously holds for all hospitals.
For each period, all hospitals solve:
maxat Et
Xt
βt21Utðst; at; ξtÞ" #
s:t: st1 1 5 f ðst; at; ξtÞ ð9:1Þ
where Et is the expectations operator given the information set available to the hospi-
tal in period t. The solution to this problem is a mapping from each state and realiza-
tion of a hospital’s shock to an action.
Entry is incorporated by allowing for a set of potential entrants who receive a ran-
dom entry cost shock, while exit is incorporated by assigning hospitals a scrap value
they receive if they exit. Hospitals will enter if the expected present discounted value
of market participation exceeds the cost of entry, while exit occurs if the expected
presented discounted value of continuing to participate in the market is less than the
scrap value. If the return function is smooth and concave and if the evolution of the
state variables is also well behaved, usually at least one equilibrium exists. In general,
there is no closed form solution for these types of models. However, given the para-
meters of the model, there are well-established algorithms for solving these models.14
The model’s economic and policy implications will depend upon the parameters
chosen by the researcher. Thus, selection of “reasonable” parameter values is critical
in order for these models to provide policy guidance. A natural choice of parameter
values are those that are consistent with the patterns in the data. The static para-
meters—those that relate the states to the single period returns—can be estimated by
13 Clearly, other objective functions of the hospital are possible and the appropriate one will depend on the question
under consideration.14 See, e.g., Pakes and McGuire (1994), Gowrisankaran (1995), and Doraszelski and Satterthwaite (2010).
513Competition in Health Care Markets
specifying a demand and supply system and solving for the static equilibrium for every
possible state. Given estimates of the single period returns, the remaining parameters
to estimate are the dynamic ones. These parameters typically capture sunk costs of
entry, scrap values from exit, fixed costs of production, and parameters of the invest-
ment process. An important literature has arisen that develops econometric methods
to estimate these parameters.
Gowrisankaran and Town (1997) is the first attempt to estimate the structural para-
meters from a dynamic oligopoly model of entry, exit, and quality investments. The
goal of their work is to examine the impact of different policy initiatives on the struc-
ture of the hospital industry and patient welfare. In their model there are three types
of patients: privately insured, Medicare beneficiaries, and uninsured; and two types of
hospitals: NFP and FP. NFP hospitals seek to maximize the present discounted value
of utility, which depends on profits and the number of treated patients. FP hospitals
pay property taxes on their capital stock. To estimate the parameters they use a
method of moments estimator in which for every trial parameter value they solve for
the fixed point of the dynamic game. At the estimated parameter values, they find
that NFP hospitals are longer lived (FPs are both more likely to enter and to exit),
and have higher quality. Decreasing Medicare payment levels reduces the number of
hospitals—this occurs principally because FP hospitals exit the market, and lead to
higher quality adjusted prices for private pay patients. FP hospitals are more likely to
be the marginal hospital, whose market participation is more sensitive to shifts in
demand or government policy.
Several applied theoretical papers examine the entry and exit of health care provi-
ders in simpler settings than the dynamic context described above, thus allowing for
the derivation of analytic results. Lakdawalla and Philipson (2006) examine a simple,
traditional, perfectly competitive equilibrium model familiar to most economists, and
add the ability of not-for-profit firms to enter and compete with for-profit firms. In
their framework, for-profit hospitals maximize profits, while not-for-profit hospitals
maximize utility, which has profits and output (and potentially inputs) as arguments.
Lakadawalla and Philipson show that when NFP hospitals place positive weight on
output they will behave as if they are profit maximizers with lower marginal
costs, and in equilibrium will always earn negative profits. In general, NFP firms
crowd out FP organizations. However, if the number of potential not-for-profit firms
is limited, then for-profit firms participate in the market. In this case the market envi-
ronment is determined by the response of for-profit firms, since they are the marginal
organizations.
Hansmann et al. (2003) highlight that for-profit hospitals are the most responsive to
reductions in demand, followed, in turn, by public hospitals and religiously affiliated
non-profits, while secular non-profits are distinctly the least responsive of the four
ownership types. Glaeser (2002) notes that the governance structures on the managers
514 Martin Gaynor and Robert J. Town
of NFP institutions are generally weak. He constructs a model of the NFP sector that
examines the implications that governing boards of NFPs are not responsible to anyone
outside of the organization. He further notes that the behavior of hospitals displays
patterns consistent with capture by management and physicians.
2.1. Structural Estimates of the Dynamic Behavior of ProvidersOver the last two decades there have been significant advances in econometric
approaches to estimating parameters from dynamic models of oligopoly. Early
approaches (e.g. as previously mentioned, Gowrisankaran and Town, 1997) solved for
the equilibrium of the model for each trial parameter value. Recently, two-step
approaches have been developed. These two-step methods alleviate the need to solve
the model in order to recover the parameters, and thus significantly reduce the
computational burden of estimation. Bajari et al. (2007), Aguirregabiria and Mira
(2007), and Pakes et al. (2007) all develop approaches to estimate parameters from
dynamic oligopoly.15
Schmidt-Dengler (2006) studies the adoption of nuclear magnetic resonance imag-
ing (MRI) by US hospitals. Specifically, he examines the strategic incentives that hos-
pitals have to adopt the technology. Adopting the technology allows the hospital to
“steal” volume from their competitors and it may also deter or delay entry into this
service line by competing hospitals. He estimates the parameters of a structural model
of the timing of technology adoption (solving for equilibrium for each trial parameter
vector) in order to disentangle these two effects. His simulations show that business
stealing is the primary profit impact of MRI adoption, and that preemption has a
small but significant impact on hospital profits.
Beauchamp (2010) estimates a dynamic model of the entry, exit, and service provi-
sion of abortion providers using the two-step method of Arcidiacono and Miller
(2010). The goal of this work is to examine the reasons underlying the increasing
concentration of abortion providers. He finds that high fixed costs explain the growth
of large clinics and that increased provider regulation raised fixed entry costs for small
providers. Interestingly, his simulations show that removing all regulations leads to
increased entry by small providers into incumbent markets, increasing competition
and the number of abortions.
Nursing homes are an extremely large industry where the federal and state
governments are the primary payers. Two million US residents reside in 18,000
nursing homes. Because nursing homes do not set prices for most of their
patients, competition is primarily along quality dimensions. However, it is well
documented that the quality of care in nursing homes in the US is low. Seventy-three
percent of nursing homes were cited for quality of care violations during routine
15 Also see Arcidiacono and Miller (2010) and Pesendorfer and Schmidt-Dengler (2008).
515Competition in Health Care Markets
inspections.16 In order to study the dynamic response of the nursing home industry to
different policy experiments, Lin (2008) estimates the parameters of an Ericson and
Pakes (1995) type model. In the most interesting of her three policy experiments, she
increases government payments for providing high-quality care by 40 percent. This
leads to dramatic increases in both the percentage of high-quality homes and the total
number of homes.
The Rural Hospital Flexibility Program that was passed in the Balanced Budget
Amendment of 1997 has as its overarching goal maintaining access to quality hospital
care for rural residents. To achieve this objective, the program created a new class of
hospitals, Critical Access Hospitals (CAH). Participating hospitals opt out of
Medicare’s standard prospective payment system (PPS) and instead receive relatively
generous cost-based reimbursements from Medicare. In return, they must comply
with a number of restrictions, principally limits on their capacity to 25 beds or less
and patient length-of-stay to 96 hours or less. By 2006, 25 percent of all general acute
care US hospitals had converted to CAH status. Gowrisankaran et al. (2011) estimate
the structural parameters of a dynamic oligopoly capacity game in order to assess the
impact of this program on rural hospital infrastructure. They extend recent work on
estimating dynamic oligopoly games by constructing a one-step ahead estimator that
significantly reduces the computational burden of estimation. Preliminary results sug-
gest that the program only had a modest impact on the likelihood of exit, while it
dramatically changed the size distribution of rural hospitals. The estimates suggest that
the reduction in the size of rural hospitals had a detrimental impact on rural residents
and outweighs the benefits they received from keeping open a few hospitals that
would otherwise close.
Dunne et al. (2009) estimate a dynamic, structural model of entry and exit for
dentists and chiropractors using the method of Pakes et al. (2007). Their goal is to
understand the roles of entry, fixed costs, and toughness of competition in determin-
ing market structure. They find that all three factors are important in determining
market structure. To understand the role of entry costs in affecting market structure
they simulate the impact of reducing entry costs and find that increased price compe-
tition offsets the reduction in entry costs.
As noted by Brenahan and Reiss (1990, 1991) (BR), market structure is endoge-
nous and the relationship between market structure (i.e. the number of firms) and
market size (e.g. population) speaks to the nature of static price competition. The BR
method uses a simple, general entry condition to model market structure. The intui-
tion is that if the population (per-firm) required to support a given number of
firms in a market grows with the number of firms then competition must be getting
tougher. The tougher competition shrinks profit margins and therefore requires a larger
16 Office of the Inspector General, “Trends in Nursing Home Deficiencies and Complaints,” OEI-02-08-00140.
516 Martin Gaynor and Robert J. Town
population to generate the variable profits necessary to cover entry costs. For example,
if the size of the market needs to triple in order to add an additional entrant, that sug-
gests that the addition of that firm dramatically reduces firm profits. Thus, the key data
required for this method are both minimal and commonly available: market structure
and population.
Abraham et al. (2007) specify a static entry model modified from Bresnahan and
Reiss (1991) to better understand the nature of hospital competition. Abraham et al.
augment the BR approach by incorporating the use of quantity data. Their method
allows the separate identification of changes in the fixed costs of entry and changes in
the toughness of competition. Their estimates imply that the threshold per-firm popu-
lation required to support one hospital is approximately 7,000, increases to 12,600 to
support two hospitals, is approximately 19,000 for three hospitals, and just under
20,000 for four or more hospitals. They also find that increases in the number of
hospitals in the market dramatically increases the number of patients up until there are
three hospitals—by 23 percent with the entry of the second hospital and 15 percent
with the entry of the third hospital. This implies substantial increases in the toughness
of competition with the entry of a second or third firm, but not afterwards. These
results point to substantial effects on competition even from having only a second firm
in the market. However, the magnitude of the effects (23 percent increase in quantity
associated with moving from a monopoly to a duopoly) seem extremely large.
Schaumans and Verboven (2008) specify a static entry model of pharmacy and
physician entry in which pharmacies and physicians may be complementary services.
Their model is in the spirit of Bresnahan and Reiss (1991) and Mazzeo (2002). In
Europe, pharmacies have frequently received high, regulated markups over wholesale
costs, and have been protected from additional competition through geographic entry
restrictions. These restrictions may affect more than the market structure for pharma-
cies but may also spill over and affect entry of other complementary services. They
estimate the parameters of the model using data from Belgium. They find that the
entry decisions of pharmacies and physicians are strategic complements. Furthermore,
the entry restrictions have directly reduced the number of pharmacies by more than
50 percent, and indirectly reduced the number of physicians by about 7 percent.
Their model is discussed in more detail in section 6 on markets for physician services.
2.2. Reduced Form Studies of Dynamic Behavior of ProvidersUnderstanding the patterns of the evolution of health care provider market structure
can yield important insights into the underlying roles of policy and other factors that
shape market structure. Towards that end, several papers examine the entry, exit,
investment, and technology adoption patterns of providers using reduced form techni-
ques. Given clean identification, these approaches can provide important insight into
517Competition in Health Care Markets
underlying relationships that affect the dynamic behavior of providers. A limitation of
these approaches is that it is difficult to use these estimates to perform counterfactual
policy experiments.
The most important change in US health care policy over the last century was the
introduction of Medicare and Medicaid in the mid-1960s. Large portions of the pop-
ulation that were in poor health became insured under this program. That is, the
introduction of Medicare and Medicaid constituted a large, positive shock to the
demand for hospital and physician services which, in turn, had the potential to affect
the entry, exit, and investment decisions of providers. Finkelstein (2007) examines the
impact of this program on hospital dynamic behavior. She uses a long panel of
American Hospital Association data and employs a difference-in-difference identifica-
tion strategy. This strategy relies on geographic variation in the rates of hospital insur-
ance prior to the introduction of Medicare/Medicaid to identify the impact of these
programs. The idea is that areas in which large percentages of the population had
insurance prior to the introduction of Medicare and Medicaid were less exposed to
the treatment (the demand shock associated with the introduction of these programs)
than areas of the country with lower insurance coverage. She finds that the Medicare
program significantly increases the size of hospitals, increased admissions, increased
hospital entry rates, and there is some evidence that it increased the rate of adoption
of new technologies.
Not only does the presence of insurance affect hospital incentives, but the nature
of the insurance market may affect reimbursement rates and thus affect the incentives
of firms to invest in technology. In particular, managed care organizations negotiate
lower payments and restrict utilization, and thus may affect technology adoption. In a
series of papers, Laurence Baker and co-authors find evidence that managed care
penetration affects technology adoption. Baker and Wheeler (1998) find that high
HMO market share is associated with low levels of MRI availability and utilization.
This suggests that managed care may be able to reduce health care costs by influenc-
ing the adoption and use of new medical equipment and technologies. Baker and
Brown (1999) find evidence that increases in HMO activity are associated with
reductions in the number of mammography providers and with increases in the num-
ber of services produced by the remaining providers. They also find that increases in
HMO market share are associated with reductions in costs for mammography and
with increases in waiting times for appointments, but not with worse health out-
comes. Baker and Phibbs (2002) find that managed care slowed the adoption of neo-
natal intensive care units (NICUs) by hospitals, primarily by slowing the adoption of
mid-level NICUs rather than advanced high-level units. Slowing the adoption of
mid-level units would likely have generated savings. Moreover, contrary to the fre-
quent supposition that slowing technology growth is harmful to patients, in this case
reduced adoption of mid-level units could have benefited patients, since health
518 Martin Gaynor and Robert J. Town
outcomes for seriously ill newborns are better in high-level NICUs and reductions in
the availability of mid-level units appear to increase the chance of receiving care in a
high-level center.
The entry behavior of providers can be used to uncover the relative generosity of
different payers. Chernew et al. (2002) use this insight to measure the relative payment
generosity for coronary artery bypass graft (CABG) surgery. They examine the behav-
ior of hospitals in California from 1985 to 1994—a period in which CABG was dif-
fusing and hospitals were actively making decisions whether to provide this procedure.
Chernew et al. (2002) use geographic variation in the distribution of patients with dif-
fering insurance arrangements to identify returns to CABG entry as a function of the
expected volumes by payer class. They first estimate a hospital choice model for
CABG and then use the predicted volumes by insurer type in a simple entry regres-
sion. They find that fee-for-service (FFS) insurance provides a high return through-
out. Medicare reimbursements were initially generous but declined throughout the
study period. HMOs pay at approximately average variable costs, and, interestingly,
the return varies inversely with competition.
Chakravarty et al. (2006) examine hospital entry and exit rates through the lens of
the model of Lakdawalla and Philipson (2006). They analyze the entry and exit behav-
ior of hospitals from 1984 to 2000 and find higher exit and entry rates for FP hospitals
than for NFPs. In addition, FP hospitals are more sensitive to shifts in demand. These
results are all consistent with theoretical predictions—FPs are the marginal firm.
Ciliberto and Lindrooth (2007) derive a random effects estimator of hospital exit and
find that increases in Medicare reimbursements and improvements in efficiency
reduced the probability of exit. Deily et al. (2000) find that during the late 1980s
increases in relative inefficiency increased the probability that FP and NFP hospitals
would exit, but not public hospitals.
Public policy can directly or indirectly affect hospital closure. The direct impact
can occur by closing public hospitals, forcing existing private hospitals to close, or by
bailing out failing hospitals. For example, in New York state, the recent Berger
Commission Report (Commission on Health Care Facilities in the 21st Century,
2006) requires the reconfiguration and/or closure of 59 hospitals, or 25 percent of all
hospitals in the state. Changes in payment or regulatory policy can indirectly affect
the financial viability of hospitals and thus their probability of exit. The welfare impact
of such closures will depend upon relative costs of the closed hospital and the value
patients place upon having access to that hospital.
Lindrooth et al. (2003) examine the impact of hospital closure on the average cost
of hospital care in the community. They find that the hospitals that closed were less
efficient and that costs per discharge declined by 2�4 percent for all patients and 6�8
percent for patients at the closed hospital due to patients shifting to more efficient
hospitals. Capps et al. (2010b) compare the loss in consumer surplus to patients from
519Competition in Health Care Markets
closing a hospital to the potential cost savings from closing inefficient hospitals. They
examine five hospital closures in Arizona and Florida and conclude that, for the
closures they study, the cost savings from closures more than offset the reduction in
patient welfare. In contrast, Buchmueller et al. (2006) find that hospital closures in
California had negative health consequences on the surrounding population.
Specifically, they find that increases in the distance to the closest hospital increases
deaths from heart attacks and unintentional injuries. These health effects are not
captured in the consumer surplus analysis of Capps, Dranove, and Lindrooth.
Entry can significantly shape market structure and can have significant impacts
on incumbent firms in the market. If firms can deter entry or if there are fric-
tions that prevent the entry of organizations that might otherwise become market
participants, it can have a significant impact on providers and health care consu-
mers. In addition to the work of Schmidt-Dengler (2006), two other papers have
addressed issues of entry deterrence and entry frictions: Ho (2009a) and Dafny
(2005).
Kaiser Permanente is a vertically integrated, staff-model Managed Care
Organization (MCO) based in California that owns hospitals and directly employs
physicians and other health care providers. In California and Hawaii, Kaiser is quite
successful, with large market shares in many California markets. However, outside of
the West Coast of the US, Kaiser is not a significant factor. Much of Kaiser’s success is
attributable to its ability to provide reasonably high-quality care at low cost. Kaiser
members generally do not receive care outside of the Kaiser provider network and
thus they have limited provider choices. Given their comparative advantages and
California success, an interesting question is why Kaiser is unable to replicate its
California business model and enter in other markets. Kaiser has attempted to enter
seven different markets and only successfully gained a foothold in three of these mar-
kets. Using simulation methods based on her previous work (Ho, 2006), Ho (2009a)
examines the underlying reasons for Kaiser’s lack of success outside of the West Coast.
She finds that the premium reductions that Kaiser would have offered because of their
limited provider network are large and not likely offset by any cost advantages they
may possess. In addition, even in locations in which incumbent plan quality is low,
customer informational asymmetry over plan quality implies that it will take Kaiser a
long time to achieve the necessary scale economies to be profitable. Finally, she notes
that Certificate of Need laws also raise the cost of entry for Kaiser, affecting their
likely success rate.
As we discuss later in this chapter (section 4.4.3), there are significant volume-
outcome effects in the provision of many hospital services, i.e. patients that go to
hospitals that do larger volumes of a procedure typically have better health outcomes.
Hospitals therefore may have an incentive to invest in building volume in the hopes
of leaving insufficient patients for any potential entrants to attract if they were in fact
520 Martin Gaynor and Robert J. Town
to enter.17 Dafny (2005) tests for this type of preemption for electrophysiological stud-
ies, a procedure to identify and correct cardiac arrhythmias. Building on the ideas of
Ellison and Ellison (2007), she notes that entry preemption will most likely occur in
markets where the entry probability is intermediate. In markets in which entry proba-
bilities are high, entry will likely occur even with incumbent strategic behavior. In
low entry probability markets, entry deterrence is unnecessary, because entry is
unlikely even without preemption. Using Medicare claims data she tests this proposi-
tion and finds that incumbent volume growth for electrophysiological studies is largest
in markets in which there is only one potential entrant (an intermediate entry
probability case) and that the greater the number of entrants, the lower the incumbent
volume growth. Thus, the evidence suggests that hospitals do engage in entry deter-
rence in accordance with the theory.
The analysis of entry and exit by providers other than hospitals is quite limited.
Orsini (2010) examines the impact of changes in Medicare home health reimburse-
ment rates that were passed in the Balanced Budget Act of 1997 on home health
agency exits. Orsini finds that a decline in reimbursement of one visit per user
increases the hazard of exit of a home health care agency by 1.13 percent with no
differential response in exit by ownership type. Bowblis (2010) studies closures in the
nursing home industry and finds that FP homes are slightly more likely to close than
NFP homes. Also, homes that care for more publicly insured patients and those with
poor financial performance were more likely to close.
2.2.1. The Impact of the Introduction of New Classes of ProvidersThe basic structure, roles, and segmentation of health care providers has remained
relatively constant over the last half of the century. Hospitals provide a variety of inpa-
tient and outpatient services and, depending on their specialty, physicians provide care
in either their office and/or the hospital. Cutler (2010) comments on the lack of
entrepreneurial vigor addressing the inefficiencies in the provision of health care. He
cites two reasons for these inefficiencies. First, fee-for-service reimbursement schemes
give providers little incentive to reduce the cost of the care they provide. Second,
information on the cost and quality of care is generally not transparent. Thus, the
returns to developing new care modalities that result in higher-quality and/or lower-
cost care are likely to be modest. Cebul et al. (2008) also consider organizational issues
in health care. They point to sociological factors, legal barriers, and issues with infor-
mation (the compatibility and deployment of information technology specifically) as
the key reasons for the inefficient organization of this sector. While Cutler and Cebul
17 This can form a barrier due to fixed costs of entry or due to a volume-outcome effect. Insufficient volume may
result in such poor quality that entry will not occur.
521Competition in Health Care Markets
et al. are right to note the organization problems and lack of large entrepreneurial
advances in health care provision, there are some important exceptions.
More broadly, the literature outside of health care generally finds that the intro-
duction of new products can have large positive impacts on consumer welfare (e.g.
Petrin, 2002; Gentzkow, 2007). However, this need not be the case in the health care
sector. The large role of public programs where prices are set administratively, the
importance of private third-party payers, and the presence of asymmetric information
imply that new organizational forms can plausibly reduce consumer well-being. That
is, these organizations could be designed to exploit administrative pricing irregulari-
ties, the inability of insurers to curtail patient utilization, or knowledge gaps between
patients and providers over the quality and necessity of the care they receive. There
are at least three types of new organization types that have been introduced over the
last several decades, and we discuss them below.
There is a long history of hospitals that are devoted to specific conditions or popu-
lations—women’s, children’s, psychiatric, and tuberculosis hospitals have existed for
over a century. However, in the early 1990s a new type of “specialty” hospital was
born. Specialty hospitals are inpatient facilities that treat a limited range of conditions
(e.g. cardiac and orthopedic). These hospitals are principally for-profit organizations,
with physicians owning a significant stake in the hospital. Specialty hospitals are con-
troversial. Critics argue that specialty hospitals are a mechanism to exploit asymmetric
information by providing kickbacks to physicians for referrals, and they restrict the
ability of general hospitals to internally cross-subsidize unprofitable services by skim-
ming off high-margin patients. Proponents contend that there are important gains
from specialization. Specialty hospitals may offer greater economic efficiency, higher
quality, more consumer-responsive products and services, and provide beneficial com-
petition to general hospitals.18 Barro et al. (2006) study the impact of specialty hospi-
tals and find that markets experiencing entry by a cardiac specialty hospital have lower
spending for cardiac care without significantly worse clinical outcomes. In markets
with a specialty hospital, however, specialty hospitals tend to attract healthier patients
and provide higher levels of intensive procedures than general hospitals. Carey et al.
(2008) find that orthopedic and surgical specialty hospitals appear to have significantly
higher levels of cost inefficiency. Cardiac hospitals, however, do not appear to be
different from competitors in this respect.
Chakravarty (2010) employs a number of analyses to assess the impact of specialty
hospitals on general hospitals. In one, he uses propensity score matching and differ-
ence-in-difference analysis on a national dataset to estimate the effect of specialty
hospitals on the profits of general hospitals. He finds no statistically significant
impacts of the entry of specialty hospitals on general hospital profits. In this analysis
18 See Schneider et al. (2008b) for an overview of the economics of specialty hospitals.
522 Martin Gaynor and Robert J. Town

he is unable to control for the extent to which specialty hospitals may select healthier
patients. He employs a dataset from the state of Texas with detailed clinical
information to conduct an analysis controlling for the possibility that specialty
hospitals skim healthier patients. He finds that there is heterogeneity in the effects of
specialty hospital entry on general hospital profits: entry lowers general hospital
profits in counties where specialty hospitals have healthier patients than the median
(county), but not in other counties. He also looks at the impacts of specialty hospital
entry on general hospital exit and merger. He finds no evidence of an impact on
exit, but some evidence that specialty hospital entry increases the probability of
general hospital mergers.
Ambulatory Surgical Centers (ASCs) were introduced in the US in the 1970s as
more and more surgical procedures shifted to an outpatient setting, and have grown
to become an important type of health care provider. There are 4,500 freestanding
ASCs performing more than 15million procedures annually (Cullen et al., 2009).
ASCs provide non-emergent, outpatient surgical services, generally focusing on
specific sets of procedures (e.g. cataract surgery, orthopedics). ASCs compete with
each other and with the outpatient departments of general acute care hospitals for the
provision of these services. Weber (2010) examines the welfare benefits of ambulatory
surgical centers. She does this by estimating the demand for ASCs as a function of
distance and patient and facility characteristics, using data from the state of Florida.
Her estimates show that consumers place relatively little value on having access to an
ASC. If all ASCs were closed, potential consumers of ASC services would conserva-
tively lose approximately $1.50 of surplus per episode for the least valued procedure
and about $27 per episode for the most valued procedure. Approximately two-thirds
of the welfare loss comes from the loss of ASCs and their unique attributes, while the
remaining one-third stems from consumers facing smaller choice sets and greater
travel times.
Retail clinics (or convenience clinics) are a relatively new type of health care pro-
vider that compete with physician clinics for the diagnosis and treatment of several
common, low acuity conditions. The first retail clinic opened in a Cub grocery store
in St. Paul, MN, in 2000. Retail clinic patients do not need an appointment, and care
is provided by nurses with advanced training (usually nurse practitioners) who are
overseen by a physician (often remotely). Currently, there are over 1,200 clinics oper-
ating in the US. The prices for each service are typically posted at the clinic as well as
online, making the patient financial obligation transparent. These fees are much lower
than most physician office visit charges, making retail clinics a more attractive option
for the uninsured. The clinics also are usually located in a retail establishment (drug
store, grocery store, big box retailer) and have extensive evening and weekend hours.
Using a large, national database of private insurer claims, Parente and Town (2011)
examine the impact of these clinics on the cost and quality of care. They find that the
523Competition in Health Care Markets
cost of care at these clinics is significantly lower relative to the care provided in a phy-
sician’s office, with no obvious quality differences. As a consequence, these results sug-
gest that the introduction of retail clinics resulted in significant consumer welfare
gains. Some recent results by Ashwood et al. (2011), using data from a different large
national insurer, find increased utilization and cost associated with retail clinics, how-
ever. Retail clinics are associated with reductions in utilization and costs for physician
office visits and emergency room visits. However, the increase in retail clinic visits is
larger than the reductions in other types of utilization.
3. HOSPITAL MARKET STRUCTURE, COMPETITION, AND PRICES
3.1. A Model of Hospital Insurer NegotiationAs mentioned in the introduction, the hospital industry is one of the largest industries
in the US economy. Not only is the hospital industry large, but it operates in a very
unique institutional setting. Over the last decade a series of papers have been written
that model the price setting behavior of hospitals. These models recognize that
institutional features of the hospital market in the United States are unique and these
features have ramifications for the role of competition in affecting prices and the
quality of care. There are at least four key distinguishing features of hospital markets
that play an important role in affecting competitive interactions between hospitals.
First, privately insured patients primarily access hospital care through their health
insurance, therefore the set of available hospitals will depend on the health plan’s
provider network structure. Health insurers often contract with a subset of hospitals
in a given location. The effective hospital choice set for a patient when they need to
be treated will therefore depend upon their health insurance plan (Ho, 2006).
Second, patients do not pay directly for inpatient care. Most of the cost of an inpa-
tient episode is covered under the patient’s insurance and hence any price differential
between hospitals is not generally reflected in the patient’s out-of-pocket cost. Third,
the health insurance choice of the patient is generally made prior to the need for
inpatient treatment. In this sense, hospitals are an option demand market. Fourth,
hospitals negotiate with private insurers over inclusion in their provider network and
the reimbursement rates the hospital will receive from treating the insurer’s enrollees.
These negotiations also determine how hospital utilization will be monitored and
controlled as well as details of the billing arrangements. Health insurers, in turn,
compete with each other based on premiums (which are a function of the prices they
pay hospitals) on the breadth and quality of their provider networks. Employers,
through whom most private insurance is acquired, have preferences over hospitals
which are an aggregation of their employees’ preferences, and select the set of health
524 Martin Gaynor and Robert J. Town
plans they offer to their workers based on expected costs, benefit structure, and pro-
vider networks.19
Below, we outline a simple model of hospital�insurer bargaining. There are several
goals we wish to accomplish with this model. First, we wish to understand the role
of market power and its source in affecting the price of hospital care. Second, a related
goal is to understand how hospital mergers affect the price of inpatient care and the
impact on welfare. Third, we provide guidance to empirical modelers so that one can
estimate parameters that can be linked, either directly or indirectly, to the underlying
theory of hospital price determination. We also note that this model, while faithful to
key institutional details specific to health care, is generic enough that it can be applied
to other health care providers besides hospitals, most prominently physicians. It also
could be expanded in the direction of encompassing a richer model of the insurer
market, although one for pragmatic purposes one would then have to simplify the
insurer-provider part of the model.
The model combines the insights of research on hospital competition by Gal-Or
(1997), Town and Vistnes (2001), Capps et al. (2003), Gaynor and Vogt (2003), Ho
(2009b), Haas-Wilson and Garmon (2011), and Lewis and Pflum (2011). The structure
of this model is also similar to the bargaining models of Crawford and Yurukoglu (2010)
and Grennan (2010), who study cable television distribution and the negotiations
between hospital and medical device suppliers over the price of stents, respectively. Our
formulation most closely follows the exposition in Brand et al. (2011) (BGGNT).
Hospitals differ from most products in that the vast majority of consumers obtain
their hospital services through their health plan. In order for health insurers to offer
products that are viable in the marketplace, insurers must construct networks of hospi-
tals from which enrollees can receive health care services. The breadth and depth of
the provider network is a large determinant of the desirability of the different health
plans, as consumers value access to a variety of hospitals in the event of adverse illness
shocks. At the same time, consumers value income and so health insurance plans with
lower premiums are also more attractive. As will be seen, there is a trade-off between
the inclusiveness of an insurer’s network and insurer premiums. Health plans with
more inclusive networks will ceteris paribus have less bargaining power with hospitals
and thus pay higher prices, resulting in higher premiums.
We model hospital competition as taking part in three stages. First, health plans
and hospitals bargain to determine both the set of hospitals to include in the plan net-
works and the payment from the health plan to the hospital for each admitted patient.
Second, patients choose health plans. Finally, patients realize illness shocks, and choose
a hospital based on their illness shock and the hospitals in their network. Hospitals
19 Most large employers are self-insured and thus changes in negotiated prices between providers and health plans are
directly passed on to the employer.
525Competition in Health Care Markets
and health plans are assumed to have “passive beliefs,” i.e. if a plan or hospital gets an
alternative offer in the negotiating process, this will not change their beliefs about the
offers made or received by its competitors. We describe each of the three stages of the
game in turn, starting from the final stage.
There are H health plans and N hospitals operating in the market. A set of
patients, denoted i5 1, . . ., I, live in the market area and may enroll in a health insur-
ance plan and, after they have enrolled, they may become ill enough to require inpa-
tient treatment. In the final stage of the game, each patient takes her health plan h
and associated set Jh of in-network hospitals as given. At the beginning of the third
stage, each patient learns her illness shock. Denote these shocks m5 1, . . .,M, where
each m corresponds to a particular illness, or no illness, m5 0. Let ρi1, . . ., ρiM denote
the ex-ante probability of each shock. Each diagnosis has an accompanying weight
w1, . . ., wM. The weights describe the relative importance of each diagnosis in both
the cost and utility function, as we discuss below. In empirical implementations, the
m values would generally correspond to Diagnosis Related Groups (DRGs) or some
other disease classification system.
Given diagnosis m, patients choose a hospital at which to obtain treatment.
Patients are assumed not to pay an out-of-pocket differential price based on which
hospital they select, provided the hospital is in-network. The utility that patients
receive depends on the characteristics of the hospital (e.g. the services offered and the
perceived quality of care), characteristics of the patients (e.g. demographics and diag-
nosis), the travel time to the hospital, and an idiosyncratic error term.20 We let the
ex-post utility for patient i from hospital jAJh with illness shock mi be given by:
uij;m 5wm½ f ðxj; zi; dij;mi; θÞ1 eij� ð9:2Þwhere xj is a vector of hospital characteristics including a hospital indicator, zi is a
vector of patient characteristics including age, sex, and race, dij is the distance to the
hospital from the patient’s home, mi is diagnosis, θ is a parameter vector to be
estimated, and eij is an i.i.d. error term that is a distributed Type I extreme value,
which is revealed to the patient at the same time as her illness shock. In practice, uijis parameterized to be a linear function of a hospital fixed effect, travel time and
interactions between hospital characteristics (such as bed size, ownership type,
teaching status, service offerings), patient characteristics, diagnosis, diagnosis weight,
and travel time.
20 In our formulation of utility, we assume that patients do not face any price differential across hospitals. We make
this assumption primarily for expositional ease. There is some evidence that hospital prices do in fact affect hospital
choice (e.g. Gaynor and Vogt, 2003). This could be a consequence of patient cost-sharing arrangements, insurers
negotiating on their enrollees’ behalves, or because physicians are incentivized to use lower-cost hospitals (Ho and
Pakes, 2011). The advantage of allowing prices to enter patient utility is that recovering the utility parameter on
price allows for the monetization of the patient’s surplus from a given hospital network.
526 Martin Gaynor and Robert J. Town
In addition to the Jh hospitals, the patient can also choose the outside option 0,
which corresponds to going to an out-of-network or out-of-area hospital or no
hospital. We normalize the utility from the outside option to have zero base
utility, so ui05 ei0. We assume that if the health shock m5 0 then the utility of
hospital treatment is sufficiently low that the patient always chooses the outside
option 0.
Given the logit assumption, the probability that an individual i with illness m will
seek care at hospital j is
sijm5expð f ðxj; zi; dij;m; θÞÞ
11P
kAJjexpðf ðxk; zi; dik;m; θÞÞ
In turn, the ex-ante expected utility that a patient receives from a given hospital
choice set Jh is given by:21
WiðJhÞ5X
m5 1...m
ρimwmln 11XjAJj
expðf ðxj; zi; dij;m; θÞ ! !
ð9:3Þ
Conditional on illness severities and probabilities, the distribution of xj and the
geographic distribution of hospitals, the welfare a patient receives from a health plan’s
network is a function of the identities of the hospitals in the plan’s network.
Turning now to the second stage, each enrollee (and potential patient) is faced
with a set of health plans, h5 1, . . ., H, from which they select. Each plan has a set of
hospitals in its network, Jh, and each plan simultaneously chooses its premium for its
customers.22 Plan attributes are given by a set of characteristics, ch. We posit that the
expected utility for consumer i of plan h is given by:23
vij 5Wið Jh; θÞ1 γch1 ξh1αP lnðincomei2PremhÞ1 εih
where Premh is the insurance premium for plan h, ξh captures differences in the
unmeasured (by the econometrician) desirability of the plan, γ and αP are parameters,
and where εih is distributed i.i.d. Type I extreme value.24 Let ~vih denote the uncondi-
tional expected value of vih and let Wi and Prem denote the vectors of the plan values
21 To ease the notational burden, we index Wi( Jh) only by Jh but it is understood that it is a function of patient and
hospital characteristics and θ.22 BGNGT model the health plan as a cooperative whose objective is to maximize enrollee surplus. The advantage of
this approach is that it allows for an explicit solution to the hospital/insurer bargaining game without modeling
health plan competition. In that approach, consumer surplus directly enters the bargaining solution.23 For expositional ease we treat health plan enrollees as homogeneous conditional on their zi and e. However, in an
empirical implementation it may be desirable to allow for random coefficients over the preference parameters, as in
Berry et al. (1995).24 In this parameterization of utility the pre-tax benefit treatment of health insurance is captured, in a reduced form
way, in αP.
527Competition in Health Care Markets

for these variables for all plans in the market. The probability that individual i enrolls
in plan h is:
yihð J ; ξ; Prem; θ; γ;αÞ5expðv~ihÞPlexpðv~ilÞ
where J is an H3N matrix of ones and zeros which denote the hospital networks of
all the H plans and ξ is the H3 1 vector of ξh values. The market share for plan h is
then the summation of the probabilities of selecting the plan across the population:
Yhð J ; ξ;PremÞ5P
iyihð J1; . . . ; JH ; PremÞ.25 The profits the health plan earns from a
given network are then:
πhðJ ; ξ;PremÞ5 Premh2 ach2Xj
pjhqjh
!YhðJ ; ξh;PremÞ2Fixedh
where ach is the other variable costs incurred by the plan outside of hospital expendi-
tures, e.g. administrative and marketing costs. We assume that the plan’s cost structures
are known to all the other plans. Health plans are assumed to select a single premium
to maximize profit. That is, treating their own and the competitors’ hospital networks
as fixed, the first-order conditions are:
YhðJ ; ξ;PremÞ1 Premh2 ach2Xj
pjhqjh
!dYhðJ ; ξ;PremÞ
dPremh
5 0 ð9:4Þ
The equilibrium of the premium setting game is one in which all of the plans’
premiums satisfy (9.4) simultaneously. Caplin and Nalebuff (1991) prove that there is a
unique equilibrium in the premium setting game given the set of health plan hospital
networks. The premiums and thus the profits of all the health plans will depend upon
the structure of all the competing plans’ hospital networks, their costs, and the
distribution of patients across geography and incomes.
Finally, at the first stage of the game, we assume that hospitals and health plans
bargain over the price of inpatient care. The outcome of this bargaining game deter-
mines which hospitals and health plans will agree to a contract and the prices health
plans will pay hospitals for caring for their enrollees. Although the contract terms
between hospitals and health plans are complex, we assume that health plans and
hospitals are constrained to negotiate a base price for each patient. The actual price
paid by the health plan to the hospital will be the base price multiplied by the disease
weight, wm. Since the weights are effectively meant to capture costs, one could
implement this by using DRG weights, which have roughly the same purpose. With
the interpretation of the w terms as DRG weights, we believe that this structure for a
25 We ease the notational burden by subsuming the parameter index into Yh.
528 Martin Gaynor and Robert J. Town

contract between a health plan and hospital is a reasonable approximation of actual
contracts.
We consider a model of bargaining and competition similar to Horn and Wolinsky
(1988).26 There are JH pairs of hospitals and health plans which are negotiating over a
price (pjh) the health plan pays to the hospital for each patient the hospital treats. The
hospital’s marginal cost of treating the patient is Cj.27 Nature chooses a random order-
ing among each of these pairs and assigns an initial offerer to each pair. The parties
then engage in a bargaining process over prices. Prior to the match, the health plan
receives an i.i.d. synergistic cost term from the match, cmjh, that is common knowl-
edge to both firms and which will generate randomness to the ex-ante outcomes.
A natural starting point for analyzing the bargaining game is to focus on the Nash
bargaining solution.28 This solution takes each insurer�hospital pair in isolation, hold-
ing the other hospital�insurer prices fixed. The Nash bargaining solution we consider
ignores the strategic interactions that a given insurer�hospital price might have on
other insurer�hospital prices. Importantly, this framework is an approximation to the
game in which prices and the entire provider networks are determined.29 Clearly,
allowing a richer set of strategic interactions would be a welcome advance.
To calculate the Nash bargaining outcome we need to specify the agreement and
disagreement values for the hospital and the insurer. The agreement value for the hos-
pital is the net revenues they earn from the insurer’s flow of patients to the hospital.
Under the disagreement outcome the hospital is assumed to receive a fixed net reve-
nue, rh. For the insurer, the agreement value is the gross revenue they earn from hav-
ing hospital network Jh in place less the expenditures on inpatient care at the hospital.
Holding the other plans’ hospital networks fixed, we denote the gross revenue as:
FhðJhÞ5Prem�hð Jh; J2hÞYhð Jh; J2h; ξ;Prem�
hÞ ð9:5Þwhere Prem�
h is the vector of premiums that solves (9.4), and we decompose the
matrix of hospital networks into two components, plan h’s network and the networks
of the other plans, J2h. Denote the hospital network that excludes hospital j as Jh2j.
The gross revenue from the network that excludes hospital j is then:
Fhð Jh2 jÞ5Prem�hð Jh2 j; J2hÞYhð Jh2 j; J2h; ξ; Prem�
hÞ ð9:6ÞThe insurer’s disagreement value is then FhðJh2 jÞ2
Pkpkjq
Jh 2 jkh , where q
Jh 2 jkh is
the flow of patients to network hospitals given network Jh2 j. If the net surplus
26 More recent analyses of bargaining games in supplier network contexts include Stole and Zwiebel (1996), Inderst
and Wey (2003), and de Fontenay and Gans (2007).27 We assume costs do not vary by health plan.28 See Dranove et al. (2007) for an examination of the “levels” of rationality that hospitals possess in the bargaining
game.29 Ho (2009b) and Pakes (2010) consider a game of hospital network formation which endogenizes the network
structure.
529Competition in Health Care Markets
from the hospital�insurer match is not greater than zero, then bargaining does
not take place and the hospital is not in the insurer’s network. That is, bargaining
only takes place if Fh(Jh)2Fh(Jh2 j)2 cjhqjh2Σl6¼jplhdjlh2 cmjh. 0, where
djk 5 ðqJ2 jkh 2 qkhÞ.
Summarizing the agreement and disagreement values we have:
Hagree5 ðpjh2 cjÞqjhðJhÞHdisagree5 rj
Magree5FhðJhÞ2 pjhqjhðJhÞ2X
l 6¼jplhqlhðJhÞ2 cmjh
Mdisagree 5FhðJh2 jÞ2X
l 6¼jplhqlhðJh2 jÞ
Under Nash bargaining each bilateral price maximizes the Nash product of hospi-
tal net profits and the net insurer surplus from agreement, taking the other prices as
given, solving
maxp
½Hagree2Hdisagree�β½Magree2Mdisagree�12β
where βA[0,1] is the relative bargaining ability or non-modeled bargaining power of
the hospital relative to the insurer. Differentiating and solving for pjh yields:30
pjh5 ð12 βÞ cj 2rj
qjh
� �1
βqjh
ðFhðJhÞ2FhðJh2 jÞ2 cmjhÞ1 βXl 6¼j
plhdjlh ð9:7Þ
where we refine d as a share so djk5 ðqJ2 jkh 2 qkhÞ=qjh and q
J 2 jkh is the number of
patients that flow to hospital k if the network is Jh2 j. That is, djk is the diversion share
from hospital j to hospital k when hospital j is no longer available.
The Nash bargaining solution predicts that, quite intuitively, a hospital’s price
will be increasing in its costs, bargaining ability, the prices of other competing hospi-
tals, and, importantly, the net value that the hospital brings to the insurer’s network.
In this framework, we have left the insurer few tools to affect their bargaining
position. There are circumstances in which if the health plan can steer patients to
lower priced hospitals it can significantly affect the bargaining outcome. This is true
theoretically as well as empirically. Sorensen (2003) and Wu (2009) find that health
plans which are better able to channel patients can extract greater discounts from
hospitals.
Part of the goal of this analysis is to provide a framework for the analysis of
hospital mergers. To start this analysis assume that the hospitals negotiate separately
while under joint control but take into account the impact of disagreement on the
30 Note that@FðVJh
;pjhÞ@pjh
5 0 by the envelope theorem.
530 Martin Gaynor and Robert J. Town
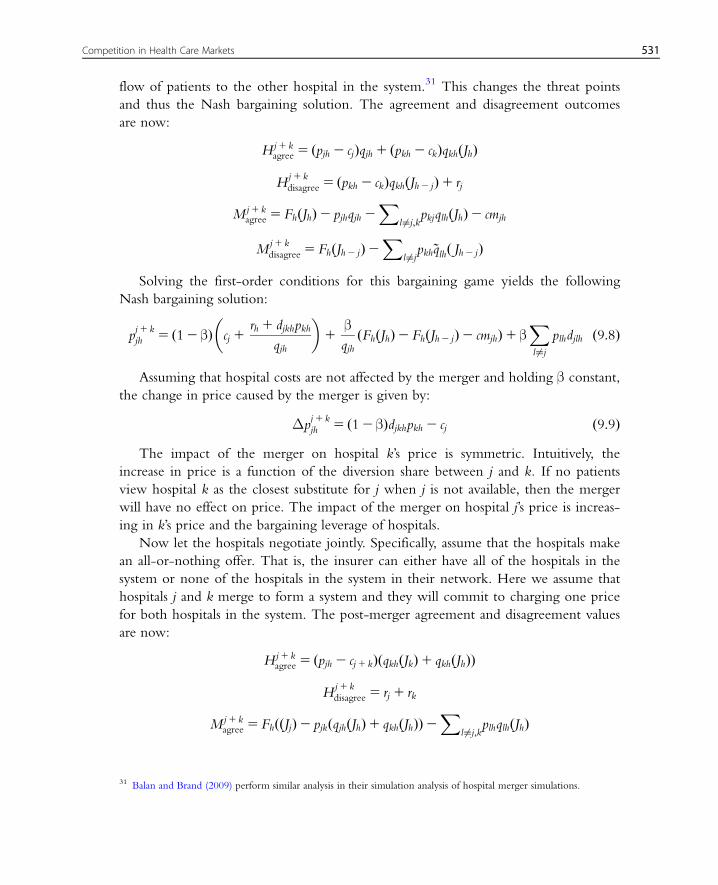
flow of patients to the other hospital in the system.31 This changes the threat points
and thus the Nash bargaining solution. The agreement and disagreement outcomes
are now:
Hj1 kagree5 ðpjh 2 cjÞqjh1 ðpkh2 ckÞqkhðJhÞ
Hj1 kdisagree 5 ðpkh2 ckÞqkhðJh2 jÞ1 rj
Mj1 kagree5FhðJhÞ2 pjhqjh2
Xl 6¼j;k
pkjqlhðJhÞ2 cmjh
Mj1 kdisagree5 FhðJh2 jÞ2
Xl 6¼jpkh~qlhð Jh2 jÞ
Solving the first-order conditions for this bargaining game yields the following
Nash bargaining solution:
pj1 kjh 5 ð12 βÞ cj 1
rh1 djkhpkh
qjh
� �1
βqjh
ðFhðJhÞ2FhðJh2 jÞ2 cmjhÞ1 βXl 6¼j
plhdjlh ð9:8Þ
Assuming that hospital costs are not affected by the merger and holding β constant,
the change in price caused by the merger is given by:
Δpj1 kjh 5 ð12 βÞdjkhpkh2 cj ð9:9Þ
The impact of the merger on hospital k’s price is symmetric. Intuitively, the
increase in price is a function of the diversion share between j and k. If no patients
view hospital k as the closest substitute for j when j is not available, then the merger
will have no effect on price. The impact of the merger on hospital j’s price is increas-
ing in k’s price and the bargaining leverage of hospitals.
Now let the hospitals negotiate jointly. Specifically, assume that the hospitals make
an all-or-nothing offer. That is, the insurer can either have all of the hospitals in the
system or none of the hospitals in the system in their network. Here we assume that
hospitals j and k merge to form a system and they will commit to charging one price
for both hospitals in the system. The post-merger agreement and disagreement values
are now:
Hj1 kagree5 ðpjh 2 cj1 kÞðqkhðJkÞ1 qkhðJhÞÞ
Hj1 kdisagree 5 rj 1 rk
Mj1 kagree5FhððJjÞ2 pjkðqjhðJhÞ1 qkhðJhÞÞ2
Xl 6¼j;k
plhqlhðJhÞ
31 Balan and Brand (2009) perform similar analysis in their simulation analysis of hospital merger simulations.
531Competition in Health Care Markets

Mj1 kdisagree 5FhðJh2 j2 kÞ2
Xl 6¼j;k
plhqlhðJh2 j2 kÞ
where cj1 k is the volume weighted average cost of the newly merged system.
Solving as before yields the solution:
pjh5 ð12 βÞ cj1 k 1rj1 k
qjh1 qkh
!
1βðFhðJhÞ2FhðJh2 j2 kÞ2 cmj1 khÞ
qjh 1 qkh1 β
Xl 6¼j
plhdðj1 kÞlh
ð9:10Þ
The diversion shares, d(j1 k)lh, are now relative to the merged entity and d(j1 k)kh5 0.
The impact of a given hospital merger will depend on the changes in the relative
threat points. However, if the hospitals are viewed as substitutes by potential patients,
then post-merger prices will increase. To see this, let hospitals j and k be symmetric
in the sense that they have the same pre-merger prices, average costs and volumes,
and assume that the match value terms are unaffected by the merger.32 Let
ΔJh2 j 5 1qjhðFhðJhÞ2FhðJh2 jÞÞ, which is the average loss in net revenue to the insurer
per patient if no agreement is reached. The corresponding value for the merged hos-
pital is ΔJ2 j2 k 5 1qjh 1 qkh
ðFhðJhÞ2FhðJh2 j2 kÞÞ. The change in the price of hospital j is
then:
Δpjh 5ΔJ2 j2 k 2ΔJ2 j 1Xl 6¼j;k
plhðdj1 klh2 djlhÞ ð9:11Þ
The merger will increase price as long as the additional loss in per-patient welfare
(relative to network J) from hospital network Jh2 j2 k is greater than the loss in welfare
from hospital network Jh2 j. This will be the case if and only if patients view hospitals
j and k as substitutes. To see this, assume that hospitals j and k are not substitutes in the
sense thatdjkhqjk
, a where a is a sufficiently small (say 0.05), so that Fh(Jh)2 Fh( Jh2 j2 k) �2Fh(Jh)2Fk(Jh2 j)2Fh(Jh2 k). ThenΔJ2 j2 k �ΔJ2 j andΔpjh � 0.33
In order to assess the welfare impact of a change in hospital market structure, we
need to trace out the pass-through from changes in hospital prices to changes in
health insurance premiums. In this framework, hospitals are an input into the produc-
tion of health insurance, thus any change in hospital prices will only affect consumer
surplus if those changes are passed through to consumers. Given parameters on health
plan utility and the appropriate data, it is possible to quantify the impact of the hospi-
tal merger on welfare. Suppose competing hospitals j and k successfully merge and in
32 It is straightforward but notationally cumbersome to let prices differ by hospital for this exercise.33 In the random utility hospital choice model there will always be some non-zero substitution between hospitals in
the choice set and thus there is no two-hospital pair for which djkh5 0.
532 Martin Gaynor and Robert J. Town
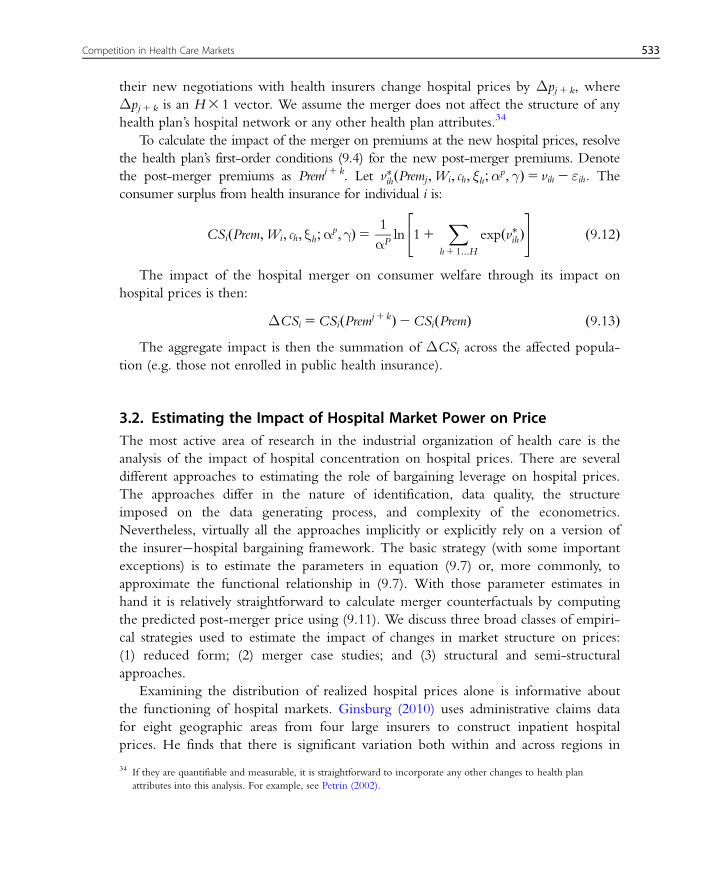
their new negotiations with health insurers change hospital prices by Δpj1 k, where
Δpj1 k is an H3 1 vector. We assume the merger does not affect the structure of any
health plan’s hospital network or any other health plan attributes.34
To calculate the impact of the merger on premiums at the new hospital prices, resolve
the health plan’s first-order conditions (9.4) for the new post-merger premiums. Denote
the post-merger premiums as Premj1 k. Let v�ihðPremj;Wi; ch; ξh;αp; γÞ5 vih2 εih. The
consumer surplus from health insurance for individual i is:
CSiðPrem;Wi; ch; ξh;αp; γÞ5 1
αPln 11
Xh1 1...H
expðv�ihÞ" #
ð9:12Þ
The impact of the hospital merger on consumer welfare through its impact on
hospital prices is then:
ΔCSi5CSiðPremj1 kÞ2CSiðPremÞ ð9:13ÞThe aggregate impact is then the summation of ΔCSi across the affected popula-
tion (e.g. those not enrolled in public health insurance).
3.2. Estimating the Impact of Hospital Market Power on PriceThe most active area of research in the industrial organization of health care is the
analysis of the impact of hospital concentration on hospital prices. There are several
different approaches to estimating the role of bargaining leverage on hospital prices.
The approaches differ in the nature of identification, data quality, the structure
imposed on the data generating process, and complexity of the econometrics.
Nevertheless, virtually all the approaches implicitly or explicitly rely on a version of
the insurer�hospital bargaining framework. The basic strategy (with some important
exceptions) is to estimate the parameters in equation (9.7) or, more commonly, to
approximate the functional relationship in (9.7). With those parameter estimates in
hand it is relatively straightforward to calculate merger counterfactuals by computing
the predicted post-merger price using (9.11). We discuss three broad classes of empiri-
cal strategies used to estimate the impact of changes in market structure on prices:
(1) reduced form; (2) merger case studies; and (3) structural and semi-structural
approaches.
Examining the distribution of realized hospital prices alone is informative about
the functioning of hospital markets. Ginsburg (2010) uses administrative claims data
for eight geographic areas from four large insurers to construct inpatient hospital
prices. He finds that there is significant variation both within and across regions in
34 If they are quantifiable and measurable, it is straightforward to incorporate any other changes to health plan
attributes into this analysis. For example, see Petrin (2002).
533Competition in Health Care Markets
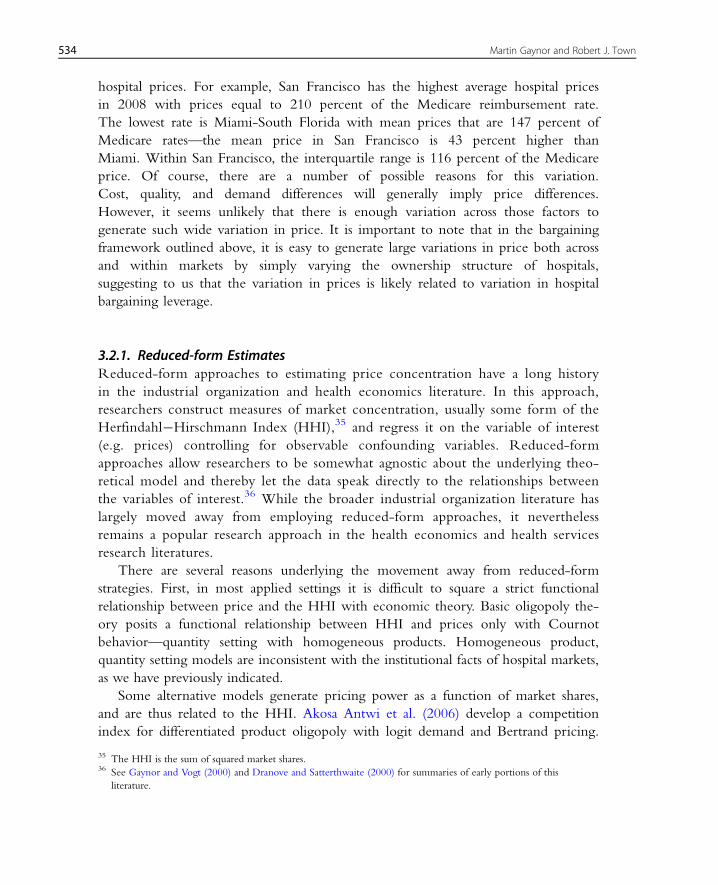
hospital prices. For example, San Francisco has the highest average hospital prices
in 2008 with prices equal to 210 percent of the Medicare reimbursement rate.
The lowest rate is Miami-South Florida with mean prices that are 147 percent of
Medicare rates—the mean price in San Francisco is 43 percent higher than
Miami. Within San Francisco, the interquartile range is 116 percent of the Medicare
price. Of course, there are a number of possible reasons for this variation.
Cost, quality, and demand differences will generally imply price differences.
However, it seems unlikely that there is enough variation across those factors to
generate such wide variation in price. It is important to note that in the bargaining
framework outlined above, it is easy to generate large variations in price both across
and within markets by simply varying the ownership structure of hospitals,
suggesting to us that the variation in prices is likely related to variation in hospital
bargaining leverage.
3.2.1. Reduced-form EstimatesReduced-form approaches to estimating price concentration have a long history
in the industrial organization and health economics literature. In this approach,
researchers construct measures of market concentration, usually some form of the
Herfindahl�Hirschmann Index (HHI),35 and regress it on the variable of interest
(e.g. prices) controlling for observable confounding variables. Reduced-form
approaches allow researchers to be somewhat agnostic about the underlying theo-
retical model and thereby let the data speak directly to the relationships between
the variables of interest.36 While the broader industrial organization literature has
largely moved away from employing reduced-form approaches, it nevertheless
remains a popular research approach in the health economics and health services
research literatures.
There are several reasons underlying the movement away from reduced-form
strategies. First, in most applied settings it is difficult to square a strict functional
relationship between price and the HHI with economic theory. Basic oligopoly the-
ory posits a functional relationship between HHI and prices only with Cournot
behavior—quantity setting with homogeneous products. Homogeneous product,
quantity setting models are inconsistent with the institutional facts of hospital markets,
as we have previously indicated.
Some alternative models generate pricing power as a function of market shares,
and are thus related to the HHI. Akosa Antwi et al. (2006) develop a competition
index for differentiated product oligopoly with logit demand and Bertrand pricing.
35 The HHI is the sum of squared market shares.36 See Gaynor and Vogt (2000) and Dranove and Satterthwaite (2000) for summaries of early portions of this
literature.
534 Martin Gaynor and Robert J. Town
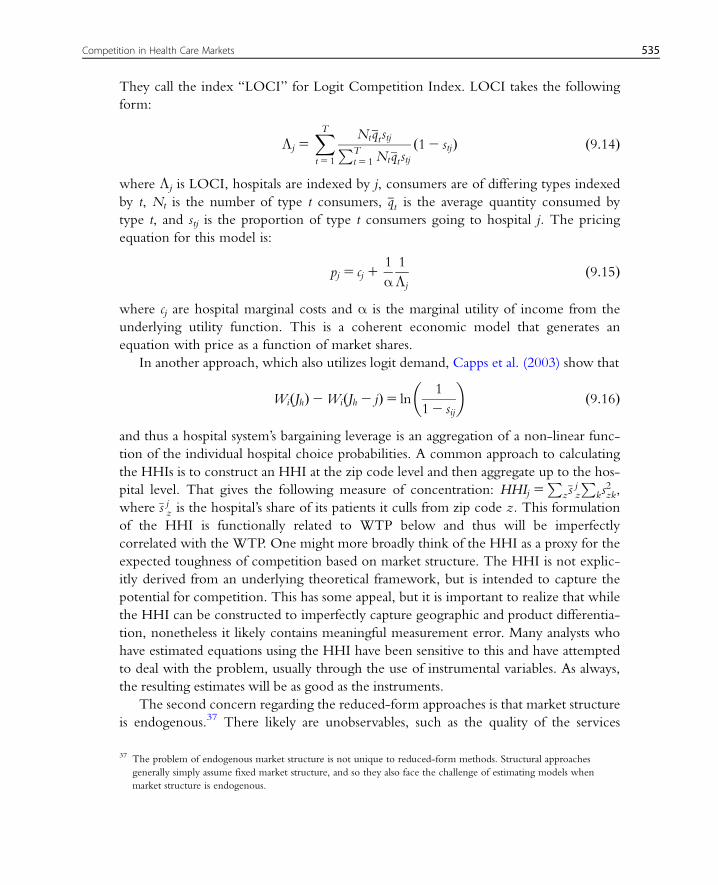
They call the index “LOCI” for Logit Competition Index. LOCI takes the following
form:
Λj 5XTt5 1
NtqtstjPTt5 1Ntqtstj
ð12 stjÞ ð9:14Þ
where Λj is LOCI, hospitals are indexed by j, consumers are of differing types indexed
by t, Nt is the number of type t consumers, qt is the average quantity consumed by
type t, and stj is the proportion of type t consumers going to hospital j. The pricing
equation for this model is:
pj 5 cj 11
α1
Λj
ð9:15Þ
where cj are hospital marginal costs and α is the marginal utility of income from the
underlying utility function. This is a coherent economic model that generates an
equation with price as a function of market shares.
In another approach, which also utilizes logit demand, Capps et al. (2003) show that
WiðJhÞ2WiðJh2 jÞ5 ln1
12 sij
� �ð9:16Þ
and thus a hospital system’s bargaining leverage is an aggregation of a non-linear func-
tion of the individual hospital choice probabilities. A common approach to calculating
the HHIs is to construct an HHI at the zip code level and then aggregate up to the hos-
pital level. That gives the following measure of concentration: HHIj 5P
zsjz
Pks2zk,
where s jz is the hospital’s share of its patients it culls from zip code z. This formulation
of the HHI is functionally related to WTP below and thus will be imperfectly
correlated with the WTP. One might more broadly think of the HHI as a proxy for the
expected toughness of competition based on market structure. The HHI is not explic-
itly derived from an underlying theoretical framework, but is intended to capture the
potential for competition. This has some appeal, but it is important to realize that while
the HHI can be constructed to imperfectly capture geographic and product differentia-
tion, nonetheless it likely contains meaningful measurement error. Many analysts who
have estimated equations using the HHI have been sensitive to this and have attempted
to deal with the problem, usually through the use of instrumental variables. As always,
the resulting estimates will be as good as the instruments.
The second concern regarding the reduced-form approaches is that market structure
is endogenous.37 There likely are unobservables, such as the quality of the services
37 The problem of endogenous market structure is not unique to reduced-form methods. Structural approaches
generally simply assume fixed market structure, and so they also face the challenge of estimating models when
market structure is endogenous.
535Competition in Health Care Markets
provided, or unobserved cost differences, that will be correlated with price and market
structure. For example, if price is not appropriately adjusted for quality, then standard
regression analysis of concentration on hospital price will yield biased coefficients.
Some of this concern can be mitigated by estimating a multinomial model of hospital
choice and using the estimates to construct hospital-specific measures of market con-
centration. Kessler and McClellan (2000) and Gowrisankaran and Town (2003) develop
such an approach to construct measures of market concentration and much of the
recent literature has moved to constructing hospital-specific versions of the HHI. These
HHI measures are generally the weighted (by hospital patient shares) zip code HHIs.
More generally, instrumental variable approaches can be employed to deal with the
endogeneity problem, including the approach just described.
The third issue is that hospitals sell differentiated products, and traditional
approaches to calculating the HHI do not account for this differentiation. The hospital-
specific measures described above constitute an ad hoc approach to dealing with this
problem. The LOCI measure described above is a competition index explicitly derived
for differentiated products oligopoly.
Fourth, reduced-form approaches generally require specifying a geographic market.
This often relies on geopolitical boundaries (e.g. counties or Primary Metropolitan
Statistical Areas (PMSAs)) to define the market. Geopolitical boundaries are unlikely to
correspond to market definitions, and thus this approach will generate measurement error.
As mentioned above, many recent SCP approaches construct a hospital-specific measure
of the HHI by measuring the HHI at the zip code level and taking a share weighted aver-
age across zip codes to construct the hospital’s HHI. This approach to calculating the HHI
mitigates, at least to some degree, the third and fourth criticisms listed above.
The principal challenge in estimating models of hospital price competition is con-
structing an accurate measure of hospital price. Hospital contracts with insurers are
generally complicated and have numerous prices for different services. In general,
there are three classes of contracts: DRG-based, per-diem, and percent of charges. It
is common for hospital contracts to contain combinations of these approaches. For
example, a hospital/insurer contract might have a DRG structure for general medical/
surgical services and “carve-out” obstetrics using a per-diem formulation. These
contracts give hospitals different incentives for resource use. Anecdotally, bargaining
leverage appears to play a significant role in the determination of the contract
form, with hospitals preferring contracts with lower-powered incentives and insurers
preferring higher-powered contracts.
There is little work that considers the role of competition in determining
insurer�hospital contract structure.38 In their analysis of insurer contracts for transplant
38 Town et al. (2011) examine the degree of physician risk-bearing in their contracts with health insurers. They find
that physicians facing less competition are more likely to have fee-for-service contracts.
536 Martin Gaynor and Robert J. Town
services, Bajari et al. (2010) find that the majority of hospital contracts rely on a
non-linear, percent of charges structure. Because of the complexity of insurer�hospital
contracts, in most circumstances actual administrative claims data used to adjudicate
payments between hospitals and insurers will provide the best measure of price.
Constructing price using administrative claims requires adjusting for differential severity
and types of services. Unfortunately, administrative claims data from payers and hospitals
are not widely available. Researchers more commonly use measures of price
constructed from state mandated hospital financial reports. Capps and Dranove (2004),
Tenn (2011), Haas-Wilson and Garmon (2011), Thompson (2011), Ginsburg (2010),
and Brand et al. (2011) are a subset of the papers that use insurer claims data to
construct prices in this way.
Table 9.8 presents a summary of the reduced form papers published since 2000.
This literature has moved away from primarily using data from California which,
because of data availability issues, was the primary data source for prior work. All but
one of the papers listed in this table finds a positive relationship between hospital
concentration and price. Not surprisingly, this relationship appears to be a function of
the structure of the health plan. Specifically, during the rise of MCOs during the
1990s, this relationship strengthened and the growth in the correlation appears to
wane during the managed care backlash. In addition, the correlation is stronger in
markets with high MCO penetration or in areas with a large number of managed care
organizations. The relationship between price and measures of market structure also
holds in other countries. Halbersma et al. (2010) find hospital�insurer prices are
positively correlated with hospital concentration and negatively correlated with insurer
concentration after the introduction of market-based health care reforms in the
Netherlands in 2004.
3.2.2. Estimates of the Impact of Consummated Mergers on PriceThe second popular approach to the analysis of the impact of hospital mergers is to
study the impact of consummated mergers. The analysis of actual mergers has obvious
appeal. The variation in market structure is driven by the phenomenon of primary
interest. Understanding the outcomes of past hospital mergers speaks directly to the
role of competition and the impact of consolidation on hospital prices, and ultimately
downstream health care consumers. Studying consummated mergers also suggests a
natural estimation strategy. Most of the papers in this literature rely on a difference-in-
difference research design in which the merging hospitals (or sometimes their close
rivals) are the treatment group and researchers locate other hospitals to use as controls.
In an effort to better understand the appropriate merger enforcement strategy,
the Federal Trade Commission has embarked on a program to retrospectively study
consummated mergers. The results of these studies are published in a recent issue of
International Journal of the Business of Economics.
537Competition in Health Care Markets

Table 9.8 Summary of Hospital Price-Concentration LiteratureStudy Primary Data Source,
Services, Location andTime Period
Measures of MarketStructure/Price
Empirical Approach Results
Akosa
Antwi
et al.
(2009)
OSHPD; Inpatient;
CA; 1999�20025
County-level HHI;
average net revenue
per discharge
Graphical analysis of price
growth trends
Prices increased 2-fold over
period and growth is
highest in monopoly
markets; however, changes
in market structure are not
associated with differential
price growth
Burgess
et al.
(2005)
AHA, OSHPD,
inpatient; CA;
1994�1998
Average net private
revenue per private
discharge; hospital
system HHI is
weighted average zip
code HHI
Estimate GEE to account for
within-hospital
correlations
Hospital system HHI is
positively correlated with
price
Dranove
et al.
(2008)
OSHPD, Florida
State Center for
Health Statistics;
AHA; inpatient; CA
and FL; 1990�2003
Hospital system HHI
based on actual and
predicted patient
flows
OLS and IV regression of
price on concentration
and measure of MC
intensity
The association between
concentration and price
increased during the 1990s
and leveled off during the
2000s
Melnick
and
Keeler
(2007)
OSHPD, AHA; inpatient;
CA; 1999�2003
Average net private
revenue per private
discharge; hospital
system HHI is
weighted average zip
code HHI
Linear regression of log price
on concentration indexes
and system indicators
System HHI is positively
associated with price
growth; hospitals in large
systems experienced
higher price growth
Moriya
et al.
(2010)
MedStat insurance
claims, AHA data; all
inpatient; US;
2001�2003
HHI calculated using
AHA data, DRG-
adjusted prices from
claims data
Estimate the relationship
between insurer/hospital
concentration and price
using OLS w/market FE
Insurer concentration is
negatively associated with
hospital prices; hospital
(Continued )
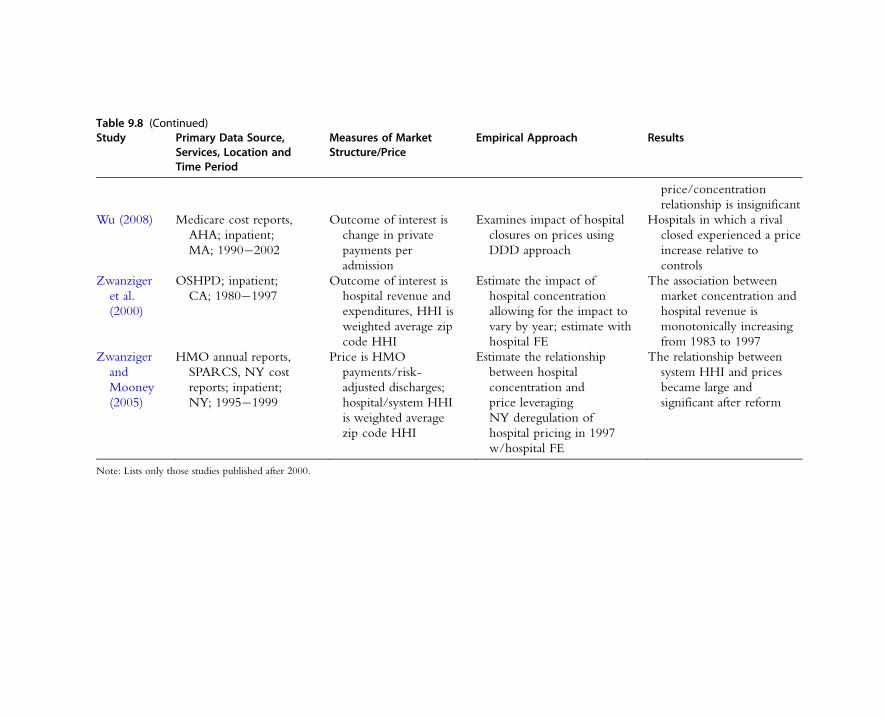
Table 9.8 (Continued)Study Primary Data Source,
Services, Location andTime Period
Measures of MarketStructure/Price
Empirical Approach Results
price/concentration
relationship is insignificant
Wu (2008) Medicare cost reports,
AHA; inpatient;
MA; 1990�2002
Outcome of interest is
change in private
payments per
admission
Examines impact of hospital
closures on prices using
DDD approach
Hospitals in which a rival
closed experienced a price
increase relative to
controls
Zwanziger
et al.
(2000)
OSHPD; inpatient;
CA; 1980�1997
Outcome of interest is
hospital revenue and
expenditures, HHI is
weighted average zip
code HHI
Estimate the impact of
hospital concentration
allowing for the impact to
vary by year; estimate with
hospital FE
The association between
market concentration and
hospital revenue is
monotonically increasing
from 1983 to 1997
Zwanziger
and
Mooney
(2005)
HMO annual reports,
SPARCS, NY cost
reports; inpatient;
NY; 1995�1999
Price is HMO
payments/risk-
adjusted discharges;
hospital/system HHI
is weighted average
zip code HHI
Estimate the relationship
between hospital
concentration and
price leveraging
NY deregulation of
hospital pricing in 1997
w/hospital FE
The relationship between
system HHI and prices
became large and
significant after reform
Note: Lists only those studies published after 2000.
Despite its appeal, there are a number of challenges to implementing merger case
study analysis. Principal among these challenges is defining a sensible set of control
group hospitals. Over the last decade hospital inflation has been significant and
persistent—the producer price index for hospitals increased on average 3.8 percent
per year. Thus, simply examining pre-post-hospital prices may lead to misleading
inferences regarding the underlying change in the competitive environment
induced by the merger. In addition, a merger may change the quality or the set of ser-
vices provided by the merging hospitals, which may also affect inference. The set of
control hospitals should have cost and demand shocks that mimic what would have
happened to the merging hospitals under the counterfactual that the merger did not
take place.
In their study of the impact of the Evanston Northwestern Healthcare and
Highland Park Hospital merger and the St. Therese Medical Center and Victory
Memorial Hospital, Haas-Wilson and Garmon (2011) used the non-federal general
acute-care hospitals in the Chicago Primary Metropolitan Statistical Area that were
not involved in mergers over the relevant time period. However, as is clear from the
pricing equation (9.7) from our bargaining model, hospital mergers will affect the
prices of competitors. That is, a hospital merger that leads to increased bargaining
power will also spill over and increase the prices of competing hospitals that are not
party to the merger. Using a set of control group hospitals that are geographically
proximate to the merging hospital will control for local demand and cost shocks, but
risks inducing a downward bias in the estimated impact due to the spillover effect.
Using hospitals that are not proximate as a control group reduces the bias from spil-
lovers, but increases the likelihood that demand and costs shocks will not be ade-
quately controlled.
Table 9.9 provides a summary of the papers examining the impact of consummated
mergers on estimated prices. There are several patterns worth noting. Because of the
size of this literature, we do not have the space to discuss in detail all of the papers,
and therefore highlight the patterns and the papers that are particularly noteworthy.
First, the large number of hospital mergers in concentrated markets provides many
opportunities for the examination of price effects of mergers. This is reflected in the
numbers of papers (nine in total) that estimate merger price effects. In the broad
industrial organization literature, the number of papers devoted to examining pricing
behavior post-merger is rather limited.39 Second, on average, the impact of consolida-
tion on prices is positive and large. Third, while the average impact is large, there
does seem to be heterogeneity across health plans in the change in the post-
merger negotiated price. The model presented above can account for this heterogene-
ity in a limited way through changes in the bargaining leverage parameters that occur
39 This literature has focused primarily on mergers in the airline and banking industries.
540 Martin Gaynor and Robert J. Town
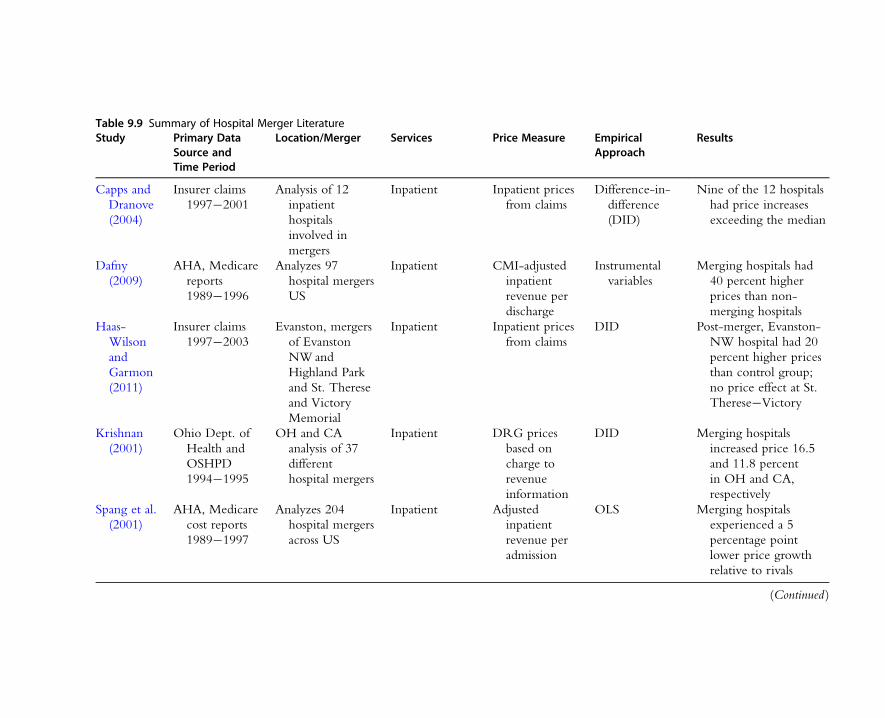
Table 9.9 Summary of Hospital Merger LiteratureStudy Primary Data
Source andTime Period
Location/Merger Services Price Measure EmpiricalApproach
Results
Capps and
Dranove
(2004)
Insurer claims
1997�2001
Analysis of 12
inpatient
hospitals
involved in
mergers
Inpatient Inpatient prices
from claims
Difference-in-
difference
(DID)
Nine of the 12 hospitals
had price increases
exceeding the median
Dafny
(2009)
AHA, Medicare
reports
1989�1996
Analyzes 97
hospital mergers
US
Inpatient CMI-adjusted
inpatient
revenue per
discharge
Instrumental
variables
Merging hospitals had
40 percent higher
prices than non-
merging hospitals
Haas-
Wilson
and
Garmon
(2011)
Insurer claims
1997�2003
Evanston, mergers
of Evanston
NWand
Highland Park
and St. Therese
and Victory
Memorial
Inpatient Inpatient prices
from claims
DID Post-merger, Evanston-
NW hospital had 20
percent higher prices
than control group;
no price effect at St.
Therese�Victory
Krishnan
(2001)
Ohio Dept. of
Health and
OSHPD
1994�1995
OH and CA
analysis of 37
different
hospital mergers
Inpatient DRG prices
based on
charge to
revenue
information
DID Merging hospitals
increased price 16.5
and 11.8 percent
in OH and CA,
respectively
Spang et al.
(2001)
AHA, Medicare
cost reports
1989�1997
Analyzes 204
hospital mergers
across US
Inpatient Adjusted
inpatient
revenue per
admission
OLS Merging hospitals
experienced a 5
percentage point
lower price growth
relative to rivals
(Continued )
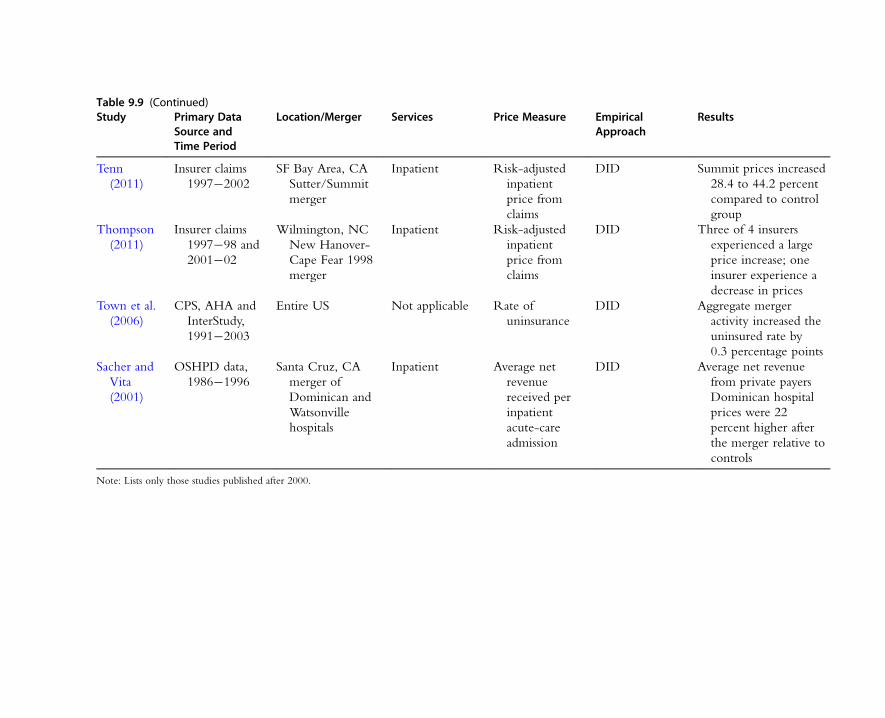
Table 9.9 (Continued)Study Primary Data
Source andTime Period
Location/Merger Services Price Measure EmpiricalApproach
Results
Tenn
(2011)
Insurer claims
1997�2002
SF Bay Area, CA
Sutter/Summit
merger
Inpatient Risk-adjusted
inpatient
price from
claims
DID Summit prices increased
28.4 to 44.2 percent
compared to control
group
Thompson
(2011)
Insurer claims
1997�98 and
2001�02
Wilmington, NC
New Hanover-
Cape Fear 1998
merger
Inpatient Risk-adjusted
inpatient
price from
claims
DID Three of 4 insurers
experienced a large
price increase; one
insurer experience a
decrease in prices
Town et al.
(2006)
CPS, AHA and
InterStudy,
1991�2003
Entire US Not applicable Rate of
uninsurance
DID Aggregate merger
activity increased the
uninsured rate by
0.3 percentage points
Sacher and
Vita
(2001)
OSHPD data,
1986�1996
Santa Cruz, CA
merger of
Dominican and
Watsonville
hospitals
Inpatient Average net
revenue
received per
inpatient
acute-care
admission
DID Average net revenue
from private payers
Dominican hospital
prices were 22
percent higher after
the merger relative to
controls
Note: Lists only those studies published after 2000.
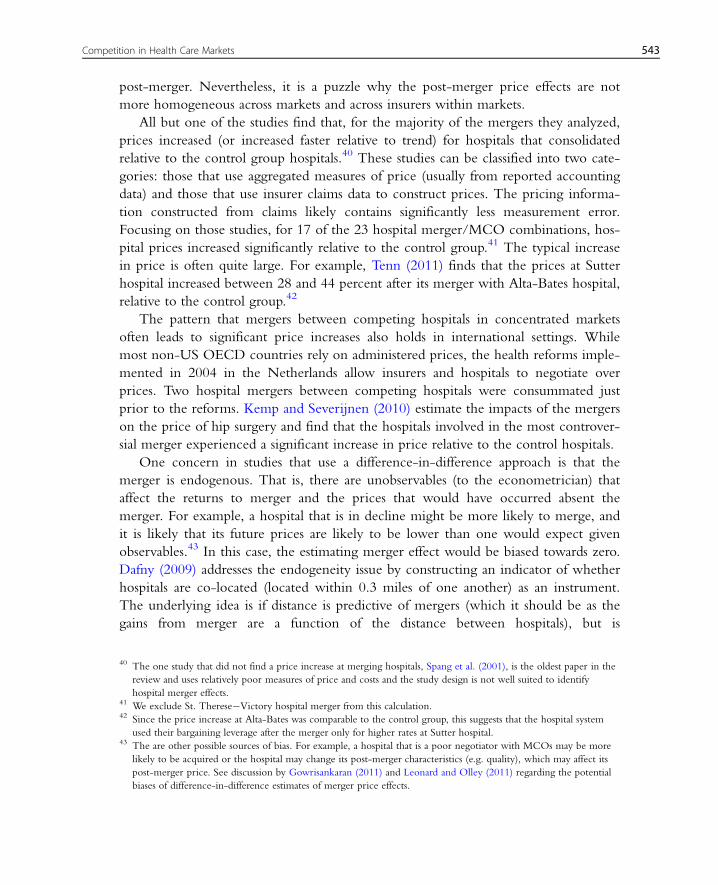
post-merger. Nevertheless, it is a puzzle why the post-merger price effects are not
more homogeneous across markets and across insurers within markets.
All but one of the studies find that, for the majority of the mergers they analyzed,
prices increased (or increased faster relative to trend) for hospitals that consolidated
relative to the control group hospitals.40 These studies can be classified into two cate-
gories: those that use aggregated measures of price (usually from reported accounting
data) and those that use insurer claims data to construct prices. The pricing informa-
tion constructed from claims likely contains significantly less measurement error.
Focusing on those studies, for 17 of the 23 hospital merger/MCO combinations, hos-
pital prices increased significantly relative to the control group.41 The typical increase
in price is often quite large. For example, Tenn (2011) finds that the prices at Sutter
hospital increased between 28 and 44 percent after its merger with Alta-Bates hospital,
relative to the control group.42
The pattern that mergers between competing hospitals in concentrated markets
often leads to significant price increases also holds in international settings. While
most non-US OECD countries rely on administered prices, the health reforms imple-
mented in 2004 in the Netherlands allow insurers and hospitals to negotiate over
prices. Two hospital mergers between competing hospitals were consummated just
prior to the reforms. Kemp and Severijnen (2010) estimate the impacts of the mergers
on the price of hip surgery and find that the hospitals involved in the most controver-
sial merger experienced a significant increase in price relative to the control hospitals.
One concern in studies that use a difference-in-difference approach is that the
merger is endogenous. That is, there are unobservables (to the econometrician) that
affect the returns to merger and the prices that would have occurred absent the
merger. For example, a hospital that is in decline might be more likely to merge, and
it is likely that its future prices are likely to be lower than one would expect given
observables.43 In this case, the estimating merger effect would be biased towards zero.
Dafny (2009) addresses the endogeneity issue by constructing an indicator of whether
hospitals are co-located (located within 0.3 miles of one another) as an instrument.
The underlying idea is if distance is predictive of mergers (which it should be as the
gains from merger are a function of the distance between hospitals), but is
40 The one study that did not find a price increase at merging hospitals, Spang et al. (2001), is the oldest paper in the
review and uses relatively poor measures of price and costs and the study design is not well suited to identify
hospital merger effects.41 We exclude St. Therese�Victory hospital merger from this calculation.42 Since the price increase at Alta-Bates was comparable to the control group, this suggests that the hospital system
used their bargaining leverage after the merger only for higher rates at Sutter hospital.43 The are other possible sources of bias. For example, a hospital that is a poor negotiator with MCOs may be more
likely to be acquired or the hospital may change its post-merger characteristics (e.g. quality), which may affect its
post-merger price. See discussion by Gowrisankaran (2011) and Leonard and Olley (2011) regarding the potential
biases of difference-in-difference estimates of merger price effects.
543Competition in Health Care Markets
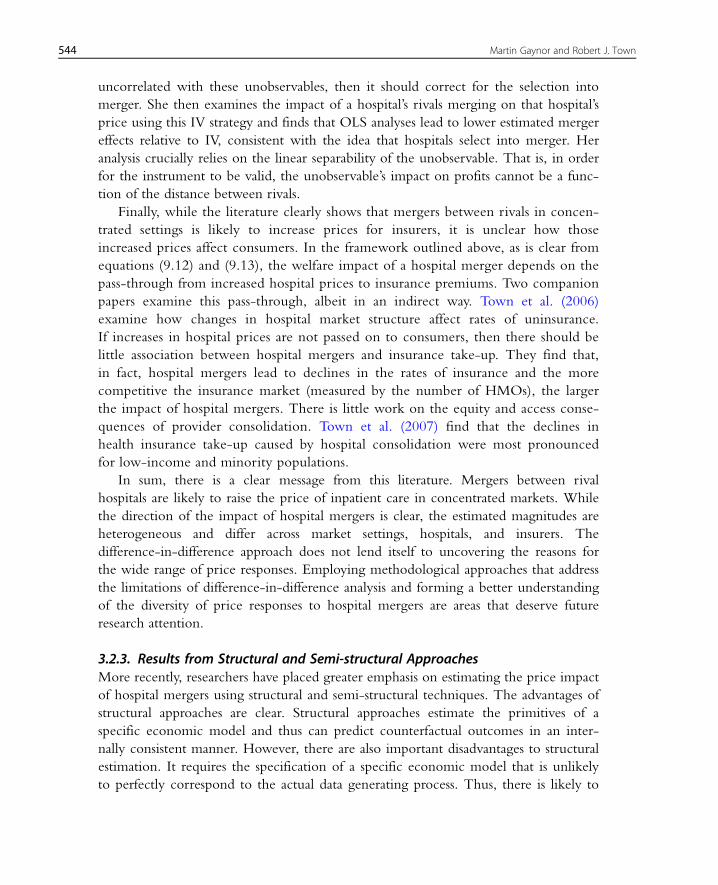
uncorrelated with these unobservables, then it should correct for the selection into
merger. She then examines the impact of a hospital’s rivals merging on that hospital’s
price using this IV strategy and finds that OLS analyses lead to lower estimated merger
effects relative to IV, consistent with the idea that hospitals select into merger. Her
analysis crucially relies on the linear separability of the unobservable. That is, in order
for the instrument to be valid, the unobservable’s impact on profits cannot be a func-
tion of the distance between rivals.
Finally, while the literature clearly shows that mergers between rivals in concen-
trated settings is likely to increase prices for insurers, it is unclear how those
increased prices affect consumers. In the framework outlined above, as is clear from
equations (9.12) and (9.13), the welfare impact of a hospital merger depends on the
pass-through from increased hospital prices to insurance premiums. Two companion
papers examine this pass-through, albeit in an indirect way. Town et al. (2006)
examine how changes in hospital market structure affect rates of uninsurance.
If increases in hospital prices are not passed on to consumers, then there should be
little association between hospital mergers and insurance take-up. They find that,
in fact, hospital mergers lead to declines in the rates of insurance and the more
competitive the insurance market (measured by the number of HMOs), the larger
the impact of hospital mergers. There is little work on the equity and access conse-
quences of provider consolidation. Town et al. (2007) find that the declines in
health insurance take-up caused by hospital consolidation were most pronounced
for low-income and minority populations.
In sum, there is a clear message from this literature. Mergers between rival
hospitals are likely to raise the price of inpatient care in concentrated markets. While
the direction of the impact of hospital mergers is clear, the estimated magnitudes are
heterogeneous and differ across market settings, hospitals, and insurers. The
difference-in-difference approach does not lend itself to uncovering the reasons for
the wide range of price responses. Employing methodological approaches that address
the limitations of difference-in-difference analysis and forming a better understanding
of the diversity of price responses to hospital mergers are areas that deserve future
research attention.
3.2.3. Results from Structural and Semi-structural ApproachesMore recently, researchers have placed greater emphasis on estimating the price impact
of hospital mergers using structural and semi-structural techniques. The advantages of
structural approaches are clear. Structural approaches estimate the primitives of a
specific economic model and thus can predict counterfactual outcomes in an inter-
nally consistent manner. However, there are also important disadvantages to structural
estimation. It requires the specification of a specific economic model that is unlikely
to perfectly correspond to the actual data generating process. Thus, there is likely to
544 Martin Gaynor and Robert J. Town
be some bias from model misspecification, and the importance of that bias is difficult
to quantify.
Semi-structural estimation approaches also have advantages and disadvantages.
They have a foundation in economic theory and estimate some of the primitives of
an economic model but do not impose a specific economic model on the estimation.
However, this flexibility has consequences, as the estimated parameters may not be
invariant to changes in costs, demand, or market structure and thus might lead to
inaccurate counterfactual predictions. It should be noted that reduced-form methods
also impose a specific data generating process: however, that data generating process is
often ad hoc and might not be consistent with any economic model. As the reduced-
form approaches do not estimate economic primitives, the coefficients may be
functions of factors that might be affected by changes in the market environment.
Thus, reduced-form approaches may also lead to poor counterfactual predictions.
The inherent limitations of any empirical approach should not deter researchers
from applying these methods—empirical nihilism is not an attractive option. In
particular, policy makers will continue to make policies that affect the outcomes of
provider markets and it is important for economists to produce the best evidence they
can on the likely impact of these policies. That will require economists to use the best
empirical tools to make inferences from the available data, understanding and probing
the limitations of their chosen empirical strategy.
Town and Vistnes (2001) and Capps et al. (2003) (CDS) are papers that first
developed semi-structural approaches consistent with the institutional framework in
which hospitals compete to estimate the price effects of hospital mergers. Let
VhðJhÞ5XiAIh
WiðJhÞ ð9:17Þ
where Wi(Jh) is defined in (9.3) and Ih is the relevant health plan population to aggre-
gate over. Equation (9.17) is the gross value to health plan enrollees of having access
to hospital network Jh. The basic idea is to structurally estimate what CDS call the
willingness-to-pay (WTP) for each hospital, WTPj5V( Jh)2V( Jh2 j), using patient
discharge data. From (9.7), hospital prices are a function of Fh( Jh)2 Fh( Jh2 j), divided
by the expected number of patients from that payer.44 The key assumption is that the
WTP measure well approximates Fh( Jh)2Fh( Jh2 j) or rather the functional relation-
ship between price and Fh(Jh)2Fh( Jh2 j) is well approximated by the functional
relationship between price (or profits) and the WTP.
With the WTP measure in hand the researcher can then regress WTP on prices or
hospital profits. This is done by first estimating a multinomial logit hospital choice
44 If price is the dependent variable then the appropriate measure of WTP will be normalized by the expected
volume of patients. The dependent variable in CDS is profits and thus their WTP measure is based on the
aggregate gross value of the network.
545Competition in Health Care Markets

model using patient discharge data. These data contain information on the hospital
where the patient was admitted, home zip code, diagnosis, and patient demographics,
which allow the estimation of θ in equation (9.2). With an estimate of θ and illness
severity weights, it is straightforward to calculate WTP using (9.3). Given the esti-
mates from this model, the values of Wi(Jh)2Wi(Jh2 j) are calculated and then the
WTP is calculated by integrating over the probability of each illness for each individ-
ual, using the empirical distribution of illnesses in the data. The fundamental assump-
tion is that the hospital system threatens to pull all of the hospitals from the insurer’s
system if an agreement is not reached at any of its hospitals.
To calculate the price impact of a merger between hospitals j and k one can simply
compute the new value of WTPj1 k5V(Jh)2V(Jh2 (j1 k)) and use the regression esti-
mates to compute the post-merger price increase. Let θ be the coefficient on WTP.
The impact of the merger is determined by the net increase in bargaining leverage:
θ(ΣiV(Jh2 j)1V(Jh2 k)2V(Jh2 (j1 k))). Compared to pure reduced form approaches,
the primary advantage of this approach is that it is more closely grounded in the
underlying theory.
While the semi-structural approach is better grounded in the theory, and can be
thought of as a reduced-form approximation to a number of different bargaining
games, the estimation is nevertheless not tied to a specific theory that predicts this
particular functional relationship. Thus, the residuals from the regression have no
structural interpretation. The residuals capture all factors that affect price but are not
included in the observables, which could include bargaining ability, unobserved costs,
or complementary organizational assets (e.g. the ownership of physician groups, or
health plans).
In calculating the expected post-merger price increase of a merger between hospi-
tals j and k, one needs to make assumptions regarding the appropriate treatment of the
residuals. One possible approach is to calculate the change in the fitted prices and use
that change as the predicted price change from the merger. Another approach would
be to take the average of j and k’s residuals and apply them to the newly formed hos-
pital. Finally, if there are important asymmetries between hospitals j and k (e.g. one
hospital is part of an existing large system and one hospital is a stand-alone commu-
nity hospital), one might reasonably apply the residual from the large system to all
hospitals in calculating the price increase. Here the price increase would then account
for both increases in the bargaining leverage due to the merger, as well as the impact
of organizational-specific attributes that affect price (e.g. better bargaining skill, the
ownership of complementary assets). In addition, another important limitation to this
approach is that it assumes that there is no spillover effect of the merger on the pricing
behavior of other hospitals in the market (i.e. it only allows for unilateral effects).
Town and Vistnes (2001) acquired data on negotiated price between two MCOs
and hospitals in Southern California to estimate the relationship between the net value
546 Martin Gaynor and Robert J. Town
that a hospital brings to the network and price. One of the challenges in estimating
bargaining models is specifying the counterfactual outcome that would occur if the
hospital and MCO fail to reach an agreement. In the bargaining framework outlined
above, the disagreement outcomes are quite simple and only consider the possibility
that the hospital is dropped from the network without replacement. However, there
are other possible counterfactual networks that could arise under a disagreement.
Town and Vistnes consider two counterfactual disagreement outcomes to estimate
the parameters. The first counterfactual is that absent an agreement, the MCO will
simply exclude the hospital from the network. The second counterfactual they
consider is that MCOs will contract with the closest hospital not currently in the
network. They then estimate a switching regression model in which one of these two
counterfactuals determines the bargaining leverage of the hospital, and hence will
determine the negotiated price. They find that hospitals with higher bargaining power
(as measured by these two counterfactuals) negotiate higher prices. They also run
merger counterfactuals, and their results indicate that mergers between neighboring
hospitals can lead to significant increases in hospital prices, even in an urban environ-
ment with many other competing hospitals.
CDS use data from San Diego, CA, to estimate the relationship between WTP
and hospital bargaining leverage. They calculate WTP as described above and regress
it against hospital profits. Rearranging (9.7) and aggregating over MCOs, hospital
profits will be a complicated function of the WTP. They find a strong positive correla-
tion between WTP and hospital profits—a one unit increase in WTP increases
hospital profits by $2,233. This implies that hospitals that are more attractive to
consumers have greater bargaining power, and hence earn substantially higher profits.
Lewis and Pflum (2011) expand upon the CDS framework. They estimate a hospital
cost function and specify a simple bargaining model and find that WTP is correlated
with market power. They also find that systems operating in multiple markets have
higher bargaining power, indicating that focusing only on local markets in evaluating
the potential effect of a merger may be insufficient. A hospital’s physician
arrangements and other characteristics can also have a significant effect on its
bargaining power.
Several papers take a significantly more structural approach to examining hospital
competition. Gaynor and Vogt (2003) take a different approach to structurally estimat-
ing the impact of hospital mergers. They adapt the structural models of Berry et al.
(1995) (BLP), who developed an estimation framework for differentiated products
consumer goods to the hospital industry. In both cases the products are differentiated,
but individuals pay directly for consumer goods, without the intermediate step of
health plans. The Gaynor and Vogt (2003) approach modifies the utility model in
equation (9.2) so that total price paid by the insurer is an argument in the utility func-
tion, and thus affects hospital choices. The interpretation is that this is a reduced-form
547Competition in Health Care Markets

choice function incorporating the objectives of consumers and insurers.45 They
specify a supply side, allowing for differences between NFP and FP hospitals.
Gaynor and Vogt use data from hospital discharge and financial data from
California. They use the discharge data to estimate a multinomial logit model of hos-
pital choice, and use data on hospital revenues to construct a measure of prices. They
estimate the average elasticity of demand faced by a hospital to be 24.85, and find
that hospitals are highly spatially differentiated—cross-price elasticities fall sharply with
the distance between two hospitals. NFP hospitals set lower prices than FPs, but mark
up prices over marginal costs by the same amount. They then go on to simulate the
impact of a hospital merger in San Luis Obispo, California, and predict that hospital
prices would increase by up to 53 percent, with no significant difference in merger
effects if the merging hospitals are NFP or FP. The advantage of using this approach is
that it allows for a rich model of consumer demand, direct information on hospital
costs is not necessary, and given the data and the parameter estimates, it is straightfor-
ward and transparent to calculate the impact of a merger of prices.
This posted price BLP model is fairly different from a bargaining model. BLP-style
models have been widely applied to examine mergers for many other industries.46
There are two issues with adapting BLP-style estimation to the hospital industry. First,
using a BLP approach requires obtaining an accurate estimate of the price elasticity of
demand from the choices of consumers. Yet consumers rarely pay different out-of-
pocket prices for different hospitals in-network so it is not entirely clear how the vari-
ation in hospital prices affects consumer choice. Second, in general, BLP models
assume a Bertrand price equilibrium. However, as noted by Grennan (2010), the
Bertrand price equilibrium is a special case of the Nash bargaining equilibrium with
β5 1 and no price discrimination. If β, 1, imposing a Bertrand equilibrium will lead
to misspecification. Of course, all models are simplifications and thus are necessarily
misspecified, so it is unclear how important this misspecification is for merger analysis.
Given that bargaining models can be complicated and also subject to misspecification,
one way to think about the posted price model is that it is a reduced-form way of
capturing a complicated underlying bargaining relationship.
Ho (2009b) represents a significant breakthrough in the modeling of hospital
competition. The key insight she develops is that given consumer preferences over
MCO characteristics (including the structure of its hospital network), and the realized
hospital network, one can estimate the parameters of the hospital profit function. She
45 Gaynor and Vogt prove that, under fairly general conditions, insurers, in effect, act on behalf of consumers. In this
case the demand function they estimate recovers consumer preferences. Consumers may not pay differential prices
at the point of choosing a hospital, but they do pay higher premiums if hospital prices are higher. Insurers’
objectives are not affected by hospital characteristics, but they must attract consumers who do care about these
factors.46 For example, see Nevo (2000).
548 Martin Gaynor and Robert J. Town

estimates a hospital choice model and uses those parameter estimates to construct V
(Jm) (where the m subscripts insurers) for each hospital and each insurer for the large
metropolitan areas in the US. She also uses the parameters to construct counterfactual
V(Km), where Jm 6¼ Km: the values associated with alternative hospital networks. With
the measures of V(Jm) in hand, she then posits that insurers compete in static Nash
equilibrium in prices and estimates the utility parameters of insurer choice using the
approach of BLP, where V(Jm) is included as an argument in the consumer’s utility
function.
In Ho’s model, all hospitals make simultaneous take-it-or-leave-it offers to all plans
in the market. Then, all plans simultaneously respond. MCOs select the hospital net-
work that maximizes profits relative to counterfactual network configurations. That is,
E(πm(V(Jm))$E(πm(V(Km)) ’Km 6¼ Jm where π denotes the profits for MCO m.
These profits are the revenues the MCO earns, given its hospital network, less the
payments made to the hospitals in its network.
This observation suggests the use of an inequality method of moments estimator
developed by Ho and co-authors (Pakes et al., 2006). While the underlying econo-
metric theory is non-trivial, the basic idea behind this estimator is straightforward.
Given a set of instruments which help address measurement error, the estimator
finds the set of parameters that result in the observed network producing the highest
expected profits relative to other counterfactual hospital networks.47 The challenge
is to construct profit functions for counterfactual networks that are consistent with
the underlying bargaining model. Ho assumes “passive beliefs”—the hospital
believes that the MCO will not change its beliefs about the offers the hospital
makes to other MCOs were it to receive the counterfactual offer. Instead of positing
a structural approach to hospital profits, she specifies a reduced-form hospital
profit function where a hospital’s profits are a function of the number of expected
admissions, market and hospital characteristics. Ho does not have access to hospital
pricing information, which limits the ability to directly estimate the bargaining
model.
Ho finds that hospitals in systems take a larger fraction of the surplus and also
penalize plans that do not contract with all members. Hospitals that are attractive to
consumers also capture high markups, and hospitals with higher costs per patient
receive lower markups per patient than other providers. The limitation of Ho’s
approach is that it is not directly applicable to analyzing the impact of hospital mergers
or other changes in hospital market structure. For example, in her framework, two
hospital systems that merge would not affect the equilibrium surplus division, and
thus would not have an impact on prices. In related work, Ho (2006) notes that the
realized equilibrium selective network may be inefficient. Under selective contracting,
47 The parameters are only set identified.
549Competition in Health Care Markets
hospitals contract with a subset of the hospitals in the market, thus limiting the choice
set of the patient when they select an MCO.
Brand et al. (2011) use both semi-structural and structural approaches to estimate
the impact of a proposed hospital merger in Northern Virginia between the large
1,800-bed INOVA hospital system and Prince William Hospital, a 170-bed facility in
Manassas, VA. The FTC challenged this merger in 2006 and the parties abandoned
the transaction. In their structural work, Brand et al. (2011) manipulate an equation
similar to (9.7) to recover bargaining and cost parameters and then use pricing
relationships similar to those in equations (9.8) and (9.10) to calculate the impact of
the merger.
Pakes (2010) furthers the ideas in Ho (2009b) and Pakes et al. (2006) by examining
the MCO/hospital network formation decision, allowing for richer error structures.
Again, the underlying idea is that the revealed choice of the insurer network can be
used to infer deeper parameters of the hospital profit function. While the focus of
Pakes’s work is methods development, the estimation and simulation results reveal
interesting patterns. In the simulation results he computes the full in formation Nash
equilibrium for the game in which hospitals make take-it-or-leave-it offers to insurers
and insurers decide whether to accept or reject the offers. The equilibrium margins
for hospitals are decreasing in the excess capacity and costs relative to the other
hospitals in the market. The hospital’s margins are increasing in the insurer’s margins.
The structural analysis of buyer�seller networks is a young and quickly evolving
literature. While this literature is relatively new, the underlying policy implications of
these papers is similar to the other strands of the literature. Hospitals (particularly
those in systems) can acquire and exercise market power. The availability of
high-quality data sets combined with recent theoretic and econometric advances point
to this line of work leading to important findings in the near future.
3.2.4. Not-for-profit Firm BehaviorThe hospital sector is characterized by the fact that there is a mixture of firms with
different ownership types. Not-for-profits are the most common, but there are sub-
stantial numbers of for-profit hospitals and public hospitals. Interesting questions arise
in this context about differences in behavior between for-profit and not-for-profit
firms (and publics), and the impact of the mixture of different types of firms in a mar-
ket on firm conduct.
Some of the studies we have already reviewed (e.g. Capps et al., 2003; Gaynor and
Vogt, 2003) have addressed the issue of not-for-profit/for-profit differences in com-
petitive conduct. Those studies do not find any significant differences in pricing
behavior. A recent study by Capps et al. (2010a) examines whether not-for-profit
hospitals are more likely than for-profit hospitals to offer more charity care or
unprofitable services in response to an increase in market power. The implication is
550 Martin Gaynor and Robert J. Town

that, if there were such a difference, not-for-profits would be spending their profits
from market power on socially beneficial activities. Capps et al. examine seven years
of data on California hospitals and find no evidence of any such differences—not-for-
profits do not engage in any more socially beneficial activities than do for-profits
when they possess market power.
Dafny (2005) asks whether hospitals engage in “upcoding,” choosing more
profitable diagnosis codes for patients when the profitability of doing so increases. She
uses a 1988 policy reform that generated large price increases for many, but not all,
Medicare admissions and finds evidence of substantial upcoding by hospitals. This is
much more pronounced among for-profit hospitals than among not-for-profits.
Duggan (2000) uses an increase in government reimbursements for treating indi-
gent patients to test for differences in behavior between for-profit, not-for-profit, and
public hospitals. He finds that both for-profit and not-for-profit hospitals responded
strongly to the financial incentives in the policy. Both types of private hospitals treated
the most profitable indigent patients and avoided unprofitable ones. Public hospitals’
behavior did not change. In addition, both for-profit and not-for-profit hospitals used
the revenues from the indigent care program to increase financial assets, as opposed to
improve medical care for the poor.
Duggan (2002) uses the same government policy as in his previous paper to iden-
tify behavior. In this paper he is concerned with the mix of hospital ownership types
and impacts on behavior. He finds that not-for-profit hospitals located in areas with
many for-profit hospitals were substantially more responsive to the changed financial
incentives than not-for-profit hospitals located in areas with few for-profits. A fruitful
area for future research may be to further examine the determinants of the mix of
ownership types and impacts on other types of conduct.
3.2.5. Impact of Hospital Mergers on CostsIt is clear that mergers can result in efficiencies because of economies of scale,
increased purchasing power, the ability to consolidate services, or the transfer of man-
agerial techniques and skill to the acquired hospital. Williamson (1968) noted that
mergers that result in significant market power but also lead to meaningful reductions
in marginal costs can be welfare improving. However, mergers also have the potential
to increase costs. Larger systems imply larger bureaucracies. In addition, hospital costs
are not necessarily exogenous to market structure. Hospitals that are able to bargain
for higher prices may have the incentive to use the resulting profits for the benefit of
physicians and hospital executives (e.g., through capital expenditures that benefit phy-
sicians or increases in executive compensation or perks). This is particularly likely
if there is no residual claimant (as is the case for not-for-profit organizations) or moni-
toring by the residual claimant is costly. Thus, the analysis of the cost impacts is central
to understanding the impact of hospital mergers. The evidence presented above suggests
551Competition in Health Care Markets
that, on average, hospital mergers result in increases in price. Consequently if there
are significant cost reductions associated with mergers they are not passed onto the
purchasers of hospital services in the form of lower prices.
The analysis of the impact of hospital mergers and acquisitions on cost faces a
notable challenge in finding accurate and reliable measures of costs. Medicare Cost
Reports and state financial data are the primary source of cost data, but these data
generally lump inpatient and outpatient expenditures into one category, are not easily
adjusted for changes in patient severity, and are subject to the vagaries of accounting
methodologies. Dranove and Lindrooth (2003) is the most convincing analysis. Using
data on mergers of previously independent hospitals that consolidate financial
reporting and operate under a single license post-merger, they find that, on average,
these hospitals experience post-merger cost decreases of 14 percent. System mergers
in which the hospitals were not as fully integrated (as measured by the use of multiple
licenses) did not realize cost savings. These findings suggest that integration of
merging hospitals is necessary to achieve meaningful efficiencies. Harrison (2010) uses
AHA data to examine differences in expected hospital costs, and finds that
immediately following a merger costs declined, but eventually rose to pre-merger
levels. This finding is difficult to reconcile with the view that mergers require signifi-
cant upfront costs but have benefits that accrue in later years. In sum, the evidence
discussed above suggests that mergers between competitors in concentrated markets
lead to hospital price increases. That is, on average hospital mergers in these circum-
stances do not appear to generate enough efficiencies to offset the gains in market
power. The circumstances in which mergers are most likely to result in meaningful
cost decreases are those in which the merging facilities operate as a more fully
integrated entity.
3.3. Recent Developments in Antitrust Enforcement and CompetitionPolicy in Health Care
3.3.1. Antitrust Developments in the USTraditionally, the hospital sector has been one of the most active areas of antitrust
enforcement.48 However, the decade of the 2000s saw a significant slowdown in the
number of US antitrust cases in the health care sector. While there were not as many
significant cases as the previous decades, there nonetheless were at least two cases that
went to trial that were important.
In a separate development, the DOJ and FTC recently revised the Horizontal
Merger Guidelines (Federal Trade Commission and Department of Justice, 1992) to
48 In this segment we review the recent case developments and refer the reader to Whinston (2007) for a more
complete discussion of recent developments in the economics of antitrust. The Department of Justice (DOJ) and
Federal Trade Commission’s (FTC) report Improving Health Care: A Dose of Competition (2004) also provides an
excellent overview of the competition policy issues in health care markets.
552 Martin Gaynor and Robert J. Town
more accurately reflect the agencies’ approach to mergers. Relative to the previously
issued versions, the revised Merger Guidelines take a more conservative and more flexi-
ble approach to merger analysis, increasing the HHI cut-off for defining “Highly
Concentrated” markets to 2,500. The Merger Guidelines also make clear that the agen-
cies use econometric and economic theory-based approaches to merger analysis, in
addition to using the traditional methodologies.
In this section we discuss these two significant antitrust developments since the
1990s as well as discussing other cases that affect the current implementation of com-
petition policy. The 1990s saw a string of losses by the US federal antitrust agencies.
As discussed in Gaynor and Vogt (2000), the federal antitrust agencies lost these cases
for two broad reasons. First, the courts sometimes have viewed the not-for-profit sta-
tus of hospitals as mitigating the anticompetitive impact of increased market power
that might accrue to hospitals because of the merger.49 Second, the courts have
tended to side with plaintiffs in accepting broad geographic market definitions or
viewing the presence of other possible competitors as sufficient to constrain the exer-
cise of market power.50
While each case brings a different set of facts, the courts’ decisions on both of
these issues run counter to the general findings from the health economics literature.
The evidence consistently shows that not-for-profit status does not affect static
hospital behavior in significant ways—not-for-profit hospitals are just as willing as
for-profits to exercise market power should they possess it. Second, hospitals are
differentiated products, where patient distance plays a major role in differentiating
hospitals. Hospital competition occurs locally, and thus mergers involving two closely
located competitors in a large urban area may result in the ability of the merged
hospitals to negotiate substantially higher prices.
The most important case in the 2000s for merger enforcement towards health
care providers is FTC v. Evanston Northwestern Healthcare Corp.51 In 2000, Evanston
Northwestern Healthcare Corporation merged with Highland Park Hospital. Both
hospitals are located in Evanston, IL, an affluent suburb of Chicago. The case was ini-
tiated as part of the FTC’s post-merger retrospective, in which they reviewed a num-
ber of hospital mergers that occurred in the late 1990s to the early 2000s. The FTC
filed suit in 2004, alleging that the merger violated Section 7 of the Clayton Act. The
Administrative Law Judge (ALJ) issued an Initial Decision finding that, “[FTC] proved
that the Challenged merger has substantially lessened competition in the product mar-
ket of general acute inpatient services [sold to managed care organizations] and in the
geographic market of the seven hospitals described above.”
49 FTC v. Butterworth Health Corp., 946 F. Supp. 1285, 1300�1301 (W.D. Mich. 1996).50 For example, see United States v. Mercy Health Services, 902 F. Supp. 968 (N.D. Iowa 1995).51 Evanston Northwestern Healthcare Corp., FTC Docket No. 9315, Initial Decision (Oct. 20, 2005), available at
http://www.ftc.gov/os/adjpro/d9315/051021idtextversion.pdf.
553Competition in Health Care Markets
The initial relief of Evanston Northwestern was to divest Highland Park hospital
and essentially re-create the market structure that existed prior to the merger. The
parties appealed the case (which is referred to the Commissioners under the FTC
administrative law process) and the Commissioners upheld the ALJ’s initial ruling but
significantly altered the relief. The Commissioners feared that the hospitals were
already too integrated to effectively de-merge and thus ruled that hospitals could
remain as a merged entity but had to maintain separate negotiating functions that
would independently negotiate with MCOs.
This case is notable for a number of reasons. First, the merger was already consum-
mated and the hospital operations had been integrated prior to the FTC’s challenge.
Because many of the functions (including insurer negotiations) had been integrated,
the impact of the merger on prices could be directly analyzed, as pre- and post-
merger insurer claims data were available to analyze. In most merger investigations,
post-merger price increases must be inferred and predicted from the available evi-
dence. In this case, the post-merger prices were available to study. Both testifying eco-
nomic experts found there was a significant post-acquisition price increase (with the
hospital’s expert finding a post-merger increase of approximately 10 percent for inpa-
tient services and the FTC expert finding significantly higher post-merger price
increases).
Second, the ALJ found that the merger increased Evanston Northwestern’s market
power in a suburban market with a number of other competing hospitals.52
Previously, the federal antitrust enforcement agencies have lost cases where, under
very plausible geographic market definitions, the merger was a two-to-one consolida-
tion. Thus, the implication is that mergers in hospital markets with several competi-
tors can lead to significant increases in price. Of course, this is consistent with the
framework outlined above, but the courts have traditionally been hesitant to embrace
the basic premise that market power can be exercised in settings with more than one
competitor. Finally, the ALJ and the Commissioners outlined an approach to analyzing
hospital mergers that explicitly accounts for the institutional features of the industry—
specifically, that hospitals and insurers engage in negotiations that determine prices,
and that an increase in market power from a given merger will be determined by the
increase in bargaining leverage.
Since the Evanston Northwestern case, the FTC has been more aggressive in chal-
lenging hospital mergers in urban and suburban settings. In 2008, the FTC challenged
INOVA’s acquisition of Prince William hospital. INOVA is a large, five-hospital
system in Northern Virginia and they sought to acquire the community hospital in
Mannasas, VA. The FTC sued to enjoin the transaction and the parties abandoned the
52 The ALJ determined the pre-merger HHI as 2,739 with an increase of 384 (assuming the shares are unchanged,
post-merger).
554 Martin Gaynor and Robert J. Town
merger soon after the FTC filed its case. In 2009, Scott and White merged with
King’s Daughter hospital—both hospitals are located in Temple, TX. The FTC staff
viewed the merger as anticompetitive; however, King’s Daughter hospital was in very
poor financial shape and would likely close soon without a merger with another hos-
pital. The FTC did not challenge the merger, as they determined that there was not
another, less anticompetitive purchaser for King’s Daughter. More recently, the FTC
has sued to stop ProMedica’s acquisition of St. Luke’s hospital. ProMedica is a large
hospital system with three hospitals in and around Toledo, OH, and St. Luke’s hospital
is located in the adjacent suburb of Maumee, OH. At this writing that case is still
being adjudicated; however, at the initial preliminary injunction hearing in the
Federal District Court the judge ruled in the FTC’s favor.53 In analyzing the competi-
tive impact of hospital mergers, the FTC has looked to the recent literature on hospi-
tal competition and is incorporating the recent approaches in its analysis.
There has been very limited enforcement regarding consolidation in outpatient
and physician services. While some of these transactions may well result in increases
in bargaining leverage and thus increases in prices, most of these transactions likely fall
below the Hart�Scott�Rodino thresholds which specify the value of the transaction
that is necessary for the parties to notify the federal antitrust agencies. However, in
2008, the FTC issued an administrative complaint challenging Carilion Clinic’s 2008
acquisition of two outpatient clinics in the Roanoke, VA, area.54 Carilion is a large
integrated health system and they had acquired an outpatient surgery center and an
imaging center. The FTC secured a consent decree from Carilion which divested the
two clinics.
Market power need not only be exercised by selling a product but can also be
used to gain lower prices on the purchase of inputs. In health care markets this can
occur when insurers have significant upstream market share and use this leverage
to secure lower provider prices. Hospitals may also be able to leverage their market
power in the labor market by offering nurses lower wages.55 In the consent decree
in United States v. UnitedHealth Group Incorporated and PacifiCare Health Systems, Inc.
the US Department of Justice clearly states that they will prosecute cases in which
the merger leads to increases in monopsony power. In this case, United Health
Group acquired PacifiCare, a large health insurer on the West Coast of the US. One
of the relevant product markets where the DOJ alleged competitive harm was the
purchase of physician services. The DOJ required divesture in order to preserve
competition in this market. United States and the State of Arizona v. Arizona Hospital
and Healthcare Association and AzHHA Service Corporation is a case regarding the
53 FTC v. ProMedica Health System, Docket No. 215, Case No. 3:11 CV 47, Findings and Conclusions available at
http://www.ftc.gov/os/caselist/1010167/110329promedicafindings.pdf.54 See http://www.ftc.gov/os/adjpro/d9338/index.shtm.55 Unlike on the selling side of the market, the welfare impact of lower input prices is less clear.
555Competition in Health Care Markets
exercise of monopsony power in the nurses market.56 AzHHA Registry Program
is a hospital group purchasing organization which contracts with nursing agencies
to provide temporary nursing services for most Arizona hospitals. The DOJ defined
the relevant market as the “hospitals’ purchases of per diem nursing services in
the Phoenix and Tucson metropolitan areas” and claimed that the hospitals partici-
pating in AzHHA were able to obtain rates for temporary nursing services below
competitive levels. The consent decree prevented AzHHA from jointly negotiating
nurses’ wages for its member hospitals.
Hospitals and other integrated providers offer a number of different services and,
importantly, the services they offer (e.g. primary, secondary, and tertiary care) may dif-
fer from their competitors.57 The fact that hospitals offer a variety of services implies
that they may have an incentive to bundle those services for exclusionary purposes
when they negotiate with insurers. In Cascade Health Solutions v. Peace Health the
plaintiffs argued that Peace Health, a three-hospital system in Lane County, OR, with
a large hospital, Sacred Heart, that offers primary, secondary, and tertiary care, bun-
dled and tied their products in an attempt to monopolize primary and secondary ser-
vices. Cascade Health Solutions is a 114-bed hospital that does not offer tertiary
services. Specifically, Peace Health offered insurers substantial discounts on their entire
range of services if they did not contract with Cascade Health Solutions. The Ninth
Circuit Court of Appeals ruled that when the party has monopoly power, bundling is
legal unless the discounts result in prices that are below an appropriate measure of
costs.58 This standard is in conflict with the Third Circuit standard of anticompetitive
harm which does not consider the relationship between price and the appropriate
measure of costs.59
The second antitrust case of importance that occurred during the 2000s is In the
Matter of North Texas Specialty Physicians (NTSP).60 NTSP is an organization of inde-
pendent physicians and physician groups that was formed, managed, and operated by
physicians. Many of the physicians in NTSP directly compete with one another.
NTSP’s main functions are to negotiate and review contract proposals for member
services that are submitted by payers, including insurance companies and health plans;
to review payment issues; and to act as a lobbyist for its members’ interests.
56 See http://www.justice.gov/atr/cases/azhha.htm.57 “Tertiary” refers to complex services like invasive cardiovascular surgery and intensive neonatal care, whereas
“primary” and “secondary” acute hospital services are more common medical services like bone-setting and
tonsillectomies.58 The parties later settled the case once it was remanded back to the District Court.59 See LePages, Inc. v. 3M. “Bundled price discounts may be anti-competitive if they are offered by a monopolist and
substantially foreclose portions of the market to a competitor who does not provide an equally diverse group of
services and who therefore cannot make a comparable offer.”60 In the Matter of North Texas Specialty Physicians, Docket No. 9312. The initial decision can be found at http://
www.ftc.gov/os/adjpro/d9312/041116initialdecision.pdf.
556 Martin Gaynor and Robert J. Town

The fundamental issue in this case was whether NTSP served as a price fixing
agent for its member physicians or if the facilitation of setting premiums was an
ancillary activity and their primary function was to enable the setting of risk contracts
between it and its member physicians. Previously, the courts have found that physi-
cian organizations that set rates for the group can be illegal under a rule of reason
analysis.61 Organizations like NTSP can serve as a conduit for establishing risk con-
tracts that can allow the implementation of high-powered incentives for physicians
and these high-powered incentives can induce more efficient behavior than standard,
fee-for-service reimbursement. However, the use of risk-bearing contracts by insurers
has declined since the 1990s, and thus the purpose of organizations like NTSP for
such purposes is unclear.
NTSP negotiates both risk-sharing contracts and non-risk-sharing contracts for its
members; however, the vast majority of the contracts were non-risk-sharing contracts.
NTSP’s physicians enter into an agreement with NTSP that grants NTSP the right to
receive all payer offers and imposes on the physicians a duty to forward payer offers
to NTSP promptly. The physicians agree that they will not individually pursue a
payer offer unless and until they are notified by NTSP that it has permanently
discontinued negotiations with the payer. NTSP surveys members, uses the informa-
tion to calculate the mean, median, and mode of the minimum acceptable fees
identified by its physicians, and then uses these measures to establish its minimum
contract prices.
The ALJ ruled (and the Commission later affirmed) that the activities of NTSP
were “inherently suspect” and, taken as a whole, amounted to horizontal price fixing
which is unrelated to any pro-competitive efficiencies. NTSP’s conduct could be
characterized as per se unlawful under the antitrust laws. The broad lessons from this
ruling are: (1) activities by physician organizations that look inherently suspect and are
likely price fixing will be treated under a per se standard; (2) if a physician organization
intends to argue that efficiencies justify collection and dissemination of reimbursement
rates, the organization needs to be ready to explain why those efficiencies could not
be achieved without price fixing. Going forward, as physicians form accountable care
organizations (ACOs) under the recently passed health reform legislation, those activi-
ties should be limited to the implementation of the ACO and behavior among those
physicians that resembles collective negotiations of MCO contracts will be examined
closely. Unless those activities can be viewed as necessary to the implementation of
the ACO, they will likely be treated harshly by the federal antitrust enforcement
agencies.62
61 See Arizona v. Maricopa Co. Med. Soc’y, 457 US 332, 356�357 (1982).62 In contrast to the NTSP case, the FTC’s review of “TriState Health Partners” lays out an example of where joint
contracting by a collection of physicians is subordinate to the efficiencies the organization may yield. See http://
www.ftc.gov/os/closings/staff/090413tristateaoletter.pdf.
557Competition in Health Care Markets
As of this writing there is at least one antitrust case that was recently initiated and
has yet to be resolved that may significantly affect competition policy once decided.
In United States and State of Michigan v. Blue Cross Blue Shield of Michigan the DOJ
alleges that BCBS used its monopsony power to secure most-favored nation contracts
with hospitals in which the hospitals were contractually obligated to charge competing
MCOs 25 percent higher rates. The apparent purpose of such contracts is to increase
BCBS’s rivals’ marginal costs as well as increasing entry costs. In a differentiated
products setting higher rival costs allow a firm to charge higher prices and earn higher
profits.
While the decade of the 2000s was a relatively quiet one for health care provider
antitrust policy, it seems likely that the courts will have to address important issues in
the near future. In particular, providers are becoming more integrated—hospitals are
acquiring more physician groups and other outpatient services (e.g. imaging, rehabili-
tation, outpatient surgery). As these “integrated” organizations become more common
the likelihood is that they will attempt to use bargaining leverage in some services
to other services (or that their behavior will be interpreted as attempting to leverage
market power) through the use of tying, bundling or other means. The recently passed
health care reform provides incentives for increased provider integration and will
likely only increase the number of integrated organizations. Thus, it seems likely that
it is only a matter of time before the courts will have to examine the legality of such
behavior by integrated hospital systems.
3.3.2. Competition Policy towards Health Care in OECD CountriesThere has not been nearly as much antitrust activity towards health care outside of the
US. This is mostly due to health care systems in other countries being more centrally
controlled and heavily regulated. However, a number of countries have pursued de-
centralization and competition in reforms of their health systems. The Netherlands,
Germany, and the United Kingdom (England in particular) are notable in this regard.
Varkevisser and Schut (2009) review antitrust policy towards hospital mergers in the
Netherlands, Germany, and the US.
The Netherlands has a competition agency, the Netherlands Competition Authority
(NMa), for general competition policy. They oversee cartel, dominance abuse, and merger
cases including health care. They closely cooperate with the Netherlands Healthcare
Authority (NZa) for oversight of the functioning of health insurance and health care
markets. The NZa has become the primary government agency entrusted with regulation
and dominance abuse in health care markets, although they do work closely with
the NMa.63 The Netherlands has had a few antitrust matters arise over the past few
years. They have had concerns about hospital mergers, as in the US, and also have
63 The NZa plays an advisory role to the NMa in hospital merger cases, for example.
558 Martin Gaynor and Robert J. Town
had concerns about vertical restraints, including vertical integration, between
insurers, hospitals, and doctors. As Canoy and Sauter (2009) note, there was an
uptick in merger activity following market liberalization, and a consequent need for
greater merger control. The NMa has reviewed nine hospital mergers. All were
approved, although some were subject to extensive review. A notable development
has been the adoption of a market definition methodology for hospitals based
on a structural model (the model of Gaynor and Vogt, 2003, estimated for the
Netherlands).
Competition policy enforcement in Germany is under the control of the Federal
Cartel Office (Bundeskartellamt, BKA). Most of the concern in health care has been
with the acquisition of public hospitals by private hospital systems. With many local
and regional governments facing large budget deficits, there has been a wave of take-
overs of public hospitals by private chains. The BKA has examined over 100 hospital
mergers and acquisitions. Relatively few of these have been challenged, but some
have been blocked, and there was one merger which was allowed subject to divesti-
ture. At this point economic and econometric modeling have not played a large role
in these decisions.
In 2009 the UK established an agency charged with oversight of competition in
the NHS, following their reforms (in England) in 2006 designed to promote competi-
tion. The establishment of a new agency was necessary, because the conduct of NHS
entities was exempt by fiat from oversight by the UK’s competition authority (the
Office of Fair Trading). The Cooperation and Competition Panel (CCP) is the
agency that has been established for the oversight of competition in health care and
has fairly broad authority to regulate mergers and general conduct. Since beginning
operations in 2009, the CCP has reviewed over 50 merger cases and a number of
conduct cases.
4. HOSPITAL COMPETITION AND QUALITY
Thus far (in section 3) we have focused on hospital competition over prices.
The product is differentiated, but product characteristics are not subject to choice by
hospitals. As we have seen, this is an extremely useful framework for analyzing hospital
price competition. Nonetheless, quality64 is subject to hospital control, and can be an
important instrument for competition. In what follows, we first lay out approaches to
64 At this point we use quality in a very generic sense. In particular, this encompasses both horizontal and vertical
differentiation. To be clear, horizontal differentiation is sometimes alternatively referred to as “product variety,”
while vertical differentiation is alternatively referred to as “product quality.” Our use of the term quality should be
understood to encompass both of these except where we specifically indicate otherwise.
559Competition in Health Care Markets
modeling quality competition, then review the relevant literature.65 The models differ
substantially depending on whether price is set administratively (e.g. by a regulator) or
if it is a strategic variable. As a consequence, we cover these as separate cases, begin-
ning first with administratively set prices and then progressing to market determined
prices.
4.1. Hospital Choice of QualityIn what follows, we write down models in which hospitals directly choose the quality
of service they provide. This is convenient for writing down a parsimonious
model. There are some potentially important ways, however, in which this model
may not conform precisely to empirical phenomena. One reason is that hospitals may
not directly choose the quality of care they provide. Hospitals may not explicitly
choose a quality level that maximizes profits (or some other objective). Hospitals may
instead choose overall effort, or slack, based on the incentives they face. Quality of
care for a given patient(s) may then be determined (in part, perhaps stochastically) by
effort. This distinction is immaterial for the purposes of modeling. A model where
quality is chosen directly is isomorphic to one where it is determined indirectly by
effort.
In empirical modeling, the most commonly used measure of quality is patient
mortality. It is important to note that mortality is not a measure of quality of service
per se, but an outcome determined (in part) by quality of service. Hospitals are thus
not choosing mortality, but choosing a quality of service level that has an impact on
mortality. Patients are heterogeneous in their responsiveness to treatment. The most
common reason for this is severity of illness. Severely ill patients are more likely to
die, ceteris paribus, than healthier ones.66 In addition, the relationship between quality
of service and mortality is stochastic. A patient’s outcome cannot be predicted with
certainty based on a certain quality of care, even given patient and hospital observa-
bles. Nonetheless, a given service level generates an expected level of mortality. As a
consequence, it is immaterial whether a model is written down in which hospitals
choose service quality or expected mortality.
Last, consider the fact that hospitals do not compete for all kinds of cases. In par-
ticular, patients in urgent situations do not usually choose their hospital. A promi-
nent example of this which has been extensively studied in the empirical literature is
AMI (acute myocardial infarction, or “heart attack”). Heart attack patients do not
choose the hospital they are taken to, yet empirical studies (Kessler and McClellan,
2000) find that heart attack mortality is lower in less concentrated (and presumably
65 For prior reviews of hospital quality competition see Gaynor (2006b), Pauly (2004), or Vogt and Town (2006).66 See Gowrisankaran and Town (1999) and Geweke et al. (2003) for an econometric approach to correcting
measured mortality for this problem, and others.
560 Martin Gaynor and Robert J. Town
more competitive) hospital markets. How can hospitals be competing for patients
who do not choose where they go?67 The story is that hospitals choose a general
level of effort for the hospital as a whole, which affects quality of service, and thus
mortality, as described above. Hospitals that are subject to tougher competition in
general choose greater effort, thus increasing the chances of survival of heart attack
patients, even though they are not competing for heart attack patients. Again,
this can be described using a model in which hospitals choose quality directly.
Here, however, hospitals choose quality of service for the entire hospital based on a
sector where choice is possible. This hospital-wide level of quality then determines
patient outcomes, including those for services where there is not competition, like
AMI.
4.2. Administratively Set PricesIn many situations, prices are set administratively, rather than being market deter-
mined. This is true of entire health systems (e.g. the British National Health Service),
or sectors of health systems (e.g. the Medicare program in the US). In this situation,
when competition among firms occurs it will be via non-price means. We call
any non-price output characteristic(s) quality. In what follows, we will treat this as
vertical differentiation,68 i.e. we will treat quality as uni-dimensional. This is for ease
of exposition. The basic intuition that follows from such a treatment carries over
to a horizontally differentiated world, although this is not truly general. We refer to
literature which models horizontal differentiation where relevant.
The model we present here follows Gaynor (2006b). Let quality have only a verti-
cal dimension, i.e. “more is better.” For simplicity in exposition, assume that the
demand that any firm j faces is separable in its market share, sj, and the level of market
demand, D. Firm j thus faces a demand of:
qj 5 sjðzj; z2jÞDðp; zj; z2jÞ ð9:18Þwhere sj is firm j’s market share, zj is firm j’s quality, z2j is a vector of all other firms’
qualities, D is market demand, and p is the regulated price.69 Assume that j’s market
share is increasing in own quality, decreasing in the number of firms, and that the
responsiveness of market share to own quality is also increasing in the number of
firms.
67 Even if patients do not choose where they go, emergency crews may choose among hospitals based on quality,
especially in urban areas with a number of hospitals within a short distance of each other.68 Alternatively referred to as product quality.69 Note that for consumers insulated from the cost of consumption, as in health care, the price they face will be less
than the price received by the firm. We ignore this in order to keep this sketch of a model simple. It would not
affect the conclusions in any event.
561Competition in Health Care Markets

Assume that firms all use the same technology and face the same input prices.
Then they each have costs described by:
cj 5 cðqj; zjÞ1F ð9:19Þwhere c( � ) is variable cost and F is a fixed cost of entry.
Further assume that there is free entry and exit, so that all firms earn zero profits
in equilibrium. Then, assuming Nash behavior, equilibrium is described by the
solutions to the following across all firms j:70
@πj
@zj5 p2
@cj@qj
" #@sj@zj
DðUÞ1 sj@DðUÞ@zj
( )
2@cj@zj
5 0
ð9:20Þ
and
πj 5 pUqj 2 cj 5 0 ð9:21ÞInspection of (9.20) yields some immediate insights. First, compare equilibrium
quality under monopoly to that with multiple firms. Notice that, since a monopolist
faces market demand, the first term in curly brackets in 9.20 vanishes and sj5 1. Since@sj@zj
is positive by assumption, the term in curly brackets will be larger in most cases
with multiple firms than with a monopolist, so equilibrium quality is higher with
competition. This is definitely the case if competition is only over market share,
which is ofter the case in health in health care markets
In markets for normal consumer goods, whether welfare is higher depends on the
relative magnitudes of@sj@zj
and @D@zj. In particular, if @D
@zjequals zero, then increases in
quality do not shift market demand, and quality competition is simply over market
share, and hence wasteful. In health care markets that is not likely to be the case.
Consumers who are ill may not respond to changes in quality by changing the
aggregate quantity consumed. Nonetheless, increased quality may result in substantial
gains in welfare if it results in improved health.
Since@sj@zj
increases with the number of firms (i.e. the firm’s demand becomes more
elastic with respect to own quality the more alternatives there are for consumers),
quality competition will be more intense with entry and equilibrium quality will
increase with the number of firms in the market. This benefits consumers, but may
not increase social welfare. In particular, the increase in consumer surplus from
increased quality may be outweighed by the increased costs (recall that there is a fixed
cost of entry for every firm in the market), particularly if there is diminishing marginal
utility from quality and diminishing returns in quality production. As indicated
previously, this may result in excessive quality levels. In the case of health care it is
70 We assume here that firms maximize profits. We relax that assumption below. See section 4.2.2.
562 Martin Gaynor and Robert J. Town

most likely that quality will be excessive if it has little effect on health. Quality that
substantially improves a patient’s chance of survival will be very valuable, and such
benefits are more likely to outweigh costs. We can do a simple back of the envelope
calculation to illustrate this. For example, the typical estimate of the value of one life-
year is $100,000. If an increase in quality leads to one additional life-year for every
sick person and there are 1,000 sick people in the market, then costs would have to
increase by more $100 million for the increase in quality to be inefficient.
The positive predictions of this model are clear. Quality is increasing in the num-
ber of firms in the market, i.e. competition leads to more quality. Further, quality is
increasing in the regulated price. One may write down a firm’s equilibrium quality
function as the (implicit) solution to equations (9.20) and (9.21),
ze 5 zðp; cq; cz; sj; DÞ ð9:22Þwhere cq and cz denote first derivatives. The firm’s level of quality depends on the level
of the regulated price, the marginal cost of quantity, the marginal cost of quality, the
level of demand, market share, and the quality elasticities of market share and market
demand. This can be seen informally by manipulating (9.20) to obtain the following
expression:
z5ðp2 cqÞ½ηsz 1 ηDz �ðsjUDÞ
czð9:23Þ
where ηsz and ηDz are the quality elasticities of market share and market demand,
respectively. Quality is increasing in price, the elasticity of demand with respect to
quality, and the firm’s total demand. Quality is decreasing in the marginal costs of
quantity or quality.
This has implications for econometric specifications for empirical analysis. The
equation to be estimated is (9.22). However, measures of marginal cost, market share,
and demand are likely to be endogenous in an econometric equation. One would
employ exogenous determinants of these factors, such as cost shifters (W), demand
shifters ðXDÞ, and the number of firms (N). A reduced form econometric specification
would thus look something like the following:
ze 5Zðp; W ; XD; N ; εÞ ð9:24Þwhere ε is a random error term.
The normative implications of the model are somewhat less clear than the positive
ones. Depending on how valuable quality is (specifically how responsive health is to
quality), competition may lead to excessive quality provision. Since every firm pays a
fixed cost of entry, but does not consider the effects of demand stealing, there can be
too many firms in a free entry competitive equilibrium. Similarly, a higher regulated
price may reduce welfare by leading to excessive quality. This is less likely to be the
563Competition in Health Care Markets

case where quality leads to highly effective treatment, and that treatment has a large
impact on consumer well-being. It is important to note, however, that consumers are
never made worse off by competition. If competition leads only to demand stealing
they are no better off as a result, but if it leads to any increase in market demand then
consumers are unequivocally better off.
4.2.1. SpilloversNow let health outcomes, H, be determined by the following equation:
Hitj 5 htðzj; ξitÞ ð9:25Þwhere Hitj is the health outcome of patient i of type t treated in hospital j, ht is the
health production function for type t, zj is quality of service in hospital j, and ξit is avector of unobservable patient-type specific factors, with a known distribution.71
Let there be patients of two types, t5 1,2. Type 1 patients choose their hospital
based on the expected health outcome at that hospital, Hj 5Eit½Hitj�. Type 2 patients
simply arrive at the hospital. For example, type 1s may be maternity or orthopedic
patients, and type 2s heart attack patients. To start, assume, without loss of generality,
that there is one (fixed) price the hospital receives for treating either patient type, and
that costs do not depend on patient type.72 In this case, the hospital’s profits are as
follows:
πj 5 pU½sj1ðHj; H 2 jÞD1ðp; Hj; H 2 jÞ�1 pU½sj2D2ðpÞ�2 cðsj1D11 sj2D2; zjÞ2F ð9:26ÞEquilibrium here is the solution to the following first-order conditions across all
firms:
@πj
@zj5 p2
@cj@q1j
" #@s1j@Hj
@Hj
@zjD1ðUÞ1 s1j
@D1ðUÞ@Hj
@Hj
@zj
( )
2@cj@zj
5 0
ð9:27Þ
and
πj 5 0 ð9:28ÞNotice that the first-order condition for the choice of quality is unaffected by type
2s. They simply show up at the hospital, regardless of the level of service quality, so
they have no impact on the hospital’s choice of quality. Quality is chosen to maximize
71 We could make some of the patient-type specific factors observable, but we omit that detail to avoid additional
notation.72 The only assumption that matters here is that there is one quality level for both patient types.
564 Martin Gaynor and Robert J. Town

profits from type 1s. This then determines expected health outcomes for type 1s and
type 2s.
The comparative statics of this model are the same as the previous model (with
a single type). Quality is increasing in the number of firms. As competition gets tougher,
firms choose higher quality in order to attract more type 1 patients. Since quality is hos-
pital-wide, this spills over into higher quality for type 2s. Thus competition leads to
higher quality for type 2s, even though there is no direct competition for type 2 patients.
This is also true with regard to the regulated price. In the model above, there is a single
regulated price for both type 1s and type 2s. If we relax this assumption so there are dif-
ferent prices for each type, then quality will be increasing in the price for type 1s, but
not for type 2s.73
4.2.2. Non-profit Maximizing BehaviorThe model outlined above is not specific to health care. In particular, the majority of
firms in the hospital industry are not-for-profit or public. Let us now write down a
simple model that captures this aspect of the health care industry. There have been
many models of not-for-profit hospitals (Pauly and Redisch, 1973; Newhouse, 1970;
Lee, 1971; Lakdawalla and Philipson, 1998; Capps et al., 2010a) While there is no
agreement on a general model, most models posit an objective function which
includes profits and some other argument, such as quantity or quality. Therefore, let
us assume that not-for-profit hospitals have an objective function which includes
quality and profits (as a shorthand for everything else they care about). Further, for
simplicity, let this function be additively separable in quality and profits and linear in
profits:
Uj 5 uðzj; πjÞ5 vðzjÞ1πj ð9:29ÞWe can now revisit the first-order conditions for quality choice (9.20), modified to
take account of this objective function:
@Uj
@zj5 p2
@cj@qj
" #@sj@zj
DðUÞ1 sj@DðUÞ@zj
( )
2@cj@zj
1@v
@zj5 0
ð9:30Þ
Notice that the only difference with the first-order conditions for an industry of
profit maximizing firms is the presence of the last term, @u@zj. Since this term is positive,
the value that not-for-profit firms put on quality acts like a reduction in the
marginal cost of producing quality, i.e. not-for-profit firms will act like for-profit firms
73 This is a testable hypothesis.
565Competition in Health Care Markets
with a lower marginal cost of quality.74 This implies that quality will be higher in
equilibrium. The comparative statics, however, are identical with an industry of profit
maximizing firms. Quality is increasing in the number of firms and the regulated
price, as before.
In the case of the spillover model with two patient types, we might imagine that a
not-for-profit or public hospital may care directly about the health outcomes of each
patient type. In that case, the hospital’s first-order condition looks like this:
@πj
@zj5 p2
@cj@q1j
" #@s1j@Hj
@Hj
@zjD1ðUÞ1 s1j
@D1ðUÞ@Hj
@Hj
@zj
( )
2@cj@zj
1@v
@H1j
@H1j
@zj1
@v
@H2j
@H2j
@zj5 0
ð9:31Þ
As before, this implies that quality will be higher for non-profit maximizers than
for profit maximizers, but that the comparative statics are unchanged.
4.3. Market Determined PricesWe now turn to examining quality determination in an environment where prices are
market determined. We expand the model of a bargaining game in prices among hos-
pitals previously described in section 3.1 to allow for hospital choice of quality. In that
game hospitals are differentiated, but that differentiation is not a strategic choice. Here
we relax that assumption to allow hospitals to choose quality. As before, we treat qual-
ity as vertically differentiated. Hospitals choose their qualities in a (new) first stage,
then the price bargaining game in section 3.1 ensues, treating qualities as fixed. The
other two stages in the model, patient choice of health plan and patient choice of hos-
pital, then ensue, as before. This expanded model now has four stages, with the qual-
ity game among hospitals being the first stage.
Let demand be determined by underlying utility functions, as in the model of the
price bargaining game in section 3.1. These aggregate up to demand functions facing
each hospital.
Let each hospital j choose quality zj to maximize utility, as follows:
maxzj
Uj 5 pjðzjÞUDjðpjðzjÞ; zj; XijÞ2 cðDjðpjðzjÞ; zj; XijÞ; zj; WjÞ1 vðzjÞ ð9:32Þ
Xij is a vector of firm and consumer characteristics. Wj is a vector of input prices.
Both are regarded as fixed by the firm. The price pj is determined in the bargaining
game in the next stage. In this stage hospitals take account of the effects of their qual-
ity choices on price through the pricing equation from the next stage, equation (9.7):
74 This is the same specification and result as for not-for-profit firms that care about quantity, as opposed to quality.
See Lakdawalla and Philipson (1998); Gaynor and Vogt (2003).
566 Martin Gaynor and Robert J. Town

pjh5 ð12βÞ cjðzjÞ1rh
qjh
� �1
βqjh
ðFðVJhðzj; z2j; pjhÞ2FðVJh2 jðz2jÞ2 cmjhÞ1βXl 6¼j
plhdjlh
ð9:7ÞOur goal here is to understand the effect of competition on quality (in this stage)
and subsequently on price, in the continuation game. We can obtain the basic
intuition about impacts on price by employing the equation derived in the previous
section that describes the effect of a merger of two hospitals on price:
Δpj1 kjh 5 ð12 βÞdjkhUpkh2 cj
The impact on price is determined by the diversion ratio (holding β and hospital
k’s price constant). The diversion ratio is larger the more that consumers view hospi-
tals j and k as substitutes. If hospital j’s quality is higher than hospital k’s, then consu-
mers will view them as less close substitutes than if they had the same levels of quality.
As a consequence, a merger would not have a large impact on prices. If, however,
hospitals are symmetric, so j and k choose the same quality levels, then there is (at least
to a first approximation) no impact of quality on the change in prices due to merger.
We now turn to the impact of competition on quality. Treating the pricing
equation (9.7) as a function of quality and differentiating the objective function with
respect to zj we get the first-order condition for hospital j:
pU@D
@z1DðUÞ @pj
@zj1 pjU
@Dj
@pj
@pj@zj
2@c
@DU@D
@z2
@c
@DU@D
@p
@pj@zj
2@c
@z1
@v
@zj5 0 ð9:33Þ
Now consider the impact of competition. Assume that competition increases the
quality responsiveness of demand since there are closer substitutes for hospital j (e.g. a
hospital enters nearby). We assume that competition has no impact on costs or the
hospital’s marginal utility from quality @u@zj
� �. With regard to the first-order condition
for price, competition will increase the terms @D@z and
@Dj
@pj. The effect on
@pj@zj
is indeter-
minate in general. If, however, we focus only on the effects on price through the net
value a hospital brings to an insurer’s network (the terms Fh(Jh)2Fh(Jh2 j)), then the
effect of quality on price is positive.75
The overall effect is as follows (where n represents the number of firms):
pj 2@c
@D
� �U@2D
@z@n1DðUÞ @2pj
@zj@n1 pj 2
@c
@D
� �U@2Dj
@pj@n
@pj@zj
1 pj 2@c
@D
� �U@Dj
@pj
@2pj@zj@n
ð9:34Þ
75 The impact on an insurer’s revenue of having a higher-quality hospital in its network is higher when there is more
hospital competition. With more competition a hospital’s demand is more responsive to quantity, so a higher-
quality hospital will garner more patients.
567Competition in Health Care Markets
In general, this derivative cannot be signed. Assuming price is greater than mar-
ginal cost, the first two terms are positive, while the second two terms are negative.76
If we assume, however, that demand is not responsive to price (which can be reason-
able for hospital care where consumers are largely insulated from prices by the pres-
ence of health insurance) then the derivative is positive, i.e. competition will lead
hospitals to optimally increase their quality. Assuming symmetry and Nash behavior,
all hospitals will increase their qualities.
In equilibrium this may not actually lead to increased prices. It may be that
hospitals increase quality, but do not change their relative attractiveness to insurers.
In that case, hospitals’ bargaining positions haven’t changed, so in equilibrium there
is no effect on price. It may be, however, that this is not the case. Suppose that
hospitals have different costs of producing quality. In this situation, some hospitals
will choose higher quality than others and their relative values to an insurer’s
network will change. This will lead to some hospitals (those with lower marginal
costs of quality) having more bargaining power with insurers and commanding
higher prices.
4.4. Econometric Studies of Hospital Competition and QualityThere is a rapidly growing empirical literature on competition and quality in health
care. At present the evidence from this literature is entirely on hospital markets. In
what follows we review this literature. We first review the results from econometric
studies of markets with administered prices, and then market determined prices.77
The studies reviewed here employ a variety of econometric approaches. The
modal approach is what we call a “Structure�Conduct�Performance” (SCP) specifi-
cation. These econometric models are derived from a conceptual model that hypothe-
sizes a causal link from market structure to firm conduct and then to industry
performance.78 Most SCP models applied to health care focus on the link between
market structure and firm conduct, and omit industry performance. The typical con-
duct measure in the general industrial organization literature is price or price�cost
margin. The typical measure of market structure is the Herfindahl�Hirschmann
Index (HHI), which is the sum of the squares of all firms’ market shares.79 The equa-
tion usually estimated has roughly the following appearance:
p5β01β1q1β2XD 1β3W 1β4HHI1 ε ð9:35Þ
76 @Dj
@pjand
@2Dj
@pj@nare negative—demand slopes down and even more so in the presence of more firms.
77 We focus on work that occurred after the publication of the first volume of the Handbook of Health Economics
in 2000. Most of the empirical literature on quality is relatively recent, and so occurs after that date.78 See Carlton and Perloff (2005).79 That is, HHI5
PNi5 1 s
2i ; where si is firm i’s market share, and there are N firms in the market.
568 Martin Gaynor and Robert J. Town
where XD represents demand shifters and W captures cost shifters. The SCP studies of
quality simply employ a measure of quality as the dependent variable in this equation,
rather than price.
The SCP approach has a number of well-recognized problems when price is the
dependent variable (see Bresnahan, 1989; Schmalensee, 1989, on these issues). These
problems also apply when quality is the dependent variable, and there are some addi-
tional issues. First, the use of the HHI in a pricing equation can be explicitly derived
only from a homogeneous goods Cournot model of conduct.80 Obviously an SCP
regression with quality as the dependent variable does not derive from this framework.
In the case of administered prices, theory does point to an econometric model with a
measure of market structure on the right-hand side (see equation (9.24)). Even in this
case, or even if one thinks of a quality SCP regression as deriving from a broad
conceptual framework as opposed to a specific theoretical model, a number of issues
remain. The HHI (or any market structure measure) is usually regarded as endoge-
nous. Unmeasured variation in demand and cost factors affect both quality and market
structure. For example, a firm with low costs is likely to have both a high market
share (leading to a high HHI) and choose high-quality.
Two additional specification issues arise in regard to SCP studies of markets with
administered prices. When firms set prices it is clear that price and quality are deter-
mined simultaneously, so an SCP model might either include price and treat it as
endogenous, or simply include exogenous determinants of price. Typically price is
not included in the studies reviewed here, although it is not clear whether the authors
were explicitly trying to include exogenous determinants of price. When price is
regulated, however, price (or the price�cost margin) should appear as an exogenous
determinant of quality (again, see equation (9.24)). In some studies price is omitted
based on the argument that, since price is regulated, price does not affect demand
(e.g. for Medicare beneficiaries). The regulated price should be included, however,
because it is a determinant of supply, not demand. In addition, it is possible that the
regulated price may be correlated both with quality and concentration. For example,
firms in unconcentrated markets may produce higher quality due to tougher
competition. They may also have higher costs due to producing higher quality, and
therefore receive higher regulated prices. Therefore, omitting price may lead one to
overestimate the effect of concentration on quality.
There is another complication due to the nature of hospitals. The major purchasers
of hospital services in the US are Medicare and private health insurers. Medicare sets
regulated prices. Prices from private health insurers are determined in the market.
Since hospitals generally sell in both markets, one must either account for this or
80 In that case, the coefficient on the HHI in an SCP regression captures the elasticity of demand, not firm conduct
(which is already assumed to be Cournot).
569Competition in Health Care Markets

presume that there are no complementarities between the two (e.g. demand and cost
are completely separable in Medicare and private output). Many of the studies that
focus on Medicare seemingly make the implicit assumption of separability. This is not
generally an issue in other countries, where there is essentially a single payer for health
care services.81
While the majority of the studies we review here employ an SCP framework,
some employ different approaches. Some studies evaluate the impact of mergers, some
evaluate the impact of regulatory changes (e.g. price deregulation), and a number
estimate the relationship between hospital volume of a surgical procedure and patient
health outcomes. In addition, there are a small number of studies that take a structural
approach: there are some that estimate demand, and some that examine the determi-
nants/impacts of the number of firms. Each of these approaches has its advantages and
disadvantages. We discuss these in the context of evaluating the various studies.
Before proceeding, however, we want to note that the results of the majority of
these studies provide evidence only on positive questions, e.g. “Does competition
increase quality?” Few of these studies allow for normative analysis. This first wave of
studies consists for the most part of policy evaluation and reduced-form studies.82 It is
not generally possible to evaluate effects on welfare with these kinds of studies. This
should not be taken as a criticism of these studies, but simply a recognition of what
sorts of inferences can be drawn from them.
4.4.1. Studies with Administered PricesThere are a number of studies of the impact of competition on hospital quality under
an administered price regime. These derive from the US Medicare program and from
the English NHS, which made a transition to administered prices in a reform in 2006.
The amount a Medicare beneficiary pays is the same, regardless of where she obtains
care (again, in a given area at a given point in time). As a consequence, price is not a
strategic variable for hospitals serving Medicare patients. Patients in the NHS pay
nothing, so price plays no strategic role in that system either. Table 9.10 presents a
summary of these studies and their findings. The entry in the column labeled “Effect
of competition on quality” indicates the direction of the relationship between the
competition measure and the quality measure. For example, in the first row, the entry
“Increase” in that column indicates that the quality is higher in more competitive
markets. For the study cited in the first row (Kessler and McClellan, 2000), quality is
measured by mortality and competition is measured by the HHI. Quality is inversely
related to mortality—lower mortality is higher quality. Competition is inversely
81 Most countries do have some private insurers, but they are generally so small that their roles can be safely ignored.82 By policy evaluation studies, we mean econometric specifications that evaluate the impact of some policy or
(economic) environmental factor, but are not derived from an explicit economic model. By reduced form, we
mean an econometric specification that is the reduced form of a specific economic model.
570 Martin Gaynor and Robert J. Town
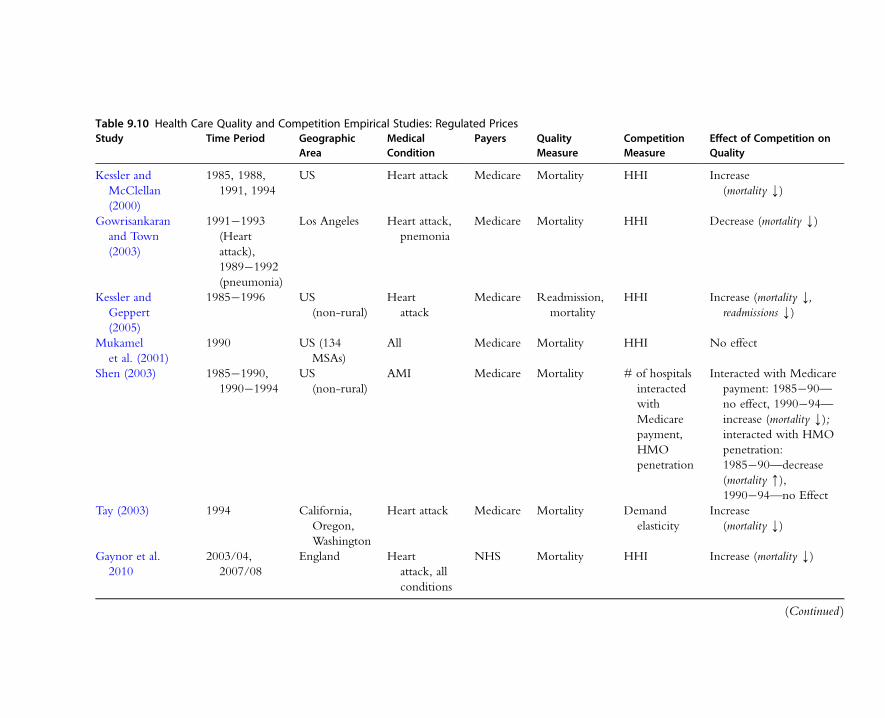
Table 9.10 Health Care Quality and Competition Empirical Studies: Regulated PricesStudy Time Period Geographic
AreaMedicalCondition
Payers QualityMeasure
CompetitionMeasure
Effect of Competition onQuality
Kessler and
McClellan
(2000)
1985, 1988,
1991, 1994
US Heart attack Medicare Mortality HHI Increase
(mortality k)
Gowrisankaran
and Town
(2003)
1991�1993
(Heart
attack),
1989�1992
(pneumonia)
Los Angeles Heart attack,
pnemonia
Medicare Mortality HHI Decrease (mortality k)
Kessler and
Geppert
(2005)
1985�1996 US
(non-rural)
Heart
attack
Medicare Readmission,
mortality
HHI Increase (mortality k,readmissions k)
Mukamel
et al. (2001)
1990 US (134
MSAs)
All Medicare Mortality HHI No effect
Shen (2003) 1985�1990,
1990�1994
US
(non-rural)
AMI Medicare Mortality # of hospitals
interacted
with
Medicare
payment,
HMO
penetration
Interacted with Medicare
payment: 1985�90—
no effect, 1990�94—
increase (mortality k);interacted with HMO
penetration:
1985�90—decrease
(mortality m),1990�94—no Effect
Tay (2003) 1994 California,
Oregon,
Washington
Heart attack Medicare Mortality Demand
elasticity
Increase
(mortality k)
Gaynor et al.
2010
2003/04,
2007/08
England Heart
attack, all
conditions
NHS Mortality HHI Increase (mortality k)
(Continued )
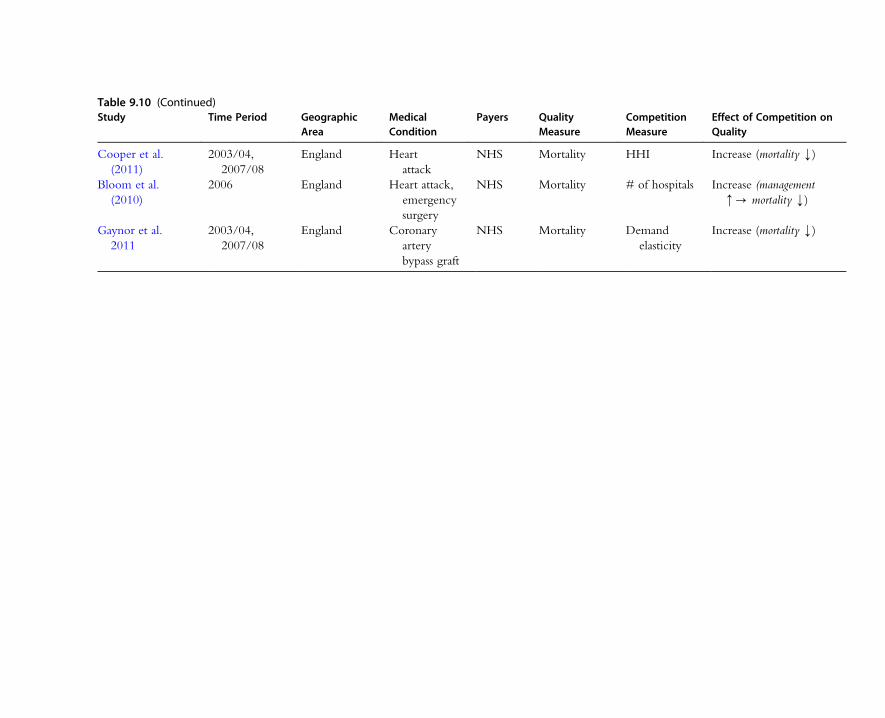
Table 9.10 (Continued)Study Time Period Geographic
AreaMedicalCondition
Payers QualityMeasure
CompetitionMeasure
Effect of Competition onQuality
Cooper et al.
(2011)
2003/04,
2007/08
England Heart
attack
NHS Mortality HHI Increase (mortality k)
Bloom et al.
(2010)
2006 England Heart attack,
emergency
surgery
NHS Mortality # of hospitals Increase (management
m- mortality k)
Gaynor et al.
2011
2003/04,
2007/08
England Coronary
artery
bypass graft
NHS Mortality Demand
elasticity
Increase (mortality k)
related to the HHI—the HHI is lower in more competitive markets. So, the finding
that competition increases quality is based on a positive empirical relationship between
mortality and the HHI—mortality is higher in less competitive markets.
Kessler and McClellan (2000) is one of the first studies attempting to make inferences
about a causal effect of competition on quality for hospitals. This is a study of the impact
of hospital market concentration on risk-adjusted one-year mortality from acute myocar-
dial infarction (AMI, i.e. a heart attack) for Medicare patients. Expenditures on these
patients are also studied. The study included data on all non-rural Medicare beneficiaries
with AMI during selected years from 1985 to 1994. Kessler and McClellan use the SCP
framework discussed above, with some modifications. They instrument for the HHI with
hospital market shares predicted from a model of patient choice of hospital, where patient
choice is largely determined by distance from the hospital. They also employ zip code
fixed effects. As a consequence, the effects of hospital market concentration are identified
by changes in the predicted HHI. The specification they employ, however, omits the regu-
lated Medicare price. A number of hospital and area characteristics are included, HMO
enrollment among them. It is unclear whether they are considered demand or cost shifters.
The results from this study are striking. Kessler and McClellan find that risk-
adjusted one-year mortality for Medicare AMI patients is significantly higher in
more concentrated markets. In particular, patients in the most concentrated markets
had mortality probabilities 1.46 points higher than those in the least concentrated
markets (this constitutes a 4.4 percent difference) as of 1991. This is an extremely
large difference—it amounts to over 2,000 fewer (statistical) deaths in the least
concentrated vs. most concentrated markets. The results with regard to expenditures
have a somewhat different pattern. Prior to 1991, expenditures were higher in less
concentrated markets, while the reverse is true as of 1991.
The positive inferences from this study are clear. Mortality from heart attacks for
Medicare patients is lower in less concentrated markets. The effects of concentration
are stronger beginning in 1991 and are reinforced by HMO enrollment. The
omission of the regulated price is unfortunate, although for this omission to lead to
biased estimates the changes in the omitted price would have to be correlated with the
within zip code changes in the predicted HHI. It is unclear whether the inclusion of
market and hospital characteristics is intended to control for possible hospital
complementarities between Medicare and private output. So long as it is unlikely there
are important omitted factors there should be no problem with bias. While it is clear
that concentration affects hospital quality, the mechanism by which this works is not.
It seems unlikely that hospitals deliberately choose lower quality in the form of an
increased probability of death. What may be happening is that hospitals in more
concentrated markets take some of their excess profits by exerting lower effort. Low
effort in the hospital may have the unintended consequence of higher mortality.
Another issue with regard to this application is whether hospitals compete for heart
573Competition in Health Care Markets

attack patients. Tay (2003) states that one-half of heart attack patients arrive at the
hospital via ambulance. It seems unlikely that these patients have any choice of
hospital, hence hospitals cannot compete for these patients. We think the most likely
story is that heart attack patients are the “canary in the mine shaft.” Hospitals in more
competitive environments are pressured to be better across the board, and that
manifests itself clearly in a very sensitive area—heart attack patient mortality.
While the basic positive results from this study are clear, we do not believe that
there are clear normative inferences. The results show that both expenditures and
mortality are lower in less concentrated markets, implying gains in benefits with a
reduction in costs. Kessler and McClellan state that this implies there is a welfare
gain from competition. This may be so, but the inference is not entirely clear. The
measure of Medicare expenditures they use is not a measure of economic cost.
Therefore, the finding that quality is higher in less concentrated markets tells us that
consumers are likely better off, but does not tell us if social welfare has necessarily
been improved.
Gowrisankaran and Town (2003) estimate the effects of hospital market concentra-
tion on risk-adjusted mortality rates for AMI and pneumonia, for both Medicare and
HMO patients. We discuss their findings with regard to Medicare patients here, since
the price is regulated for them, and discuss the findings with respect to HMO patients
in the next section. Gowrisankaran and Town use data from Los Angeles county from
1991 to 1993 for AMI and 1989 to 1992 for pneumonia. Their approach is similar
to that of Kessler and McClellan. They use an SCP framework, instrumenting for
the HHI with hospital market shares predicted from a patient choice equation, where
distance is the main determinant of hospital choice. An innovation is that they
construct separate, hospital-specific, HHIs based on (predicted) hospital market
shares for Medicare, HMO, Medicaid, indigent and self-pay patients, and indemnity
patients.
Gowrisankaran and Town find, in contrast to Kessler and McClellan, that mortality
is worse for Medicare patients treated in hospitals with lower Medicare HHIs. The
implication is that competition reduces quality for Medicare patients. Gowrisankaran
and Town hypothesize that Medicare margins are small or negative, or that hospitals
may deviate from profit-maximizing behavior. If Medicare margins are indeed
negative (i.e. p,MC), then the results are consistent with theory. It seems unlikely,
however, that this is true for AMI. Heart treatments for Medicare patients are widely
thought to be profitable. Indeed, there is substantial entry of hospitals specializing
only in the treatment of heart disease. Since Medicare patients are a substantial portion
of heart patients, it seems as if Medicare margins must be significant in order to
generate the observed entry. Small or negative Medicare margins for pneumonia,
however, do seem plausible. We do not observe the entry of hospitals specializing in
pneumonia, or pulmonary disorders generally.
574 Martin Gaynor and Robert J. Town
This study also omits Medicare price. Since Gowrisankaran and Town only examine
Los Angeles county there may be little or no variation in Medicare price across hospitals
for a given year. Although there should be temporal variation, they have only a short
time period. As a consequence, there may not be enough variation in their sample to
estimate a parameter for Medicare price. It includes some hospital characteristics,
although it is unclear if these characteristics are considered demand or cost shifters.
It is hard to know why the results of this study contrast so markedly with the previous
one. It may be that the Medicare price is below marginal cost (on average) for the hospi-
tals in Gowrisankaran and Town’s study, while the opposite is true for the hospitals in
Kessler and McClellan’s study. Since neither study included Medicare price it is impossi-
ble to evaluate this hypothesis. It is also possible that the estimated relationship between
the HHI and mortality is sensitive to the choice of instruments. Gowrisankaran and
Town and Kessler and McClellan use similar, but not identical, instrumenting strategies.
Obviously identification is driven by the instruments, so it is possible that the differences
in instruments are driving the differences between the studies. This is only speculation,
however. The opposite results from the two studies suggest caution in drawing strong
conclusions about the impact of market structure on hospital mortality.
Kessler and Geppert (2005) extend the framework employed by Kessler and
McClellan to consider the impact of concentration on differences in quality between
patients. Their work is inspired by the theoretical result that oligopolists will find it opti-
mal to engage in product differentiation in order to relax price competition (see Tirole,
1988, section 7.5.1). These theory papers are not directly relevant for Kessler and
Geppert’s empirical exercise, since the theory examines quality dispersion when firms
set prices. Kessler and Geppert examine Medicare patients, for whom price is set via
regulation. Clearly any incentive to engage in product differentation is not related to a
desire to relax price competition for Medicare patients. It is possible that hospitals may
be attempting to relax price competition for private patients, and are unable to quality
discriminate between Medicare and private patients, perhaps for legal or ethical reasons.
It seems like it should be a straightforward result from models where firms choose both
product variety and product quality that oligopolists operating in a market with a
regulated price have an incentive to differentiate themselves with regard to product
variety in order to avoid the kind of quality competition described previously.83
Kessler and Geppert examine outcomes (readmissions, mortality) and expense
(expenditures, various measures of utilization) for Medicare heart attack patients, as in
83 If one takes the kind of model used in Lyon (1999) or Kamien and Vincent (1991), where firms locate on a line, it
seems evident that firms will have an incentive to locate as far apart from each other as possible (at the ends of the
line), rather than nearby (in the middle). If they locate in the middle, the firms are identical, so the one that
produces the highest product quality will take the entire market. Thus firms will engage in fierce product quality
competition, up until the point that profits are dissipated. If firms are located at the ends of the line, then each firm
will be considerably more attractive to consumers located very close to it. This will dampen quality competition.
575Competition in Health Care Markets
Kessler and McClellan. They contrast outcomes and expenditures for high-risk and
low-risk patients in highly concentrated vs. unconcentrated markets. High-risk
patients are those who were hospitalized with a heart attack in the previous year,
whereas low-risk patients had no such hospitalization. They find that low-risk patients
receive more intensive treatment in highly concentrated markets, but have no statisti-
cally significant difference in outcomes. High-risk patients, on the other hand, receive
less intensive treatment in highly concentrated markets, and have significantly worse
outcomes. They conclude that competition leads to increased variation in patient
expenditures, and that it is welfare enhancing, since [on net] outcomes are better and
expenditures are lower. Medicare price is omitted, as in previous studies.
This chapter adds to the evidence that concentration is significantly correlated
with readily observable measures of quality for hospitals. The statistical relationship
between quality dispersion and concentration is surprising and interesting. So far as
we know, this is the only paper to examine quality dispersion. What economic behav-
ior generated these patterns in the data is an intriguing puzzle.
Mukamel et al. (2001) examine risk-adjusted hospital mortality for Medicare
patients in 134 Metropolitan Statistical Areas (MSAs) in 1990. They focus on the
impact of HMOs, but also examine hospital market concentration. Mukamel et al.
(2001) find that HMO penetration (the percentage of the MSA population enrolled
in an HMO) has a negative impact on excess hospital mortality (the difference
between observed mortality and predicted risk-adjusted mortality), i.e. HMO penetra-
tion is associated with better quality. Hospital market concentration (measured by the
HHI) has no statistically significant impact on mortality. HMO market concentration
is also included as an explanatory variable, although it is not significant. Medicare
price is omitted. It is unclear what to make of these results. First, Mukamel et al.’s
specification includes inpatient expenditures, which are certainly endogenous, as well
as hospital HHI, HMO HHI, and HMO penetration, which may very well be endog-
enous, so it is unclear that the resulting estimates are consistent. It is possible that hos-
pital concentration does truly have an impact on mortality, but that it is not
consistently estimated in this study. Second, it is not clear how enrollment in private
HMO plans affects the mortality of Medicare patients. Presumably there has to be
some spillover effect, but the nature of the mechanism is unclear, as Mukamel et al.
acknowledge.
A study that is notable for taking account of Medicare price effects is Shen (2003).
Shen examines the impact of financial pressure from reduced Medicare payments and
HMO penetration on mortality from AMI, controlling for the hospital’s competitive
environment.84 She examines data from 1985 to 1990 and 1990 to 1994 for most
84 There have been a number of studies assessing the impact of the change in Medicare hospital payment from cost-
plus to fixed price (the Medicare Prospective Payment system). See, for example, Kahn et al. (1990); Cutler (1995).
576 Martin Gaynor and Robert J. Town
non-rural hospitals in the US. Shen’s measure of market structure is an indicator of
whether there are five or more other hospitals within a 15-mile radius of a hospital.
This is interacted with a measure of the change in the Medicare price and the change
in HMO penetration. There are direct effects of Medicare price and HMO penetra-
tion, but not market structure.
Shen finds a negative and significant relationship between the change in Medicare
price and mortality. The interaction between the market structure and Medicare price
variable is negative and significant for 1990�1994, but has no significant impact on
mortality for 1985�1990. These results are consistent with standard theory. Hospitals
respond to an increase in the regulated price by increasing quality. This response is
amplified when hospitals face more competitors.
The effects of HMO penetration also appear to be roughly consistent with theory.
Shen finds that HMO penetration leads to higher mortality, and that hospitals in mar-
kets with more competitors appeared to respond to HMO penetration with quality
reductions in 1985�1990, although not thereafter. HMOs are hypothesized to
increase the price elasticity of demand facing hospitals. If so, then the increased price
elasticity will likely lead to a quality reduction. This should be amplified in markets
with more competitors, since that should also increase the price elasticity. Shen also
does a simple normative analysis of the effects of financial pressure, but not the effects
of competition.
A paper by Tay (2003) takes a more structural approach. Tay specifies and estimates
a structural econometric model of hospital choice by Medicare enrollees with AMI.85
Tay uses data on urban enrollees in conventional Medicare, located in California,
Oregon, and Washington in 1994. She examines the effect of a number of aspects of
quality and distance on the probability a patient is admitted to a particular hospital.
The quality measures include two clinical outcomes (the mortality rate and the com-
plication rate); a measure of input intensity (nurses per bed); and whether the hospital
can perform two high-tech cardiac services (catheterization or revascularization). All
measures of quality are treated as exogenous.
Tay finds that hospital demand is negatively affected by patient distance and posi-
tively affected by quality. She then simulates the effects of changes in the various
aspects of a hospital’s quality, holding the total number of heart attack patients fixed,
the locations of patients and hospitals fixed, and the qualities of all other hospitals
fixed. Adopting a catheterization lab is predicted to increase demand by 65 percent,
while adding revascularization in addition to catheterization increases demand by
85 A number of papers have previously examined whether choice of hospital is affected by quality (Luft et al., 1990;
Burns and Wholey, 1992; Chernew et al., 1998). These studies find that clinical quality, as measured by deviation
between expected and actual mortality rates, has a significant impact on hospital choice—hospitals with lower
mortality are more likely to be chosen. The responsiveness found in these studies indicates the potential for quality
competition among hospitals, although how much is not clear, since the studies were not designed to assess this.
577Competition in Health Care Markets
76 percent. If the number of nurses per bed is increased by 1 percent, then demand
is predicted to increase by 24 percent.
Tay shows that hospital demand is significantly affected by quality and distance,
thus there are potentially high payoffs to hospitals increasing quality. While this repre-
sents an advance over the previous literature by using more detailed modeling, there
are nonetheless some limitations to the inferences that can be drawn from this study.
As with the previous studies, the Medicare price is omitted. It is possible that this
omission is inconsequential, but we see no way to tell. Tay assumes that hospitals set
the same level of quality for Medicare and non-Medicare patients. This is also an
untested assumption, although it is at least explicit.
More fundamentally, the supply side of the market is not modeled. As a conse-
quence, competition itself is not modeled and cannot be examined explicitly. There is
no structure in place for dealing with the potential endogeneity of the quality
variables. There is the usual reason to be concerned about endogeneity, since quality
is chosen by the firm. In addition, it has been observed for a number of hospital
procedures that hospital volume causes patient outcomes (see section 4.4.3 below
for a review of some studies). This suggests endogeneity of the mortality and
complication rates.
Further, the simulation is an out-of-equilibrium prediction. Tay’s predicted effects
of adding a catheterization lab or other services on demand are likely too large, since
they hold rivals’ responses fixed. If rivals respond by also adopting catherization labs or
other services, then the equilibrium effects should be smaller, potentially even zero. It
is also unclear whether firms would actually make the predicted choices. If rivals
respond strongly to a firm’s adoption of services, the responses may make adoption
unprofitable. As a consequence it is hard to assess the magnitude of quality effects.
Last, as Tay acknowledges, without a supply side no welfare analysis can be
performed.
Two recent studies (Cooper et al., 2011; Gaynor et al., 2010) examine the impact
of competition on hospital quality using a recent reform in the English National
Health Service (NHS). The NHS introduced a reform in 2006 intended to promote
competition among hospitals. Prices were administratively determined based on
patient diagnoses, via a method very similar to that employed by the US Medicare
system. As a consequence, hospitals were to compete solely on non-price dimensions.
Although they differ in the precise methods employed, both Cooper et al. (2010) and
Gaynor et al. (2010) find that, following the reform, risk-adjusted mortality from
AMI fell more at hospitals in less concentrated markets than at hospitals in more
concentrated markets.
Gaynor et al. (2010) also look at mortality from all causes and mortality from all
causes, excluding AMI, and find the same qualitative results as for AMI, although the
estimated effects are smaller in magnitude. They also examine measures of utilization
578 Martin Gaynor and Robert J. Town
and expenditure, and find that length of stay rose in less concentrated markets relative
to more concentrated markets after the reform, but there were no impacts on expen-
ditures. Quantitatively, Gaynor et al. (2010) find that the reform reduced heart attack
mortality by 0.2 percent.86 Since the reform saved lives without increasing costs, they
conclude it was welfare improving. The measure of costs is hospital expenditures. As
noted before, this may not accurately capture economic costs, so welfare inferences
are not necessarily clear. Gaynor et al. also control for the impact of the NHS admin-
istered prices on outcomes. They estimate a positive, but statistically insignificant,
effect.
Gaynor et al. (2011) estimate a structural model of demand for heart bypass
surgery (CABG) in England to evaluate the effect of the reform studied by Cooper
et al. and Gaynor et al. (2010). In particular, one part of the reform required refer-
ring physicians to give patients five choices of hospitals (previously they had been
required to give none). Gaynor et al. (2011) use individual data on patient treatment
to estimate a multinomial logit model of demand faced by individual hospitals
for CABG surgery. They find that the demand elasticity with respect to a hospital’s
(risk-adjusted) mortality rate is greater after the reform than before. Post-reform the
elasticity with respect to the adjusted mortality rate is roughly equal to 0.3. In the
case of the mortality rate, an increase of one standard deviation (about a 20 percent
increase) implies a drop in the choice probability of about 6 percent. This elasticity
is significantly larger than the pre-reform mortality rate elasticity. They also find
substantial geographic differentiation—cross-elasticities between hospitals with
respect to their mortality rates fall dramatically with distance. This indicates that
close-by hospitals compete with each other over quality, but not with hospitals far
away. There is considerable individual heterogeneity in patient responsiveness. More
seriously ill patients (as measured by a higher co-morbidity count) are more sensitive
to the hospital mortality rate than the average patient. With the introduction of
the reform their preference for quality, relative to the average patient, increases even
more. They also find larger effects of the reform on low-income patients. This study
takes a structural approach toward studying the effect of competition on quality.
The English reform was intended to increase competition, and apparently did
increase demand responsiveness.
Some insight into the mechanisms underlying the relationship between market
structure and quality identified in Cooper et al. and Gaynor et al. (2010) is provided
by Bloom et al. (2010). Bloom et al. use data for the English NHS and employ a
86 Both the Cooper et al. (2011) and Gaynor et al. (2010) estimates of the impact of competition post-reform are
quantitatively similar. Cooper et al. (2011) calculate that a one standard deviation increase of their measure of
competition would lead to a reduction in the heart attack mortality rate of 0.3 percent per year. Gaynor et al.
(2010)’s estimates imply that a one standard deviation decrease in concentration reduces heart attack mortality by
0.33 percent per year.
579Competition in Health Care Markets
measure of management quality developed by Bloom and Van Reenen (2007) to
examine the impact of market structure on management quality and, ultimately, on
hospital quality (AMI mortality, emergency surgery mortality, and other measures).
They find that having more close-by competitors has a strong and significant impact
on management quality and hence on clinical quality of care. Their estimates imply
that adding a rival hospital close by increases the measure of management quality by
one-third of a standard deviation and thereby reduces heart attack mortality by 10.7
percent. This study employs only cross-sectional data (2006), so the methods differ
from those in Cooper et al. and Gaynor et al. (2010). Identification of the effect of
market structure is achieved by using political marginality of a hospital’s geographic
area. Because hospital openings, mergers, and closures are determined by a govern-
ment agency (Department of Health), they are subject to political influence.
4.4.2. Studies with Market Determined PricesWe now turn to econometric studies of competition and quality where prices are
determined in the market.87 Most of these employ the SCP model, while some exam-
ine the impacts of mergers or price deregulation. A smaller number are structural (or
related) and estimate entry behavior.
The results are summarized in Table 9.11. In the table the entry in the column
labeled “Effect of competition on quality” indicates the direction of the relationship
between the competition measure and the quality measure. The measure of quality
used in the study is listed under the column heading “Quality measure,” and the
measure of competition is listed in the column labeled “Competition measure.”
There have been a number of recent studies of competition and quality in hospital
markets. These all cover time periods from the 1990s or later, when it is generally
agreed that price competition had emerged in hospital markets. We first discuss SCP
studies, then cover merger studies, then finally move to studies of price deregulation.
In considering these studies we need to refer back to economic theory for guidance.
Unlike the case of regulated prices, economic theory on competition and quality is
less clear (see Gaynor, 2006b). Nonetheless, theory does provide a guide to what to
look for, and what economic factors might be underlying an estimated relationship.
Some insights into the determinants of quality levels can be gained from the model
of Dorfman and Steiner (1954). Their model is nominally about choice of price
and advertising, but can also be interpreted as about price and quality (although in a
somewhat restrictive way).88
87 We omit older studies of the “Medical Arms Race.” For a review that includes these studies see Gaynor (2006b).88 Dorfman and Steiner model a monopolist’s behavior. We can consider this an approximation to the behavior of a
monopolistically competitive firm if we think of the demand function as a reduced-form demand, e.g. an
oligopolist’s residual demand curve (see, e.g., Dranove and Satterthwaite, 2000).
580 Martin Gaynor and Robert J. Town
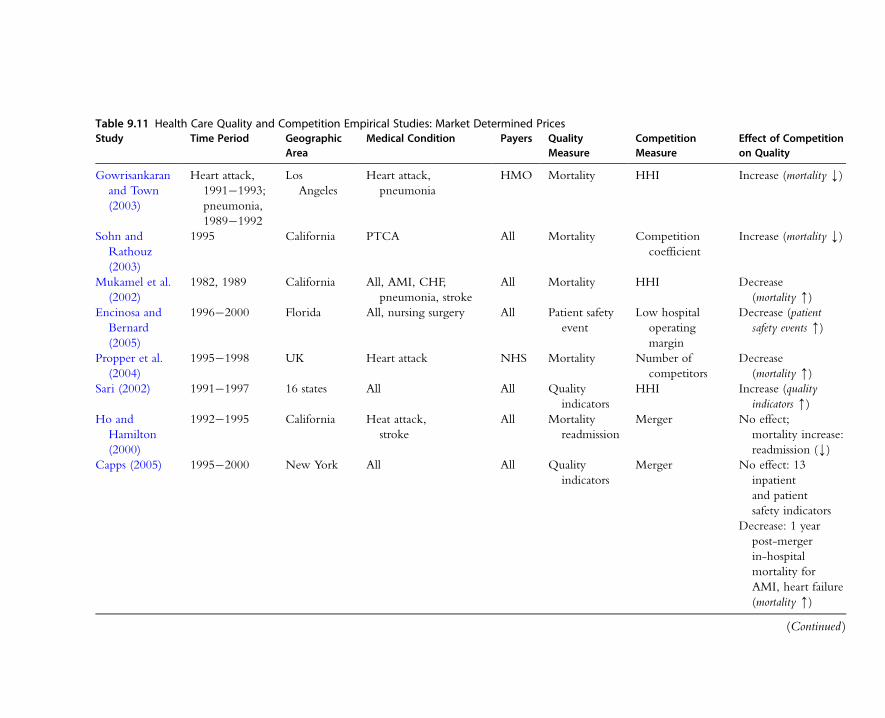
Table 9.11 Health Care Quality and Competition Empirical Studies: Market Determined PricesStudy Time Period Geographic
AreaMedical Condition Payers Quality
MeasureCompetitionMeasure
Effect of Competitionon Quality
Gowrisankaran
and Town
(2003)
Heart attack,
1991�1993;
pneumonia,
1989�1992
Los
Angeles
Heart attack,
pneumonia
HMO Mortality HHI Increase (mortality k)
Sohn and
Rathouz
(2003)
1995 California PTCA All Mortality Competition
coefficient
Increase (mortality k)
Mukamel et al.
(2002)
1982, 1989 California All, AMI, CHF,
pneumonia, stroke
All Mortality HHI Decrease
(mortality m)Encinosa and
Bernard
(2005)
1996�2000 Florida All, nursing surgery All Patient safety
event
Low hospital
operating
margin
Decrease (patient
safety events m)
Propper et al.
(2004)
1995�1998 UK Heart attack NHS Mortality Number of
competitors
Decrease
(mortality m)Sari (2002) 1991�1997 16 states All All Quality
indicators
HHI Increase (quality
indicators m)Ho and
Hamilton
(2000)
1992�1995 California Heat attack,
stroke
All Mortality
readmission
Merger No effect;
mortality increase:
readmission (k)Capps (2005) 1995�2000 New York All All Quality
indicators
Merger No effect: 13
inpatient
and patient
safety indicators
Decrease: 1 year
post-merger
in-hospital
mortality for
AMI, heart failure
(mortality m)
(Continued )
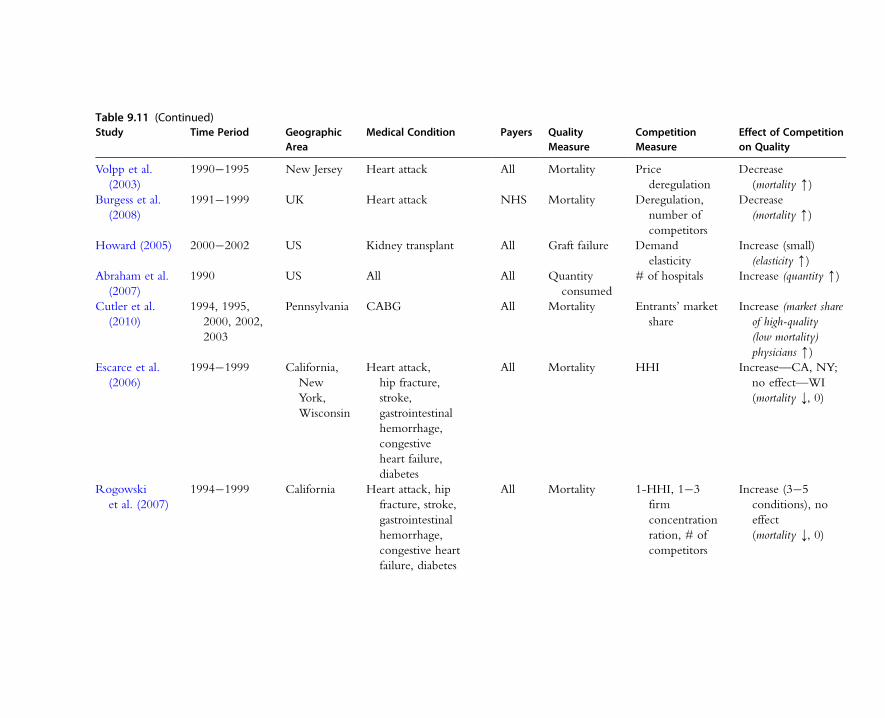
Table 9.11 (Continued)Study Time Period Geographic
AreaMedical Condition Payers Quality
MeasureCompetitionMeasure
Effect of Competitionon Quality
Volpp et al.
(2003)
1990�1995 New Jersey Heart attack All Mortality Price
deregulation
Decrease
(mortality m)Burgess et al.
(2008)
1991�1999 UK Heart attack NHS Mortality Deregulation,
number of
competitors
Decrease
(mortality m)
Howard (2005) 2000�2002 US Kidney transplant All Graft failure Demand
elasticity
Increase (small)
(elasticity m)Abraham et al.
(2007)
1990 US All All Quantity
consumed
# of hospitals Increase (quantity m)
Cutler et al.
(2010)
1994, 1995,
2000, 2002,
2003
Pennsylvania CABG All Mortality Entrants’ market
share
Increase (market share
of high-quality
(low mortality)
physicians m)Escarce et al.
(2006)
1994�1999 California,
New
York,
Wisconsin
Heart attack,
hip fracture,
stroke,
gastrointestinal
hemorrhage,
congestive
heart failure,
diabetes
All Mortality HHI Increase—CA, NY;
no effect—WI
(mortality k, 0)
Rogowski
et al. (2007)
1994�1999 California Heart attack, hip
fracture, stroke,
gastrointestinal
hemorrhage,
congestive heart
failure, diabetes
All Mortality 1-HHI, 1�3
firm
concentration
ration, # of
competitors
Increase (3�5
conditions), no
effect
(mortality k, 0)
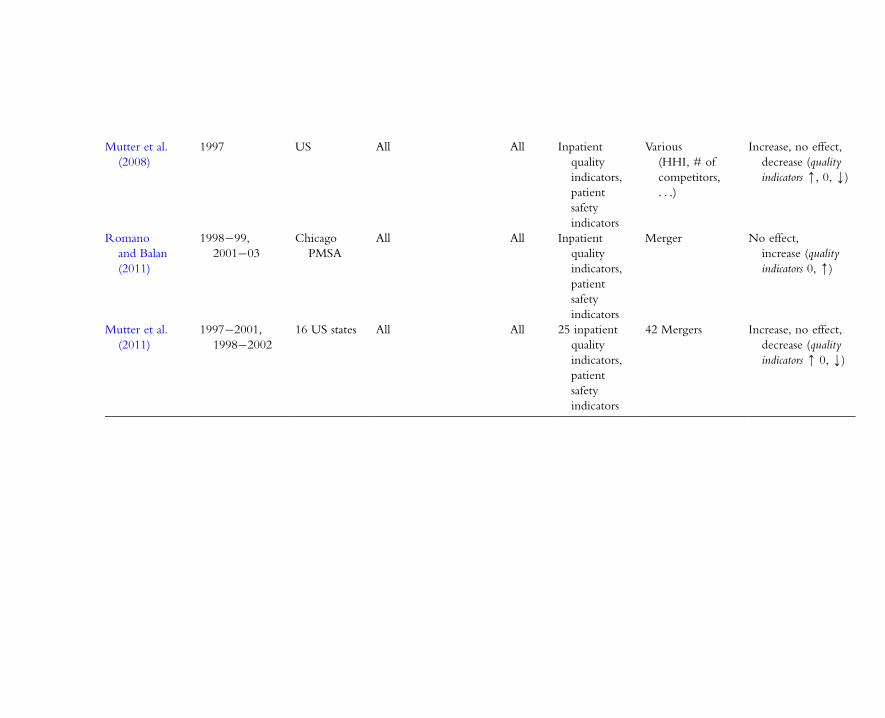
Mutter et al.
(2008)
1997 US All All Inpatient
quality
indicators,
patient
safety
indicators
Various
(HHI, # of
competitors,
. . .)
Increase, no effect,
decrease (quality
indicators m, 0, k)
Romano
and Balan
(2011)
1998�99,
2001�03
Chicago
PMSA
All All Inpatient
quality
indicators,
patient
safety
indicators
Merger No effect,
increase (quality
indicators 0, m)
Mutter et al.
(2011)
1997�2001,
1998�2002
16 US states All All 25 inpatient
quality
indicators,
patient
safety
indicators
42 Mergers Increase, no effect,
decrease (quality
indicators m 0, k)
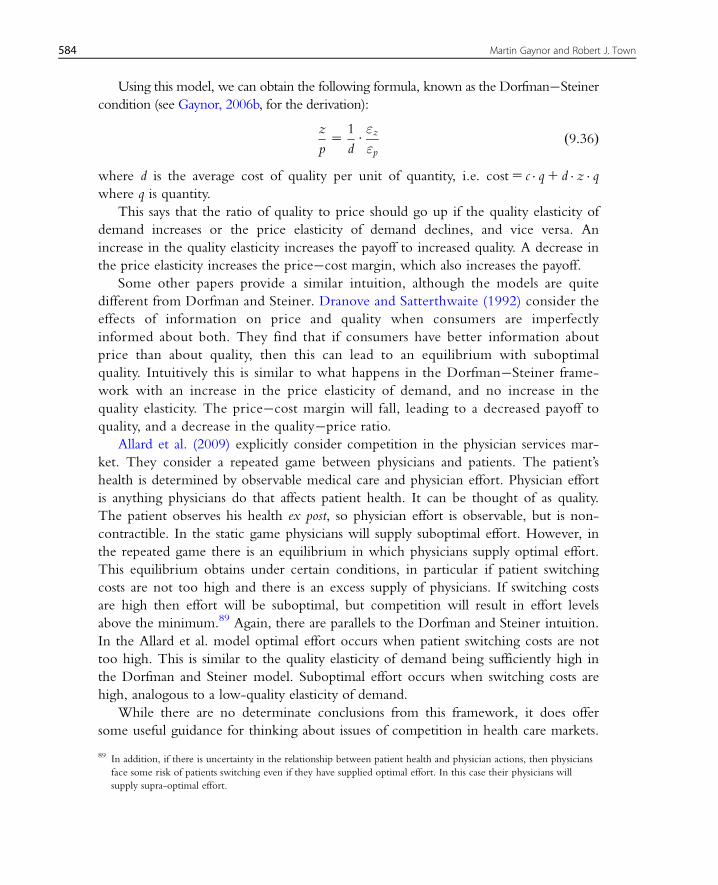
Using this model, we can obtain the following formula, known as the Dorfman�Steiner
condition (see Gaynor, 2006b, for the derivation):
z
p5
1
dUεzεp
ð9:36Þ
where d is the average cost of quality per unit of quantity, i.e. cost5 c � q1 d � z � qwhere q is quantity.
This says that the ratio of quality to price should go up if the quality elasticity of
demand increases or the price elasticity of demand declines, and vice versa. An
increase in the quality elasticity increases the payoff to increased quality. A decrease in
the price elasticity increases the price�cost margin, which also increases the payoff.
Some other papers provide a similar intuition, although the models are quite
different from Dorfman and Steiner. Dranove and Satterthwaite (1992) consider the
effects of information on price and quality when consumers are imperfectly
informed about both. They find that if consumers have better information about
price than about quality, then this can lead to an equilibrium with suboptimal
quality. Intuitively this is similar to what happens in the Dorfman�Steiner frame-
work with an increase in the price elasticity of demand, and no increase in the
quality elasticity. The price�cost margin will fall, leading to a decreased payoff to
quality, and a decrease in the quality�price ratio.
Allard et al. (2009) explicitly consider competition in the physician services mar-
ket. They consider a repeated game between physicians and patients. The patient’s
health is determined by observable medical care and physician effort. Physician effort
is anything physicians do that affects patient health. It can be thought of as quality.
The patient observes his health ex post, so physician effort is observable, but is non-
contractible. In the static game physicians will supply suboptimal effort. However, in
the repeated game there is an equilibrium in which physicians supply optimal effort.
This equilibrium obtains under certain conditions, in particular if patient switching
costs are not too high and there is an excess supply of physicians. If switching costs
are high then effort will be suboptimal, but competition will result in effort levels
above the minimum.89 Again, there are parallels to the Dorfman and Steiner intuition.
In the Allard et al. model optimal effort occurs when patient switching costs are not
too high. This is similar to the quality elasticity of demand being sufficiently high in
the Dorfman and Steiner model. Suboptimal effort occurs when switching costs are
high, analogous to a low-quality elasticity of demand.
While there are no determinate conclusions from this framework, it does offer
some useful guidance for thinking about issues of competition in health care markets.
89 In addition, if there is uncertainty in the relationship between patient health and physician actions, then physicians
face some risk of patients switching even if they have supplied optimal effort. In this case their physicians will
supply supra-optimal effort.
584 Martin Gaynor and Robert J. Town
For example, the advent of managed care in the 1990s is commonly thought to have
increased the price elasticity of demand facing health care firms (hospitals in particu-
lar). This should have led to decreased prices, and indeed seems to have done so. If
there was no sufficiently countervailing increase in the quality elasticity, then quality
should have fallen.
Another change in health care markets is the recent emphasis on medical errors
and quality improvement. If that leads to the quality elasticity of demand increasing,
then quality will increase. If the price elasticity remains unchanged this will increase
price (since increased quality raises marginal cost), but price�cost margins will remain
unchanged.
A study by Gowrisankaran and Town (2003) examined the relationship between
market structure and AMI and pneumonia mortality in Los Angeles county in the
early 1990s for both Medicare and HMO patients. We discussed the findings for
Medicare patients in the previous section. We now turn to HMO patients.
Gowrisankaran and Town find that risk-adjusted mortality is significantly lower in less
concentrated parts of Los Angeles county. This implies that competition in quality is
increasing for HMO patients. With a standard model of price and quality competition
(see Gaynor, 2006b) this could occur if the quality elasticity of demand is higher in
less concentrated markets, or if the price elasticity is lower. Since we generally think
that elasticities are higher with more competitors, the former seems plausible (and the
latter does not).
Sohn and Rathouz (2003) study the impact of competition on risk-adjusted mor-
tality for patients receiving percutaneous transluminal coronary angioplasty (PTCA) in
116 hospitals in California in 1995. They construct a “competition coefficient” that
varies between zero and one depending on the degree of overlap in the patient pools
of a pair of hospitals. Sohn and Rathouz find that mortality is lower for patients in
hospitals facing more competition. This effect is stronger in lower volume hospitals.
Again, this result seems to imply that the quality elasticity is higher in more competi-
tive markets.
Mukamel et al. (2002) examine the impact of competition on risk-adjusted mor-
tality for California patients in 1982 and 1989. The two years cover the period before
and after the introduction of insurer-selective contracting in California. They hypoth-
esize that the introduction of selective contracting increased price competition and
that hospitals responded by shifting resources from clinical activities, which are hard
to observe, to hotel activities, which are more easily observed. Mukamel et al. esti-
mate the effects of the level of hospital concentration (measured as the HHI) in the
base year and the change in hospital concentration on the change in inpatient clinical
expenditures, and then the impact of the change in expenditures and the level of the
hospital HHI in 1989 on the level of risk-adjusted mortality in 1989. They find that
the change in the HHI had a negative and significant impact on both clinical and
585Competition in Health Care Markets
hotel expenditures for not-for-profit hospitals, but no significant impact on for-profit
hospitals. The estimated relationship between clinical expenditures and mortality is
negative. Mukamel et al. find that together these two results imply that increased
competition from 1982 to1989 led to increased mortality, operating via competition
reducing clinical expenditures on patients. The introduction of selective contracting is
likely to have increased the price elasticity of demand facing hospitals, without
increasing the quality elasticity by a similar proportion. In this case, the Dorfman and
Steiner model predicts that quality will fall.
Encinosa and Bernard (2005) use data on all inpatient discharges from Florida hospi-
tals from 1996 to 2000 to examine the impacts of financial pressure on patient safety.
Encinosa and Bernard employ a newly available set of quality indicators developed by
the Agency for Health Care Research and Quality (AHRQ). These indicators measure
a variety of factors reflecting clinical quality, including mortality, obstetric complications,
adverse or iatrogenic complications, wound infections, surgery complications, cesarean
section, and inappropriate surgery.90 Encinosa and Bernard estimate the impact of
within-hospital changes in lagged operating profit margins91 on the probabilities
of adverse patient safety events. They find that patients at hospitals in the lowest quartile
of operating profit margins have significantly higher probabilities of adverse safety events
than those in any of the higher quartiles. There are no significant differences in the
probability of adverse events between patients in the highest, second-highest, or third-
highest quartiles.92 Thus patients at hospitals that are doing poorly financially are at
greater risk of suffering from a patient safety problem than those who are at hospitals
that are doing better financially. There seems to be no impact of doing better financially
above a threshold (bottom quartile of operating margin).
This finding is roughly consistent with theory. We expect that quality will be posi-
tively related to marginal profits, so the empirical finding that quality is lower at hos-
pitals with low profits seems likely. Standard theory would predict a continuous effect
of profits on quality, however, not a threshold. It is possible that this could be due to
data limitations. Encinosa and Bernard have to rely on accounting data, so they are
unable to measure economic profits or construct a measure of marginal profits.
There are also some issues with the econometrics. Encinosa and Bernard use hos-
pital dummies to control for hospital-specific unobserved factors. The estimating
equations are logits for the probabilities of adverse patient safety events. This is a non-
linear estimator, so unlike least squares, hospital-specific effects are not differenced
away. As a consequence, it is not clear to what extent their estimates of the effects of
90 Go to http://http://www.qualityindicators.ahrq.gov for more information.91 The ratio of net operating profit to net operating revenue.92 The first quartile covers patients at hospitals with margins below20.5 percent. The second quartile covers margins
between20.5 percent and 4.4 percent, the third between 4.4 percent and 9.3 percent, and the fourth covers
margins greater than 9.3 percent.
586 Martin Gaynor and Robert J. Town
profits on safety are truly purged of potentially confounding hospital-specific effects.
Another issue is that slope estimates from non-linear models with group fixed effects
are only consistent when the number of observations per group goes to infinity. In
this context, that means that the number of years each hospital is observed has to be
large. Since the sample in this paper covers five years, it seems unlikely this condition
is met, hence the estimates may not be consistent.
While this study does not directly examine competition, it may have implications
for the impact of competition on quality. To the extent that competition reduces hos-
pital operating margins to low levels as in Encinosa and Bernard it may put patients at
higher risk of adverse safety events.
Propper et al. (2004) use an SCP approach to examine the effect of hospital com-
petition in the United Kingdom following reforms to the National Health Service in
the 1990s. These reforms encouraged payer-driven competition among hospitals.
Propper et al. examine the impact of this payer-driven competition on mortality for
AMI patients. They examine the impact of a measure of market structure (roughly,
the number of competitors) on mortality over the period 1995�1998 and find that
mortality increases with the number of competitors. This finding certainly contrasts
with that of US SCP studies, but (for better or for worse) it is consistent with theory.
The presence of more competitors can increase quality elasticity, price elasticity, or
both. If the price elasticity increases more than the quality elasticity, then quality will
fall. Whether this is the mechanism driving the result in this paper cannot be deter-
mined, although it provides some direction for future research. As previously, the wel-
fare impacts of this finding are unclear. If increasing the number of competitors is
associated with a decrease in market power, then a quality decrease may be welfare
improving. Alternatively, it could be harmful.
An interesting study is by Sari (2002). Sari uses the same quality indicators as
Encinosa and Bernard. Sari is one of the first studies to employ these indicators rather
than following the common practice of using risk-adjusted mortality as a quality mea-
sure. He employs data on hospitals in 16 states covering the period 1992�1997 and
estimates the SCP model using fixed effects, random effects, and instrumental variables
with fixed effects. Sari finds that quality is significantly lower in more concentrated
markets—he estimates that a 10 percent increase in hospital market share leads to a
0.18 percent decrease in quality. He also finds evidence that managed care penetration
increases quality for some of the quality indicators, although there is no statistically
significant relationship for others.
Ho and Hamilton (2000) and Capps (2005) are two papers that examine the impact
of hospital mergers on quality of care. Ho and Hamilton (2000) study 130 hospital mer-
gers of various types over the period 1992 to 1995. The quality measures they employ
are inpatient mortality, readmission rates, and early discharge of newborns. They employ
hospital-specific fixed effects to control for time invariant hospital characteristics that
587Competition in Health Care Markets

may be related to merger. Ho and Hamilton find no detectable impact of merger on
mortality for either heart attack or stroke patients. They do find that some mergers
increase readmission rates for heart attack patients and the early discharge of newborns.
It is unclear whether Ho and Hamilton find no effect because there truly is no effect
or because they are unable to identify the effect in the data. The effects of mergers are
notoriously difficult to identify. First, there are not a large number of mergers, so there
is not a lot of statistical power with which to detect an effect. Second, the identifying
variation in this study comes from within-hospital variation over time. If that is not the
primary source of variation in outcomes then the estimates of the parameters will
be imprecise. Third, mergers are certainly endogenous. Mergers occur for reasons that
are often related to the outcome variables of interest. If mergers occur for reasons
related to hospitals’ changing circumstances over time, then the hospital fixed effects
will not control for endogeneity, so it will be difficult to obtain consistent estimates of
a merger effect.
Capps (2005) uses the AHRQ quality indicators to examine the effect of hospital
mergers on quality. He compares merging to non-merging hospitals in New York
state during 1995�2000. There are 25 merging hospitals, and 246 total. Control
groups are constructed in two ways. The first method is to select non-merging hospi-
tals that are similar to merging hospitals in observable characteristics (e.g. teaching sta-
tus, size, ownership, etc.). The second method is to use propensity scores to identify a
control group. The control group for a merging hospital then consists of the ten non-
merging hospitals that have predicted probabilities of merging that are closest to the
predicted probability of the merging hospital.
Using the first method Capps finds no statistically significant effect of mergers on
most of the quality indicators. There is no effect on four of six inpatient indicators for
quality procedures, no effect for indicators for three other surgical procedures, and no
effect for six patient safety indicators. Merger is found to have a negative effect on the
inpatient quality indicators for two cardiac procedures: AMI and congestive heart fail-
ure (CHF). Merger is estimated to lead to an additional 12 deaths per 1,000 AMI or
CHF admissions in the year following the merger, although there is no significant
effect in the second year after the merger. There are no statistically significant effects
of merger on any of the quality indicators when propensity scores are used to generate
a control group. As with the Ho and Hamilton paper it is hard to know how to inter-
pret the overall lack of statistical significance. Mergers may truly have had no impact
on hospital quality in New York state over this period, or it may just be very difficult
to precisely test the hypothesis.
Two very interesting recent papers use changes in regulation as a way to learn about
the effect of hospital competition on quality. Volpp et al. (2003) study the effect of
the deregulation of hospital prices in New Jersey to try to learn about the impact of the
introduction of price competition on hospital quality. In 1992 New Jersey deregulated
588 Martin Gaynor and Robert J. Town
hospital prices. The neighboring state of New York had no change in its hospital
regulatory regime. Volpp et al. use data on AMI hospital admissions in New Jersey and
New York from 1990 to 1996 to learn about the effect of the deregulation. They
look at the difference in risk-adjusted inpatient AMI mortality between New Jersey and
New York before and after regulatory repeal. They find that mortality in New Jersey
relative to New York increased after price deregulation. At first glance this result con-
trasts markedly with the SCP type studies previously discussed. However, consider the
impact of price deregulation. The biggest impact should be to increase the price elasticity
of demand, and decrease price.93 The quality elasticity seems unlikely to be significantly
affected. The prediction of a standard model is that quality will fall when the price elas-
ticity of demand increases. It is impossible to say what the impact on welfare might be.
If the regulated prices were set too high, then this quality decrease is welfare increasing,
and vice versa.
A paper by Burgess et al. (2008) employs a similar approach to Volpp et al. In this
paper Burgess et al. (2008) examine the impacts of competitive reforms in the NHS
on mortality for AMI patients. Burgess et al. (2008) use a different strategy in this
paper than in Propper et al. (2004). Here they use the change in regulation in the UK
over the period 1991�1999, combined with geographic variation in the number of
competitors.94 Competition was introduced in 1991 and actively promoted up until
1995. It was downplayed after 1995 and actively discouraged from 1997 onwards. The
impact of competition is identified by differences between hospitals facing competitors
and those who are not between the time periods when competition was encouraged
versus when it was discouraged.
Burgess et al. (2008) find that competition reduces quality. The differences in mor-
tality for hospitals in areas with competitors versus those with no competitors was
higher during the period when competition was promoted (1991�1995), than during
the period when competition was discouraged (1996�1998). The estimated cumula-
tive effect of competition over the entire period is to raise mortality rates by roughly
the same amount as the cumulative effect of the secular downward trend in heart
attack mortality (presumably due to technological change). This is a large impact. As
with Volpp et al. (2003), these results can be interpreted as consistent with economic
theory, although that is not testable within the framework employed in the paper.
Also as before, the welfare inferences are unclear.
Howard (2005) is a paper that focuses on demand, as in the paper by Tay. Howard
models the demand for kidney transplantation facilities, focusing on the effect of quality on
consumer choice of facility. Howard examines the choices of all patients receiving trans-
plants, including Medicare patients, Medicaid patients, and those with private insurance.
93 Unfortunately Volpp et al. do not have any evidence on the effect of deregulation on prices.94 Only variation in the number of competitors is used in Propper et al. (2004).
589Competition in Health Care Markets

Quality is measured as the difference between expected and actual one-year
post-transplant graft failure rates at a center. Howard assumes that there are no price
differences that affect choice between transplant centers, thus price is omitted. The
explanatory variables are the quality measure, patients’ distances from transplant centers,
and patient characteristics. The average estimated choice elasticity with respect to quality
is 20.12. The quality elasticity for privately insured patients is larger: 20.22.
These elasticity estimates are not particularly large. The low value of the average
estimated quality elasticity implies that this does not give transplant centers a large
incentive to compete on quality, as indicated by equation (9.23). Since Howard does
not model the supply side, his model does not directly predict the impacts of competi-
tion (it is not intended to do so).
As with the Tay paper there are also some concerns about price and endogeneity.
Howard assumes that price has no impact on where patients obtain their transplants.
This may be true for Medicare, but it seems unlikely for patients who are privately
insured. Privately insured patients face very large differences in out-of-pocket costs
between providers that are in and out of their coverage networks. In addition, health
insurance plans make decisions on which providers to include in their networks based
on price. Thus it seems as if price should be included for those with private insurance.
Further, if price is positively correlated with quality, then its omission could lead to a
downward bias in the estimated effect of quality on demand. Patients may appear less
responsive to quality differences than they really are if high-quality transplant centers
are also high cost to them. Endogeneity of quality may also be an issue, for the same
reasons as the Tay paper.
Abraham et al. (2007) has some welfare implications. Abraham et al. examine the
determinants of the number of hospitals in isolated markets in the US for 1990. They
do not examine price or quality explicitly. Instead, they infer whether competition is
increasing by the population required to support another firm in the market. If the pop-
ulation required to support another firm is increasing, then average profits available
post-entry must be decreasing, thus increasing the volume necessary to make entry
profitable. They find that market size is the primary determinant of the number of hos-
pitals, and that the quantity bought and sold in the market rises, and variable profits fall,
as the number of hospitals in a local market increases. This implies that the market is
getting more competitive as the number of hospitals increases. Further, it shows that
entry is not simply demand-stealing—more hospitals increase demand. The reason is
that quantity demanded can increase only if price is lower or quality is higher. Since
that does happen, people are consuming more and must be better off.95 As a
95 As pointed out previously, increased aggregate demand is not necessary for increased quality to be welfare
enhancing.
590 Martin Gaynor and Robert J. Town
consequence, they conclude that competition increases with the number of hospitals,
and that competition is welfare improving.
Cutler et al. (2010) is a recent very interesting study that, like Abraham et al., uti-
lizes information on entry (in the coronary artery bypass graft surgery market, i.e.
CABG) to make inferences about the impacts of competition. Cutler et al. use the
repeal of entry restricting regulation (hospital certificate of need regulation, CON) in
Pennsylvania to examine the effect of entry of hospitals into the CABG surgery
market. They hypothesize that overall production is capacity constrained—cardiac sur-
geons are a scarce input and supply cannot be altered easily. As a consequence, entry
will not lead to increased quantities of CABG surgery, but may lead to improved
quality; in particular, they hypothesize that it will increase the market shares of high-
quality surgeons. This hypothesis is confirmed in the empirical analysis. They find
that in markets where entrants have 11�20 percent market shares of CABG surgeries,
high-quality surgeons’ market shares increased 2.1 percentage points more than for
standard quality surgeons. Overall, they conclude that entry led to increased quality,
but that there was no net effect of entry on social welfare. Their estimates of the gains
from reduced mortality due to entry are approximately offset by the estimated fixed
costs of entry. This is one of the few papers with welfare results.
Escarce et al. (2006) examine the relationship between hospital concentration and
patient mortality for adults hospitalized for myocardial infarction, hip fracture, stroke,
gastrointestinal hemorrhage, congestive heart failure, or diabetes in California, New
York, and Wisconsin. They find that the probability of death is lower in less concen-
trated markets in California and New York, but not Wisconsin. This adds to the evi-
dence that there can be substantial quality competition among hospitals, but also that
there can be substantial heterogeneity, depending on market specifics. It is possible
that in Wisconsin price competition dominates quality competition, although the
study does not present evidence on that and of course there could be other reasons
for the result.
A different study by Rogowski et al. (2007) examines the same six conditions in
the state of California. In this study Rogowski et al. find that mortality is lower in less
concentrated markets for three to five of the six conditions, depending on the mea-
sure of concentration employed. Interestingly, they find no statistically significant
impact of market structure on heart attack mortality, in direct contrast to many other
studies which find the opposite result.
Mutter et al. (2008) use national data on hospitals from the US Agency for
Healthcare Research and Quality’s Hospital Cost and Utilization Project state inpa-
tient databases to examine the relationships between 38 different measures of inpatient
quality and 12 different measures of hospital market structure. They find a variety of
differing relationships: some quality measures positively related to measures of market
structure, some negatively, and some not at all (insignificant). The use of national data
591Competition in Health Care Markets
is an improvement on prior studies which only use data from a single state. While the
results seem somewhat murky, perhaps the variety of patterns they uncover in the data
is not surprising. First, since there is both price and quality competition, anything can
happen. Second, the use of multiple states, while laudable, does introduce additional
heterogeneity, which can be hard to measure. Third, finding results in every direction
is not terribly surprising with such a large number of different outcome measures.
Romano and Balan (2011) is an interesting recent study. Romano and Balan study
the impact on quality of care of a consummated merger between two hospitals in the
Chicago suburbs (Evanston Northwestern Hospital and Highland Park Hospital). This
merger was the subject of an antitrust suit by the Federal Trade Commission, and the
authors provided evidence on the case. This study uses the Inpatient Quality
Indicators and Patient Safety Indicators used by Encinosa and Bernard and by Sari.
The authors use a difference-in-differences methodology and compare the changes in
quality measures at the two merged hospitals before and after the merger to the
changes at control hospitals over the same time period. They find no significant
impact of the merger on many quality measures, but there is a significant negative
impact on some and a few with positive impacts. AMI, pneumonia, and stroke mor-
tality went up at Evanston Northwestern Hospital post-merger compared to control
hospitals, although there was no statistically significant impact at Highland Park.
There was some improvement in quality for some nursing-sensitive quality measures:
the incidence of decubitis ulcers (bedsores) fell at both merged entities, as did infec-
tions at Evanston Northwestern. Conversely, the incidence of hip fractures rose at
Evanston Northwestern. Last, they found increases in some measures of obstetric out-
comes (birth trauma to the newborn, obstetric trauma to the mother), and decreases
in some other measures. They conclude that overall there is no reason to infer that
the merger had salutary effects on quality.
Mutter et al. (2011) expand on other studies by examining the impacts of multiple
mergers (42) in multiple (16) US states. The authors use difference-in-difference analysis
to contrast changes in 25 different measures of quality (the AHRQ Inpatient Quality
Indicators and Patient Safety Indicators) at merging hospitals against changes at control
hospitals over the same time period. Mutter et al. find mixed results— mergers result in
increased, decreased or no change in quality depending on the measure and the nature
of the merger. For the majority of cases, mergers have no impact on quality. For a few
measures there are statistically significant impacts of mergers on quality, although there
are both positive and negative effects. Overall, the authors have a hard time finding
statistically significant impacts of hospital mergers on quality, implying that on average
there is no detectable effect. Their results do indicate, however, that mergers can have
either negative or positive quality impacts, depending on the measure of quality and
the specifics of the merger. The nature of these results has a lot in common with their
previous study (Mutter et al., 2008), which focused on measures of market structure,
592 Martin Gaynor and Robert J. Town
rather than merger. As with that study, while the results seem somewhat murky, perhaps
that is to be expected, given the large degree of heterogeneity in hospital mergers, and
the large number of outcome measures employed.
4.4.3. Studies of the Volume�Outcome RelationshipThere have been a very large number of studies of the “volume�outcome” relation-
ship, the majority in the medical literature. These studies commonly find a significant
correlation with the volume a hospital does of a procedure and the medical outcomes
of patients receiving the procedure at that hospital. The obvious concern with studies
of this kind is endogeneity. It may be that hospitals that do more of a procedure are
better at it, whether from learning by doing or by making quality improving invest-
ments. It may also be true, however, that patients are attracted to hospitals with the
best outcomes. The studies in the medical literature are unable to distinguish between
these two alternatives.
This is important for assessing competition in the hospital sector and for antitrust
enforcement. If volume causes quality, then there may be some efficiencies from
improved patient outcomes in more concentrated markets. This could also affect hospi-
tal merger evaluation. We review three relatively recent studies below that present the
strongest evidence to date on the volume�outcome effect: Ho (2002), Gowrisankaran
et al. (2004), and Gaynor et al. (2005). The results of these studies are summarized in
Table 9.12.
Ho (2002) examines the volume�outcome relationship for PTCA using data from
California hospitals from 1984 to 1996. The outcomes she examines are mortality and
emergency CABG. She estimates the effects of hospital cumulative and annual volume
on outcomes, employing hospital and time fixed effects. Ho finds substantial improve-
ments in outcomes over time, but a small effect of annual hospital volume on out-
come. The effect of cumulative volume on outcomes is imprecisely estimated.
Gowrisankaran et al. (2004) attempt to recover the causal relationship between
volume and outcome using instrumental variables. They study the volume�outcome
relationship for three surgical procedures: the Whipple procedure (removing tumors
from the pancreas); CABG; and repair of abdominal aortic aneurysm (this repairs
weak spots in the abdominal artery). They use data on hospitals from Florida from
1988 to 1999 and California from 1993 to 1997. The instrumental variables approach
is to use patient distance from the hospital to estimate patient choice of hospital and
then construct predicted volume. Gowrisankaran et al. find that increasing volume
causes better outcomes for all three procedures and find significant and large effects of
hospital volume on patient mortality. This implies that volume�outcome effects can
be important to consider when evaluating the impact of hospital competition. If com-
petition leads to reduced volume then outcomes will decline. If competition leads to
specialization then outcomes will improve.
593Competition in Health Care Markets
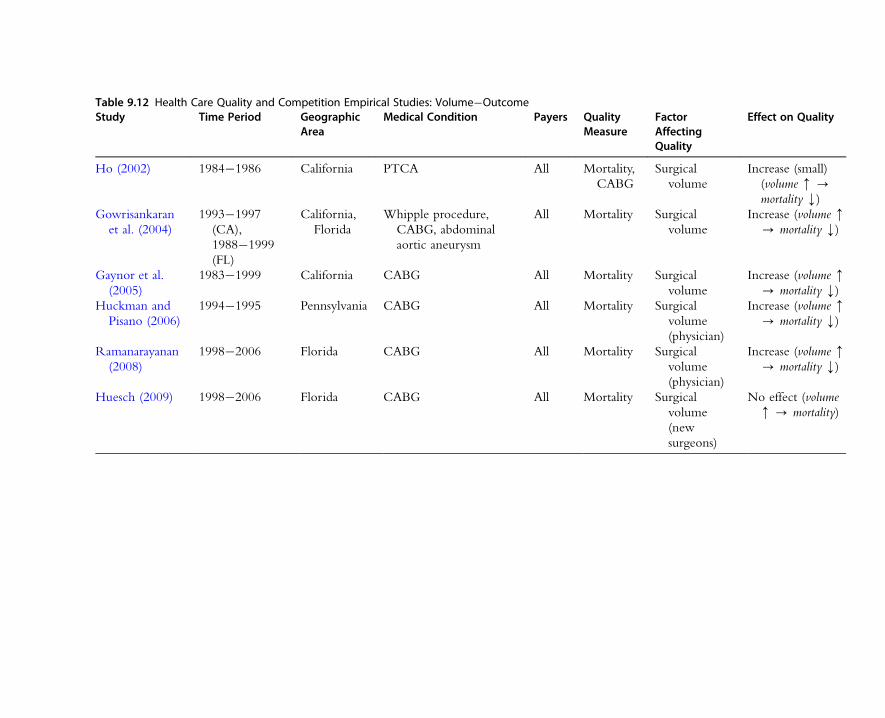
Table 9.12 Health Care Quality and Competition Empirical Studies: Volume�OutcomeStudy Time Period Geographic
AreaMedical Condition Payers Quality
MeasureFactorAffectingQuality
Effect on Quality
Ho (2002) 1984�1986 California PTCA All Mortality,
CABG
Surgical
volume
Increase (small)
(volume m -mortality k)
Gowrisankaran
et al. (2004)
1993�1997
(CA),
1988�1999
(FL)
California,
Florida
Whipple procedure,
CABG, abdominal
aortic aneurysm
All Mortality Surgical
volume
Increase (volume m- mortality k)
Gaynor et al.
(2005)
1983�1999 California CABG All Mortality Surgical
volume
Increase (volume m- mortality k)
Huckman and
Pisano (2006)
1994�1995 Pennsylvania CABG All Mortality Surgical
volume
(physician)
Increase (volume m- mortality k)
Ramanarayanan
(2008)
1998�2006 Florida CABG All Mortality Surgical
volume
(physician)
Increase (volume m- mortality k)
Huesch (2009) 1998�2006 Florida CABG All Mortality Surgical
volume
(new
surgeons)
No effect (volume
m - mortality)

Gaynor et al. (2005), in a similar paper, use instrumental variables techniques to
estimate the volume�outcome relationship for CABG. They use data from California
for 1983�1999. Gaynor et al. find a causal, and substantial, effect of volume on out-
come. For example, if CABGs could only be performed in hospitals with a volume
of 200 or greater, the average mortality rate from CABG would fall from 2.5 to
2.05 percent, saving 118 (statistical) lives. In a related working paper by the same
authors, Seider et al. (2000) simulate the effects of two mergers: a hypothetical “stan-
dard merger,” in which two out of five firms with equal market shares merge; and the
actual merger of Alta Bates Medical Center and Summit Medical Center in Oakland,
California. They find that, for larger hospital mergers (hospital volumes .140), the
value of saved lives from the standard merger outweighs the loss of consumer surplus
from increased prices. For the Summit�Alta Bates merger, which does not, however,
have a large effect on volume, the effect is a net loss of $2.8 to $4.4 million. The
reason is that the increase in volume due to the merger is too small to have much
effect on outcomes, while the price increase reduces welfare.
Huckman and Pisano (2006) examine the slightly different question of the rela-
tionship between volume and outcome for surgeons. Specifically, they ask whether it
is a surgeon’s volume at a particular hospital, or his/her overall volume that influences
surgical outcomes. Examining cardiac bypass (CABG) cases in Pennsylvania in 1994
and 1995, they find that the mortality rate of a surgeon’s patients at a specific hospital
improves significantly with increases in his or her volume at that hospital but not with
increases in his or her volume elsewhere. They do not specifically address the possibil-
ity of endogeneity of volume, although concerns over this may be allayed somewhat
by the findings from Gowrisankaran et al. (2004) and Gaynor et al. (2005) that fail to
reject exogeneity (although Ramanarayanan (2008), discussed below, rejects exogene-
ity in his study).
Ramanarayanan (2008) also attempts to identify physician specific volume�outcome
effects for CABG surgery. Ramanarayanan’s approach differs from Huckman and
Pisano in that he uses an instrumental variables strategy for identification (Huckman
and Pisano use lagged volume and lags of surgeon and hospital risk-adjusted mortality
to try to address endogeneity concerns) and uses data from Florida for 1998�2006.
The instrument is the departure of a surgeon—this departure has the impact of
exogenously shifting volume to remaining physicians. Ramanarayanan finds that
individual physician volume does have a significant impact on patient outcomes.
Unlike Huckman and Pisano, he does find that surgeon experience is somewhat
portable across hospitals. However, it is not fully portable—surgeon volume at the
“home” hospital has a much bigger impact on outcomes than does volume at other
hospitals. The results from these two papers (Ramanarayanan, 2008; Huckman and
Pisano, 2006) provide a more nuanced view on the volume�outcome relationship.
Physicians play an important role, but it is not simply the physician’s volume that
595Competition in Health Care Markets

determines outcomes. There are hospital-specific aspects to the volume�outcome
relationship, implying that concentrating procedures at a hospital can play a significant
role in improved outcomes.
In a novel approach to try to identify learning effects, Huesch (2009) estimates the
volume�outcome relationship for 57 “new cardiac surgeons” (physicians who had
completed their residencies immediately before the beginning of the time period he
examines). Huesch uses the same data covering the same time period as does
Ramanarayanan. He finds no evidence of a volume�outcome relationship for these
new cardiac surgeons. Indeed, allowing for forgetting, he finds that the effects of prior
experience do not carry over from one quarter to the next. Huesch uses fixed effects
and instrumental variables methods, although he does not reject exogeneity of volume
for the new doctors he examines. This result stands in marked contrast to Huckman
and Pisano and Ramanarayanan. One would expect that new physicians would be
those doing the most learning. This is not supported by the results of this study. It is
well known that learning by doing is difficult to identify empirically (see Thompson,
2010). Huesch and Sakakibara (2009) point out a number of possible mechanisms
that could be driving observed empirical volume�outcome relationships, and suggest
further thought on how to identify these specific mechanisms is in order.
4.5. SummaryThe empirical literature on competition and quality in health care markets is for the
most part fairly recent, and has grown very rapidly. The results from empirical
research are not uniform. Most of the studies of Medicare patients show a positive
impact of competition on quality. This is not surprising, since economic theory for
markets with regulated prices predicts such a result. However, the results from studies
of markets where prices are set by firms (e.g. privately insured patients) are much
more variable. Some studies show increased competition leading to increased quality,
and some show the opposite. While this may appear surprising, it is not. Economic
theory predicts that quality may either increase or decrease with increased competition
when firms are setting both quality and price.
This first generation of studies has provided a very valuable base of knowledge for
further research. The base that has been constructed, while extremely useful, does not
allow for normative analysis, for the most part. The results of these studies do not
allow us to make inferences about whether their estimated results imply that competi-
tion increased or decreased social welfare.
These results also contain some useful lessons for research on competition and
quality in other industries, specifically what can and cannot be learned via non-struc-
tural (SCP) econometric approaches, and what is required to obtain more refined
results.
596 Martin Gaynor and Robert J. Town
A major next step for research in this area is sorting out the factors that determine
whether competition will lead to increased or decreased quality. Economic theory can
be a helpful guide for these next generation studies. While theoretical models of price
and quality determination are complex and usually yield indefinite predictions, there
is also some simple intuition that can be gleaned from theory. Whether competition
leads to increased or decreased quality will depend on its relative impacts on firms’
price and quality elasticities of demand. Future research can focus on trying to recover
estimates of these key elements. Additionally, studies of price regulated markets can
refer back to theory to specify econometric models that include the regulated price
and marginal cost (or its determinants). In general, the sorts of studies discussed above
will allow for more precise positive analysis of the impact of competition on quality
in health care, and provide opportunities for normative analysis as well.
We need more detailed models, however, in order to perform normative analysis.
Thus, an important, although formidable, task for future work is to pursue the estima-
tion of more complete econometric models of quality determination in health care
markets. This means trying to recover preferences and costs (i.e. demand and supply).
The benefit of this approach is the ability to make clearer inferences about welfare, since
estimates of preference and cost parameters are in hand. The drawback is that such esti-
mates are not easily obtained. In particular, they usually can only be obtained at the cost
of making untestable assumptions. The quantity, and detail, of health care data may
make some of the assumptions employed in settings with sparser data unnecessary, how-
ever. Augmenting modern bargaining models of price determination with quality
choice may also be a fruitful approach to trying to identify the price and quality effects
of competition where prices are market determined. In the previous section 4.3 we
provided a preliminary sketch of what such a model might look like. Clearly more
work remains to be done, but this may be a promising avenue for future research.
5. STUDIES OF HEALTH INSURANCE MARKETS
5.1. IntroductionWhile a great deal of effort in health economics has been devoted to studying health
insurance, most research has been focused on consumer behavior, or on the implica-
tions of asymmetric information for selection and market outcomes (see Breyer et al.,
2012, for coverage of these topics). Until recently there has been very little work on
competition by health insurance firms. Part of the reason for this has been the paucity
of sufficient data for given markets to construct measures of prices or market shares in
the US and internationally. For the US, there are detailed household-level data (the
Medical Expenditure Panel Survey, http://www.meps.ahrq.gov/mepsweb/) on health
597Competition in Health Care Markets
insurance decisions and prices, but these data are from surveys of approximately 4,000
households selected to be nationally representative. As a consequence, they do not
fully describe the choices in a given market, or catalog the prices of alternatives,
let alone the market shares of sellers. Other data (National Association of Insurance
Commissioners, http://www.naic.org) do capture market shares, but at the level of a
state. Since the vast majority of health insurance restricts enrollees’ choices to a net-
work of providers, most of whom are local, the geographic market for health insur-
ance is local, and smaller than a state. In addition, there are no comprehensive data on
health plans’ networks of providers. The most comprehensive data on health insurance
markets have been for private insurance associated with the Medicare program
(Medigap coverage, Medicare1Choice/Medicare Advantage). Internationally, some
countries have enacted reforms that have led to the creation or expansion of private
health insurance markets (Germany, the Netherlands, Switzerland). Data from those
markets have become available over the last few years.
Another reason has been the difficulty of specifying a coherent model of competi-
tion in this market due to its complexity. For the US, the majority of private health
insurance is provided by employers to their workers as a (pre-tax) fringe benefit.
Within this category, some employers self-insure, and contract with insurers only to
administer their plans (including assembling a network of providers and negotiating
terms with them). This is typical of large employers. Other employers do purchase the
underwriting of risk from insurers, as well as administration. Of those that purchase
actual insurance, small employers are faced with very different circumstances than
large employers, mostly due to their smaller risk pool. Thinking about demand here is
complicated. First, employers are faced with the task of somehow aggregating employees’
preferences.96 Employers want to retain and attract productive employees, and so
have to offer competitive total compensation, including health insurance. Countries
like Germany, the Netherlands, and Switzerland do not have this particular compli-
cated institutional structure on the demand side, but have their own institutional
idiosyncracies that also present a challenge to economic modeling. Second, the
demand for a health insurance plan depends on its associated network of providers, as
we noted previously (this tends to be true in every country). Competition among
health plans is affected by their provider networks.
5.2. Empirical StudiesEmpirical studies have taken a number of different forms. One group of studies
have tried to study the impacts of competition on outcome variables. This includes
96 Dafny et al. (2010) present evidence that employers’ choices do not maximize employees’ welfare, although they do
not allow for effects of restricted choice on provider prices, and hence premiums. Also see Goldstein and Pauly
(1976).
598 Martin Gaynor and Robert J. Town
reduced-form studies, SCP studies, and studies of entry. Another set of studies have
written down complete demand- and supply-side models of the health insurance mar-
ket and proceeded with structural estimation. Yet another set of studies have estimated
the elasticity of demand for an insurance plan (as opposed to aggregate demand for
insurance). These studies are relevant to competition in insurance markets, since the
elasticity faced by sellers plays a large role in competition. In what follows, we review
these studies. We divide them into studies of competition and studies of demand
elasticity.
5.2.1. Studies of the Impacts of CompetitionTable 9.13 contains summaries of recent studies of health insurance market competi-
tion. This table is organized in a similar way to the previous tables summarizing
empirical studies of hospital market competition.
Dafny (2010) is one of the first of some new studies on insurance market competi-
tion. Dafny uses data from a benefits consulting firm on the plans purchased and pre-
miums paid by a large number (776) of large employers over the period 1998�2005.
While these data are not necessarily complete by market or nationally representative,
they do represent the most extensive and comprehensive data set with prices and
quantities for the insurance market. Dafny’s empirical approach is motivated by a bar-
gaining model between insurers and employers.97
Her identification strategy is to examine the effect of shocks to employer profit-
ability on the changes in the insurance premiums they pay. The idea is that if insurers
possess no market power then the premiums they charge will not vary with employer
profitability. Only if insurers have market power will they be able to price discriminate
based on employer profitability.98 Dafny finds strong evidence that premiums increase
with the buyer’s profitability. She also interacts profitability with the number of
insurers in the market. As the number of firms increases, market power should
decline. Her results are consistent with this hypothesis—the effect of employer profit-
ability on insurance premiums falls with the number of firms in the market. This
provides some evidence on competition in insurance markets where previously there
was none.
Of course, like any other study, it is possible that other factors could be driving
the results. In particular, premiums are not an ideal measure of the price of insurance.
Premiums consist of expected medical expenses, plus the insurer’s administrative costs,
plus any markup due to market power. In essence, the premium is a measure of
97 This is analogous to the bargaining model between insurers and hospitals that we presented in section 3.1. We did
not specify a bargaining model between insurers and hospitals, although bargaining between these agents surely
occurs. This emphasizes the complexity of the institutional structure of insurance markets and the difficult
modeling choices researchers must confront.98 Dafny is thinking in terms of a bargaining, as opposed to posted price, model, but the basic intuition is the same.
599Competition in Health Care Markets
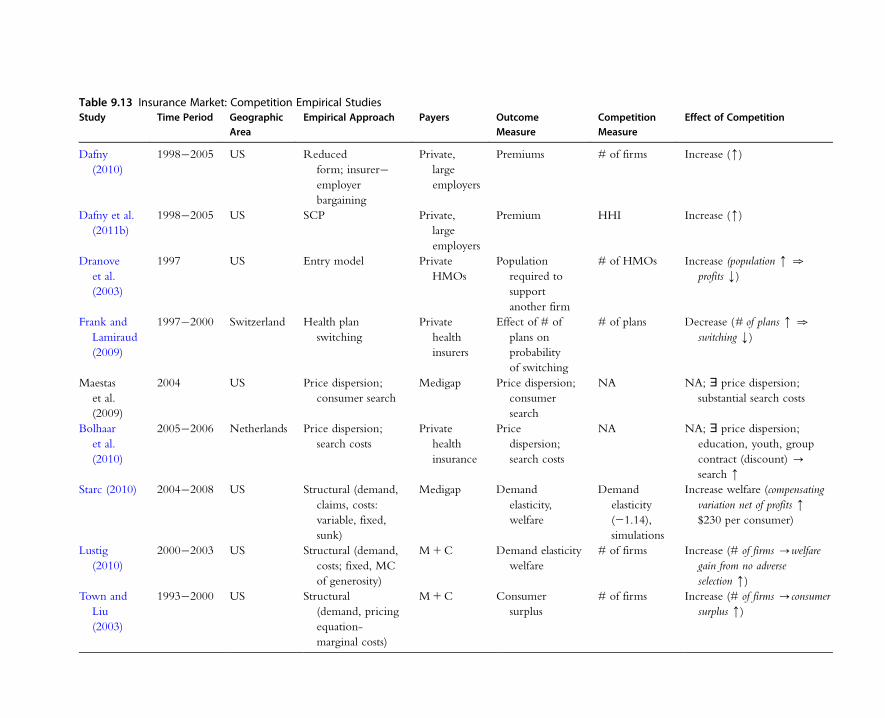
Table 9.13 Insurance Market: Competition Empirical StudiesStudy Time Period Geographic
AreaEmpirical Approach Payers Outcome
MeasureCompetitionMeasure
Effect of Competition
Dafny
(2010)
1998�2005 US Reduced
form; insurer�employer
bargaining
Private,
large
employers
Premiums # of firms Increase (m)
Dafny et al.
(2011b)
1998�2005 US SCP Private,
large
employers
Premium HHI Increase (m)
Dranove
et al.
(2003)
1997 US Entry model Private
HMOs
Population
required to
support
another firm
# of HMOs Increase (population m .
profits k)
Frank and
Lamiraud
(2009)
1997�2000 Switzerland Health plan
switching
Private
health
insurers
Effect of # of
plans on
probability
of switching
# of plans Decrease (# of plans m .
switching k)
Maestas
et al.
(2009)
2004 US Price dispersion;
consumer search
Medigap Price dispersion;
consumer
search
NA NA; ' price dispersion;
substantial search costs
Bolhaar
et al.
(2010)
2005�2006 Netherlands Price dispersion;
search costs
Private
health
insurance
Price
dispersion;
search costs
NA NA; ' price dispersion;
education, youth, group
contract (discount) -
search m
Starc (2010) 2004�2008 US Structural (demand,
claims, costs:
variable, fixed,
sunk)
Medigap Demand
elasticity,
welfare
Demand
elasticity
(21.14),
simulations
Increase welfare (compensating
variation net of profits m
$230 per consumer)
Lustig
(2010)
2000�2003 US Structural (demand,
costs; fixed, MC
of generosity)
M1C Demand elasticity
welfare
# of firms Increase (# of firms -welfare
gain from no adverse
selection m)
Town and
Liu
(2003)
1993�2000 US Structural
(demand, pricing
equation-
marginal costs)
M1C Consumer
surplus
# of firms Increase (# of firms -consumer
surplus m)
quantity of health insurance as well as the price. Expected medical expenditures are
the quantity—they will vary with the generosity of the health insurance plan, the
characteristics of the enrollees (sickness and preferences for medical care)—and pro-
vider prices. The part of the premium not due to medical expenses, the “load” or
“load factor,” is the price of insurance.
As Dafny realizes, the issue here is that if employers who experience positive profit
shocks share some of the rents with employees via more generous insurance coverage
then the observed relationship between employer profitability and health insurance
premiums may be quantity increases as opposed to price. One of her purposes in esti-
mating the specification with interactions between employer profitability and insur-
ance market structure is to test for this possibility. The fact that this effect is larger in
markets with fewer insurers suggests that it is not primarily due to increased plan gen-
erosity.99 Dafny also includes a control for plan design to try to control for generosity.
Including this variable does not alter the results. It is notable that there are significant
effects of employer profitability in insurance premiums even for markets with 9�10
insurers (the effect is insignificant for markets with 10 or more insurers). It seems sur-
prising that insurers would possess market power in markets with 8�9 rivals (9�10
firms total). This empirical result does raise some doubts, but research by Dranove
et al. (2003) found patterns in 1997 suggesting there may be market power in HMO
markets with up to six firms. In any event, Dafny is a contribution that opens a line
of empirical research on competition in health insurance markets.
Dafny et al. (2011b) take a more traditional SCP approach to examining health
insurance market competition. They employ the same dataset as in Dafny (2010), but
examine how the growth rate of an employer’s health insurance premiums is affected
by health insurance market concentration (HHI). They include variables intended to
control for factors that could influence medical spending or administrative costs (as
opposed to markup): a demographic factor, plan design factor, and the number of
enrollees in a plan. Initial OLS regressions reveal no significant effect of insurer market
concentration on premium growth. Of course, the HHI may be endogenous. In order
to deal with that problem Dafny et al. instrument for the observed HHI with changes
in local market concentration due to a large merger in 1999 between two national
health insurers: Aetna and Prudential Healthcare. Using this instrumental variables
approach, they find a significant impact of the predicted change in HHI due to the
merger on the change in premiums. They find that the cumulative effect of insurer
market consolidation on premiums is approximately 7 percent.
Dafny et al. also recognize that insurers may have bargaining power (market power
in a posted price world) with regard to providers. They therefore examine the effect
99 More precisely, what Dafny finds is that the effect of increased profitability for an employer is to increase premiums
in markets with few insurers by more than in markets with a large number of insurers, for the same employer.
601Competition in Health Care Markets
of insurer concentration on changes in earnings and employment for physicians and
for nurses as a way of testing for the presence of insurer monopsony power. They find
that the merger reduced physician earnings growth on average by 3 percent, while
nurses’ earnings rose by approximately six-tenths of 1 percent. There is no significant
effect on physician employment, while nurse employment grows as a result of the
merger-induced increase in concentration. It’s not clear if this is evidence of monop-
sony power, but it is consistent with plan concentration leading to downward pressure
on physician earnings and ultimately to substitution of nurses for physicians. Overall,
while the estimation results depend crucially on the use of the Aetna�Prudential
merger as an instrumental variable, they show evidence of a significant relationship
between changes in insurer market concentration and changes in premiums, implying
a link between market structure and the exercise of market power.
Dranove et al. (2003) employ a modification of the methodologies of Brenahan
and Reiss (1991) devised by Mazzeo (2002) to examine competition among HMOs.
They use data from 1997 on the number of HMOs in local markets, distinguishing
between HMOs that are national and those that are not. They first estimate threshold
ratios (the ratio of the population necessary to support n1 1 firms to that necessary
to support n) for all HMOs together. They find somewhat puzzling results: the
threshold ratio for two firms is 0.93 and for three firms is 1.58 (it declines thereafter).
A threshold ratio of 1 indicates that it takes exactly the same population (demand)
to support the second firm as to support the first. In the Brenahan and Reiss
framework this implies that there is no change in profitability with the entry of the
second firm, i.e. there’s no increase in competition in duopoly HMO markets com-
pared to monopoly. The threshold ratio above 1 for the third firm indicates that it
takes substantially more population (per firm) to support three HMOs than two,
implying that profit margins must be falling with the entry of the third firm (but not
the second).
Dranove et al. speculate that this seemingly strange pattern in the threshold ratios
may be due to product differentiation. If local HMOs do not compete strongly with
national HMOs (national employers may strongly prefer to buy from national HMOs
and local employers from local HMOs), then the estimates produced by pooling them
together could be misleading. Dranove et al. then employ the framework of Mazzeo
(2002), allowing for the possibility of any combination of any number of firms (up to
five) of each type. The parameter estimates indicate that the profits of local HMOs are
virtually unaffected by the number of national HMOs, and vice versa. By contrast,
the presence of a second same-type HMO reduces profits by approximately one-half.
The effects of subsequent same-type competitors on profits are negative, but declining
in magnitude. These results indicate that there is substantial competition in HMO
markets, but also substantial product differentiation. Dranove et al.’s results indicate
that there is virtually no competition at all between national and local HMOs.
602 Martin Gaynor and Robert J. Town
The studies by Dafny (2010), Dafny et al. (2011b), and Dranove et al. (2003) find
evidence that market structure affects conduct—more firms in a market are associated
with tougher competition. Some other studies call that relationship into question.
Frank and Lamiraud (2009) examine the functioning of health insurance markets
in Switzerland. Switzerland requires all residents to have health insurance. Health
insurance is privately supplied, but the market is heavily regulated. The government
defines a standardized benefit for the required coverage, mandates guaranteed issue by
insurers, adjusts the payments insurers receive to compensate them for risk,100 and
provides public information on prices. Frank and Lamiraud document a high degree
of price dispersion in Swiss health insurance markets, with little evidence of conver-
gence over time. The number of health insurers has declined over time, but the mean
number of health plans per canton rose from 40 in 1997 to 56 in 2004. Switching
rates across plans were low: 4.8 percent in 1997, 2.1 percent in 2000, then stabilizing
at around 3 percent.
Frank and Lamiraud find this puzzling, given the rather large price differences
across plans with identical benefits. They speculate that the presence of a large
number of choices may lead to decision overload. They make use of survey data on
individuals and publicly reported information on health insurance plans to estimate
a model of individual health plan switching and attempt to test these hypotheses.
They find that switching is significantly larger in areas with fewer plans, and that
those who switched paid significantly less than those staying with the same plan
(15.9 percent less; 33.18 CHF). These results do not seem consistent with price
competition getting tougher with the number of firms. Now, to be clear, the studies
by Dafny, Dafny et al., and Dranove et al. are on the large employer segment of the
US private health insurance market. There, purchasing decisions are made by large
corporations, so one would presume that these decisions are likely to be rational.
The Frank and Lamiraud study examines the decisions of individual consumers in
Switzerland. The most important difference is that individuals are making decisions,
not large employers. Individuals are more likely to be affected by transactions costs
or irrationality than are large corporations. Of course, the institutions in the Swiss
individual health insurance market and the US large employer market are also quite
different, but it seems to us that the most likely reason for the different patterns
observed in these studies is due to the differences between decision making for
individuals vs. that for large employers.
Similar patterns with regard to price dispersion have been documented in the
US market for Medigap insurance and in the Netherlands health insurance market.
Medigap is private insurance purchased by Medicare beneficiaries to cover the “gaps” in
the Medicare coverage provided by the government. The insurance covers coinsurance
100 Payments are adjusted up or down based on the expected medical expenses of the insurer’s enrollee pool.
603Competition in Health Care Markets

payments, deductibles, and those items or services that are excluded from the publicly
provided coverage (most notably prescription drugs before the introduction of Medicare
Part D).
Maestas et al. (2009) document substantial price variation in Medigap insurance
markets, even though plans are standardized.101 They apply the search model of
Carlson and McAfee (1983) and find that insurers have substantial differences in costs,
and hence loading fees, which contribute to the observed variation in prices. This
price dispersion is an equilibrium due to substantial search costs—Maestas et al.
estimate an average search cost for consumers in the market of $72 and a maximum
of $144.
Bolhaar et al. (2010) also find substantial price dispersion in the Netherlands mar-
ket for health insurance. This market is also subject to substantial regulation, including
policy standardization and the dissemination of information to consumers, so the exis-
tence of price dispersion is somewhat surprising. They employ a unique dataset, the
Dutch Health Care Consumer Panel, which contains information on actual consumer
search behavior. They find that more educated consumers and younger consumers are
more likely to search. In the Dutch system, there are also group contracts (e.g. an
employment group). These are offered at a discount. They find a very strong correla-
tion between an offer for a group contract and the probability of search.
Starc (2010) models the Medigap market, allowing for adverse selection and
market power. She documents that the market is highly concentrated—the national
four-firm concentration ratio is 83 percent (compared to 44 percent for private
passenger automobile insurance or 34 percent for life insurance), and two firms
(United Health, 46 percent; Mutual of Omaha, 24 percent) account for almost all of
that. Starc documents substantial price dispersion for Medigap policies, confirming
Maestas et al., and documents a positive relationship between premiums and market
concentration, the same qualitative result as in Dafny et al. (2011b), albeit for a very
different market. A 1 percent increase in the two-firm concentration ratio is associated
with a 0.26 percent increase in premiums.
Starc estimates a structural model of insurance demand, claims, and seller costs (vari-
able, fixed, sunk) using data from the National Association of Insurance Commissioners
(NAIC) and the Medicare Current Beneficiary Survey for 2006�2008. She estimates
the average price elasticity of demand to be 21.12. This is a very low elasticity for
firm demand, especially given the standardization of the products sold in this market.
It is possible this is due to aggregation—the NAIC data are at the level of the state
and the true geographic market is likely much smaller than that. It is also possible that
the instruments are weak and that is what is driving the seemingly low estimate. The
101 Studies of quite a few other markets have found substantial price dispersion, even in what one might think are
competitive markets (e.g. Pratt et al., 1979; Dahlby and West, 1986; Gaynor and Polachek, 1994; Sorensen, 2000).
604 Martin Gaynor and Robert J. Town

estimate of the claim function (estimated jointly with demand) reveals that insurer
claims increase with premiums—a $100 increase in premiums will lead to a
$15 increase in claims. This indicates the presence of adverse selection—higher
risk consumers are less price sensitive. In the case of adverse selection, claims are
increasing in the premium charged by the insurer. As a consequence, insurers facing
adverse selection will charge lower markups of premiums over marginal costs than
they otherwise would. This is a classic case of the second best—two distortions
are better than one. The monopoly power of insurers is actually reduced by the
“additional” distortion of adverse selection.
Starc also recovers estimates of cost parameters. For variable costs this is done in
the usual manner, via a pricing equation and an assumption about conduct, but with
the following wrinkle to account for an institutional feature of health insurance mar-
kets. Health insurers are subject to minimum loss ratio regulations by the federal gov-
ernment—65 percent of premiums collected are required to be paid out to enrollees
as reimbursements for covered services. Starc incorporates this into estimation as an
inequality constraint on pricing (premium setting). She estimates that United Health’s
variable (administrative) costs are about 6 percent of premiums, while they are esti-
mated to be 18 percent of premiums for Mutual of Omaha.
Estimates of bounds on fixed or sunk costs can be recovered from the data. This
employs the following intuition. First, assume that Mutual of Omaha faces fixed costs
of entering each local market (a state). United Health, by contrast, expends resources
on promotion (e.g. obtaining AARP’s endorsement) entering the national market.
These are sunk costs. Second, we observe, for example, one firm employing Mutual
of Omaha’s strategy. This implies that Mutual of Omaha is profitable, and a second
firm employing that strategy would not be profitable. Therefore the lower bound for
Mutual’s fixed costs are the expected variable profits for a second firm employing their
strategy, and the upper bound is the expectation of variable profits. The same exercise
is performed to identify the bounds on the sunk costs of entering the national market.
The bounds on Mutual of Omaha’s fixed costs of entering a state are estimated at
approximately $445,000 and $796,000, implying fixed costs of entering all of the 50
state markets between $22 and $40 million. The bounds on United Health’s sunk
costs of entering the national market are approximately $99 million and $488 million.
The standard errors on these estimates are very large.
With these estimates in hand, Starc proceeds to welfare analysis. First, the impact
of adverse selection in insurers’ pricing is computed by setting the derivative of claims
with respect to price to zero and then finding optimal prices.102 This increases pre-
miums by 9 percent and reduces the size of the market (lowers insurance coverage) by
102 Recall that adverse selection is manifested as a positive impact of premiums on claims. This positive relationship
reduces the profit-maximizing price for insurers, since setting a higher price attracts enrollees who are higher risk
and more expensive.
605Competition in Health Care Markets
18 percent. Welfare falls by 7 percent. This is interesting, because in this situation
where there is market power, welfare is improved by the presence of adverse selection.
This is entirely the opposite of the impact of adverse selection in a competitive
insurance market. Starc goes on to calculate the impact of setting premiums equal to
average and to marginal claims. These lead to large reductions in prices—44 and
45 percent, respectively. The median compensating variation to consumers is $644
($670), and falls to $230 ($230) net of reduced producer profits.
These results emphasize the substantial market power exercised in this market. It
points out that insurance subsidies or mandates will mostly result in increased rents
to sellers, with little impact on welfare. Starc interprets the low demand elasticity
and associated high degree of market power as due to strong brand loyalty. The
strong brand loyalty provides sellers with a strong incentive to engage in extensive
marketing and promotion activities. Policies to reduce brand effects, such as provid-
ing better consumer information, or attracting entry, can substantially enhance
welfare.
Another paper that models both adverse selection and market power in insurance
markets is Lustig (2010). Lustig examines the market for Medicare1Choice plans in
2000�2003. Medicare1Choice are private managed care plans that Medicare benefi-
ciaries may choose as an alternative to traditional Medicare (the current version of this
program is called Medicare Advantage). Lustig has a clever idea to identify adverse
selection. Consumers’ preferences for plan generosity should increase plans’ costs if
there’s adverse selection. He recovers preferences from demand estimation, then esti-
mates plans’ cost function to test for adverse selection. He finds that generosity prefer-
ences have a significant impact on plan fixed costs, but not the marginal cost of plan
generosity. Further, consumers’ health risk has no significant impact on insurers’ costs.
This is a very clever test, and the results are interesting, but they do not seem very
supportive of adverse selection. It seems like generosity preferences should affect
insurers’ marginal costs of generosity, as should consumers’ health risks. Lustig then
goes on to do welfare analysis. In particular, he uses the model estimates to simulate
welfare when adverse selection is eliminated, then compares this to welfare measured
at the allocation observed in the data. This gain from eliminating adverse selection is
simulated for markets with increasing numbers of insurers (1,2,. . . ,6,. 6) to generate
effects of competition. Lustig finds that the gains to eliminating adverse selection
increase monotonically in the number of insurance firms. For example, in one of his
simulations Lustig finds that removing adverse selection eliminates 17 percent of the
difference in welfare between the observed and socially optimal outcomes where
there’s a monopoly, while it eliminates 35 percent of the difference in a duopoly, and
50 percent where there are six or more firms. This implies that when there is market
power most of the welfare loss is due to the exercise of market power as opposed to
adverse selection.
606 Martin Gaynor and Robert J. Town
An earlier paper by Town and Liu (2003) focuses on estimating the welfare associ-
ated with Medicare1Choice, and conducts an analysis of the impact of competition
on welfare. Their model does not allow for adverse selection. They find that the crea-
tion of the M1C program resulted in approximately $15.6 billion in consumer sur-
plus and $52 billion in profits from 1993 to 2000 (in 2000 dollars). They find
evidence of competitive effects. Consumer surplus increases in the number of plans in
a county, and most of the increase in welfare is due to increased premium competi-
tion. Comparing monopoly markets versus markets with four firms, they find that 81
percent of the difference in welfare (higher in quadropoly markets) is due to increased
premium competition. Of the remainder, 3 percent is from increased product variety
and 8 percent from prescription drug coverage.
As stated previously, most of the literature on health insurance markets has focused
on market imperfections due to asymmetric information (Breyer et al., 2012). The
smaller and newer literature on market power in health insurance markets, which we
have just been describing, abstracts away from issues of asymmetric information. The
papers by Starc and Lustig represent significant innovations by modeling a health
insurance market with adverse selection and market power. While the models differ,
and are applied to different markets (Medigap, Medicare Advantage), both sets of
results point to market power as the major source of welfare loss in this market, as
opposed to adverse selection. We should also note that the studies by Starc (2010) and
Lustig (2010) are not necessarily inconsistent with the studies by Dafny (2010), Dafny
et al. (2011b), and Dranove et al. (2003). Both sets of studies point to the existence of
market power in health insurance, and market power decreasing in the number of
firms. It is also worth noting that these structural studies of health insurance markets
find much larger estimates of demand responsiveness than have studies that estimate
demand using insurance choices by employees within a single firm. Those studies find
evidence of substantial switching costs (Handel, 2010) or large (and persistent) plan
preference heterogeneity (Carlin and Town, 2009) that are associated with low esti-
mates of demand elasticity.
5.2.2. Studies of the Elasticity of Demand for Health InsuranceThere have been many studies of the elasticity of demand for health insurance. We do
not attempt a complete review here. Our purpose is instead to report a few estimates
as a means of providing insight into the potential for competition in the health insur-
ance market. If the elasticity of demand facing a firm is low, then there is not much
potential for market power.103 Most of the US evidence comes from studies of
employee choice among plans within firms. The Carlin and Town and Handel studies
103 A traditional measure of market power, the Lerner Index, which measures the ratio of the price�marginal cost
markup to price, is equal to the absolute value of the inverse of the firm’s own-price elasticity of demand.
607Competition in Health Care Markets
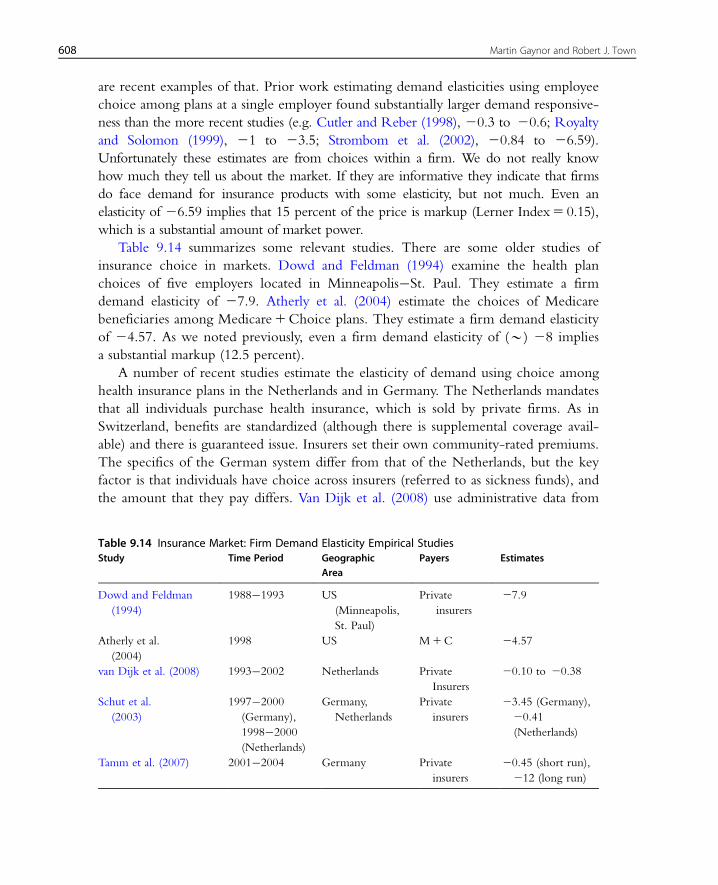
are recent examples of that. Prior work estimating demand elasticities using employee
choice among plans at a single employer found substantially larger demand responsive-
ness than the more recent studies (e.g. Cutler and Reber (1998), 20.3 to 20.6; Royalty
and Solomon (1999), 21 to 23.5; Strombom et al. (2002), 20.84 to 26.59).
Unfortunately these estimates are from choices within a firm. We do not really know
how much they tell us about the market. If they are informative they indicate that firms
do face demand for insurance products with some elasticity, but not much. Even an
elasticity of 26.59 implies that 15 percent of the price is markup (Lerner Index5 0.15),
which is a substantial amount of market power.
Table 9.14 summarizes some relevant studies. There are some older studies of
insurance choice in markets. Dowd and Feldman (1994) examine the health plan
choices of five employers located in Minneapolis�St. Paul. They estimate a firm
demand elasticity of 27.9. Atherly et al. (2004) estimate the choices of Medicare
beneficiaries among Medicare1Choice plans. They estimate a firm demand elasticity
of 24.57. As we noted previously, even a firm demand elasticity of (B) 28 implies
a substantial markup (12.5 percent).
A number of recent studies estimate the elasticity of demand using choice among
health insurance plans in the Netherlands and in Germany. The Netherlands mandates
that all individuals purchase health insurance, which is sold by private firms. As in
Switzerland, benefits are standardized (although there is supplemental coverage avail-
able) and there is guaranteed issue. Insurers set their own community-rated premiums.
The specifics of the German system differ from that of the Netherlands, but the key
factor is that individuals have choice across insurers (referred to as sickness funds), and
the amount that they pay differs. Van Dijk et al. (2008) use administrative data from
Table 9.14 Insurance Market: Firm Demand Elasticity Empirical StudiesStudy Time Period Geographic
AreaPayers Estimates
Dowd and Feldman
(1994)
1988�1993 US
(Minneapolis,
St. Paul)
Private
insurers
27.9
Atherly et al.
(2004)
1998 US M1C 24.57
van Dijk et al. (2008) 1993�2002 Netherlands Private
Insurers
20.10 to 20.38
Schut et al.
(2003)
1997�2000
(Germany),
1998�2000
(Netherlands)
Germany,
Netherlands
Private
insurers
23.45 (Germany),
20.41
(Netherlands)
Tamm et al. (2007) 2001�2004 Germany Private
insurers
20.45 (short run),
212 (long run)
608 Martin Gaynor and Robert J. Town
the Netherlands, and estimate the price elasticity of residual demand facing an insur-
ance firm as ranging from 20.10 (for women aged 55�64) to 20.38 (for men aged
25�34). These are very low firm elasticities, which seems to imply little potential for
competition in the Dutch health insurance market. Since no profit-maximizing firm
should operate in the inelastic portion of their demand curve, these numbers seem
too low to represent actual residual demand elasticities. Unfortunately van Dijk et al.
only have one year of actual data—they construct a synthetic panel from the actual
data, given institutional facts about the market. This may have something to do with
the low estimates of elasticities.
Schut et al. (2003) estimate demand elasticities for the Netherlands and for
Germany. They estimate the firm elasticity of demand for Germany to be 23.45 (in
1997�2000). The Dutch elasticity is estimated at most to be 20.41 (1998�2000).
Again, this seems implausible as a firm elasticity of demand. Tamm et al. (2007) use
panel data from Germany over the period 2001�2004 and find a short-run price
elasticity of approximately 20.5. The long-run elasticity is approximately 212.
Overall, the results that find estimated firm demand elasticities below (minus) 1
are hard to understand. Those that are greater than 1 in absolute value are what one
would expect. Nonetheless, those numbers, like the earlier estimates from the US,
taken at face value, indicate the presence of substantial market power on the part of
insurers in the German health insurance market.
5.3. SummaryThere has not been much empirical research on competition in health insurance mar-
kets until very recently, as the dates of most of the studies reviewed in this section
demonstrate. Most of the studies find evidence that competition leads to lower prices.
In the US, the papers by Dafny and Starc present evidence that the markets for large
employer insurance and for Medigap are highly concentrated, leading to higher
prices. The studies by Frank and Lamiraud, Maestas et al., and Bolhaar et al. docu-
ment substantial price dispersion and search costs. The Frank and Lamiraud study sug-
gests that consumers may be subject to psychological biases that undermine the
market mechanism. There are not many studies of the elasticity of demand faced by
insurance firms for their products in the market. Those that exist for the US and
Germany do find fairly substantial elasticities of demand, although it should be noted
that even those estimates imply that insurers possess substantial market power. The
demand elasticity estimates for the Netherlands are all below 21. Since firms should
not be operating on the inelastic portions of their demand curves this presents a bit
of a puzzle. Further work is required to understand what is driving these estimates.
If it truly is consumer behavior, then more work has to be done understanding the
demand side of this market.
609Competition in Health Care Markets
Overall, the studies reviewed in this section represent substantial additions to
knowledge. Further research is required on both the demand and supply sides of this
market. The Netherlands insurance market and the market for private health insur-
ance in the US present opportunities for employing careful economic modeling to
advance our understanding of this complicated market. In addition, at present there
are no studies of competition in the US (private) markets for small group or individ-
ual insurance (we presume due to data limitations). Those are the markets most fre-
quently referred to as functioning poorly. Understanding how well these markets
function, and the role played by competition, is an important task for economic
research.
6. STUDIES OF PHYSICIAN SERVICES MARKETS
6.1. IntroductionOver the years a great deal of attention has been paid by health economists to issues
regarding physicians. The majority of that work has focused on the role of asymmetric
information. A great deal of that has been about the impact of asymmetric informa-
tion on the market relationships between patients and physicians, i.e. physician-
induced demand. Another component has been focused on incentives and payment
mechanisms for physicians. Relatively little, however, has focused on competition
per se. One of the reasons for that, perhaps, is the fact that the majority of physician
services markets have large numbers of sellers and entry into a (local) market is rela-
tively easy. It seems reasonable to characterize most markets for physician services as
monopolistically competitive, and a relatively mild form of monopolistic competition
at that.
There are some reasons, however, to think that the monopolistic competition
model may be an accurate depiction of these markets no longer. Insurers no longer
allow their enrollees to see any physician they like. Physicians must be members of
the insurer’s network. This implies that entry into a market requires entry into an
insurer’s provider network (at least one). This may be a more substantial cost associ-
ated with entry than existed previously. Separately, the nature of competition also
depends on the product markets. Markets for more specialized services have fewer
sellers. The costs of entry into a specific local market may be higher due to the need
for access to specialized labor and facilities. In any event, the extent of competition in
the aggregate is limited by the total stock of physicians who can supply these special-
ized services. Given the limited entry of new physicians into the specialties that supply
these services there is only so much competition possible.
In addition, geographic markets may be fairly limited. They are almost certainly
smaller than an entire metropolitan area. As a consequence, buyers who wish to have
610 Martin Gaynor and Robert J. Town
physician practices in their network in locations convenient for their enrollees may be
facing fewer sellers than it might appear. An additional factor is the possibility of
monopsony power in physician services markets. Insurance companies are large rela-
tive to physician practices. It may appear that insurers may be able to exercise monop-
sony power as buyers. The monopolistic competition model does not admit that
possibility and thus is not useful for considering this issue. A posted price model of
monopsony (or more accurately oligopsony) is an alternative, but does not really cap-
ture the true nature of buyer and seller interchange in this market.
There is some recent theoretical work which considers the impact of competition
among physicians in an asymmetric information setting. Allard et al. (2009) examine
physicians’ provision of care under information asymmetry in a dynamic game.
Without repetition all physicians provide minimum effort. With repetition, competi-
tion can serve to discipline physicians—it is even possible the physicians will supply
optimal effort. Introducing patient switching costs reduces the effect of competition,
but it still serves to set a lower bound on physician effort. Competition serves a
socially useful role in disciplining shirking by physicians in the face of asymmetric
information.
Dulleck and Kerschbamer (2009) analyze the case where there is a competitive
market with experts and discounters supplying consumers. Experts can diagnose and
treat problems, while discounters can only offer a treatment (without performing
diagnosis). They show that in a competitive market experts may refrain from diagnosis
to prevent consumers from obtaining a lower price for treatment from a discounter.
In this setting, competition does not enhance welfare.
The bargaining model we describe in section 3.1 could also be applied to physi-
cians, although it does not include asymmetric information. It admits market power
on either side of the market through the bargaining abilities and threat points of the
buyers and sellers. However, at present data limitations (at least for the US) preclude
the estimation of such a model. Indeed, the empirical literature on physician competi-
tion is quite sparse. This is undoubtedly mostly due to lack of data with which to test
hypotheses about competition. It may also be that health economists’ attention has
been drawn elsewhere. There is no doubt that there are interesting and important
issues to address in this area.
6.2. Empirical Studies of Physician Services MarketsIn what follows, we review the empirical literature on competition in physician ser-
vices markets. We focus mostly on research that has been published (or at least writ-
ten) since the previous volume of this Handbook came out. The papers are divided
into two areas: entry and market structure, and studies of pricing conduct. Table 9.15
contains summary information on these studies.
611Competition in Health Care Markets
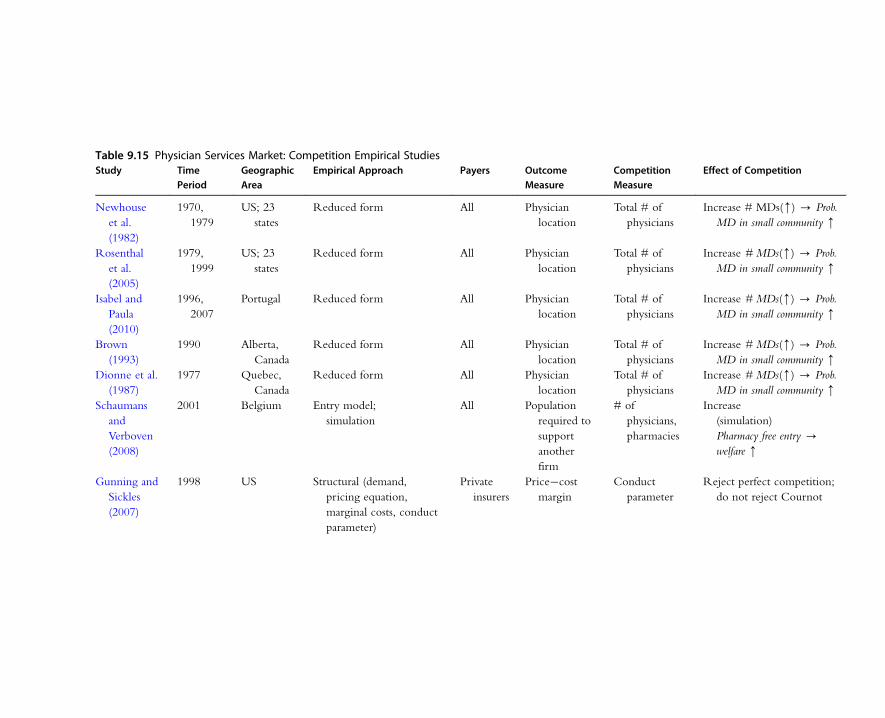
Table 9.15 Physician Services Market: Competition Empirical StudiesStudy Time
PeriodGeographicArea
Empirical Approach Payers OutcomeMeasure
CompetitionMeasure
Effect of Competition
Newhouse
et al.
(1982)
1970,
1979
US; 23
states
Reduced form All Physician
location
Total # of
physicians
Increase # MDs(m) - Prob.
MD in small community m
Rosenthal
et al.
(2005)
1979,
1999
US; 23
states
Reduced form All Physician
location
Total # of
physicians
Increase # MDs(m) - Prob.
MD in small community m
Isabel and
Paula
(2010)
1996,
2007
Portugal Reduced form All Physician
location
Total # of
physicians
Increase # MDs(m) - Prob.
MD in small community m
Brown
(1993)
1990 Alberta,
Canada
Reduced form All Physician
location
Total # of
physicians
Increase # MDs(m) - Prob.
MD in small community m
Dionne et al.
(1987)
1977 Quebec,
Canada
Reduced form All Physician
location
Total # of
physicians
Increase # MDs(m) - Prob.
MD in small community m
Schaumans
and
Verboven
(2008)
2001 Belgium Entry model;
simulation
All Population
required to
support
another
firm
# of
physicians,
pharmacies
Increase
(simulation)
Pharmacy free entry -
welfare m
Gunning and
Sickles
(2007)
1998 US Structural (demand,
pricing equation,
marginal costs, conduct
parameter)
Private
insurers
Price�cost
margin
Conduct
parameter
Reject perfect competition;
do not reject Cournot
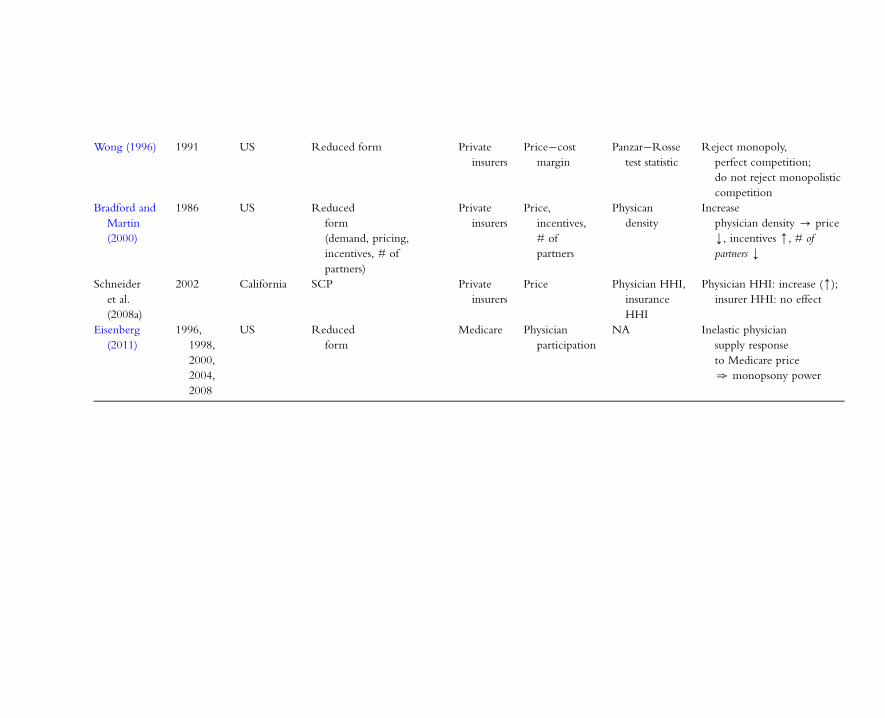
Wong (1996) 1991 US Reduced form Private
insurers
Price�cost
margin
Panzar�Rosse
test statistic
Reject monopoly,
perfect competition;
do not reject monopolistic
competition
Bradford and
Martin
(2000)
1986 US Reduced
form
(demand, pricing,
incentives, # of
partners)
Private
insurers
Price,
incentives,
# of
partners
Physican
density
Increase
physician density - price
k, incentives m, # of
partners k
Schneider
et al.
(2008a)
2002 California SCP Private
insurers
Price Physician HHI,
insurance
HHI
Physician HHI: increase (m);
insurer HHI: no effect
Eisenberg
(2011)
1996,
1998,
2000,
2004,
2008
US Reduced
form
Medicare Physician
participation
NA Inelastic physician
supply response
to Medicare price
. monopsony power
6.2.1. Studies of Entry and Market StructureLocation theory implies that there will be a minimum population necessary for a
given area to support a physician of a particular specialty. The smaller the total num-
ber of physicians in a given specialty, the greater the critical value of population. If
the total number of physicians expands, the minimum population necessary to support
a physician will fall. This was first exposited and tested by Newhouse et al. (1982),
who found that the size of a town affects the probability of having a physician located
there. They also make use of the fact that the number of specialists in the US
increased dramatically over the decade of the 1970s. The theory predicts that towns
that did not previously have a specialist would gain them at a greater rate than those
that did. They find that this is so.
Rosenthal et al. (2005) revisit this hypothesis using data from the 1980s and 1990s.
They examine 23 states with low physician to population ratios. The total number of
physicians in these states doubles from 1970 to 1999. They find that communities of
all sizes gained physicians over this period, but that the impact was larger for smaller
communities, as predicted by the theory.
A recent paper by Isabel and Paula (2010) examines some of these issues using data
for Portugal from 1996 and 2007. The total number of physicians in Portugal grew by
approximately 30 percent over that period and the number per capita grew by approx-
imately 22 percent. They estimate a static model using 2007 data and find that popu-
lation size has a large and significant impact on the number of physicians per capita
located in an area. They also test a dynamic model and find that areas that had more
physicians per capita in 1996 had lower growth in the number of physicians per capita.
This is consistent with the hypothesis of Newhouse et al. Brown (1993) finds confir-
mation of the hypothesis for the Canadian province of Alberta, although the evidence
is not overwhelming. A study by Dionne et al. (1987) also found this to be true for
the province of Quebec, Canada.104 The results of these studies are consistent with
competitive effects from entry.
A recent paper by Schaumans and Verboven (2008) examines the determinants of
entry in physician services markets in Belgium. They consider the entry decisions
of pharmacies as well. Pharmacies and physician practices provide complementary
services—physicians prescribe drugs and pharmacists dispense them. As a consequence,
each type of firm benefits from the presence of the other. Both prescription drug
prices and physician services prices are heavily regulated in Belgium. Therefore,
both pharmacies and physician practices only engage in non-price competition (con-
venience, quality of service, quality of care, etc.). The entry of physicians into local
104 Dionne et al. have the innovation of controlling for the number of good restaurants in a community. They find
this to influence physician location. It remains an open question if Quebecois physicians are uniquely responsive
to restaurant quality—alas, no such data have been employed by researchers in other countries (or other parts of
Canada).
614 Martin Gaynor and Robert J. Town
markets is free, but pharmacy entry is regulated—there is a maximum number of
pharmacies allowed in an area based on the local population. Schaumans and
Verboven adapt the models of Brenahan and Reiss (1991) and Mazzeo (2002) to
allow for entry restrictions for pharmacies and that products sold by the two types
of firms (pharmacies and physicians) may be strategic complements.105 As in the
Brenahan and Reiss and Mazzeo work, this is a static game and the outcomes in
terms of market structure (numbers of firms of both types), as opposed to firm iden-
tities, is what is modeled. They find that the population necessary to support a given
number of firms increases approximately proportionately with the number of firms.
As in Brenahan and Reiss, this implies that entry does not lead to tougher competi-
tion. As mentioned previously, price competition is not feasible for physicians’
practices or pharmacies in Belgium. These results imply that they do not engage in
more intense price competition as more firms of their own type enter a market.
They also find that the population necessary to support another physician practice
falls with the number of pharmacies, and vice versa. This supports the hypothesis
of strategic complementarities.
Schaumans and Verboven then use the parameter estimates from the model to sim-
ulate the impacts of policy reform toward pharmacies. They consider easing entry
restrictions by increasing the maximum number of pharmacies allowed in an area, and
reducing pharmacies’ regulated markups. They find that simply allowing free entry
(no change in markups) would increase the number of pharmacies by 173 percent.
The complementarities between pharmacies and physician practices lead to a 7 per-
cent increase in the number of physician practices as a result of the entry liberalization
for pharmacies. If pharmacy markups are reduced to 50 percent of their original levels
then with free entry the number of pharmacies increases by 44 percent and the num-
ber of physician practices increases by six-tenths of 1 percent. Not surprisingly, a drop
in markups decreases the magnitude of entry, but it is still extensive. The results of
Schaumans and Verboven do not indicate conduct changing with the number of
firms, but this is a very heavily regulated environment, so it is unlikely the results are
very general except for other countries with similar regulatory environments.
6.2.2. Studies of Pricing ConductGunning and Sickles (2007) estimate a structural model of pricing conduct by physi-
cian practices. They employ the framework described in Bresnahan (1989) to estimate
the conduct parameter θ in the following pricing equation (for quantity setters):106
105 Brenahan and Reiss (1991) test whether conduct changes with the number of firms in the market for doctors,
dentists, plumbers, and tire dealers located in isolated markets (mostly rural) in the US. They find evidence that
competition among doctors gets tougher with the number of practices in a market, up until the third. After three
practices there is no further increase in the toughness of competition.106 Bresnahan’s framework covers quantity or price setting. He refers to equation (9.37) as a “supply relation.”
615Competition in Health Care Markets

pj 5@c
@qj2 qj
@qj@pj
� �21
θ ð9:37Þ
The conduct parameter, θ, is a parameter to be estimated, along with demand and
costs. The value of θ provides information about the toughness of competition.
A value of θ equal to zero implies perfect competition (no markup). The farther that
θ is from zero, the farther is conduct from competitive. Gunning and Sickles use data
from the 1998 American Medical Association Socioeconomic Monitoring Survey
(AMASMS) to estimate this model. They estimate average firm price elasticities
of 21.75 to 22.35. Taken alone, these imply substantial market power and substantial
markups. Their overall estimate of the conduct parameter is 21.34.
They strongly reject the null hypothesis of perfect competition, but cannot reject
the hypothesis of Cournot conduct (θ5 1). For generalist physicians the estimate of θis 21.87, and the hypotheses of perfect competition and Cournot conduct are both
rejected. While this is a worthy exercise, the results are surprising. An estimate of a
negative value of θ implies that physician practices are pricing below marginal cost.
This seems implausible, especially if one takes the elasticity estimates as valid. Those
estimates indicate that physician practices have substantial power to mark up price
over marginal cost, but the conduct parameter indicates that they do the opposite.
Identification of the conduct parameter requires a “demand rotator” (Bresnahan,
1989). Suppose an exogenous variable rotates the demand curve around the equilib-
rium point. If the market is perfectly competitive, there is no change in price (or
quantity). If the market is imperfectly competitive there will be a change. It is not
clear what sort of exogenous variation Gunning and Sickles have to rotate the demand
curve. In addition, they estimate the cost function as part of the model. This is an
heroic attempt. It is not clear how to measure the most important cost of a physician
practice—physician opportunity cost. Since θ is estimated from the pricing equation,
bias in the estimation of cost will be transmitted to the estimate of θ if cost is esti-
mated jointly with (9.37). As a consequence, it is possible that difficulties in consis-
tently estimating the parameters of the cost function may be a source of bias for
estimating the conduct parameter.
An older paper by Wong (1996) uses a test devised by Panzar and Rosse (1987) for
testing hypotheses about market structure. The Panzar�Rosse test statistic is
φ� �Xi
wi
R�@R�
@wi
� �ð9:38Þ
where wi represents the price of factor i and R� is the firm’s reduced form revenue
function, which is a function of exogenous demand and cost shifters. The test statistic,
φ�, is the elasticity of equilibrium firm revenue with regard to factor prices. In the
case of monopoly, the test statistic must be negative. If all factor prices increase, then
616 Martin Gaynor and Robert J. Town
marginal costs increase. The firm will then optimally choose a lower quantity and a
higher price. Since a monopolist always operates on the elastic portion of their
demand curve, revenues will fall. If the market is perfectly competitive, Panzar and
Rosse argue that the value of the test statistic is 1. If factor prices increase, then the
long-run cost curves will increase, but the quantity at which long-run average cost
reaches a minimum is unchanged. As a consequence, price will increase by 1 percent,
but quantity will remain unchanged, hence the value taken by φ� will be 1. The deriva-tion of the test statistic under monopolistic competition implies that φ� will be less than
or equal to 1 if the market is monopolistically competitive.
Wong uses data from the AMASMS in 1991 to estimate the test statistic. He esti-
mates values of φ� of 0.83 for primary care, 0.76 for general and family practice, 0.94
for internal medicine, and 0.85 for surgery. All of these estimates are significantly
different from zero. The test statistics for primary care, general and family practice,
and surgery are all significantly different from 1. Therefore he rejects the hypotheses
of monopoly and of perfect competition (except for internal medicine). The results
are consistent with monopolistic competition.
Bradford and Martin (2000) specify and model physician partnerships, then derive
and estimate the reduced forms. In their model the partnership’s choice of internal
incentive system (profit sharing) depends on whether the firm is demand constrained.
When the partnership is demand constrained, it is optimal to employ strong incentives
to motivate physicians to exert more effort which will bring in business. This means
unequal profit sharing, i.e. profit shares based on individuals’ productivities. When the
firm is not demand constrained the opposite is true. This also applies to the number
of physician partners in a practice. More partners leads to weaker incentives and free
riding, so their theory predicts smaller partnerships in the presence of a demand con-
straint. They use data from the Physician Practice Cost and Income Survey for 1986
to test their hypotheses.
They do find evidence consistent with their theory. In addition, the firm chooses
the number of partners and the price they charge for their services. They find that
profit sharing, partnership size, and price all respond to the number of physicians per
capita in the market. Physician partnerships are significantly less likely to choose equal
profit sharing the more potential competition they face in a market due to more phy-
sicians per capita being present. These firms also choose smaller size in response to
more physicians per capita. Physician practices in markets where there are more rivals
(physicians per capita) also set lower prices. Bradford and Martin also estimate a prac-
tice demand curve. They find that demand is responsive to the amount of physician
time per visit in the practice, which they interpret as quality. The parameter estimate
implies that a physician spending 3 more minutes per visit (at 10 percent increase) will
lead to 9.1 more weekly visits to the practice. They also find that price decreases
quantity demanded from the firm, although the implied elasticity (20.49) is less
617Competition in Health Care Markets
than 1. Overall, the results of this study are consistent with physician firms’ conduct
becoming more competitive in response to market structure.
Schneider et al. (2008a) estimate an SCP-type model similar to what Shen et al.
(2010) and Moriya et al. (2010) do for the hospital industry. They examine the impact
of HHIs for physician organizations and for insurers in California on physician prices.
While these models are ad hoc, one can think of them as attempting to capture the
impacts of relative bargaining power on price, using buyer and seller HHIs as proxies
for bargaining power. They find that physician market concentration is associated
with significantly higher prices. A 1 percent increase in the physician HHI leads to
1�4 percent higher physician prices. Conversely, the health insurer HHI has no statis-
tically significant impact on physician prices.
These results stand in sharp contrast to the findings of Shen et al. and Moriya
et al., who find significant impacts of insurer concentration on price (negative).
Schneider et al. stands out—there are very few studies that look at price competition
in physician markets. The results have to be interpreted with some caution, however.
As noted elsewhere in this chapter, SCP studies are vulnerable to problems associated
with endogeneity of the HHI. The usual practice is to find some means to address
this, commonly through the use of instruments of fixed effects. This issue is not
addressed by Schneider et al., so some caution must be applied before making causal
inference from the results of this study.
Eisenberg (2011) is a recent paper that examines monopsony power in the physi-
cian services market. Eisenberg examines whether the US Medicare program has
monopsony power. He uses nationally representative data on physicians in selected
markets107 for selected years from 1996 to 2008, along with data on Medicare physi-
cian reimbursement. The idea is that Medicare physician payment rates are set
administratively and should be exogenous to physician decisions.108 Therefore varia-
tion in payment rates should trace out the physician supply curve to Medicare. One
difficulty is that physicians in the US sell both to Medicare and to private insurers. If
unobserved variation in the private market is correlated with Medicare payments then
it will not be possible to estimate an unbiased causal effect of Medicare payment on
physician supply. Unfortunately private insurance prices are not observable in the
data. Eisenberg takes two approaches to deal with this problem. First, he includes a
number of characteristics of local markets that likely influence the level of private
insurer payments, including a measure of the insurer HHI. As a supplementary strat-
egy, he examines only physicians in contiguous counties that had different Medicare
payment rates. The idea is to reduce heterogeneity, including the private market.
107 The Community Tracking Survey of the Center for Studying Health System Change, http://www.hschange.com/
index.cgi?data5 04.108 Medicare payments are based to some degree on physician practice costs but it seems unlikely that the regulators
are systematically capturing marginal costs in their payment rates.
618 Martin Gaynor and Robert J. Town
Eisenberg estimates the impact of Medicare payment rates on the probabilities that
physicians will accept all, some, or no new Medicare patients. He finds that a 1 per-
cent increase in the Medicare payment rate increases the probability that a physician
will accept all new Medicare patients by 0.39�0.77 percent, reduces the probability
they will only see some new Medicare patients by 0.29�0.56 percent, and reduces
the probability that they will see no new Medicare patients by 0.83�1.62 percent.
Physicians’ participation responses are inelastic, implying that Medicare possesses
monopsony power with regard to physician participation in the program. This study
does not answer the question of whether Medicare has monopsony power with regard
to the supply of services, nor does it address whether Medicare exercises monopsony
power (although this seems unlikely given political constraints and government
bureaucracy).
6.3. SummaryEmpirical research on competition in physician services markets is sparse. The main
reason for this is lack of data. This is frustrating, since this is a very important market
and evidence is limited and often dated. Researchers in industrial organization have
developed sophisticated methods for the analysis of markets. Adapting these methods
or inventing new ones that address the idiosyncracies of physician services markets
represents an exciting opportunity. However, researchers will have to be entrepreneurial
and innovative in finding or collecting data to estimate models of physician services
markets.
7. VERTICAL RESTRAINTS AND MONOPSONY
The previous sections have all dealt with issues of horizontal competition and
market power—hospitals competing against hospitals, insurers against insurers, physi-
cians against physicians. In this section we take on two different issues regarding mar-
ket power�vertical restraints and monopsony.
7.1. Vertical Restraints7.1.1. Vertical Restraints—TheoryThere is a small, but important, literature on vertical restraints in health care.109 As in
the general case, vertical integration can serve to achieve efficiencies. It can eliminate
109 In health care the focus has been on vertical integration and exclusive dealing. We therefore restrict our attention
to these two forms of vertical restraint. We refer to vertical integration for the most part, but make clear when
exclusivity is important.
619Competition in Health Care Markets
double marginalization, hold-up problems, transaction costs, and information asym-
metries (improved monitoring). In the case of hospitals and insurers, there are also
important spillover effects which integration can internalize. Insurers and hospitals
make decisions over many matters like pricing, information systems, etc. which affect
each other. Integration can allow for efficient coordination on such choices.110
It is also worth pointing out some other sources of potential efficiencies beyond
the usual ones. Insurers may be able to obtain lower prices from hospitals, leading to
improved consumer welfare. Gal-Or (1997, 1999) shows that at an exclusionary equi-
librium (all insurers and hospitals are exclusive pairs), insurers obtain lower prices
from hospitals in exchange for guaranteed larger volume and consumers are better off
(provided that there is not too much differentiation).
Another source of possible efficiencies is the elimination of inefficient substitution.
If there are multiple hospitals, say, and one hospital has greater market power than the
others, and thus higher markups, an insurer will inefficiently substitute away from the
hospital with market power to the other hospitals. If hospitals are not perfect substi-
tutes to patients then this will result in a loss of utility.
It is also possible that vertical integration can lead to reduced prices. Suppose that
integration eliminates double marginalization and that the integrated firm is not
exclusive, i.e. it buys and sells with other market participants. Then other hospitals
have to set their prices at least as low as the marginal cost of the hospital in the inte-
grated firm in order to sell to the insurer in the integrated firm. If the hospital in the
integrated firm wants to sell to outside insurers, it has to set its price as low as the out-
side hospitals. So, it is possible (but not necessary) that integration could lower prices
via this mechanism.
The traditional concern with vertical integration, however, is that it can serve to
enhance or extend market power. An integrated insurer�hospital firm may find it
profitable to exclude rival insurers from access to the hospital, or charge them prices
higher than the internal transfer price of the integrated firm (raising rivals’ costs) (see
Ma, 1997).111 The same could be true for excluding rival hospitals from access to the
insurer in the integrated firm. There may also be a horizontal aspect to the vertical
integration, if, say, there are multiple hospitals that join the integrated firm. This may
110 Eggleston et al. (2004) study a model of vertical integration between hospitals and physicians and hospitals and
insurers. They find that vertical integration does not necessarily increase net revenues.111 There have been some recent theoretical advances in this literature, using more general frameworks than in
previous work. These newer papers tend to find anticompetitive effects of integration or exclusivity. Bijlsma et al.
(2009) show that there can be foreclosure and anticompetitive effects if there are uninsured consumers. Douven
et al. (2011) demonstrate foreclosure and anticompetitive effects using a more general bargaining framework due
to de Fontenay and Gans (2007). They show that any exclusionary equilibrium is likely to be anticompetitive—a
much stronger result than previous work. Halbersma and Katona (2011) find that vertical integration always harms
consumers. The elimination of double marginalization results in a softening of price competition between the
insurers.
620 Martin Gaynor and Robert J. Town
have the standard anticompetitive effect of horizontal merger increasing market
power. Another horizontal effect is that integration may facilitate collusion. If the
insurer in the integrated firm buys from outside hospitals, it can communicate pricing
information between the hospital in the integrated firm and its rivals, thereby facilitat-
ing collusion.
In an industry with uncertainty and with differentiated products, like health care,
integration can be inefficient without being anticompetitive, simply by reducing
choice. The key here is exclusivity, not integration per se. If a hospital�insurer pair
are exclusive, then consumers’ choices are restricted. When consumers choose an
insurer they do not know what kind of illness they will have should they fall ill, and
therefore they have an option demand for hospitals that can best treat any illness they
might contract. Exclusivity restricts choice and therefore results in a loss of utility,
even if there is no anticompetitive effect. Gaynor and Ma (1996) show a loss of con-
sumer welfare from exclusive dealing in the absence of foreclosure in such a situation.
In health care there is also the possibility of another effect on consumers—risk seg-
mentation. Consider the following situation. Let there be two differentiated upstream
hospitals: H1 and H2. Let H1 offer specialized care for very ill patients, e.g. H1 is a
tertiary care facility. Let H2 offer ordinary care, but nothing specialized, e.g. H2 is a
primary care facility. H1 has higher costs than H2. Let there be two downstream
homogeneous insurers: I1 and I2. There are two types of consumers: high risk and
low risk. The high-risk consumers have a high probability of contracting a serious ill-
ness that will require treatment at a tertiary care facility. The low-risk consumers have
a low probability of this happening. Suppose that I1 and H1 are integrated and exclu-
sive (by implication I2 and H2 also are exclusive).112
We conjecture that there is an equilibrium with risk segmentation.113 I2 will offer
insurance at a lower premium, since H2 has lower costs. High-risk consumers will
want insurance from I1 and low-risk consumers from I2. Since there is risk segmenta-
tion, there is an efficiency loss (in addition to any welfare effects due to pricing and
restriction on choice, as discussed previously). This is a very informal argument—it
may not be correct. But it points to a factor to examine in health care markets.
7.1.2. A Model of Vertical Integration and Hospital PricesThe framework we laid out in section 3.1 can be used to examine the impact of
hospital�insurer integration on hospital prices paid by independent insurers.114 In
112 Enhancement of market power is not the effect of interest here.113 Baranes and Bardey (2004) have a formal model where exclusivity leads to risk segmentation. The setup of their
model is quite different from what we have proposed here. They find that exclusivity reduces hospital
differentiation and intensifies price competition. They conclude that exclusivity is welfare improving.114 Halbersma and Katona (2011) lay out a sketch of a potential empirical framework based on their model in
Appendix B of their paper.
621Competition in Health Care Markets
other industries, vertical integration has been linked to an increase in rivals costs, and
that is the phenomenon we focus on here.115 More concretely, assume that hospital j
is now owned by insurer m and, for now, that the insurer does not contract with any
other hospitals. The insurer’s ownership of the hospital changes the bargaining game
by changing the agreement and disagreement payoffs for the hospital.116 As previously
in section 3.1, the negotiations between the insurer and hospital j take the other
prices as given. Let πmðphj Þ be the profit the insurer m earns as a function of the price
hospital j negotiates with insurer h holding all other prices constant.117 Assume that if
there is an agreement @πm
@phj. 0 for all l—increasing the price hospital h negotiates with
other insurers raises their costs and therefore raises the profits of insurer m. Disagreement
profits for the vertically integrated hospital are denoted πm(D). We assume that the
insurer profits under a disagreement between hospital j and any other insurer are greater
than the insurer’s profits under agreement. That is, πm(D)$πm(phj ), ’phj ,N.
The hospital’s agreement and disagreement outcomes are now:
Hagree5 ðpjh2 cjÞqjhðJhÞ1πmðphj ÞHdisagree5 rj 1πmðDÞ
Because πm is a function of ph there is no simple closed-form relationship between
hospital price and the other parameters of the model. However, it is straightforward
to assess the impact of integration on prices. As long as β. 0, hospital prices are
decreasing in the difference between the hospital’s agreement and disagreement out-
comes. The more important the agreement is to the hospital, the lower are prices.
Here the difference is (pjh2 cj)qjh(Jh)2 rj1 (πm(plj)2πm(D)), which is smaller than in
the non-integrated case. In addition, the marginal return from increasing prices is
now qjhðJhÞ1 @πm
@plj; which is greater than without integration. These two effects work
to force prices higher.
Similar logic shows that insurer m it will be able to negotiate lower rates with the
other hospitals in the market. If the insurer pays hospital j its marginal cost for providing
care, then the difference in the agreement and disagreement values for insurer h when
it is negotiating with hospital k is: cjdkh1 ðFhðJhÞ2FhðJh2 kÞ2 cmkhÞ1βP
l 6¼j;kplhdjlh.
The difference between the agreement and disagreement values if the insurer owns
hospital j is (pjh2 cj)dkh . 0, where pjh is the price the insurer and hospital j would have
negotiated if they were not jointly owned.
The intuition is straightforward. A vertically integrated insurer pays its hospital
marginal cost, which implies that under a disagreement with another hospital it will
115 Hastings and Gilbert (2005) study the impact of vertical integration in the gasoline industry on rivals’ prices.116 The structure of the payoffs for the insurer is unaffected by the integration; however, the functional relationships
(e.g. Fh( Jh) and Fh( Jh2 j2 k)) will almost surely change.117 We assume that the insurer pays the hospital a transfer price equal to the marginal cost of care.
622 Martin Gaynor and Robert J. Town

have lower disagreement expenditures. To summarize, in this framework, vertical inte-
gration leads the vertically integrated hospital to negotiate higher prices with other
payers and the vertically integrated insurer to negotiate lower prices with the other
hospitals in the market.
7.1.3. Empirical Evidence on Vertical RestraintsThere is very little evidence at present on the impact of vertical restraints on market
power. In part, that is because vertical integration has not been that common in
health care. It was quite rare until the mid-1990s, and then declined rapidly thereaf-
ter. Integration between hospitals and physician practices peaked in 1996 at approxi-
mately 40 percent of all hospitals, and declined thereafter (Burns and Pauly, 2002;
Ciliberto, 2005). This pattern was repeated with vertical integration of hospitals into
the insurance market, although the extent of vertical integration was never as great
as between hospitals and physicians (Burns and Pauly, 2002). This growth coincided
with the growth of managed care, and in particular with the perceived growth in
managed care organizations’ negotiating power with hospitals. Nonetheless, there
are reports that vertical integration and exclusive deals are on the increase in health
care, in part because of elements of the health reform law in the US. Burns et al.
(2000) find that hospital�physician alliances increase with the number of HMOs
in the market. They infer that providers may be integrating in order to achieve
or enhance market power. More recently, Berenson et al. (2010) conducted 300 inter-
views with health care market participants, and report that increased bargaining power
through joint negotiations listed as one of several reasons for hospital�physician
alliances.
Certain types of vertical relations in health care have been the subject of significant
antitrust scrutiny—exclusive dealing between physician practices and hospitals (usually
for a specialized service, e.g. radiology, anesthesiology, or pathology), and most-
favored-nations clauses between insurers and providers, which require the provider to
give the insurer a rate as low as it gives to any buyer (see Gaynor and Haas-Wilson,
1998; Haas-Wilson, 2003, for reviews of vertical issues in health care).118
In spite of the interest in this topic, there is relatively little evidence on the
effects of vertical restraints in health care. The evidence comes from reduced-form
studies.
118 Complaints about exclusive contracts between hospitals and physician practices are the most numerous type
of antitrust case brought in health care. One of these cases was decided by the Supreme Court (Jefferson
Parish Hosp. Dist. No. 2 v. Hyde, 466 US 2(1984)), and represents an important legal precedent on exclusive
dealing and tying. There have also been a number of cases on most-favored-nations clauses, e.g. Ocean State
Physicians Health Plan v. Blue Cross & Blue Shield, 883 F.2d 1101 (1st Cir. 1989), cert. denied, 494 US 1027
(1990) and Blue Cross & Blue Shield v. Marshfield Clinic, 65 F.3d 1406 (7th Cir. 1995), cert. denied, 116 S.
Ct. 1288 (1996).
623Competition in Health Care Markets
Ciliberto and Dranove (2005) and Cuellar and Gertler (2005) are the only two
papers of which we are aware that examine the competitive impacts of vertical inte-
gration in health care. Both papers look at the effects of hospital�physician practice
integration on hospital prices. The two studies find opposite results—Cuellar and
Gertler find evidence consistent with anticompetitive effects of physician�hospital
integration, while Ciliberto and Dranove find no such evidence. As Gaynor (2006a)
points out, these seemingly contradictory results are fully consistent with economic
theory—vertical integration can be anticompetitive and lead to higher prices or be
efficiency enhancing and have the opposite result.
Research on efficiencies from integration is not very encouraging. Burns and
Muller (2008) review the empirical evidence on hospital�physician relationships.
They find little evidence of an impact of integration on costs, quality, access or clinical
integration. Madison (2004) investigates the relationship between hospital�physician
affiliations and patient treatments, expenditures, and outcomes using data on Medicare
heart attack patients. She finds little evidence of any impacts of hospital�physician
relationships.
If integration between various types of providers or providers and insurers grows,
there may be continued interest (and more data) in these relationships. The model we
sketched out above in section 7.1.2, or one like it, may provide a useful framework
for future empirical investigation.
7.2. Health Care Providers and Monopsony PowerIt is well known that market power in the purchase of health care inputs can (but does
not necessarily) lead to welfare loss.119 While the textbook depiction of monopsony
results in a reduction in output below the competitive equilibrium, other models of
monopsony can yield more ambiguous welfare results. Herndon (2002) shows that if sell-
ers are forced into all-or-nothing decisions by a buyer with monopsony power that there
is no reduction in output and no welfare loss. Consumers are better off, because the sell-
ers’ prices have been reduced with no decrease in output. She argues that this model
applies to health care, where insurers are able to force such decisions on providers.
There is also a literature that examines why large purchasers (e.g. Walmart) are
able to negotiate more favorable terms with their suppliers (e.g. Snyder, 1996).
Insurer economies of scale may ultimately be based on their ability to exercise some
monopsony power and negotiate lower provider payment rates. The issue of the role
of monopsony extends beyond any individual antitrust case or the understanding of
the provider price-setting mechanism, but is relevant for considering health system
design. Health policy commenters have argued that the relative cost advantage of
119 The analysis of monopsony power dates to Robinson (1933). Gaynor and Vogt (2000) provide a nice review of
the theory of monopsony and vertical foreclosure.
624 Martin Gaynor and Robert J. Town
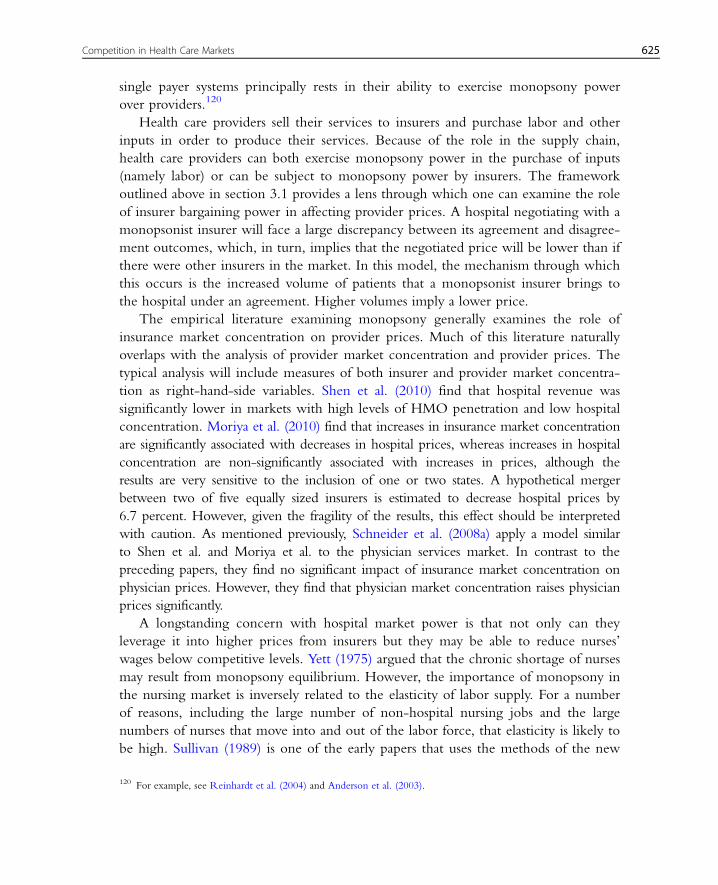
single payer systems principally rests in their ability to exercise monopsony power
over providers.120
Health care providers sell their services to insurers and purchase labor and other
inputs in order to produce their services. Because of the role in the supply chain,
health care providers can both exercise monopsony power in the purchase of inputs
(namely labor) or can be subject to monopsony power by insurers. The framework
outlined above in section 3.1 provides a lens through which one can examine the role
of insurer bargaining power in affecting provider prices. A hospital negotiating with a
monopsonist insurer will face a large discrepancy between its agreement and disagree-
ment outcomes, which, in turn, implies that the negotiated price will be lower than if
there were other insurers in the market. In this model, the mechanism through which
this occurs is the increased volume of patients that a monopsonist insurer brings to
the hospital under an agreement. Higher volumes imply a lower price.
The empirical literature examining monopsony generally examines the role of
insurance market concentration on provider prices. Much of this literature naturally
overlaps with the analysis of provider market concentration and provider prices. The
typical analysis will include measures of both insurer and provider market concentra-
tion as right-hand-side variables. Shen et al. (2010) find that hospital revenue was
significantly lower in markets with high levels of HMO penetration and low hospital
concentration. Moriya et al. (2010) find that increases in insurance market concentration
are significantly associated with decreases in hospital prices, whereas increases in hospital
concentration are non-significantly associated with increases in prices, although the
results are very sensitive to the inclusion of one or two states. A hypothetical merger
between two of five equally sized insurers is estimated to decrease hospital prices by
6.7 percent. However, given the fragility of the results, this effect should be interpreted
with caution. As mentioned previously, Schneider et al. (2008a) apply a model similar
to Shen et al. and Moriya et al. to the physician services market. In contrast to the
preceding papers, they find no significant impact of insurance market concentration on
physician prices. However, they find that physician market concentration raises physician
prices significantly.
A longstanding concern with hospital market power is that not only can they
leverage it into higher prices from insurers but they may be able to reduce nurses’
wages below competitive levels. Yett (1975) argued that the chronic shortage of nurses
may result from monopsony equilibrium. However, the importance of monopsony in
the nursing market is inversely related to the elasticity of labor supply. For a number
of reasons, including the large number of non-hospital nursing jobs and the large
numbers of nurses that move into and out of the labor force, that elasticity is likely to
be high. Sullivan (1989) is one of the early papers that uses the methods of the new
120 For example, see Reinhardt et al. (2004) and Anderson et al. (2003).
625Competition in Health Care Markets
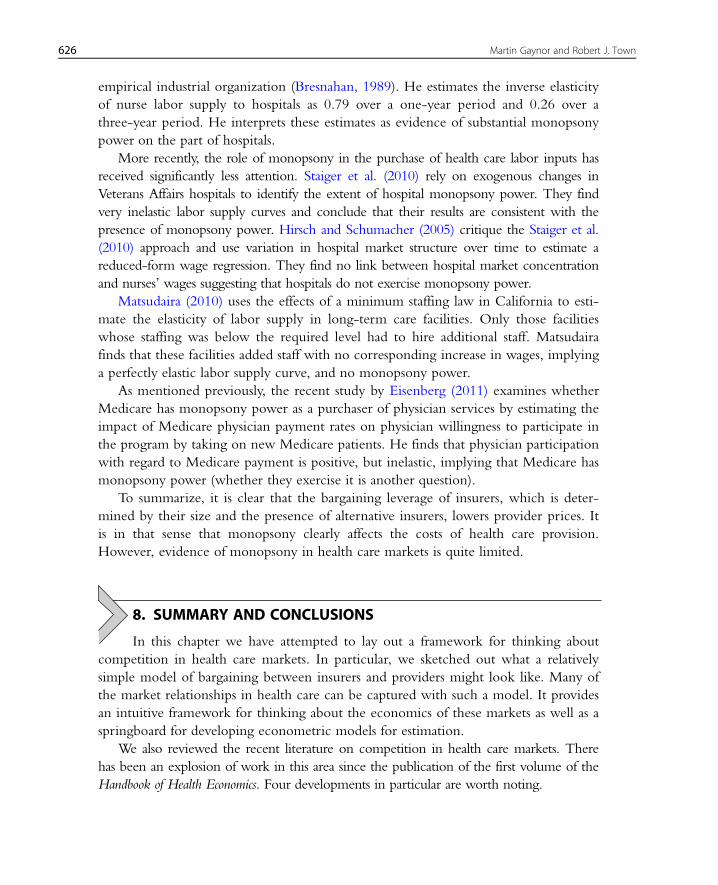
empirical industrial organization (Bresnahan, 1989). He estimates the inverse elasticity
of nurse labor supply to hospitals as 0.79 over a one-year period and 0.26 over a
three-year period. He interprets these estimates as evidence of substantial monopsony
power on the part of hospitals.
More recently, the role of monopsony in the purchase of health care labor inputs has
received significantly less attention. Staiger et al. (2010) rely on exogenous changes in
Veterans Affairs hospitals to identify the extent of hospital monopsony power. They find
very inelastic labor supply curves and conclude that their results are consistent with the
presence of monopsony power. Hirsch and Schumacher (2005) critique the Staiger et al.
(2010) approach and use variation in hospital market structure over time to estimate a
reduced-form wage regression. They find no link between hospital market concentration
and nurses’ wages suggesting that hospitals do not exercise monopsony power.
Matsudaira (2010) uses the effects of a minimum staffing law in California to esti-
mate the elasticity of labor supply in long-term care facilities. Only those facilities
whose staffing was below the required level had to hire additional staff. Matsudaira
finds that these facilities added staff with no corresponding increase in wages, implying
a perfectly elastic labor supply curve, and no monopsony power.
As mentioned previously, the recent study by Eisenberg (2011) examines whether
Medicare has monopsony power as a purchaser of physician services by estimating the
impact of Medicare physician payment rates on physician willingness to participate in
the program by taking on new Medicare patients. He finds that physician participation
with regard to Medicare payment is positive, but inelastic, implying that Medicare has
monopsony power (whether they exercise it is another question).
To summarize, it is clear that the bargaining leverage of insurers, which is deter-
mined by their size and the presence of alternative insurers, lowers provider prices. It
is in that sense that monopsony clearly affects the costs of health care provision.
However, evidence of monopsony in health care markets is quite limited.
8. SUMMARY AND CONCLUSIONS
In this chapter we have attempted to lay out a framework for thinking about
competition in health care markets. In particular, we sketched out what a relatively
simple model of bargaining between insurers and providers might look like. Many of
the market relationships in health care can be captured with such a model. It provides
an intuitive framework for thinking about the economics of these markets as well as a
springboard for developing econometric models for estimation.
We also reviewed the recent literature on competition in health care markets. There
has been an explosion of work in this area since the publication of the first volume of the
Handbook of Health Economics. Four developments in particular are worth noting.
626 Martin Gaynor and Robert J. Town

One is the increasing use of modern structural models of industrial organization,
adapted to the specifics of health care markets. The chapters by Dranove and
Satterthwaite (2000) and Gaynor and Vogt (2000) described structural models that
might be estimated, but that had not yet been executed at the time of the Handbook’s
publication. The models described in those chapters, and more sophisticated models,
were estimated only a few short years ago. In addition, there has been increasing (and
productive) interchange between health economics and industrial organization scho-
lars, leading to more sophisticated and informative modeling of health care markets.
Second is the volume of empirical work on hospital markets, particularly work on
quality competition. At the time of the writing of the first volume of the Handbook
there was a fair amount of non-structural work on hospital price competition, but vir-
tually none on hospital quality competition. This has changed dramatically.
Third is the entry of work on competition in health care markets in countries
other than the US, and by non-US scholars working in this area. This is largely due
to health system reforms in countries like England, the Netherlands, and Switzerland
designed to increase the use of markets. This has become an important area of work
internationally and is no longer US-centric.
Fourth is the very recent work on health insurance markets. This development is
so recent that most of the papers we cite in this chapter are yet to be published. This
expansion of interest in this area is something that hopefully will continue.
It is disappointing that there is so little empirical research on competition in physi-
cian services markets. In the US this is largely due to data limitations. Hopefully scho-
lars will find ways to surmount this problem and we will see the kinds of advances in
knowledge about this market that we have seen for hospital markets.
There are tremendous research opportunities for ambitious scholars interested in
the economics of health care markets. We expect to see further developments in
thinking about the economics of these markets and in devising estimable models for
analysis.
REFERENCESAbraham, J. M., Gaynor, M., & Vogt, W. B. (2007). Entry and competition in local hospital markets.
Journal of Industrial Economics, LV, 2, 265�288.Ackerberg, D., Benkard, L., Berry, S., & Pakes, A. (2007). Econometric tools for analyzing market out-
comes. In J. Heckman & E. Leamer (Eds.), Handbook of econometrics (Vol. 6). Amsterdam andLondon: Elsevier North-Holland.
Aguirregabiria, V. & Mira, P. (2007). Sequential estimation of dynamic discrete games. Journal ofEconometrics, 75(1), 1�53.
Akosa Antwi, Y. O. D., Gaynor, M., & Vogt, W. B. (2006). A competition index for differentiated productsoligopoly with an application to hospital markets. Carnegie Mellon University.
Akosa Antwi, Y. O. D., Gaynor, M., & Vogt, W. B. (2009). A bargain at twice the price? Californiahospital prices in the new millennium. Forum for Health Economics and Policy, 12(1), Article 3., http://www.bepress.com/fhep/12/1/3/..
627Competition in Health Care Markets
Allard, M., Leger, P., & Rochaix, L. (2009). Provider competition in a dynamic setting. Journal ofEconomics & Management Strategy, 18(2), 457�486.
American Medical Association (2010). Competition in health insurance: A comprehensive study of USmarkets. Technical report, American Medical Association, Chicago, IL, 2006�2010 editions.
Anderson, G., Reinhardt, U., Hussey, P., & Petrosyan, V. (2003). It’s the prices, stupid: Why the UnitedStates is so different from other countries. Health Affairs, 22(3), 89�105.
Arcidiacono, P. & Miller, R. (2010). CCP estimation of dynamic discrete choice models with unobserved heteroge-neity. Carnegie Mellon University, Duke University.
Ashwood, S. J., Reid, R. O., Setodji, C. M., Weber, E., Gaynor, M., & Mehotra, A. (2011). What is theimpact of retail clinics on overall utilization? The Rand Corporation, Carnegie Mellon University.
Atherly, A., Dowd, B. E., & Feldman, R. (2004). The effect of benefits, premiums, and health risk onhealth plan choice in the Medicare program. Health Services Research, 39(4, Part 1), 847�864.
Bajari, P., Benkard, L., & Levin, J. (2007). Estimating dynamic models of impefect competition.Econometrica, 75(5), 1331�1370.
Bajari, P., Hong, H., Park, M., & Town, R. (2010). Regression discontinuity designs with an endogenous forc-ing variable and an application to contracting in health care. University of Minnesota.
Baker, L. & Brown, M. (1999). Managed care, consolidation among health care providers, and healthcare: Evidence from mammography. RAND Journal of Economics, 30(2), 351�374.
Baker, L. & Phibbs, C. (2002). Managed care, technology adoption, and health care: The adoption ofneonatal intensive care. RAND Journal of Economics, 33(3), 524�548.
Baker, L. & Wheeler, S. (1998). Managed care and technology diffusion: The case of MRI. HealthAffairs, 17(5), 195�207.
Balan, D. & Brand, K. (2009). Simulating hospital merger simulations. Federal Trade Commission.Baranes, E. & Bardey, D. (2004). Competition in health care markets and vertical restraints. Cahiers de
Recherche du LASER 013-03-04, Laboratoire de Sciences Economiques de Richter (LASER),Universite de Montpellier, Montpellier, France. Available at , http://www.laser.univ-montp1.fr/Cahiers/cahier130404.pdf/..
Barro, J., Huckman, R., & Kessler, D. (2006). The effects of cardiac specialty hospitals on the cost andquality of medical care. Journal of Health Economics, 25(4), 702�721.
Beauchamp, A. (2010). Regulation, imperfect competition, and the US abortion market. Boston College.Berenson, R., Ginsburg, P., & Kemper, N. (2010). Unchecked provider clout in California foreshadows
challenges to health reform. Health Affairs, 29(4), 699.Berry, S., Levinsohn, J., & Pakes, A. (1995). Automobile prices in market equilibrium. Econometrica, 63
(4), 841�890.Bijlsma, M., Boone, J., & Zwart, G. (2009). Selective contracting and foreclosure in health care markets. Tilburg
University.Bloom, N. & Van Reenen, J. (2007). Measuring and explaining management practices across firms and
nations. Quarterly Journal of Economics, 122(4), 1351�1408.Bloom, N., Propper, C., Seiler, S., & Van Reenen, J. (2010). The impact of competition on management
quality: Evidence from public hospitals. Cambridge, MA: National Bureau of Economic Research.Bolhaar, J., Lindeboom, M., & van der Klaauw, B. (2010). Insurance search, switching behavior and the role of
group contracts. Vrije Universiteit Amsterdam.Bowblis, J. (2010). Ownership conversion and closure in the nursing home industry. Journal of Health
Economics, 20(6), 631�644.Bradford, D. & Martin, R. (2000). Partnerships, profit sharing, and quality competition in the medical
profession. Review of Industrial Organization, 17, 193�208.Brand, K., Garmon, C., Gowrisankaran, G., Nevo, A., & Town, R. (2011). Estimating the price impact
of hospital mergers: Inova’s proposed acquisition of Prince William hospital. Unpublished manu-script, Federal Trade Commission, University of Arizona, Northwestern University, University ofMinnesota.
Bresnahan, T. & Reiss, P. (1990). Entry in monopoly markets. Review of Economic Studies, 57(4), 531�553.Bresnahan, T. & Reiss, P. (1991). Entry and competition in concentrated markets. Journal of Political
Economy, 99(5), 977�1009.
628 Martin Gaynor and Robert J. Town

Bresnahan, T. F. (1989). Empirical studies of industries with market power. In R. Schmalensee & R. Willig(Eds.), Handbook of industrial organization (Vol. 2, pp. 1011�1057). Amsterdam and New York: ElsevierScience, North-Holland Chapter 17.
Breyer, F., Bundorf, M. K., & Pauly, M. V. (2012). Health care spending risk, health insurance, andpayment to health plans. In T. G. McGuire, M. V. Pauly, & P. Pita Barros (Eds.), Handbook of healtheconomics (Vol. 2, chapter 11, pp. 691�763). Amsterdam and London: Elsevier North-Holland.
Brown, M. (1993). Do physicians locate as spatial competition models predict? Evidence from Alberta.Canadian Medical Association Journal, 148(8), 1301�1307.
Buchmueller, T., Jacobson, M., & Wold, C. (2006). The effect of hospital closures on access to care.Journal of Health Economics, 25, 740�761.
Burgess, J., Carey, K., & Young, G. (2005). The effect of network arrangements on hospital pricingbehavior. Journal of Health Economics, 24(2), 391�405.
Burgess, S., Propper, C., & Gossage, D. (2008). Competition and quality: Evidence from the NHS inter-nal market 19912 99. Economic Journal, 118, 138�170.
Burns, L. & Muller, R. (2008). Hospital�physician collaboration: Landscape of economic integrationand impact on clinical integration. Milbank Quarterly, 86(3), 375�434.
Burns, L., Bazzoli, G., Dynan, L., & Wholey, D. (2000). Impact of HMO market structure physi-cian�hospital strategic alliances. Health Services Research, 35(1), 101�132.
Burns, L. R. & Pauly, M. V. (2002). Integrated delivery networks: A detour on the road to integratedhealth care? Health Affairs, 21(4), 128�143.
Burns, L. R. & Wholey, D. R. (1992). The impact of physician characteristics in conditional choicemodels for hospital care. Journal of Health Economics, 11(1), 43�62.
Canoy, M. & Sauter, W. (2009). Hospital mergers and the public interest: Recent developments in theNetherlands. Tilburg University.
Caplin, A. & Nalebuff, B. (1991). Aggregation and imperfect competition: On the existence of equilib-rium. Econometrica, 59(1), 25�59.
Capps, C. (2005). The quality effects of hospital mergers. Bates White LLC.Capps, C. & Dranove, D. (2004). Hospital consolidation and negotiated PPO prices. Health Affairs, 23
(2), 175�181.Capps, C., Carlton, D., & David, G. (2010a). Antitrust treatment of nonprofits: Should hospitals receive special
care? Bates White LLC, University of Chicago, University of Pennsylvania.Capps, C., Dranove, D., & Lindrooth, R. (2010b). Hospital closure and economic efficiency. Journal of
Health Economics, 29, 87�109.Capps, C., Dranove, D., & Satterthwaite, M. (2003). Competition and market power in option demand
markets. RAND Journal of Economics, 34(4), 737�763.Capps, C. S. (2009). Federal health plan merger enforcement is consistent and robust. Bates White LLC.Carey, K., Burgess, J., & Young, G. (2008). Specialty and full-service hospitals: A comparative cost analy-
sis. Health Services Research, 43(5), 1869�1887.Carlin, C. & Town, R. J. (2009). Adverse selection, welfare, and optimal pricing of employer sponsored health
plans. University of Minnesota.Carlson, J. A. & McAfee, R. P. (1983). Discrete equilibrium price dispersion. Journal of Political Economy,
91(3), 480�493.Carlton, D. W. & Perloff, J. M. (2005). Modern industrial organization. Boston, MA: Addison-Wesley.Cebul, R. D. Rebitzer, J. B., Taylor, L. J., & Votruba, M. E. (2008). Organizational fragmentation and
care quality in the US healthcare system. Journal of Economic Perspectives, 22(4), 93�113.Chakravarty, S. (2010). Much ado about nothing? Entry and operations of physician owned specialty hospitals.
Rutgers University.Chakravarty, S., Gaynor, M., Klepper, S., & Vogt, W. (2006). Does the profit motive make Jack nimble?
Ownership form and the evolution of the US hospital industry. Health Economics, 15, 345�361.Chernew, M. (1995). The impact of non-IPA HMOs on the number of hospitals and hospital capacity.
Inquiry, 32(2), 143�154.Chernew, M., Gowrisankaran, G., & Fendrick, A. (2002). Payer type and the returns to bypass surgery:
Evidence from hospital entry behavior. Journal of Health Economics, 21, 451�474.
629Competition in Health Care Markets

Chernew, M., Scanlon, D., & Hayward, R. (1998). Insurance type and choice of hospital for coronaryartery bypass graft surgery. Health Services Research, 33(3), 447�466.
Ciliberto, F. (2005). Does organizational form affect investment decisions? University of Virginia.Ciliberto, F. & Dranove, D. (2005). The effect of physician�hospital affiliations on hospital prices in
California. Journal of Health Economics, 25(1), 29�38.Ciliberto, F. & Lindrooth, R. (2007). Exit from the hospital industry. Economic Inquiry, 45(1), 71�81.Commission on Health Care Facilities in the 21st Century (2006). A plan to stabilize and strengthen
New York’s health care system. Final report, Commission on Health Care Facilities in the 21stCentury, New York, NY. June.
Cooper, Z., Gibbons, S., Jones, S., & McGuire, A. (2011). Does hospital competition save lives?Evidence from the NHS patient choice reforms. Economic Journal, 121(554), 228�260.
Crawford, G. & Yurukoglu, A. (2010). The welfare effects of bundling in multichannel television markets.University of Warwick, Stanford University.
Cuellar, A. E. & Gertler, P. J. (2005). Strategic integration of hospitals and physicians. Journal of HealthEconomics, 25(1), 1�28.
Cullen, K., Hall, M., & Golosinskiy, A. (2009). Ambulatory surgery in the United States, 2006. Center forDisease Control.
Cutler, D. (2010). Where are the health care entrepreneurs? The failure of organizational innovation in health care.National Bureau of Economic Research.
Cutler, D., McClellan, M., & Newhouse, J. (2000). How does managed care do it? RAND Journal ofEconomics, 31(3), 526�548.
Cutler, D. M. (1995). The incidence of adverse medical outcomes under prospective payment.Econometrica, 63(1), 29�50.
Cutler, D. M. & Reber, S. J. (1998). Paying for health insurance: The trade-off between competition andadverse selection. Quarterly Journal of Economics, 113(2), 433�466.
Cutler, D. M., Huckman, R. S., & Kolstad, J. T. (2010). Input constraints and the efficiency of entry:Lessons from cardiac surgery. American Economic Journal: Economic Policy, 2(1), 51�76.
Dafny, L. (2005). Games hospitals play: Entry deterrence in hospital procedure markets. Journal ofEconomics and Management Strategy, 14(5), 513�542.
Dafny, L. (2009). Estimation and identification of merger effects: An application to hospital mergers.Journal of Law and Economics, 52(3), 523�550.
Dafny, L. (2010). Are health insurance markets competitive? American Economic Review, 100, 1399�1431.Dafny, L., Dranove, D., Limbrock, F., & Scott Morton, F. (2011a). Data impediments to empirical work in
health insurance markets. Northwestern University, Yale University.Dafny, L., Duggan, M., & Ramanarayanan, S. (2011b). Paying a premium on your premium?
Consolidation in the US health insurance industry. American Economic Review, forthcoming.Dafny, L., Ho, K., & Varela, M. (2010). An individual health plan exchange: Which employees would
benefit and why? American Economic Review, 100, 485�489.Dahlby, B. & West, D. S. (1986). Price dispersion in an automobile insurance market. Journal of Political
Economy, 94(2), 418�438.De Fontenay, C. & Gans, J. (2007). Bilateral bargaining with externalities. University of Melbourne.Deily, M., McKay, N., & Dorner, F. (2000). Exit and inefficiency: The effects of ownership type. Journal
of Human Resources, 35(4), 734�737.Dionne, G., Langlois, A., & Lemire, N. (1987). More on the geographical distribution of physicians.
Journal of Health Economics, 6, 365�374.Doraszelski, U. & Pakes, A. (2007). A framework for applied dynamic analysis in IO. In M. Armstrong &
R. Porter (Eds.), Handbook of industrial organization (Vol. 3). Amsterdam and London: Elsevier North-Holland.Doraszelski, U., & Satterthwaite, M. (2010). Computable Markov-perfect industry dynamics. RAND
Journal of Economics, 41(2), 215�243.Dorfman, R. & Steiner, P. (1954). Optimal advertising and optimal quality. American Economic Review, 44
(5), 826�836.Douven, R., Halbersma, R., Katona, K., & Shestalova, V. (2011). Vertical integration and exclusive vertical
restraints between insurers and hospitals. Tilburg University.
630 Martin Gaynor and Robert J. Town

Dowd, B. E. & Feldman, R. (1994). Premium elasticities of health plan choice. Inquiry, 31(4), 438�444.Dranove, D. & Lindrooth, R. (2003). Hospital consolidation and costs: Another look at the evidence.
Journal of Health Economics, 22, 983�997.Dranove, D., Gron, A., & Mazzeo, M. (2003). Differentiation and competition in HMO markets. Journal
of Industrial Economics, 51(4), 433�454.Dranove, D., Lindrooth, R., White, W., & Zwanziger, J. (2008). Is the impact of managed care on hospi-
tal prices decreasing? Journal of Health Economics, 27, 362�376.Dranove, D., Satterthwaite, M., & Sfekas, A. (2007). Boundedly rational bargaining in option demand markets:
An empirical application. Northwestern University.Dranove, D., Simon, C., & White, W. (2002). Is managed care leading to consolidation in health-care
markets? Health Services Research, 37(3), 573�594.Dranove, D. D. & Satterthwaite, M. A. (1992). Monopolistic competition when price and quality are
imperfectly observable. RAND Journal of Economics, 23(4), 518�534.Dranove, D. D. & Satterthwaite, M. A. (2000). The industrial organization of health care markets.
In A. Culyer & J. Newhouse (Eds.), Handbook of health economics (pp. 1094�1139). New York andOxford: Elsevier Science, North-Holland, Chapter 20.
Duggan, M. (2000). Hospital ownership and public medical spending. Quarterly Journal of Economics,115(4), 1343�1373.
Duggan, M. (2002). Hospital market structure and the behavior of not-for-profit hospitals. RANDJournal of Economics, 33(3), 433�446.
Dulleck, U. & Kerschbamer, R. (2009). Experts vs. discounters: Consumer free-riding and experts withholdingadvice in markets for credence goods. International Journal of Industrial Organization, 27(1), 15�23.
Dunne, T., Klimek, S., Roberts, M., & Xu, D. (2009). Entry, exit, and the determinants of market structure.National Bureau of Economic Research.
Eggleston, K., Pepall, L., & Normany, G. (2004). Pricing coordination failures and health care providerintegration. Contributions to Economic Analysis and Policy, 3(1), 1�29.
Eisenberg, M. (2011). Reimbursement rates and physician participation in Medicare. Carnegie MellonUniversity.
Ellison, G. & Ellison, S. (2007). Strategic entry deterrence and the behavior of pharmaceutical incumbents prior topatent expiration. National Bureau of Economic Research.
Encinosa, W. E. & Bernard, D. M. (2005). Hospital finances and patient safety outcomes. Inquiry, 42(1),60�72.
Ericson, R. & Pakes, A. (1995). Markov-perfect industry dynamics: A framework for empirical work.Review of Economic Studies, 62(1), 53�82.
Escarce, J. J., Jain, A. K., & Rogowski, J. (2006). Hospital competition, managed care, and mortality afterhospitalization for medical conditions: Evidence from three states. Medical Care Research and Review,63(6 Suppl.), 112S�140S.
Federal Trade Commission and Department of Justice (1992). Horizontal merger guidelines. IssuedApril 2, 1992, Revised September, 2010.
Finkelstein, A. (2007). The aggregate effects of health insurance: Evidence from the introduction ofMedicare. Quarterly Journal of Economics, 122(1), 1�37.
Frank, R. & Lamiraud, K. (2009). Choice, price competition and complexity in markets for healthinsurance. Journal of Economic Behavior and Organization, 71, 550�562.
Fuchs, V. (2007). Managed care and merger mania. Journal of the American Medical Association, 277(11), 920�921.Gal-Or, E. (1997). Exclusionary equilibria in health-care markets. Journal of Economics and Management
Strategy, 6(1), 5�43.Gal-Or, E. (1999). Mergers and exclusionary practices in health care markets. Journal of Economics and
Management Strategy, 8(3), 315�350.Gaynor, M. (2006a). Is vertical integration anticompetitive? Definitely maybe (but that’s not final).
Journal of Health Economics, 25(1), 175.Gaynor, M. (2006b). What do we know about competition and quality in health care markets?
Foundations and Trends in Microeconomics, 2(6) , http://www.nowpublishers.com/product.aspx?product5MIC&doi5 0700000024/.
631Competition in Health Care Markets

Gaynor, M. & Haas-Wilson, D. (1998). Vertical relations in health care markets. In M. A. Morrisey (Ed.),Managed care and changing health care markets (pp. 140�163). Washington, DC: AEI Presschapter 7.
Gaynor, M. & Ma, C.-t. A. (1996). Insurance, vertical restraints, and competition. Carnegie Mellon University.Gaynor, M. & Polachek, S. W. (1994). Measuring information in the market: An application to physician
services. Southern Economic Journal, 60(4), 815�831.Gaynor, M. & Vogt, W. B. (2000). Antitrust and competition in health care markets. In A. Culyer &
J. Newhouse (Eds.), Handbook of health economics (pp. 1405�1487). New York and Oxford: ElsevierScience, North-Holland, Chapter 27.
Gaynor, M. & Vogt, W. B. (2003). Competition among hospitals. RAND Journal of Economics, 34(4),764�785.
Gaynor, M., Moreno-Serra, R., & Propper, C. (2010). Death by market power: Reform, competition andpatient outcomes in the British National Health Service. Carnegie Mellon University, ImperialCollege.
Gaynor, M., Propper, C., & Seiler, S. (2011). Free to choose: Reform and demand response in the BritishNational Health Service. Carnegie Mellon University, Imperial College London, London School ofEconomics.
Gaynor, M., Seider, H., & Vogt, W. B. (2005). Is there a volume-outcome effect and does it matter? Yes,and yes. American Economic Review, Papers and Proceedings, 95(2), 243�247.
Gentzkow, M. (2007). Valuing new goods in a model with complementarity: Online newspapers.American Economic Review713�745.
Geweke, J., Gowrisankaran, G., & Town, R. J. (2003). Bayesian inference for hospital quality in a selec-tion model. Econometrica, 71, 1215�1238.
Ginsburg, P. (2010). Wide variation in hospital and physician payment rates evidence of provider market power.Center for Studying Health System Change.
Glaeser, E. (2002). The governance of not-for-profit firms. National Bureau of Economic Research.Goldstein, G. S. & Pauly, M. V. (1976). Group health insurance as a local public good. In R. N. Rosett
(Ed.), The role of health insurance in the health services sector (pp. 73�114). Cambridge, MA: NationalBureau of Economic Research, Chapter 3.
Government Accountability Office (2009). State small group health insurance markets. Technical report,US Government Accountability Office, Washington, DC. GAO-09-363R.
Gowrisankaran, G. (1995). A dynamic analysis of mergers. Yale University.Gowrisankaran, G. (2011). Estimating the impact of a hospital merger using the difference-in-differences
of prices. International Journal of the Economics of Business, 18(1), 83�89.Gowrisankaran, G. & Town, R. (1997). Dynamic equilibrium in the hospital industry. Journal of
Economics and Management Strategy, 6(1), 45�74.Gowrisankaran, G. & Town, R. (2003). Competition, payers, and hospital quality. Health Services
Research, 38, 1403�1422.Gowrisankaran, G. & Town, R. J. (1999). Estimating the quality of care in hospitals using instrumental
variables. Journal of Health Economics, 18, 747�767.Gowrisankaran, G., Ho, V., & Town, R. (2004). Causality and the volume�outcome relationship in surgery.
University of Minnesota.Gowrisankaran, G., Lucarelli, C., Schmidt-Dengler, P., & Town, R. (2011). Government policy and the
dynamics of market structure: Evidence from critical access hospitals. University of Arizona, CornellUniversity, London School of Economics, University of Minnesota.
Grennan, M. (2010). Price discrimination and bargaining: Empirical evidence from medical devices. University ofToronto.
Gunning, T. S. & Sickles, R. C. (2007). Competition and market power in physician private practices. RiceUniversity.
Haas-Wilson, D. (2003). Managed care and monopoly power: The antitrust challenge. Cambridge, MA:Harvard University Press.
Haas-Wilson, D. & Garmon, C. (2011). Hospital mergers and competitive effects: Two retrospectiveanalyses. International Journal of the Economics of Business, 18(1), 17�32.
Halbersma, R. & Katona, K. (2011). Vertical restraints in health care markets. Tilburg University.
632 Martin Gaynor and Robert J. Town

Halbersma, R., Mikkers, M., Motchenkova, E., & Seinen, I. (2010). Market structure and hospital�insurerbargaining in the Netherlands. European Journal of Health Economics, Online Paper, , http://www.springerlink.com/content/477hx26326t61467/..
Handel, B. (2010). Adverse selection and switching costs in health insurance markets: When nudging hurts.Berkeley: University of California.
Hansmann, H., Kessler, D., & McClellan, M. B. (2003). Ownership form and trapped capital in the hos-pital industry. In E. L. Glaeser (Ed.), The governance of not-for-profit organizations (pp. 45�70). NationalBureau of Economic Research.
Hastings, J. & Gilbert, R. (2005). Market power, vertical integration and the wholesale price of gasoline.Journal of Industrial Economics, 53(4), 469�492.
Herndon, J. (2002). Health insurer monopsony power: The all-or-none model. Journal of HealthEconomics, 21, 197�206.
Hirsch, B. & Schumacher, E. (2005). Classic or new monopsony? Searching for evidence in nursing labormarkets. Journal of Health Economics, 24, 969�989.
Ho, K. (2006). The welfare effects of restricted hospital choice in the US medical care market. Journal ofApplied Econometrics, 21(7), 1039�1079.
Ho, K. (2009a). Barriers to entry of a vertically integrated health insurer: An analysis of welfare and entrycosts. Journal of Economics and Management Strategy, 18(2), 487�545.
Ho, K. (2009b). Insurer-provider networks in the medical care market. American Economic Review, 99(1),393�430.
Ho, K. & Pakes, A. (2011). Physician responses to financial incentives: Evidence from hospital dischargerecords. Unpublished Manuscript.
Ho, V. (2002). Learning and the evolution of medical technologies: The diffusion of coronary angio-plasty. Journal of Health Economics, 21(5), 873�885.
Ho, V. & Hamilton, B. H. (2000). Hospital mergers and acquisitions: Does market consolidation harmpatients? Journal of Health Economics, 19(5), 767�791.
Horn, H. & Wolinsky, A. (1988). Bilateral monopolies and incentives for merger. RAND Journal ofEconomics, 19, 408�419.
Howard, D. H. (2005). Quality and consumer choice in healthcare: Evidence from kidney transplantation.Topics in Economic Analysis and Policy, 5(1), Article 24, 1�20. , http://www.bepress.com/bejeap/topics/vol5/iss1/art24/..
Huckman, R. S. & Pisano, G. P. (2006). The firm specificity of individual performance: Evidence fromcardiac surgery. Management Science, 52(4), 473�488.
Huesch, M. D. (2009). Learning by doing, scale effects, or neither? Cardiac surgeons after residency.Health Services Research, 44(6), 1960�1982.
Huesch, M. D. & Sakakibara, M. (2009). Forgetting the learning curve for a moment: How much per-formance is unrelated to own experience? Health Economics, 18, 855.
Inderst, R. & Wey, C. (2003). Bargaining, mergers, and technology choice in bilaterally oligopolisticindustries. RAND Journal of Economics, 34, 19�41.
Isabel, C. & Paula, V. (2010). Geographic distribution of physicians in Portugal. European Journal of HealthEconomics, 11, 383�393.
Kahn, K. L., Keeler, E. B., Sherwood, M. J., Rogers, W. H., Draper, D., Bentow, S. S., Reinisch, E. J.,Rubenstein, L. V., Kosecoff, J., & Brook, R. H. (1990). Comparing outcomes of care before andafter implementation of the DRG-based prospective payment system. Journal of the American MedicalAssociation, 264(15), 1984�1988.
Kamien, M. I. & Vincent, D. R. (1991). Price regulation and the quality of service. Center for MathematicalStudies in Economics and Management Science, Northwestern University.
Kemp, R. & Severijnen, A. (2010). Price effects of Dutch hospital mergers: An ex post assesment of hip surgery.Netherlands Competition Authority (NMa).
Kessler, D. & McClellan, M. (2000). Is hospital competition socially wasteful? Quarterly Journal ofEconomics, 115(2), 577�615.
Kessler, D. P. & Geppert, J. J. (2005). The effects of competition on variation in the quality and cost ofmedical care. Journal of Economics and Management Strategy, 14(3), 575�589.
633Competition in Health Care Markets

Krishnan, R. (2001). Market restructuring and pricing in the hospital industry. Journal of HealthEconomics, 20, 213�237.
Lakdawalla, D. & Philipson, T. (1998). Nonprofit production and competition. National Bureau of EconomicResearch.
Lakdawalla, D. & Philipson, T. (2006). The nonprofit sector and industry performance. Journal of PublicEconomics, 90, 1681�1698.
Lee, M. (1971). A conspicuous production theory of hospital production. Southern Economic Journal, 38(1), 48�58.
Leonard, G. & Olley, G. S. (2011). What can be learned about the competitive effects of mergers fromnatural experiments? International Journal of the Economics of Business, 18(1), 103�107.
Lewis, M. & Pflum, K. (2011). Diagnosing hospital system bargaining power in managed care networks. OhioState University.
Liebhaber, A. Grossman, J. M. (2007). Physicians moving to mid-sized, single-specialty practices. Technicalreport, Center for Studying Health System Change, Washington, DC. Tracking Report No. 18.
Lindrooth, R., Lo Sasso, A., & Bazzoli, G. (2003). The effect of urban hospital closure on markets.Journal of Health Economics, 22, 691�712.
Luft, H. S., Garnick, D. W., Mark, D. H., Peltzman, D. J., Phibbs, C. S., Lichtenberg, E., & McPhee,S. J. (1990). Does quality influence choice of hospital? JAMA, 263(21), 2899�2906.
Lustig, J. (2010). Measuring welfare losses from adverse selection and imperfect competition in privatized Medicare.Boston University.
Lyon, T. P. (1999). Quality competition, insurance, and consumer choice in health care markets. Journalof Economics and Management Strategy, 8(4), 545�580.
Ma, C.-t. A. (1997). Option contracts and vertical foreclosure. Journal of Economics and Management Strategy,6(4), 725�753.
Madison, K. (2004). Hospital�physician affiliations and patient treatments, expenditures, and outcomes.Health Services Research, 39(2), 257�278.
Maestas, N., Schroeder, M., & Goldman, D. (2009). Price variation in markets with homogeneous goods: Thecase of Medigap. National Bureau of Economic Research.
Martin, A., Lassman, D., Whittle, L., & Catlin, A. (2011). Recession contributes to slowest annual rateof increase in health spending in five decades. Health Affairs, 30, 111�122.
Massachusetts Attorney General (2010). Investigation of health care cost trends and cost drivers, pursuantto G.L. c.118G, y 6 1/2(b). Preliminary report, Office of Attorney General Martha Coakley, Boston,MA, January 29.
Matsudaira, J. D. (2010). Monopsony in the low-wage labor market? Evidence from minimum nurse staffing regula-tions. Cornell University.
Mazzeo, M. (2002). Product choice and oligopoly market structure. RAND Journal of Economics, 33(2),221�242.
Melnick, G. & Keeler, E. (2007). The effects of multi-hospital systems on hospital prices. Journal ofHealth Economics, 26(2), 400�413.
Moriya, A. S., Vogt, W. B., & Gaynor, M. (2010). Hospital prices and market structure in the hospitaland insurance industries. Health Economics, Policy and Law, 5, 459�479.
Mukamel, D., Zwanziger, J., & Bamezai, A. (2002). Hospital competition, resource allocation and qualityof care. BMC Health Services Research, 2(1), 10�18.
Mukamel, D., Zwanziger, J., & Tomaszewski, K. J. (2001). HMO penetration, competition and risk-adjusted hospital mortality. Health Services Research, 36(6), 1019�1035.
Mutter, R. L., Romano, P. S., & Wong, H. S. (2011). The effects of US hospital consolidations onhospital quality. International Journal of the Economics of Business, 18(1), 109.
Mutter, R. L., Wong, H. S., & Goldfarb, M. G. (2008). The effects of hospital competition on inpatientquality of care. Inquiry, 45(3), 263�279.
National Center for Health Statistics (2011). Health, United States, 2010. Hyattsville, MD: NationalCenter for Health Statistics, Center for Disease Control.
Nevo, A. (2000). Mergers with differentiated products: The case of the ready-to-eat cereal industry.RAND Journal of Economics, 31(3), 395�421.
634 Martin Gaynor and Robert J. Town
Newhouse, J. (1970). Toward a theory of nonprofit institutions: An economic model of a hospital.American Economic Review, 60(1), 64�74.
Newhouse, J. P., Williams, A. P., Bennett, B. W., & Schwartz, W. B. (1982). Does the geographical dis-tribution of physicians reflect market failure? Bell Journal of Economics, 13(2), 493�505.
Orsini, C. (2010). Ownership and exit behavior in home health care: Responses to government financing in ahealth care market with low entry and exit barriers. University of Aarhus.
Pakes, A. (2010). Alternative models for moment inequalities. Econometrica, 78(6), 1783�1822.Pakes, A. & McGuire, P. (1994). Computing Markov-perfect Nash equilibria: Numerical implications of
a dynamic differentiated product model. RAND Journal of Economics, 25(4), 555�589.Pakes, A., Ostrovsky, M., & Berry, S. (2007). Simple estimators for the parameters of discrete dynamic
games (with entry/exit examples). RAND Journal of Economics, 38(2), 373�399.Pakes, A., Porter, J., Ho, K., & Ishii, J. (2006). Moment inequalities and their application. Harvard University.Panzar, J. C. & Rosse, J. (1987). Testing for “monopoly” equilibrium. Journal of Industrial Economics, 35(4),
443�456.Parente, S. & Town, R. (2011). The impact of retail clinics on cost, utilization and welfare. University of Minnesota.Pauly, M. & Redisch, M. (1973). The not-for-profit hospital as a physicians’ cooperative. American
Economic Review, 63(1), 87�99.Pauly, M. V. (2004). Competition in medical services and the quality of care: Concepts and history.
International Journal of Health Care Finance and Economics, 4, 113�130.Pennsylvania Health Care Cost Containment Council (2007). Cardiac surgery in Pennsylvania 2005.
Report, Pennsylvania Health Care Cost Containment Council, Harrisburg, PA. June.Pesendorfer, M. & Schmidt-Dengler, P. (2008). Asymptotic least squares estimators for dynamic games.
Review of Economic Studies, 75, 901�928.Petrin, A. (2002). Quantifying the benefits of new products: The case of the minivan. Journal of Political
Economy, 110(4), 705�729.Pratt, J. W., Wise, D. A., & Zeckhauser, R. (1979). Price differences in almost competitive markets.
Quarterly Journal of Economics, 93(2), 189�211.Propper, C., Burgess, S., & Green, K. (2004). Does competition between hospitals improve the quality
of care? Hospital death rates and the NHS internal market. Journal of Public Economics, 88(7�8),1247�1272.
Ramanarayanan, S. (2008). Does practice make perfect: An empirical analysis of learning-by-doing in cardiac sur-gery. Anderson School of Management, UCLA.
Reinhardt, U., Hussey, P., & Anderson, G. (2004). US health care spending in an international context.Health Affairs, 23(3), 10�25.
Rogowski, J., Jain, A. K., & Escarce, J. J. (2007). Hospital competition, managed care, and mortality afterhospitalization for medical conditions in California. Health Services Research, 42(2), 682�705.
Romano, P. & Balan, D. (2011). A retrospective analysis of the clinical quality effects of the acquisition ofHighland Park hospital by Evanston Northwestern healthcare. International Journal of the Economics ofBusiness, 18(1), 45�64.
Rosenthal, M. B., Zaslavsky, A., & Newhouse, J. P. (2005). The geographic distribution of physiciansrevisited. Health Services Research, 40(6, Part 1), 1931�1952.
Royalty, A. B. & Solomon, N. (1999). Health plan choice: Price elasticities in a managed competitionsetting. Journal of Human Resources, 34(1), 1�41 pp.
Sacher, S. & Vita, M. (2001). The competitive effects of a not-for-profit hospital merger: A case study.Journal of Industrial Economics, 49(1), 63�84.
Sari, N. (2002). Do competition and managed care improve quality? Health Economics, 11, 571�584.Schaumans, C. & Verboven, F. (2008). Entry and regulation: Evidence from health care professions.
RAND Journal of Economics, 39, 949972.Schmalensee, R. (1989). Inter-industry studies of structure and performance. In R. Schmalensee &
R. Willig (Eds.), Handbook of industrial organization (Vol. 2, pp. 951�1009). Amsterdam andNew York: Elsevier Science, North-Holland, Chapter 16.
Schmidt-Dengler, P. (2006). The timing of new technology adoption: The case of MRI. London School ofEconomics.
635Competition in Health Care Markets
Schneider, J., Li, P., Klepser, D., Peterson, N., Brown, T., & Scheffler, R. (2008a). The effect of physi-cian and health plan market concentration on prices in commercial health insurance markets.International Journal of Health Care Finance and Economics, 8, 13�26.
Schneider, J., Miller, T., Ohsfeldt, R., Morrisey, M., Zellner, B., & Li, P. (2008b). The economics ofspecialty hospitals. Medical Care Research and Review Journal, 65(5), 531�553.
Schut, F., Greß, S., & Wasem, J. (2003). Consumer price sensitivity and social health insurer choice inGermany and the Netherlands. International Journal of Health Care Finance and Economics, 3, 117�138.
Seider, H., Gaynor, M., & Vogt, W. B. (2000). Volume�outcome and antitrust in US health care markets.Universitat Augsburg, Carnegie Mellon University.
Shen, Y., Wu, V., & Melnick, G. (2010). Trends in hospital cost and revenue, 1994�2005: How are theyrelated to HMO penetration, concentration, and for-profit ownership? Health Services Research, 45(1),42�61.
Shen, Y.-S. (2003). The effect of financial pressure on the quality of care in hospitals. Journal of Health Economics,22(2), 243�269.
Snyder, C. (1996). A dynamic theory of countervailing power. RAND Journal of Economics, 27(4),747�769.
Sohn, M.-W. & Rathouz, P. J. (2003). Competition among hospitals and quality of care: Hospital-level analysis.University of Chicago.
Sorensen, A. T. (2000). Equilibrium price dispersion in retail markets for prescription drugs. Journal ofPolitical Economy, 108(4), 833�850 pp.
Sorensen, A. T. (2003). Insurer�hospital bargaining: Negotiated discounts in post-deregulationConnecticut. Journal of Industrial Economics, 51(4), 469�490.
Spang, H., Bazzoli, G., & Arnould, R. (2001). Hospital mergers and savings for consumers: Exploringnew evidence. Health Affairs, 20(4), 150�158.
Staiger, D., Spetz, J., & Phibbs, C. (2010). Is there monopsony in the labor market? Evidence from a nat-ural experiment. Journal of Labor Economics, 28, 211�236.
Starc, A. (2010). Insurer pricing and consumer welfare: Evidence from Medigap. Harvard University.Stole, L. & Zwiebel, J. (1996). Bargaining, mergers, and technology choice in bilaterally oligopolistic
industries. Review of Economic Studies, 63, 375�410.Strombom, B. A., Buchmueller, T. C., & Feldstein, P. J. (2002). Switching costs, price sensitivity and
health plan choice. Journal of Health Economics, 21(1), 89�116.Sullivan, D. (1989). Monopsony power in the market for nurses. Journal of Law and Economics, 32(2),
S135�S178.Tamm, M., Tauchmann, H., Wasem, J., & Greß, S. (2007). Elasticities of market shares and social health
insurance choice in Germany: A dynamic panel data approach. Health Economics, 16, 243�256.Tay, A. (2003). Assessing competition in hospital care markets: The importance of accounting for quality
differentiation. RAND Journal of Economics, 34(4), 786�814.Tenn, S. (2011). The price effects of hospital mergers: A case study of the sutter-summit transaction.
International Journal of the Economics of Business, 18(1), 65�82.Thompson, E. (2011). The effect of hospital mergers on inpatient prices: A case study of the New
Hanover-Cape Fear transaction. International Journal of the Economics of Business, 18(1), 91�101.Thompson, P. D. (2010). Learning by doing. In B. Hall & N. Rosenberg (Eds.), Handbook of economics of
technical change (pp. 429�476). North-Holland, New York and Oxford: Elsevier Science, Chapter 10.Tirole, J. (1988). The Theory of Industrial Organization. Cambridge, MA: MIT Press.Town, R. J. & Liu, S. (2003). The welfare impact of Medicare HMOs. RAND Journal of Economics, 34,
719�736.Town, R. J. & Park, M. (2011). Market structure beliefs and hospital merger waves. University of Minnesota.Town, R. & Vistnes, G. (2001). Hospital competition in HMO networks. Journal of Health Economics,
20(5), 733�752.Town, R., Feldman, R., & Kralewski, J. (2011). Market power and contract form: Evidence from physi-
cian group practices. International Journal of Health Care Finance and Economics, forthcoming.Town, R., Wholey, D., Feldman, R., & Burns, L. (2006). The welfare consequences of hospital mergers.
National Bureau of Economic Research.
636 Martin Gaynor and Robert J. Town

Town, R., Wholey, D., Feldman, R., & Burns, L. (2007). Revisiting the relationship between managedcare and hospital consolidation. Health Services Research, 42(1), 219�238.
Van Dijk, M., Pomp, M., Douven, R., Laske-Aldershof, T., Schut, E., de Boer, W., & do Boo, A. (2008).Consumer price sensitivity in Dutch health insurance. International Journal of Health Care Finance andEconomics, 8, 225�244.
Varkevisser, M. & Schut, F. (2009). Hospital merger control: An international comparison. Erasmus University,Rotterdam.
Vogt, W. B. & Town, R. J. (2006). How has hospital consolidation affected the price and quality of hospital care?Princeton, NJ: Robert Wood Johnson Foundation.
Volpp, K. G., Williams, S. V., Waldfogel, J., Silber, J. H., Schwartz, J. S., & Pauly, M. V. (2003). Marketreform in New Jersey and the effect on mortality from acute myocardial infarction. Health ServicesResearch, 38(2), 515�533.
Weber, E. (2010). Measuring welfare from ambulatory surgery centers: A spatial analysis of demand for healthcarefacilities. Carnegie Mellon University.
Wong, H. (1996). Market structure and the role of consumer information in the physician services indus-try: An empirical test. Journal of Health Economics, 15, 139�160.
Wu, V. (2008). The price effect of hospital closures. Inquiry, 45, 280�292.Wu, V. (2009). Managed care’s price bargaining with hospitals. Journal of Health Economics, 28, 350�360.Yett, D. (1975). An economic analysis of the nurse shortage. Lexington, MA: Lexington Books.Zwanziger, J. & Mooney, C. (2005). Has price competition changed hospital revenues and expenses in
New York? Inquiry, 42, 183�192.Zwanziger, J., Melnick, G., & Bamezai, A. (2000). The effect of selective contracting on hospital costs
and revenues. Health Services Research, 35(4), 849�867.
637Competition in Health Care Markets