competition and product quality in the supermarket industry · competition and product quality in...
TRANSCRIPT
Competition and Product Quality in the Supermarket Industry
David A. Matsa 0F
*
July 6, 2009
Abstract
This paper analyzes the effect of competition on a supermarket firm’s incentive to
provide product quality. In the supermarket industry, product availability is an important
measure of quality. Using U.S. consumer price index microdata to track inventory
shortfalls, I find that stores facing more intense competition have fewer shortfalls.
Competition from Wal-Mart – the most significant shock to industry market structure in
half a century – decreased shortfalls by up to 24 percent. The risk of customers switching
stores appears to provide strong incentives for investments in product quality.
JEL Classifications: D40, G31, L15, L81
Keywords: product quality, competition, monopoly, big-box, inventory management, stockout
* Kellogg School of Management, Northwestern University, [email protected]. This work was conducted in coordination with the U.S. Bureau of Labor Statistics (BLS) under an Agency Agreement. I am indebted to Bill Cook, Craig Brown, Mark Bowman, Dan Ginsburg, and others at the BLS who have been extremely helpful throughout this project, and to Mark Bils for sharing portions of his computer code and insight into the data. I also want to thank Mike Mazzeo and Nancy Rose for helpful comments. I am grateful to Garry Van Siclen and Trade Dimensions for providing the supermarket establishment data, and to Thomas Holmes for the information on Wal-Mart store openings. This research would not have been possible without the support of the George and Obie Shultz Fund and the National Science Foundation (Grant No. SES-0551097). The BLS pledges confidentiality to voluntary respondents in the Consumer Price Index (CPI) sample; no inferences should be made from this paper as to whether or not a specific firm is included in the CPI sample. Any opinions, findings, or conclusions expressed herein are my own and do not necessarily reflect the views of the BLS.
1
Increasingly over the last few years, competition for consumers’ food dollars has intensified....The Company believes its competitive advantages include convenient locations, the quality of service it provides its customers, competitive pricing, product variety and quality and a pleasant shopping environment.
Ingles Markets, Inc. 10-K, September 27, 2008
1. Introduction
In most consumer markets, there is more to shopping than finding the lowest price. A product’s
quality can have large effects on demand and consumer welfare. Although theory has long recognized
that firms with market power may reduce their products’ quality in order to save costs and maximize their
profits (Chamberlin 1933; Abbott 1955), empirical research and competition policy tend to focus almost
exclusively on price setting (Draganska, Mazzeo, and Seim 2009). While the potential for competition to
have a significant effect on product quality is recognized in theory, its empirical importance is much less
clear.
This study focuses on the connection between competition and product quality in the supermarket
industry. In the retail sector, a firm’s “product” is the shopping experience it provides its customers.
Like for physical products, retail product quality has many dimensions, including the store’s cleanliness,
its checkout speed, the courteousness of its staff, and the depth of its product assortment. The particular
dimension of quality that I examine in this paper is whether a supermarket reliably has its customers’
preferred products in stock when they want to make a purchase.
As an important determinant of customer satisfaction, maintaining a reputation for product
availability is a key strategic issue throughout the retail sector. Estimates suggest that 8.2 percent of the
items a grocery retailer carries are not in inventory on a typical afternoon and that this is a major cause of
customer dissatisfaction (Andersen 1996; Roland Berger 2002). In fact, consumer surveys find that
frequent inventory shortfalls (“stockouts”) and limited product variety are the number one cause of
dissatisfaction among supermarket shoppers (FMI 1994b).
Stockouts can be costly to retailers in the current period and especially in future periods.
Customers’ immediate substitution to other products or stores upon encountering out-of-stock items is
estimated to cost the average grocery retailer 1.7 to 3.1 percent of current period sales (e.g., Andersen
1996; Emmelhainz et al. 1991; Anupindi et al. 1998). Aggregating over the supermarket industry, this
translates to $6 billion to $12 billion in lost sales per year.1F
1 An even greater risk to the firm is that some
consumers will shift their future shopping to competing stores. Although these future costs are difficult to
1 This figure aggregates retailers’ lost intended purchase expenditure, but it does not include the sales gained by retailers because of inventory shortfalls at other stores. The number is meaningful from the perspective of an individual profit-maximizing retailer, but not from the perspective of the industry. The decrease in aggregate supermarket sales, which includes gains in addition to losses, is likely much lower.
2
quantify, studies find they have the potential to be substantial (e.g., Straughn 1991; Fitzsimons 2000;
Anderson et al. 2006). To avoid these costs, a typical supermarket firm spends twice as much on
inventory as on advertising.2F
2
Pressure from competition places countervailing incentives on a retail firm’s optimal level of
availability. This tradeoff and other factors affecting optimal availability are discussed in Section 2. On
one hand, lower profit margins reduce the immediate costs of losing a sale because an item is out of stock.
But greater competition also increases the future costs if dissatisfied consumers are more likely to switch
stores for their future shopping needs. Which of these incentives dominates is an empirical question.
This ambiguity is common in theories of quality competition (for example, see Spence 1975).
Schmalensee’s (1979) review of the theoretical literature on quality competition concludes “there is an
obvious need for empirical work to confront the implications of the theoretical literature with data.”
To measure inventory shortfalls, this study takes advantage of a unique data set that was hand
collected by the U.S. Bureau of Labor Statistics for use in constructing the consumer price index (CPI).
Section 3 describes these data. The data are unique in that they contain information that can be used to
measure supermarket product availability at the store-product level, even for firms that do not report
financial information to the Securities and Exchange Commission (SEC). These disaggregated microdata
allow me to examine variation in product availability across products and stores – even within the same
firm – to shed light on the economic forces that affect expenditures on product quality.
I examine the empirical connection between competition and supermarket quality using two
complementary approaches. First, in a descriptive analysis, I measure the conditional correlation between
local retail competition and stockouts. These results control for market and store characteristics as well as
an extensive set of fixed effects, including indicators for firm, product category, metropolitan area, and
date. I find that stockouts are negatively correlated with competition. Supermarkets that face competition
in their census tract average 5 percent lower stockout rates than otherwise similar stores, suggesting that
competition increases firms’ incentive to provide quality.
To address the possibility that these correlations are confounded by endogeneity or an omitted
local market characteristic, I employ a second empirical approach. I examine the effects of Wal-Mart’s
entry into the supermarket industry – the most significant shock to industry market structure in half a
century. Section 4 describes these developments. Within fourteen years of opening its first supercenter
(stores selling both general merchandise and a full-line of groceries) in 1988, Wal-Mart has become the
largest grocery retailer in the U.S. and the first truly national grocery chain. I exploit time series patterns
in Wal-Mart’s entry into local grocery markets to examine how competing supermarkets adjust their
2 Using an inventory carrying cost of 25 percent (Brooks 1972), the average Compustat firm in 2005 spent 1.6 percent of sales on financing and maintain inventory, compared to 0.8 percent on advertising.
3
quality in response. After controlling for market and even store fixed effects, the specific timing of Wal-
Mart’s entry represents an exogenous shock to the competitive landscape of these markets. Consistent
with this interpretation, there are no pre-existing differences or trends in product availability in these
markets before Wal-Mart’s entry.
Section 5 documents how supermarkets’ product availability changes after Wal-Mart comes to
town. The analysis finds that pressure from competition can have significant effects on the quality of a
firm’s products. When facing competition from Wal-Mart, stockouts decrease on average by about 8
percent. The effect is long-lived and robust to including store fixed effects, indicating that the additional
stockouts are not attributable to demand miscalculations or attrition that may have followed Wal-Mart’s
entry. Furthermore, I separate products based on their distribution channel and find that competition has
no impact on stockouts for product categories for which inventory is directly managed by manufacturers’
distributors, whose optimal stockout rate is unlikely to change with retail market structure. There is also
no evidence of incumbents decreasing product variety after competition increases.
Heterogeneity in these effects across stores and markets further supports the role of competition
in improving quality. I examine whether there are greater reductions in stockouts among stores that are
more likely to lose their customers to Wal-Mart, as measured along two dimensions. First, competition
from Wal-Mart typically represents a more direct challenge to large regional chains that feature extensive
selections of products than to independent stores that serve niche consumer markets. Second, because
Wal-Mart caters to low income consumers with a low price, low service format, supermarkets located in
lower income areas within a given supercenter’s catchment area are likely to be most affected when a
supercenter opens. I find that the decrease in stockouts is indeed related to both factors. In fact, the
average stockout rate decreases by 24 percent among chain stores in low income areas.
This analysis focuses on product availability in the supermarket industry, but it likely also has
implications for other dimensions of product quality at these and other firms. Supermarket executives see
the stockout rate as a barometer of the whole operational side of the business (Progressive Grocer 1968, p.
S4). Empirically, I confirm that supermarket inventories are correlated with other dimensions of product
quality: chains that rarely run out of inventory are also cleaner, have more courteous staff, and have faster
checkouts. If competition reduces stockouts, these other dimensions of product quality may improve as
well. In fact, case studies suggest that supermarket chains attempt to differentiate themselves from Wal-
Mart by improving quality along many dimensions, including increasing product assortments, offering
fresher meat and produce, and maintaining cleaner, more attractive displays (Carré, Tilly, and Holgate
2009).
This article complements a small number of empirical papers that examine the connection
between quality provision and market concentration in other settings. For example, Domberger and Sherr

4
(1989) examine markets for real estate transfer services in England and Wales, and Mazzeo (2003)
examines on-time performance in the US passenger airline industry. These studies tend to find positive
correlations between competition and quality, but the data analyzed leave some questions about causal
inference. 3F
3 This paper addresses those concerns by exploiting variation at the product level in individual
stores that experience different shocks to their competitive environment. The shocks vary in their
magnitude and hit at different times. By studying how competition affects inventory strategies across
these markets and stores, and for products with different characteristics, I am able to make a strong
argument for competition causing supermarkets to improve their quality.
This work also extends previous research on retail inventory strategy. An extensive theoretical
literature investigates optimal retail inventory policies and stockout avoidance (e.g., Hall and Porteus
2000; Dana 2001; Dana and Petruzzi 2001; Gaur and Park 2007), but until recently there has been little
data on the empirical relevance of these models. Based on a large-scale field test at a catalog company,
Anderson, Fitzsimons, and Simester (2006) conclude that inventory policy at the firm they study fails to
account for the future opportunity costs of a stockout. Building on that result, Matsa (2009) shows that
highly leveraged supermarket firms, which are likely to heavily discount the future costs, are more likely
to run out of inventory. This is the first empirical paper (that I know of) to examine the connection
between market structure and inventory policy.
2. Retail product availability and competition
Maintaining optimal product availability is an important dimension of store quality in the retail
sector. Studies indicate that 8.2 percent of a grocery retailer’s items are out of stock on a typical
afternoon and that frequent stockouts and limited product variety are the number one cause of
dissatisfaction among supermarket shoppers (Andersen 1996; Roland Berger 2002; FMI 1994b).
Reducing stockouts is cited as being as important to store image as flashy customer attractions such as
new buildings, remodeling, attractive decor, advertising, promotion, and merchandising (Progressive
Grocer 1968, p. S1). Nevertheless, stockout rates vary dramatically across stores and markets, and high
in-stock levels are reported to provide retailers with a significant competitive advantage (Andersen 1996).
The frequency of retail stockouts is largely determined by ordering and stocking decisions made
at the regional and store levels. Studies find that the vast majority of supermarket stockouts are caused
3 Domberger and Sherr (1989) find that the threat of new entry caused by liberalization was associated with increases in customers’ self-reported satisfaction with their attorney for property sales but not for property purchases. Based on only time series variation, it is unclear to whether these measures of satisfaction reflect the rapid acceleration in house prices over the period rather than an actual change in the quality of legal services provided. Mazzeo (2003) finds that average flight delays are longer in more concentrated airline markets. Based only on cross-sectional variation, it is possible that unobserved market characteristics that cause delays also deter entry from additional carriers.

5
within the store rather than by other parties in the vertical chain: 51 to 73 percent of out-of-stocks due to
inaccurate forecasting (e.g., underestimating demand) and ordering errors (e.g., failing to sufficiently
monitor the shelf inventory and not reordering when demand exceeds forecast) and another 8 to 22
percent due to failing to restock shelves with available backroom or display inventory (Andersen
Consulting 1996; Gruen et al. 2002). A store’s investments in inventory and staff assigned to shelf
monitoring thus have the most direct impact on its product availability. Because these decisions can be
adjusted in real time, an optimizing retailer typically takes retail market structure as given when making
investments in product availability.
Although no retailer typically wants to run out of inventory, reducing stockouts is costly and
maintaining 100 percent product availability in a supermarket is certainly not optimal. Optimal stocking
decisions trade off expenditures on both inventory costs and shelf monitoring costs for the present value
of expected lost profits from running out of inventory. Running out of inventory can reduce profits in
both the short and long run. Upon finding that an item is out of stock, consumers substitute by purchasing
an alternative item (which reduces the intended purchase expenditure by 0.4 percent), shopping at another
store or forgoing the purchase (a 1.3 percent expenditure reduction), or delaying purchase (a 1.3 percent
reduction; Andersen 1996). Lost sales from immediate substitution on out-of-stock items is estimated to
cost the grocery industry $6 to 12 billion annually.0H
1
Importantly, a store that runs out of inventory not only loses profits from current purchases of the
product but also risks affecting consumers’ future shopping behavior. Switching supermarkets is thought
to be costly for shoppers, who are accustomed to a particular store’s layout and a regular food shopping
routine. Because consumers only reluctantly change their routines, a small but important risk of running
out of inventory is that it may cause some customers to switch their regular business to another retailer
(Anderson et al. 2006). Consumer surveys find that stockouts are a significant factor in consumers’
decisions to switch primary grocers (Andersen 1996). For this reason a store’s provision of reliable
product availability can be thought of as an investment in future market share.
A store’s optimal level of product availability thus depends on customers’ propensities, when
facing an out-of-stock item, to reduce current expenditures and to switch stores on future shopping trips.
An increase in retail competition can affect these risks. Competition may reduce the short-run costs of
running out of stock if profit margins decrease, making it less costly on the margin for customers to
substitute to a lower margin product, delay purchase, or search elsewhere. But competition may also
increase the long-run costs, because consumers will have additional options for their future shopping
needs. Although a reputation for running out of stock frequently may irritate customers, it is not so costly
for a store when customers other food shopping options are limited. Thus once another store opens
6
nearby, a strong incentive can develop to improve quality and reputation for reliable in-stock
performance.
Retailers’ incentives in inventory management differ from those of the product manufacturers.
When customers substitute brands upon encountering an out-of-stock item, the retailer only loses any
difference in margin between the products, but the manufacturer loses profits from the sale entirely. On
the other hand, the manufacturer may lose little when customers switch stores, while the retailer loses the
sale entirely. Therefore, manufacturers do not share stores’ incentive to offer greater product availability
when retail competition increases. If manufacturers managed shelf inventory, increased retail competition
would be unlikely to affect product availability.
Many factors besides competition and customer substitution and switching also affect a particular
item’s optimal stockout rate, including the price elasticity of demand, the wholesale cost, the inventory
cost, and the variability of demand. Products for which demand is less elastic earn greater markups and
are more valuable to keep in stock. Some products, such as refrigerated items, are more costly to
inventory than shelf-stable products. And some products, such as many seasonal items, have less
predictable demand.
The optimal rate also varies across retailers. In large stores, returns to scale in demand
forecasting and order management may reduce the cost of providing product availability. Greater product
variety may also reduce the inconvenience for consumers of encountering a stockout in these stores. The
distance from a store’s primary supplier may affect the store’s optimal stockout rate, and technological
advances and other changes over time may affect inventory costs. To control for these and other factors
that affect the optimal rate of product availability, the empirical analyses of stockouts presented below
controls for product category, store, and year-month fixed effects as well as a number of market, item,
and time-varying store characteristics.
3. Data and descriptive analysis
A. Data on retail stockouts
Reliable data on supermarket product availability are rare; most food stores do not even keep
systematic records on their availability (Andersen 1996). The most frequently cited statistics on the
prevalence of stockouts come from an Andersen (1996) study, sponsored by the Coca-Cola Retailing
Research Council. The authors performed daily audits of 7,000 items in eight product categories in ten
demographically and regionally diverse stores for one month. Such isolated (and often localized) studies
do not lend themselves to either cross-sectional or longitudinal analysis at the store or market level. Due
to the cost of conducting wider-scale audits, some studies have attempted to measure out-of-stocks using

7
purchase scanner data (e.g., Gruen et al. 2002). But such studies risk confusing low availability with low
demand, which would bias estimates (Dorgan 1997).
I obtain reliable data on stockouts from the CPI Commodity and Services Survey, which is used
by the U.S. Bureau of Labor Statistics (BLS) to compute the consumer price index (CPI). To calculate
the CPI, the BLS sends surveyors to record the prices of about 30,000 items sold at grocery stores each
month, where each price is specific to a particular product at a particular establishment. Generally, a
product must be available for purchase at the time the surveyor visits the establishment in order to be
included in the CPI. If the product is unavailable for sale, the surveyor determines whether the
establishment expects to carry the item in the future. Thus a product may be considered out of stock if it
is not available for sale, it is continuing to be carried by the outlet, and it is not seasonally unavailable
(Bils 2005). More details on the construction of these data are described in Appendix A.
Using these microdata, I examine observations on product availability at the item-store-month
level from January 1988 through December 2004. Any particular item is sampled for at most 5 years: the
full data set includes about 5 million observations on availability for almost 220,000 unique items at
11,500 stores in more than 8,000 census tracts and 147 metropolitan areas. I augment the CPI data with
detailed store-level information from the Trade Dimensions Retail Site Database and demographic
information on each store’s census tract from the 2000 U.S. Census of Population and Housing.
Summary statistics are reported in Table 1. The average stockout rate among supermarket respondents is
4.3 to 5.3 percent. Two factors relating to BLS data collection procedures seem to explain why these
estimates are lower than the 1996 industry estimate of 8.2 percent. First, CPI data are usually collected
throughout the day on weekdays, whereas out-of-stocks are most prevalent in the afternoon and on
Sundays (when they reach an estimated 10.9 percent; Andersen 1996). Second, for food items consumed
at home, the BLS effectively does not record stockouts caused by store shelving issues (8 to 22 percent of
stockouts; see Appendix A for details). While these factors affect estimates of the absolute level of
stockouts, they are unlikely to bias estimates of changes in product availability caused by changes in
stores’ competitive environments.
Average stockout rates by day of the week are reported in Figure 1. Average stockout rates are
greatest on Sundays (4.8 percent) and decline throughout the rest of the week. This general pattern is
consistent with 13 different industry studies surveyed by (Gruen et al. 2002, p.14). Because the heaviest
shopping usually takes place over the weekend, re-ordering and deliveries typically occur on Monday and
Tuesday. Throughout the week, restocking and preparations for Saturday and Sunday promotions lead to
lower stockout rates. After the heavy shopping on Saturday, stockout rates increase sharply on Sundays
when labor is reduced, stores seldom take deliveries, and inventories runs out for items that are more
popular than expected.

8
Stockout rates also vary systematically across product categories. Figure 2 graphs average
stockout rates by major product group. Average stockout rates are lowest for prescription drugs (0.9
percent) and fats and oils (1.4 percent), and they are highest for fish and seafood (8.3 percent), poultry
(7.9 percent), and other fresh meat, fruit, and bakery products. On the whole, stockout rates are lower for
shelf-stable than refrigerated or frozen products. Similar patterns are evident across more detailed
product categories. Appendix Table 1 reports average stockout rates in each of 76 different product
categories. There is significant variation in stockout rates even for product categories within the same
major group. For example, cakes are out of stock 10.0 percent of the time, whereas cookies are out of
stock only 3.5 percent; and ground beef is out 2.5 percent, while other beef and veal are out 12.5 percent.
In the analyses that follow, I control for product category fixed effects at this more detailed level.
B. Stockouts and competition and other market, store, and product characteristics
Although rates of product availability calculated from the CPI data are certainly measured with
sampling error, they seem to provide reliable estimates. Table 2 presents the conditional correlations of
stockouts with various market, store, and product characteristics in a linear-probability multivariate-
regression framework.4F
4 Each observation represents a particular item in a particular store on a particular
day: the dependent variable equals 100 if the item is out of stock and 0 if it is in stock. In addition to the
controls shown, the regression reported in Table 2 includes a set of fixed effects for each of the following:
the firm, the product category, the metropolitan area, the day of the week, and the year-month.5F
5 The
standard errors are adjusted to account for contemporaneous and intertemporal within-market correlation
in the error term.
A number of robust patterns emerge from the estimates presented in Table 2. First, the structure
of retail competition is correlated with supermarket quality. As a measure of supermarket competition, I
examine whether a store faces any competing stores in its census tract. On average, stores that face
competition in their census tract have 5 percent lower stockout rates than other stores (evaluated at the
mean; p < 0.01).6F
6 A causal interpretation of this estimate implies that pressure from supermarket
competition encourages improvements in quality. But it is also possible that an omitted variable, such as
an unmeasured dimension of consumer preferences, leads to both greater competition and greater product
4 Given the size of the data set and the large number of fixed effects, maximum likelihood estimation of a probit or conditional logit model is computationally infeasible. 5 There is one firm fixed effect for all stores not affiliated with a chain (defined as 11 or more retail stores), which corresponds to 18.9 percent of the sample. Product category fixed effects are at the level of BLS entry level items. The sample includes items from approximately 75 grocery categories, ranging from breakfast cereal to eggs to laundry and cleaning products; Appendix Table A1 lists the complete set of product categories. 6 Stockout rates at these stores average 21 basis points lower – a 5 percent decrease relative to the sample mean of 4.3 percent.
9
availability in some markets. The analysis of Wal-Mart entry in the supermarket industry, presented
below, aims to distinguish between these possibilities by examining the competitive responses to
plausibly exogenous shocks to the competitive landscape of various local markets over time.
The importance of other market characteristics is also striking. Supermarkets located in census
tracts with wealthier consumers offer greater product availability (fewer stockouts). Higher prices (and
presumably margins) in these markets give firms an incentive to offer greater availability (Dana 2001).
Markets with more senior citizens also have significantly fewer stockouts, likely because senior citizens –
with pronounced preferences and low time costs – are more likely to shop elsewhere when their preferred
item is out of stock (Peckham 1963).
The stockout rates are also linked to store and product characteristics. Returns to scale seem to
lead to lower stockout rates at larger stores, and stockout rates are greatest when a store is located far
from its primary supplier. Stockout rates are also greater for seasonal items (items that are not offered for
sale year-round), which is consistent with the demand for these items being less predictable.7F
7
C. Stockouts and other dimensions of store quality
Observed rates of product availability are also correlated with other dimensions of supermarket
quality. I obtain ratings of major supermarket chains from Consumer Reports magazine, which publishes
the ratings based on tens of thousands of readers’ responses to questionnaires (See Appendix A for
details). Combining these ratings with the CPI data yields a sample of more than 2 million availability
observations for 57 supermarket chains.
Conditional correlations of stockouts with various ratings from Consumer Reports are presented
in Table 3.8 I regress the stockout indicator on each rating, fixed effects for product category,
metropolitan area, day of the week, and year-month, and controls for the market, store, and product
characteristics shown in Table 2. The standard errors are adjusted to account for within-firm correlation
in the error term. The results show that the more highly rated chains are less likely to run out of
inventory. Consumer Reports’ overall satisfaction score summarizes readers’ average satisfaction with
store quality. While overall satisfaction is ostensibly rated on a 100-point scale, the actual ratings range
from 63 to 87. The estimate, which is reported in Column (1), suggests that a 10-point greater overall
satisfaction rating is associated with a lower stockout rate by 0.6 percentage points – a 13 percent
reduction for the average firm (p < 0.01).
7 The algorithm for identifying stockouts is structured to avoid classifying an unavailable item as a stockout when the item is out of season (see Appendix A for details). 8 These results are also reported in Matsa (2009).

10
In addition to having relatively high overall ratings, chains with low stockout rates are rated
highly in more specific dimensions as well. Consumer Reports publishes separate ratings of supermarket
cleanliness, staff courtesy, and checkout speed. Each of these ratings is on a 5-point scale, and their
conditional correlations with the stockout rate are reported in Columns (2) through (4). A decrease in the
stockout rate of 40 basis points (just under 10 percent of the mean) is associated with a 1.7 point increase
in its rating for cleanliness, a 1.3 points for courtesy, and 1.3 points for checkout speed.8F
9 A retailer’s
ability to keep products in stock seems to also be an indicator of their performance on other dimensions of
product quality.
4. Wal-Mart’s entry into the supermarket industry
Wal-Mart’s entry into the supermarket industry shocked the structure of local grocery markets
throughout the United States. Wal-Mart first experimented with adding a full-line of groceries to its
general merchandise stores in 1988, branding these stores “supercenters.” According to industry analysts,
Wal-Mart originally added food in order to drive store traffic and sales of its general merchandise
offerings by getting customers into its stores for weekly shopping rather than only a couple of times a
month (Singh, Hansen, and Blattberg 2006; Carré, Tilly, and Holgate 2009). Wal-Mart has since grown
to become the largest grocery retailer in the United States, currently operating more than 2,600
supercenters across the United States. In fact, groceries now account for 49 percent of Wal-Mart’s
domestic sales. Not surprisingly, Wal-Mart is seen as a serious threat to the traditional supermarket
industry, with 80 percent of supermarket managers citing competition from supercenters as their biggest
concern in the coming year (National Grocers Association 2003; Hausman and Leibtag 2007).9F
10
Wal-Mart’s success is widely attributed to a combination of technology and scale (Basker 2007).
State of the art information technologies in distribution enable Wal-Mart to use frequent deliveries to
support large stores at low cost. Adding additional product lines, such as groceries, both benefits from
and further enhances this advantage, as delivery trucks use the additional product lines to support even
more frequent deliveries without much additional cost (Holmes 2001). Economies of scale also put Wal-
Mart in a strong bargaining position with suppliers, as Wal-Mart accounts for 14 to 18 percent of sales
from the major grocery manufacturers, including Kraft, Kellogg, and General Mills (Warner 2006).
Building on this competitive advantage, Wal-Mart stores feature a low price, low service, one-
stop-shopping format. For a majority of consumers, low prices are the “best thing” about Wal-Mart (Pew
9 A one-point increase in a store’s cleanliness rating is associated with 24 basis points fewer stockouts. Therefore, a 1.7 point increase in the cleanliness rating is associated with 40 basis points fewer stockouts (i.e., 40 / 24 = 1.7). The other estimates are calculated in a similar manner. 10 Although Kmart and Target, other large general merchandise retailers, have also added groceries to some of their stores, they have not grown nearly as fast (Graff 2006).
11
2005). The broad selection of product lines – including groceries, clothes, house wares, and cosmetics –
also offer convenience. However, lower prices and increased convenience are partially mitigated by
reduced product offerings, lower service levels, and other disamenities. Wal-Mart’s low inventory costs
and strong bargaining position with suppliers rely in part on its carrying a more limited assortment of
brands and varieties of particular goods – i.e., it specializes in product breadth rather than depth (Basker
2007). With 100,000 people visiting an average supercenter each week, customers also criticize long
lines and poor customer service (Pew 2005); reports find the stores’ displays often messy and dirty, the
aisles jammed with new stock waiting to be shelved (Callahan and Zimmerman 2003).10F
11
Consistent with its product market strategy, Wal-Mart is more popular among lower income
consumers. Fifty-three percent of people with annual incomes below $30,000 shop at Wal-Mart
regularly, compared to only 33% of those with incomes above $50,000 (Pew 2005). Basker
(forthcoming) confirms that the likelihood of shopping at Wal-Mart falls with income. Using both cross-
sectional and time-series data, she finds that the average household spends more at Wal-Mart when its
income falls. Singh, Hansen, and Blattberg (2006) find a similar pattern among supermarket customers
that defect to Wal-Mart when a supercenter opens nearby. They examine high-frequency transaction data
for one small town supermarket before and after Wal-Mart’s entry, and find that low income consumers
are more likely to shop less at the supermarket after Wal-Mart opens.
Competition in the retail food industry can be divided into two distinct submarkets: regional
chains and independent stores. Ellickson (2006) shows that the chains’ escalating investments in their
distribution systems can create natural oligopolies in retail food markets. The chains build large stores
that feature extensive selections of products, while independent stores offer narrower, more specialized
selections of products serving niche consumer markets. In this framework, the entry of Wal-Mart’s
logistics expertise into groceries presents a more direct challenge to the large chains than to the niche
independents.
Following previous research, I use counties as the relevant market for competition from Wal-Mart
(e.g., Graff and Ashton 1994; Basker 2005; Jia 2008). Figure 3 shows the timing of Wal-Mart’s entry
into new grocery markets between 1988 and 2004. The store opening data is from Holmes (2008), which
is based primarily on information posted by Wal-Mart on its web site plus additional data from Basker
(2005). Supercenter expansion followed a similar geographic pattern to the expansion of Wal-Mart’s
general merchandise stores, starting in the central United States and radiating outward until supercenters
reached nationwide (Basker 2007; Holmes 2008).
11 Wal-Mart is also known for inferior offerings and low service in the meat department. After a group of meat-cutters in east Texas voted to unionize in 2000, Wal-Mart reassigned its butchers to other jobs and turned to case-ready, pre-packaged meat. The decision saved labor costs but left its meat counters with fewer choices and no customer service (Callahan and Zimmerman 2003).

12
Because Wal-Mart locates its stores in markets where it expects to be profitable, cross-sectional
estimates of the effects of Wal-Mart’s entry are undesirable. An omitted variables bias is likely to affect
cross-sectional estimates, because market characteristics that affect Wal-Mart’s entry decision are also
likely to affect supermarkets’ expenditures on quality. Although a well-designed instrumental variables
(IV) strategy could overcome this issue, finding an appropriate instrument has proven elusive. Basker
and Noel (forthcoming) show that using either (i) the distance from Wal-Mart’s nearest food distribution
center or (ii) the presence of a pre-existing Wal-Mart discount store, violate the IV exclusion restriction
and yield biased estimates. Basker and Noel (forthcoming) find instead that panel OLS regressions with
market fixed effects provide the most reliable estimates of the effects of Wal-Mart’s entry.
Relative to the other approaches, panel estimates with market fixed effects require weak
conditions for causal interpretation. This approach allows for Wal-Mart’s choice to enter a particular
market to be endogenous. In the context of this paper, the estimates have a causal interpretation as long
as, conditional on entry, the exact timing is uncorrelated with other determinants of incumbents’
inventory policies. In support of this assumption, I find no pre-existing trends in the stockout rates of
incumbent stores before they experience Wal-Mart entry (see Table 6 and Figure 4 below).
Table 4 reports summary statistics for supermarkets’ characteristics in 1990, before Wal-Mart
began entering the grocery industry in earnest. Supermarkets averaged just over 20,000 square feet of
selling space, $170,000 in weekly sales, 50 employees, and 7 checkout counters. About one in two
supermarkets were part of a chain of 11 or more stores, and the average store shared ownership with 270
stores across 6 states. Stores that would and would not eventually face competition from Wal-Mart were
mostly similar across these dimensions, in stark contrast to what would become the footprint of a typical
Wal-Mart supercenter. According to data from Trade Dimensions, supercenters average 185,000 square
feet of which about a third are devoted to groceries, $880,000 in weekly grocery sales, 333 employees,
and 28 checkout counters. With more than 2,600 supercenters across 48 states by 2009, Wal-Mart has
become the first truly national grocery retailer.
5. Results
A. Estimates of the overall effect
Difference-in-difference comparisons provide a simple measure of how product availability
changes among incumbent supermarkets after Wal-Mart enters a grocery market. Table 5 reports average
stockout rates in 1988 and 1998, separately for markets that experienced Wal-Mart entry in that period
and markets that did not. There was no difference in stockout rates in 1988 between the two groups. But
ten years later, in 1998, stockout rates were approximately 1 percentage point, or 21 percent, lower in

13
markets that experienced Wal-Mart entry during the intervening period.11F
12 This difference-in-difference
comparison, reported in the last row of Table 5, is economically meaningful and statistically significant.
A similar pattern is evident from longitudinal regression analysis that controls for a large set of
store, market, and product characteristics. I use a fixed-effects framework to examine same-store changes
in product availability leading up to and following Wal-Mart entry. The estimates reveal whether
incumbent supermarkets alter their product availability, relative to stores in other markets, after Wal-Mart
entry increases competition in their market. Using monthly product-level data from January 1988 through
December 2004, I estimate a linear probability model of an item being out of stock:12F
13
isjttsjisjjtjtisjt XPreWMWalMartSTOCKOUT εψωφβαα ++++++= 11 (1)
where STOCKOUTisjt indicates whether product i in store s, market j, and month t is out of stock,
WalMartjt indicates the presence of a Wal-Mart supercenter, and PreWMjt indicates the two years before
Wal-Mart enters. WalMartjt reveals the impact of competition from Wal-Mart, and PreWMjt represents a
Granger-type test for a pre-existing trend.
Equation (1H1) also includes a number of control variables. The term isjX includes product, store,
and market characteristics. Controls for product characteristics include whether the item is seasonal (i.e.,
not offered for sale year-round) and fixed effects for both the day of the week the item was sampled and
the product category (e.g., eggs, cookies, frankfurters). Controls for store characteristics include whether
the store is affiliated with a chain, total grocery selling space (categorized into 5 groups), and the distance
from the warehouse that is the primary supplier of the outlet (categorized into 5 groups).13F
14 Controls for
local market characteristics include whether there is a competing store in the same census tract, the
average income of residents of the census tract (categorized into 3 groups), and the proportion of these
residents above the age of 65.14F
15 The term jφ represents county fixed effects, which account for any
fixed market characteristics that may have affected Wal-Mart’s entry decision, such as unobserved
consumer demographics. The term sω represents firm and/or store fixed effects, which account for any
number of other fixed firm and store characteristics, such as the specific chain affiliation, exact location,
12 The estimates in Table 6 also show that average stockout rates increased substantially between 1988 and 1998 in both types of markets. This may be explained by the secular increase in supermarkets product variety over this period. Product variety increased from an average of 26,000 SKUs per store in 1988 to 40,000 in 1998 (FMI 1989a, 1999a). Greater product variety increases the optimal stockout rate, because it makes stockouts more costly for firms to prevent and less costly for consumers to experience. 13 Given the size of the data set and the large number of fixed effects, maximum likelihood estimation of a probit or conditional logit model is computationally infeasible. 14 The total grocery selling space categories are: less than 10,000 square feet, 10,000 to 20,000, 20,000 to 30,000, 30,000 to 40,000, and 40,000 or more. The distance from warehouse categories are: less than 20 miles, 20 to 40, 40 to 75, 75 to 125, and 125 or more. 15 The average income categories are: less than $40,000 per year, $40,000 to $55,000, and $55,000 or more.

14
and store footprint. Finally, the term tψ represents year-month fixed effects, which account for seasonal,
technological, and other national trends in inventory management. The standard errors are adjusted to
account for within-market correlation in the error term.
Table 6 reports ordinary least squares estimates of equation (2H1). Only the coefficients for the
Wal-Mart indicators are reported; the estimates for the control variables are similar to the estimates
reported in Table 2. The results confirm that competition from Wal-Mart leads competing supermarkets
to offer greater product availability. Column (1) presents estimates from regressions that control for
market fixed effects. On average, incumbent stores’ stockout rates decrease by 30 basis points after Wal-
Mart enters a market (p < 0.10). Relative to the sample mean of 4.3 percent, this estimate corresponds to
a 7 percent decrease in stockouts. If there is classical measurement error in the stockout estimates
constructed from the CPI sample, then these coefficient estimates provide a lower bound for the
magnitude of the true impact of competition from Wal-Mart.
Competition from Wal-Mart supercenters has been linked to the bankruptcy of at least 25
supermarket chains (Callahan and Zimmerman 2003). It is possible that exiting firms also performed
relatively poorly before the shock. In this case, the correlation between competition from Wal-Mart and
stockouts could be due to a composition effect; average quality would increase after competition
intensifies, even if no incumbent firm actually improves its quality. To rule out this possibility, I repeat
the regression analysis and include firm fixed effects. The results, which are reported in Column (2), find
that stockout rates decrease by 40 basis points, or 9 percent of the mean, after Wal-Mart enters (p < 0.01).
Controlling for firm fixed effects decreases the point estimate, suggesting that exiting firms have lower
than average stockout rates. This is consistent with Wal-Mart posing a greater threat to large, chain
supermarkets than niche independents (see Section 4). Across the sample, chain supermarkets average 16
basis point lower stockout rates than independents, and stockout rates are also negatively associated with
store size (see Table 2).
Even some chains that were not pushed into bankruptcy likely closed some stores because of
Wal-Mart’s entry. If low quality stores with high stockout rates were more likely to close, then average
supermarket quality would again increase, even if continuing stores did not actually increase their product
availability. To assess the empirical relevance of this scenario, I re-estimate equation (1), this time also
including separate fixed effects for each of the more than 11,000 stores included in the sample. These
estimates, which are reported in Column (3), are based on same-store changes in the stockout rate after
Wal-Mart entry. Even after adding these additional controls, competition from Wal-Mart is associated
with a 34-basis-point, or 8 percent, decrease in the average stockout rate (p < 0.10). Relative to the same-
firm analysis reported in Column (2), controlling for store fixed effects increases the point estimate
slightly, suggesting that exiting stores did have slightly higher stockout rates than surviving stores at the
15
same chains. Nevertheless, the estimates show definitively that continuing stores did increase their
product availability after Wal-Mart enters.
The estimated increase in stockouts is economically meaningful. Applying the estimate from
Table 6, Column (3) to the average industry stockout rate of 8.2 percent (Andersen 1996; Roland Berger
2002), implies that a household purchasing 50 items per week will encounter one fewer stockout about
every three weeks. Based on the sample of firms that have at least 15,000 product availability
observations, the estimated increase in stockouts is equal to 0.4 standard deviations. This effect would
move a median firm to the 34th percentile of the stockout distribution.
An analysis of pre-existing trends shows no evidence that these firms or stores had unusually high
or low levels of product availability in the two years before Wal-Mart entry. In all of the specifications
reported in Table 6, the estimated pre-period coefficient is small and not statistically different from zero.
The lack of a pre-existing trend suggests that the increase in competition indeed caused the observed
increase in availability.
To buttress the interpretation that the competition-induced improvements in availability represent
an intentional shift in product market strategy toward increased quality, it is important to rule out the
possibility that they instead result unintentionally from the reduced store traffic associated with increased
competition. If a store fails to accurately forecast the reduction in its residual demand after Wal-
Mart enters, then it will run out of inventory less frequently, even if it did not intend to reduce stockouts.
It is impossible to distinguish these possibilities using only the basic difference-in-difference relations
reported above. To tease them apart, I undertake three additional analyses: (1) I examine the duration of
decrease in stockouts after Wal-Mart’s entry; (2) I examine changes in a different dimension of
supermarket quality – product variety; and (3) I examine whether stockouts of products whose inventories
are controlled by the manufacturer also decrease (presented in Section 5.2). All of these analyses suggest
that the improvements in product quality in fact represent an intentional strategic shift.
The impact of competition from Wal-Mart on supermarket product availability persists after
entry. Figure 4 depicts the timing of the effects. I graph estimated regression coefficients associated with
quarterly indicator variables for the eight quarters before and the eight quarters after Wal-Mart entry.
These estimates are from analyses that control for store fixed effects and the other controls included the
regression reported in Table 6, Column (3). On average, stockouts begin to decrease in the first quarter
after entry and then stay at the lower level.
The extended duration of the impact of competition from Wal-Mart on product availability
suggests that the improved in-stock rate reflects a strategic decision to increase inventory investment and
improve product quality, rather than resulting from forecasting errors caused by Wal-Mart’s entry. Using
daily data, Singh, Hansen, and Blattberg (2006) find that when Wal-Mart enters, store traffic and sales

16
drop immediately to the new equilibrium level. The decrease in store traffic implies that an optimizing
retailer can now reduce inventories to achieve the same level of product availability. Although the
magnitude of the change in store traffic is uncertain ex ante and may cause forecasting errors immediately
after Wal-Mart enters, it becomes clear within the first few weeks and months. Competition-related
errors in forecasting demand are therefore unlikely to persist past the first quarter, and almost certainly
not past the second quarter after entry. The estimates presented in Figure 4 do not fit this pattern. In
contrast, they show that the stockouts stay low for years after Wal-Mart enters. Increased competition
appears to lead firms to make consistent and lasting improvements in product quality.
A supermarket’s product availability is also affected by the variety of products it offers for sale.
On the supply side, stock keeping unit (SKU) proliferation contributes to inventory shortfalls by
increasing the size and complexity of the firm’s forecasting problem. And on the demand side, running
out of inventory may not be as costly for consumers when a store offers greater product variety. (In other
words, the more products a store carries, the more difficulty it will have keeping everything in stock; but
consumers won’t mind so much if the store carries an acceptable substitute for an out-of-stock item.) So,
if competition from Wal-Mart leads firms to reduce product variety, then the measured increases in
product availability may not actually represent an improvement in product quality. To the contrary,
however, competition from Wal-Mart seems to increase product variety.
Because I do not have direct measures of product variety, I construct a rough measure of changes
in product variety from the CPI Commodity and Services Survey. Just as I can observe when a surveyor
attempts to sample an item but encounters a stockout, I can observe when the sampled item is instead
discontinued by the outlet (that is, marked as permanently unavailable). Product cancellations are rare for
food items in the CPI sample, occurring in only 0.6 to 1.3 percent of attempted price quotes.15F
16 While this
measure of the product cancellation rate is far from perfect, I analyze it as a possible proxy for changes in
product variety.16F
17
Average changes in the product cancellation rate before and after highly leveraged transactions
are presented in Figure 5. I graph estimated regression coefficients associated with quarterly indicator
variables for the eight quarters before and after Wal-Mart entry. These estimates are from analyses that
control for store fixed effects and the other controls included in Figure 4. There is no evidence of an
16 The range on this estimate corresponds to details of how it is constructed. As explained in Appendix A, there is a possibility that the CPI data confuse out-of-stocks with product cancellations and vice versa. Considering all attempts to sample an item yields a product cancellation rate of 1.3 percent. As a conservative alternative, I only consider attempts for which the item was successfully sampled in the preceding month. This yields a lower estimate of 0.6 percent, and I use this algorithm to construct the variable in the analysis presented here. 17 The product cancellation rate is an asymmetric measure of product variety. It directly measures product cancellations, but it does not account for new product introductions. When I measure a decrease in product cancellation, it is possible that firms are also introducing fewer new products, thereby making fewer updates to their product mix while actually reducing product variety.

17
increase in product cancellations after entry. To the contrary, although there is no pre-existing trend,
product cancellations are less prevalent after competition from Wal-Mart increases.
Regression analyses of changes in product cancellations are reported in Table 7. These
specifications are similar to those reported in Table 6, but with the different dependent variable. The
estimates find that the product cancellation rate decreases by 8 to 13 basis points after Wal-Mart entry,
corresponding to 13 to 22 percent decreases, relative to the mean (p < 0.05). Competition from Wal-Mart
appears to spur improvements in quality for consumers through increased product variety in addition to
increased availability. The fact that product variety also improves when competition intensifies reinforces
the conclusion that the observed improvements in quality represent an intentional shift in product market
strategy.
B. Cross-sectional heterogeneity in the effect
Cross-sectional heterogeneity in these effects across products, stores, and local markets presents
further evidence that the observed changes in product quality are tied to the changes in retail competition.
Grocery products are typically distributed by manufacturers to retail stores through either warehouse or
direct store delivery (DSD). Major DSD product categories include carbonated drinks, bread, snacks,
cookies, and crackers; other products typically have warehouse distribution.
A primary difference between warehouse and DSD distribution is that the manufacturer’s
distributor typically plays the lead role in store-level category management, merchandising, and managing
the shelf inventory for DSD products. 17F
18 The degree of the retailers’ involvement in inventory
management depends on the replenishment arrangement in place with the distributor. Although the
retailer always checks-in and approves deliveries when they arrive, the retailer often does not initiate
orders. In some arrangements, the route driver doubles as a salesperson who monitors the shelf and
replenishes as needed; in others, an account manager for the distributor forecasts sales requirements and
works with the store manager to develop an order for the store. These arrangements give the distributor a
good deal of autonomy over replenishment. Because DSD distributors typically have incentives based on
total brand sales across stores, inventory levels for DSD products are more likely to reflect incentives
faced by the manufacturer rather than the retailer.
As discussed in Section 2, an increase in retail competition is unlikely to affect the optimal level
of product availability from the perspective of most manufacturers. In contrast to retailers,
manufacturers’ profits are very sensitive to customers substituting brands upon encountering an out-of-
18 There are also differences in the nature of products distributed through each channel. Compared to warehouse-supplied items, DSD products tend to have shorter shelf life, higher volume, higher promotional intensity (and demand variability), lower value density, and greater merchandising difficulty due to greater weight or fragility (Boston Consulting Group 1998).

18
stock item, but they are largely insensitive to the risk of customers switching stores, because
manufacturers earn roughly similar profits regardless of where their products are sold. (In fact, the
Robinson-Patman Act limits wholesale price discrimination.) Because manufacturers do not share stores’
incentive to offer greater product availability when retail competition increases, competition is unlikely to
affect inventories or the availability of DSD products.
I estimate the effect of competition from Wal-Mart separately for product categories that are
typically distributed through a warehouse versus direct store delivery. Panel estimates of equation (1)
with store fixed effects are reported in Table 8. While the average stockout rate for warehouse-supplied
categories decreases by 38 basis points after Wal-Mart entry (Column 3; p < 0.05), the prevalence of
stockouts does not increase for DSD categories (Column 2). The DSD point estimate is positive and not
statistically different than zero. Given the distributors’ active role in DSD replenishment, the differential
impact of competition on the availability of warehouse-supplied products provides a useful robustness test
that the increase in stockouts reflects retailers’ incentives to prevent store switching, rather than some
other unobserved, concomitant shock to demand or consumer preferences. These results thereby also
provide further evidence that the competition-induced improvements in availability represent an
intentional shift in product market strategy toward increased quality.
As discussed in Section 4, Wal-Mart’s entry into groceries was widely perceived as a greater
threat to supermarket chains than to niche independents. As a further test that supermarkets’ changes in
product quality after Wal-Mart entry are tied to the changes in retail competition, I examine whether the
associated reductions in stockouts are in fact concentrated among chain stores.
Estimates of the impact of competition from Wal-Mart on stockouts of warehouse-supplied
products in chain versus independent stores are also presented in Table 8. Stores are classified as chain or
independent based on the industry definition of 11 or more stores, and both regressions include store fixed
effects and the other controls included in equation (1). The results show a large impact on product
availability at chain stores. The stockout rate for warehouse-supplied products in chain stores decreases
by 57 basis points after Wal-Mart entry (Column 5; p < 0.01), whereas the estimated change among
independent stores is positive and not statistically different than zero (Column 4).
The largest chains display the strongest effects. Restricting this analysis to chains of 1,000 or
more stores, the stockout rate decreases by 102 basis points after Wal-Mart entry, with a standard error of
40 basis points (p < 0.05). This amounts to a decrease in stockouts of 22 percent, relative to the mean rate
of 4.6 percent for these stores. This dramatic increase in quality contrasts with these firms’ muted price
response to Wal-Mart entry. Basker and Noel (forthcoming) find that price cuts are less than half as large
among large chains as among other stores. Combined, these stockout and price results support case
studies finding that supermarket chains attempt to differentiate themselves from Wal-Mart by improving

19
quality levels and offering wider selection, rather than competing purely on price (Carré, Tilly, and
Holgate 2009).
A final test also suggests that supermarkets’ changes in product quality after Wal-Mart entry
result from the changes in retail competition. Because Wal-Mart caters to low income consumers,
supermarkets located in lower income areas within a given supercenter’s catchment area are likely to be
most affected when a supercenter opens. I classify supermarkets based on the median income of the
census tract in which they are located (the average Wal-Mart catchment area contains 16 census tracts),
and compare the quality reactions of firms in the top and bottom quartiles for median income. Building
on the previous results, I also restrict the sample to warehouse-supplied products in chain stores.
Estimates of the impact of competition from Wal-Mart on stores in high and low income areas are
also presented in Table 8. The results show the greatest impact among stores located in low income areas.
The stockout rate decreases by 107 basis points in low income areas after Wal-Mart entry (Column 7; p <
0.01). This amounts to a 24 percent reduction in stockouts, relative to the mean rate of 4.5 percent for
these stores. In contrast, the stockout rate decreases by only 14 basis points in high income area after
Wal-Mart entry (Column 6). This point estimate, which is not statistically significant, corresponds to
only a 3 percent reduction relative to the mean.
The decrease in stockouts rates among stores in low income areas is dramatic. Applying the
estimate from Column (7) to the average industry stockout rate of 8.2 percent (Andersen 1996; Roland
Berger 2002), implies that the average household, which purchases about 50 items per week (FMI 1999a,
2000b), will average one fewer stockout a week – a significant improvement in quality. Based on the
sample of firms that have at least 15,000 product availability observations, the decrease in stockouts is
equal to 1.3 standard deviations. This effect would move a median firm to the 8th percentile of the
stockout distribution.
In sum, these estimates reveal that the reduction in stockouts associated with competition from
Wal-Mart is greatest for warehouse-supplied products, for chain stores, and in low-income areas. These
patterns all point to competitive pressure encouraging improvements in product quality.
6. Conclusions
Product quality is an important element of competition in a wide range of markets, including the
supermarket industry. Although firms with differentiated products compete on many dimensions,
relatively little empirical research focuses on competition’s impact on nonprice variables. In theory,
competition can either increase or decrease quality, depending on how it affects the sensitivity of demand
to changes in quality (for example, see Spence 1975). If price competition leads to a quality race to the
bottom, then the welfare gains from competition may actually be much lower than if quality were
20
unaffected (Chamberlain 1953). Identifying the relationship between competition and quality is thus an
important empirical question.
This study specifically examines the connection between competition and a supermarket’s
provision of retail product availability – a key strategic variable in the retail sector. I find that
competition improves this dimension of quality for consumers. Stores facing competition in their census
tract have 5 percent lower stockout rates than other stores. Moreover, stockout rates among incumbent
supermarkets decrease by 8 percent, on average, when a Wal-Mart supercenter opens nearby. The effect
is long-lived, restricted to products whose inventory is controlled by the retailer, and joined by a
concomitant increase in product variety, all indicating that the additional stockouts are not attributable to
decreases in store traffic or demand miscalculations following Wal-Mart’s entry. Instead, the
improvements in availability seem to represent an intentional shift in product market strategy toward
increased quality. The effect is larger for chain stores and in low income areas, where competition from
Wal-Mart is particularly intense. In these stores, stockout rates decrease by a striking 24 percent. This
estimate is actually a lower bound for the magnitude of the true effect, because the analyzed stockout
rates, which I estimate from CPI microdata, are likely measured with error.
There is intense public debate about the effects of Wal-Mart on local communities. Hundreds of
grassroots organizations across the country fight to keep Wal-Mart supercenters and other big box
retailers out of their communities, and local governments across the country have adopted limits on store
size or other regulations meant to deter Wal-Mart’s entry (Beaumont and Tucker 2002). But the estimates
reported in this paper suggest that benefits of Wal-Mart for consumers extend beyond its low prices. Not
only does the competitive pressure Wal-Mart creates lower prices at competing stores (Hausman and
Leibtag 2007; Basker and Noel, forthcoming), it also improves their product availability. In fact, by this
measure, supermarket quality improves the most in the poorest local markets, where consumers are
arguably the most in need. This analysis of course does not speak to Wal-Mart’s other effects on
communities, including any effects on jobs, traffic, crime, or social capital.
The intuition that firms with market power can maximize their profits by reducing the quality of
their products is often cited but rarely tested empirically. Competition policy also tends to focus
relatively little attention on quality competition. Based on product availability in the supermarket
industry, the analyses presented in this paper suggest that pressure from competition can have substantial
effects on product quality in real markets. I find that supermarkets that are most at risk of losing sales to
Wal-Mart display a 1.3 standard deviation improvement in product availability when Wal-Mart enters
nearby. This effect would move a median firm to the 8th percentile of the stockout distribution – a
significant improvement for consumers. And to the extent that the impact on stockouts is representative
of firms’ investments in other dimensions of quality, the benefits of competition for consumers may be

21
much greater. Examining the impact of competition on other dimensions of product quality would be an
interesting area for further empirical research.
References
Abbott, Lawrence. 1955. Quality and Competition; an Essay in Economic Theory. New York: Columbia University Press.
Andersen Consulting. 1996. Where to Look for Incremental Sales Gains: The Retail Problem of out-of-Stock Merchandise. Coca-Cola Retailing Research Council.
Anderson, Eric T., Gavan J. Fitzsimons, and Duncan Simester. 2006. “Measuring and Mitigating the Costs of Stockouts.” Management Science, 52(11): 1751-63.
Anupindi, Ravi, Maqbool Dada, and Sachin Gupta. 1998. “Estimation of Consumer Demand with Stock-out Based Substitution: An Application to Vending Machine Products.” Marketing Science, 17(4): 406-23.
Basker, Emek. 2005. “Job Creation or Destruction? Labor Market Effects of Wal-Mart Expansion.” Review of Economics and Statistics, 87(1): 174-83.
____. 2007. “The Causes and Consequences of Wal-Mart's Growth.” Journal of Economic Perspectives, 21(3): 177-98.
____. Forthcoming. “Does Wal-Mart Sell Inferior Goods?” Economic Inquiry.
____, and Michael Noel. Forthcoming. “The Evolving Food Chain: Competitive Effects of Wal-Marts Entry into the Supermarket Industry.” Journal of Economics and Management Strategy
Beaumont, Constance, and Leslie Tucker. 2002. “Big-Box Sprawl (and How to Control It).” Municipal Lawyer, 43(2): 6-9, 30-31.
Bils, Mark. 2005. “Studying Price Markups from Stockout Behavior.”
Boston Consulting Group. 1998. “The Power of DSD: Delivering Growth in Sales, Profits, and Productivity,” Progressive Grocer. Special Report.
Brooks, B.L. 1972. “Inventory Management and Control.” University of Illinois Extension Circular, 1063.
Callahan, Patricia, and Ann Zimmerman. 2003. “Price War in Aisle 3 – Wal-Mart Tops Grocery List with Supercenter Format; but Fewer Choices, Amenities,” Wall Street Journal, May 27.
Carré, Françoise, Chris Tilly, and Brandynn Holgate. 2009. “Competitive Strategies in the Us Retail Industry: Consequences for Jobs in Food and Consumer Electronics Stores,” Industry Studies Association Annual Conference. Chicago, Ill.
Chamberlin, Edward H. 1933. The Theory of Monopolistic Competition. Cambridge Mass: Harvard
22
Univ. Press.
Dana, James, and Nicholas Petruzzi. 2001. “The Newsvendor Model with Endogenous Demand.” Management Science, 47(11): 1488-97.
Dana, James D. 2001. “Competition in Price and Availability When Availability Is Unobservable.” RAND Journal of Economics, 32(3): 497-513.
Domberger, Simon, and Avrom Sherr. 1989. “The Impact of Competition on Pricing and Quality of Legal Services.” International Review of Law and Economics, 9(1): 41-56 Language English Available From Publisher's URL.
Dorgan, Tim. 1997. “The Awful Truth,” Progressive Grocer. 75.
Draganska, Michaela, Michael J. Mazzeo, and Katja Seim. 2009. “Addressing Endogenous Product Choice in an Empirical Analysis of Merger Effects,” Northwestern University.
Ellickson, Paul B. 2006. “Quality Competition in Retailing: A Structural Analysis,” International Journal of Industrial Organization, 24(3): 521-40.
Emmelhainz, Margaret, James R. Stock, and Larry W. Emmelhainz. 1991. “Consumer Responses to Retail Stock-Outs.” Journal of Retailing, 67(2): 138-47.
Fitzsimons, Gavan J. 2000. “Consumer Response to Stockouts.” Journal of Consumer Research, 27(2): 249-66.
Food Marketing Institute (FMI). Various years (a). The Food Marketing Industry Speaks. Washington D C: Food Marketing Institute.
____. Various years (b). Trends in the United States: Consumer Attitudes and the Supermarket. Washington, DC: Food Marketing Institute.
Gaur, Vishal, and Young-Hoon Park. 2007. “Asymmetric Consumer Learning and Inventory Competition.” Management Science, 53(2): 227-40.
Gruen, Thomas W., Daniel S. Corsten, and Sundar Bharadwaj. 2002. Retail out-of-Stocks: A Worldwide Examination of Extent, Causes, and Consumer Responses. Washington, DC: Grocery Manufacturers of America.
Hall, Joseph, and Evan Porteus. 2000. “Customer Service Competition in Capacitated Systems.” Manufacturing & Service Operations Management, 2(2): 144-65.
Hausman, Jerry, and Ephraim Leibtag. 2007. “Consumer Benefits from Increased Competition in Shopping Outlets: Measuring the Effect of Wal-Mart,” Journal of Applied Econometrics, 22(7): 1157-77.
Holmes, Thomas J. 2001. “Bar Codes Lead to Frequent Deliveries and Superstores.” RAND Journal of Economics, 32(4): 708-25.
____. 2008. “The Diffusion of Wal-Mart and Economies of Density,” NBER Working Paper 13783.
Jia, Panle. 2008. “What Happens When Wal-Mart Comes to Town: An Empirical Analysis of the Discount Retailing Industry.” Econometrica, 76(6): 1263-316.

23
Matsa, David A. 2009. “Financial Leverage and Product Quality: Evidence from the Supermarket Industry,” Northwestern University.
Mazzeo, Michael J. 2003. “Competition and Service Quality in the U S Airline Industry.” Review of Industrial Organization, 22(4): 275-96.
National Grocers Association. 2003. “NGA Marketing Survey.”
Peckham, James O. 1963. “The Consumer Speaks.” Journal of Marketing, 27(4): 21-6.
Pew Research Center for the People and the Press. 2005. “Wal-Mart: A Good Place to Shop but Some Critics Too,” Pew Research Center for the People and the Press.
Progressive Grocer. 1968. “The Out of Stock Study: Part I,” S1-S16.
Roland Berger Strategy Consultants. 2002. Full-Shelf Satisfaction--Reducing out-of-Stocks in the Grocery Channel: An in-Depth Look at DSD Categories. Washington, DC: Grocery Manufacturers of America.
Schmalensee, Richard. 1979. “Market Structure, Durability, and Quality: A Selective Survey.” Economic Inquiry, 17(2): 177-96.
Singh, Vishal P., Karsten T. Hansen, and Robert C. Blattberg. 2006. “Market Entry and Consumer Behavior: An Investigation of a Wal-Mart Supercenter.” Marketing Science, 25(5): 457-76.
Spence, A. Michael. 1975. “Monopoly, Quality, and Regulation.” Bell Journal of Economics, 6(2): 417-29.
Straughn, Katherine. 1991. “The Relationship between Stockouts and Brand Share,” Tallahassee, FL: Florida State University.
Warner, Melanie. 2006. “When Wal-Mart Shops for Groceries, It Gets Whatever It Wants,” New York Times, March 3.
24
A1. Data appendix
A. Retail stockouts
The data on retail stockouts are from the CPI Commodity and Services Survey, which is used by
the U.S. Bureau of Labor Statistics (BLS) to compute the consumer price index (CPI). To calculate the
CPI, the BLS sends surveyors to record the prices of about 30,000 items sold at grocery stores each
month, where each price is specific to a particular product at a particular establishment. Generally, a
product must be available for purchase at the time the surveyor visits the establishment in order to be
included in the CPI. If the product is unavailable for sale, the surveyor determines whether the
establishment expects to carry the item in the future. In this sense, a product may be considered out of
stock if it is not available for sale, it is continuing to be carried by the outlet, and it is not seasonally
unavailable (Bils 2005).
In practice, the determination of a stockout is slightly more subtle. First, I condition on the outlet
being available for pricing by the BLS surveyor. Second, I consider items with different day prices as
being out of stock at the time of the surveyor’s visit. Third, I restrict attention to observations that are at
least three months prior to a product becoming permanently or seasonally unavailable. This is an attempt
to address a concern that an item reported as temporarily unavailable that becomes permanently
unavailable before another price quote is successfully obtained may not actually represent a stockout (Bils
2005).18F
19
For food items (excluding food consumed away from home), surveyors are instructed to record an
item as available if the retailer respondent says an out-of-stock item will be restocked later that day. This
complicates efforts to measure true product availability. Out-of-stocks caused by retailers failing to stock
shelves with back room or display inventory will not be reflected in the BLS data. Industry studies
attribute 8 to 22 percent of out-of-stocks to these sorts of store shelving issues (Andersen 1996; Gruen et
al. 2002).
In some situations it is also possible that a BLS surveyor may record an out-of-stock item as
available if another similar item is available for purchase. However, the procedures for this sort of
substitution are regulated carefully by the BLS. Key characteristics of the product must be the same for 19 The concern is that the BLS surveyor may initially misinterpret some product cancellations as temporary out-of-stocks. A concern in the opposite direction is that some products that are repeatedly unavailable because they are out of stock may become classified as permanently unavailable. If a product is repeatedly unavailable, it may trigger an instruction to the surveyor to begin pricing a new item at the next visit. However, analysis conducted by Teague Ruder and cited by Bils (2005) suggests that in practice the field agents often continue to price the old version when the product becomes available for purchase before a substitution is executed. Accepting the surveyors’ original classification of product unavailability yields an estimated out-of-stock rate of 5.3 percent. Another option is to only count an item as temporarily out-of-stock if it is observed to be available at a later date. Under this definition, I eliminate the final observation for each product, because out-of-stock rates for those observations are zero by construction. This methodology results in an overall out-of-stock rate of 4.3 percent. The paper uses this more conservative algorithm for computing an out-of-stock.

25
the surveyor to execute a substitution. For example, a substitute ready-to-eat cereal product must have the
same brand, product name, size, sweeteners, fruit, nuts, flavorings, and more, but it does not have to have
the same UPC code. To the extent that the BLS definition of a stockout more closely reflects a
consumer’s willingness to substitute across nearly identical items (e.g., changes in package design), it
may be preferred to a simple SKU-based definition.
B. Store and market characteristics
Store-level data on ownership, sales volume, selling area, and the primarily warehouse supplier of
each U.S. supermarket is from the Trade Dimensions Retail Site Database. The Retail Site Database is a
leading source of establishment data in the retail food industry. I use cross-sections of the Retail Site
Database from 1990, 1995, 2000, and 2004, merging the monthly CPI data with the nearest available
information from the Retail Site Database. I merge the data sets using the store telephone number, ZIP
code, street address, and/or name. I am able to successfully match Retail Site Database information to
89.2 percent of the observations of product availability.
Market demographic information on each store’s census tract is from the 2000 U.S. Census of
Population and Housing. Census tracts typically have between 2,500 and 8,000 residents and are
designed to be homogeneous with respect to population characteristics, economic status, and living
conditions (U.S. Census Bureau, Geographic Areas Reference Manual, April 19, 2000). Summary
statistics for the store and market characteristics analyzed are reported in Table 1.
C. Supermarket quality ratings
Supermarket quality ratings are from the September 1993, August 1997, September 2000,
September 2003, and October 2006 issues of Consumer Reports magazine. Each chain for which ratings
are reported is evaluated by at least 200 readers, and some chains are evaluated by more than 1,500
readers. CPI data from January 1990 through December 2004 are matched temporally with the ratings
whose survey was conducted closest to the observation on product availability. Reflecting the design of
the Consumer Reports survey, CPI data are included only for stores in each supermarket chain that bear
the corporate name.

Figure 1: Stockout Rate by Day of the Week
3 3.2 3.4 3.6 3.8 4 4.2 4.4 4.6 4.8 5
Sunday
Monday
Tuesday
Wednesday
Thursday
Friday
Saturday
Stockout rate (percent)
26
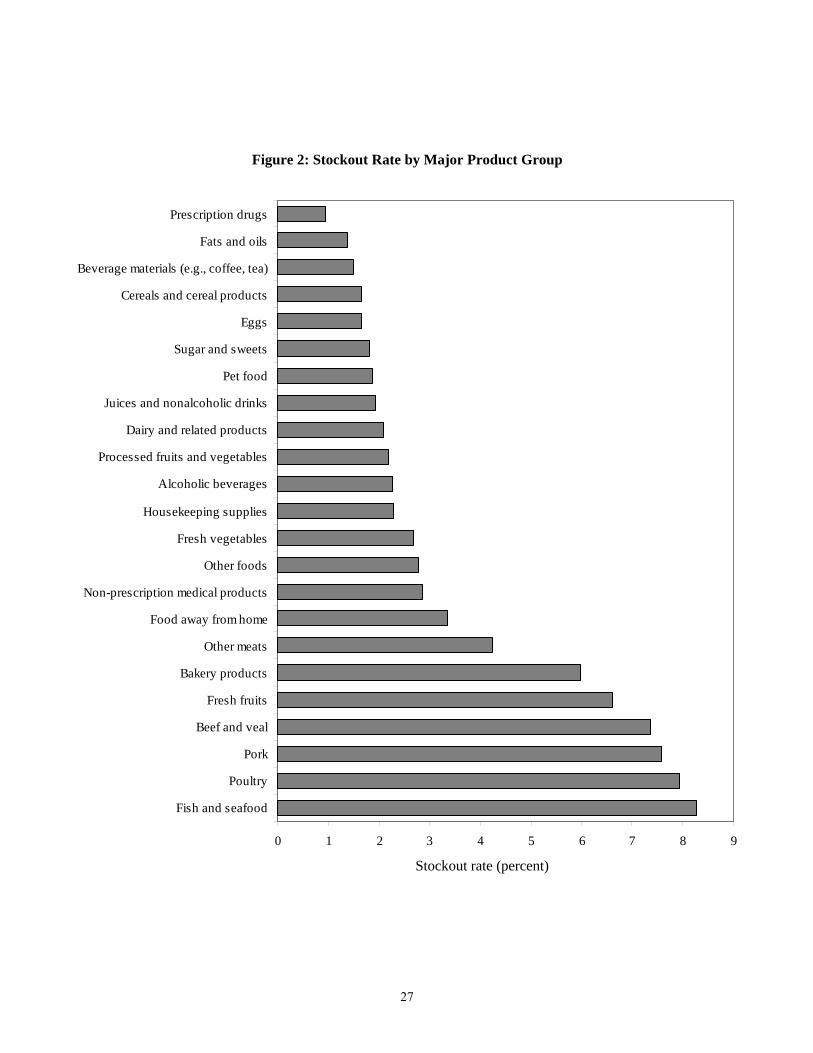
0 1 2 3 4 5 6 7 8 9
Prescription drugs
Fats and oils
Beverage materials (e.g., coffee, tea)
Cereals and cereal products
Eggs
Sugar and sweets
Pet food
Juices and nonalcoholic drinks
Dairy and related products
Processed fruits and vegetables
Alcoholic beverages
Housekeeping supplies
Fresh vegetables
Other foods
Non-prescription medical products
Food away from home
Other meats
Bakery products
Fresh fruits
Beef and veal
Pork
Poultry
Fish and seafood
Figure 2: Stockout Rate by Major Product Group
Stockout rate (percent)
27
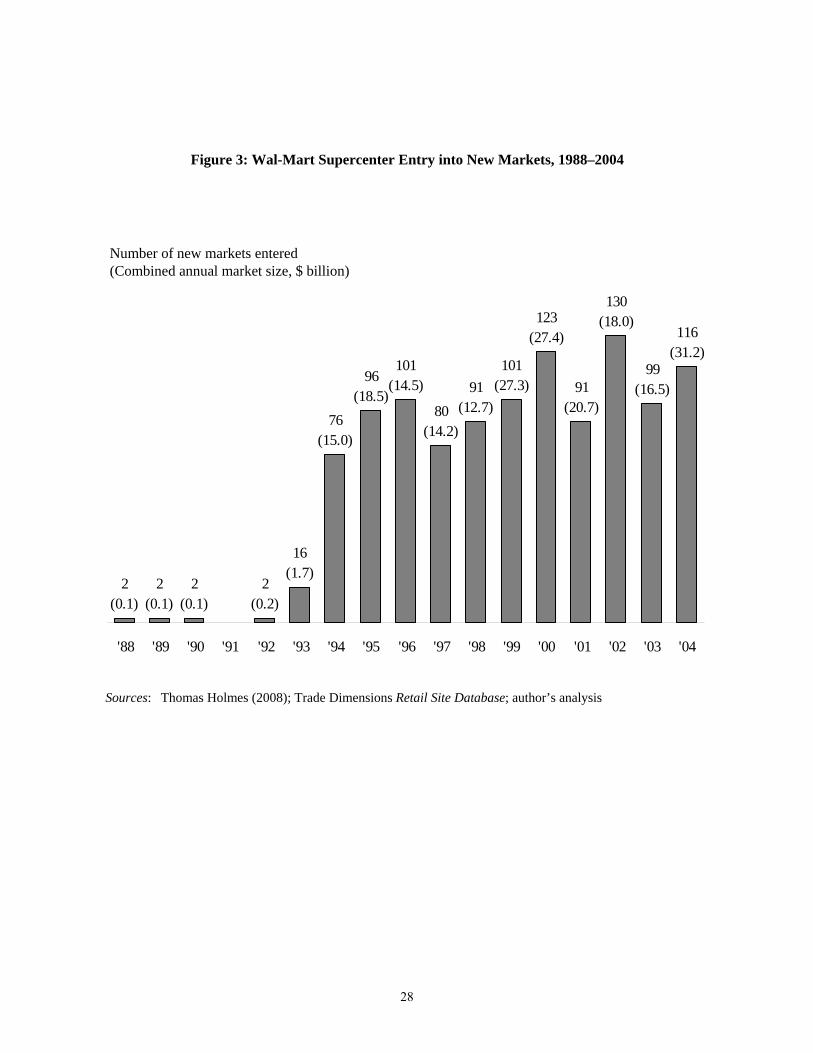
Number of new markets entered(Combined annual market size, $ billion)
Figure 3: Wal-Mart Supercenter Entry into New Markets, 1988–2004
Thomas Holmes (2008); Trade Dimensions Retail Site Database; author’s analysisSources:
116(31.2)
99(16.5)
130(18.0)
91(20.7)
123(27.4)
101(27.3)91
(12.7)80(14.2)
101(14.5)96
(18.5)76
(15.0)
16(1.7)
2(0.2)
2(0.1)
2(0.1)
2(0.1)
'88 '89 '90 '91 '92 '93 '94 '95 '96 '97 '98 '99 '00 '01 '02 '03 '04
28

-1.4
-1.2
-1.0
-0.8
-0.6
-0.4
-0.2
0.0
0.2
0.4
0.6
0.8
-8 -7 -6 -5 -4 -3 -2 -1 0 1 2 3 4 5 6 7 8
Figure 4: Changes in Stockout Rates After Wal-Mart Entry
This figure depicts regression coefficients and 95 percent confidence intervals from a regression examining the probability of an item being out of stock. An indicator for whether the item is out of stock (multiplied by 100) is regressed on separate indicators for each of the eight quarters before and after Wal-Mart enters a store’s county, store fixed effects, and a set of additional controls. The reported coefficients should be interpreted as the percentage point change in the stockout rate associated with each indicator variable. In addition to store fixed effects, the controls include the product, store, and time characteristics included in the regressions reported in Table 6, Column 3. The mean stockout rate in this sample is 4.3 percent.
Note:
Quarter
29

-0.4
-0.3
-0.2
-0.1
0.0
0.1
0.2
0.3
-8 -7 -6 -5 -4 -3 -2 -1 0 1 2 3 4 5 6 7 8
Figure 5: Changes in Product Cancellation Rates After Wal-Mart Entry
This figure depicts regression coefficients and 95 percent confidence intervals from a regression examining the probability of an item being discontinued by a retail outlet. An indicator for whether the item is discontinued (multiplied by 100) is regressed on separate indicators for each of the eight quarters before and after Wal-Mart enters a store’s county, store fixed effects, and a set of additional controls. The reported coefficients should be interpreted as the percentage point change in the product cancellation rate associated with each indicator variable. In addition to store fixed effects, the controls include the product, store, and time characteristics included in the regressions reported in Table 7, Column 3. The mean product cancellation rate in this sample is 0.6 percent.
Note:
Quarter
30

Mean
Outcome measure:Out of stock 4.3 %
Market characteristics:Competition in census tract 38.6Average income of local residents ($ thousands):
55 or more 23.340 through 54 28.2Less than 40 48.5
Percent of local residents aged 65+ 14.0
Store characteristics:Grocery selling space (1,000 sq. ft.):
40 or more 32.730 through 39 23.920 through 29 23.110 through 19 12.6Less than 10 7.7
Affiliated with a chain (11 or more stores) 81.1Distance from primary supplier (miles):
125 or more 15.075 through 124 15.740 through 74 19.320 through 39 19.4Less than 20 30.6
Integrated with primary supplier 61.1
Product characteristic:Seasonal item (not offered for sale year-round) 4.0
Observations 4,751,180
Table 1Summary Statistics
Note: This table reports summary statistics for the main analytic sample. Forindicator variables, the mean equals the percent of observations with thecorresponding characteristic.
31
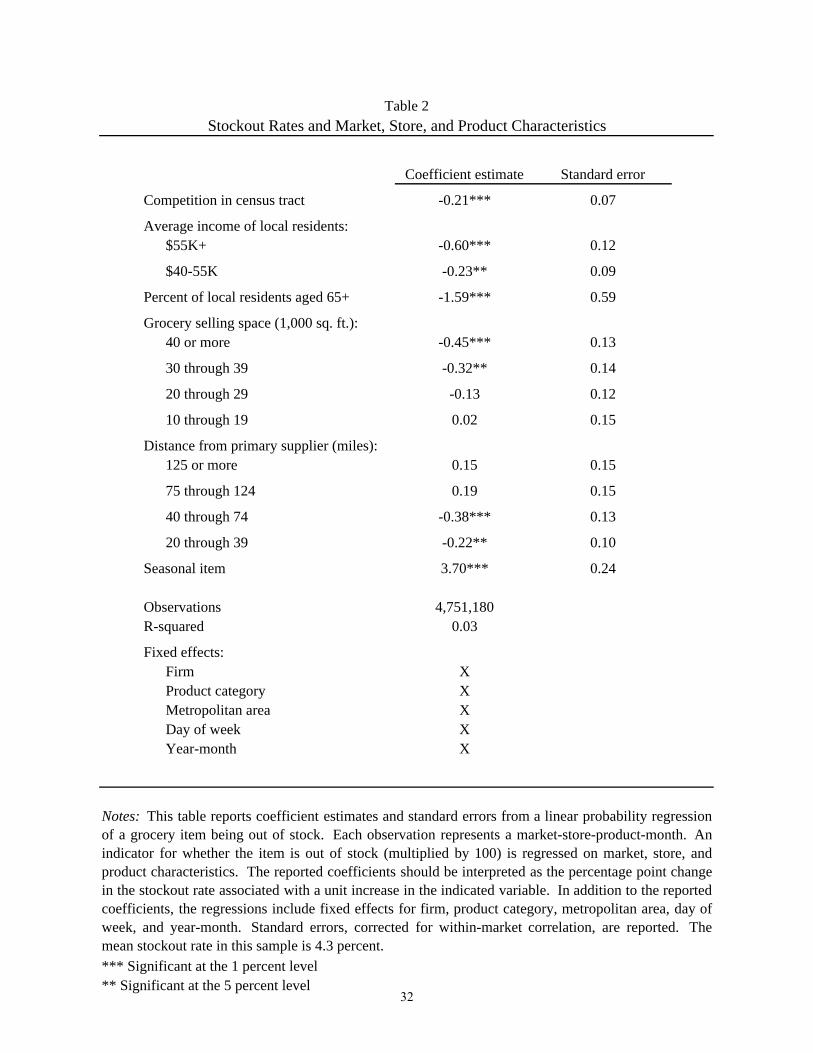
Coefficient estimate Standard error
Competition in census tract -0.21*** 0.07
Average income of local residents:$55K+ -0.60*** 0.12
$40-55K -0.23** 0.09
Percent of local residents aged 65+ -1.59*** 0.59
Grocery selling space (1,000 sq. ft.):40 or more -0.45*** 0.13
30 through 39 -0.32** 0.14
20 through 29 -0.13 0.12
10 through 19 0.02 0.15
Distance from primary supplier (miles):125 or more 0.15 0.15
75 through 124 0.19 0.15
40 through 74 -0.38*** 0.13
20 through 39 -0.22** 0.10
Seasonal item 3.70*** 0.24
Observations 4,751,180R-squared 0.03
Fixed effects:Firm XProduct category XMetropolitan area XDay of week XYear-month X
*** Significant at the 1 percent level** Significant at the 5 percent level
Stockout Rates and Market, Store, and Product CharacteristicsTable 2
Notes: This table reports coefficient estimates and standard errors from a linear probability regressionof a grocery item being out of stock. Each observation represents a market-store-product-month. Anindicator for whether the item is out of stock (multiplied by 100) is regressed on market, store, andproduct characteristics. The reported coefficients should be interpreted as the percentage point changein the stockout rate associated with a unit increase in the indicated variable. In addition to the reportedcoefficients, the regressions include fixed effects for firm, product category, metropolitan area, day ofweek, and year-month. Standard errors, corrected for within-market correlation, are reported. Themean stockout rate in this sample is 4.3 percent.
32
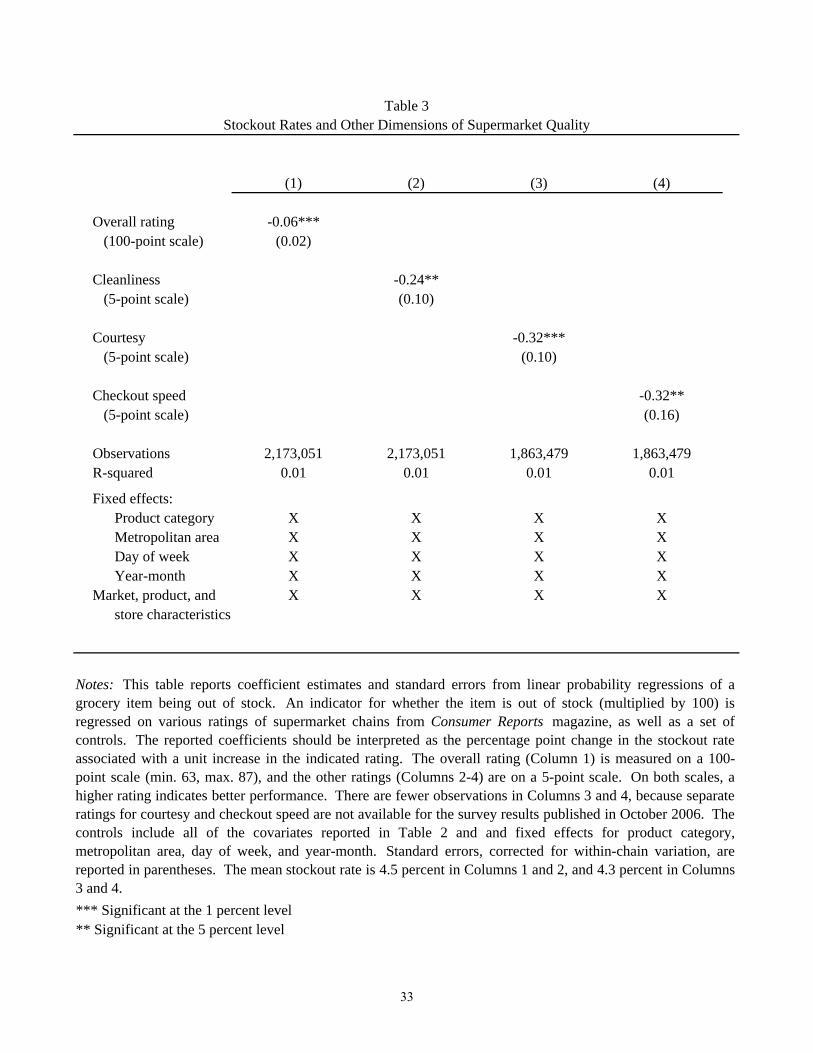
(1) (2) (3) (4)
Overall rating -0.06*** (100-point scale) (0.02)
Cleanliness -0.24** (5-point scale) (0.10)
Courtesy -0.32*** (5-point scale) (0.10)
Checkout speed -0.32** (5-point scale) (0.16)
Observations 2,173,051 2,173,051 1,863,479 1,863,479R-squared 0.01 0.01 0.01 0.01
Fixed effects:Product category X X X XMetropolitan area X X X XDay of week X X X XYear-month X X X X
Market, product, and X X X Xstore characteristics
*** Significant at the 1 percent level** Significant at the 5 percent level
Table 3Stockout Rates and Other Dimensions of Supermarket Quality
Notes: This table reports coefficient estimates and standard errors from linear probability regressions of agrocery item being out of stock. An indicator for whether the item is out of stock (multiplied by 100) isregressed on various ratings of supermarket chains from Consumer Reports magazine, as well as a set ofcontrols. The reported coefficients should be interpreted as the percentage point change in the stockout rateassociated with a unit increase in the indicated rating. The overall rating (Column 1) is measured on a 100-point scale (min. 63, max. 87), and the other ratings (Columns 2-4) are on a 5-point scale. On both scales, ahigher rating indicates better performance. There are fewer observations in Columns 3 and 4, because separateratings for courtesy and checkout speed are not available for the survey results published in October 2006. Thecontrols include all of the covariates reported in Table 2 and and fixed effects for product category,metropolitan area, day of week, and year-month. Standard errors, corrected for within-chain variation, arereported in parentheses. The mean stockout rate is 4.5 percent in Columns 1 and 2, and 4.3 percent in Columns3 and 4.
33

Full sampleEventually face Wal-Mart entry
Do not face Wal-Mart entry
A. Store characteristics: Grocery selling space (1,000 sq ft) 22.6 24.2 20.2 62.6
(14.4) (14.8) (13.4) (10.5)
Weekly grocery volume ($1,000) 171.0 175.8 164.1 880.4(143.8) (142.6) (145.3) (286.7)
Employment (FTEs) 49.9 51.1 48.1 332.8(45.0) (45.2) (44.7) (94.8)
Checkout counters 7.40 7.56 7.16 27.85(3.98) (3.90) (4.07) (6.02)
Percent affiliated with chain 56.5 59.4 52.3 100 (11 or more stores) (49.6) (49.1) (49.9)
B. Firm characteristics: Stores in chain 269.8 285.2 247.3 1,675
(438.5) (449.2) (421.5)
States with at least one store 6.16 6.08 6.27 46(8.66) (8.30) (9.16)
Observations 32,065 19,053 13,012 1,675
Notes: This table reports the means and standard deviations (in parentheses) of various store and firmcharacteristics in 1990 (the first year for which the data are available) for incumbent stores in markets thateventually experience entry from a Wal-Mart supercenter. For comparison, the characteristics are also reported(i) for stores in markets that do not experience Wal-Mart entry and (ii) for Wal-Mart supercenters that opennedby 2004 (the last year for which the data are available). The data on firm and store characteristics are fromTrade Dimensions, and the information on Wal-Mart entry are from Thomas Holmes (2008).
Firm and Store Characteristics for Wal-Mart and Incumbent StoresTable 4
Grocery stores, 1990 Wal-Mart supercenters,
2004
34

1988 1998
Experience entry between1988 and 1998?
Yes 3.03 4.00(0.16) (0.21)[65] [63]
No 3.14 5.05(0.10) (0.14)[255] [283]
Difference -0.11 -1.05***(0.21) (0.31)
Difference-in-difference -0.94**(0.39)
*** Significant at the 1 percent level** Significant at the 5 percent level
Table 5Difference-in-Difference Estimate
Notes: This table reports mean stockout rates (in percentage points) and theassociated standard errors (in parentheses) at two points in time for two samples: (1)markets that experienced Wal-Mart entry between 1988 and 1998; and (2) firms thatdid not. The number of markets underlying each calculation is reported in brackets,and the reported mean stockout rates are weighted by the number of productavailability observations. The third line reports the difference in mean stockout ratesbetween these two samples in each year, and the final line reports the simpledifference-in-difference estimate.
35

(1) (2) (3)
After entry -0.30* -0.40*** -0.34*(0.17) (0.17) (0.18)
2 years before entry -0.07 -0.05 -0.03(0.13) (0.13) (0.13)
Observations 4,751,180 4,751,180 4,751,180R-squared 0.03 0.04 0.05
Fixed effects:County X X XFirm X XStore XProduct category X X XDay of week X X XYear-month X X X
Market, product, and X X Xstore characteristics
*** Significant at the 1 percent level* Significant at the 10 percent level
Table 6Changes in Stockout Rates Following Wal-Mart Entry
Notes: This table reports coefficient estimates and standard errors from regressions examining theprobability of an item being out of stock. Each observation represents a market-store-product-month.An indicator for whether the item is out of stock (multiplied by 100) is regressed on separate indicatorsfor (1) whether Wal-Mart operates a supercenter in the county and (2) the 2 years before Wal-Martentry, as well as a set of controls. The reported coefficients should be interpreted as the percentagepoint change in the stockout rate associated with each indicator variable. The controls include county,product category, day of week, and year-month fixed effects as well as indicators for whether the storefaces competition in its census tract, the income of local residents, store size, distance from primarysupplier, and whether the item is seasonal. The controls also include firm and store fixed effects whereindicated. Standard errors, corrected for within-market correlation, are reported in parentheses. Themean stockout rate in this sample is 4.3 percent.
36

(1) (2) (3)
After entry -0.13*** -0.12*** -0.08**(0.03) (0.03) (0.04)
2 years before entry -0.04 -0.03 0.01(0.03) (0.03) (0.03)
Observations 4,447,253 4,447,253 4,447,253R-squared 0.004 0.004 0.009
Fixed effects:County X X XFirm X XStore XProduct category X X XDay of week X X XYear-month X X X
Market, product, and X X Xstore characteristics
*** Significant at the 1 percent level** Significant at the 5 percent level
Table 7Changes in Product Cancellation Rates Following Wal-Mart Entry
Notes: This table reports coefficient estimates and standard errors from regressions examining theprobability of an item being discontinued by a retail outlet. Each observation represents a market-store-product-month. An indicator for whether the item is discontinued (multiplied by 100) is regressed onseparate indicators for (1) whether Wal-Mart operates a supercenter in the county and (2) the 2 yearsbefore Wal-Mart entry, as well as a set of controls. The reported coefficients should be interpreted asthe percentage point change in the product cancellation rate associated with each indicator variable.The controls include county, product category, day of week, and year-month fixed effects as well asindicators for whether the store faces competition in its census tract, the income of local residents, storesize, distance from primary supplier, and whether the item is seasonal. The controls also include firmand store fixed effects where indicated. Standard errors, corrected for within-market correlation, arereported in parentheses. The mean product cancellation rate in this sample is 0.6 percent.
37
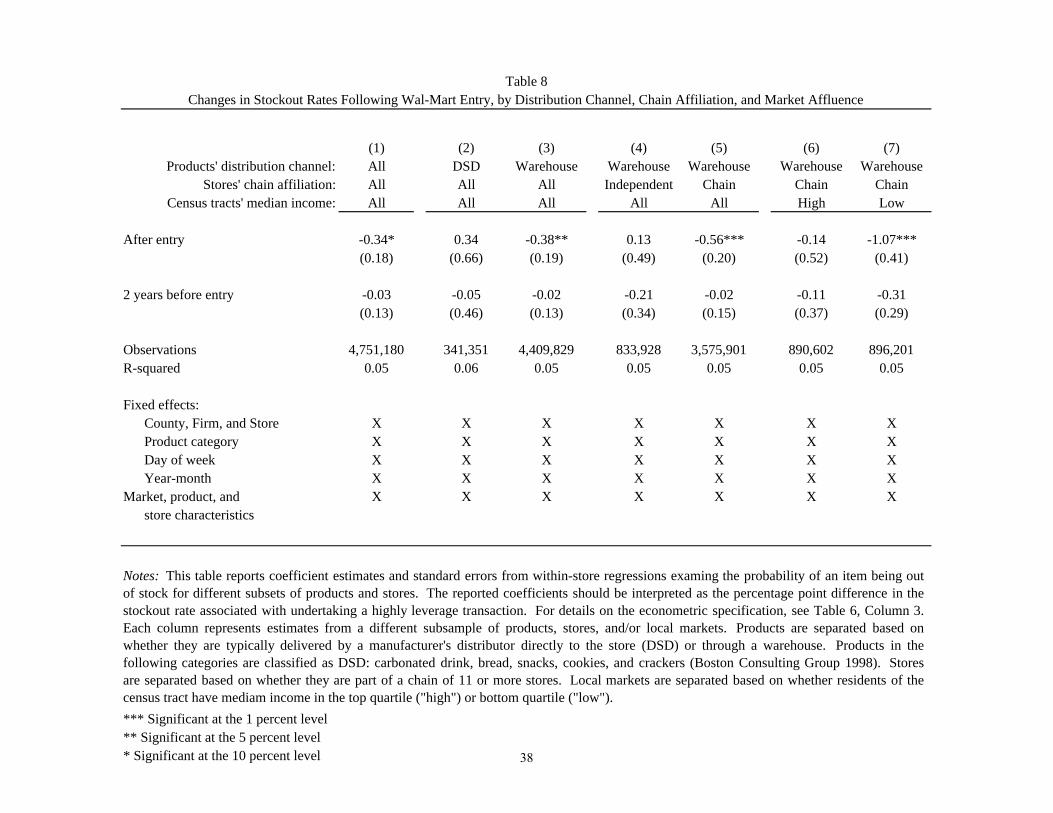
(1) (2) (3) (4) (5) (6) (7)Products' distribution channel: All DSD Warehouse Warehouse Warehouse Warehouse Warehouse
Stores' chain affiliation: All All All Independent Chain Chain ChainCensus tracts' median income: All All All All All High Low
After entry -0.34* 0.34 -0.38** 0.13 -0.56*** -0.14 -1.07***(0.18) (0.66) (0.19) (0.49) (0.20) (0.52) (0.41)
2 years before entry -0.03 -0.05 -0.02 -0.21 -0.02 -0.11 -0.31(0.13) (0.46) (0.13) (0.34) (0.15) (0.37) (0.29)
Observations 4,751,180 341,351 4,409,829 833,928 3,575,901 890,602 896,201R-squared 0.05 0.06 0.05 0.05 0.05 0.05 0.05
Fixed effects:County, Firm, and Store X X X X X X XProduct category X X X X X X XDay of week X X X X X X XYear-month X X X X X X X
Market, product, and X X X X X X Xstore characteristics
*** Significant at the 1 percent level** Significant at the 5 percent level* Significant at the 10 percent level
Table 8Changes in Stockout Rates Following Wal-Mart Entry, by Distribution Channel, Chain Affiliation, and Market Affluence
Notes: This table reports coefficient estimates and standard errors from within-store regressions examing the probability of an item being outof stock for different subsets of products and stores. The reported coefficients should be interpreted as the percentage point difference in thestockout rate associated with undertaking a highly leverage transaction. For details on the econometric specification, see Table 6, Column 3.Each column represents estimates from a different subsample of products, stores, and/or local markets. Products are separated based onwhether they are typically delivered by a manufacturer's distributor directly to the store (DSD) or through a warehouse. Products in thefollowing categories are classified as DSD: carbonated drink, bread, snacks, cookies, and crackers (Boston Consulting Group 1998). Storesare separated based on whether they are part of a chain of 11 or more stores. Local markets are separated based on whether residents of thecensus tract have mediam income in the top quartile ("high") or bottom quartile ("low").
38

Observations Stockout rate
Cereals and cereal productsFlour and prepared flour mixes 71,676 1.6 % Breakfast cereal 87,191 1.7Rice, pasta, cornmeal 72,728 1.6
Bakery productsBread 98,926 5.7Fresh biscuits, rolls, and muffins 35,827 7.2Cakes and cupcakes (excluding frozen) 26,453 10.0Cookies 38,429 3.5Crackers and bread & cracker products 26,773 2.1Sweetrolls, coffee cake & doughnuts (excluding frozen) 20,677 9.6Frozen bakery products & frozen/refrigerated doughs & batters 17,055 3.1Pies, tarts, turnovers (excluding frozen) 8,375 12.3
Beef and vealUncooked ground beef 81,958 2.5Uncooked beef roasts 157,266 10.0Uncooked beef steaks 234,208 6.0Uncooked other beef and veal 57,124 12.5
PorkBacon, breakfast sausage, and related products 80,853 3.7Ham 65,122 13.2Pork chops 71,098 3.5Other pork including roasts and picnics 78,402 10.6
Other meatsFrankfurters 25,094 3.1Lunchmeats 127,272 3.7Lamb, organ meats, and game 14,865 10.4
PoultryChicken 170,786 7.2Other poultry including turkey 23,286 13.1
Fish and seafoodFresh fish and seafood 61,626 14.0Processed fish and seafood 71,726 3.3
EggsEggs 80,220 1.7
Dairy and related productsMilk 156,108 1.5Cheese and cheese products 86,354 2.5Ice cream and related products 67,595 2.8Other dairy and related products 44,156 2.3
Fresh fruitsApples 110,294 3.8Bananas 79,693 0.7Citrus fruits 125,925 9.6Other fresh fruits 260,183 8.2
Fresh vegetablesPotatoes 78,988 2.6Lettuce 93,895 1.8Tomatoes 78,520 3.6Other fresh vegetables including fresh herbs 154,978 2.8
Processed fruits and vegetablesCanned fruits and vegetables 39,264 1.5Frozen fruits and vegetables 96,766 2.8Other processed fruits and vegetables including dried 95,784 1.8
Appendix Table A1Stockout Rates by Product Category
39

Observations Stockout rate
Juices and nonalcoholic drinksCarbonated drinks 79,779 1.3Frozen noncarbonated juices and drinks 62,921 1.6Nonfrozen noncarbonated juices and drinks 111,871 2.5
Beverage materialsCoffee 79,465 1.3Tea 22,606 1.7Other beverage materials 27,447 1.7
Sugar and sweetsSugar and artificial sweeteners 59,976 1.4Candy and chewing gum 44,696 2.3Other sweets 32,356 1.9
Fats and oilsButter and margarine 59,080 1.5Salad dressing 78,942 1.5Peanut butter 26,390 0.9Other fats and oils 23,011 1.2
Other foodsSoups 70,080 2.0Frozen and freeze dried prepared foods 83,965 4.4Snacks 76,005 3.8Salt and other seasonings and spices 17,909 1.6Olives, pickles, relishes 11,948 1.9Sauces and gravies 35,870 1.9Other condiments (excluding olives, pickles and relishes) 14,211 1.5Baby food 40,802 1.9Prepared salads 11,263 3.2Other miscellaneous foods 50,621 1.9
Food away from homeFood from vending machines and mobile vendors 9,089 3.3
Alcoholic beveragesBeer, ale, and other malt beverages 21,439 1.9Distilled spirits 6,543 1.8Wine 16,447 2.9
Housekeeping suppliesLaundry and cleaning products 41,080 2.1Household paper products 17,418 2.2Miscellaneous household products 9,000 3.1
Prescription drugsPrescription drugs 6,753 0.9
Non-prescription medical productsInternal and respiratory over-the-counter drugs 10,589 2.7Topicals and dressings 5,097 3.1
Pet foodPet food 12,992 1.9
Overall 4,751,180 4.3
Appendix Table A1 (continued)Stockout Rates by Product Category
Note: This table reports the number of observations and the mean stockout rate by product category for the mainanalytic sample. The product categories are listed under their major product group reported in Figure 1.
40