competition and concentration in the polish banking · pdf filecompetition and concentration...
TRANSCRIPT

Competition and concentration in the Polish Banking Market (prior the financial crisis and during the crisis)
- empirical results based on micro data
Małgorzata PawłowskaNBP*
Current Trends in Macroeconomic and Finance Research National Bank of Poland
July 13, 2012
* The views expressed in this paper are the views of the author and do not necessarily reflect those of the National Bank of PolandWork in Progress. Please do not quote without permission.
Outline
• Motivation
• Theory and Literature Review
• Changes in the Structure of the Banking Sector in Poland 1997-2009 (prior the financial crisis and during the crisis)
• Competition in the Polish banking sector
� Panzar and Rosse (P-R) model
� Lerner index
� Boone indicator
• Competition in CEC5 (the Czech Republic, Hungary, Slovenia,Slovakia, Poland) based on Bankscope database
• Conclusions

Motivation
Competition between banks is:• one of the most important factors for stability in the financial
sector through its influence on: profitability of banks, access toexternal funding and the country’s economic development asawhole
• a crucial issue for the EU countries as well as for Poland. Thisinterest is driven by an increasing consolidation in the bankingsector, changes in technology and regulation
Question:• Did the level of competition in the Polish Banking Market
change during the financial crisis?

Theory and Literature Review

There are two major streams to assess competition amongbanks: methods employed in industrial organisation (IO) andthe new empirical approaches (NEIO), specifically appllied tobanking
• The approaches consist of the structure-conduct-performance(SCP) paradigm(Bain 1951, Rhoades 1977, Gilbert 1984)and the efficiency structure hypothesis (ESH) (Demsetz1973); Boone’s model (2008). Concentration ratios (CR5,HHI) are used in formal models explaining competitiveperformance in the banking industry
• The models of competition embrace the Iwata model (1974),the Bresnahan (1982, 1989) and Lau model (1982), thePanzar and Rosse model (1982, 1987), and empirical LernerIndex for banking sector based on Monti-Klein model
Theory

Competition among banks: good or bad? What is special aboutcompetition in financial sector?
Competition in the banking industry is necessarily welfare-enhancing (Pagano (1993), Guzman (2000), Cetorelli (2001)), butthere are possible channels through which bank competitionmaygenerate negative economic effects
Specific to the financial sector, is thelink between competition andstability (Schaecket al., (2006), Allen and Gale (2004, 2007), Vives(2010)).
Vievs (2010) found that competition may increase instability on theliability side, and fostering runs/panics, which may affect the systemoverall; and increasing the incentives to take risk (on either theliability or asset sides), thus increasing the probabilityof failure
Literature Review

Another issue, is thelink between competition and concentration;and regulation
A number of analysts, who investigated the trade-off betweencompetition and concentration, found thatthere is no evidence thatbanking sector concentration negatively relates to the level ofcompetition (Gelos and Roldos (2002), Yildrim and Philippatoas(2007), Claessens and Laeven (2004), Hempell (2002) Coccorese(2004), Fillipaki and Staikouras (2006))
Bikker et al. (2006, 2007, 2008) demonstrated that the levelofcompetition in the existing P-R literature was systematicallyoverestimated. With the correctly specified P-R model Bikker et al.(2008) proved that further consolidation would reduce competitionamong banks
Literature Review cont.

• Most studies based on the Lerner index found a reduction ofcompetition during the 90s and higher Lerner index in MUcountries (e.g. de Guevara and Maudos, (2004, 2007), deGuevara et al., (2007)); Maudos et al., (2007), de Guevara etal.(2004); Angelini and Cetorelli (2003), Fischer and Hempell(2005) demonstrated an increase in competition
• An increase in competition on the credit market in euro zonecountries was demonstrated by Leuvensteijn et al (2007) with theuse of the Boone method
• Finally, Carbó et al (2009) found using five measures ofcompetition that the various indicators of competition yielddifferent results about competitive behaviour due to that fact thatthose competition indicators measure different things
Literature Review cont.

Results related specifically to changes in competition of the financialsector in EMUprior the financial crisisareambiguous
• on the one hand, an increase in competitionhas been found (cf.Utrero-González and Callado-Muñoz (2007)), Boucinha andRibeiro (2009) confirmed increase in competition due to theeuroarea participation for Portuguese banking system, as well LuisGutiérrez de Roza (2007) for Spanish banks
• on the other hand, the results obtained by Bikker and Spierdijk(2008) in cross-country research indicateda decrease incompetition, and found that the degree of competition betweenbanking sectors of the „old” and the „new” EU levelled off
Literature Review cont.

Results related specifically to the competition in the Polish bankingsector:
Based on BanksScope Database:Gelos and Roldos (2002),Claessens and Laeven (2004), Yildrim and Philippatoas (2007),Bikker and Spierdijk (2008)
Based on Poland’s Balance Sheet Statistics (NBP):Pawłowska(2005), Pawłowska and Kozak (2007), Pawłowska (2010),Pawłowska (2011)
Literature Review cont.
Changes in the Structure of the Banking Sector in Poland (1997-2009)

The Share of Banking Sector Assets with Majorityof Foreign Equity in Asstes of All Polish Banksbetween 1997-2009 and The Share of ForeignInvestors in Assets of the Polish Banking Sector in2003, 2007 and 2009 by Country of Origin
Source: NBP, KNF.
(%)
(%)

M&As in the Polish Banking between 1997 and 2009
• M&As taking place in 1997-2001 were strictly connected withtheprocess of privatization, based mostly on foreign capital from theeuro area, and were influenced by international consolidation
• In the years 2002-2007 the process of consolidation slowed down,and since 2004 the main trend was to set up branches of foreigncredit institutions
• M&As taking place in 2008-2009 were strictly connected withthefinancial crisis

The Number of Polish Commercial Banks and Branches
The number of Polish commercial banks decreased, at the sametimethe number of foreign branches increased, despite an increase in thenumber of credit institutions’ branches in Poland (18 in 2009) theirshare in the market remained insignificant
Source: NBP, KNF.
(%)

HHI and CR5 for Polish Commercial Banks in 1997-2009
Source: NBP, KNF.
Consolidation in the Polish banking sector resulted in changes in concentration measured:HHI CR 5
(%)

Change of CR5 for Credit Institutions in UE (2004-2009)
16
Source: NBP, ECB.
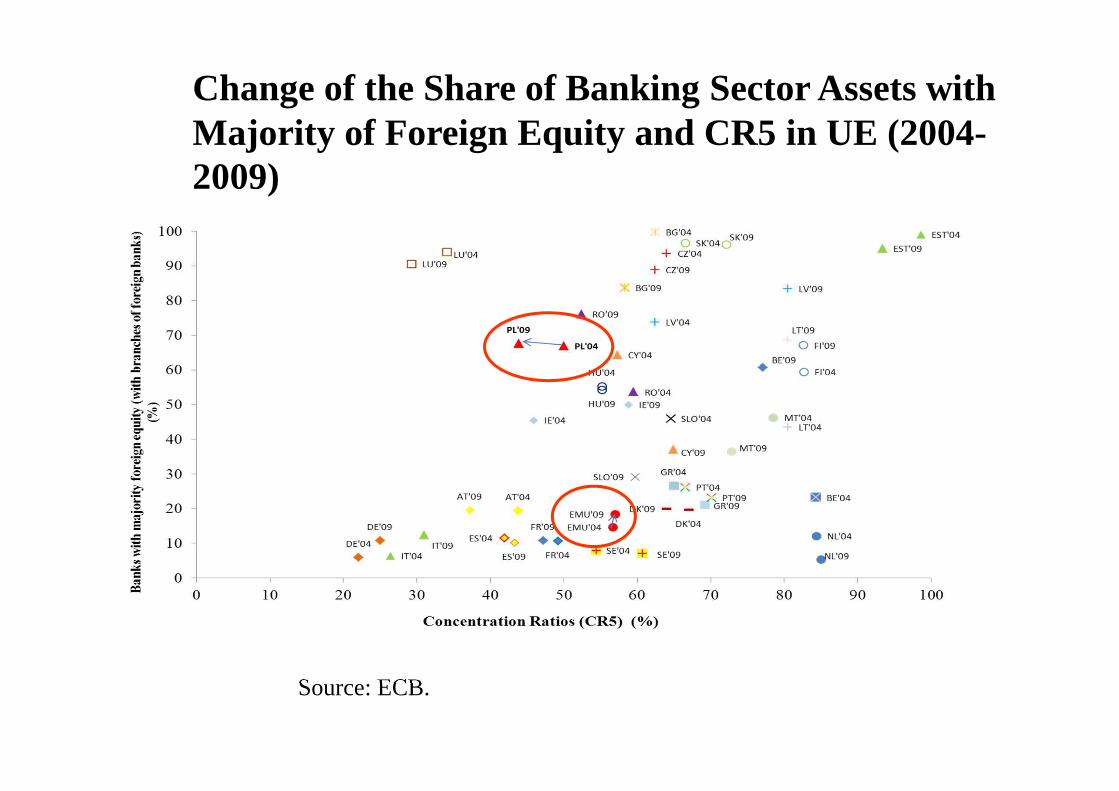
Change of the Share of Banking Sector Assets with Majority of Foreign Equity and CR5 in UE (2004-2009)
Source: ECB.

Commercial Banking Sector’s Efficiency Indicators in Poland 1997-2009 (%)
Source: NBP and FSA.

Structural and Technological Changes in the Polish Banking Sector Between 1997 and 2009
• On May 1, 2004, ten countries, including Poland, joined theEuropean Union, one of the results of the accession was theharmonisation of Polish financial law with EU regulations.
• The Internet made the established Polish banking sector morevulnerable to new entrants
• During the period of crisis in order to stabilized and improvedsituation on financial market: NBP, Polish Government andFinancial Supervision took some activities; despite the strongdeterioration in financial performance, the situation of thebanking sector was quite stable, also in terms of liquidity.

Empirical results for the Polish Banking Sector
� Panzar and Rosse (P-R) model � Lerner index� Boone indicator

21
Panzar and Rosse Approach
H = ∑= ∂
∂m
k i
i
i
i
R
w
w
Rk
k1
*
*
*
where: R* i– revenue function in the equilibrium, wi – factor of input prices of bank.
Market power is measured by the extent to which changes in factor input prices (dwki) are reflected in equilibrium revenues (dRi* ) earned by bank i.
(3)
This method implies, that bank i maximizes its profits, where marginal revenue equals marginal cost:
),,(),,( ''iiiiiii twyCznyR =
),,(),,( ***** twyCznyR ii =(1)
(2)
where: Ri – revenue function of bank i, Ci – cost of bank i, yi – output of bank i, n – number of banks, wi – vector of m factor input prices of bank i, zi – vector of exogenous variables that shift the revenue function, zi - vector of exogenous variables that shift the cost function, the prime denoting marginal and the asterisk denoting equilibrium values.

22
Interpretation of the Panzar – Rosse’sH-Statistic
Values of H Competitive Environment
H≤0 Monopoly or perfectly collusive oligopoly
0<H<1 Monopolistic competition
H=1 Perfect competition or monopoly in a perfectly contestable market
Values of H Equilibrium test*
0<H Disequilibrium
H=0 Equilibrium
Source: Gelos & Roldos (2002), p. 13. *price should equal marginal cost and free entry and exit conditions determine zero profit.

Panzar and Rosse Approach, continued
Bikker and Haaf (2002) arrived the empirical reduced-form equation obtained astheproduct of equilibrium output and the common price level :
Where:
dependent variablelnII denotes natural logarithm of interest income,
explanatory variables:wf – the price of funds, wl – the price of personal expenses, wc – the price of capital, egz – bank-specific exogenous factors,OI/II – the ratio of other income to total assets to capture the increasing role of non interest revenue in banks’ income
εηβα ++++++= ∑ )/ln(lnlnlnln 321 IIOIegzwawawaIIj
jjcpf(4)

Misspecification in the Panzar and Rosse (P-R) modelWhere dependent variable yit = ln(II/TA) is ‘the price’
or yit=ln(II it) is ‘the revenue’ the OLS estimator is expressed in the usual way (see Bikker et al. (2007)):
TAXXXTAXXXIIXXX
YXXX
IIorYTAIIY
XY
rp ln')'(ln')'(ln')'(
')(
)ln()/ln(
111
1'
'
−−
∧−−
∧
−∧
=−=
=
==+=
ββ
β
εβ
β
The bias in the H statistic obtained from the P-R model with interestincome divided by total assets(II/TA):
)(TAbiasHH rp +=
(5)

Lerner Index of Market Power
Lerner index is a mark-up of price over marginal cost anddivergence of price, and measures thecapacity to set prices abovethe marginal cost, being an inverse function of the elasticity ofdemandeand of the number of banksN
The higher the mark-up, the greater the realized market power .The values of the index range from 0 (perfect competition) to1(monopoly)
(6)
p
MCp
NeL
−==||
1

Lerner index expression is obtained from the Monti-Klein (1971) imperfect competitionmodel (see Freixas & Rochet, pp. 78-81).The bank’s decision variables areL (the amount of loans) areD (the amount of deposits),and for simplicity's sake the level of capital is assumed to be given.The bank is assumed to be a price taker in the inter-bank market (r) so that the objectivefunction of profits to be maximized is as follows:
(7)
The first order conditions with respect to deposits and loans are as follows:
(8)
26
Lerner index in the case of banking companies (1)
L)C(D,-D*(D))r -(r+L*r) - (L)(r),( DL=LDπ
DD
LL
NrD
C
Dr
DD
NrL
Cr
rLL
επ
επ
1r-r
0C
-rDr
1r
0LC
- - rLr
*
*D
DD
*
*L
LL
=
∂∂−
→=∂∂−+
∂∂−=
∂∂
=
∂∂−−
→=∂∂+
∂∂=
∂∂
p
MCp
NeL
−==||
1

From National Bank of Poland’s Balance Sheet Statistics:• annual data for the period 1997 to 2009• values of the H-statistics and Lerner index were calculated for
the whole period under analysis (1997-2009), and for three sub-periods: 1997-2001 (H1), 2002-2007 (H2) and 2008-2009(H3)
From BankScope Data: • annual data for the period 2002 to 2009 for the Czech
Republic, Hungary, Slovakia, Slovenia, Poland• values of the H-statistics were calculated for the whole period
under analysis (2002-2009), and for sub-periods: 2002-2007(H1), 2008-2009 (H2)
Diff.-in-diff. Estimation
Two variants of the dependent variable equation were estimated: Thefirst variant was based on the natural logarithm of interestincomedivided by total assets (II/TA), the second on the natural logarithm ofinterest income (II)
Data Sources & Estimation

Revenue Equation for the Polish Banking Sector Panzar and Rosse (P-R) model
• II – dependent variable (II/TA) - interest income/total assetsor
(II) - interest income
• wl – unit price of labour : personnel expenses/total assets
• wp – unit price of funds : interest expenses/total deposits
• wk – unit price of capital : other expenses/fixed assets
OI/II – (the ratio of other income to interest income)
the ratio of other income to interest income
• oth – bank specific variables size of nonperforming loans
• ci - constant constant
ln(II it) = Ci+a1*ln wlit+a2*ln wpit+a3*ln wkit+ d*(OI/II )+e*oth it+eit (9)
Source: Gelos and Roldos (2002), pp. 14-16.

Value of H-statistic for Polish Commercial Banks
Source: own calculations. Note: to test the value of H the Wald tests were used:for monopoly: H0 : H≤0 versus H1: H>0 and for perfect competition: H0 : H = 1 versusH1:H 1, 1Null hypothesis H=0 and H=1 has been rejected at 1% significance level.2Hypothesis of H≤0 was not rejected at the significance level of 1%.
≠
Estimations results with time interaction termsfor overall sample:
FE pooled OLS GMM
ln(II/TA) ln(II) ln(II/TA) ln(II) ln(II/TA) ln(II)
H1
1997 – 2001 0.551 -0.052 0.491 -0.5972 0.601 --0.0872
p(F-test) (0.000) (0.408) (0.000) (0.031) (0.000) (0.064)
H2
2002 – 2007 0.781 0.2811 0.791 -0.3932 0.841 0.17451
p(F-test) (0.000) (0.000) (0.000) (0.537) (0.000) (0.045)
H32008-2009 0.821 0.1963 0.881 -0.7692 0.821 -0.03482
p(F-test) (0.000) (0.000) (0.000) (0.635) (0.000) (0.045)
p(F-test) H0 : H1 = H2 (0.000) (0.000) (0.000) (0.094) (0.000) (0.000)
p(F-test) H0 : H3= H2 (0.271) (0.456) (0.054) (0.133) (0.574) (0.470)
p(F-test) H0 : H3 = H1 (0.000) (0.037) (0.000) (0.405) (0.000) (0.009)
Estimations results for overall sample: FE pooled OLS GMM
ln(II/TA) ln(II) ln(II/TA) ln(II) ln(II/TA) ln(II)
H*1997 – 2007 0.761 0.0152 0.731 0.0062 0.671 -0.0112
p(F-test) (0.000) (0.854) (0.000) (0.393) (0.000) (0.053)
H1997 – 2009 0.771 0.1262 0.741 -0.6882 0.671 -0.09682
p(F-test) (0.000) (0.068) (0.000) (0.395) (0.000) (0.054)

Results of H-Statistic Based on the BankScopeData
Value of H-statistic for the Polish banking sector
Source: Gelos and Roldos (2002), p. 47, Claessens and Laeven(2004), p. 573,Yildrim and Philippatoas (2007), p. 203, Pawłowska (2005),p. 13, Bikker andSpierdijk (2008), p. 26, Pawłowska (2011), p. 710.1H=0 and H=1 rejected (level of confidence 99.9 per cent).
Year Value of H-statistic
The dependent variable
Number of banks
Market Structure
Claessens and Laeven (2004) 1994 - 2001 0.771 ln(II/TA) 40 Monopolistic competition
Gelos and Roldos (2002) 1994 0.541 ln(II/TA) 55 Monopolistic competitionGelos and Roldos (2002) 1999 0.531 ln(II/TA) 55 Monopolistic competition
Yildrim and Philippatoas (2007) 1993 - 2000 0.501 ln(II/TA) 53 Monopolistic competition
Bikker and Spierdijk (2008) 1992 0.451 ln(II) 50 Monopolistic competitionBikker and Spierdijk (2008) 2004 0.08 ln(II) 50 -Bikker and Spierdijk (2011) 1994-2004 0.83 ln(II/TA) - -Bikker and Spierdijk (2011) -0.19 ln(II) - -
Pawłowska(2005) 1997-2002 0.771 ln(II/TA) All Monopolistic competitionPawłowska(2011) 1997-2007 0.76 ln(II/TA) All Monopolistic competitionPawłowska(2011) 1997-2007 0.015 ln(II) All -

Results of the calculation of the H statistic for EU-15 and EU-10
Years: Dependent variable EU-15 EU-10
1998-20021 ln(II/TA) H = 0.54 H = 0.78
1998-20021 ln(TI/TA) H = 0.61 H = 0.46
19942 ln(II) H = 0.87 H = 0.61
20042 ln(II) H = 0.55 H = 0.55
Source:1Koutsomanoli-Fillipaki and Staikouras (2006), p. 39,2 Bikker and Spierdijk(2008), p. 26.
32
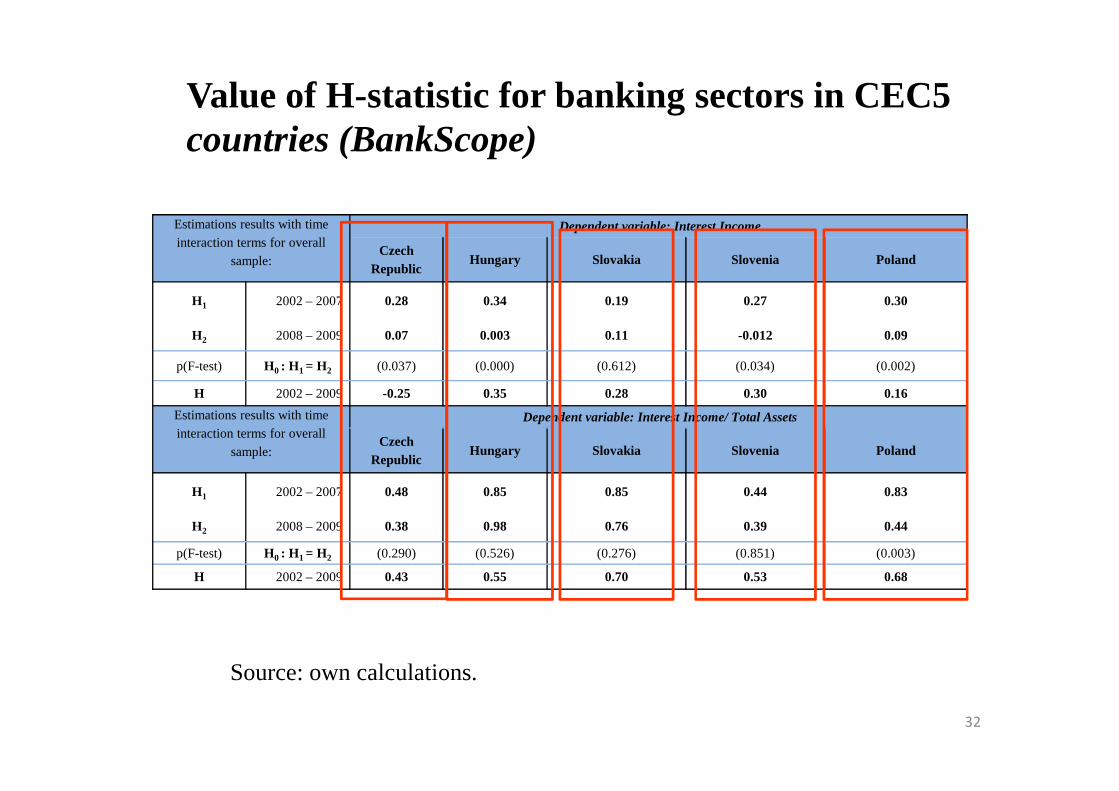
Value of H-statistic for banking sectors in CEC5countries (BankScope)
Source: own calculations.
Estimations results with time interaction terms for overall
sample:
Dependent variable: Interest Income
Czech Republic
Hungary Slovakia Slovenia Poland
H1 2002 – 2007 0.28 0.34 0.19 0.27 0.30
H2 2008 – 2009 0.07 0.003 0.11 -0.012 0.09
p(F-test) H0 : H1 = H2 (0.037) (0.000) (0.612) (0.034) (0.002)
H 2002 – 2009 -0.25 0.35 0.28 0.30 0.16
Estimations results with time interaction terms for overall
sample:
Dependent variable: Interest Income/ Total Assets
Czech Republic
Hungary Slovakia Slovenia Poland
H1 2002 – 2007 0.48 0.85 0.85 0.44 0.83
H2 2008 – 2009 0.38 0.98 0.76 0.39 0.44
p(F-test) H0 : H1 = H2 (0.290) (0.526) (0.276) (0.851) (0.003)
H 2002 – 2009 0.43 0.55 0.70 0.53 0.68

The marginal cost is estimated on the basis of the following translogarithmic cost function (Berger & Mester (1997)):
From the translog functional form marginal cost is easily derived from derivative:
Lerner Index:
price pi=interest income /total assets (Angelini i Cetorelli(2003)); Yi total assets, Wj the price of the factors of production w1 = price of labour: personnel costs / total assets, w2 = price of physical capital: operating costs (except personnel costs)/ fixed assets,w3 =price of deposits: financial costs /deposits like in P-R model.
33
( ) iitj
jjj k
kjjkj
jj zvWyWWWyyTC +++++++= ∑∑∑∑== ==
3
1
3
1
3
1
3
1
2210 lnlnlnlnlnln*2/1lnln γβββββ
( )
++= ∑
=
3
121 lnln
jjjit Wy
y
TCMC γββ
(10)
p
MCpL
−=
Lerner index in the case of banking companies (1)

34
Source: own analysis.
Value of Lerner Indices for Polish Commercial Banks in 1997-2009
Year Std. Dev. Lerner index Std. Dev. MC Number of obs.
1997 0.4252542 0.3802458 0.009015 0.07307695 831998 0.3861225 0.3816084 0.008732 0.07155848 811999 0.340915 0.2866669 0.0091585 0.06980097 732000 0.306847 0.4192944 0.0086041 0.06887544 722001 0.6842708 0.3019527 0.0087703 0.06913474 702002 0.4167888 0.0973307 0.008439 0.06642440 672003 1.695749 0.1360234 0.0086616 0.06589605 592004 1.596667 0.1892985 0.008575 0.06461746 592005 0.8623657 0.284603 0.008973 0.06457389 582006 0.5313009 0.2788467 0.008505 0.06336119 592007 1.031755 0.2591705 0.0085683 0.06254121 602008 0.3700726 0.3700726 0.0086041 0.06174030 642009 0.9603999 0.4222222 0.0220195 0.02212918 62

35
Source: own analysis.
Value of Lerner Indices for Polish CommercialBanks in years 1997-2001, 2002-2007, 2008-2009
Years Lerner index Std. Dev.
(1) L1: 1997-2001 0.3556355 0.0229866
number of observations 372
(2) L2:2002-2007 0.207891 0.0600689
number of observations 351
(3) L3:2009-2008 0.3957335 0.7528025
number of observations 126
H0: L 1= L2 p(F-test) (0.0096)
H0: L 3= L2 p(F-test) (0.0014)
H0: L 3= L1 p(F-test) (0.2351)
L*: 1997-2007 0.2839089 0.8487746
number of observations 723
L: 1997-2009 0.3005048 0.8357595
number of observations 849

36
Source: own analysis.
Spearman's rank correlation coefficients matrix for Polish Commercial Banks in 1997-2009
Correlation
Banks with majority foreign equity (with branches of foreign banks)
Banks with majority of state ownership
CR5 HHI
Lerner index -0.3330 0.0879 -0.7345 -0.5055

37
The market shares of banks with lower marginal costs are expectedto increase, and thisβ is negative Booneet al. (2004) .
lnsit = α+ β lnmcit + uit (11)
si -market share, defined as = qi /Σj qj
MCit –marginal cost of bank i t,
β parameter is refered to the as the Boone indicator.
The stronger competition is, the stronger this effect will be, and the larger, in absolute terms, the (negative) value of β.
The Boone indicator model

38
Source: Leuvensteijn, Bikker, Rixtel, Sørensen (2007), for Poland own analysis.The results for 2009 are tentative.
Boone Indicators for Polish Commercial Banksand for Selected European Banking Sectors

Conclusions
• There was monopolistic competition in Polish banking sectorbetween 2002-2007. The degree of competition in the Polishbanking sectorprior the crisis was close to that in the euroarea banking sectors
• The main impulse for the increase in the level of competitionin the Polish banking sectorprior the crisiswas the entry offoreign banks (which brings new technologies and newproducts), connected with the M&A process and a rapidgrowth of IT technology. This proces was conected withPoland’s accession to the European Union
• The same channels, consolidation and financial deregulation,that were observed in the EU during adoption of the euro,influenced the level of competition of the Polish bankingsector

Conclusions, continued
• Between 2008 and 2009 the Polish banking system was mainlyunder the impact of the financial crisis, competition measuresconfirm that the degree of competition in the Polish bankingsectorduring the crisisdecreased slighly
• Finally, liberalisation had an impact on the competition ofthefinancial intermediaries and also on the financial crisis,while stronginstitutional environment and regulation reduces them. This suggestthat coordinating regulation and competition policy is necessary(see: Vives, 2010).
REFERENCES
• Angelini P., N. Cetorelli,The effects of regulatory reform on competition in the banking industry. Journalof Money, Credit and Banking 35, pp. 663–684, 2003.
• Bain J.P.:Relation of profit rate to industry concentration: American manufacturing 1936-40,“QuarterlyJournal of Economics” 65, pp. 293-324, 1951.
• Berger, N., L., J. Mester,Beyond the Black Box: What Explains Differences in the efficiencies ofFinancial Institutions“Journal of Banking and Finance”, 21, pp. 895-947, 1997.
• Bikker J.A., Competition and Efficiency in Unified European Banking Market, Edward Elgar,Cheltenham, UK&Northampton, MA, USA, 2004.
• Bikker J.A., M. Leuvensteijn,An exploration into competition and efficiency in the Dutchlife insuranceindustry, DNB Working Paper, 2005.
• Bikker J.A., L. Spierdijk, P. Finnie,The impact of market structure, contestability and institutionalenvironment on banking competition,DNB Working Paper, No. 156/November 2007.
• Bikker J.A., L. Spierdijk,How Banking Competition Changed over Time,DNB Working paper, No.167/February 2008.
• Boone J. „A New Way to Measure Competition”,CEPR Discussion Paper Series No. 4330, March(2004).
• Carbó S., D. Humphrey, J. Maudos and P. Molyneux,Cross-Country Comparisons of Competition andPricing Power in European Banking,Journal of International Money and Finance, 28, pp. 115-134, 2009.
• Coccorese P.,Banking competition and macroeconomic conditions: a disaggregate analysis, Journal ofInternational Financial Markets, Institutions & Money 14,pp. 203-219, 2004.
• Cetorelli N.,Real Effects of Bank Competition, Journal of Money, Credit, and Banking, Vol. 36, No. 3(June 2004, Part 2), The Ohio State University Press, pp. 544-558, 2004.

• Claessens P., L. Laeven,What drives bank competition? Same international evidence. Journal of Money,Credit, and Banking, Vol. 36, No. 3 (June 2004, Part 2), The Ohio State UniversityPress, pp. 564-583,2004.
• Degryse H., M. Kim, S. Ongena,Microeconomics of Banking: Methods, Applications and Results,Oxford University Press, 2009.
• Goddard J., J.O.S. Wilson,Competition in banking: a disequilibrium approach, Journal of Banking andFinance 33, 2282-2292, 2009.
• Fungacova Z., L. Weill, How market power influences bank failures: Evidence from Russia,BOFIT, 12,2009.
• Gelos R.G., J. Roldos,Consolidation and Market structure in Emerging Market Banking Systems,IMFWorking Paper, WP/02/186, 2002.
• Gutierrez de Rozas L.,Testing for Competition in the Spanish Banking Idustry: thePanzar-RosseAproach Revisited, Banco de Espana, Documentos de Trabajo, N. 0726, 2007.
• Hempell H., Testing for Competition among German Banks. Economic Research Centre,DeutscheBundesbank, Discussion Paper 04/02, 2002.
• Iwata G.,Measurement of conjectural variations in oligopoly,Econometrica 42, pp. 947–966, 1974.• Koutsomanoli-Fillipaki N., CH. Staikouras: European Financial Management, Vol. 12, No. 3, pp. 443–
482, 2006.• Lau L., On identifying the degree of competitiveness from industryprice and output data, Economics
Letters 10, pp. 93–99, 1982.• Leuvensteijn M., J. A. Bikker, A. Rixtel, C. K. Sørensen,A new Approach to measuring competition in
the loan markets of the euro area, EBC, Working Paper Series, No 768, June 2007.
REFERENCES, continued

• Lerner A., The concept of monopoly and the measurement of monopoly Power, Review of EconomicStudies 1, pp. 157–175, 1934.
• Panzar J.C., J.N. Rosse,Testing for “monopoly” equilibrium,Journal of Industrial Economics 35, pp.443-456, 1987.
• Pawłowska M.,Competition, Concentrations, Efficiency and their Relationship in the Polish BankingSector, „Materiały i Studia”, No. 32, NBP, Warsaw, 2005.
• Pawłowska M.,Competition in the Polish Banking Sector, Gospodarka Narodowa (National Economy),vol: 21, No. 5-6, pp. 91-119, 2010.
• Pawłowska M.,Competition in the Polish banking market prior to the recentcrisis - empirical resultsobtained with the use of three different models for the period 1997-2007,Bank i Kredyt, nr 5, 2011.
• Shaffer, P.,Competition in the US banking industry, Economics Letters 29, pp. 321–323, 1989.• Schaeck K.,Čihák M., Wolfe S.,Are More Competitive Banking Systems More Stable, “Working Paper”,
No. 143, IMF, Washington, D.C., 2006.• Schaeck K.,Čihák, M., How Does Competition Affect Efficiency and Soundness in Banking? ECB
Working Paper, No. 932, 2008.• Utrero-González N., F. J. Callado-Munoz,Can Monetary Union Enhance Banking Competition?: A
Multicase Study, Journal of Economic Integration, Volume 22, Number 1/march 2007, pp. 128-155,2007.
• Vieves X.,Competition and stability in banking, CEPR, No. 50, August 2010.• Yildirim H.P., G.C. Philippatos,Competition and Contestability in Central and Eastern European
Banking Markets, Managerial Finance, Vol. 33, No. 3, 2007, pp. 195-209.
REFERENCES, continued

Thank you for attention