comparison of laser scanning and dense stereo matching ... · comparison of laser scanning and...
TRANSCRIPT
Comparison of Laser Scanning and Dense Stereo Matching Techniques
in Diverse Environmental Conditions and Light Exposure
The Case Study of Las Cuevas, Belize.
Fabrizio GALEAZZI1 | Stefan LINDGREN2 | Holley MOYES1
1 School of Social Sciences, Humanities and Arts, University of California, Merced | 2 Humanities Laboratory,
Lund University
Abstract: The use of three dimensional technologies for the documentation of archaeological and cultural
heritage sites is well established today, but this can be challenging because researchers have yet to
integrate these technologies to develop a complete and coherent methodology for the 3D documentation of
sites. Laser scanning and, recently, dense stereo matching techniques have shown to be very powerful tools
for the 3D documentation of the archaeological excavation and context.
The proposed work tests and compares laser scanning and dense stereo matching techniques at Las
Cuevas site (Belize), to find the most appropriate methods to document different aspects of an archeological
site, based on diverse environmental conditions, light exposures, and varied surfaces. The complexity of the
Las Cuevas’ site allowed testing the 3D documentation techniques in areas of the site presenting different
environmental conditions and light exposure: dark recesses of caves; areas in shaded sunlight under the
jungle canopy; and places of more direct sunlight in areas that have been cleared of brush or exposed by
tree fall.
This paper presents the comparison of phase shift variation laser scanner (Faro Focus 3D) and dense stereo
matching (Agisoft Photoscan) techniques for the 3D data acquisition of archaeological stratigraphy.
This study points to dense stereo matching as the most economical, portable, flexible, and widely used
approach for the 3D documentation of archaeological sites today. This technique, in fact, allowed saving time
for both data acquisition and processing in all excavation areas selected for the comparison. This kind of
research can help defining best 3D practices for the documentation, visualization and analysis of sites.
Keywords: phase shift variation laser scanner, dense stereo matching, 3D documentation, archaeological
excavation, 3D practices.
Introduction
This paper presents the results of the 2012 3D documentation fieldwork campaign at Las Cuevas, western
Belize. The 3D data acquisition and processing was possible thanks to a multidisciplinary collaboration
between the University of California Merced and the Humanities Laboratory at Lund University in Sweden.
This research aims to compare laser scanner and dense stereo matching techniques for the 3D acquisition
and preservation of archaeological stratigraphy in extreme environmental conditions. The 3D survey was
conducted using dense stereo matching (DSM; Photoscan) and phase shift variation laser scanning (PST;
FARO Laser Scanner Focus3D) techniques to understand how these technologies work in the different
environmental and lighting conditions of the Las Cuevas site. To this end the two techniques were compared
International Conference on Cultural Heritage and New Technologies | Vienna | 2013
2
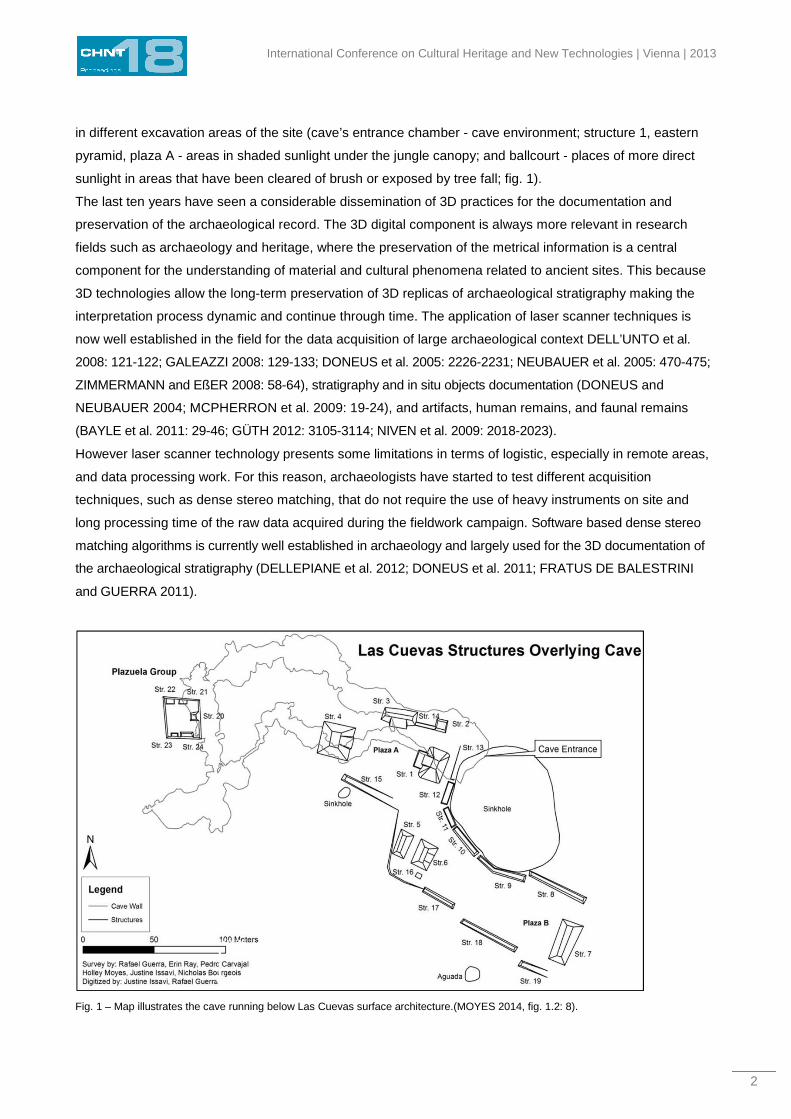
in different excavation areas of the site (cave’s entrance chamber - cave environment; structure 1, eastern
pyramid, plaza A - areas in shaded sunlight under the jungle canopy; and ballcourt - places of more direct
sunlight in areas that have been cleared of brush or exposed by tree fall; fig. 1).
The last ten years have seen a considerable dissemination of 3D practices for the documentation and
preservation of the archaeological record. The 3D digital component is always more relevant in research
fields such as archaeology and heritage, where the preservation of the metrical information is a central
component for the understanding of material and cultural phenomena related to ancient sites. This because
3D technologies allow the long-term preservation of 3D replicas of archaeological stratigraphy making the
interpretation process dynamic and continue through time. The application of laser scanner techniques is
now well established in the field for the data acquisition of large archaeological context DELL’UNTO et al.
2008: 121-122; GALEAZZI 2008: 129-133; DONEUS et al. 2005: 2226-2231; NEUBAUER et al. 2005: 470-475;
ZIMMERMANN and EßER 2008: 58-64), stratigraphy and in situ objects documentation (DONEUS and
NEUBAUER 2004; MCPHERRON et al. 2009: 19-24), and artifacts, human remains, and faunal remains
(BAYLE et al. 2011: 29-46; GÜTH 2012: 3105-3114; NIVEN et al. 2009: 2018-2023).
However laser scanner technology presents some limitations in terms of logistic, especially in remote areas,
and data processing work. For this reason, archaeologists have started to test different acquisition
techniques, such as dense stereo matching, that do not require the use of heavy instruments on site and
long processing time of the raw data acquired during the fieldwork campaign. Software based dense stereo
matching algorithms is currently well established in archaeology and largely used for the 3D documentation of
the archaeological stratigraphy (DELLEPIANE et al. 2012; DONEUS et al. 2011; FRATUS DE BALESTRINI
and GUERRA 2011).
Fig. 1 – Map illustrates the cave running below Las Cuevas surface architecture.(MOYES 2014, fig. 1.2: 8).
Galeazzi | Lindgren | Moyes – Comparison of Laser Scanning Techniques
3
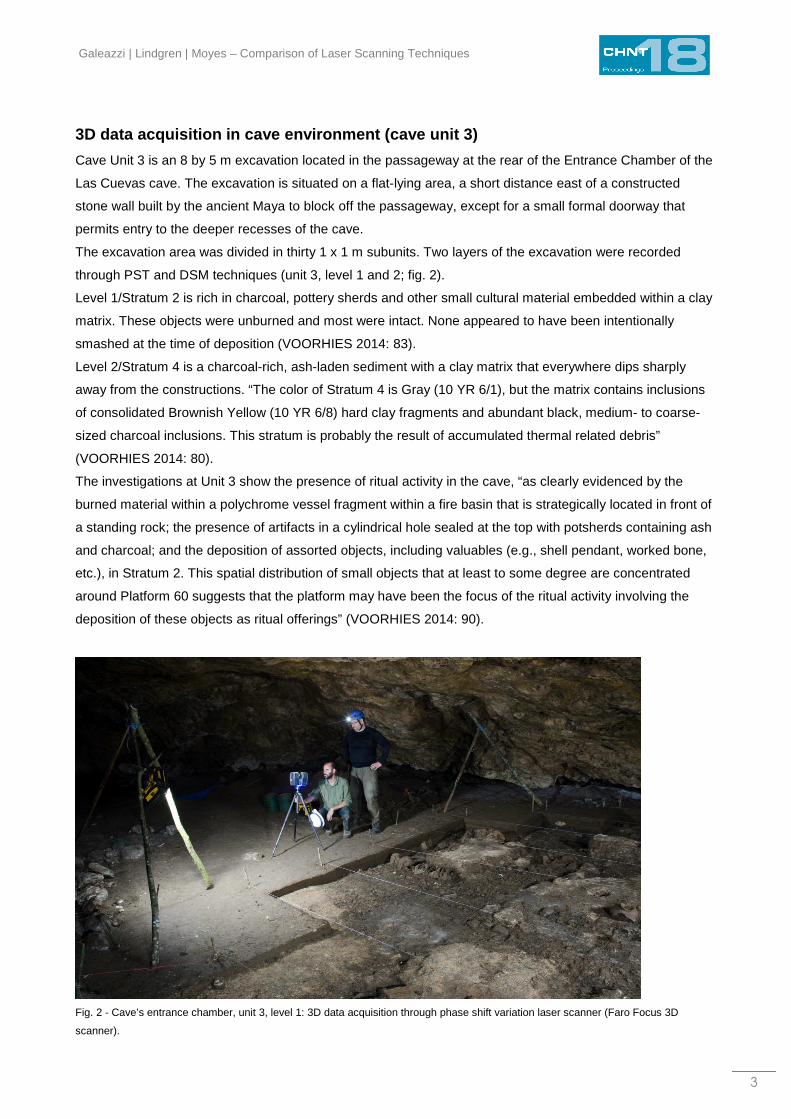
3D data acquisition in cave environment (cave unit 3)
Cave Unit 3 is an 8 by 5 m excavation located in the passageway at the rear of the Entrance Chamber of the
Las Cuevas cave. The excavation is situated on a flat-lying area, a short distance east of a constructed
stone wall built by the ancient Maya to block off the passageway, except for a small formal doorway that
permits entry to the deeper recesses of the cave.
The excavation area was divided in thirty 1 x 1 m subunits. Two layers of the excavation were recorded
through PST and DSM techniques (unit 3, level 1 and 2; fig. 2).
Level 1/Stratum 2 is rich in charcoal, pottery sherds and other small cultural material embedded within a clay
matrix. These objects were unburned and most were intact. None appeared to have been intentionally
smashed at the time of deposition (VOORHIES 2014: 83).
Level 2/Stratum 4 is a charcoal-rich, ash-laden sediment with a clay matrix that everywhere dips sharply
away from the constructions. “The color of Stratum 4 is Gray (10 YR 6/1), but the matrix contains inclusions
of consolidated Brownish Yellow (10 YR 6/8) hard clay fragments and abundant black, medium- to coarse-
sized charcoal inclusions. This stratum is probably the result of accumulated thermal related debris”
(VOORHIES 2014: 80).
The investigations at Unit 3 show the presence of ritual activity in the cave, “as clearly evidenced by the
burned material within a polychrome vessel fragment within a fire basin that is strategically located in front of
a standing rock; the presence of artifacts in a cylindrical hole sealed at the top with potsherds containing ash
and charcoal; and the deposition of assorted objects, including valuables (e.g., shell pendant, worked bone,
etc.), in Stratum 2. This spatial distribution of small objects that at least to some degree are concentrated
around Platform 60 suggests that the platform may have been the focus of the ritual activity involving the
deposition of these objects as ritual offerings” (VOORHIES 2014: 90).
Fig. 2 - Cave’s entrance chamber, unit 3, level 1: 3D data acquisition through phase shift variation laser scanner (Faro Focus 3D
scanner).
International Conference on Cultural Heritage and New Technologies | Vienna | 2013
4
Unit 3 was acquired after all its subunits were fully excavated (LINDGREN and GALEAZZI 2013). This
approach allowed the excavation teams to save time. In fact, the documentation team needed about 5
minutes for the equipment setup; therefore, the acquisition of the subunits would have required about 150
minutes, (i.e., 5 minutes x 30 subunits), compared to the 5 minutes needed to scan the whole unit.
Since color information was crucial for the acquisition of Unit 3, it was decided to use the built in camera of
the scanner. Six lamps (DeWALT DC020 fluorescent light) were used to light up the area enough for the
scanner camera to be able to capture the color information. The lamps were powered by batteries that,
according to the manufacturer, would last for at least 2 hours. However in the high humidity of the cave, the
expected 2 hours turned out to be 40 minutes. Since 7 scanner positions were needed to record the unit and
each one took about 6-7 minutes to complete, different strategies were tried to solve lighting time
constraints. One was to light the area with fewer lamps, thus having the possibility to replace the lamps that
ran out of power. Another strategy was to turn on the lamps only while the scanner was capturing the
pictures. Despite these efforts, the resulting color information varied between the scans and it was hard to
get uniform colors in the final model.
The first part of the point processing and editing of the excavation area was performed with FARO Scene
software supplied by scanner manufacturer. The single scans obtained from the 7 scanner positions were
cleaned and exported using an exchange format (ptx). The scans were imported in the open source software
Meshlab.
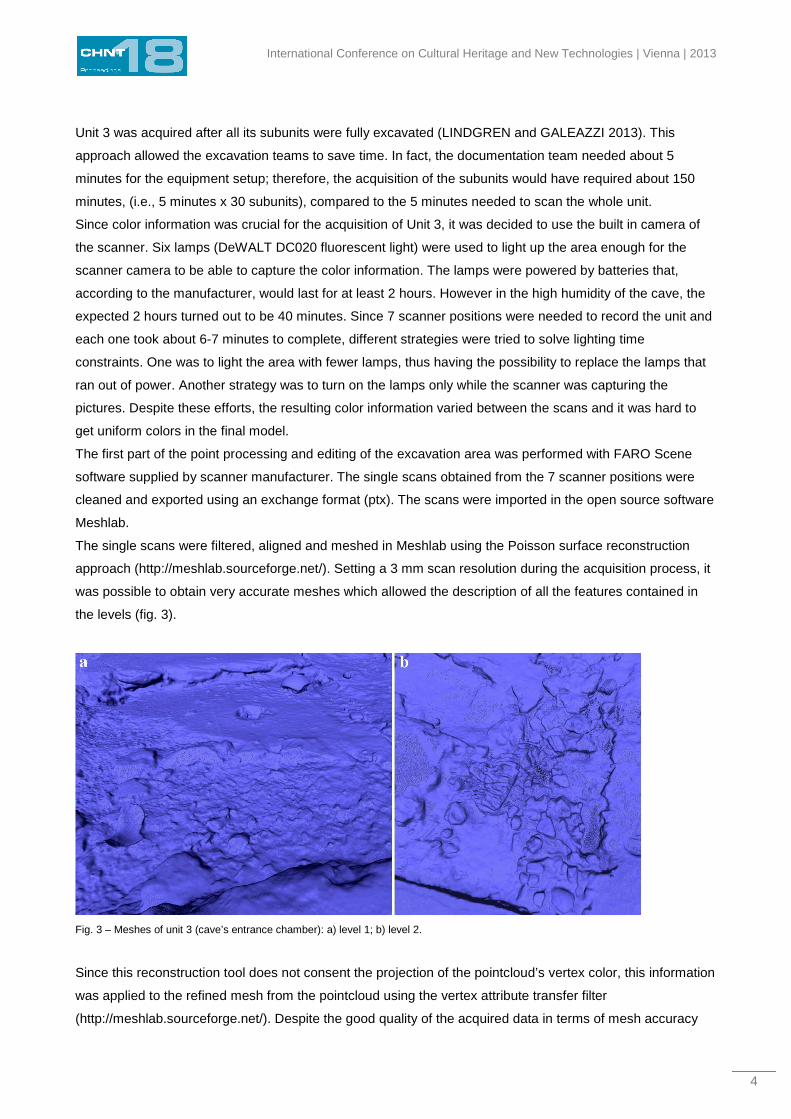
The single scans were filtered, aligned and meshed in Meshlab using the Poisson surface reconstruction
approach (http://meshlab.sourceforge.net/). Setting a 3 mm scan resolution during the acquisition process, it
was possible to obtain very accurate meshes which allowed the description of all the features contained in
the levels (fig. 3).
Fig. 3 – Meshes of unit 3 (cave’s entrance chamber): a) level 1; b) level 2.
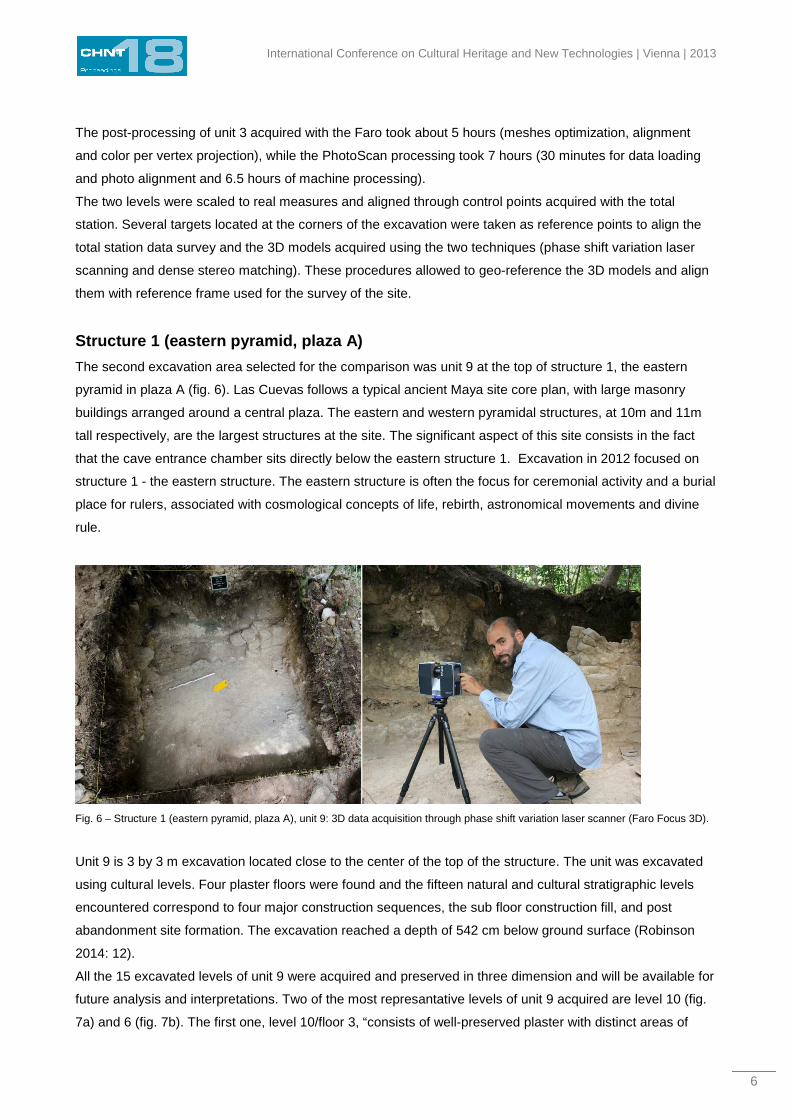
Since this reconstruction tool does not consent the projection of the pointcloud’s vertex color, this information
was applied to the refined mesh from the pointcloud using the vertex attribute transfer filter
(http://meshlab.sourceforge.net/). Despite the good quality of the acquired data in terms of mesh accuracy
Galeazzi | Lindgren | Moyes – Comparison of Laser Scanning Techniques
5
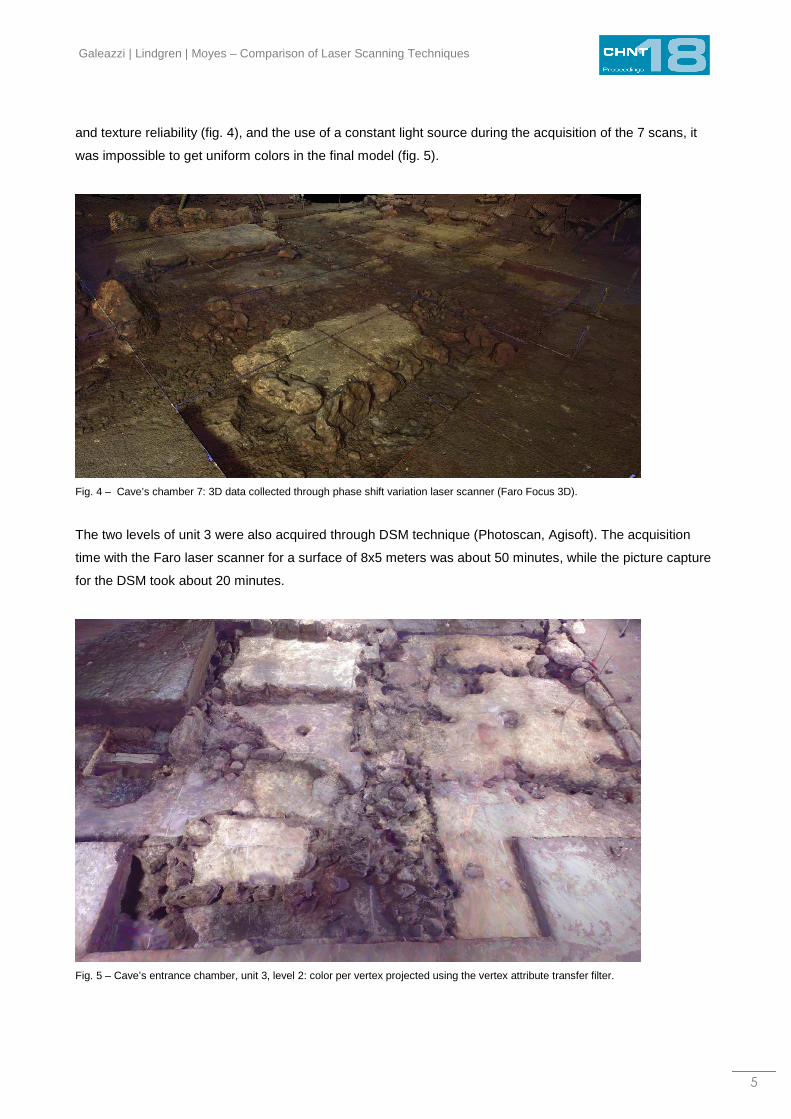
and texture reliability (fig. 4), and the use of a constant light source during the acquisition of the 7 scans, it
was impossible to get uniform colors in the final model (fig. 5).
Fig. 4 – Cave’s chamber 7: 3D data collected through phase shift variation laser scanner (Faro Focus 3D).
The two levels of unit 3 were also acquired through DSM technique (Photoscan, Agisoft). The acquisition
time with the Faro laser scanner for a surface of 8x5 meters was about 50 minutes, while the picture capture
for the DSM took about 20 minutes.
Fig. 5 – Cave’s entrance chamber, unit 3, level 2: color per vertex projected using the vertex attribute transfer filter.
International Conference on Cultural Heritage and New Technologies | Vienna | 2013
6
The post-processing of unit 3 acquired with the Faro took about 5 hours (meshes optimization, alignment
and color per vertex projection), while the PhotoScan processing took 7 hours (30 minutes for data loading
and photo alignment and 6.5 hours of machine processing).
The two levels were scaled to real measures and aligned through control points acquired with the total
station. Several targets located at the corners of the excavation were taken as reference points to align the
total station data survey and the 3D models acquired using the two techniques (phase shift variation laser
scanning and dense stereo matching). These procedures allowed to geo-reference the 3D models and align
them with reference frame used for the survey of the site.
Structure 1 (eastern pyramid, plaza A)
The second excavation area selected for the comparison was unit 9 at the top of structure 1, the eastern
pyramid in plaza A (fig. 6). Las Cuevas follows a typical ancient Maya site core plan, with large masonry
buildings arranged around a central plaza. The eastern and western pyramidal structures, at 10m and 11m
tall respectively, are the largest structures at the site. The significant aspect of this site consists in the fact
that the cave entrance chamber sits directly below the eastern structure 1. Excavation in 2012 focused on
structure 1 - the eastern structure. The eastern structure is often the focus for ceremonial activity and a burial
place for rulers, associated with cosmological concepts of life, rebirth, astronomical movements and divine
rule.
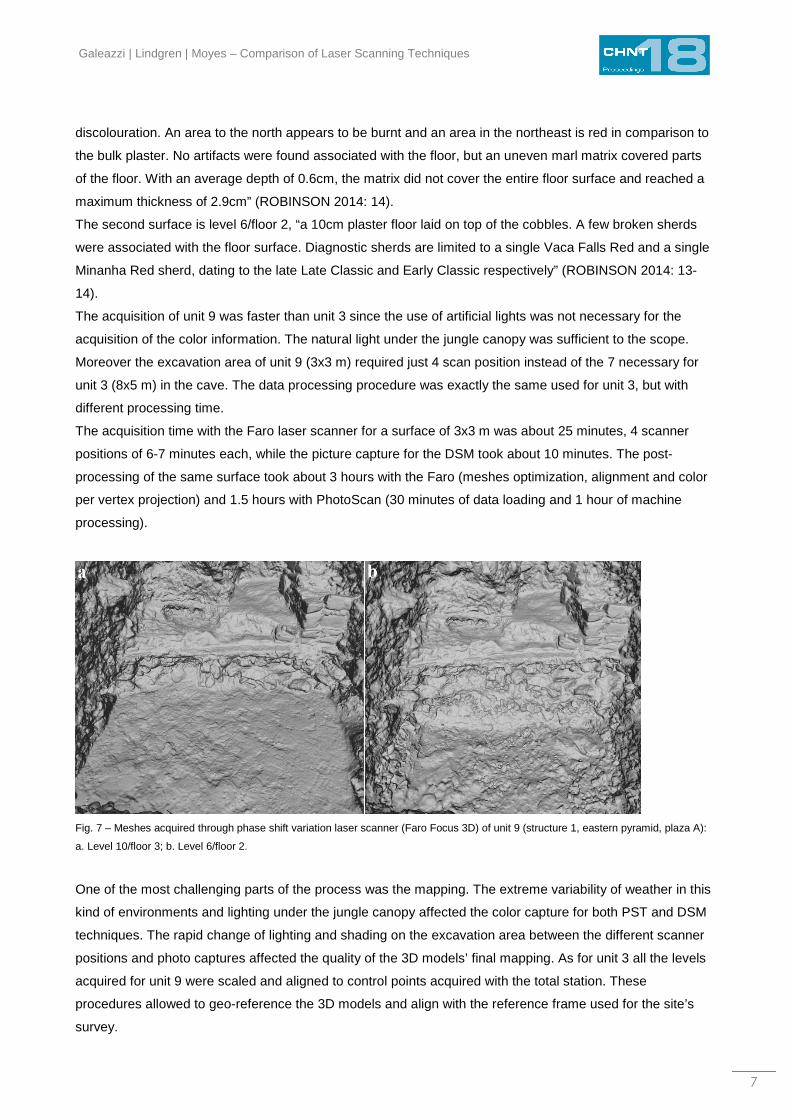
Fig. 6 – Structure 1 (eastern pyramid, plaza A), unit 9: 3D data acquisition through phase shift variation laser scanner (Faro Focus 3D).
Unit 9 is 3 by 3 m excavation located close to the center of the top of the structure. The unit was excavated
using cultural levels. Four plaster floors were found and the fifteen natural and cultural stratigraphic levels
encountered correspond to four major construction sequences, the sub floor construction fill, and post
abandonment site formation. The excavation reached a depth of 542 cm below ground surface (Robinson
2014: 12).
All the 15 excavated levels of unit 9 were acquired and preserved in three dimension and will be available for
future analysis and interpretations. Two of the most represantative levels of unit 9 acquired are level 10 (fig.
7a) and 6 (fig. 7b). The first one, level 10/floor 3, “consists of well-preserved plaster with distinct areas of
Galeazzi | Lindgren | Moyes – Comparison of Laser Scanning Techniques
7
discolouration. An area to the north appears to be burnt and an area in the northeast is red in comparison to
the bulk plaster. No artifacts were found associated with the floor, but an uneven marl matrix covered parts
of the floor. With an average depth of 0.6cm, the matrix did not cover the entire floor surface and reached a
maximum thickness of 2.9cm” (ROBINSON 2014: 14).
The second surface is level 6/floor 2, “a 10cm plaster floor laid on top of the cobbles. A few broken sherds
were associated with the floor surface. Diagnostic sherds are limited to a single Vaca Falls Red and a single
Minanha Red sherd, dating to the late Late Classic and Early Classic respectively” (ROBINSON 2014: 13-
14).
The acquisition of unit 9 was faster than unit 3 since the use of artificial lights was not necessary for the
acquisition of the color information. The natural light under the jungle canopy was sufficient to the scope.
Moreover the excavation area of unit 9 (3x3 m) required just 4 scan position instead of the 7 necessary for
unit 3 (8x5 m) in the cave. The data processing procedure was exactly the same used for unit 3, but with
different processing time.
The acquisition time with the Faro laser scanner for a surface of 3x3 m was about 25 minutes, 4 scanner
positions of 6-7 minutes each, while the picture capture for the DSM took about 10 minutes. The post-
processing of the same surface took about 3 hours with the Faro (meshes optimization, alignment and color
per vertex projection) and 1.5 hours with PhotoScan (30 minutes of data loading and 1 hour of machine
processing).
Fig. 7 – Meshes acquired through phase shift variation laser scanner (Faro Focus 3D) of unit 9 (structure 1, eastern pyramid, plaza A):
a. Level 10/floor 3; b. Level 6/floor 2.
One of the most challenging parts of the process was the mapping. The extreme variability of weather in this
kind of environments and lighting under the jungle canopy affected the color capture for both PST and DSM
techniques. The rapid change of lighting and shading on the excavation area between the different scanner
positions and photo captures affected the quality of the 3D models’ final mapping. As for unit 3 all the levels
acquired for unit 9 were scaled and aligned to control points acquired with the total station. These
procedures allowed to geo-reference the 3D models and align with the reference frame used for the site’s
survey.
International Conference on Cultural Heritage and New Technologies | Vienna | 2013
8
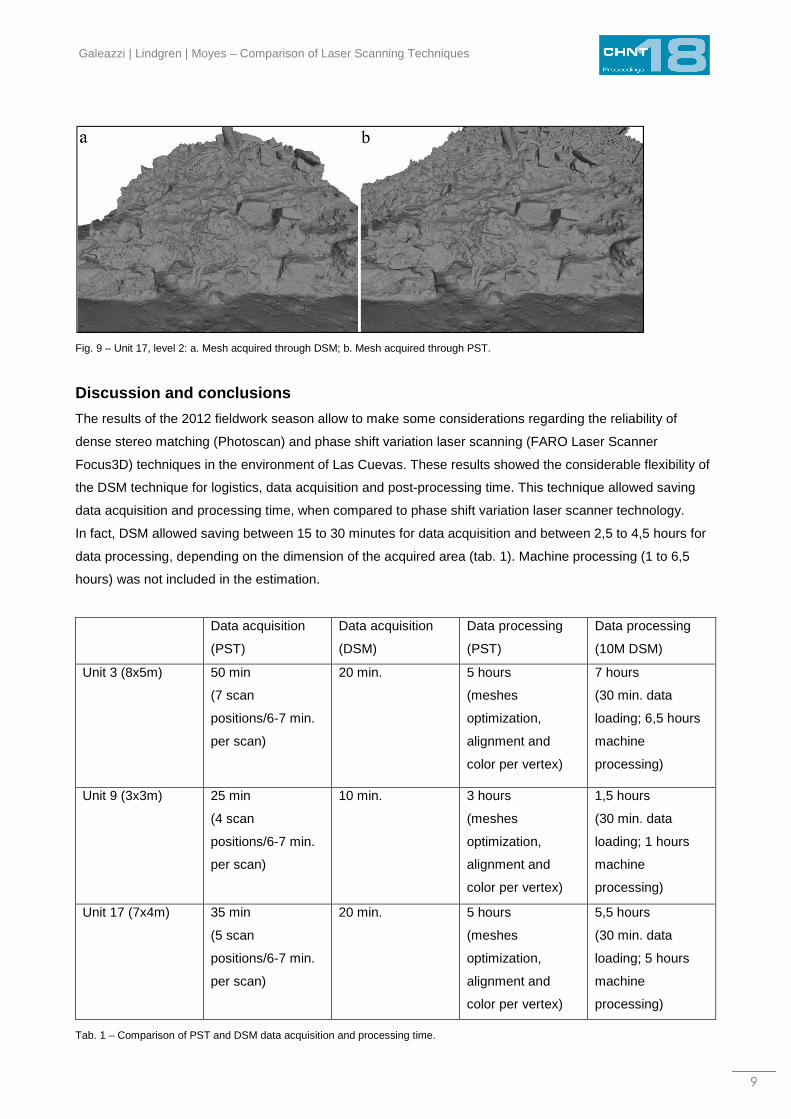
Ballcourt (unit 17)
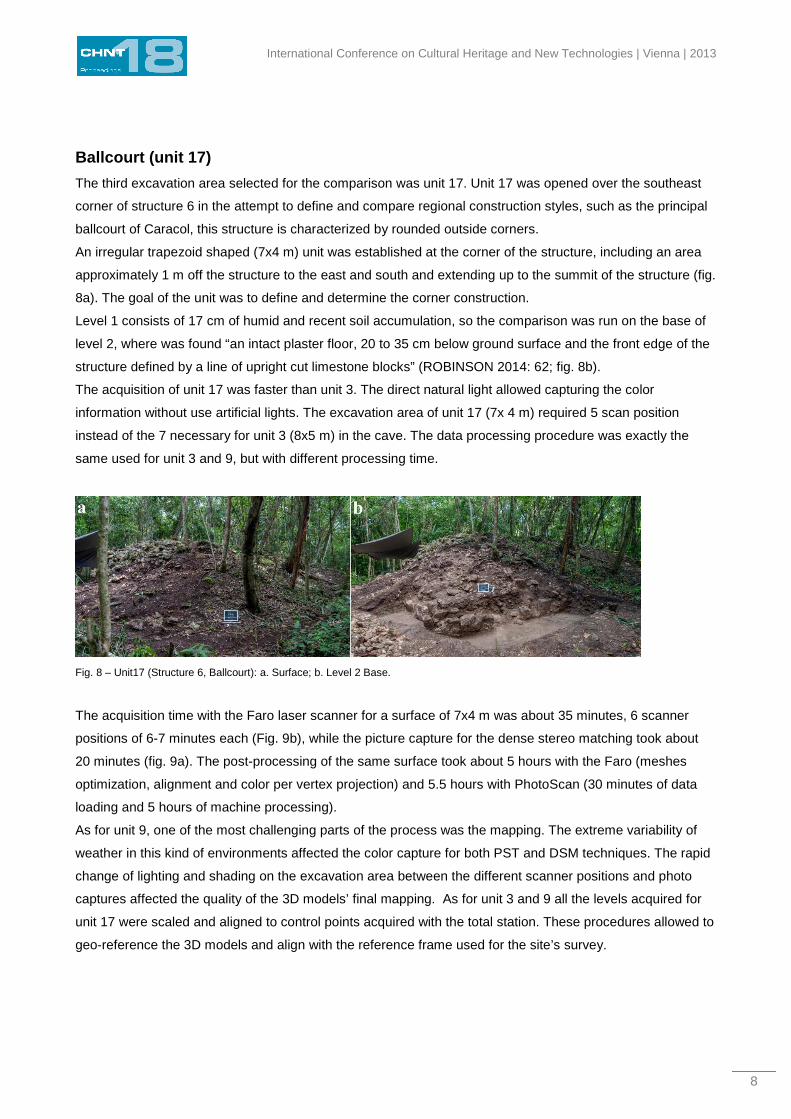
The third excavation area selected for the comparison was unit 17. Unit 17 was opened over the southeast
corner of structure 6 in the attempt to define and compare regional construction styles, such as the principal
ballcourt of Caracol, this structure is characterized by rounded outside corners.
An irregular trapezoid shaped (7x4 m) unit was established at the corner of the structure, including an area
approximately 1 m off the structure to the east and south and extending up to the summit of the structure (fig.
8a). The goal of the unit was to define and determine the corner construction.
Level 1 consists of 17 cm of humid and recent soil accumulation, so the comparison was run on the base of
level 2, where was found “an intact plaster floor, 20 to 35 cm below ground surface and the front edge of the
structure defined by a line of upright cut limestone blocks” (ROBINSON 2014: 62; fig. 8b).
The acquisition of unit 17 was faster than unit 3. The direct natural light allowed capturing the color
information without use artificial lights. The excavation area of unit 17 (7x 4 m) required 5 scan position
instead of the 7 necessary for unit 3 (8x5 m) in the cave. The data processing procedure was exactly the
same used for unit 3 and 9, but with different processing time.
Fig. 8 – Unit17 (Structure 6, Ballcourt): a. Surface; b. Level 2 Base.
The acquisition time with the Faro laser scanner for a surface of 7x4 m was about 35 minutes, 6 scanner
positions of 6-7 minutes each (Fig. 9b), while the picture capture for the dense stereo matching took about
20 minutes (fig. 9a). The post-processing of the same surface took about 5 hours with the Faro (meshes
optimization, alignment and color per vertex projection) and 5.5 hours with PhotoScan (30 minutes of data
loading and 5 hours of machine processing).
As for unit 9, one of the most challenging parts of the process was the mapping. The extreme variability of
weather in this kind of environments affected the color capture for both PST and DSM techniques. The rapid
change of lighting and shading on the excavation area between the different scanner positions and photo
captures affected the quality of the 3D models’ final mapping. As for unit 3 and 9 all the levels acquired for
unit 17 were scaled and aligned to control points acquired with the total station. These procedures allowed to
geo-reference the 3D models and align with the reference frame used for the site’s survey.
Galeazzi | Lindgren | Moyes – Comparison of Laser Scanning Techniques
9
Fig. 9 – Unit 17, level 2: a. Mesh acquired through DSM; b. Mesh acquired through PST.
Discussion and conclusions
The results of the 2012 fieldwork season allow to make some considerations regarding the reliability of
dense stereo matching (Photoscan) and phase shift variation laser scanning (FARO Laser Scanner
Focus3D) techniques in the environment of Las Cuevas. These results showed the considerable flexibility of
the DSM technique for logistics, data acquisition and post-processing time. This technique allowed saving
data acquisition and processing time, when compared to phase shift variation laser scanner technology.
In fact, DSM allowed saving between 15 to 30 minutes for data acquisition and between 2,5 to 4,5 hours for
data processing, depending on the dimension of the acquired area (tab. 1). Machine processing (1 to 6,5
hours) was not included in the estimation.
Data acquisition
(PST)
Data acquisition
(DSM)
Data processing
(PST)
Data processing
(10M DSM)
Unit 3 (8x5m) 50 min
(7 scan
positions/6-7 min.
per scan)
20 min. 5 hours
(meshes
optimization,
alignment and
color per vertex)
7 hours
(30 min. data
loading; 6,5 hours
machine
processing)
Unit 9 (3x3m) 25 min
(4 scan
positions/6-7 min.
per scan)
10 min. 3 hours
(meshes
optimization,
alignment and
color per vertex)
1,5 hours
(30 min. data
loading; 1 hours
machine
processing)
Unit 17 (7x4m) 35 min
(5 scan
positions/6-7 min.
per scan)
20 min. 5 hours
(meshes
optimization,
alignment and
color per vertex)
5,5 hours
(30 min. data
loading; 5 hours
machine
processing)
Tab. 1 – Comparison of PST and DSM data acquisition and processing time.
International Conference on Cultural Heritage and New Technologies | Vienna | 2013
10
Future improvements of this research will focus on a qualitative comparison of the stratigraphy acquired at
Las Cuevas using the two techniques (DSM and PST) for the understanding of the real value of these 3D
technology on site. In fact, according to Dellepiane et al. “although someone claims that dense stereo
reconstruction is a mature alternative to 3D scanning, no convincing comparison has been presented until
now. Recently, some initial effort has been made in this direction, but an overall methodological definition
and accurate data assessment are still missing (DELLEPIANE et al. 2012: 203)”.
Acknowledgments
We would like to acknowledge the support of Barbara Voorhies and Mark Robinson who supervised the
excavation areas during the 3D data acquisition. Our deepest gratitude goes to the excavation team of Las
Cuevas for the help and assistance during the entire duration of the project. In particular, we want to thank
Oubalit Akeryans, photographer of the project, for his support during the image acquisition campaign.
References BAYLE, P., BONDIOLI, L., MACCHIARELLI, R., MAZURIER, A., PUYMERAIL, L., VOLPATO, V., and ZANOLLI, C. (2011). Three-
dimensional imaging and quantitative characterization of human fossil remains - Examples from the NESPOS Database. In:
Macchiarelli, R. and Weniger, G. (eds.), Pleistocene Databases: Acquisition, Storing, Sharing. Wissenschaftliche Schriften des
Neanderthal Museums, Mettmann: 29-46.
Dellepiane, M., Dell’Unto, N., Callieri, M., Lindgren, S., and Scopigno, R. (2012). Archeological excavation monitoring using dense
stereo matching techniques. Journal of Cultural Heritage, 14 (3): 201-210.
DELL’UNTO, N, DI IOIA, M., GALEAZZI, F., MORO, A., and TRABASSI, B. (2008). I rilievi tridimensionali. In: Forte, M. (ed.), La villa di
Livia, un percorso di ricerca di archeologia virtuale. Erma di Bretschneider, Roma: 120-128
DONEUS, M., VERHOEVEN, G., FERA, M., BRIESE, C., KUCERA, M., and NEUBAUER, W. (2011). From deposit to point cloud. A
study of low-cost computer vision approaches for the straightforward documentation of archaeological excavation. XXIII International
CIPA Symposium on Geomatics, 6: 81-88.
DONEUS, M., and NEUBAUER, W. (2005) 3D laser scanners on archaeological excavations. In: Dequal, S. (ed.), Proceedings of the
XXth International Symposium CIPA, Torino 2005. International Archives of Photogrammetry, Remote Sensing and Spatial Information
Sciences, XXXVI-5/C34/1: 226-231.
DONEUS, M., and NEUBAUER, W. (2004). Digital recording of stratigraphic excavations in Magistrat der Stadt Wien, Referat
Kulturelles Erbe, and Stattarcha¨ologie Wien. In: Fischer-Ausserer, K., Borner, W., Goriany, M., and Karlhuber-Vockl, L. (eds.), Enter
the Past: The E-way into the Four Dimensions of Cultural Heritage, CAA2003. Oxford, UK: BAR International Series 1227: 113-116
FRATUS DE BALESTRINI, E., and GUERRA, F. (2011). New instruments for survey: On-line softwares for 3d recontruction from
images. International Archives of the Photogrammetry, Remote Sensing and Spatial Information Sciences, Vol. XXXVIII-5/W16.
GALEAZZI, F. (2008). La modellazione architettonica. La modellazione. In: Forte, M. (ed.), La villa di Livia, un percorso di ricerca di
archeologia virtuale. Erma di Bretschneider, Roma: 129-133
GÜTH, A. (2012). Using 3D scanning in the investigation of Upper Palaeolithic engravings: first results of a pilot study. Journal of
Archaeological Science, 39 (10): 3105-14.
LINDGREN, S., and GALEAZZI F. (2013). 3D Laser Scanning in Cave Environment: the Case of Las Cuevas, Belize. Acquisition of the
Cave System and Excavation Area. In: Addison, A. C., Guidi, De Luca, L., and Pescarin, S. (eds.), 2013 Digital Heritage International
Conference, 28 October – 1 November 2013, Marseille, France, Volume 1. Proceedings of the Institute of Electronical and Electronics
Engineers (IEEE): 219-222.
Galeazzi | Lindgren | Moyes – Comparison of Laser Scanning Techniques
11
MOYES, H. (2014). Introduction. In: Moyes, H., and Robinson, M. (eds.), 2th Report of the Las Cuevas Archaeological Reconnaissance
Project: The 2012 Field Season, in preparation: 1-8.
NEUBAUER, W., DONEUS, M., and RIEGL, J. 2005. Combined High Resolution Laser Scanning and Photogrammetrical
Documentation of the Pyramids at Giza. In: CIPA 2005, XX International Symposium Torino. International Cooperation to Save the
World’s Cultural Heritage (26 September-1 October 2005, Torino, Italy), http://cipa.icomos.org/fileadmin/template/doc/TURIN/470.pdf,
accessed November 10, 2013.
NIVEN, L., STEELE T. E., FINKE, H., GERNAT, T., and HUBLIN, J.-J. (2009). Virtual skeletons: using a structured light scanner to
create a 3D faunal comparative collection. Journal of Archaeological Science, 36 (9): 2018-23.
MCPHERRON, S. P., GERNAT, T., and HUBLIN, J.-J. (2009). Structured light scanning for high-resolution documentation of in situ
archaeological finds. Journal of Archaeological Science, 36: 19-24.
ROBINSON, M. (2014). Las Cuevas Surface Excavations. In: Moyes, H., and Robinson, M. (eds.), 2th Report of the Las Cuevas
Archaeological Reconnaissance Project: The 2012 Field Season, in preparation: 7-67.
VOORHIES, B. (2014). 2012 Excavations at Cave Unit 3. In: Moyes, H., and Robinson, M. (eds.), 2th Report of the Las Cuevas
Archaeological Reconnaissance Project: The 2012 Field Season, in preparation: 68-97.
ZIMMERMANN, N., and EßER, G. (2008). Showing the Invisible – Documentation and Research on the Roman Domitilla Catacomb,
Based on Image Laser Scanning and 3D Modelling. In: Posluschny, A., Lambers, K., and Herzog, I. (eds.), Layers of Perception.
Proceedings of the 35th International Conference on Computer Applications and Quantitative Methods in Archaeology (CAA). Berlin,
Germany, April 2–6, 2007. Kolloquien zur Vor- und Frühgeschichte 10, Bonn: 54-64.
Imprint:
Proceedings of the 18th International Conference on Cultural Heritage and New Technologies 2013 (CHNT 18, 2013)
Vienna 2014
http://www.chnt.at/proceedings-chnt-18/
ISBN 978-3-200-03676-5
Editor/Publisher: Museen der Stadt Wien – Stadtarchäologie
Editorial Team: Wolfgang Börner, Susanne Uhlirz
The editor’s office is not responsible for the linguistic correctness of the manuscripts.
Authors are responsible for the contents and copyrights of the illustrations/photographs.