community and business advancement. amanda d’angelo, manager, compliance & regulatory...
TRANSCRIPT
CONTRACTOR REPORTING TRAINING
COMMUNITY AND BUSINESS ADVANCEMENT

Welcome & Meeting PurposeAmanda D’Angelo, Manager, Compliance & Regulatory Performance

Contractor Reporting Training
Welcome Introduction of Community &
Business Advancement (CBA) staff
Purpose of Meeting Data driven outcomes Data quality Advocacy/trending

Overview and Changes
Cathy Backos, Program Manager, Caregiver and Social Services

Current Elements of the CPR Tool
Logic Model
Developed with input from contractors for each specific service
Road map to describe the many elements of a specific program
Identified long-term goal for each specific service
Shapes the planning, management, evaluation and communication of the specific program to achieve the long-term goal

Long Term Goal
Long range broad perspective outcome that the specific program is designed to accomplish
Example: Adult Day Health Service LTG To promote the safety, health and well-being of older adults
with dementia, or adults with disabilities, and their caregivers/families, to enable the caregivers/ families to provide care for the care receiver at home in the community for a longer period of time, preventing early institutional placement.
Current Elements of the CPR Tool (cont’d)

Current Elements of the CPR Tool (cont’d)
Outcomes
Important events to accomplish to achieve the long term goal
Reflect AAA 1-B’s programmatic and targeting priorities
Short Term – Measurable change over one year or less
Intermediate – Measurable change over three years
Pre-determined and included on the worksheet
Mandatory (cannot be modified) and optional

Current Elements of the CPR Tool (cont’d)
Outputs
Pre-selected measurable data from the logic model to be collected
Mandatory for each contractor for that specific service
Reported on quarterly
Result from action steps, and advance progress toward the outcomes and long-term goal
Current Elements of the CPR Tool (cont’d)
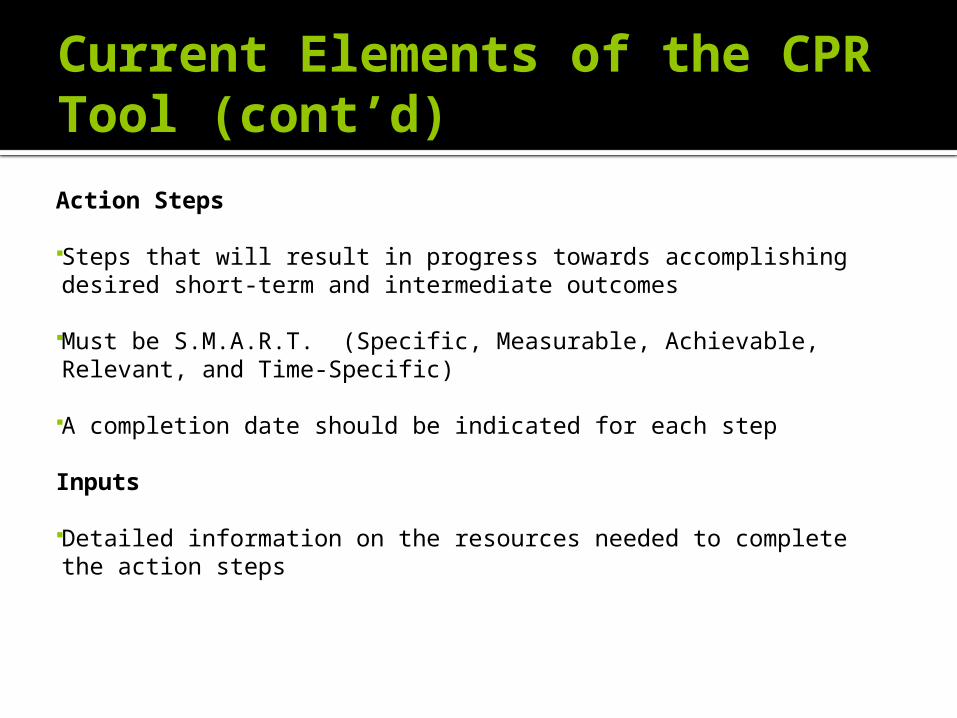
Action Steps
Steps that will result in progress towards accomplishing desired short-term and intermediate outcomes
Must be S.M.A.R.T. (Specific, Measurable, Achievable, Relevant, and Time-Specific)
A completion date should be indicated for each step
Inputs
Detailed information on the resources needed to complete the action steps

Evaluation of First Year Reporting on CPR Tool
Benefits and Strengths Identified
All reporting tools are located in one document
Mandatory outputs and outcomes measured across contractors for each individual service
Improved data collection process on effectiveness of each contracted service
Improved tracking and reporting for targeting priorities

Evaluation of First Year Reporting on CPR Tool (cont’d)
Problems and Reporting Issues Identified:
Mandatory and optional outputs and outcomes – too many to measure
Often incorrect reporting of outputs and outcomes
Outputs and outcomes data reported is not always measurable or relevant
Information listed for some outputs are actually action steps

Recommendations to Improve Data Reporting on CPR Tool
Recommendations:
Training & review of CPR tool reporting for contractors
Remove optional outputs and outcomes to simplify tool
Maintain mandatory outputs and outcomes for the three year contract cycle
Revise mandatory outcomes for some contract services for improved measurement of outcome results
Revise action steps yearly as needed to reach desired outputs and outcomes

AAA 1-B Tracking Tool
Melissa Maxwell, Contracts and DSP Coordinator

Example of AAA 1-B Tracking Tool(Internal Document)
Example of AAA 1-B Internal Tool KEY
No progress reported
Partially Complete Complete
OUTCOMES
110% increase in 'new' participants utilize the service%
Q1 Q2 Q3 Q4Rotten Orange's Pink Lady Baby Blues
Average at Year End #DIV/0!
285% of participants report being 'satisfied' or 'very satisfied' with the service
%
Rotten Orange's Pink Lady Baby Blues
Average at Year End #DIV/0!
3Number of participants in targeted priority/underserved population is at least double their proportion in community
%
Rotten Orange's Pink Lady Baby Blues
Average at Year End

ONE YEAR CONTRACTOR PLANNING AND REPORTING WORKSHEET – PAGE ONE
INPUT ACTION STEPS OUTPUTS OUTCOMES – SHORT TERM
OUTCOMES-INTERMEDIATE
Add specificity: Funding: AAA1-B, OSA, MDCH, Grants, Donations Staff & Volunteers: Program Managers, Support Staff, Supervisors, Interns Data: Census, Surveys & Assessments Community Partners: OSA, MDCH, Contractors, Vendors, Stakeholders, Senior Centers Physical Space: AAA 1-B offices, senior centers, senior living facilities, hospitals Policies & Procedures: OSA, MDCH, Internal, Grant Specific Training: Person Centered Training, HIPAA, Aging Network Technology/Equipment: Computers, Phone, Fax, Copier
1) Develop and distribute program flyers to at least 2 churches throughout the community each quarter
2) Hold/participate in a minimum of 6 outreach events throughout the year
3) First Quarter - revise evaluation tool to include question that service has helped them remain living independently
4) First Quarter - develop a memo requesting donations from participants utilizing the service; Second-Fourth Quarter – mail donation memo to participants two times within the fiscal year
5) Schedule and hold 4 presentations in low income areas throughout the year
6) Schedule and meet with representatives from local hospital and homecare agency to share information about programs and try to establish a process for referral
1) # of new participants 2) # of evaluations distributed & received;
3) Amount of donations received
4) # of outreach events in low income areas
5) # of participants in attendance at outreach events in low income areas
1) 10% increase in 'new' participants utilize the service
2) 85% of participants report being 'satisfied' or 'very satisfied' with the service
3) Number of participants in poverty/underserved populations are at least double their proportion in the community
1) 85% of participants report that the service helps/has helped them remain living independently in the community
2) 20% increase in donations received
3) Three new community partners identified as a referral source to the program

Outcomes Report Filled Out
One Year CONTRACTOR PLANNING AND REPORTING WORKSHEET - Page Two QUARTERLY PROGRESS REPORT
ROTTEN ORANGES PINK LADY BABY BLUES
OUTCOMES – SHORT TERM Short term Outcomes Short Term Outcomes Short Term Outcomes
1) 10% increase in 'new' participants utilize the service. 2) 85% of participants report being 'satisfied' or 'very satisfied' with the service. 3) Number of participants in poverty/underserved populations are at least double their proportion in the community.
FIRST
1) First quarter is usually slow, we expect second quarter will have many more. 2) Many people will recommend us to their friends. 3) 0
1) 2) 3)
1) We had a really good event, it was well attended.
SECOND
1) Second quarter is busier than the first. 2) We did not have any complaints this quarter. 3) Three African Americans served.
1) 10% new people 2) Survey went out in February 3) 25%
Progress
THIRD
1) Four new people served 2) Survey sent out, expect results to be reported in fourth quarter 3) One additional African Americans served.
1) Advertising in hopes to get more new clients. 2) Sent out 40 surveys, received 12 responses. 3) No change from second quarter.
1) 12%
FOURTH
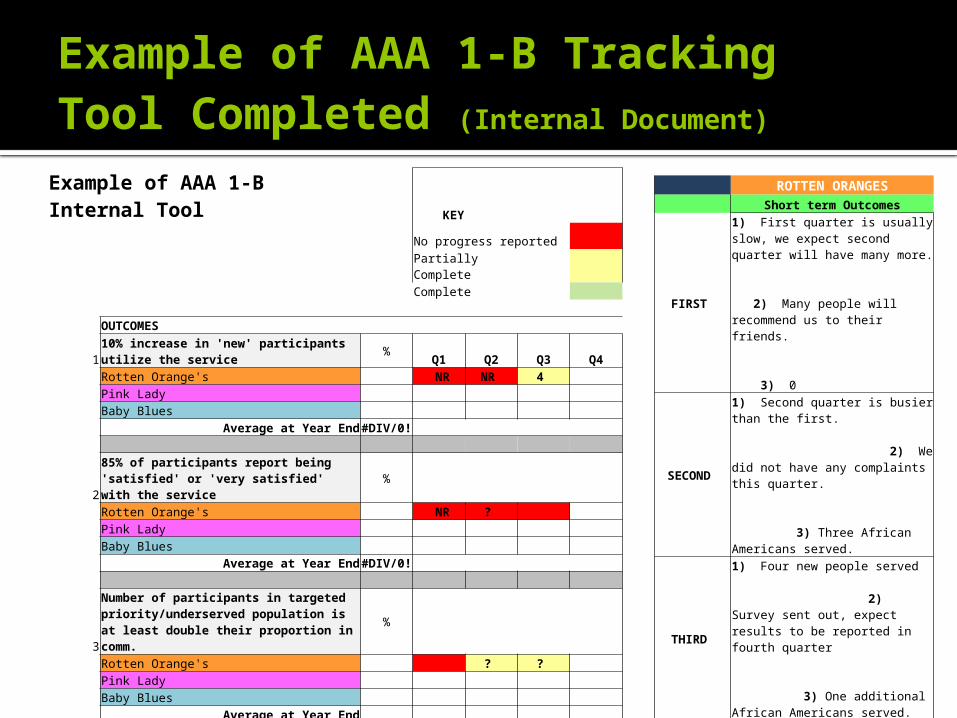
Example of AAA 1-B Tracking Tool Completed (Internal Document)
Example of AAA 1-B Internal Tool KEY
No progress reported
Partially Complete Complete
OUTCOMES
110% increase in 'new' participants utilize the service%
Q1 Q2 Q3 Q4Rotten Orange's NR NR 4 Pink Lady Baby Blues
Average at Year End #DIV/0!
285% of participants report being 'satisfied' or 'very satisfied' with the service
%
Rotten Orange's NR ? Pink Lady Baby Blues
Average at Year End #DIV/0!
3
Number of participants in targeted priority/underserved population is at least double their proportion in comm.
%
Rotten Orange's ? ? Pink Lady Baby Blues
Average at Year End
ROTTEN ORANGES
Short term Outcomes
FIRST
1) First quarter is usually slow, we expect second quarter will have many more. 2) Many people will recommend us to their friends. 3) 0
SECOND
1) Second quarter is busier than the first. 2) We did not have any complaints this quarter. 3) Three African Americans served.
THIRD
1) Four new people served 2) Survey sent out, expect results to be reported in fourth quarter 3) One additional African Americans served.
FOURTH

How to ReportKristin Wilson, Program Manager, Nutrition and Wellness Services

Helpful Hints to Accurate Reporting
Every quarter, report the same number of action steps, outputs and outcomes as outlined on the ‘Contractor Planning and Reporting Worksheet –page 1’. Example: If you have 6
action steps you should be reporting the action that occurred for each of the 6 steps.
Numbers in the update should correlate with those listed in the plan
Action Steps Outputs
1) Hold 2 presentations each quarter; 2) Update evaluation tool and disseminate quarterly; 3) Have 3 staff attend person centered training; 4) Promote volunteer opportunities every quarter; 5) By April 1, 2014 set up Facebook and Twitter account to promote services/events; 6) Between April 1, 2014 –September 30, 2014 post new information on Facebook and Twitter at least once a week
1) # of new participants 2) Number of second
meals served3) Number of Facebook
Friends 4) Number of Tweets/Re-
Tweets
First Quarter Update
1) Presentations held at St. Clair COA & MCCSA; 2) Evaluations developed –mailing in 2nd quarter; 3) No training offered; 4) Set up an account on volunteermatch.com and posted volunteer opportunities; 5) Facebook account established. Twitter account will active in 2nd quarter; 6) No activity
1) 1222) 3453) 04) 0
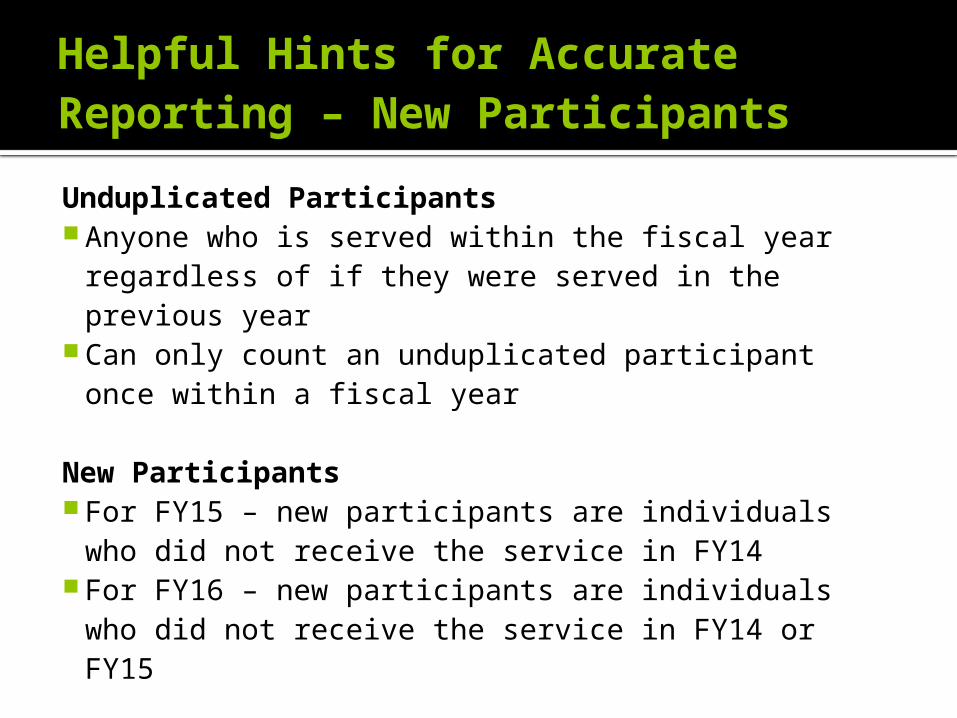
Helpful Hints for Accurate Reporting – New Participants
Unduplicated Participants Anyone who is served within the fiscal year
regardless of if they were served in the previous year
Can only count an unduplicated participant once within a fiscal year
New Participants For FY15 – new participants are individuals who
did not receive the service in FY14 For FY16 – new participants are individuals who
did not receive the service in FY14 or FY15

Helpful Hints for Accurate Reporting – Baselines and Percents
Baselines are being established this current fiscal year –FY14
Outcome – 10% increase in new
participants
Target/Goal = number new of participants that you would need to reach within the fiscal year
Outcome – Short Term10% increase in new participants
Baseline = Unduplicated number of participants served in FY 14
Target/Goal = 10% increase from total number of unduplicated participants in FY 14
1500 unduplicated participants in FY14
150 new participants to be served in FY15

Helpful Hints for Accurate Reporting – Baselines and Percents Continued
Percent equals number of new participants (per quarter) divided by the target/goal x 100%
Example: 36 divided by 150 = .24 x 100 = 24%
Outcome – 10%
increase in new
participants
Target/Goal = 150 new participants *
*10% increase from total number of unduplicated participants in FY14
Q1: 36 new participants
Q2: 23 new participants
Q3: 44 new participants
Q4: 48 new participants
Q1: 24%
Q2: 15%
Q3: 29%
Q4: 32%
Please note: the total percents (Q1-Q4) by the end of the fiscal year should be equal to or greater than 100% in order to meet the outcome of a 10% increase in new participants

ONE YEAR CONTRACTOR PLANNING AND REPORTING WORKSHEET – PAGE ONE
INPUT ACTION STEPS OUTPUTS OUTCOMES – SHORT TERM
OUTCOMES-INTERMEDIATE
Add specificity: Funding: AAA1-B, OSA, MDCH, Grants, Donations Staff & Volunteers: Program Managers, Support Staff, Supervisors, Interns Data: Census, Surveys & Assessments Community Partners: OSA, MDCH, Contractors, Vendors, Stakeholders, Senior Centers Physical Space: AAA 1-B offices, senior centers, senior living facilities, hospitals Policies & Procedures: OSA, MDCH, Internal, Grant Specific Training: Person Centered Training, HIPAA, Aging Network Technology/Equipment: Computers, Phone, Fax, Copier
1) Develop and distribute program flyers to at least 2 churches throughout the community each quarter
2) Hold/participate in a minimum of 6 outreach events throughout the year
3) First Quarter - revise evaluation tool to include question that service has helped them remain living independently
4) First Quarter - develop a memo requesting donations from participants utilizing the service; Second-Fourth Quarter – mail donation memo to participants two times within the fiscal year
5) Schedule and hold 4 presentations in low income areas throughout the year
6) Schedule and meet with representatives from local hospital and homecare agency to share information about programs and try to establish a process for referral
1) # of new participants 2) # of evaluations distributed & received;
3) Amount of donations received
4) # of outreach events in low income areas
5) # of participants in attendance at outreach events in low income areas
1) 10% increase in 'new' participants utilize the service
2) 85% of participants report being 'satisfied' or 'very satisfied' with the service
3) Number of participants in poverty/underserved populations are at least double their proportion in the community
1) 85% of participants report that the service helps/has helped them remain living independently in the community
2) 20% increase in donations received
3) Three new community partners identified as a referral source to the program

ONE YEAR CONTRACTOR PLANNING AND REPORTING WORKSHEET – PAGE TWO
ACTION STEPS OUTPUTS OUTCOMES – SHORT TERM OUTCOMES-INTERMEDIATE
1) 24% 2) 0 - surveys to be mailed 2nd
quarter 3) 50
FIRST
THIRD
SECOND
FOURTH
1) Distributed program info and met with program leaders at St. Mary's and Our Lady of the Lakes; 2) Participated as a vendor at the Happy Birthday 65 presentation and Senior Fun Fest; 3) Surveys mailed out to participants who received services in the first quarter; 4) Donation memo provided to participants after service is rendered; 5) 2 presentations held at the Bowen Center and Hazel Park Towers; 6) Contacted St. Joe's in Pontiac and scheduled a meeting for the 3rd quarter (April 30th)
1) Flyers were developed and distributed to 5 churches in the community - Shrine of the Little Flower & St. Dennis. Met with representative from each parish to talk about the programs; 2) Vendor at the AAA 1-B caregiver expo. Planning 2 events for the 2nd quarter; 3) Revised evaluation tool - will begin distributing in 2nd quarter; 4) Developed a sliding fee scale for donation and memo to give to participants making them aware of the opportunity to donate; 5) 2 presentations scheduled to be held in 2nd quarter (Hazel Park and Pontiac); 6) No progress - will happen in 2nd/3rd quarter
1) 36 new participants 2) 0 3) None 4) 1 5) 0
1) 23 new participants 2) 200 evaluations distributed/125 received 3) $100 4) 4 5) 57
1) 15% 2) 91% report being satisfied/very satisfied 3) 75
1) 0 - surveys to be mailed 2nd quarter 2) 03) None at this time
1) 93%2) 17%3) None at this time
1) Distributed program information to Lakecrest Baptist Church & Franklin Road Church of Christ; 2) Vendor at Senior Power Day & Health Fair at St. Joe’s Senior ER; 3) Surveys mailed out to participants who received services in the second quarter; 4) Donation memo and envelopes mailed to participants after service is rendered; 5) 2 presentations scheduled for 4th quarter; 6) Met with social worker at St. Joe’s who expressed interest in developing a referral process. Currently working on a referral form that can be used by social workers/discharge planners at the hospital when service is needed. Hope to finalize form in 4th quarter.
1) 44 new participants2) 250 evaluations distributed/120 received 3) $250 4) 2 5) 0
1) Met with parish leaders from Holy Nazarene and Holy Calvary Church will be providing info to include in parish newsletter; 2) Vendor at St. Joseph Hospital fall prevention event; 3) Surveys mailed out to participants served in 3rd quarter; 4) Donation memo provided to participants after service is rendered; 5) Presentation held at Oak Park Senior Apts. & Southfield Public Library; 6) Was unable to meet with a homecare agency, but continue to work with St. Joe’s and have finalized referral pad. Piloting process in October
1) 48 new participants2) 150 evaluations distributed/60 received 3) $300 4) 3 5) 30
1) 29%2) 87% satisfied/very satisfied3) 44
1) 32%2) 88% report being satisfied/very satisfied3) 56
1) 86%2) 42%3) In progress – one potential partner
1) 88%2) 50%3) One

Action Steps Outputs Outcomes – short term
Outcomes - intermediate
1) Develop & distribute program flyers to at least 2 churches throughout the community each quarter; 2) Hold/participate in a minimum of 6 outreach events throughout the year; 3) 1st quarter – revise evaluation tool to include question that service has helped remain independently; 4) 1st quarter -Develop a memo requesting donations from participants utilizing service; 2nd-4th quarter mail/distribute memo to participants; 5) Schedule & hold 4 presentations to low income areas throughout the year; 6) Schedule/meet w/ representatives from local hospital & homecare agency to share info about programs and establish a referral process
1) # of new participants2) # of evaluations
distributed & received
3) Amount of donations received
4) # of outreach events in low income areas
5) # of participants in attendance at outreach events in low income areas
1) 10% increase in new participants utilizing the service2) 85% of participants report being ‘satisfied’ or ‘very satisfied’ with the service3) Number of participants in poverty are at least double their proportion in the community
1) 85% of participants report that the service helps them to remain living independently in the community2) 20% increase in donations received3) Three new community partners identified as a referral source to the program
First Quarter Update
1) Flyers were developed and distributed to 2 churches in the community - Shrine of the Little Flower & St. Dennis. Met with representative from each parish to talk about the programs; 2) Vendor at the AAA 1-B caregiver expo. Planning 2 events for the 2nd quarter; 3) Revised evaluation tool - will begin distributing in 2nd quarter; 4) Developed a sliding fee scale for donation and memo to give to participants making them aware of the opportunity to donate; 5) 2 presentations scheduled to be held in 2nd quarter (Hazel Park and Pontiac); 6) No progress - will happen in 2nd/3rd quarter
1) 36 new participants2) 03) None4) 15) 0
1) 24%2) 0 – surveys to be mailed in 2nd quarter3) 50
1) 02) 03) None at this time

Questions????
Will the new forms have a place for baselines to be documented so we have that information? - We are still trying to determine if this information will fit. Stay tuned…
Provider was previously told to use FY13 as a baseline for FY14. - To maintain consistency across providers we are now using FY14 as baseline numbers.

Questions????
If in FY14 we are establishing a baseline, how can we show a percent increase in an outcome when reporting in the 4th quarter of FY14? - You won’t be reporting an increase because you are establishing your baseline this year. If you are to report number of new participants this year, then you would report all unduplicated clients per quarter as new for FY14.
How will I know which outputs/outcomes are mandatory and which are optional? - We are taking out all of the optional so all you will see on the forms are the mandatory outputs/outcomes.

Questions????
If we have an intermediate outcome of increasing something by X% (i.e. 20% increase in participants) do we have to increase by 20% each year ? No, the intermediate outcome is to be accomplished by the end of FY16. We encourage you to report your progress along the way, but the goal would be to reach the increase by the end of FY16.

Questions???
Will we be getting a new tool for FY15? – Yes, we are in the process of making tweaks and tools will either be emailed out or you will receive a link to the AAA 1-B website to find the forms.
Do we use the new form to complete the 4th quarter report for this year (FY14)? – No, use the form you are currently using to report 4th quarter. The new tools will be sent out and used for FY15.

Thank you for participating!
Everyone dismissed except Nutrition Providers

Nutrition Outcomes Reporting and ChangesKristin Wilson, Program Manager, Nutrition and Wellness Services

Changes for HDM
Nutrition Service Chart & Nutrition Education (annual) To be completed prior to the start of the fiscal year
Targeting Plan (annual) To be completed prior to the start of the fiscal year
Plan & Progress Outputs - Changes to the outputs incorporate some data
from the Quarterly HDM Outcomes and Values report Outcomes -Changes to the outcomes incorporate some
data to be used for the Silver Key Campaign
Instructions
Nutrition Service Chart
Targeting Plan
Plan & Progress
Q1 Narrative
Q2 Narrative
Q3 Narrative
Q4 Narrative

Changes for HDM Continued
Quarterly Narrative & Waitlist Report
No Change – report quarterly
HDM Outcomes & Values report Removed Some outputs/outcomes were
incorporated onto the plan and progress tool

Plan & Progress Tool - HDMOutputs Short Term
OutcomesIntermediate Outcomes
1) Number of new participants;
2) # of hours contributed by HDM program volunteers;
3) # of participants who report eating fewer than two meals per day at initial intake/assessment;
4) # of participants who report eating fewer than 2 meals per day at 6-month re-assessment
1) 10% increase in new participants;
2) 80% of participants report that receiving meals allows them to remain in their home;
3) Number of participants in underserved populations are at least double their proportion in the community
1) 20% increase in donations received;
2) 25% increase in the number of meals served
3) Meals delivered within 24 hours of request

Changes for Congregate Meals
Nutrition Service Chart (annual) To be completed prior to the start of the fiscal year
Targeting Plan (annual) To be completed prior to the start of the fiscal year
Plan & Progress Outputs – Minor changes Outcomes –Changes that make outcomes more
measurable
Quarterly Narrative and Waitlist Report No change
Instructions
Nutrition Service Chart
Targeting Plan
Plan & Progress
Q1 Narrative
Q2 Narrative
Q3 Narrative
Q4 Narrative

Plan & Progress Tool - CongregateOutputs Short Term
OutcomesIntermediate Outcomes
1) Number of new participants;
2) Number of participants in targeted priority group served;
3) Number of culturally targeted theme meals;
4) # of evaluations distributed;
5) # of evaluations received;
6) # of hours contributed/"worked" by volunteers
1) Number of participants in targeted priority/underserved groups are double their proportion in the community;
2) a minimum of one new source of additional funding is obtained;
3) 10% increase in number of theme/and or culturally appropriate meals served
1) 20% increase in donations received;
2) 85% of participants report being 'satisfied' or 'very satisfied' with the menu options;
3) 20% increase in congregate participants

Questions????
Clarification on 24 hour meal deliver; this is not really an outcome. – the expectation is that meals will be delivered next business day – providers might want to consider a policy that outlines this more specifically. When reporting this we are looking for ‘yes’ or ‘no’ response. We will move from the outcomes to the waitlist report.
Is the 20% increase in congregate for ‘new’ participants or any/all participants? - 20% increase in overall participants