communication with less hardware - core · communication with less hardware ambily joseph, ... in...
TRANSCRIPT

Communication with less hardware
Ambily Joseph, Jaini Sara Babu, K. P. Soman Centre for Computational Engineering and Networking,
Amrita Vishwa Vidyapeetham, Coimbatore, India [email protected], [email protected]
Abstract
Software Defined Radio is an emerging technology in the field of communication. In this paper, two applications based on SDR are discussed. First we discuss the weather satellite image decoding using a SDR receiver, FUNcube Dongle (FCD). Second, Sudden Ionospheric Disturbances (SID)are studied with Software Defined Radio (SDR) and Gnu radio framework using VLF signal captured from Indian Navy Station VTX3 that transmits at 18.2 kHz. Both these applications require very less hardware and hence they are very much cost effective.
1. Introduction Traditional RF receivers or Superheterodyne
receivers are the most widely used architecture in wireless tranceivers so far. But its adaptation to different applications is difficult since the hardware module need to be re-designed. While in case of SDR receivers, with same software we can do different applications, we just need to change the software program alone. So we prefer SDR receivers over traditional RF receivers.
Satellite image decoding and VLF reception requires a good antenna, a receiver and an efficient software systems. In satellite image decoding, to receive signals from orbiting weather satellites, a receiver and an antenna capable of receiving a signal frequency of 137 MHz is needed. This is satellite frequency range of many orbiting satellites such as NOAA (National Oceanic and Atmospheric Administration) satellites. The receiver is tuned to this frequency and signal is received using antenna. Then the signal from the receiver is fed into the input of the computer sound card, where it is saved as an audio file (usually in WAV format) and then decoded into an image using computer software. Since the orbiting satellites are constantly moving, there is a need of satellite program which will tell us when they pass overhead.
In SID receiver, the VLF signals of 18.2 kHz
being transmitted from INS station (call sign VTX3) at
South Vijayanarayanam village, India. These signals bounce off from earth’s ionosphere after their transmission. It can be picked up by VLF receivers kept at anywhere. An SID antenna, which is basically a loop antenna is used here to pick up the reflected radio signals. Antenna is connected to the souncard of the PC which does the ADC conversion. Using software signal-processing techniques in Gnu radio framework the capured signal is anlaysed and studied.
2. Weather Satellite Decoding
2.1 Quadrifilar Helix Antennas
Weather satellites are polar orbiting satellites i.e. constantly moving satellites. Circularly polarized antennas are required for the signal reception from these satellites. These antennas have same directivity in all the directions. One such antenna is Quadrifilar Helix Antenna (QFH). The Quadrifilar antenna comprises two bifilar helical loops oriented in a mutually orthogonal relation on a common axis. The terminals of each loop are fed 180° out of phase, and the currents in the two loops are in phase quadrature (90°out of phase).
2.2 FUNcube Dongle
FUNcube Dongle (FCD) is a low cost SDR receiver used by many amateur radio enthusiasts. An FCD is designed to connect directly between the antenna feed and PC and, by the use of appropriate software, enable the display and dissemination of the received telemetry. So the QFH antenna is connected to the SMA port of FCD and the USB port of FCD is connected to computer. When FCD is connected to PC, it will act as a soundcard.
2.3 Processing
A satellite tracking program like Orbitron is used to choose the weather satellite which appears above the horizon. When a satellite is flying above our location, the signal from the satellite is received using QFH
Ambily Joseph et al ,Int.J.Computer Technology & Applications,Vol 3 (4), 1528-1531
IJCTA | July-August 2012 Available [email protected]
1528
ISSN:2229-6093

antenna which in turn connected to the FCD. The FCD interface software drives the FCD and helps in Doppler frequency control. The signal from FCD is FM demodulated and recorded as wavefiles using HDSDR (High Definition Software Defined Radio) software. It also displays the waterfall and spectrum graphs. The recorded audio wavefiles are converted to image using WXtoImg software. Different image enhancements like MCIR (Map Coloured Infrared), sea surface temperature, thermal etc. are done and the map analysis is performed.
3. SID SDR Receiver 3.1. Transmission Station In this experiment, VLF signals are used as reference signal to measure the ionospheric changes. Here, we mainly focus the VLF signals of 18.2 kHz being transmitted from INS station (call sign VTX3) at South Vijayanarayanam village, 8°25'59.88"N 77°48'00"E. The station was commissioned as INS KATTABOMMAN on 20 October, 1990. Table 1 gives an overall information about the Indian Navy Station VTX. Table 1 : INS station details ID/Call Sign VTX
Location 08°23'N 77°45'E
Frequency allocations 16 KHz (VTX1) / 17 KHz (VTX2) / 18.2 KHz (VTX3) / 19.2 KHz (VTX4)
Locator MJ88vj
Modulation MSK
Mode Active
3.2. SID Antenna
Building an antenna is the most important part of an SID SDR receiver. Either a small antenna (less than 1m wide) with lots of wraps or a large one with less number of turns is used for this. Mostly larger antennas are preferred because they have more sensitivity than smaller ones. A 1 meter framed square loop antenna of PVC cross-beam structure is used for this experiment. Antenna loop is has 25 turns and is
made from single stranded insulated magnet wire of 1.1 mm thickness.
3.3 GRC flow graph description Signal received from SID antenna is directly plugged into the MIC input of 48 kHz sound card of the PC. Once the signal arrives at the sound card it is split into several directions. One is copied to the speaker through an Audio Sink. Signal is also given to FIR filter blocks to extract a particular channel. For example, VTX3 INS station transmits at a centre frequency of 18.2 kHz. Next, RMS block is used to calculate the root mean square power of the channel extracted. This data is then send to an external file. The channel is also demodulated using a GMSK de-modulator. This result is given to another external file. Since we are building the flow graph in GRC we can add blocks and extract other VLF channels also. To display the signal, RMS power output can be given to a Scope block. We can also display an FFT of the entire spectrum. Data written to the external files are then finally read out to a text file to plot the SID graphs. 4. Results
4.1 Satellite Image Analysis
Satellite signal is received using FCD with the help of QFH antenna and it is demodulated with the HDSDR spectrum analyzer that displays the spectrum of the received signal. Here NOAA 18 satellite is tracked and the signal is received. The spectrum display of NOAA-19(137.1MHz) satellite signal is shown in Figure 1.
Figure 1: HDSDR spectrum display of NOAA-19 signal
The satellite signal is FM demodulated and it is recorded as wavefiles. Now satellite image decoding is done using WXtoImg software. The recorded audio wavefiles are opened in WXtoImg and thus converted
Ambily Joseph et al ,Int.J.Computer Technology & Applications,Vol 3 (4), 1528-1531
IJCTA | July-August 2012 Available [email protected]
1529
ISSN:2229-6093
to the image. Different enhancements can be done on this image. Some of them are MCIR, Sea surface temperature, thermal etc. MCIR (Map Coloured Infrared) colours the NOAA sensor 4 IR image using a map to colour the sea blue and land green. Sea surface temperature enhancement creates a false colour image from NOAA APT (Automatic Picture Transmission) images based on sea surface temperature. and land appears black. Thermal enhancement produces a false colour image from NOAA APT images based on temperature. These image enhancements are shown on the NOAA-19 image of southern part of India which is given Figure 2:
(a) (b)
(c)
Figure 2: (a) MCIR enhancement (b) Sea surface temperature enhancement (c) Thermal enhancement
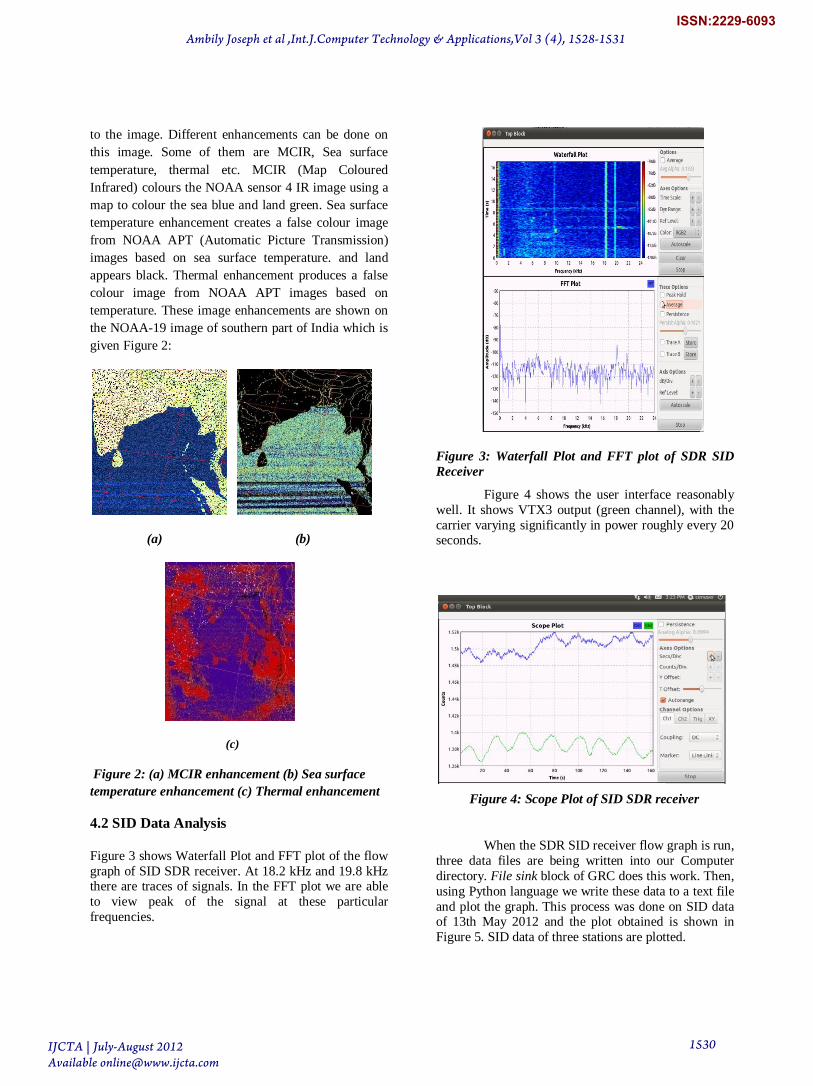
4.2 SID Data Analysis Figure 3 shows Waterfall Plot and FFT plot of the flow graph of SID SDR receiver. At 18.2 kHz and 19.8 kHz there are traces of signals. In the FFT plot we are able to view peak of the signal at these particular frequencies.
Figure 3: Waterfall Plot and FFT plot of SDR SID Receiver
Figure 4 shows the user interface reasonably well. It shows VTX3 output (green channel), with the carrier varying significantly in power roughly every 20 seconds.
Figure 4: Scope Plot of SID SDR receiver
When the SDR SID receiver flow graph is run, three data files are being written into our Computer directory. File sink block of GRC does this work. Then, using Python language we write these data to a text file and plot the graph. This process was done on SID data of 13th May 2012 and the plot obtained is shown in Figure 5. SID data of three stations are plotted.
Ambily Joseph et al ,Int.J.Computer Technology & Applications,Vol 3 (4), 1528-1531
IJCTA | July-August 2012 Available [email protected]
1530
ISSN:2229-6093

Figure 5: SID data of 13th May 2012
In the graph above note the sunrise and sunset shapes. The 3 peaks in the graph are 3 events caused by solar activity. In figure 5, brightness of X-ray solar flares is measured as the peak intensity. Some smaller peaks caused due to unknown events are not marked in the graph. Our data can be compared with the data from the GOES satellites. We don’t get similar flares exactly since GEOS satellites are tracking directly from space.
5. Conclusion SDR based approach is a powerful technology in the field of communication. In this paper two applications like weather satellite decoding and sudden ionospheric disturbance study are discussed. 6. Acknowledgment The authors would like to acknowledge Rakesh Peter, Geetha Srikanth, Shanmugha Sundaram and Vinod C K of CEN Dept, Amrita Vishwa Vidyapeetham, Coimbatore for their immense support extended in completing this paper. Also the authors would like to thank the Almighty and their parents whose blessings are always with them. 7. References [1] N. Benabadji, A. Hassini, and A.H Belbachir, “Hardware and Software Consideration to use NOAA Images”, Rev.Energ. Ren. Vol.7 (2004), pp 1-11 [2] NOAA Weather with FCD and WxtoImg available online at http://www.ne.jp/asahi/hamradio/je9pel/fcdwximg.htm [3] Andy, DL4AND, “Satellite weather pictures First- Hand, Part-1” available online at http://www.alice-dsl.net/andreas-chulze/English/NOAA/NOAA English 1
[4] “Quadrifilar Helix Antenna” available online at http://w2du.com/r2ch22.pdf [5] Steve Belter, “Using HDSDR with FUNcube Dongle” available at http://www.hamradio.co.uk/userfiles/file/funcube_hdsdr.pdf [6] M. Leech, “Science without Hardware: Building an SDR SID Receiver in an Afternoon”, SARA Proceedings, Mar.20-21, 2010 [7] “SID Receiver” available online at http://www.backyardastronomy.net [8] “Observing the Ionosphere with VLF radio” available online at http://abelian.org/sid [9] “SID-GRB@Home” available at http://www.infiltec.com [10] “Sudden Ionospheric Disturbances (SID)” available at http://www.aavso.org
Ambily Joseph et al ,Int.J.Computer Technology & Applications,Vol 3 (4), 1528-1531
IJCTA | July-August 2012 Available [email protected]
1531
ISSN:2229-6093