color correction of texture images for true photorealistic ...jshan/publications/2010/color... ·...
TRANSCRIPT

ARTICLE IN PRESSISPRS Journal of Photogrammetry and Remote Sensing ( ) –
Contents lists available at ScienceDirect
ISPRS Journal of Photogrammetry and Remote Sensing
journal homepage: www.elsevier.com/locate/isprsjprs
Color correction of texture images for true photorealistic visualizationYonghak Song, Jie Shan ∗Geomatics Engineering, School of Civil Engineering, Purdue University, 550 Stadium Mall Drive, West Lafayette, IN 47907, USA
a r t i c l e i n f o
Article history:Received 3 September 2007Received in revised form7 January 2010Accepted 22 January 2010Available online xxxx
Keywords:Color correctionPhotorealistic visualizationRenderingTexture mapping
a b s t r a c t
Photorealistic visualization combines 3-D geometric models with their texture images to render thevirtualworld. This paper points out that the texture images should be radiometrically corrected to achievea true realistic appearance. Such a correction should include not only the color adjustment among imagesof the same object, but also the shade variation caused by the illumination change. The objective of thisstudy is to correct the input texture images such that their shade varies when being rendered underdifferent illumination directions. To achieve this goal we first apply the specular-to-diffuse mechanismbased on the dichromatic reflection model to remove the specular component from the texture image.The resultant diffusion-only image then undergoes a shade correction to produce a normalized shade-free texture image. In the final step, shades under any illumination are produced to achieve a truephotorealistic effect. Presented in the paper are the principles and methods for such corrections, alongwith a performance evaluation based on the graphic and numerical results for roof texture images.
© 2010 Published by Elsevier B.V. on behalf of International Society for Photogrammetry and RemoteSensing, Inc. (ISPRS).
1. Introduction
Photorealistic visualization combines 3-D geometric modelswith their texture images to render the virtual world. Thisprocess provides a realistic perception and is becoming a popularfunctionality for geospatial exploration (Döllner et al., 2006).Recently, a photorealistic visualization over urban areas is ofparticular interest and challenge due to the complexity and varietyof urban features (Varshosaz, 2003). This is more obvious forlarge scale visualization, where man-made features need to bepresented in great detail at a high resolution. The state-of-the-art of the technologies makes it possible to map building roofand façade texture images onto the geometric models in anautomated or semi-automated manner. However, at least twoproblems have not been sufficiently addressed so that a perfectphotorealistic visualization can be achieved. First, the imagesused for texture mapping may likely be collected at differentlocations and angles and even with different sensors. Objectsmade of the same materials usually do not have exactly thesame appearance or color due to a number of reasons such asillumination direction, camera pointing, specular reflection, sensornoise, and environmental noise. Such ‘‘internal differences’’ caneven be observed among the different primitives of an object ina single image. These internal differences among images are oftencorrected during the production of the imagemosaics by adjustingtheir colors using various radiometric correction methods such as
∗ Corresponding author.E-mail address: [email protected] (J. Shan).
multi-resolution spline convolution (Burt and Adelson, 1983),histogrammatching (Du et al., 2001; Zheng et al., 2006), weighted-blending (Nicholas, 2001), and polygon based blending (Tsaiet al., 2005). The other problem is related to rendering. When aphotorealistic model is rendered under an illumination directionother than the one from which the texture images were taken, theview should appear different from the original texture images, i.e.,a new shade effectwill occur. This phenomenon is primarily causedby the difference between the real illumination direction and therendering illumination direction, and thus is named as ‘‘externaldifference’’ here for briefness. An ideal photorealistic view shouldnot only perform a color adjustment between images, but alsochange the color of the texture images according to the renderingillumination direction.The above two problems are generally referred to as color
correction in this paper and should be resolved to achieve ahigh fidelity true photorealistic visualization. It should be pointedout that this concept is an extension to the classical geometriccorrection that only changes the geometry of the image in theprocess of rectification or rendering. It is also a conceptualgeneralization from the ordinary color adjustment where colordifferences among the images of the same scenes are minimized.The color correction in this paper will change the radiometry orcolor of the texture images such that they are mutually consistentand also vary with the change of the illumination directions.Such combined geometric and radiometric corrections form acomprehensive concept for a true photorealistic visualization.This study addresses two issues in the color correction: specular
removal and shade correction. The texture image records theelectromagnetic energy reflected from the object. It consists of two
0924-2716/$ – see front matter© 2010 Published by Elsevier B.V. on behalf of International Society for Photogrammetry and Remote Sensing, Inc. (ISPRS).doi:10.1016/j.isprsjprs.2010.01.003
Please cite this article in press as: Song, Y., Shan, J., Color correction of texture images for true photorealistic visualization. ISPRS Journal of Photogrammetry and RemoteSensing (2010), doi:10.1016/j.isprsjprs.2010.01.003

ARTICLE IN PRESS2 Y. Song, J. Shan / ISPRS Journal of Photogrammetry and Remote Sensing ( ) –
components: specular reflection and diffusion reflection. Specularreflection is a surface phenomenon. Even for significantly roughsurfaces, specular reflection is observed at the specular directionand may cause an erroneous result in image segmentation andshading analysis. Hence, the specular reflection is undesirable andneeds to be removed (Nayer et al., 1993). This is a classical topicin computer graphics (Shafer, 1985) and many efforts exist toremove the confounding effect of the illumination sources so thatthe corrected texture image contains only the color of the object.In addition, to carry out the shade’s correction, the specular effectshould be first removed from the texture image, which thereforebecomes the first task in this study.The other component, diffuse reflection, results from the
light rays penetrating the object surface, undergoing multiplereflections, and re-emerging at the object’s surface. It varies slowlyand is treated as independent from the viewing direction in somesimplified reflection models such as the Lambertian model (Wolff,1996). The effect of diffuse reflection is the gradual change ofintensities over the texture image. Such an effect is also calledthe shade, which is the change of intensity due to the spatialvariation of the object’s surface (Finlayson and Schaefer, 2001).Three potential problems for true photorealistic visualization canarise due to the shade. First, it causes objects composed of thesame material with an identical color to appear differently in thetexture image. The second problem is related to the performanceof rendering. Efficient texture mapping should be able to balancebetween the rendering speed and the rendering details, and not alldetails are needed for rendering (Heckbert, 1986). Hence, the shadein the texture images of the same material should be generated toform one ‘‘normalized’’ texture image that can be used formultipleroofs made of the same material. The third problem is that theshade needs to be changed when the model is rendered from anillumination direction different than the one in which the textureimages were taken. Our second task is therefore to correct theshades of the same material to a normalized shade and change(transform) it according to the illumination direction when beingrendered.The remainder of the paper first discusses the principles of
specular removal and the shade’s correction. Relevant studies incomputer graphics and remote sensing are reviewed for each topic.The study then uses color images of building roofs to demonstratethe presented principles and methodology. Both the graphic andnumerical results are presented to evaluate the performance of thisstudy.
2. Specular reflection removal
As was addressed earlier, the intensity of a texture imagehas two components: specular reflection and diffuse reflection.Separating the specular component from the texture image isnecessary for photorealistic visualization and is also a prerequisitefor the shade’s correction. This is a topic that has been extensivelystudied in computer graphics with most of the effort based on thedichromatic reflectancemodel (Shafer, 1985). Utilizing this model,Klinker et al. (1988) observed that the color histogram of an objectwith a uniform diffuse color presents a T-shape with two limbs,respectively corresponding to the diffuse component and thespecular component. However, this T-shape is rarely separable formost real images due to the existence of noise (Klinker et al., 1988).Bajcsy et al. (1990) showed additional limbs produced by inter-reflections between objects. They suggested that the separationshould be performed in the space of brightness, saturation andhue. Although it wasmore accurate, it needed the correct specular-diffuse pixel segmentation. Lee (1992) used a ‘‘moving sensor’’method and applied spectral differencing to the color histogramsof the consecutive images for the specular component extraction.More recently, Tan et al. (2004) proposed a separation method
based on the distribution of specular and diffuse points or pixelsin a two-dimensional maximum chromaticity-intensity space. Ourstudy in this paper adopts and applies this method. However, fora consistency of discussion and the convenience of readers, it willbe presented below along with derivations and an example of theimplementation. For the complete original work, see Tan et al.(2004).The dichromatic reflectionmodel (Shafer, 1985) is composed of
two additive components, diffuse reflection and specular reflection
I(x) = wd(x)D(x)+ ws(x)S(x) (1)
whereI = {Ir , Ig , Ib}T : the color vector of the image’s intensity, where
the subscripts r , g , b respectively stand for the red, green and bluecomponents.
x = {x, y}: the image’s coordinates.D(x), S(x): the diffuse reflection vector and the specular
reflection vector.wd(x), ws(x): weighting factors for the diffuse and specular
components.According to Tan and Ikeuchi (2005), the diffuse reflection is dueto the varying refractive indices in the object’s surfaces, while thespecular reflection is mainly due to the refractive index differencebetween the object surface and the air. The values of the weightingfactors depend on the geometric structure of the object at thelocation x.Next, the concept of chromaticity is introduced, which in
general is defined as a normalized vector (Tan et al., 2004).
σ(x) =I(x)
Ir(x)+ Ig(x)+ Ib(x)
λ(x) =D(x)
Dr(x)+ Dg(x)+ Db(x)
γ(x) =S(x)
Sr(x)+ Sg(x)+ Sb(x)
(2)
σ is the chromaticity corresponding to the image’s intensity.By inserting the diffuse chromaticity (λ) and the specularchromaticity (γ) into Eq. (1), the image’s intensity can be expressedas a combination of the diffuse chromaticity and the specularchromaticity
I(x) = md(x)λ(x)+ms(x)γ(x) (3)
wheremd(x) andms(x) are the normalized weight factors
md(x) = wd(x)(Dr(x)+ Dg(x)+ Db(x))ms(x) = ws(x)(Sr(x)+ Sg(x)+ Sb(x)).
(4)
Before the full mathematic development for the specular compo-nent removal is presented, its task can be conceptually introducedbelow. A pixel in an imagemay belong to one of two types: a diffusepixel or a specular pixel. A diffuse pixel has no specular component,i.e., ms = 0, which means that its intensity comes entirely fromthe diffuse reflections of the objects. On the other hand, a specularpixel has both a diffuse component and a specular component, i.e.,md > 0 and ms > 0, which implies that its intensity comes fromboth a single mirror reflection and multiple diffusion reflectionsat the object’s surface due to its roughness. The task of removingthe specular component is to determine the specular contribution,ms(x)γ(x), in Eq. (3) such that it can be subtracted from the im-age color vector I(x). The resultant diffuse contribution,md(x)λ(x),will be the final color vector in the specular-free image.To calculate the specular component, the concept of chromatic-
ity defined in Eq. (2) is utilized. Since (γr + γg + γb) = (λr + λg +λb) = (σr+σg+σb) = 1, inserting Eq. (3) into the σ(x) expressionin Eq. (2) will yield
σ(x) =md(x)λ(x)+ms(x)γ(x)
md(x)+ms(x). (5)
Please cite this article in press as: Song, Y., Shan, J., Color correction of texture images for true photorealistic visualization. ISPRS Journal of Photogrammetry and RemoteSensing (2010), doi:10.1016/j.isprsjprs.2010.01.003

ARTICLE IN PRESSY. Song, J. Shan / ISPRS Journal of Photogrammetry and Remote Sensing ( ) – 3
Fig. 1. Steps for determining the maximum chromaticity σ .
According to Tan et al. (2004), the maximum chromaticity, whichessentially identifies the dominant color, is defined as
σ (x) = max{σr(x), σg(x), σb(x)
}=
I(x)Ir(x)+ Ig(x)+ Ib(x)
(6)
where
I(x) = max{Ir(x), Ig(x), Ib(x)
}. (7)
As md > 0 and ms > 0, and under the assumption of whiteillumination, i.e., γ(x) = (1/3 1/3 1/3)T , it can be shownthat the maximum elements of σ(x),λ(x), and γ(x) occur at thesame row or at the same color component (such as red). Letλ(x) and γ (x), respectively, be the elements in λ(x) and γ(x)corresponding to σ (x) in σ(x), then Eq. (5) can be written in thescalar formwith themaximum chromaticity σ (x) = (md(x)λ(x)+ms(x)γ (x))/(md(x)+ms(x)). With rearrangement this will lead to
ms(x) = md(x)λ(x)− σ (x)σ (x)− γ (x)
. (8)
Inserting Eq. (8) into Eq. (3) and considering γ (x) = 1/3, we have
I(x) = md(x)(3λ(x)− 1)σ (x)
3σ (x)− 1(9)
or
md(x) =I(x)(3σ (x)− 1)σ (x)(3λ(x)− 1)
. (10)
Once the diffuse weight factor is determined from the lastequation, the specular weight factor can be calculated withms(x) = Ir(x)+ Ig(x)+ Ib(x)−md(x). (11)Finally, the diffuse component, i.e., the specular-free image can beformed by subtracting the specular contribution,ms(x)/3, from theinput image I(x)with the following equation
md(x)λ(x) = I(x)−ms(x)[1/3 1/3 1/3]T . (12)The above development in Tan et al. (2004) forms the basis ofthe specular-to-diffuse mechanism for the specular componentremoval. It is seen that once σ (x) and λ(x) are determined,Eqs. (10)–(12) can then be used to remove the specular component.Under the assumption that the object’s surface in question is made
of the same material and uniform, then both the diffuse and thespecular pixels have the same diffuse component,
λ(x) = λ(xd) = σ (xd) (13)
where xd stands for the diffuse pixels. Thus, the key in usingEqs. (10)–(12) is to obtain the maximum chromaticity σ (omittingthe location for simplicity of notations) for the diffuse pixels.According to Tan et al. (2004), the maximum chromaticity-
intensity space (σ , I) is formed where the horizontal axisrepresents the maximum chromaticity defined in Eq. (6) and thevertical axis is for the maximum intensity of the color vectordefined in Eq. (7). Under the assumption of a uniform surfaceand a white illumination, the specular pixels should have a largerintensity (I) and smaller maximum chromaticity (σ ) than thediffuse pixels due to the maximum operation in the definitionof I . In addition, the maximum chromaticity (σ ) of the diffusepixels should be a constant for the uniform object. However, dueto the effect of the sensor and the environmental noises, suchideal situation does not occur in real images and one cannotdirectly separate the two components using the above principle.The suggested procedure by Tan et al. (2004) consists of thefollowing steps. First, we calculate the color index (u).
u =Ir + Ib − 2IgIg + Ib − 2Ir
(14)
for every pixel of the object. This color index is designed such thatthe effect of the equal specular components will be canceled in anoise-free image and all the pixels from one uniform object shouldideally yield a constant u value. To consider the effect of noise, wedivide the range of u, (umin, umax) into a number of bins (50 in thisstudy). As shown in Fig. 1, the pixels corresponding to one bin ui(upper left) are plotted into the maximum chromaticity-intensityspace (σ , I) (upper right). Such a plot will be approximated by anumber of straight lines (100 in this study) as an approximationto Eq. (9). The maximum σ ’s of each of the straight lineswill be selected as candidates (lower right), yielding 100 σ ’scorresponding to the 100 straight lines. This procedure is repeatedfor all 50 bins of u and a total of 5000 candidate σ ’s are selected.The final selection of σ for the object is determined by forming the
Please cite this article in press as: Song, Y., Shan, J., Color correction of texture images for true photorealistic visualization. ISPRS Journal of Photogrammetry and RemoteSensing (2010), doi:10.1016/j.isprsjprs.2010.01.003

ARTICLE IN PRESS4 Y. Song, J. Shan / ISPRS Journal of Photogrammetry and Remote Sensing ( ) –
(a) Specular image. (b) Specular-free image.
250
200
150
100
50
00 0.1 0.2 0.3 0.4 0.5 ~σ
~Ι
250
200
150
100
50
00 0.1 0.2 0.3 0.4 0.5 ~σ
~Ι
(c) (δ, I) of the specular image. (d) (δ, I) of the specular-free image.
Fig. 2. Specular correction of a tent image.
histogram of σ ’s and selecting the σ that has the highest frequency(lower left).For the purpose of illustration, the above principles and
implementation are applied to correct the specular effect on anaerial image of a tent shown in Fig. 2(a). The intermediate stepsand results for this correction are depicted in Fig. 1 and the originalimage and final specular-free image are shown in Fig. 2(a) and (b),respectively. Fig. 2(c) and (d) present the maximum chromaticity-intensity space of the example image before and after the specularcorrection.
3. Shade correction and transform
Once the specular-free image is obtained, it is ready for a furthercorrection of the shade effect. For this purpose, what is neededis a reflection model that describes the relationship betweenthe shade (image), the object and the incoming light. Remotesensing has used various methods to correct the shade effectscaused by the topography. Representative methods include theLambertian (cosine) correction, theMinnaert correction (Minnaert,1941; Teillet et al., 1982), and a normalization method (Civco,1989). Newton et al. (1991) applied a complex and intensiveshading model to remove the irradiance variation effects in theLandsat TM imagery using digital elevation models.This study uses the three popular reflection models: the cosine
(Lambertian) model, the Minnaert model, and the Marsik model.All thesemodels need to calculate the incident angle i, i.e., the anglebetween the illumination normal (O) and the surface normal (S).As shown in Fig. 3, E is the slope inclination, Z is the solar zenithangle, Ao is the solar azimuth, and As is the surface aspect of theslope. Under these notations, the unit vector of the solar directionis [sin Z · sin Ao sin Z · cos Ao cos Z ]Tand the unit vector of thesurface normal is [sin E · sin As sin E · cos As cos E]T . The dotproduct of the two unit vectors leads to the following formula(Holben and Justice, 1980; Smith et al., 1980)
cos i = cos E cos Z + sin E sin Z cos(As − Ao). (15)
Fig. 3. Geometry of incident angle calculation.
The Lambertian model assumes that the object’s surface is aperfect diffuse reflector, i.e., the same amount of reflectance occursin all viewing directions. Thismodel can bewritten as (Teillet et al.,1982; Jones et al., 1988)
In = (Id − Ia)/cosi (16)
where Id is the color vector of the specular-free or diffuse-onlyimage, Ia is the constant color vector caused by the ambient light, Inis the color vector to be determined for the final shade-free imageor a normalized image.The Minnaert model below was developed for the photometric
analysis of the lunar surface in Minnaert (1941)
In =Id cos e
cosk i cosk e(17)
where e is the slope angle and k is the Minnaert constant. Themodel uses the Minnaert constant k to describe the roughness of a
Please cite this article in press as: Song, Y., Shan, J., Color correction of texture images for true photorealistic visualization. ISPRS Journal of Photogrammetry and RemoteSensing (2010), doi:10.1016/j.isprsjprs.2010.01.003

ARTICLE IN PRESSY. Song, J. Shan / ISPRS Journal of Photogrammetry and Remote Sensing ( ) – 5
Table 1Means and color ratios of roofs in one building.
Roof 1 Roof 2 Roof 3 Roof 4 Roof 5
Mean R 204.3 145.5 192.8 218.3 114.5Mean G 162.2 104.3 149.1 183.6 113.0Mean B 138.0 96.4 127.5 160.6 108.5Color ratio −0.16 −0.37 −0.20 −0.13 0.41Incident angle 39.98° 67.75° 56.82° 20.88° 0.23°
surface. For surfaceswith a Lambertian behavior, k = 1; otherwise,k < 1.The third model is based on the Marsik (1971) method. It takes
the form
In =1
1+ log(cos i)Cd ⊗ Id −
11+ log(cos i)
Ca (18)
where − log(cos i) = D is called the shading density function(Marsik, 1971), Cd and Ca are the scale vectors, respectively, for thediffuse light and the ambient light,⊗ stands for the product of thecorresponding elements in two vectors.A shade transform is needed to convert the shade under one
illumination direction to the shade under another illuminationdirection. For this purpose we use the shade-free image of theintermediate step, i.e., the resultant shade-free image createdthrough a shade correction is transformed to form a new shadeimage. This is the reverse process of the shade correction. Theunknown to be determined for shade transform is Id, while all theother parameters, except the incident angle i, in the above shademodels (Eqs. (16)–(18)) are known through the shade correctionprocess.
4. Tests and discussion
This section evaluates the aforementioned principles andmethods for the specular removal and the shade correction forgenerating a true photorealistic effect. The tests are carried outwith roof models and roof texture images obtained by aerialphotography. The roof images have a pixel size of 30 µm and areobtained by scanning the aerial photographs at a scale of 1:4000.The scanned images have three R, G, B bands with a radiometricscale from 0 to 255 per band. The roof models are digitized roofby roof from a stereo pair. For the simplicity of discussion and toprevent any ambiguity in the context, the term roof here refers toeach individual digitized planar face atop a building.Every individual building is processed with two sequential
steps: specular removal and shade correction. After verifyingthe assumption of white illumination following Tominaga andWandell (1989), each roof image is separately applied to thespecular removal. The pixels of every roof image are treated asone correction unit, for which a maximum chromaticity σ isdetermined. After that, every roof pixel is subject to the specularreflection removal by using Eqs. (10)–(13).The specular-free images are then used for the shade correction.
We first group the roofs of a building according to their colorratios (Eq. (14)) calculated by the mean color components of allpixels in one roof. Roofs with the maximum color ratio differencewithin±0.25 (gray value) are regarded as being made of the samematerial and should have the same reflection properties. As anexample, Table 1 lists the mean R, G and B components and thecolor ratios of the five roofs of a building (Fig. 4). Roofs 1, 2, 3 and 4are considered to be made of the same material, which is differentfrom the material for roof 5.The three shading models described in Section 3 are applied
to the specular-free images for the shade correction. The solarazimuth and zenith at the time the image was taken are obtainedbased on the time tag and location of the aerial photograph usingthe NOAA solar calculator (http://www.srrb.noaa.gov/highlights/sunrise/azel.html). The incident angles are then calculated using
the roof normals with Eq. (15). Every roof within one group willform one set of equations to determine the normalized color In andother parameters Ia or Ca and Cd with a linear regression. The pixelvalues of the roof images are then adjusted for shade correctionby using the resultant model parameters. Fig. 4 shows the shade-corrected roofs with and without specular reflection removal.For comparison purpose, the shade correction results from both
with and without specular reflection removal are presented alongwith their histograms to show the distribution of the pixel values.The original image and its histogram (C1) in Fig. 4 suggest thatthe entire building roof has two dominant colors which representfour slant parts (roof 1–4) and one flat part (roof 5). However,the histogram of the original image shows three apparent peaksdue to three illuminated slant parts, one shaded slant part andthe flat part. A successful specular removal and shade correctionshould ideally make the two dominant colors more distinct andshow only two peaks. The middle (C2) and right columns (C3)show improvement towards this goal. Shade correction increasesthe separability of the two dominant colors by harmonizing thecolors of the roofs made of the samematerial and thus successfullyforming the two more centralized peaks in the histograms. Itshould be noted, however, that such an improvement is sometimesnot apparently visible from the texture images if their specularcomponent is small. Instead, the histograms demonstrate thedifferences in all three shade correction models.In order to quantitatively evaluate the performance of the
specular and the shade corrections, Table 2 lists the standarddeviations of the images for the above four roofs made of the samematerial. We first calculate the variance of each individual roof(planar face)
σ 2i =1mi
mi∑j=1
(gij − gi)2 (19)
where i and j are the roof and the pixel numbers, respectively; gij isthe pixel value of the j-th pixel of the i-th roof; gi is themean of thei-th roof;mi is the number of pixels of the i-th roof. Thewithin-roofvariance is the average of the above variances of n individual roofsmade of the same material
σ 2 =1n
n∑i=1
σ 2i . (20)
On the contrary, the between-roof variance is calculated in asimilar way to Eq. (19), however, by taking the mean of the pixelsof all the roofs (Eq. (20)). The underlying mechanism for such anevaluation is as follows. Each roof has an intrinsic shade variationdue to the material’s roughness. This variation is representedby its variance as calculated in Eq. (19). For roofs made of thesame material, they should have a similar standard deviation, ifthe shade and specular effects are corrected. The large variationbetween the roofs, if any, is caused by the specular reflection andthe diffuse reflection. A perfect correction should yield a variancebetween all roofs made of the samematerial as close as possible tothe variance of each individual roof, i.e., the within-roof variance.First of all, as depicted in Table 2 (left section), the input images
show large between-roof standard deviations, which implies theexistence of specular reflection and shade differences among theroofs. Our effort should reduce such between-roof variations,ideally to the within-roof variance, which is intrinsic for the roofsmade of the samematerial. Table 2 (right section) shows the shadecorrection without the specular correction changes the variationbetween (asmeasured by average roof variance) roofs from 38.6 to10.2 as an average of all three shade correction models. Includingthe removal of the specular component, though it is small, canfurther improve the color correction performance from 10.2 to7.1, which is very close to the average within-roof variation (7.21)
Please cite this article in press as: Song, Y., Shan, J., Color correction of texture images for true photorealistic visualization. ISPRS Journal of Photogrammetry and RemoteSensing (2010), doi:10.1016/j.isprsjprs.2010.01.003

ARTICLE IN PRESS6 Y. Song, J. Shan / ISPRS Journal of Photogrammetry and Remote Sensing ( ) –
Original Image Lambertian Model
Minnaert Model
Marsik Model
with specular reflection removal
Marsik Model
without specular reflection removal
Minnaert Model
Lambertian Model
R1
R2
C1 C2 C3
Fig. 4. Shade-corrected images (R1) and intensity histograms (R2) of the red band based on the original image (left column, C1) and different shade correction models forwith (middle column, C2) and without (right column, C3) the specular removal.
Table 2Standard deviations of the input and shade-corrected roof images.Band Input image Shade correction (between roofs)
Between roofs Within roofs Lambertian Minnaert Marsikw/o w/ w/o w/ w/o w/
Red 37.30 6.54 13.37 7.81 10.81 8.29 9.35 6.34Green 40.52 7.92 11.43 6.84 10.39 8.61 8.29 6.44Blue 33.48 8.25 9.69 7.09 9.04 8.97 7.99 7.62Intensity 38.60 7.21 11.59 6.82 10.09 8.27 8.21 6.21w/o: without specular correction; w/: with specular correction.
in the input images. Such closeness is the optimal performanceone can expect in the specular and the diffusion corrections sinceit harmonizes the roofs made of the same material, while at thesame time each individual roof is still perceptible by keeping itsintrinsic texture properties embedded in its variance. As for theperformance of the individual shade correction model, the Marsikmodel yields the best results, followed by the Lambertian modeland the Minnaert model, although all of them are very similar inthis study.Our final study is about a shade transform, i.e., to generate the
texture images under an illumination direction possibly differentfrom the one of the input images. As an evaluation strategy, we
first produce the texture images under the illuminationdirection inwhich the original images were taken. The reproduced roof imagesare then compared with the input images, pixel by pixel. Fig. 5plots the standard deviations of such pixel-by-pixel differencesfor the three color bands of the four roofs tested above. A perfectshade correction and shade transform process should yield aminimum variation during this forward (correction) and backward(transform) process. According to Fig. 5, the specular correctionmakes considerable improvement to the straight shade correction,because the specular-free image helps the determination of theparameters in the shade correctionmodels. This further verifies theprevious discussion. Finally, it is seen that the differences among
Please cite this article in press as: Song, Y., Shan, J., Color correction of texture images for true photorealistic visualization. ISPRS Journal of Photogrammetry and RemoteSensing (2010), doi:10.1016/j.isprsjprs.2010.01.003
ARTICLE IN PRESSY. Song, J. Shan / ISPRS Journal of Photogrammetry and Remote Sensing ( ) – 7
9
8
7
6
5
4
3
2
1
0
Gra
y le
vels
Fig. 5. Standard deviations of the intensity differences between the reproducedroof images and the input roof images, without (left three) and with (right three)specular corrections.
Fig. 6. Shade correction of roof images, 1st column: Original texture image atsun direction (As: 161.75°, Z: 46.82°); 2nd column: Shade-free texture image; 3rdcolumn: Texture rendering at sun location (As: 341.75°, Z: 46.82°; opposite to the1st column); 4th column: Texture rendering at the same sundirection as the originalimage. North is to the right.
the three shade correction methods are as small as only two graylevels.Figs. 6–8 present the rendered roofs generated by using the
Marsik model. In Fig. 6, the original texture images (1st column)are shown beside the corrected shade-free images (2nd column).Through the corrections the input images are normalized to theirmaterial color without the specular and the diffuse reflections. Theroofs in a building made of the same material have little colorvariation as is shown in the second column. The third column is therendering results at the illumination direction opposite to the oneof the input image. As is shown, the shade transform thus reversesthe brightness of the roofs in the input images. The last columnin Fig. 6 is the reproduced input images based on the shade-freeimages by assuming the illumination direction being the sameas the input images. No apparent difference is noticed betweenthe input and its reproduction, illustrating a check on the abilityof the shade transform to match the original shade conditions.
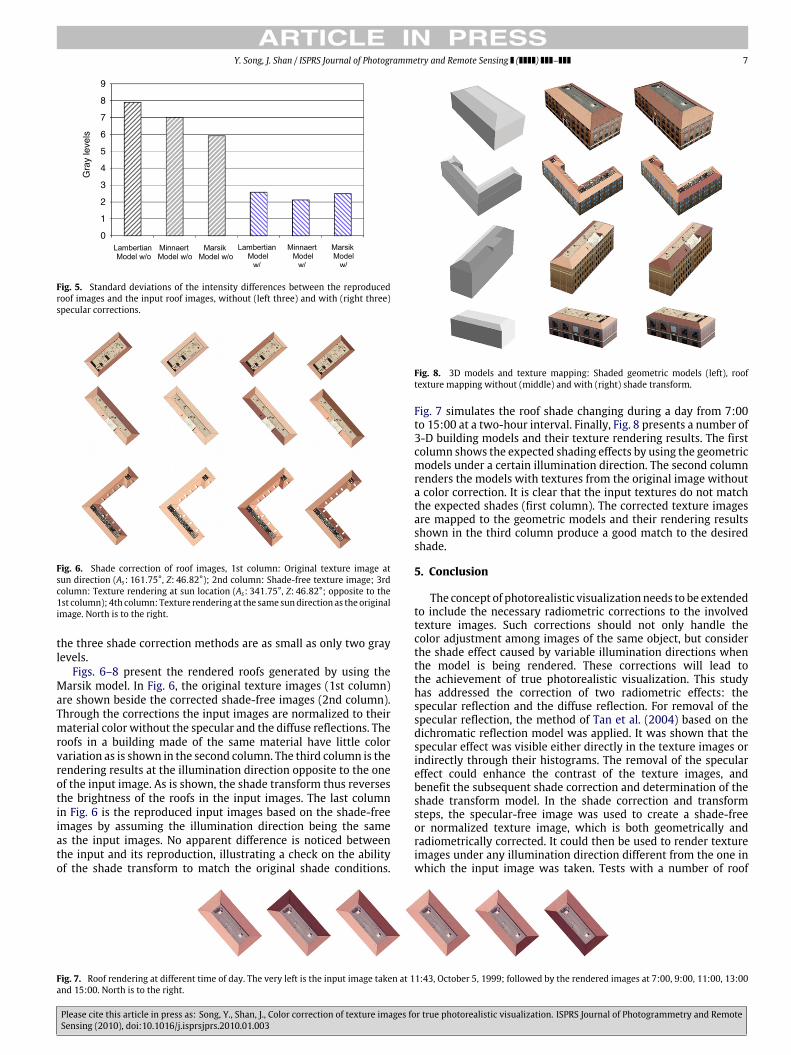
Fig. 8. 3D models and texture mapping: Shaded geometric models (left), rooftexture mapping without (middle) and with (right) shade transform.
Fig. 7 simulates the roof shade changing during a day from 7:00to 15:00 at a two-hour interval. Finally, Fig. 8 presents a number of3-D building models and their texture rendering results. The firstcolumn shows the expected shading effects by using the geometricmodels under a certain illumination direction. The second columnrenders the models with textures from the original image withouta color correction. It is clear that the input textures do not matchthe expected shades (first column). The corrected texture imagesare mapped to the geometric models and their rendering resultsshown in the third column produce a good match to the desiredshade.
5. Conclusion
The concept of photorealistic visualizationneeds to be extendedto include the necessary radiometric corrections to the involvedtexture images. Such corrections should not only handle thecolor adjustment among images of the same object, but considerthe shade effect caused by variable illumination directions whenthe model is being rendered. These corrections will lead tothe achievement of true photorealistic visualization. This studyhas addressed the correction of two radiometric effects: thespecular reflection and the diffuse reflection. For removal of thespecular reflection, the method of Tan et al. (2004) based on thedichromatic reflection model was applied. It was shown that thespecular effect was visible either directly in the texture images orindirectly through their histograms. The removal of the speculareffect could enhance the contrast of the texture images, andbenefit the subsequent shade correction and determination of theshade transform model. In the shade correction and transformsteps, the specular-free image was used to create a shade-freeor normalized texture image, which is both geometrically andradiometrically corrected. It could then be used to render textureimages under any illumination direction different from the one inwhich the input image was taken. Tests with a number of roof
Fig. 7. Roof rendering at different time of day. The very left is the input image taken at 11:43, October 5, 1999; followed by the rendered images at 7:00, 9:00, 11:00, 13:00and 15:00. North is to the right.
Please cite this article in press as: Song, Y., Shan, J., Color correction of texture images for true photorealistic visualization. ISPRS Journal of Photogrammetry and RemoteSensing (2010), doi:10.1016/j.isprsjprs.2010.01.003

ARTICLE IN PRESS8 Y. Song, J. Shan / ISPRS Journal of Photogrammetry and Remote Sensing ( ) –
images demonstrated that both corrections could be implementedeffectively without interaction for a given building model. It wasshown that although the Marsik model was the best, all of thethree tested shade correctionmodels yielded similarly satisfactoryrendering results. Finally, the color correction outcome could bequantitatively evaluated by the proposed evaluationmetrics basedon the between-roof and among-roof variances.As for future effort, it is necessary to extend our current work
on roof images mostly formed of one type of material to morecomplex objects, such as roofs with different colors and materials.Ground images of building walls and façades shall also be includedto further demonstrate the performance and effect of the specularand the shade correction. All this will allow for handling morerealistic building images that often consist of more than onematerial type such as brick, window, door and other decorations.The added realism will essentially demand not only the detailedgeometric modeling, but also a comprehensive material modelingof the scene. Finally, the color correction discussed here shouldbe integrated with the visualization tools and the geographicinformation systems to achieve a true photorealistic effect underflexible illumination directions.
Acknowledgements
The authors would like to thank the anonymous reviewerswhose constructive suggestions considerably improved the paper.
References
Bajcsy, R., Lee, S.W., Leonardis, A., 1990. Color image segmentation with detectionof highlights and local illumination induced by interreflections. In: Proc.International Conference on Pattern Recognition, vol. 1, Atlantic City, NJ, USA,16–21 June. pp. 785–790.
Burt, P.J., Adelson, E.H., 1983. A multiresolution spline with application to imagemosaics. ACM Transactions on Graphics 2 (4), 217–236.
Civco, D.L., 1989. Topographic normalization of Landsat Thematic Mapper digitalimagery. Photogrammetric Engineering & Remote Sensing 55 (9), 1303–1309.
Döllner, J., Kolbe, T.H., Liecke, F., Sgouros, T., Teichmann, K., 2006. The virtual 3D citymodel of Berlin—Managing, integrating, and communicating complex urbaninformation. In: Proc. 25th Urban Data Management Symposium, Aalborg,Denmark, 15–17 May. pp. 9.73–9.86 (on CD-ROM).
Du, Y., Cihlar, J., Beaubien, J., Latifovic, R., 2001. Radiometric normalization,composition and quality control for satellite high resolution image mosaicsover large area. IEEE Transactions on Geoscience and Remote Sensing 39 (3),623–634.
Finlayson, G., Schaefer, G., 2001. Colour indexing across devices and viewingconditions. In: Proc. 2nd International Workshop on Content BasedMultimediaand Indexing, Brescia, Italy, 19–21 September. pp. 215–221.
Heckbert, P.S., 1986. Survey of texture mapping. IEEE Computer Graphics andApplications 6 (11), 56–67.
Holben, B.N., Justice, C.O., 1980. The topographic effects on spectral response fromnadir-point sensors. Photogrammetric Engineering & Remote Sensing 46 (9),1191–1200.
Jones, A.R., Wyatt, B.K., Settle, J.J., 1988. Use of digital terrain data in theinterpretation of SPOT-1 HRV multispectral imagery. International Journal ofRemote Sensing 9 (4), 669–682.
Klinker, G.J., Shafer, S.A., Kanade, T., 1988. Color image analysis with an intrinsicreflectionmodel. In: Proc. International Conference onComputerVision, Tampa,FL, USA, 5–8 December. pp. 292–296.
Lee, S.W., 1992. Understanding of surface reflection in computer vision by color andmultiple views. Ph.D. Dissertation, University of Pennsylvania, USA.
Marsik, Z., 1971. Automatic relief shading. Photogrammetria 27 (2), 57–70.Minnaert, M., 1941. The reciprocity principle in lunar photometry. AstrophysicalJournal 93, 403–410.
Nayer, S.K., Fang, X., Boult, T., 1993. Removal of specularities using color andpolarization. In: Proc. IEEE Computer Vision and Pattern Recognition‘93, NewYork City, USA, 15–17 June. pp. 583–590.
Newton, A., Muller, J.-P., Pearson, J., 1991. SPOT DEM shading for Landsat-TMtopographic correction. In: IEEE Geoscience and Remote Sensing Symposium,IGARSS, vol. 2, Espoo, Finland, 3–6 June. pp. 655–659.
Nicholas, H., 2001. New methods for dynamic mosaicking. IEEE Transactions onImage Processing 10 (8), 1239–1251.
Shafer, S.A., 1985. Using color to separate reflection components. Color Researchand Applications 10 (4), 210–218.
Smith, J.A., Tzeu, L.L., Ranson, K.J., 1980. The Lambertian assumption and Landsatdata. Photogrammetric Engineering & Remote Sensing 46 (9), 1183–1189.
Tan, R.T., Nishino, K., Ikeuchi, K., 2004. Separating reflection components basedon chromaticity and noise analysis. IEEE Transactions on Pattern Analysis andMachine Intelligence 26 (10), 1373–1379.
Tan, R.T., Ikeuchi, K., 2005. Separating reflection components of textured surfacesusing a single image. IEEE Transactions on Pattern Analysis and MachineIntelligence 27 (2), 178–193.
Teillet, P.M., Guindon, B., Goodenough, D.G., 1982. On the slope-aspect correction ofmultispectral scanner data. Canadian Journal of Remote Sensing 8 (2), 84–106.
Tominaga, S., Wandell, B.A., 1989. Standard surface reflectance model andilluminant estimation. Journal of the Optical Society of America A 6 (4),576–584.
Tsai, F., Lou, H., Hsiao, K., 2005. Semiautomatic texture generation and transforma-tion for cyber city building models. In: IEEE Geoscience and Remote SensingSymposium, IGARSS, vol. 7, Seoul, Korea, 25–29 July. pp. 4980–4983.
Varshosaz, M., 2003. True realistic 3D models of buildings in urban areas.International Archives of Photogrammetry, Remote Sensing and SpatialInformation Sciences 34, (Part 5/W10) (on CD-ROM).
Wolff, L.B., 1996. Generalizing Lambert’s law for smooth surfaces. In: The FourthEuropean Conference on Computer Vision, vol. II. European Vision Society,Cambridge, UK, 15–18, April. pp. 40–53.
Zheng, L., Zhang, J., Luo, Y., 2006. Color matching in color remote sensing image.In: First International Multi-Symposiums on Computer and ComputationalSciences, IMSCCS’06, vol. 1, Hangzhou, China, 20–24 June. pp. 303–306.
Please cite this article in press as: Song, Y., Shan, J., Color correction of texture images for true photorealistic visualization. ISPRS Journal of Photogrammetry and RemoteSensing (2010), doi:10.1016/j.isprsjprs.2010.01.003