collective action and vulnerability - international food policy
TRANSCRIPT
COLLECTIVE ACTION AND VULNERABILITY
Burial Societies in Rural Ethiopia
Stefan Dercon, University of Oxford
John Hoddinott, International Food Policy Research Institute (IFPRI)
Pramila Krishnan, University of Oxford
Tassew Woldehannna, Addis Ababa University
The CGIAR Systemwide Program on Collective Action and Property Rights (CAPRi) is an initiative of the 15 centers of the Consultative Group on International Agricultural Research (CGIAR). The initiative promotes comparative research on the role of property rights and collective action institutions in shaping the efficiency, sustainability, and equity of natural resource systems. CAPRi’s Secretariat is hosted within the Environment and Production Technology Division (EPDT) of the International Food Policy Research Institute (IFPRI).
CAPRi Working Papers contain preliminary material and research results. They are circulated prior to a full peer review to stimulate discussion and critical comment. It is expected that most working papers will eventually be published in some other form and that their content may also be revised (http://dx.doi.org/10.2499/CAPRiWP83).
Copyright © June 2008. International Food Policy Research Institute. All rights reserved. Sections of this material may be reproduced for personal and not-for-profit use without the express written permission of but with acknowledgment to IFPRI. To reproduce the material contained herein for profit or commercial use requires express written permission. To obtain permission to reprint, contact the IFPRI Communications Division at [email protected].
CGIAR Systemwide Program on Collective Action and Property Rights (CAPRi) C/- International Food Policy Research Institute, 2033 K Street NW, Washington, DC 20006-1002 USA T +1 202.862.5600 • F +1 202.467.4439 • www.capri.cgiar.org
CAPRi Working Paper No. 83 June 2008

ABSTRACT
Collective action can help individuals, groups, and communities achieve common goals, thus contributing to poverty reduction. Drawing on longitudinal household and qualitative community data, the authors examine the impact of shocks on household living standards, study the correlates of participation in groups and formal and informal networks, and discuss the relationship of networks with access to other forms of capital. In this context, they assess how one form of collective action, iddir, or burial societies, help households attenuate the impact of illness. They find that iddir effectively deal with problems of asymmetric information by restricting membership geographically, imposing a membership fee, and conducting checks on how the funds were spent. The study also finds that while iddir help poor households cope with individual health shocks, but shows that the better-off households belong to more groups and have larger networks. In addition, where households have limited ability to develop spatial networks, collective action has limited ability to respond to covariate shocks. Therefore, realism is needed in terms of the ability of collective action to respond to shocks, and direct public action is more appropriate to deal with common shocks. Keywords: collective action, burial societies, shocks, vulnerability, poverty, networks, Ethiopia

ACKNOWLEDGMENTS
It is a pleasure to thank CAPRi for their support. This research was funded by the Federal Ministry for Economic Cooperation and Development, Germany. Other donors who contributed funding to the collection and analysis of the Ethiopia data include the Food-For-Peace Office of USAID, the World Food Programme, the Department for International Development, and BASIS CRSP under grant LAG-4213-A-00-6016-00. We have benefited from superb research assistance from Yisehac Yohannes, the helpful advice and comments from Tessa Bold, Ruth Meinzen-Dick, Michael Kirk, Alula Pankhurst, Agnes Quisumbing, an anonymous reviewer, and seminar participants at Phillips-Marburg University, IFPRI and the CAPRi Policy Conference, “Collective Action and Property Rights for Poverty Reduction” held in Entebbe, Uganda. Errors are ours.

Table of Contents
1. Introduction ............................................................................................. 1 2. Data and Context ...................................................................................... 3 3. Shocks in Rural Ethiopia ............................................................................. 5 4. Networks, Groups, and Collective Action ..................................................... 10 5. Iddir and their Role in Mitigating Shocks ..................................................... 15 References ................................................................................................ 23

1
COLLECTIVE ACTION AND VULNERABILITY Burial Societies in Rural Ethiopia
Stefan Dercon, John Hoddinott,1 Pramila Krishnan, and Tassew Woldehannna
1. INTRODUCTION
Collective action has both intrinsic and instrumental value. Being part of a group and participating towards meeting a common objective provides direct benefits to individuals. In the Ethiopian survey data used in this study, individuals who report having larger networks also report higher levels of happiness. Such correlations are not unique to Ethiopia. Using data from the World Values Survey (Helliwell and Putnam, 2004) found that individuals who report higher levels of individual and collective civic engagement also reported higher scores on measures of subjective well-being. Collective action is also a means to an end. For example, the joint management of irrigation canals, rangelands, and fisheries are actions by groups that allow individuals to generate higher and more sustainable incomes. The focus of this paper is a specific, instrumental dimension of collective action: the role of groups and networks in helping households in poor communities manage their exposure to risks and cope with shocks to their livelihoods.
In doing so, the paper builds on research addressing how poor households respond to shocks.2 These show that households can partially smooth consumption in the face of shocks, but not perfectly; as might be expected, idiosyncratic shocks (low or late rainfall on household plots) are more likely to be insured collectively than are generalized shocks (low rainfall on most plots in the village). In most empirical studies of risk-smoothing (Townsend, 1994), the insurance unit is often assumed to be the village. Studies using his approach often find that households are able to cope with idiosyncratic shocks, but not covariate shocks—implying that local insurance mechanisms are inadequate to cope with aggregate shocks. More recent studies (Munshi and Rosenzweig, 2005) have begun to question the assumption that the appropriate unit of risk-smoothing is the village. They suggest that consumption is smoothed within sub caste networks, which extend beyond the village. Indeed, the literature on migration and remittances suggests that networks can cross geographic boundaries, with the formation of migrant networks in the destination being affected by shocks in the origin locality (Munshi, 2003).
There is also a subset of studies that attempts to isolate the role of gift-giving and informal loans for households to cope with shocks; results indicate that households are not perfectly altruistic; the problems of asymmetric information and limited commitment mean that households are not likely to be fully insured (Ligon et al., 2000; Foster and Rosenzweig, 2000).3 However, such analyses do not assess
1 Corresponding author: [email protected] 2 See Morduch (2005) and references therein, the review paper by Skoufias and Quisumbing
(2005), and the recent collection edited by Dercon (2005). 3 However, Genicot and Ray (2003) show that with imperfect enforceability of contracts, stable
insurance groups can exist above or below village-level.

2
whether responses differ depending on the nature of the shock, and indicators for collective action and participation in different types of networks are generally are either absent or rudimentary. There are some exceptions. Fafchamps and Lund (2003) differentiate among different types of risk and specifically address how different networks are used. They show that risk-sharing appears to occur mostly in very small networks of close friends and families—networks that may not have the heterogeneity required to efficiently share risk. In Ethiopia, Dercon and Krishnan (2000) specifically address potential gender differences in terms of risk-coping, and find that poor women, particularly in one region, are less able to smooth consumption in the face of risks.
The collective action literature shows that the density of networks in general, and participation in more formal groups in particular, can lead to either more effective participation in community-based activities (White and Runge, 1994; Isham and Kahkonen, 2002) or higher household incomes (Pender and Scherr, 2002; Haddad and Maluccio, 2003; Narayan and Pritchett, 1999). However, there is a lack of consensus on the impact of heterogeneity on collective action. In most empirical studies where researchers use various measures of heterogeneity to examine the impact on collective action or on household incomes directly, the impact of any type of heterogeneity tends to be negative, or not significant (Ahuja, 1998; Alesina and La Ferrara, 2000; Bardhan, 2000; McCarthy and Vanderlinden, 2004; Place et al., 2004), with the interesting exception of results reported by Grootaert (2001). It is often hypothesized that heterogeneity of any sort makes finding agreements mutually beneficial and acceptable to all more costly, and that sociocultural heterogeneity in particular is likely to reduce trust among group members and also reduce the efficacy of social sanctioning (Easterly and Levine, 1997). On the other hand, much of the literature on group formation and networks highlights the added benefits to diversity (or heterogeneity) among members along any number of dimensions. Risk-pooling will certainly be more efficient when one’s income is less correlated with other members in the groups, which implies that having members with different agricultural activities and occupational structure is better for the insurance mechanism. Many networks exist to share information; clearly, if everyone has the same background and the same current sociocultural and economic profile, there is little need to rely on networks to share information. Finally, there may be economies of scope in terms of information gathering—or accumulation of other assets, for that matter. In this case, economic heterogeneity also favors pooling of resources to the benefit of all. Because there may be competing impacts of different types of heterogeneity on the functioning of groups, it becomes critical to examine which groups are able to harness the positive, and mitigate the negative effects, of heterogeneity.
Finally, if groups differ in terms of degree of heterogeneity and geographic dispersion, what kinds of enforcement mechanisms are used to ensure compliance to network objectives and norms of behavior? Members of local networks are easier to monitor, but local networks are less able to insure against covariate shocks. Spatially diversified networks offer some protection against covariate shocks, but network members will be more difficult to monitor. If information and communications technologies are poor, more distant network members may not even be aware of a shock that occurred in their origin communities.

3
Interest in these issues is more than just academic curiosity. Understanding these networks is as crucial to understanding the determinants of poverty and the policies to move people out of poverty as understanding land tenure or access to financial capital. A misunderstanding of the roles of these networks can lead to policy changes that have unintended consequences on the functioning of these networks, with potentially damaging effects on the capacity of the poor to mitigate, and cope with, the effects of shocks. At the same time, a better understanding of such networks can lead to the identification of policies that complement existing networks that already serve the poor well, and to policies that can substitute for networks that simply are not reaching the poor.
In the material that follows, we address these issues by drawing on rich longitudinal household and qualitative community data from Ethiopia. After describing these data in some detail, we examine the shocks these households face and their impact on living standards. We then look at the correlates of participation in groups and networks—both formal and informal—and the relationship of networks with access to other forms of capital. In the final substantive section, we pull these together to assess how one form of collective action, iddir (burial societies or funeral associations), allow households to attenuate the impact of illness.
2. DATA AND CONTEXT
Ethiopia is a federal country divided into 11 regions. Each region is sub-divided into zones and the zones into woredas, which are roughly equivalent to a county in the US or UK. Woredas, in turn, are divided into Peasant Associations (PA), or kebeles, an administrative unit consisting of a number of villages. Peasant Associations were set up in the aftermath of the 1974 revolution. Our data are taken from the Ethiopia Rural Household Survey (ERHS), a unique longitudinal household data set covering households in 15 areas of rural Ethiopia. Data collection started in 1989, when a survey team visited six Peasant Associations in Central and Southern Ethiopia. The survey was expanded in 1994 to encompass 15 Peasant Associations across the country, yielding a sample of 1477 households. As part of the survey re-design and extension that took place in 1994, the sample was re-randomized by including an exact proportion of newly formed or arrived households in the sample, as well as by replacing households lost to follow-up by others considered broadly similar to them in demographic and wealth terms by village elders and officials. The nine additional PAs were selected to better account for the diversity in the farming systems found in Ethiopia. The sampling in the PAs newly included in 1994 was based on a list of all households that was constructed with the help of the local Peasant Association officials.4 The sample was stratified within each village to ensure that a representative number of landless households were also included. Similarly, an exact proportion of female headed households were included via
4 The PA was responsible for the implementation of land reform following 1974 and held wide ranging powers as a local authority. All land is owned by the government. To obtain land, households have to register with the PA and, thus, lists are maintained of the households who have been allocated land. These household lists were a good source of information for the construction of a sampling frame.

4
stratification. Consequently, as Dercon (Dercon et al., 2005) shows, population shares within the sample are broadly consistent with the population shares in the three main sedentary farming systems—the plough-based cereals farming systems of the Northern and Central Highlands, mixed plough/hoe cereals farming systems, and farming systems based around enset (a root crop also called “false banana”), which is grown in southern parts of the country. Note too that in 1994, the Central Statistical Office collected a data set as part of the Welfare Monitoring System. Many of the average outcome variables, in terms of health and nutrition, were very similar to the results in the ERHS, suggesting that living conditions in our sample did not differ greatly from those found more generally throughout rural Ethiopia (Collier et al., 1997). For these reasons, the sampling frame to select the villages can be seen as one that was stratified by agro-ecological zones and subzones, with one to three villages selected per strata. Further, sample sizes in each village were chosen so as to approximate a self-weighting sample, when considered in terms of farming system: each person (approximately) represents the same number of persons found in the main farming systems as of 1994. However, we use this feature of the sample cautiously. It does not include pastoral households or urban areas. Also, the practical aspects associated with running a longitudinal household survey, when the sampled localities are as much as 1,000 kilometers apart in a country where top speeds on the best roads rarely exceed 50 kilometers per hour, constrained sampling to only 15 communities in a country of thousands of villages. So while these data can be considered broadly representative of households in nonpastoralist farming systems as of 1994, extrapolation from these results should be done with care.
Additional survey rounds were subsequently in late 1994, 1995, 1997, 1999, and 2004. These surveys were conducted, either individually or collectively, by the Economics Department at Addis Ababa University, the Centre for the Study of African Economies, the University of Oxford, and the International Food Policy Research Institute. Sample attrition between 1994 and 2004 is low, with a loss of only 12.4 percent (or 1.3 percent per year) of the sample over this 10-year period, in part because of this institutional continuity. This continuity also helped ensure that questions asked in each round were identical, or very similar, to those asked in previous rounds and that the data were processed in comparable ways.5 In addition, detailed qualitative studies were undertaken in the mid-1990s, the results of which are reported in Bevan and Pankhurst (1996).6 Smaller scale qualitative studies have been carried out in selected survey sites on specific topics, including some on collective action (see Section 5).
5 We examined whether this sample attrition is nonrandom. Over the period 1994-2004, there are no significant differences between attriters and non-attriters in terms of initial levels of characteristics of the head (age, sex), assets (fertile land, all landholdings, cattle), or consumption. However, attriting households were, at baseline, smaller than non-attriting households. Between 1999 and 2004, there are some significant differences by village with one village, Shumsha, having a higher attrition rate than others in the sample. Our survey supervisors recorded the reason why a household could not be traced. Using these data, we examined attrition in Shumsha on a case-by-case basis, but could not find any dominant reason why households attrited.
6 These are in the process of being updated, based on new fieldwork carried out in 2004 and 2005.

5
Table 1 provides descriptive statistics based on the 2004 survey round. Two features are immediately apparent. First, these households are very poor. Mean monthly consumption per capita was 106 birr or about US$13 per person and about 36 percent are below the poverty line. Second, agriculture is the dominant source of income for these households, accounting for two-thirds of household income.
Table 1. Descriptive characteristics of the Ethiopian sample, 2004
Characteristic Demographic Mean household size 5.7 people
Percent households that are female-headed 30.3%
Percent of household heads with any education 23.1%
Living standards
Monthly consumption per capita, Mean 106.2 birr
Monthly consumption per capita, Median 75.1 birr
Percent households below poverty line 36%
Income sources, percentages
Crop income 67%
Wage income 5%
Self-employment 19%
Transfers 8%
Source: Ethiopian Rural Household Survey, 2004.7
3. SHOCKS IN RURAL ETHIOPIA
We define shocks as adverse events that lead to a loss of household income, a reduction in consumption, a loss of productive assets, and/or serious concern/anxiety about household welfare. Data used in this section are based on a household-level shocks module (Hoddinott and Quisumbing, 2003). The module asks households to consider a list of adverse events and indicate whether the household was adversely affected by them. Ethiopian respondents were asked, “Has this household been affected by a serious shock—an event that led to a serious reduction in your asset holdings, caused your household income to fall substantially, or resulted in a significant reduction in consumption?”
Shocks are divided into a number of broad categories: climatic; economic; political/social/legal; crime; and health. Climatic shocks include obvious examples such as drought and flooding, but also erosion, frosts, and pestilence affecting
7 For details on construction of consumption and income aggregates and poverty line, see Dercon (Dercon et al., 2007). Monetary figures as in 2004 birr. At the time of the survey, the birr-US dollar exchange rate was approximately 8 birr to the dollar. Self-employment includes incomes from processing agricultural products (livestock, beer) and nonagricultural activities such as trading or selling firewood and charcoal. Transfers include both public and private transfers.

6
crops or livestock. Economic shocks include problems in terms of access to inputs (both physical access and large increases in price), decreases in output prices, and difficulties in selling agricultural and nonagricultural products. Political/social/legal shocks include the confiscation of assets or arbitrary taxation by government authorities, social or political discrimination, or exclusion and contract disputes. Crime shocks include the theft and/or destruction of crops, livestock, housing, tools or household durables as well as crimes against persons. Health shocks include both death and illness. We also consider miscellaneous shocks such as conflicts and disputes with other family members, neighbors, or other village residents regarding access to land or other assets. Finally, in addition to these questions about specific shocks, households were also asked to enumerate the three most important adverse shocks that they had experienced over the previous five years.
As Table 2 shows, virtually all households in the Ethiopian sample (95 percent) reported a most important shock, 85 percent reported a second most important shock, and 62 percent reported a third most important shock. The most commonly reported worst shocks are drought (47 percent), death (43 percent), and illness (28 percent). When we disaggregate by degree of importance of these worst shocks (not reported here), we see that these same three shocks were always listed as being the most important adverse shocks experienced by these households. Input and output shocks, pests affecting crops, and crime are all reported by between 11 and 14 percent of households. Other shocks are less frequently reported. Strikingly, policy shocks (land redistribution, state confiscation of assets, resettlement, villagization or forced migration, bans on migration, forced contributions, or arbitrary taxation), which featured so prominently in earlier rounds of the ERHS, have substantially diminished in importance. Only seven percent of households reported being adversely affected by such policy shocks compared to 42 percent who reported being affected by these prior to 1994 (Dercon and Krishnan, 2002; Table 1).
While these data provide a detailed overview of the types of shocks experienced by households, it does not give us a quantitative sense of their consequences. Also, there are limits to cross-sectional analysis—it is difficult to tell, for example, if, conditional on location, wealth, and other observable characteristics, female-headed households in Ethiopia are more adversely affected by droughts than male-headed households. For these reasons, we summarize the results of Dercon (Dercon et al., 2005), who reported an econometric assessment of the impact of these shocks on one measure of welfare, log per capita consumption.8
8 Consumption is the sum of food and nonfood consumption. For each food item, households were asked about the amounts they had consumed out of purchases, consumption out of own stock, and consumption from gifts and wages in-kind in the last week. In general, these consumption levels are valued using prices obtained from local market surveys fielded at the same time as the household survey. Nonfood items are limited to non-investment goods so that we include consumables such as matches, batteries, soap, kerosene and the like, clothing, and transport, but exclude investments in durable goods such as housing. Different recall periods were used for different items; for comparability all are changed into monthly (30-day) consumption and expressed in per capita terms. Dercon and Krishnan (2003) show that earlier survey rounds, using various permutations of adult equivalency, does not fundamentally affect the analysis of the determinants of living standards.

7
Table 2. Household self-reports of the worst shocks experienced between 1999 and 2004, Ethiopia
Worst shocks Percent
Most commonly reported
Drought 46.8
Death of head, spouse or another person 42.7
Illness of head, spouse or another person 28.1
Inability to sell outputs or decreases in output prices 14.5
Pests or diseases that affected crops 13.8
Crime 12.7
Difficulty in obtaining inputs or increases in input prices 11.3
Policy/political shocks (land redistribution, state confiscation of assets, resettlement, villagization, or forced migration, bans on migration, forced contributions, or arbitrary taxation) 7.4
Pests or diseases that affected livestock 7.0
Most commonly reported, by degree of importance
Most important shock Drought 32.6
Death of head, spouse, or another person 26.1
Illness of head, spouse, or another person 8.0
Second most important shock
Death of head, spouse, or another person 14.8
Drought 13.6
Illness of head, spouse, or another person 12.3
Third most important shock
Illness of head, spouse, or another person 12.2
Death of head, spouse, or another person 8.1
Drought 8.0
Source: the Ethiopian Rural Household Survey, Round 6.9
Log per capita consumption (lnpcexp) of household i in village v in time t is a
function of two broad sets of household characteristics: household characteristics observed in the past (time t-1) (Hiv, t-1) and shocks to households experienced between time t-1 and time t(Siv, t).10 Vectors of parameters to be estimated are γ, β,
9 1,371 households provided reported information; in response to the question, “what were the three most important shocks to affect this household,” 95 percent of households reported a most important shock, 85 percent reported a second most important shock, and 62 percent reported a third most important shock.
10 In very loose terms, the specification of equation (1) can be thought of as one where, á la Friedman, consumption reflects the underlying asset base (which generates “permanent income”) as well as transitory events that cause consumption to deviate from this level.
We also include a vector that captures such potentially confounding factors such as the month in which the interview took place to capture seasonality.

8
and κ. In Ethiopia, log per capita consumption is measured in 2004, while past household characteristics from 1999 are used as regressors. Denoting εiv, t as the white noise disturbance term, we write this relationship as
lnpcexpiv, t = γ · Hiv, t-1 + β · Siv, t + κ · Xiv, t + εiv, t . (1) Observable household characteristics are characteristics of the head (age,
sex, and schooling), demographic household characteristics (log size and dependency ratio), and household wealth: landholdings and livestock ownership, the latter expressed in livestock units. Also included are measures of households’ networks and connections within the village that may also affect consumption levels: whether the household belongs to an ethnic or religious minority; whether it is related to anyone holding an official position in the locality; and whether a parent of the household head was an important person in the social life of the village. As some shocks are relatively more common than others, we aggregate the data we have on shocks into several categories, whether the household had experienced the following events that had led to a loss of household income, a reduction in consumption, and/or a loss of productive assets; a drought; too much rain, pests or diseases that affected field crops or crops in storage; pests or diseases that affected livestock; difficulty in obtaining inputs or increases in input prices; inability to sell or decreases in output prices; lack of demand for nonagricultural products; theft or destruction of tools, inputs, cash, crops, livestock, housing or consumer goods, death of head, spouse or another person; and illness of head, spouse, or another person. Finally, dummy variables are included for each village in Ethiopia. The implication is that shocks are identified by within-village (municipality) variation, which may make identification of covariate shocks difficult. However, even though covariate shocks are found in virtually all villages, even in the case of drought, there is no village where all households indicate having been affected in the last five years in Ethiopia. This allows us to identify of the impact of these relatively covariate events in our data.
Basic results (Dercon et al., 2005) are reported in Table 3. The striking feature of the results of the shocks variables is how unimportant many of them seem to be. Experiencing a drought at least once in the previous five years lowers per capita consumption by approximately 20 percent and experiencing an illness that reduces per capita consumption by approximately 9 percent are the only shock variables that have a statistically significant effect on consumption. Other past shocks, controlling for a wide range of household characteristics, have no statistically significant impact on current (2004) levels of consumption. Table 3, however, examines only the average effects of these shocks across all households in the sample. In Table 4 we extend this earlier work by disaggregating along three dimensions of pre-shock (1999) household characteristics—sex of head, landholdings, and location—and explore the extent to which the impact of shocks differs across different household types. When we do so, some interesting differences do emerge: drought shocks have a more severe effect on female-headed households and on poorer households as measured by landholdings; and illness shocks matter much more in survey areas south of Addis Ababa, where malaria is much more common. We return to this latter below.

9
Table 3. Impact of shocks and other covariates on (log) consumption per capita, 2004, Ethiopia11
Covariate Estimated coefficient
(1) t statistic (absolute
value)
(2) t statistic (absolute
value)
Shocks in prior five years
Drought -0.182 3.03* 2.49
Floods 0.025 0.59 0.28
Pests or diseases that affected field crops or crops in storage -0.001 0.05
0.01
Pests or diseases that affected livestock 0.003 0.05 0.05
Difficulty in obtaining inputs or increases in input prices 0.058 1.00
1.11
Inability to sell outputs or decreases in output prices -0.076 1.16
1.06
Lack of demand for nonagricultural products -0.108 0.93 0.83
Theft or destruction of tools, inputs, cash, crops, livestock, housing, or consumer goods (crime) 0.051 0.96
0.71
Death of head, spouse, or another person 0.025 0.59 0.63
Illness of head, spouse, or another person -0.096 1.91* 1.68
Other controls
Female-headed, 1999 -0.024 0.45 0.39
Log age head, 1999 0.092 1.25 1.30
Head has schooling, 1999 0.082 1.39 2.19**
Log household size, 1999 -0.284 6.36** 8.43**
Dependency ratio, 1999 -0.033 1.92* 2.39**
Household in second land quintile, 1999 0.062 0.98 1.10
Household in third land quintile, 1999 0.140 2.29** 1.63
Household in fourth land quintile, 1999 0.143 2.27** 2.21**
Household in top land quintile, 1999 -0.036 0.49 0.42
Livestock units, 1999 0.035 4.05** 3.64**
Member, ethnic minority 0.192 2.89** 2.94**
Member, religious minority 0.064 1.11 0.79
Relative holds official position in PA 0.124 2.99** 3.39**
Mother or father was important in social life of village 0.170 3.93**
3.18**
R2 0.31
Sample size 1,281
11 Notes: Standard errors are calculated using Huber-White method; *Significant at the 10 percent level; **significant at the 5 percent level; PA dummies are also included but not reported.

10
Table 4. Impact of shocks, by household characteristic on (log) consumption per capita, 2004, Ethiopia12
Male-headed
households
Female-headed
households
Household is in
bottom three land quintiles
Household is in top two land quintiles
Village is
located north of
Addis Ababa
Village is located south of
Addis Ababa
Drought -0.086 (1.21)
-0.433 (3.77)**
-0.189 (2.50)**
-0.152 (1.55)
-0.238 (3.63)**
-0.295 (3.07)**
Floods 0.061 (0.89)
-0.097 (0.77)
-0.002 (0.03)
0.092 (0.95)
-0.094 (0.88)
0.086 (1.17)
Pests or diseases that affected crops
-0.001 (0.02)
0.011 (0.10)
0.003 (0.04)
0.011 (0.12)
0.027 (0.29)
-0.037 (0.58)
Pests or diseases that affected livestock
0.035 (0.56)
-0.037 (0.22)
-0.067 (0.85)
0.048 (0.53)
0.003 (0.03)
-0.021 (0.30)
Difficulty in obtaining inputs or increases in input prices
0.084 (1.37)
-0.050 (0.32)
0.041 (0.56)
0.114 (1.20)
-0.062 (0.53)
0.099 (1.34)
Inability to sell outputs or decreases in output prices
-0.063 (0.93)
0.068 (0.36)
0.042 (0.56)
-0.164 (1.56)
0.122 (0.58)
-0.098 (1.47)
Lack of demand for nonagricultural products
-0.111 (0.91)
-0.270 (0.97)
-0.072 (0.50)
-0.358 (1.75)*
0.026 (0.11)
-0.317 (2.09)**
Crime shocks 0.010 (0.17)
0.204 (1.68)
0.010 (0.15)
0.118 (1.28)
-0.057 (0.61)
0.094 (1.46)
Death of head, spouse or another person
0.057 (1.20)
-0.178 (1.92)*
0.027 (0.50)
0.049 (0.70)
0.107 (1.70)*
-0.027 (0.46)
Illness of head, spouse or another person
-0.076 (1.43)
-0.146 (0.96)
-0.058 (0.89)
-0.168 (2.05)**
-0.003 (0.04)
-0.143 (2.17)**
4. NETWORKS, GROUPS, AND COLLECTIVE ACTION
Having described the broader environments that our respondents live in and the effects of shocks on them, our next step is to consider the role of collective action in mitigating these.
In the 2004 survey round, households were asked to provide details “about the five most important people you can rely on in time of need for support, both within the village and elsewhere.” In addition, they were asked whether there were other people, beyond these five, who could be relied on for help in time of need. We call such individuals a “network,” and in this section we provide descriptive statistics on three dimensions of these networks: correlations between network size and observable household characteristics; characteristics of individuals within a household’s network; and the degree of network heterogeneity.
12 Notes: Specification as per Table 3; standard errors are calculated using Huber-White method; *Significant at the 10 percent level; **significant at the 5 percent level.

11
Virtually all households—91 percent—report that there is at least one person they can rely on for assistance. Figure 1 plots a density function for the size of networks reported by these households. The median number of people in a households’ network is five with about a quarter of households reporting that they have two or fewer people in their network and a smaller percentage (16 percent) reporting 10 or more people in their network. Further, there is some evidence that households do indeed call on these networks. Respondents indicate that they received help from 86 percent of the individuals they list as part of their network. There is also some evidence of reciprocity in these relationships: in 75 percent of the individuals listed as being in a household’s network, households had both received and provided assistance in the past. In fewer than 10 percent of individuals listed as part of a network had assistance neither been given nor received.
Figure 1. Network size, Ethiopia
Table 5 provides descriptive statistics on some of the characteristics of
individuals found in these networks. Most individuals in these networks are neighbors (60 percent) or, while not neighbors, live in the same village (27 percent). However, just over a quarter have at least one plot of land adjacent to a plot held by the household. Only 13 percent of individuals in households’ network reside outside the village. The most common relationship is either being a relative or being a member of the same iddir; indeed, only 12 percent of network members are neither relatives nor members of the same iddir. Network members are often (49 percent) individuals whom previously the household had borrowed from or lent
0
.02
.04
.06
.08
Den
sity
0
10
20
30
40 Number of people in network

12
to. They are unlikely to be individuals with whom the household sharecrops, hires in, or hires out labor or buys or sells crops.
Table 5. Characteristics of individuals in a household’s network, Ethiopia
Percentage of individuals who are Percent
Neighbors 60
Not neighbors, but in same village 27
Not neighbors, live outside village 13
Have plot(s) of land next to plots belonging to this household
28
Members of the same mehabir (social group) 21
Relative 66
Belong to same iddir (burial society) 57
Neither relative nor member of same iddir 12
Members of the same labor-sharing group 43
Partners in sharecropping or land renting arrangement 6
Partners in oxen sharing arrangement 23
Members of the same iqqub 7
Borrow or lend money 49
Do wage work 7
Buy or sell crops 4
Are other network members similar or dissimilar to our respondents? We consider two dimensions: comparative measures of wealth and age. If we stratify the sample by landownership, we find that poorer households have relatively better-off households in their network while richer households tend to have relatively poorer households in their network. However, when we compare oxen ownership, a different pattern emerges. Households with no oxen or only one animal tend to have as network partners similar households. Households with two or more oxen typically have as network partners other households with two or more oxen. Figure 2 graphs the distribution of the difference in age between the household head and other individuals in the network who are either relatives or members of the same iddir. The modal age difference for both is close to zero. However, while the distribution for age differences among iddir members is more peaked than for relatives, both are characterized by a considerable spread around this mode.
Table 6 examines the associations between household characteristics and the likelihood that a household has a network as well as the size of that network. The first column reports the results of estimating a probit where the dependent variable equals one if the household has at least one person in its network, and zero otherwise. To make the coefficients readily interpretable, we report the marginal effects of the regressors in column 1. In columns 2 and 3, we report the determinants of the size of the household’s network. Because our estimates need to

13
take account of the fact that the dependent variable is censored at zero, we use a tobit estimator and this is reported in column 2.13
Figure 2. Age differences with networks, Ethiopia
There are few household characteristics that are associated with an increased
or decreased likelihood that a household has at least one person in its network. The only statistically significant characteristics are whether the household’s landholdings lie within the second to fifth quintiles within the village and whether the father of the household head belonged to an iddir that marginally increases (by 4.8 percent) the likelihood that the household has at least one person in its network. However, being wealthier, as defined in terms of landholdings, is associated with having a larger network. Households in the fourth and top land quintiles have one to two more people in their network compared to the households in the bottom quintile of landholdings. Larger households and households where the head has any formal schooling have larger networks. Family background also plays some role in influencing network size. Having a parent who was an important person in social life of the village, having a relative who holds an official position within the village, and
13 Because estimates derived from a tobit are suspect if the underlying disturbance terms are non-normally distributed, we also report the results of estimating Powell’s (1984) censored least absolute deviations model. We report t-statistics based on bootstrapped standard errors; following Davidson and Mackinnon (2000), these are based on 1,000 replications.
0
.005
.01
.015
.02
.025
-50
0
50 Age difference between head and network partner
Age differences, iddir Age differences, relatives
Den
sity

14
having a father who belonged to an iddir all increase the mean number of persons in a household’s network. Lastly, households belonging to ethnic or religious minorities are not disadvantaged when it comes to network size.14
Table 6. Correlates of the presence of networks and their size, Ethiopia15
(1) (2) (3)
Probit (Dependent
variable: Household has
at least one person in network)
Tobit (Dependent
variable: Number of people in
household’s network)
Censored least absolute
deviations (Dependent
variable: Number of people in
household’s network)
Household is in second landowning quintile†
0.032 (2.28)**
0.039 (0.04)
0.607 (1.21)
Household is in third landowning quintile†
0.040 (3.15)**
0.527 (0.60)
0.685 (1.32)
Household is in fourth landowning quintile†
0.050 (3.67)**
1.904 (2.18)**
1.856 (3.97)**
Household is in highest landowning quintile†
0.031 (2.18)**
3.037 (3.07)**
1.726 (2.52)**
Log of age of head -0.039 (1.81)*
0.357 (0.34)
-0.114 (0.17)
Female-headed household† -0.004 (0.28)
-0.938 (1.29)
-0.212 (0.51)
Head has schooling† 0.024 (1.55)
2.081 (2.57)**
0.951 (1.78)*
Log household size -0.008 (0.64)
1.302 (2.15)**
0.443 (1.27)
Household head born in this village† -0.003 (0.20)
-1.164 (1.59)
-0.682 (1.57)
Mother or father was important person in social life of village†
-0.007 (0.60)
0.814 (1.24)
0.977 (2.52)**
14 We note that De Weerdt (2005) obtains similar results in Tanzania, finding that kinship and wealth are also strong determinants of network formation. Fafchamps and Lund (2003) also find that in the Philippines, pre-existing personal relationships, rather than risk-pooling, dominate reasons for network formation.
15 Notes: 1) Results of probit are presented in terms of the marginal effects of the regressors; dummy variables measure marginal impact of switching from zero to one; 2) Covariates marked with a † are dummy variables; 3) In column 1, absolute value of Z statistics are in parentheses; in columns 2 and 3, absolute values of t statistics are in parentheses. Standard errors in column 1 are heteroscedastic-robust. Standard errors calculated in column 3 use a bootstrap with 1,000 replications; 4) *Significant at the 10 percent level; **significant at the 5 percent level; and 5) PA dummies are included but not reported. Sample size is 1,124.

15
Relative holds official position 0.020 (1.62)
1.378 (2.22)**
1.111 (2.72)**
Father belonged to an iddir† 0.048 (3.25)**
2.395 (3.38)**
0.878 (2.13)**
Household belongs to an ethnic minority in PA†
-0.018 (0.73)
-0.582 (0.60)
0.309 (0.52)
Household belongs to religious minority in PA†
0.002 (0.11)
0.988 (1.22)
0.100 (0.20)
5. IDDIR AND THEIR ROLE IN MITIGATING SHOCKS
In this section, we consider the role of one form of collective action—iddir, burial societies or funeral associations, and their role in mitigating shocks in Ethiopia. Members of iddir typically meet once or twice a month, making a small payment into a group fund (1-2 birr per month). A striking feature of these organizations is their degree of formality; often there are written rules and records of contributions and payouts (Dercon et al. 2006).16 When a member dies, the iddir makes a payment to surviving family members in cash or in kind—the median amount paid out by the iddir that our households belong to is 100 birr, although there is some heterogeneity in these payments.17
Outside of Tigray, iddir membership is widespread, with nearly 90 percent of households reporting that they belong to at least one iddir. Among households who report belonging to iddir (and again excluding Tigray, where iddir do not exist), just under 60 percent report belonging to one iddir, 21 percent belong to two, and another 20 percent belong to three or more. Very few households, around 4 percent of the sample, claim that they do not belong to an iddir because they cannot afford the monthly dues. Virtually all iddir (93 percent) are situated within the PA. Two-thirds of iddir appear to have no restrictions on membership beyond paying the necessary dues and fees, 14 percent were restricted to members of the same church or mosque, 6 percent were restricted to women, and 14 percent had some other restriction. All villages had at least one iddir that was open to anyone.18
Why are iddir of interest? In addition providing what is in effect a form of life insurance, a third of the iddir these households belong to provide cash payouts to their members when they have experienced other types of adverse shocks and a quarter offer loans. As Table 7 shows, the most common form of assistance apart
16 Also see the descriptions found in Dejene (1993, 1998) and Pankhurst (2003). Note that these characteristics are consistent with a number of the factors identified by Ostrom (Ostrom et al.,1994) as necessary for successful collective action, including the ability to collectively modify rules, the existence of sanctions and conflict resolution mechanisms and a functioning management system.
17 One birr is equal to approximately US$0.12 so that 100 birr is about US$13. 18 In preliminary work, we examined the correlates of iddir membership. Wealthier households are
more likely to join iddir, and to join more than one iddir, but the magnitude of these effects is not large. Larger households and households where the father of the head had been an iddir member are more likely to join iddir. However, being a female-headed household or belonging to an ethnic or religious minority had no statistically significant impact on the likelihood or extent of iddir membership. Full results are available on request.

16
from funerals is cash payouts in cases of fires. In addition, 10 percent of iddir provide cash in case of illness and 15 percent provide loans. However, the provision of some types of assistance is not found everywhere—for example, assistance in the case of illness is concentrated in four survey sites, all south of Addis Ababa. Noting this, we juxtapose the following observations: 1) after drought, households report that the two next most important types of shocks are illness and death (Table 2); 2) illness shocks have an especially large effect on consumption in villages located south of Addis Ababa (Table 4); 3) membership in iddir is widespread, and other iddir members are seen as being individuals who can be called on in times of need (Table 5); and 4) in selected localities, some iddir provide assistance when illness shocks occur (Table 7).
Table 7. Events for which iddir make payouts or offer loans
Event Iddir will give a cash transfer
Iddir will give a loan
(percent) (percent)
Funeral 100 9
Fire 20 9
Loss of oxen or other livestock
7 3
Destruction of house 6 4
Wedding 5 5
Illness 10 15
Harvest loss 3 2
Other event 6 1
Any event 34 25
Two questions arise: 1) does this provision of assistance when illness shocks occur—in effect a form of health insurance—reduce their impact on consumption; and 2) if the answer to question one is affirmative, how do these iddir overcome problems of moral hazard and adverse selection that typically bedevil insurance schemes.
Answering question one is tricky because households can choose which iddir they wish to belong to. Because membership in iddir is endogenous, we cannot, for example, insert membership in iddir providing health insurance into one to see how it modifies the impact of self-reported illness shocks—coefficients from such a regression will be biased and inconsistent. Instead, we take a different approach. We start by restricting the sample to villages south of Addis Ababa, where, in general, illness shocks have the largest effect on consumption. We separate these southern villages into two groups: those where iddir that provide health insurance are present, and those where they are not present. Within these groups of villages, we estimate equation one using a modification of the specification reported in Table 3.19 Finally, we restrict the sample to households in the lowest three landholding
19 Specifically, in order to conserve degrees of freedom, we drop a number of variables that do not have explanatory power: age and sex of household head and four shocks: input prices, output prices,
17
quintiles to see if the availability of such insurance is particularly important for poorer households.
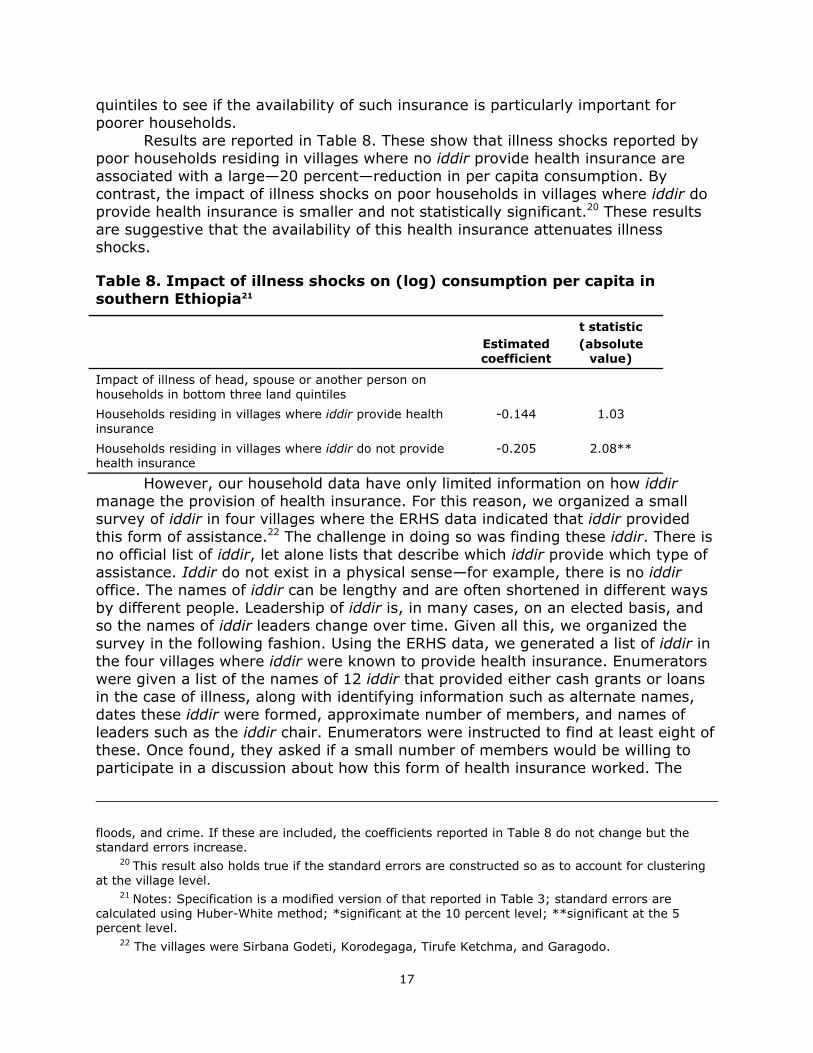
Results are reported in Table 8. These show that illness shocks reported by poor households residing in villages where no iddir provide health insurance are associated with a large—20 percent—reduction in per capita consumption. By contrast, the impact of illness shocks on poor households in villages where iddir do provide health insurance is smaller and not statistically significant.20 These results are suggestive that the availability of this health insurance attenuates illness shocks.
Table 8. Impact of illness shocks on (log) consumption per capita in southern Ethiopia21
Estimated coefficient
t statistic (absolute
value)
Impact of illness of head, spouse or another person on households in bottom three land quintiles
Households residing in villages where iddir provide health insurance
-0.144 1.03
Households residing in villages where iddir do not provide health insurance
-0.205 2.08**
However, our household data have only limited information on how iddir manage the provision of health insurance. For this reason, we organized a small survey of iddir in four villages where the ERHS data indicated that iddir provided this form of assistance.22 The challenge in doing so was finding these iddir. There is no official list of iddir, let alone lists that describe which iddir provide which type of assistance. Iddir do not exist in a physical sense—for example, there is no iddir office. The names of iddir can be lengthy and are often shortened in different ways by different people. Leadership of iddir is, in many cases, on an elected basis, and so the names of iddir leaders change over time. Given all this, we organized the survey in the following fashion. Using the ERHS data, we generated a list of iddir in the four villages where iddir were known to provide health insurance. Enumerators were given a list of the names of 12 iddir that provided either cash grants or loans in the case of illness, along with identifying information such as alternate names, dates these iddir were formed, approximate number of members, and names of leaders such as the iddir chair. Enumerators were instructed to find at least eight of these. Once found, they asked if a small number of members would be willing to participate in a discussion about how this form of health insurance worked. The
floods, and crime. If these are included, the coefficients reported in Table 8 do not change but the standard errors increase.
20 This result also holds true if the standard errors are constructed so as to account for clustering at the village level.
21 Notes: Specification is a modified version of that reported in Table 3; standard errors are calculated using Huber-White method; *significant at the 10 percent level; **significant at the 5 percent level.
22 The villages were Sirbana Godeti, Korodegaga, Tirufe Ketchma, and Garagodo.

18
meetings included the iddir chair and, in nearly all cases, at least two other individuals knowledgeable about the functioning of the iddir, including the treasurer. Across all four villages, a semi-structured questionnaire was administered to 33 iddir. Some questions were pre-coded (for example, “Are members charged interest if they take a loan to cover health expenses?”) while others were designed to encourage iddir members to explain how they functioned (for example, “How do members go about requesting assistance?”).
The successful provision of insurance revolves around the resolution of two forms of asymmetric information, adverse selection and moral hazard. In the context of health insurance, adverse selection arises because individuals who are less healthy than others have a greater incentive to seek insurance but the healthiness of such individuals is difficult to observe by the insurer. Moral hazard occurs where, once insured, an individual does not bear the full consequences of actions which are (at least partially) unobserved by the insurer.
How do iddir deal with these problems of asymmetric information? One obvious way would be to impose restrictions on who can join and when they join. The household survey asked iddir participants if their iddir restricted membership in any way. In the four villages where health insurance is offered, most (81 percent) iddir described by respondents imposed some sort of membership restriction. As Table 9 shows, the most common restriction was geographic—all members had to live in the same Peasant Association (PA). Other common restrictions include belonging to the same church or mosque or being women-only. Membership restrictions based on clan, ethnicity, or youth were not common and beyond these broad categories, no other restrictions were mentioned. Iddir that imposed certain types of membership restrictions—based on residing in the same PA or church/mosque—were more likely to provide health insurance than those that did not (see Table 9), even after taking into account other iddir characteristics, such as age, number of members, and location (see Table 10). In the iddir survey, a number of respondents commented that this restriction exists largely because it was impractical for members to attend monthly meetings if they live too far away, a point we return to below. By contrast, there does not appear to be restrictions on when individuals can join these iddir. In almost all cases, new members could join at any time and only two required that new members belonged for a minimum length of time before they are eligible for assistance with health shocks. However, individuals who join after the iddir is formed must pay a membership fee (Dercon et al., 2006).

19
Table 9. Characteristics of iddir, by provision of health insurance23
Percentage of iddir that
Membership restriction
Percentage of iddir with
this restriction
Do not provide health
insurance
Provide health
insurance
Prob value on
difference
Must reside in PA 41.0% 23.5% 38.1% 0.04**
Must belong to the same clan 4.0 28.3 57.1 0.10*
Must belong to the same church or mosque 24.9 26.2 39.5 0.10*
Must belong to the same ethnic group 4.0 28.5 50.0 0.19
Youth only 4.0 30.0 14.3 0.37
Women only 23.7 30.3 26.8 0.67
All 33 surveyed iddir stated that members who wanted to request assistance should do so before they incurred any expenditures; only two would consider requests from members after expenditures are incurred. Further, assistance is almost always limited to direct medical expenses: only one iddir would provide funds to pay for hiring workers to assist with agricultural tasks; only one iddir would pay for hiring someone to assist with domestic tasks; and none would compensate for loss of income as a result of illness.
Table 10. Correlates of the provision of health insurance in selected survey areas24
Covariate Marginal effect z statistic
(absolute value)
Membership restriction
Must reside in PA† 0.197 2.15**
Must belong to the same clan† 0.174 0.81
Must belong to the same church or mosque† 0.210 2.12**
Women only† 0.060 0.62
Log age of iddir -0.074 1.58
Iddir in 2nd, 3rd of 4th quartile for size† 0.139 1.79*
The feature uniting these shared characteristics is the way in which they address the problem of asymmetric information. Restricting membership geographically makes it easier to learn about members and to monitor their
23 Notes: *significant at the 10 percent level; **significant at the 5 percent level. 24 Notes: Results of probit are presented in terms of the marginal effects of the regressors;
dummy variables measure marginal impact of switching from zero to one. Covariates marked with a † are dummy variables. Standard errors are calculated using Huber-White method; *significant at the 10 percent level; **significant at the 5 percent level; PA dummies are included but not reported. Sample size is 169.

20
behavior. The same is true about the requirement for common church or mosque membership.25 Direct medical costs are observable. For example, one iddir reported that his neighbors serve as an informant. For example, if the member takes the money for medication and if he does not go to clinic/hospital, he will be asked to return the money. Other means of checking include going to the home of the member and asking to see receipts. In fact, about a third of the iddir surveyed stated that they had formal checks in place to make sure these funds were spent on medical related costs. Second, a considerable number of iddir conducted background checks prior to approving a grant or loan—visiting the member at home or asking neighbors to confirm that assistance was needed. By contrast, compensation for income loss is much more problematic because it is difficult to determine how much of the income loss was directly ascribable to illness. The one component that these mechanisms do not address is that of adverse selection; here in the guise that individuals who might anticipate having to incur medical expenses in the future would join with the express purpose of accessing funds held by the iddir. While iddir do not prevent this directly—recall that new members can join at any time and very few restrict new members’ access to health insurance—the imposition of a membership fee for new members discourages such behavior.
In addition to these mechanisms for dealing with informational asymmetries, these iddir take a number of steps to reduce the likelihood that the provision of health insurance will lead to financial difficulties for the iddir. One is their age structure. As Figure 2 shows, there is considerable dispersion in the distribution of ages of iddir members. As a result, there is—in effect—health insurance across generations as young members contribute to the iddir while older members are more likely to have age-related illnesses. Another observation consistent with this argument is that youth-only iddir are less likely, related to other iddir, to provide health insurance.
A second mechanism is size. Preliminary work with the ERHS data suggested a non-linear relationship between the likelihood of providing assistance with iddir in the second, third or fourth quartiles, as ranked by size, being slightly less likely to provide health insurance (see Table 10). Third, what is especially interesting is that the amount of money provided to members, either in the form of cash or loans, is tied fairly tightly to the amount of money iddir collect each month. Figure 3 shows that the 33 surveyed iddir are fairly conservative in this regard. The median iddir providing cash grants provides an amount equal to one month’s income, and the maximum cash grant of the iddir at the 75th percentile is slightly more than two month’s income. Loans as a ratio of monthly income tend to be higher than cash grants. However, while few (4/33) iddir charge interest on these loans, about 75 percent require repayment within three months. In addition, most (82 percent) impose sanctions if members do not repay: either taking the individuals to local court or prohibiting them from making monthly contributions. The latter is especially effective because members who fail to make monthly contributions risk forfeiting their claim to their past contributions.
25 Another advantage of church or mosque membership is that observance of certain religious principles—such as prohibitions on smoking and drinking; the encouragement of monogamous relationships—discourages adverse selection problems (sinners need not apply) while reducing moral hazard.

21
To summarize, health shocks have serious consequences for consumption levels of rural Ethiopian households. In some localities, where a form of collective action—iddir or burial societies—provide a form of health insurance and in these villages, illness shocks appear to have smaller effects on consumption. These iddir have managed to address problems of asymmetric information by imposing membership restrictions that reduce the cost of obtaining information; restricting assistance to an observable component of illness shocks; and by using membership fees to discourage adverse selection. Further, they use a number of mechanisms to ensure financial sustainability: age structure, grant and loan size relative to income, and a series of mechanisms to ensure timely repayment of loans.
Figure 3. Ratio of cash grants and loans to monthly iddir income
0.5
1
2
0.6
1.3
2.1
0.9
1.7
2.5
1.6
2.4
4.6
0
0.5
1
1.5
2
2.5
3
3.5
4
4.5
5
25th percentile Median 75th percentile
Typical cash to income Max cash to income Typical loan to income Max loan to income
6. CONCLUSIONS AND POLICY IMPLICATIONS
Using longitudinal data and qualitative survey work, we have attempted to understand the role of groups and networks in determining how the poor manage their exposure to risks and cope with shocks to their livelihoods. In these Ethiopian villages, drought and illness have especially malign effects; for example, illness shocks reduce per capita consumption by 9 percent in regions where malaria is endemic. Nearly all households in the ERHS report that they have a network of individuals whom they can call on for help. These networks consist largely of other households in the same village. This suggests that the scope for addressing covariate risks is likely to be limited, a supposition borne out by the observation, made in Section 3, that drought shocks lead to reductions in household consumption levels. Individuals within these networks would appear to engage in

22
reciprocal assistance. Further, they typically have other ties; in particular, they are relatives, members of the same iddir, or members of the same labor-sharing group. Better-off households tend to have larger networks as do households whose relations (parents or other relatives) had either status or connections within the village. Network heterogeneity is mixed: network members tend to be varied when measured by age or landownership but not in terms of ownership of oxen. Iddir providing health insurance are homogeneous along some dimensions (geography, and to a certain extent, religion) but heterogeneous with respect to age. They impose membership restrictions that reduce the cost of obtaining information and restrict assistance to an observable component of illness shocks (medical expenditures) that can be verified; further, they limit the extent of their assistance so that the provision of assistance does not come at the cost of financial sustainability.
These results point to the following policy implications: • Realism is needed in assessing the pro-poor benefits of support to
collective action. Because wealthier and better-educated households tend to participate more in groups and to have larger networks, development practitioners need to pay more attention to identifying those barriers that prevent the poor—or other segments of the population—from participating in collective action. Not only because they have lower levels of wealth, but also because they participate less in risk-smoothing networks, the poor are more likely to be vulnerable to both covariate and idiosyncratic shocks.
• Realism is also needed in terms of the role of collective action in responding to shocks. Specifically, where households have limited ability to develop spatial networks, collective action has limited ability to respond to covariate (common) shocks. Direct public action is more appropriate in this area.
• Collective action may be more suitable for providing an insurance function in response to idiosyncratic (individual) shocks. Public action and policy that supports forms of collective action in this area must recognize, as exemplified by the iddir study here, that successful collective action:
o is based on norms of trust and reciprocity. As trust is easier to destroy than create, the principal of “do no harm” is important here, particularly when government actions are aimed toward existing collective action institutions;
o has mechanisms for overcoming information problems; and o has mechanisms for sanctioning individuals who break the rules.
• Iddir providing health insurance exist in only some of the villages where illness shocks are prevalent and costly. Supporting the dissemination of examples of good practice across space—helping create associations of associations for example, would be valuable.
23
REFERENCES
Ahuja, V. 1998. Land degradation, agricultural productivity, and common property: Evidence from Côte d’Ivoire. Environment and Development Economics 3: 7-34.
Alesina, A. and E. La Ferrara. 2000. Participation in heterogeneous communities. Quarterly Journal of Economics 115 (3): 847−904.
Bardhan, P. 2000. Irrigation and cooperation: An empirical analysis of 48 irrigation communities in South India. Economic Development and Cultural Change 48 (4): 847-865.
Bevan, P. and A. Pankhurst, eds. 1996. Ethiopian village studies. Bath, U.K.: University of Bath.
Collier, P., S. Dercon, and J. Mackinnon. 1997. Social Sector Review—Per II, Ministry of Finance. Addis Ababa: Government of Ethiopia.
Davidson, R. and J. Mackinnon. 2000. Bootstrap tests: How many bootstraps? Econometric Reviews 19: 55-68.
Dejene, A. 1993. The informal and semiformal financial sectors in Ethiopia: A study of the iqqub, iddir and savings and credit cooperatives. AERC Research Paper 21. Nairobi: African Economics Research Consortium.
________. 1998. The iddir theory and practice. Department of Economics, Addis Ababa University. Photocopy.
Dercon, S. 2002. Income risk, coping strategies and safety nets. World Bank Research Observer 17 (2): 141-166.
________, ed. 2005. Insurance against poverty. Oxford: Oxford University Press.
Dercon, S. and P. Krishnan. 2000. In sickness and in health: Risk sharing within households in rural Ethiopia. Journal of Political Economy 108 (4): 688-727.
Dercon, S., J. Hoddinott, and T. Woldehanna. 2005. Consumption and shocks in 15 Ethiopian Villages, 1999-2004. Journal of African Economies 14: 559-585.
Dercon, S., J. Hoddinott, and T. Woldehanna. 2007. Growth and poverty in rural Ethiopia: Evidence from 15 communities 1994-2004. International Food Policy Research Institute, Washington, D.C. Photocopy.
Dercon, S., J. De Weerdt, T. Bold, and A. Pankhurst. 2006. Group-based funeral insurance in Ethiopia and Tanzania. World Development 34 (4): 685-703.
De Weerdt, J. 2005. Risk sharing and endogenous network formation. In Insurance against poverty, S. Dercon, ed. Oxford: Oxford University Press.
Easterly, W. and R. Levine. 1997. Africa’s growth tragedy: Policies and ethnic divisions. Quarterly Journal of Economics 112 (4): 1203-1250.
Fafchamps, M. and F. Gubert. 2004. The formation of risk sharing networks. University of Oxford. Photocopy.
Fafchamps, M. and S. Lund. 2003. Risk sharing networks in rural Philippines. Journal of Development Economics 71: 261−287.
Foster, A. and M. Rosenzweig. 2000. Financial intermediation, transfers, and commitment: Do banks crowd out private insurance arrangements in low-income rural areas? In Sharing the wealth: Demographic changes and economic transfers between generations, A. Mason and G. Tapinos, eds. 207-228. Oxford: Oxford University Press.
Genicot, G. and D. Ray. 2003. Endogenous group formation in risk-sharing arrangements. Review of Economic Studies 70 (1): 87-113.
24
Grootaert, C. 2001. Does social capital help the poor? A synthesis of findings and recommendations from the social capital initiative. Social Capital Initiative Working Paper 24. Washington, D.C.: Social Development Department, World Bank.
Haddad, L. and J. Maluccio. 2003. Trust, membership in groups, and household welfare: Evidence from KwaZulu-Natal, South Africa. Economic Development and Cultural Change 51 (3): 573-601.
Helliwell, J. and R. Putnam. 2004. The social context of wellbeing. Philosophical Transactions of the Royal Society, Series B: Biological Sciences 359 (1449): 1435-1446.
Hoddinott, J. and A. R. Quisumbing. 2003. Data sources for microeconometric risk and vulnerability assessments. Social Protection Paper 0323. Washington, D.C.: World Bank.
Isham, J. and S. Kahkonen. 2002. Institutional determinants of the impact of community-based water services: Evidence from Sri Lanka and India. Middlebury College Economics Discussion Paper No. 02-20. Middlebury, Vermont: Department of Economics, Middlebury College.
Kariuki, G. and F. Place. 2005. Initiatives for Rural Development through Collective Action: The Case of Household Participation in Group Activities in the Highlands of Central Kenya. CAPRi Working Paper 43. Washington, DC: International Food Policy Research Institute.
Ligon, E., J. P. Thomas, and T. Worral. 2000. Mutual insurance, individual savings, and limited commitment. Review of Economic Dynamics 3 (2): 216-246.
McCarthy, N. and J.-P. Vanderlinden. 2004. Resource management under climatic risk: A case study of Niger. Journal of Development Studies 40 (5): 120-142.
Morduch, J. 2005. Consumption smoothing across space: Testing theories of risk-sharing in the ICRISAT study region of south India. In Insurance against poverty, S. Derscon, ed. Oxford: Oxford University Press.
Munshi, K. 2003. Networks in the modern economy: Mexican migrants in the U.S. labor market. Quarterly Journal of Economics 118: 549-599.
Munshi, K. and M. Rosenzweig. 2005. Why is mobility in India so low? Social insurance, inequality, and growth. Unpublished paper, Department of Economics, Brown University, Providence, Rhode Island.
Narayan, D. and L. Pritchett. 1999. Cents and sociability: Household income and social capital in rural Tanzania. Economic Development and Cultural Change 47 (4): 871−897.
Ostrom, E., R. Gardner, and J. M. Walker. 1994. Rules, games, and common-pool resources. Ann Arbor, Ml, USA: University of Michigan Press.
Pankhurst, A. 2003. The role and space for iddirs to participate in the development of Ethiopia. In Iddirs: Participation and development, A. Pankhurst, ed. Addis Ababa: Agency for Cooperation and Development.
Pender, J. and S. J. Scherr. 2002. Organization development and natural resource management: Evidence from Central Honduras. In Property rights, collective action, and technologies for natural resource management, R. Meinzen-Dick, A. Knox, F. Place, and B. Swallow, eds. Baltimore, Md., U.S.A.: Johns Hopkins University Press.
Place, F., G. Kariuki, J. Wangila, P. Kristjanson, A. Makauki, and J. Ndubi. 2004. Assessing the factors underlying differences in group performance: Methodological issues and empirical findings from the Highlands of Central Kenya. Agricultural Systems 82(3): 257-272.
Powell, J. 1984. Least absolute deviations estimation for the censored regression model. Journal of Econometrics 25 (5): 303-325.
Skoufias, E. and A. R. Quisumbing. 2005. Consumption insurance and vulnerability to poverty: A synthesis of the evidence from Bangladesh, Ethiopia, Mali, Mexico, and Russia. European Journal of Development Research 17 (1): 24-58.
Townsend, R. 1994. Risk and insurance in village India. Econometrica 62 (3): 171-184.

25
White, T. A. and C. F. Runge. 1994. Common property and collective action: Lessons from cooperative watershed management in Haiti. Economic Development and Cultural Change 43 (1): 1-41.
26
LIST OF CAPRi WORKING PAPERS
01 Property Rights, Collective Action and Technologies for Natural Resource Management: A Conceptual Framework, by Anna Knox, Ruth Meinzen-Dick, and Peter Hazell, October 1998.
02 Assessing the Relationships between Property Rights and Technology Adoption in Smallholder Agriculture: A Review of Issues and Empirical Methods, by Frank Place and Brent Swallow, April 2000.
03 Impact of Land Tenure and Socioeconomic Factors on Mountain Terrace Maintenance in Yemen, by A. Aw-Hassan, M. Alsanabani and A. Bamatraf, July 2000.
04 Land Tenurial Systems and the Adoption of a Mucuna Planted Fallow in the Derived Savannas of West Africa, by Victor M. Manyong and Victorin A. Houndékon, July 2000.
05 Collective Action in Space: Assessing How Collective Action Varies Across an African Landscape, by Brent M. Swallow, Justine Wangila, Woudyalew Mulatu, Onyango Okello, and Nancy McCarthy, July 2000.
06 Land Tenure and the Adoption of Agricultural Technology in Haiti, by Glenn R. Smucker, T. Anderson White, and Michael Bannister, October 2000.
07 Collective Action in Ant Control, by Helle Munk Ravnborg, Ana Milena de la Cruz, María Del Pilar Guerrero, and Olaf Westermann, October 2000.
08 CAPRi Technical Workshop on Watershed Management Institutions: A Summary Paper, by Anna Knox and Subodh Gupta, October 2000.
09 The Role of Tenure in the Management of Trees at the Community Level: Theoretical and Empirical Analyses from Uganda and Malawi, by Frank Place and Keijiro Otsuka November 2000.
10 Collective Action and the Intensification of Cattle-Feeding Techniques: A Village Case Study in Kenya‘s Coast Province, by Kimberly Swallow, November 2000.
11 Collective Action, Property Rights, and Devolution of Natural Resource Management: Exchange of Knowledge and Implications for Policy, by Anna Knox and Ruth Meinzen-Dick, January 2001.
12 Land Dispute Resolution in Mozambique: Evidence and Institutions of Agroforestry Technology Adoption, by John Unruh, January 2001.
13 Between Market Failure, Policy Failure, and .Community Failure.: Property Rights, Crop-Livestock Conflicts and the Adoption of Sustainable Land Use Practices in the Dry Area of Sri Lanka, by Regina Birner and Hasantha Gunaweera, March 2001.
14 Land Inheritance and Schooling in Matrilineal Societies: Evidence from Sumatra, by Agnes Quisumbing and Keijuro Otsuka, May 2001.
15 Tribes, State, and Technology Adoption in Arid Land Management, Syria, by Rae, J, Arab, G., Nordblom, T., Jani, K., and Gintzburger, G., June 2001.
16 The Effects of Scales, Flows, and Filters on Property Rights and Collective Action in Watershed Management, by Brent M. Swallow, Dennis P. Garrity, and Meine van Noordwijk, July 2001.
17 Evaluating Watershed Management Projects, by John Kerr and Kimberly Chung, August 2001.
18 Rethinking Rehabilitation: Socio-Ecology of Tanks and Water Harvesting in Rajasthan, North-West India, by Tushaar Shah and K.V.Raju, September 2001.
19 User Participation in Watershed Management and Research, by Nancy Johnson, Helle Munk Ravnborg, Olaf Westermann, and Kirsten Probst, September 2001.
20 Collective Action for Water Harvesting Irrigation in the Lerman-Chapala Basin, Mexico, by Christopher A. Scott and Paul Silva-Ochoa, October 2001.
21 Land Redistribution, Tenure Insecurity, and Intensity of Production: A Study of Farm Households in Southern Ethiopia, by Stein Holden and Hailu Yohannes, October 2001.

27
22 Legal Pluralism and Dynamic Property Rights, by Ruth Meinzen-Dick and Rajendra Pradhan, January 2002.
23 International Conference on Policy and Institutional Options for the Management of Rangelands in Dry Areas, by Tidiane Ngaido, Nancy McCarthy, and Monica Di Gregorio, January 2002.
24 Climatic Variablity and Cooperation in Rangeland Management: A Case Study from Niger, by Nancy McCarthy and Jean-Paul Vanderlinden, September 2002.
25 Assessing the Factors Underlying the Differences in Group Performance: Methodological Issues and Empirical Findings from the Highlands of Central Kenya, by Frank Place, Gatarwa Kariuki, Justine Wangila, Patti Kristjanson, Adolf Makauki, and Jessica Ndubi, November 2002.
26 The Importance of Social Capital in Colombian Rural Agro-Enterprises, by Nancy Johnson, Ruth Suarez, and Mark Lundy, November 2002.
27 Cooperation, Collective Action, and Natural Resources Management in Burkina Faso: A Methodological Note, by Nancy McCarthy, Céline Dutilly-Diané, and Boureima Drabo, December 2002.
28 Understanding, Measuring, and Utilizing Social Capital: Clarifying Concepts and Presenting a Field Application from India, by Anirudh Krishna, January 2003.
29 In Pursuit Of Comparable Concepts and Data, about Collective Action, by Amy Poteete and Elinor Ostrom, March 2003.
30 Methods of Consensus Building for Community Based Fisheries Management in Bangladesh and the Mekong Delta, by Parvin Sultana and Paul Thompson, May 2003.
31 Formal and Informal Systems in Support of Farmer Management of Agrobiodiversity: Some Policy Challenges to Consolidate Lessons Learned, by Marie Byström, March 2004.
32 What Do People Bring Into the Game: Experiments in the Field About Cooperation in the Commons, by Juan-Camilo Cárdenas and Elinor Ostrom, June 2004.
33 Methods for Studying Collective Action in Rural Development, by Ruth Meinzen-Dick, Monica Di Gregorio, and Nancy McCarthy, July 2004.
34 The Relationship between Collective Action and Intensification of Livestock Production: The Case of Northeastern Burkina Faso, by Nancy McCarthy, August 2004.
35 The Transformation of Property Rights in Kenya‘s Maasailand: Triggers and Motivations by Esther Mwangi, January 2005.
36 Farmers‘ Rights and Protection of Traditional Agricultural Knowledge, by Stephen B. Brush, January 2005.
37 Between Conservationism, Eco-Populism and Developmentalism: Discourses in Biodiversity Policy in Thailand and Indonesia, by Heidi Wittmer and Regina Birner, January 2005.
38 Collective Action for the Conservation of On-Farm Genetic Diversity in a Center of Crop Diversity: An Assessment of the Role of Traditional Farmers‘ Networks, by Lone B. Badstue, Mauricio R. Bellon, Julien Berthaud, Alejandro Ramírez, Dagoberto Flores, Xóchitl Juárez, and Fabiola Ramírez, May 2005.
39 Institutional Innovations Towards Gender Equity in Agrobiodiversity Management: Collective Action in Kerala, South India,, by Martina Aruna Padmanabhan, June 2005.
40 The Voracious Appetites of Public versus Private Property: A View of Intellectual Property and Biodiversity from Legal Pluralism, by Melanie G. Wiber, July 2005.
41 Who Knows, Who Cares? Determinants of Enactment, Awareness and Compliance with Community Natural Resource Management Bylaws in Uganda, by Ephraim Nkonya, John Pender, Edward Kato, Samuel Mugarura, and James Muwonge, August 2005.
42 Localizing Demand and Supply of Environmental Services: Interactions with Property Rights, Collective Action and the Welfare of the Poor, by Brent Swallow, Ruth Meinzen-Dick, and Meine von Noordjwik, September 2005.

28
43 Initiatives for Rural Development through Collective Action: The Case of Household Participation in Group Activities in the Highlands of Central Kenya, By Gatarwa Kariuki and Frank Place, September 2005.
44 Are There Customary Rights to Plants? An Inquiry among the Baganda (Uganda), with Special Attention to Gender, by Patricia L. Howard and Gorettie Nabanoga, October 2005.
45 On Protecting Farmers’ New Varieties: New Approaches to Rights on Collective Innovations in Plant Genetic Resources by Rene Salazar, Niels P. Louwaars, and Bert Visser, January 2006.
46 Subdividing the Commons: The Politics of Property Rights Transformation in Kenya‘s Maasailand, by Esther Mwangi, January 2006.
47 Biting the Bullet: How to Secure Access to Drylands Resources for Multiple Users, by Esther Mwangi and Stephan Dohrn, January 2006.
48 Property Rights and the Management of Animal Genetic Resources, by Simon Anderson and Roberta Centonze, February 2006.
49 From the Conservation of Genetic Diversity to the Promotion of Quality Foodstuff: Can the French Model of Appellation d‘Origine Contrôlée‘ be Exported? by Valérie Boisvert, April 006.
50 Facilitating Collective Action and Enhancing Local Knowledge: A Herbal Medicine Case Study in Talaandig Communities, Philippines, by Herlina Hartanto and Cecil Valmores, April 2006.
51 Water, Women, and Local Social Organization in the Western Kenya Highlands, by Elizabeth Were, Brent Swallow, and Jessica Roy, July 2006.
52 The Many Meanings of Collective Action: Lessons on Enhancing Gender Inclusion and Equity in Watershed Management, by Laura German, Hailemichael Taye, Sarah Charamila, Tesema Tolera, and Joseph Tanui, July 2006.
53 Decentralization and Environmental Conservation: Gender Effects from Participation in Joint Forest Management, by Arun Agrawal, Gautam Yadama, Raul Andrade, and Ajoy Bhattacharya, July 2006.
54 Improving the Effectiveness of Collective Action: Sharing Experiences from Community Forestry in Nepal, by Krishna P. Achyara and Popular Gentle, July 2006.
55 Groups, Networks, and Social Capital in the Philippine Communities, by Marie Godquin and Agnes R. Quisumbing, October 2006.
56 Collective Action in Plant Genetic Resources Management: Gendered Rules of Reputation, Trust and Reciprocity in Kerala, India, by Martina Aruna Padmanabhan, October 2006.
57 Gender and Local Floodplain Management Institutions--A case study from Bangladesh, by Parvin Sultana and Paul Thompson, October 2006.
58 Gender Differences in Mobilization for Collective Action: Case Studies of Villages in Northern Nigeria, by Saratu Abdulwahid, October 2006.
59 Gender, Social Capital, and Information Exchange in Rural Uganda, by Enid Katungi, Svetlana Edmeades, and Melinda Smale, October 2006.
60 Rural Institutions and Producer Organizations in Imperfect Markets: Experiences from Producer Marketing Groups in Semi-Arid Eastern Kenya, by Bekele Shiferaw, Gideon Obare and Geoffrey Muricho, November 2006.
61 Women‘s Collective Action and Sustainable Water Management: Case of SEWA‘s Water Campaign in Gujarat, India, by Smita Mishra Panda, October 2006.
62 Could Payments for Environmental Services Improve Rangeland Management inCentral Asia, West Asia and North Africa? by Celine Dutilly-Diane, Nancy McCarthy, Francis Turkelboom, Adriana Bruggeman, James Tiedemann, Kenneth Street and Gianluca Serra, January 2007.
63 Empowerment through Technology: Gender Dimensions of Social Capital Build-Up in Maharashtra, India, by Ravula Padmaja and Cynthia Bantilan, February 2007.
29
64 Gender and Collective Action: A Conceptual Framework for Analysis, by Lauren Pandolfelli, Ruth Meinzen-Dick, and Stephan Dohrn, May 2007.
65 Gender, Wealth, and Participation in Community Groups in Meru Central District, Kenya, by Kristin E. Davis and Martha Negash, May 2007.
66 Beyond Group Ranch Subdivision: Collective Action for Livestock Mobility, Ecological Viability, and Livelihoods, by Shauna BurnSilver and Esther Mwangi, June 2007.
67 Farmer Organization, Collective Action and Market Access in Meso-America, by Jon Hellin, Mark Lundy, and Madelon Meijer, October 2007.
68 Collective Action for Innovation and Small Farmer Market Access: The Papa Andina Experience, by André Devaux, Claudio Velasco, Gastón López, Thomas Bernet, Miguel Ordinola, Hernán Pico, Graham Thiele, and Douglas Horton, October 2007.
69 Collective Action and Marketing of Underutilized Plant Species: The Case of Minor Millets in Kolli Hills, Tamil Nadu, India, by Guillaume P. Gruère, Latha Nagarajan, and E.D.I. Oliver King, M.S. Swaminathan Research Foundation, October 2007.
70 The Role of Public–Private Partnerships and Collective Action in Ensuring Smallholder Participation in High Value Fruit and Vegetable Supply Chains, by Clare Narrod, Devesh Roy, Julius Okello, Belem Avendaño, and Karl Rich, October 2007.
71 Collective Action for Small-Scale Producers of Agricultural Biodiversity Products, by Froukje Kruijssen, Menno Keizer, and Alessandra Giuliani, October, 2007.
72 Farmer Groups Enterprises and the Marketing of Staple Food Commodities in Africa, by Jonathan Coulter, October 2007.
73 Linking Collective Action to Non-Timber Forest Product Market for Improved Local Livelihoods: Challenges and Opportunities, by Heru Komarudin, Yuliana L. Siagian, and Ngakan Putu Oka, December, 2007.
74 Collective Action Initiatives to Improve Marketing Performance: Lessons from Farmer Groups in Tanzania, by James Barham and Clarence Chitemi, March 2008.
75 Sustaining Linkages to High Value Markets through Collective Action In Uganda: The Case of the Nyabyumba Potato Farmers, by Elly Kaganzi, Shaun Ferris, James Barham, Annet Abenakyo, Pascal Sanginga, and Jemimah Njuki, March 2008.
76 Fluctuating Fortunes of a Collective Enterprise: The Case of the Agroforestry Tree Seeds Association of Lantapan (ATSAL) in the Philippines, by Delia Catacutan, Manuel Bertomeu, Lyndon Arbes, Caroline Duque, and Novie Butra, May 2008.
77 Making Market Information Services Work Better for the Poor in Uganda, by Shaun Ferris, Patrick Engoru, and Elly Kaganzi, May 2008.
78 Implications of Bulk Water Transfer on Local Water Management Institutions: A Case Study of the Melamchi Water Supply Project in Nepal, by Dhruba Pant, Madhusudan Bhattarai and Govinda Basnet, May 2008.
79 Bridging, Linking and Bonding Social Capital in Collective Action: The Case of Kalahan Forest Reserve in the Philippines, by Ganga Ram Dahal and Krishna Prasad Adhikari, May 2008.
80 Decentralization, Pro-poor Land Policies, and Democratic Governance, by Ruth Meinzen-Dick, Monica Di Gregorio, and Stephan Dohrn, June 2008
81 Property Rights, Collective Action, and Poverty: The Role of Institutions for Poverty Reduction, by Monica Di Gregorio, Konrad Hagedorn, Michael Kirk, Benedikt Korf, Nancy McCarthy, Ruth Meinzen-Dick, and Brent Swallow, June 2008.
82 Collective Action and Property Rights for Poverty Reduction: A Review of Methods and Approaches, by Esther Mwangi and Helen Markelova, June 2008.