coal pontotoc johnstongarvinmurray coal, garvin, johnston, murray, pontotoc; ok source: rdm, pcrd...
TRANSCRIPT

South Central Oklahoma 5-County Region
Coal
Pontotoc
Johnston
Garvin
Murray
• Coal, Garvin, Johnston, Murray, Pontotoc; OK
Source: RDM, PCRD & ESRI
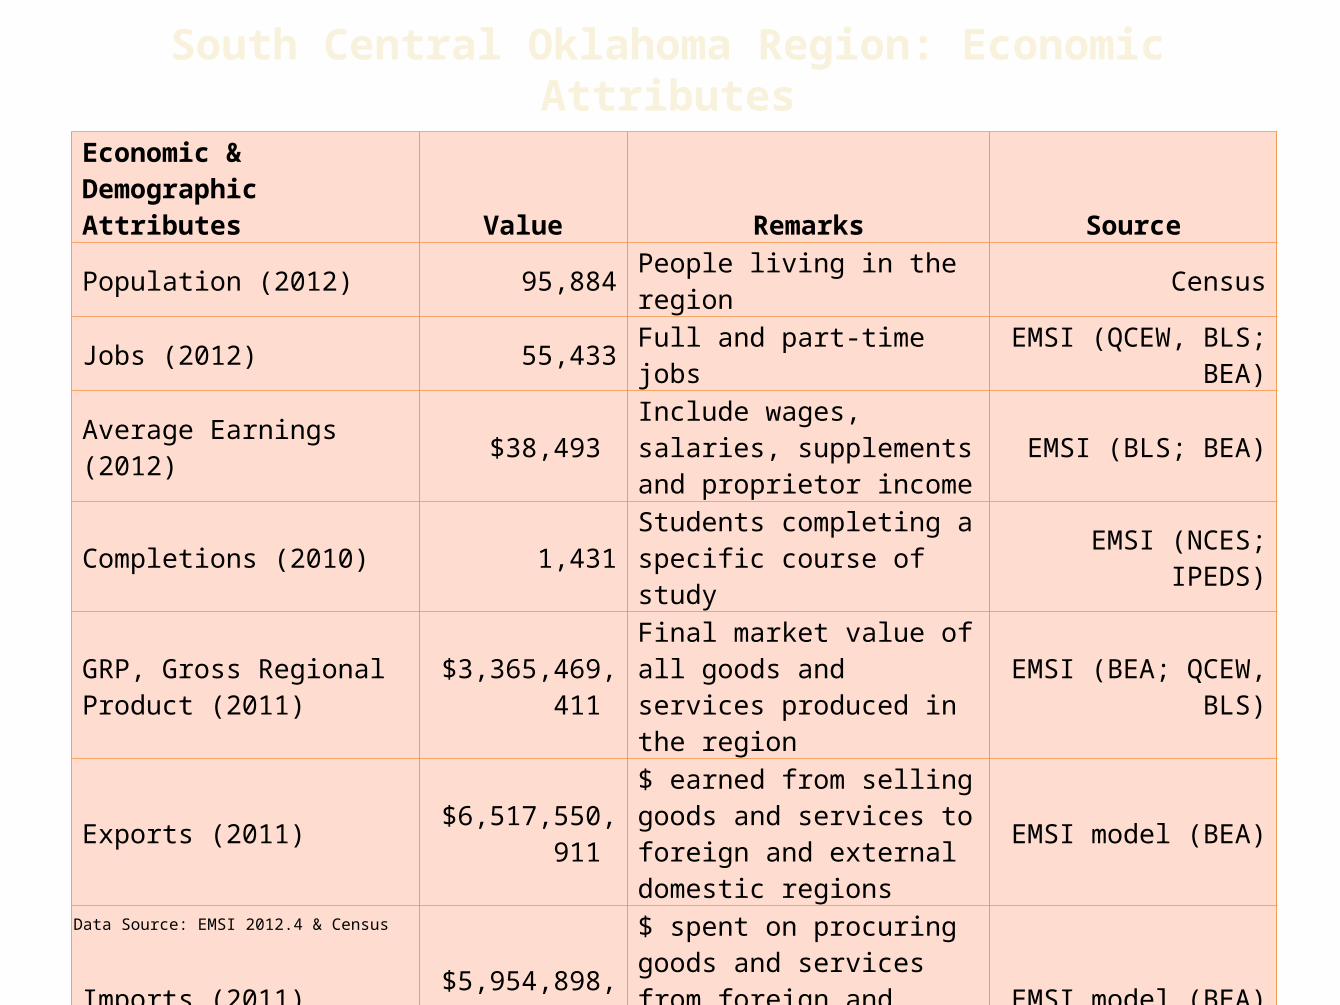
Economic & Demographic Attributes Value Remarks Source
Population (2012) 95,884 People living in the region Census
Jobs (2012) 55,433 Full and part-time jobs EMSI (QCEW, BLS; BEA)
Average Earnings (2012) $38,493 Include wages, salaries, supplements and proprietor income
EMSI (BLS; BEA)
Completions (2010) 1,431 Students completing a specific course of study EMSI (NCES; IPEDS)
GRP, Gross Regional Product (2011) $3,365,469,411
Final market value of all goods and services produced in the region
EMSI (BEA; QCEW, BLS)
Exports (2011) $6,517,550,911 $ earned from selling goods and services to foreign and external domestic regions
EMSI model (BEA)
Imports (2011) $5,954,898,297 $ spent on procuring goods and services from foreign and external domestic region
EMSI model (BEA)
South Central Oklahoma Region: Economic Attributes
Data Source: EMSI 2012.4 & Census
South Central Oklahoma Region
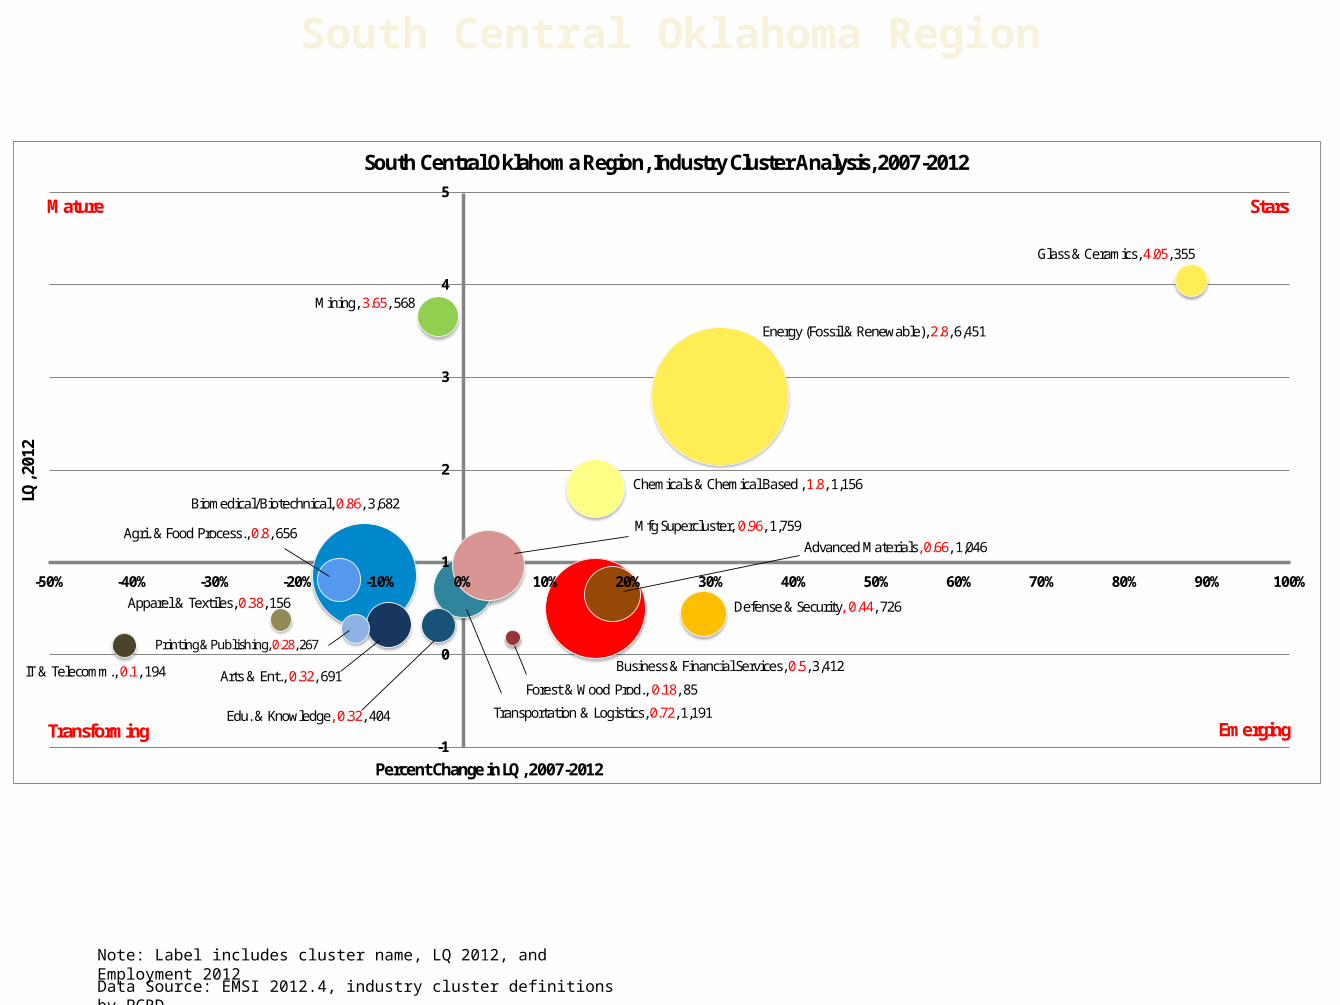
Note: Label includes cluster name, LQ 2012, and Employment 2012
Data Source: EMSI 2012.4, industry cluster definitions by PCRD
Energy (Fossil & Renewable), 2.8, 6,451
Biomedical/Biotechnical, 0.86, 3,682
Business & Financial Services, 0.5, 3,412
Transportation & Logistics, 0.72, 1,191
Chemicals & Chemical Based , 1.8, 1,156
Advanced Materials, 0.66, 1,046
Defense & Security, 0.44, 726
Arts & Ent., 0.32, 691
Agri. & Food Process., 0.8, 656
Mining, 3.65, 568
Edu. & Knowledge, 0.32, 404
Glass & Ceramics, 4.05, 355
Printing & Publishing, 0.28, 267
IT & Telecomm., 0.1, 194
Apparel & Textiles, 0.38, 156
Forest & Wood Prod., 0.18, 85
Mfg Supercluster, 0.96, 1,759
-1
0
1
2
3
4
5
-50% -40% -30% -20% -10% 0% 10% 20% 30% 40% 50% 60% 70% 80% 90% 100%
LQ, 2
012
Percent Change in LQ, 2007-2012
South Central Oklahoma Region, Industry Cluster Analysis, 2007-2012
Mature Stars
Transforming Emerging
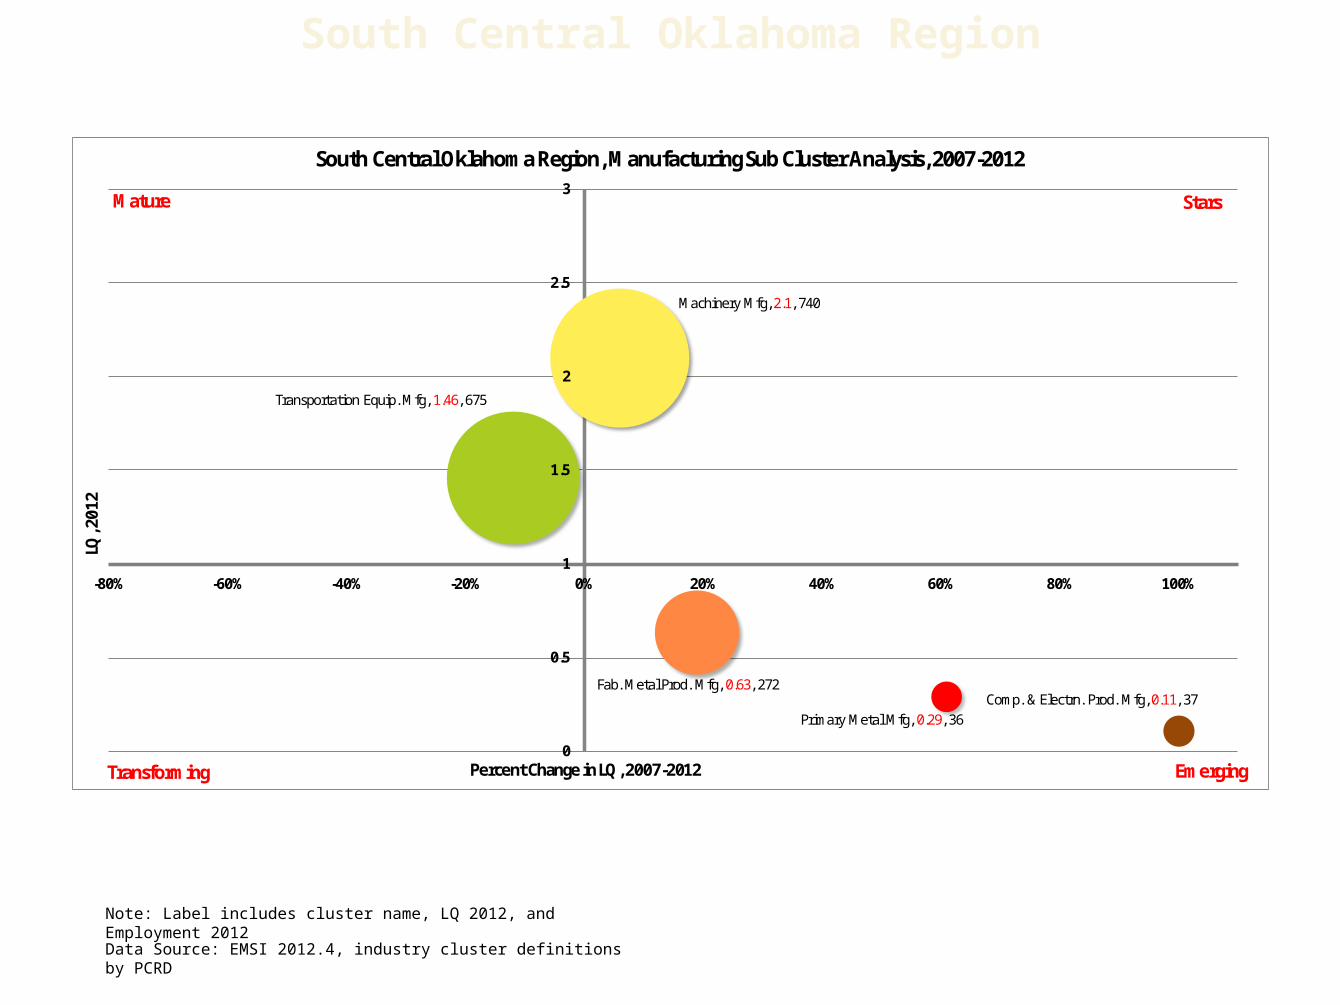
Note: Label includes cluster name, LQ 2012, and Employment 2012
Data Source: EMSI 2012.4, industry cluster definitions by PCRD
South Central Oklahoma Region
* Axis titles in 14 size font, cluster names in 12 size fonts, use embed to take from Excel to PPT, axes labels in 13 size font
Transportation Equip. Mfg, 1.46, 675
Fab. Metal Prod. Mfg, 0.63, 272
Machinery Mfg, 2.1, 740
Primary Metal Mfg, 0.29, 36Comp. & Electrn. Prod. Mfg, 0.11, 37
0
0.5
1
1.5
2
2.5
3
-80% -60% -40% -20% 0% 20% 40% 60% 80% 100%
LQ, 2
012
Percent Change in LQ, 2007-2012
South Central Oklahoma Region, Manufacturing Sub Cluster Analysis, 2007-2012
Mature Stars
Transforming Emerging
StarsMature
TRANSFORMING EmergingP e r c e n t G r o w t h i n S p e c i a l i z a t i o n
L e
v e
l o
f
S p
e c
i a l
i z a
t i o
n
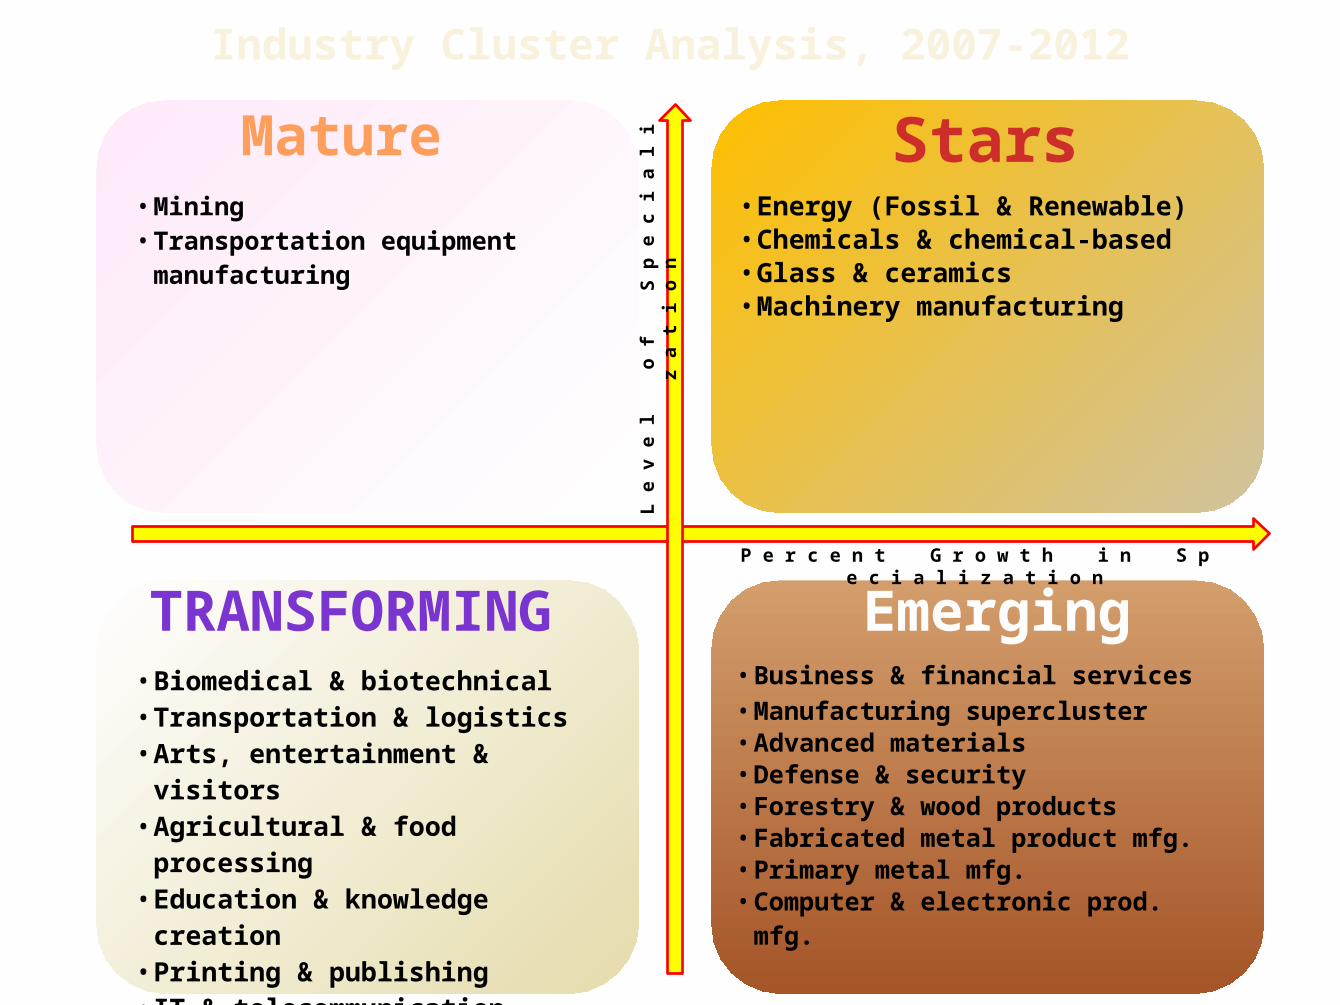
Industry Cluster Analysis, 2007-2012
• Energy (Fossil & Renewable)• Chemicals & chemical-based• Glass & ceramics• Machinery manufacturing
• Mining• Transportation equipment manufacturing
• Biomedical & biotechnical• Transportation & logistics• Arts, entertainment & visitors• Agricultural & food processing • Education & knowledge creation• Printing & publishing• IT & telecommunication• Apparel & textiles
• Business & financial services • Manufacturing supercluster • Advanced materials• Defense & security• Forestry & wood products• Fabricated metal product mfg.• Primary metal mfg.• Computer & electronic prod. mfg.
South Central Oklahoma Region
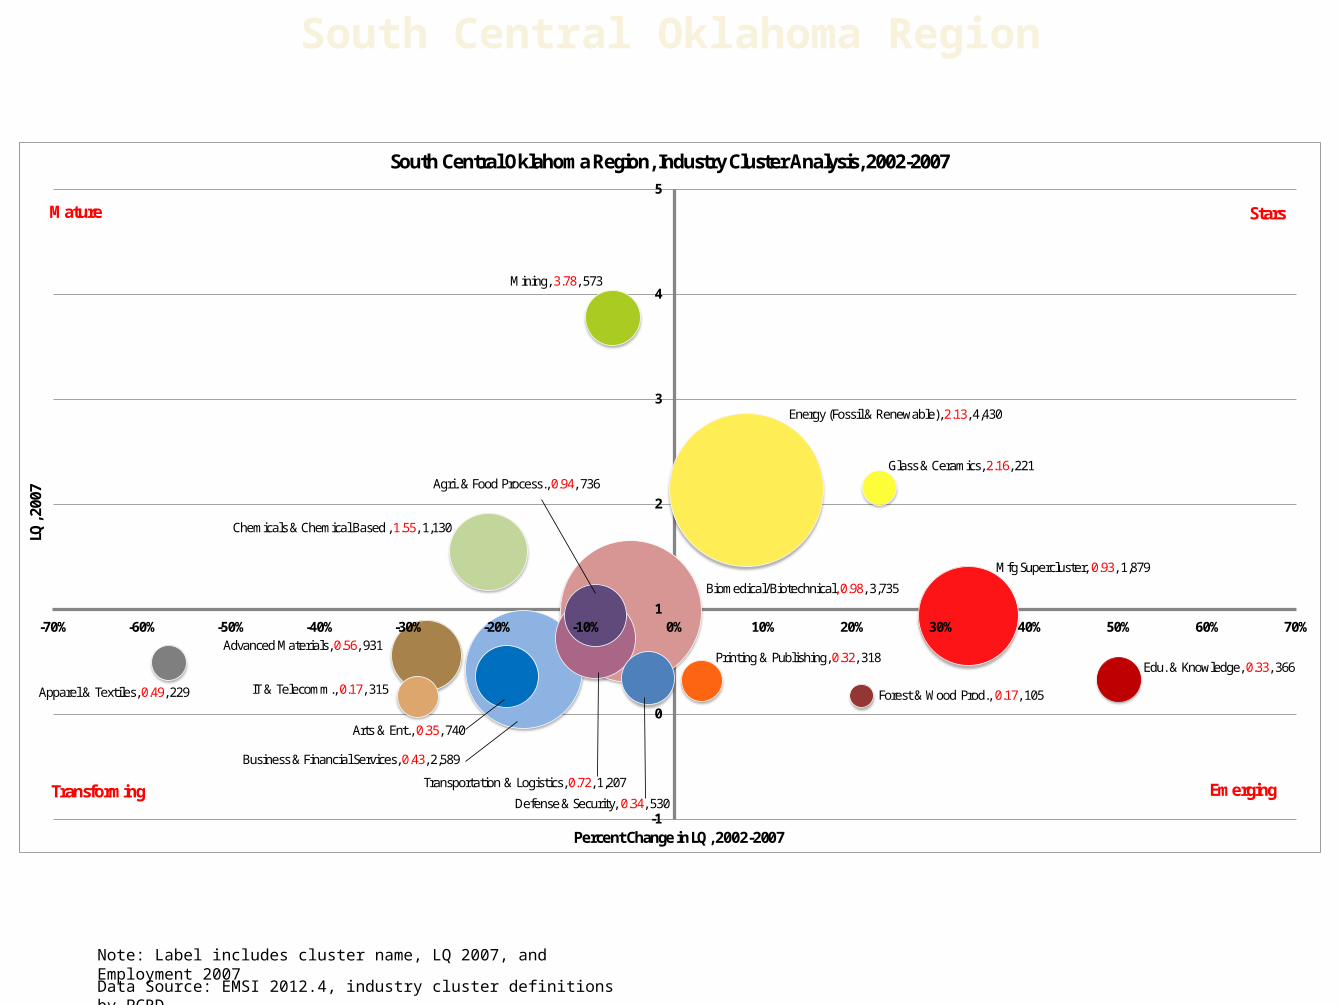
Note: Label includes cluster name, LQ 2007, and Employment 2007
Data Source: EMSI 2012.4, industry cluster definitions by PCRD
Energy (Fossil & Renewable), 2.13, 4,430
Biomedical/Biotechnical, 0.98, 3,735
Business & Financial Services, 0.43, 2,589
Transportation & Logistics, 0.72, 1,207
Chemicals & Chemical Based , 1.55, 1,130
Advanced Materials, 0.56, 931
Arts & Ent., 0.35, 740
Agri. & Food Process., 0.94, 736
Mining, 3.78, 573
Defense & Security, 0.34, 530
Edu. & Knowledge, 0.33, 366Printing & Publishing, 0.32, 318
IT & Telecomm., 0.17, 315Apparel & Textiles, 0.49, 229
Glass & Ceramics, 2.16, 221
Forest & Wood Prod., 0.17, 105
Mfg Supercluster, 0.93, 1,879
-1
0
1
2
3
4
5
-70% -60% -50% -40% -30% -20% -10% 0% 10% 20% 30% 40% 50% 60% 70%
LQ, 2
007
Percent Change in LQ, 2002-2007
South Central Oklahoma Region, Industry Cluster Analysis, 2002-2007
Mature Stars
Transforming Emerging
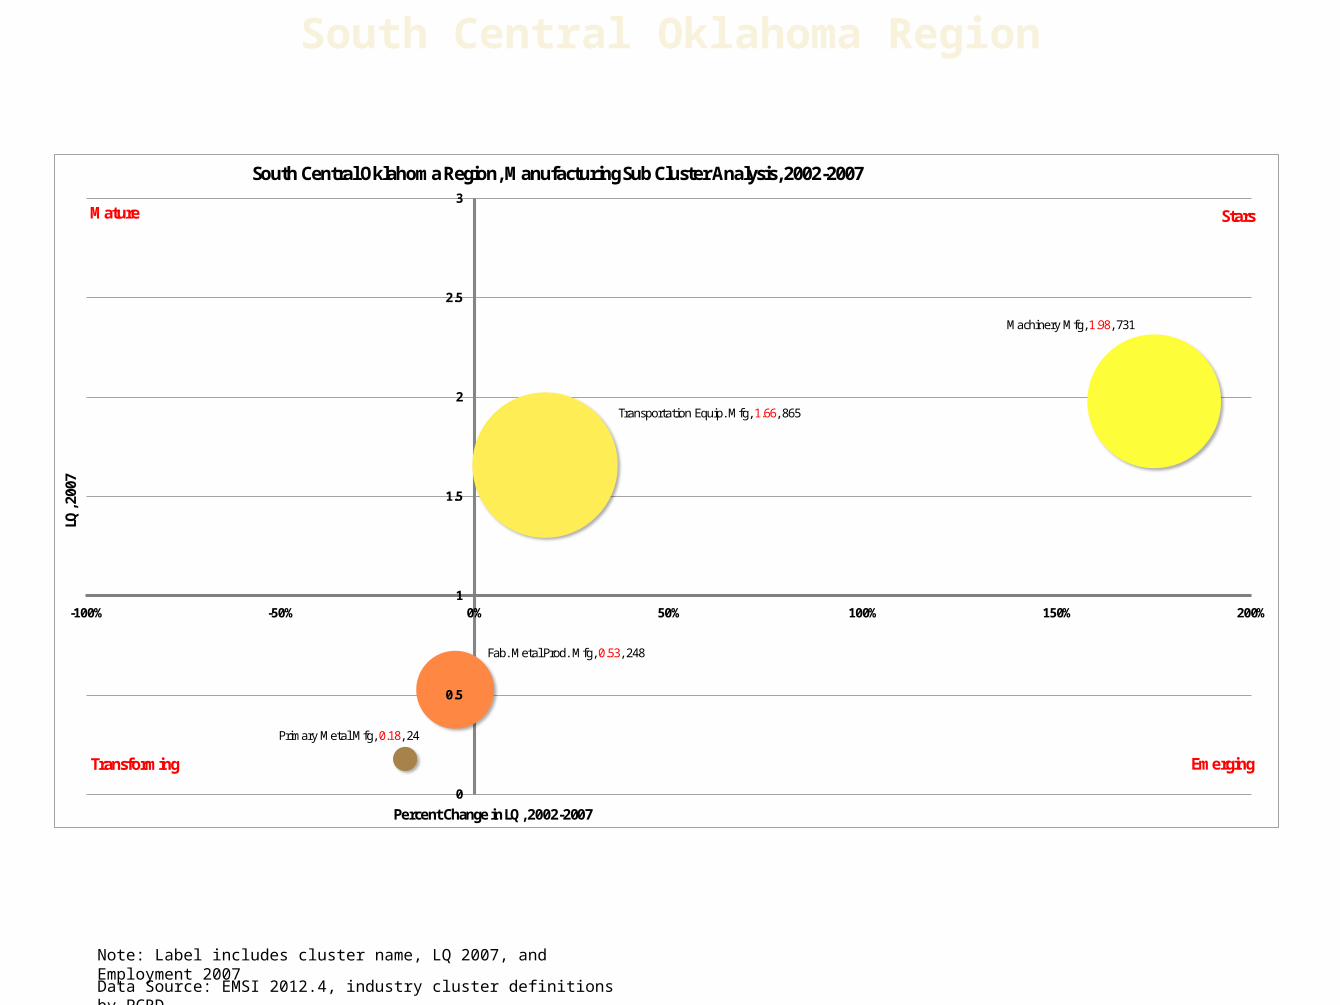
South Central Oklahoma Region
Note: Label includes cluster name, LQ 2007, and Employment 2007
Data Source: EMSI 2012.4, industry cluster definitions by PCRD
Transportation Equip. Mfg, 1.66, 865
Fab. Metal Prod. Mfg, 0.53, 248
Machinery Mfg, 1.98, 731
Primary Metal Mfg, 0.18, 24
0
0.5
1
1.5
2
2.5
3
-100% -50% 0% 50% 100% 150% 200%
LQ, 2
007
Percent Change in LQ, 2002-2007
South Central Oklahoma Region, Manufacturing Sub Cluster Analysis, 2002-2007
Mature Stars
Transforming Emerging
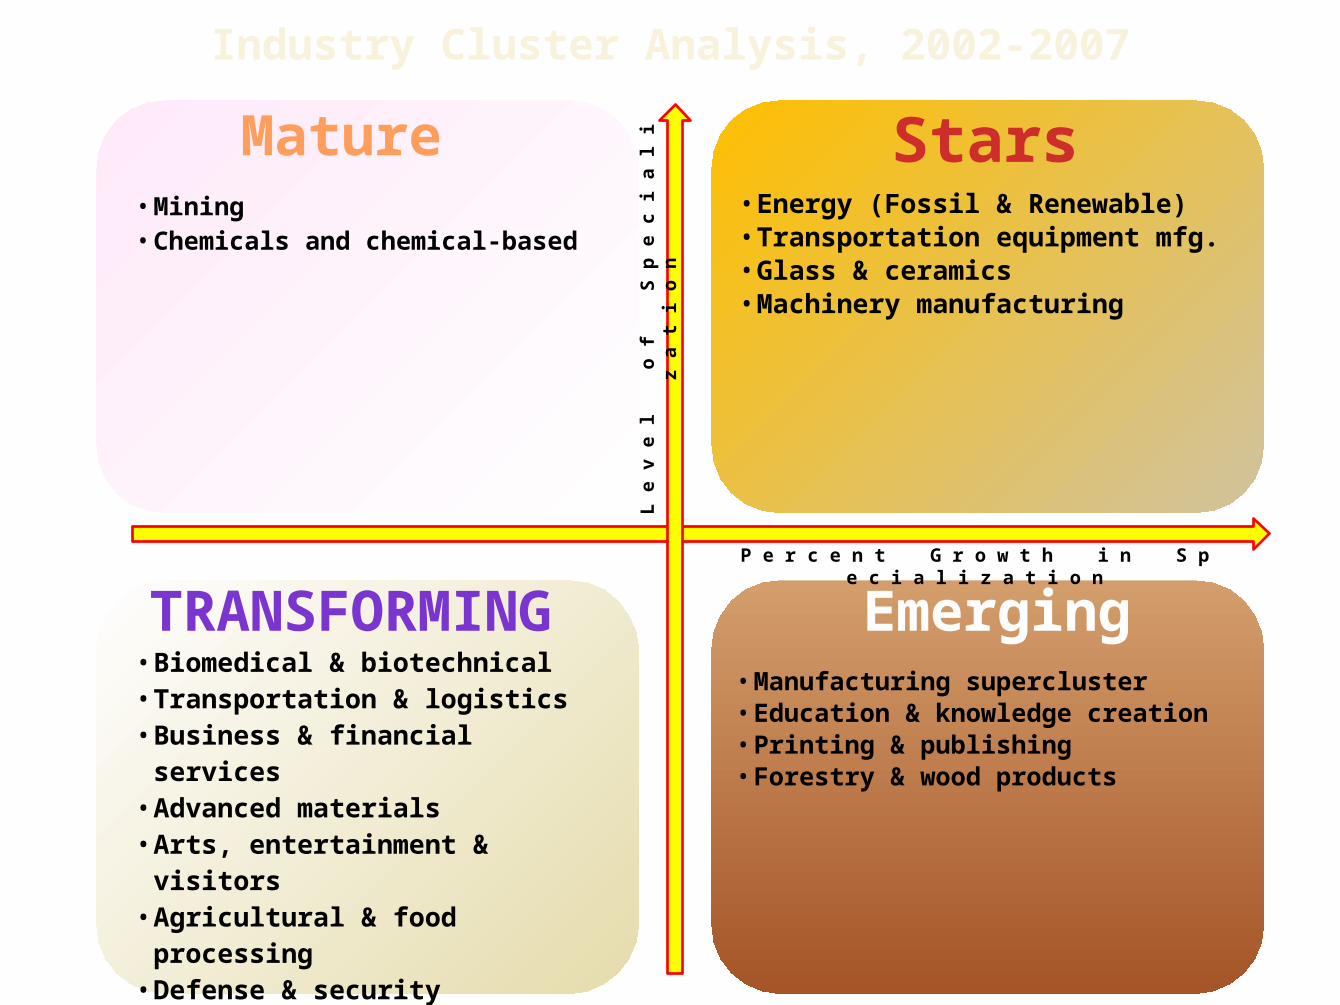
Industry Cluster Analysis, 2002-2007
StarsMature
TRANSFORMING EmergingP e r c e n t G r o w t h i n S p e c i a l i z a t i o n
L e
v e
l o
f
S p
e c
i a l
i z a
t i o
n • Energy (Fossil & Renewable)• Transportation equipment mfg.• Glass & ceramics• Machinery manufacturing
• Mining• Chemicals and chemical-based
• Biomedical & biotechnical• Transportation & logistics• Business & financial services• Advanced materials• Arts, entertainment & visitors• Agricultural & food processing • Defense & security• IT & telecommunication• Apparel & textiles• Fabricated metal product mfg.• Primary metal mfg.
• Manufacturing supercluster • Education & knowledge creation• Printing & publishing• Forestry & wood products
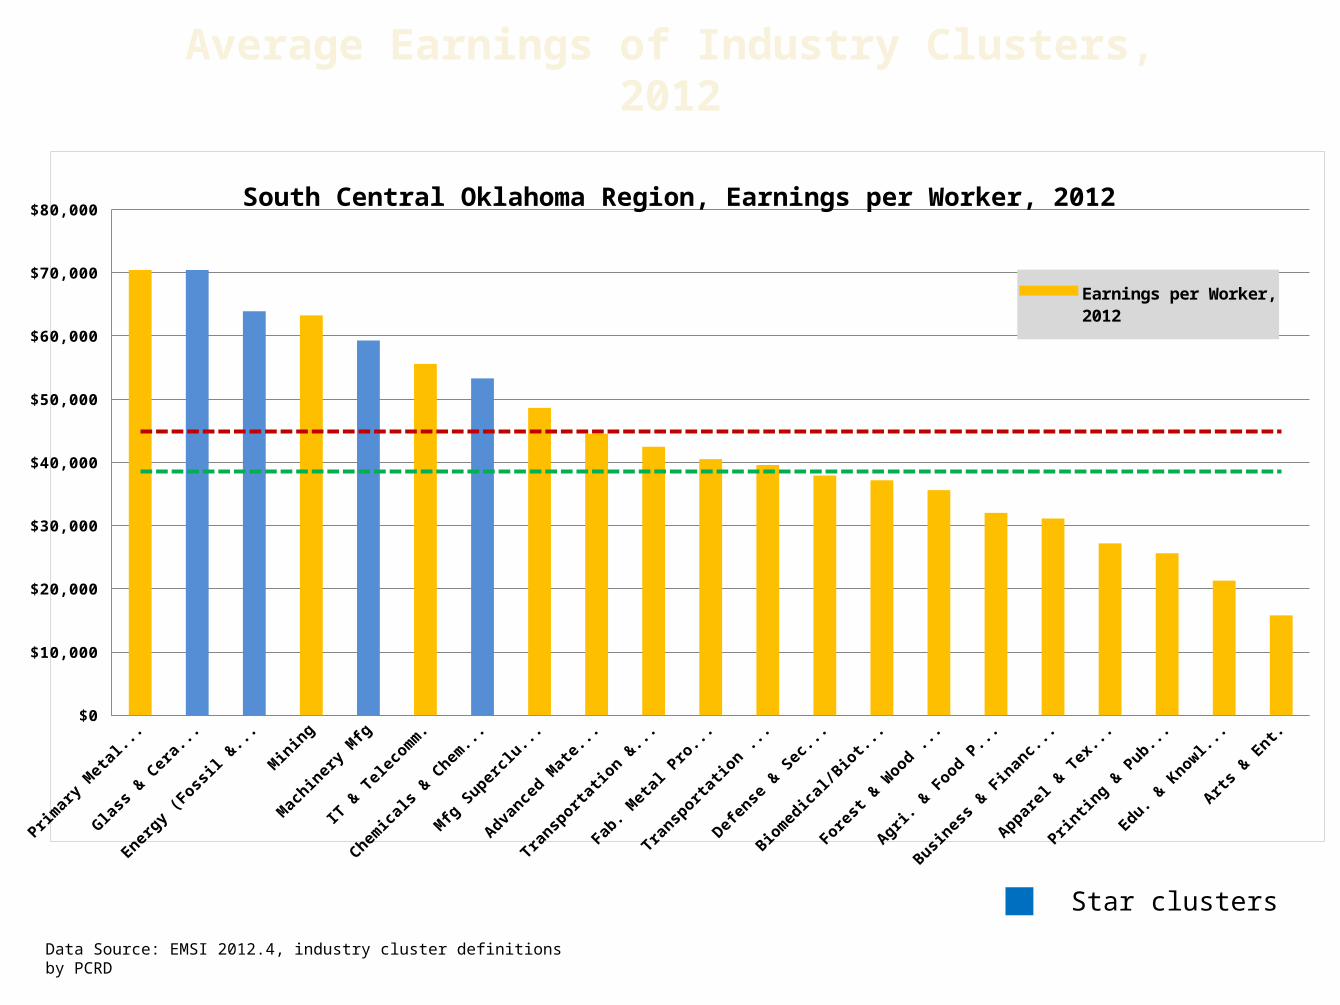
Average Earnings of Industry Clusters, 2012
Data Source: EMSI 2012.4, industry cluster definitions by PCRD
Primary
Meta
l Mfg
Glass & Cera
mics
Energy (F
ossil &
Rene...
Mining
Mach
inery M
fg
IT & Teleco
mm.
Chemicals
& Chemical ..
.
Mfg Supercl
uster
Advanced M
ateria
ls
Transp
ortation &
Logis.
..
Fab. M
etal P
rod. M
fg
Transp
ortation Equip....
Defense &
Securit
y
Biomedical/B
iotech
n...
Fore
st & W
ood Prod.
Agri. &
Food Pro
cess.
Business
& Financia
l Se...
Apparel &
Textiles
Printing &
Publishing
Edu. & Knowledge
Arts &
Ent.$0
$10,000
$20,000
$30,000
$40,000
$50,000
$60,000
$70,000
$80,000 South Central Oklahoma Region, Earnings per Worker, 2012
Earnings per Worker, 2012Average Earnings, region, 2012
Star clusters
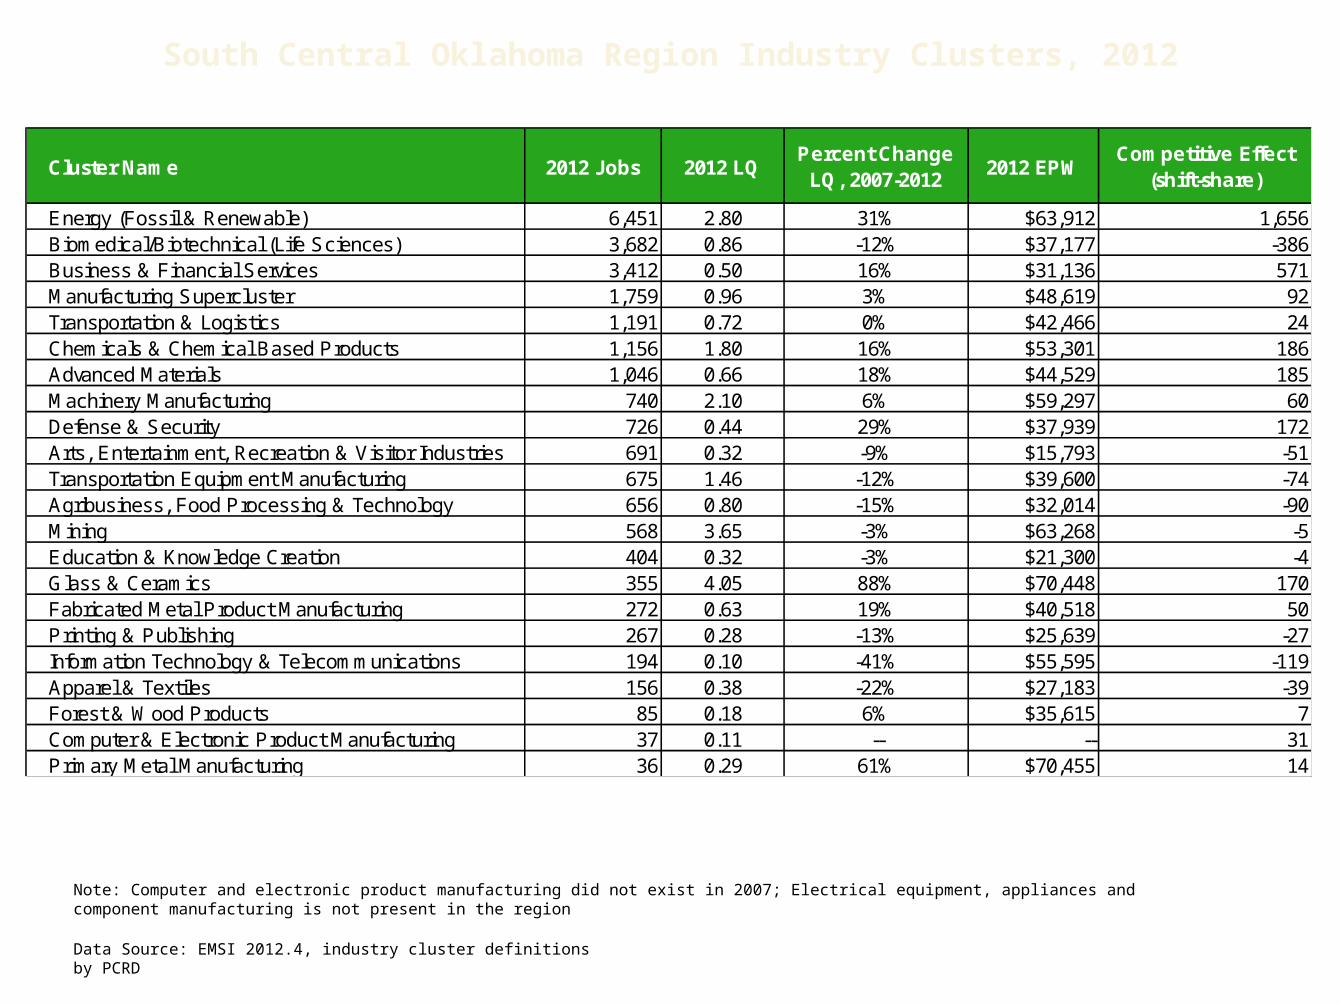
South Central Oklahoma Region Industry Clusters, 2012
Data Source: EMSI 2012.4, industry cluster definitions by PCRD
Note: Computer and electronic product manufacturing did not exist in 2007; Electrical equipment, appliances and component manufacturing is not present in the region
Cluster Name 2012 Jobs 2012 LQPercent Change
LQ, 2007-20122012 EPW
Competitive Effect (shift-share)
Energy (Fossil & Renewable) 6,451 2.80 31% $63,912 1,656Biomedical/Biotechnical (Life Sciences) 3,682 0.86 -12% $37,177 -386Business & Financial Services 3,412 0.50 16% $31,136 571Manufacturing Supercluster 1,759 0.96 3% $48,619 92Transportation & Logistics 1,191 0.72 0% $42,466 24Chemicals & Chemical Based Products 1,156 1.80 16% $53,301 186Advanced Materials 1,046 0.66 18% $44,529 185Machinery Manufacturing 740 2.10 6% $59,297 60Defense & Security 726 0.44 29% $37,939 172Arts, Entertainment, Recreation & Visitor Industries 691 0.32 -9% $15,793 -51Transportation Equipment Manufacturing 675 1.46 -12% $39,600 -74Agribusiness, Food Processing & Technology 656 0.80 -15% $32,014 -90Mining 568 3.65 -3% $63,268 -5Education & Knowledge Creation 404 0.32 -3% $21,300 -4Glass & Ceramics 355 4.05 88% $70,448 170Fabricated Metal Product Manufacturing 272 0.63 19% $40,518 50Printing & Publishing 267 0.28 -13% $25,639 -27Information Technology & Telecommunications 194 0.10 -41% $55,595 -119Apparel & Textiles 156 0.38 -22% $27,183 -39Forest & Wood Products 85 0.18 6% $35,615 7Computer & Electronic Product Manufacturing 37 0.11 -- -- 31Primary Metal Manufacturing 36 0.29 61% $70,455 14
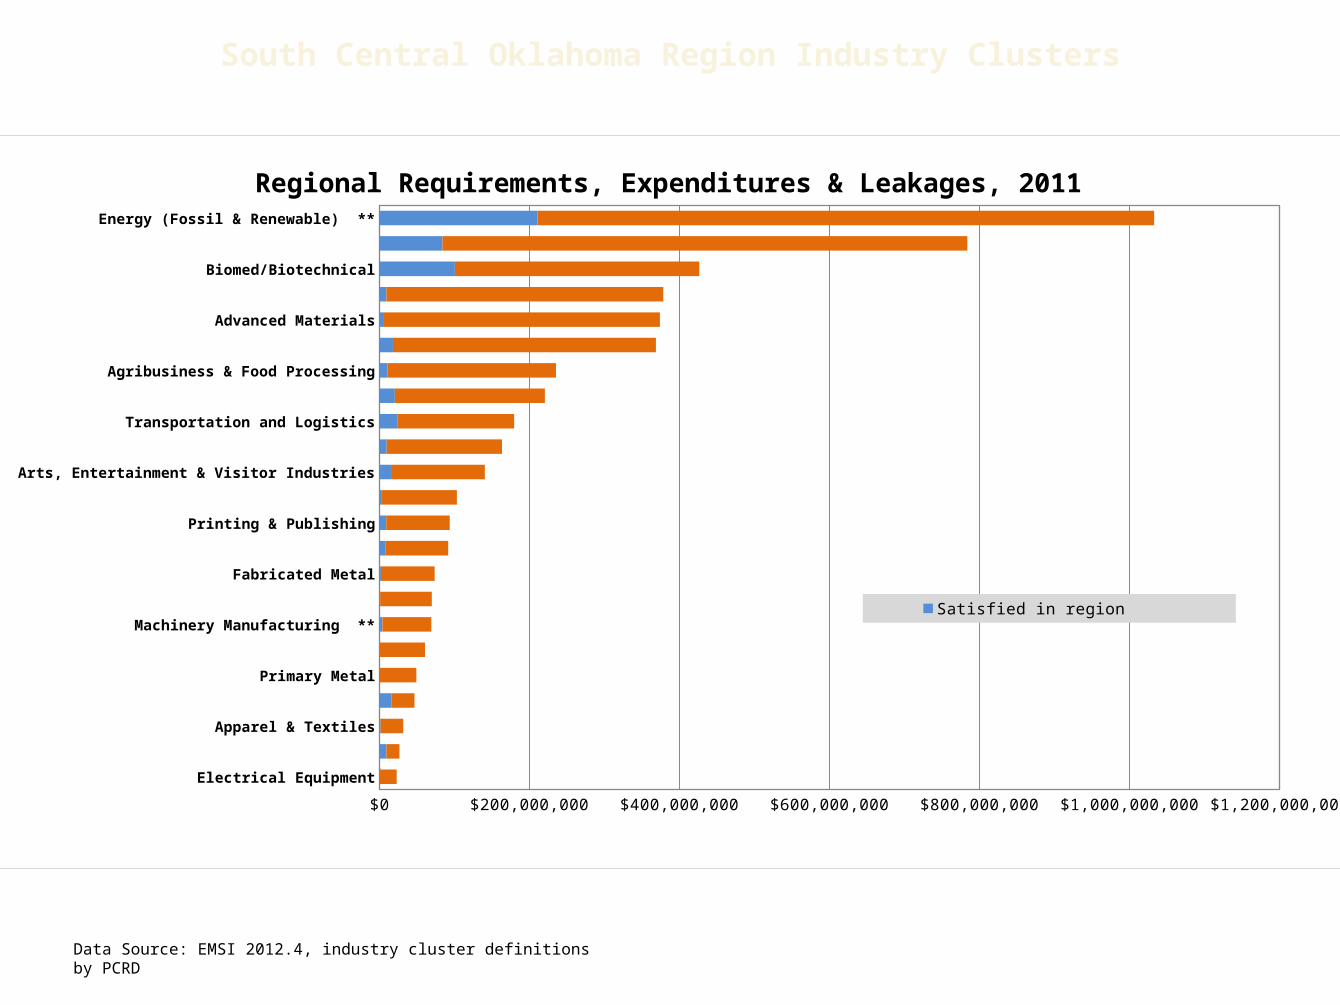
South Central Oklahoma Region Industry Clusters
Data Source: EMSI 2012.4, industry cluster definitions by PCRD
Electrical Equipment
Glass & Ceramics **
Apparel & Textiles
Mining
Primary Metal
Computer & Electronic Product
Machinery Manufacturing **
Forestry & Wood Products
Fabricated Metal
Education & Knowledge Creation
Printing & Publishing
Transportation Equipment
Arts, Entertainment & Visitor Industries
Defense & Security
Transportation and Logistics
Chemical and Chemical-based Industry Clsuters **
Agribusiness & Food Processing
IT & Telecommunications
Advanced Materials
Manufacturing Supercluster
Biomed/Biotechnical
Business & Finance
Energy (Fossil & Renewable) **
$0 $200,000,000 $400,000,000 $600,000,000 $800,000,000 $1,000,000,000 $1,200,000,000
Regional Requirements, Expenditures & Leakages, 2011
Satisfied in region Satisfied outside region

Purdue Center for Regional DevelopmentPurdue University
Gerald D. and Edna E. Mann Hall, Suite 266203 Martin Jischke Drive
West Lafayette, IN 47907-2057