cluster modeling and tddft calculations of core excitation ... · mediante modellizzazione a...
TRANSCRIPT
UNIVERSITÀ DEGLI STUDI DI TRIESTE
DOTTORATO DI RICERCA IN SCIENZE CHIMICHE - XIX CICLO
Cluster modeling and TDDFT calculations of
core excitation spectra of metal oxides and
molecules adsorbed on surfaces E
hv
Dottorando:
dott. Renato DE FRANCESCO
Coordinatore del
Collegio dei docenti:
chiar.ma prof. Giuliana PIT ACCO
Relatore:
chiar.ma prof. Giovanna FRONZONI

UNIVERSITÀ DEGLI STUDI DI TRIESTE
DOTTORATO DI RICERCA IN SCIENZE CHIMICHE- XIX CICLO Settore scientifico-disciplinare CHIM/02 - CHIMICA FISICA
Cluster modeling and TDDFT calculations of
core excitation spectra of metal oxides and
molecules adsorbed on surf aces
Dottorando:
dott. Renato DE FRANCESCO
Coordinatore del
Collegio dei docenti:
chiar.ma prof. Giuliana PITACCO
Gtik~
Relatore:
chiar.ma prof. Giovanna FRONZONI

CONTENTS
Con~nh i
Overview of the thesis v
Riassunto della tesi vii
1. NEXAFS spectroscopy 1
1.1. Introduction 1
1.2. Theoretical approach to NEXAFS 4
1.2.1. General remarks 4
1.2.2. Relaxation effects 5
1.3. NEXAFS of free molecules 6
1. 3 .1. n* resonances 6
1.3.2. Rydberg and mixed valence-Rydberg resonances 7
1.3.3. cr* shape resonances 8
1.4. NEXAFS of condensed systems 9
1. 5. Angular resolved NEXAFS 12
1.6. NEXAFS of chemisorbed molecules 13
2. Theoretical method 16
2.1. DFT-KS approach 16
2 .1.1. General remarks 16
2.1.2. Relaxation effects 17
2.2. TDDFT: standard method and extension to the core excitation treatment 19
2.3. KS vs. TDDFT results 21
2.4. DOS calculations 23
2.5. Computational aspects 25
2.5 .1. Exchange-correlation potentials 25
2.5.2. Basis sets 26
2.6. Relativistic effects 27
3. Cluster modeling of solid state systems
3 .1. Introduction
3 .2. Cluster modeling of metal oxides
3 .2.1. Cutting out clusters
3.2.2. Cluster size convergence
3.2.3. Embedding procedures
4. Core excitations in MgO: a DFT study with cluster models
Stener M., Fronzoni G., De Francesco R.., Chem. Phys. 309, 49 (2005)
4.1. Introduction
4.2. Theoretical method
4.3. Computational details
4.4. Results and discussion
4.4.1. Cluster design
4.4.2. Mg ls
4.4.3. Mg 2p
4.4.4. O ls
4.5. Conclusions
30
30
31
31
32
33
37
37
39
40
41
41
47
49 51
53
5. Time dependent density functional theory of x-ray absorption spectroscopy of alkaline-
earth oxides
Fronzoni G., De Francesco R., Stener M., J. Phys. Chem. B 109, 10332 (2005)
5.1. Introduction
5 .2. Theoretical method
5.3. Computational details
5.4. Results and discussion
5.4.1. Metal K-edge spectra
5.4.2. Metal L-edge spectra
5.4.3. Oxygen K-edge spectra
5.5. Conclusions
ii
54
54
56
57
60 62
66
71
73

6. X-ray absorption spectroscopy of titanium oxide by time dependent density functional
calculations
Fronzoni G., De Francesco R., Stener M., Causà M., J. Phys. Chem. B 110, 9899 (2006)
6.1. Introduction
6.2. Theoretical method
6.3. Computational details
6.4. Results and discussion
6.4.1. Metal K edge spectrum
6.4.2. Metal L edge spectrum
6.4.3. Oxygen K edge spectrum
6.5. Conclusions
75
75
77
79
83
86
87
91
94
7. Time dependent density functional investigation of the near-edge absorption spectra of
V20s De Francesco R., Stener M., Causà M., Toffoli D., Fronzoni G., Phys. Chem. Chem. Phys. 8, 4300 (2006)
7 .1. Introduction
7 .2. Theoretical
7.3. Computational details
7.4. Results and discussion
7.4 .1. V 1 s spectrum
7.4.2. V 2p spectrum
7.4.3. O ls spectrum
7.5. Conclusions
8. Spin-orbit relativistic calculations of the core excitation spectra of S02
Fronzoni G., De Francesco R., Stener M., Decleva P., J. Chem. Phys., in press
8 .1. Introduction
8 .2. Theoretical method
8.3. Computational details
8.4. Results and discussion
8 .4 .1. S 1 s spectrum
8.4.2. S 2p spectrum
8.4.3. O ls spectrum
8. 5. Conclusions
111
96
96
99 100
104
106
110
112
116
118
118
120
121
122
125
129
134
137

9. TDDFT calculations of NEXAFS spectra of model systems for S02 adsorbed on the
MgO(l 00) surface
Fronzoni G., De Francesco R .. , Stener M., J Chem. Phys. A, subrnitted
9 .1. Introduction
9.2. Theoretical method
9.3. Computational details
9.4. Results and discussion
9.4.1. Cluster design
9.4.2. Sulfur K-edge
9.4.3. Sulfur L2,3-edge
9.4.4. Oxygen K-edge
9. 5. Conclusions
Bibliography
IV
138 138
141 142 146 146 150 153 157 159
161

OVERVIEW OF THE THESIS
The goal of the present Ph. D. thesis is the theoretical simulation and interpretation of Near-
Edge X-ray Absorption Fine Structure (NEXAFS) spectra of solid state systems, in particular
bulk metal oxides and small molecules adsorbed on metal oxide surfaces. Cluster models are
adopted to simulate solid state systems and are treated within the Density Functional Theory
(DFT) approach, both at the Kohn-Sham (KS) and in particular at the Time-Dependent
Density Functional Theory (TDDFT) level.
The theoretical investigation of the electronic structure of complex systems such as solid state
ones is particularly important due to the role it plays in determining their peculiar properties,
especially from the point of view of their manifold catalytic and technological applications.
X-ray Absorption Spectroscopy (XAS) represents a powerful tool for the accurate
characterization of the local geometrie and electronic structure in various kinds of systems; an
efficient theoretical approach is mandatory to interpret in detail these spectra and therefore to
collect the information they can fumish about the electronic structure ofthe examined systems.
The TDDFT scheme constitutes the state-of-the-art approach for this kind of studies, as it
provides an essential improvement over single particle schemes and at the same time assures
an excellent compromise between accuracy and computational economy for the treatment of
large and complex systems.
The present computational scheme has allowed to obtain valuable and original results: for the
first time the competitive TDDFT approach has been applied together with the powerful
cluster modeling tool to the simulation and the interpretation of NEXAFS spectra of large
solid state systems such as metal oxides.
The thesis is divided into two great parts: the first one (Chapters 1-3) offers a general
overview of the various theoretical concepts involved by the present work, while the second
one (Chapter 4-9) represents a collection of the results obtained during the Ph. D. activity
which have been the subject of publications on intemational scientific joumals.
Chapter 1 is a short description of the main aspects of NEXAFS spectroscopy, in particular
conceming solid state systems and molecules adsorbed on surfaces. Chapter 2 constitutes a
brief report of the salient points of the theoretical methods employed for the present thesis, in
particular DFT and TDDFT, with special interest in the core excitation treatment. In Chapter
3 the main topics about the cluster modeling of solid state systems are outlined.
V
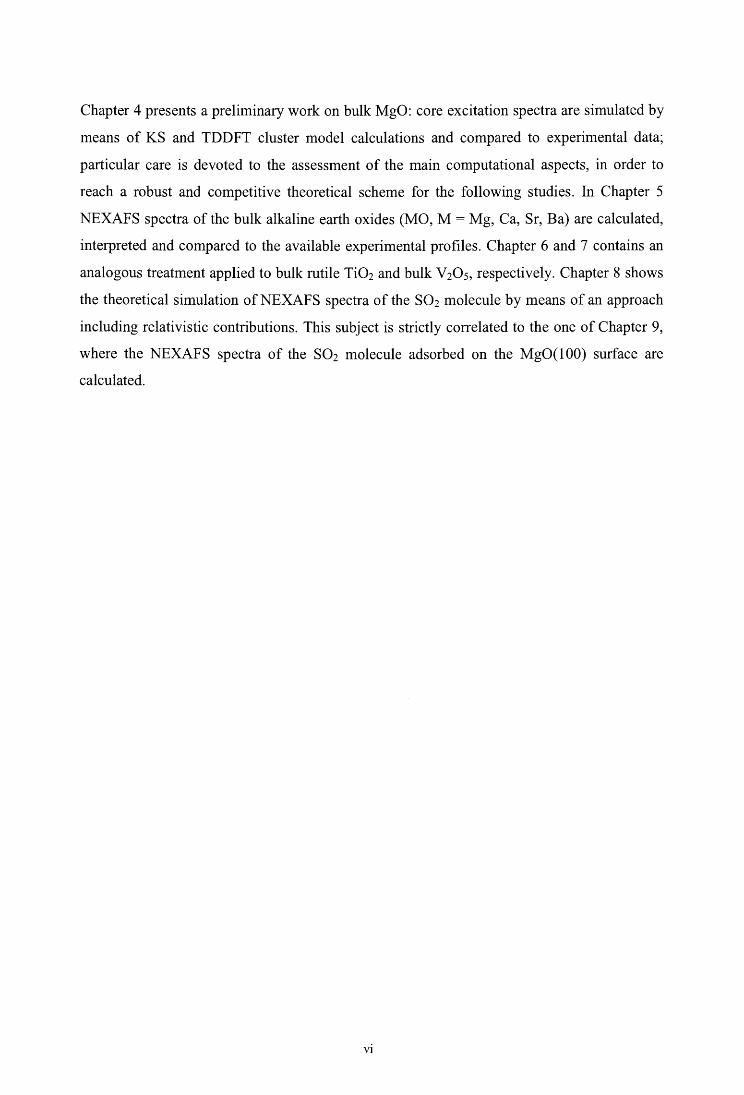
Chapter 4 presents a preliminary work on bulk MgO: core ex citati on spectra are simulated by
means of KS and TDDFT cluster model calculations and compared to experimental data;
particular care is devoted to the assessment of the main computational aspects, in arder to
reach a robust and competitive theoretical scheme for the following studies. In Chapter 5
NEXAFS spectra of the bulk alkaline earth oxides (MO, M = Mg, Ca, Sr, Ba) are calculated,
interpreted and compared to the available experimental profiles. Chapter 6 and 7 contains an
analogous treatment applied to bulk rutile Ti02 and bulk V20 5, respectively. Chapter 8 shows
the theoretical simulati on of NEXAFS spectra of the S02 molecule by means of an approach
including relativistic contributions. This subject is strictly correlated to the one of Chapter 9,
where the NEXAFS spectra of the S02 molecule adsorbed on the MgO(l 00) surface are
calculated.
VI

RIASSUNTO DELLA TESI
Lo scopo della presente Tesi di Dottorato è la simulazione teorica e la conseguente
interpretazione degli spettri NEXAFS (Near-Edge X-ray Absorption Fine Structure) di sistemi
allo stato solido, in particolare il bulk di ossidi metallici e piccole molecole adsorbite su
superfici di ossidi metallici. La simulazione dei sistemi allo stato solido è stata realizzata
mediante modellizzazione a cluster e l'approccio teorico scelto è il metodo DFT (Density
Functional Theory), sia a livello KS (Kohn-Sham) che soprattutto TDDFT (Time-Dependent
Density Functional Theory).
Lo studio teorico della struttura elettronica di sistemi complessi come quelli allo stato solido è
particolarmente importante vista l'importanza da essa rivestita nel determinare le loro
specifiche proprietà, specialmente dal punto di vista delle molteplici applicazioni di carattere
catalitico e tecnologico in generale.
La spettroscopia XAS (X-ray Absorption Spectroscopy) rappresenta uno strumento molto
potente per la caratterizzazione della struttura elettronica e geometrica locale per vari tipi di
sistemi; un approccio teorico efficiente è indispensabile per una dettagliata interpretazione di
questo tipo di spettri e per una successiva raccolta delle informazioni da essi fomite sulla
struttura elettronica dei sistemi in esame.
La teoria TDDFT rappresenta la migliore scelta possibile per descrivere questo tipo di sistemi,
in quanto garantisce un sostanziale miglioramento rispetto alle trattazioni a particella singola
e allo stesso tempo consente di raggiungere un ottimo compromesso tra accuratezza dei
risultati ed economia computazionale per il calcolo di sistemi grandi e complessi.
Lo schema di calcolo impiegato per il presente lavoro ha permesso il raggiumento di risultati
importanti ed originali: per la prima volta sono stati simulati ed interpretati spettri NEXAFS
di sistemi estesi allo stato solido, quali ossidi metallici, mediante modelli a cluster utilizzando
la metodologia TDDFT, che come detto è estremamente competitiva per questo tipo di studi.
La tesi si suddivide fondamentalmente in due parti: la prima (Capitoli 1-3) fornisce una
visione generale dei diversi aspetti teorici del presente lavoro, mentre la seconda (Capitoli 4-9)
è una raccolta dei risultati ottenuti durante l'attività di Dottorato, che sono stati oggetto di
pubblicazioni su riviste internazionali di carattere scientifico.
Il Capitolo 1 è una breve descrizione degli aspetti principali della spettroscopia NEXAFS, in
particolare relativamente sistemi allo stato solido e molecole adsorbite su superfici. Il
vii
Capitolo 2 costituisce un rapido excursus dei metodi teorici utilizzati per questo lavoro, in
particolare DFT e TDDFT, soffermandosi in particolare gli aspetti legati al calcolo delle
eccitazioni di core. Il Capitolo 3 tratta della modelizzazione a cluster di sistemi in stato solido,
soprattutto per quanto riguarda le sue principali caratteristiche e problematiche.
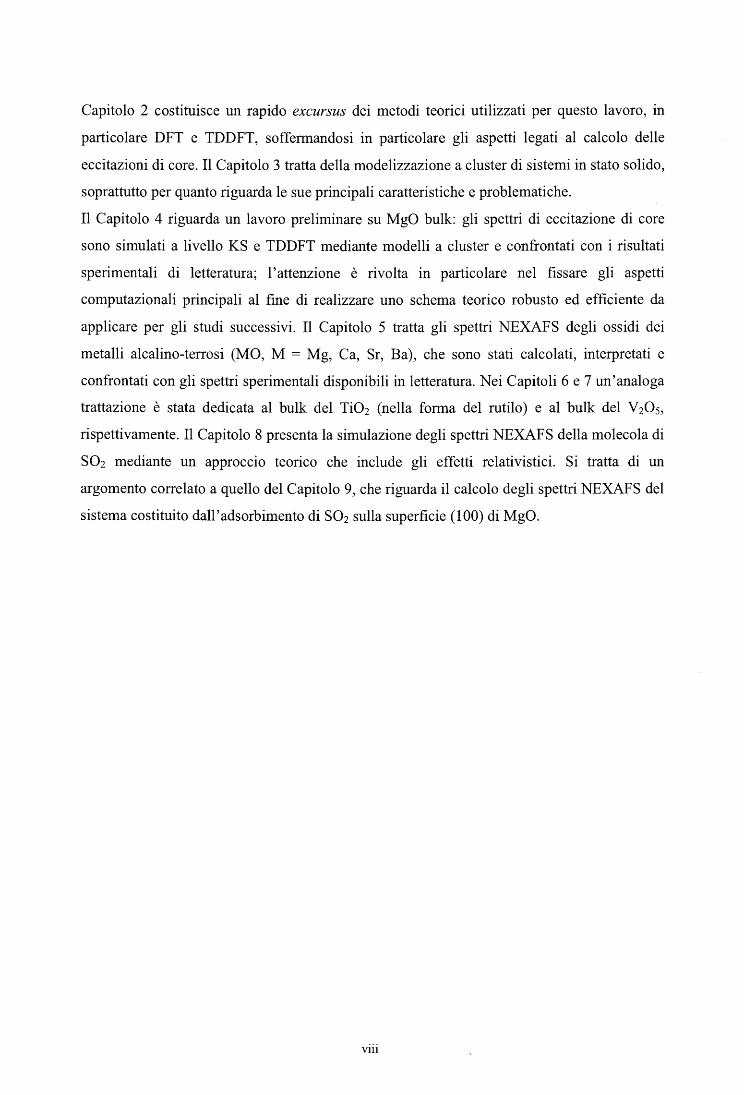
Il Capitolo 4 riguarda un lavoro preliminare su MgO bulk: gli spettri di eccitazione di core
sono simulati a livello KS e TDDFT mediante modelli a cluster e confrontati con i risultati
sperimentali di letteratura; l'attenzione è rivolta in particolare nel fissare gli aspetti
computazionali principali al fine di realizzare uno schema teorico robusto ed efficiente da
applicare per gli studi successivi. Il Capitolo 5 tratta gli spettri NEXAFS degli ossidi dei
metalli alcalino-terrosi (MO, M = Mg, Ca, Sr, Ba), che sono stati calcolati, interpretati e
confrontati con gli spettri sperimentali disponibili in letteratura. Nei Capitoli 6 e 7 un'analoga
trattazione è stata dedicata al bulk del Ti02 (nella forma del rutilo) e al bulk del V20 5,
rispettivamente. Il Capitolo 8 presenta la simulazione degli spettri NEXAFS della molecola di
S02 mediante un approccio teorico che include gli effetti relativistici. Si tratta di un
argomento correlato a quello del Capitolo 9, che riguarda il calcolo degli spettri NEXAFS del
sistema costituito dall'adsorbimento di S02 sulla superficie (100) di MgO.
vm

1. NEXAFS SPECTROSCOPY
1.1. INTRODUCTION
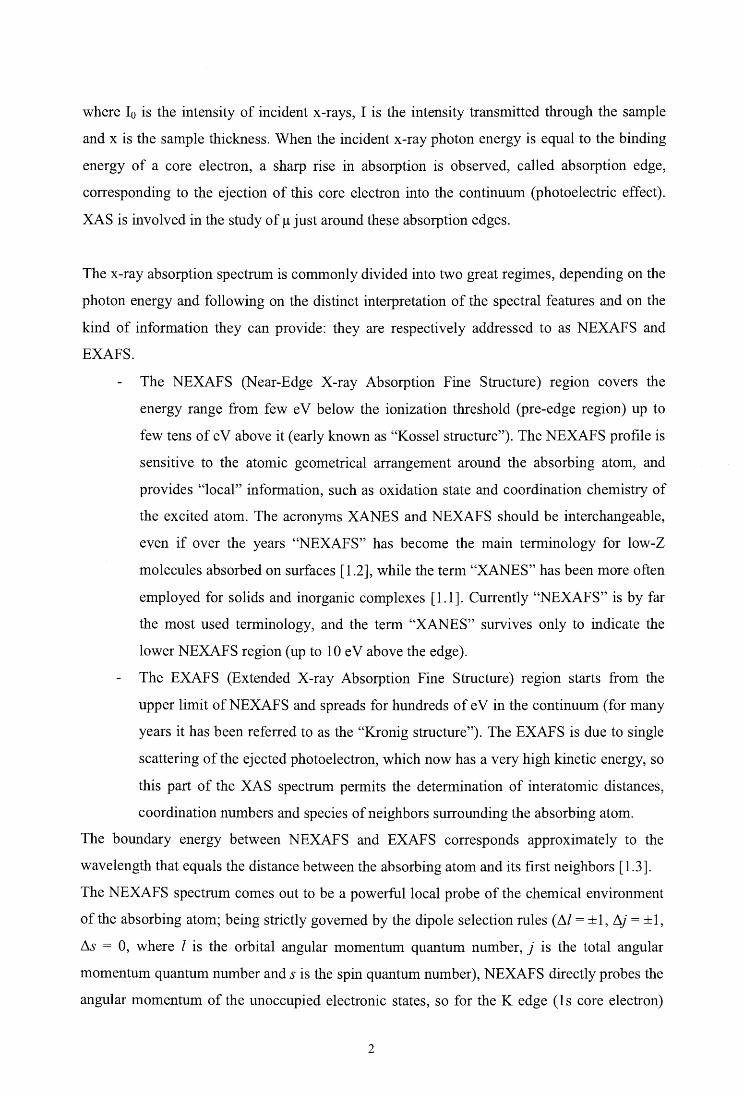
X-ray Absorption Spectroscopy (XAS) concems with the study of electronic excitations from
inner (core) levels to unoccupied states and to the continuum (see Figure 1.1 ); it is a locai
process which constitutes a powerful tool for the achievement of both electronic and structural
information in particular selected sites in complex systems.
The earliest x-ray absorption investigations were reported at the beginning of the last century,
however the main advances for these studies are related to the development of x-ray sources,
and in particular to the introduction of the synchrotron light (electron synchrotron sources,
with E < 1 GeV in the 1960s and early l 970s, and electron storage rings, with E > I GeV, in
the l 970s) [ 1.1].
XAS is interested in the study of the absorption coefficient µ, which gives the probability of
x-rays to be absorbed by the matter, as a function of energy:
I - I -µ·x - o ·e
Energy
hv
continuum ionization threshold
virtual orbitals
valence orbitals
core orbitals
Figure 1.1 . The x-ray absorption phenomenon. A photon is absorbed and a core-leve! electron is promoted to bound unoccupied below-edge states.
(1.1)
where 10 is the intensity of incident x-rays, I is the intensity transmitted through the sample
and x is the sample thickness. When the incident x-ray photon energy is equal to the binding
energy of a core electron, a sharp rise in absorption is observed, called absorption edge,
corresponding to the ejection of this core electron into the continuum (photoelectric effect).
XAS is involved in the study of µ just around these absorption edges.
The x-ray absorption spectrum is commonly divided into two great regimes, depending on the
photon energy and following on the distinct interpretation of the spectral features and on the
kind of information they can provide: they are respectively addressed to as NEXAFS and
EXAFS.
The NEXAFS (Near-Edge X-ray Absorption Fine Structure) reg10n covers the
energy range from few eV below the ionization threshold (pre-edge region) up to
few tens of e V above it ( early known as "Kossel structure"). The NEXAFS pro file is
sensitive to the atomic geometrica! arrangement around the absorbing atom, and
provides "local" information, such as oxidation state and coordination chemistry of
the excited atom. The acronyms XANES and NEXAFS should be interchangeable,
even if over the years "NEXAFS" has become the main terminology for low-Z
molecules absorbed on surfaces [ 1.2], while the term "XANES" has been more often
employed for solids and inorganic complexes [ 1.1]. Currently "NEXAFS" is by far
the most used terminology, and the term "XANES" survives only to indicate the
lower NEXAFS region (up to 10 e V above the edge).
The EXAFS (Extended X-ray Absorption Fine Structure) region starts from the
upper limit ofNEXAFS and spreads for hundreds of e V in the continuum (for many
years it has been referred to as the "Kronig structure"). The EXAFS is due to single
scattering of the ejected photoelectron, which now has a very high kinetic energy, so
this part of the XAS spectrum permits the determination of interatomic distances,
coordinati on numbers and species of neighbors surrounding the absorbing atom.
The boundary energy between NEXAFS and EXAFS corresponds approximately to the
wavelength that equals the distance between the absorbing atom and its first neighbors [1.3].
The NEXAFS spectrum comes out to be a powerful local probe of the chemical environment
of the absorbing atom; being strictly govemed by the dipole selection rules (M = ±1, ti}= ±1,
!:is = O, where l is the orbital angular momentum quantum number, j is the total angular
momentum quantum number and s is the spin quantum number), NEXAFS directly probes the
angular momentum of the unoccupied electronic states, so for the K edge (1 s core electron)
2

and the L1 edge (2s core electron) the primary transitions are s ~ p (the only dipole-allowed
ones ), while for the L2 (2p112) and L3 (2p312) edges the dipole allowed transitions are of the
type p ~ d and p ~ s (however the latter are in most cases at least 1 or 2 orders of magnitude
lesser than the former, especially for transition metal compounds). In other words, a K edge
NEXAFS spectrum maps the atomic np content of the absorbing atom in the unoccupied
electronic states, and a L2,3 edge spectrum essentially maps the analogous nd content.
The NEXAFS spectrum is usually in tum subdivided into two energy ranges:
The low energy pre-edge region, which features are caused by electronic transitions
to empty bound states, that are controlled by the dipolar selection rules, as discussed
above. This narrow energy range ( extending about 8 e V [ 1.1] up to the ionization
threshold) is rich in information on the local geometry around the absorbing atom,
on oxidations states and bonding characteristics. The physical origin of the
absorption features in the edge region is different in different classes of materials,
how it will be addressed later: Rydberg states in atoms, bound valence states (or
bound multiple-scattering resonances) in molecules, core excitons in ionie crystals,
many-body singularities in metals, bond atom-like localized excitation in solids [1.4].
The high energy region, which features are essentially explained by means of
multiple-scattering resonances (with large cross sections) of the photoelectrons
ejected at low kinetic energy [1.5]; information is provided about the atomic position
of the neighbors of the absorbing atom, both for interatomic distances and bond
angles.
This distinction directly involves the concept of absorption threshold, which can be defined in
a threefold manner [ 1.1]:
the "absorption threshold", that is the energy of the lowest energy state reached by
the core excitations;
the "absorption jump edge" or "rising edge", that is the energy where the absorption
coefficient is at half-height of the atomic absorption jump; because the dipole
selection rule can suppress a number of the lowest transitions, the energy of the
absorption jump edge can be much larger than the absorption threshold;
the "continuum threshold" or "ionization threshold", that is the energy at which the
electron is ej ected into the continuum.
If we limit our discussion, for the sake of simplicity, to K shell excitation spectra (but the
following considerations have more general validity) the 1 s Ionization Potential (IP) or
3
Binding Energy (BE) is defined as the minimum energy necessary to excite a 1 s electron to
the continuum of states above the vacuum level, i.e. the third definition of absorption edge
presented above; it is conveniently measured by photoelectron spectroscopy (XPS) as the
difference between the exciting photon energy (hv) and the Kinetic Energy of the
photoelectron (KE), i. e. the energy posi ti on of the corresponding peak in the XPS spectrum:
IP = BE = hv - KE (1.2)
An alternative experimental technique for the investigation of the electronic structure, as
concerns the conduction band, especially for solids is represented by the high-energy Electron
Energy-Loss Spectroscopy (EELS) in transmission [1.6]. It consists in exposing the sample to
a beam of electrons with a known, narrow range of kinetic energies; some electrons will
undergo inelastic scattering (interaction between the beam electron and an electron in the
sample) and consequently will lose energy; the measurement of the scattered electron energies
gives the distribution of energy loss, i. e. the EELS spectrum. EELS and XAS pro vide similar
information about the conduction band (while XPS deals with the valence band); among the
EELS advantages one has the opportunity to use smaller samples and to increase the
momentum transfer so that other than dipole selection rules apply. In recent years the fast
development of microscopy, resulting in powerful techniques as the integration of EELS and
TEM (Transition Electron Microscopy) [1.7-8], has renewed the interest in locai electronic
structure analyses for many complex systems, furnishing a valuable alternative tool to XAS.
1.2. THEORETICAL APPROACH TO NEXAFS
1.2.1. Generai remarks
NEXAFS is a much larger signal than EXAFS, so it can be measured at lower concentrations
( even for elements of minority and trace abundance) and at less-than-perfect sample
conditions; furthermore, it is one of the few non-destructive structural probes available for
non-crystalline and highly disordered materials, including solutions and complex systems
(such as polymers). However, NEXAFS is considerably harder to fully interpret than EXAFS;
precise and accurate calculations are mandatory for a correct and non-ambiguous
interpretation of the spectral features. The theoretical description of NEXAFS spectra
4
represents a big challenge due to the difficulty to calculate both the pre-edge and post-edge
energy regions. A customary general theoretical approach explains the NEXAFS structures as
arising from a multiple scattering process, where the excited electron is resonantly scattered
by the surrounding atoms in the molecules. This description has the advantage to provide the
MS-Xa computational method which can estimate both the bound and the above edge
transitions [1.9]. This approach, which is at present the only widely employed scheme to
describe the above edge region, is however limited by the crude muffin-tin approximation.
Altematively the near-edge absorption structures can be investigated at theoretical level in
terms of discrete below edge transitions of the core electron into the unoccupied orbitals of
the molecule characterized by well defined excitation energies and oscillator strengths, and of
continuum transitions which generate the photoionization cross section profiles above the
ionization limit. The LCAO Molecular Orbital (MO) approach is particularly convenient to
describe below edge excitations in terms of one-electron transitions which are known to make
usually the largest contributi on to the discrete structures of the XAS spectra. The calculations
ofbound excited states can be performed at various levels of approximation in the framework
of accurate theoretical schemes, however these methods are based on localized orbitals,
therefore they are not a suitable tool to describe states in the continuum. For the present,
discrete transitions evaluated above the edge, although partly basis set dependent, may be
qualitatively associated with the prominent resonances in the spectrum, in particular in the
lowest energy range [1.10]. Such approximation can be further refined in the rigorous
framework provided by Stieltj es moment theory [ 1.11].
1.2.2. Relaxation effects
Following an absorption event, the atom is said to be in an excited state, with one of the core
electron levels left empty: a core hole has been created. Apart from the decay of the excited
atomic state, which can follow two main mechanisms (fluorescence, ifa higher energy core-
level electron fills the deeper core hole, ejecting an x-ray of well-defined energy,
characteristic of the atom, or Auger effect, if an electron drops from a higher electron level
and a second electron is emitted into the continuum), it can be important to take into account
the so-called relaxation effect, that is the modification of the molecular orbitals following the
core-hole creation. From a theoretical point of view, different strategies can be introduced in
order to include relaxation effects and therefore to obtain more correct values for the
5

calculated ionization thresholds and excitation energ1es; this topic will be discussed m
Chapter 2.2 within the DFT framework.
1.3. NEXAFS OF FREE MOLECULES
Fora closed shell atom in its ground state, empty Rydberg states are predicted just below the
vacuum level, above which a continuum of empty states is found; the same picture applies for
the core excited atom, even if the energies of the electronic states are shifted.
Fora diatomic molecule we have also Rydberg states below the vacuum level and continuum
states above it; in addition there are unfilled molecular orbitals. It is quite common in
chemistry to label the molecular orbitals (MOs) as a o n depending on their spatial
displacement and orientation, respectively along and perpendicularly to the bond between two
atoms. These considerations result rather useful in order to outline some general, simple rules
characterizing the K edge NEXAFS spectra within the "building block picture" invoked by
StOhr [1.2], that is a simple but successful approach for the interpretation of complex system
spectra as the superposition of those of the diatomic building blocks by means of a
systematics of resonance positions that reinforces the well-known "fingerprinting" power of
NEXAFS.
In the pre-edge region two kinds of resonances dominate: the broader and often more intense
ones are associated to excitations into the valence unoccupied MOs, while the sharper and
higher energy structures arise from excitations into the Rydberg orbitals which in principle
forma series converging to the ionization limit. The relative importance of the resonances and
the Rydberg structures varies from molecule to molecule and also depend on the symmetry of
the molecule as well as on the symmetry of the excited atom core level. The distinction
between valence and Rydberg structures and their relative importance in the XAS spectra is
often complex because of possible mixing of orbitals of the same symmetry to form excited
states of composite valence-Rydberg character.
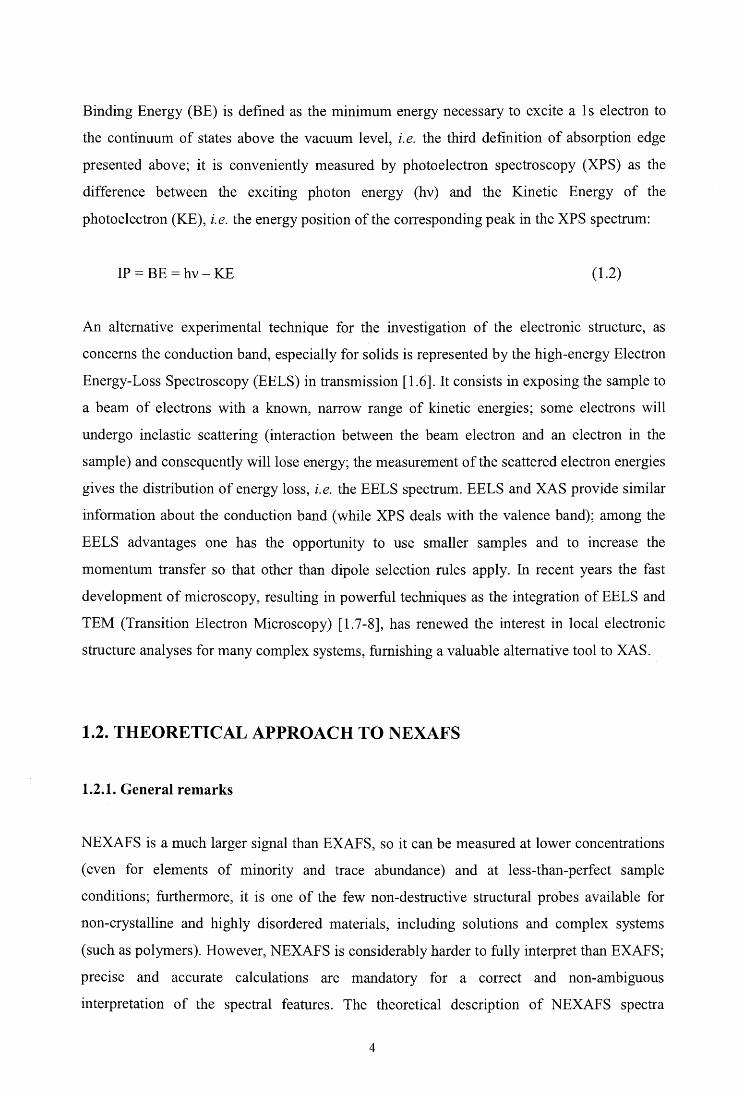
1.3.1. n* resonances
In all known K-shell spectra oflow-Z molecules the n* resonance, if present (a n* resonance
is observed only for molecules with n bonding), is the lowest energy structure and falls below
6

the ionization edge; the n* term value (TV), defined as the difference between the IP and the
energy posi ti on of the n* resonance:
TVn =-~1t = IP-En (1.3)
is rather constant, within about 1 eV, independent of the hybridization, the atom whose K-
shell is excited, the chemical shifts of the IP, while it seems to be directly proportional to the
sum of the Z values of the two selected atoms. Within a series of molecules containing the
same atoms, the n* intensity is sensitive to the bond order (and following to the bond length)
between the two selected atoms.
8
6 * n
2436 2438 2440 2442 2444 2446 2448
calculated excitation energy (eV)
Figure 1.2. NEXAFS spectra of S02, calculated at the TDDFT level (see Chapter 8); n* and cr* features, typical of NEXAFS of small molecules, are clearly visible.
1.3.2. Rydberg and mixed valence-Rydberg resonances
2450
In the energy regi on between the n* resonance and the IP, several sharp and weak resonances
are encountered, due to transitions to Rydberg orbitals or, in the presence of bonds to H atoms,
to a mixture of Rydberg and hydrogen-derived antibonding orbitals. The intensity of these
features increases as the bond order decreases; as concems their energy positions,
relationships that are similar to those relative to n* resonances can be applied. Mixed valence-
Rydberg resonances are important for the evaluation of the chemisorption extent in adsorbate-
7
substrate systems, since for strongly chemisorbed molecules their intensities are heavily
quenched, while H-originated resonances survive, being more localized (like 11* or cr*).
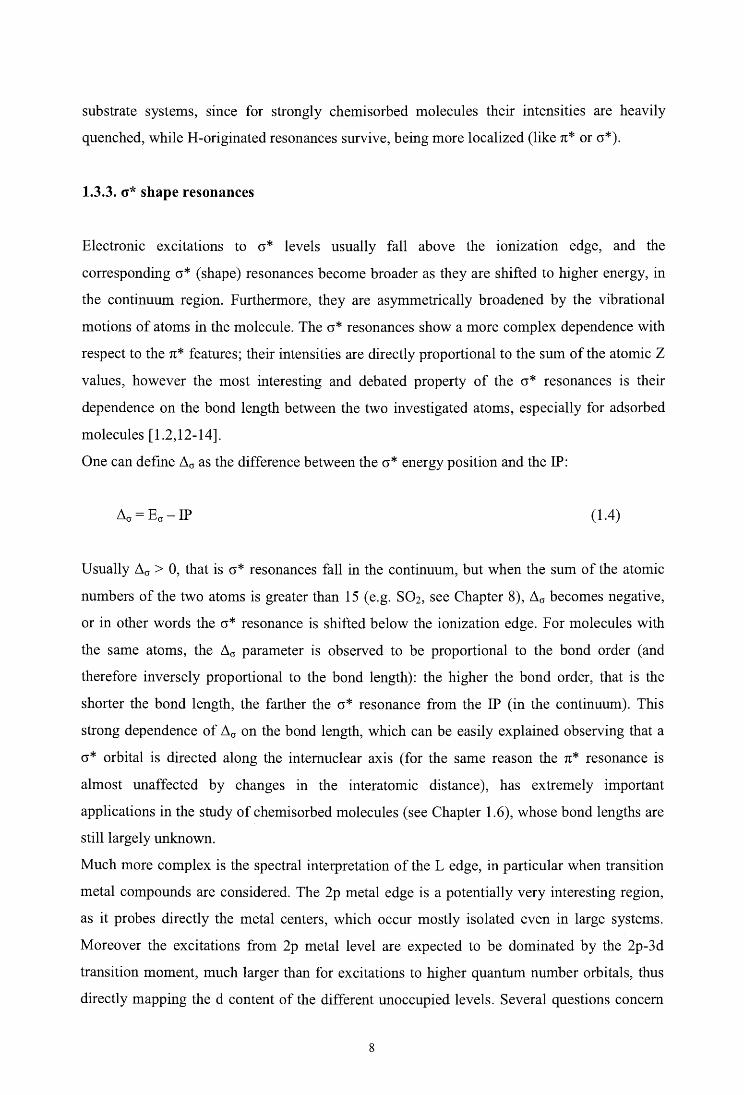
1.3.3. a* shape resonances
Electronic excitations to a* levels usually fall above the ionization edge, and the
corresponding cr* (shape) resonances become broader as they are shifted to higher energy, in
the continuum region. Furthermore, they are asymmetrically broadened by the vibrational
motions of atoms in the molecule. The cr* resonances show a more complex dependence with
respect to the 11* features; their intensities are directly proportional to the sum of the atomic Z
values, however the most interesting and debated property of the cr* resonances is their
dependence on the bond length between the two investigated atoms, especially for adsorbed
molecules [ 1.2, 12-14].
One can define ~cr as the difference between the cr* energy position and the IP:
(1.4)
U sually ~cr > O, that is cr* resonances fall in the continuum, but when the sum of the atomic
numbers of the two atoms is greater than 15 ( e.g. S02, see Chapter 8), ~cr becomes negative,
or in other words the cr* resonance is shifted below the ionization edge. For molecules with
the same atoms, the ~cr parameter is observed to be proportional to the bond order ( and
therefore inversely proportional to the bond length): the higher the bond order, that is the
shorter the bond length, the farther the cr* resonance from the IP (in the continuum). This
strong dependence of ~cr on the bond length, which can be easily explained observing that a
a* orbi tal is directed along the intemuclear axis ( for the same reason the 11* resonance is
almost unaffected by changes in the interatomic distance ), has extremely important
applications in the study of chemisorbed molecules ( see Chapter 1. 6), whose bond lengths are
still largely unknown.
Much more complex is the spectral interpretation of the L edge, in particular when transition
metal compounds are considered. The 2p metal edge is a potentially very interesting region,
as it probes directly the metal centers, which occur mostly isolated even in large systems.
Moreover the excitations from 2p metal level are expected to be dominated by the 2p-3d
transition moment, much larger than for excitations to higher quantum number orbitals, thus
directly mapping the d content of the different unoccupied levels. Severa! questions concem
8
the influence on the absorption pattern of the local symmetry and the ligand field splitting of
the d manifold, versus the individua! nature of metal and ligand species and the metal-ligand
bonding involved. The relatively weak involvement of d orbitals in covalent bonding would
suggest an interpretation based on ligand field splitting of the 3d shell mainly determined by
local symmetry and field strength. A different picture however emerges from experimental
data on metal carbonyls and cyclopentadienyls [ 1.15] where a strong sensitivity to the nature
of the ligands has been observed which implies on the contrary little dependence on the nature
of the metal atom involved. This has led to a suggestion that 2p excitation spectra would
reflect essentially the nature of the ligand and the chemical bonding involved, with the total
oscillator strength as a measure ofthe density ofthe unoccupied d states [1.5,16].
1.4. NEXAFS OF CONDENSED SYSTEMS
The interpretation of NEXAFS of condensed systems is not as simple as for small molecules,
discussed so far. Nevertheless, the local nature of x-ray absorption makes this technique very
powerful in order to characterize the rather complex electronic structure of solid systems,
which represents the most outstanding subject of the present thesis. As stated in the
introduction (Chapter 1.1 ), NEXAFS pro bes the angular momentum of the unoccupied
electronic states and therefore fumishes stereochemical details ( oxidation states, coordinati on
geometri es, bond angles) that are of special relevance in solid state systems, first of all for the
crucial role they play in catalysis, thus requiring an extensive comprehension and
characterization of their electronic and geometrie structure. Moreover, final electronic states
in condensed systems are not fully atomic-like and may have a certain degree of mixing
(hybridization) with other orbitals (e.g. the oxygen 2p - metal nd mixing in transition metal
oxides, see Chapters 6-7).
These observations become particularly intriguing when dealing with transition metal
compounds, since core excitations directly probe the metal d participation in the virtual
orbitals, and therefore provide a reliable picture of the role played by the metal d character in
the bonding [ 1.1 7].
Through the treatment of NEXAFS for metal oxides [ 1.18], which consti tute the most deeply
studied topic of the present thesis, some salient aspects can be outlined in order to trace a
general picture of what is important for a detailed description of the NEXAFS of metal
compounds and of the chemical and structural informati on they are rich in.
9
The K edge NEXAFS of a metal-based system is characterized by a pre-edge peak (or pre-
peak), an edge peak and post-edge peaks. A distinction should be made between below- and
above-edge region, depending on their specific physical origin: the low-energy features are
dominated by atomic-like effects and are significantly influenced by the electronic structure
of the system, while the NEXAFS features in the continuum are due mainly to the atomic
distribution of neighboring atoms and can be interpreted as multiple-scattering resonances,
similarly to what shown for the shape resonances in molecules (see Chapter 1.3.3). A MO
approach confirms this picture, since the greatest part of chemical and structural information
is provided by the analysis of the transition from core to bound below-edge states, while a
"conventional" simulations (i.e. not including a proper continuum treatment) gives less
meaningful results above the ionization threshold.
The pre-edge peaks are strictly connected to the presence of an inversion centre in the system:
for centrosymmetric geometries (typically the tetrahedral coordination) a large pre-edge
intensity is expected, while for non-centrosymmetric coordination ( e.g. octahedron) only a
very weak pre-edge peak is observed: this allows an easy first-sight classification of the
symmetry around the absorbing atom (e.g. in order to differentiate four-, five-, six-fold
coordination). Distortions from the octahedral coordination cause a symmetry lowering and
an increase in the pre-edge intensity, as a consequence of a non-negligible p-d mixing. Large
debate in literature concems the understanding of "core excitons" [1.19-20]: they are bound
excited states appearing in the edge region of insulators below the continuum threshold and
can be interpreted as relaxation effects (interaction between the excited core electron and the
consequent core ho le); being the core ho le fixed at an a tomie site, core excitons are extremely
localized and therefore strongly depend on the electronic structure around the absorbing atom;
assignments of pre-edge peaks for such systems are not yet clear, as they are very weak and
might be due to several complex effects. Dipole-forbidden (but quadrupole-allowed) s ---+ d
transitions can be observed in the pre-edge region even for non-centrosymmetric systems, but
they are usually very weak (see Chapter 6).
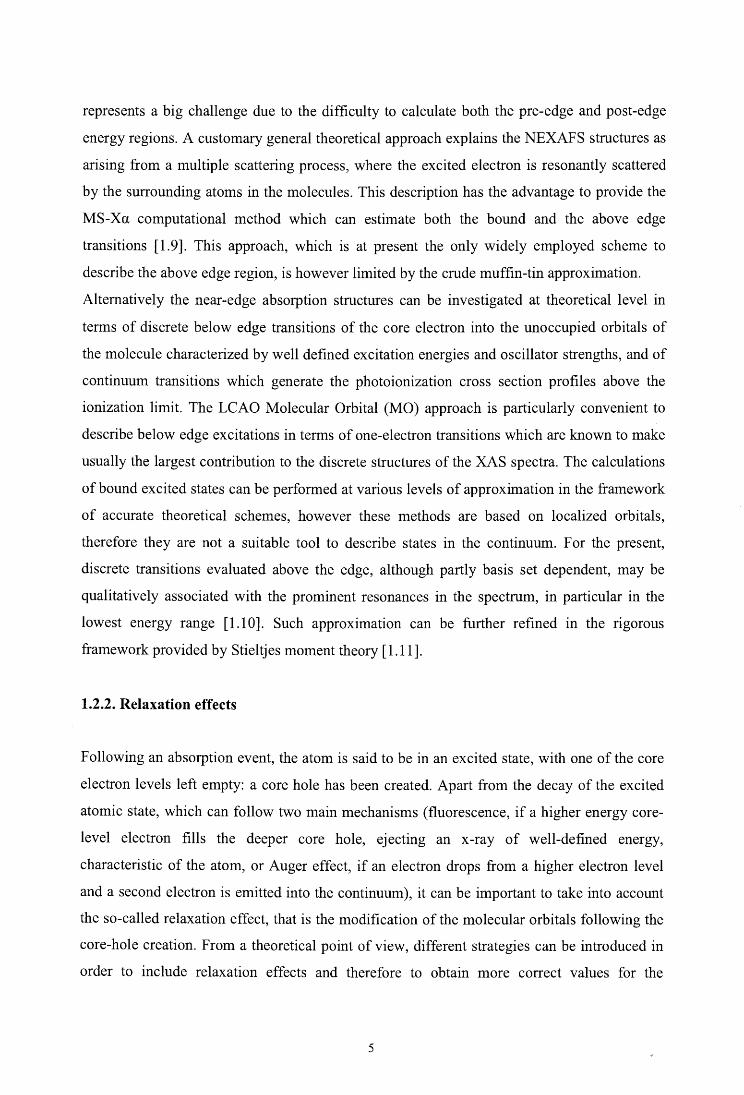
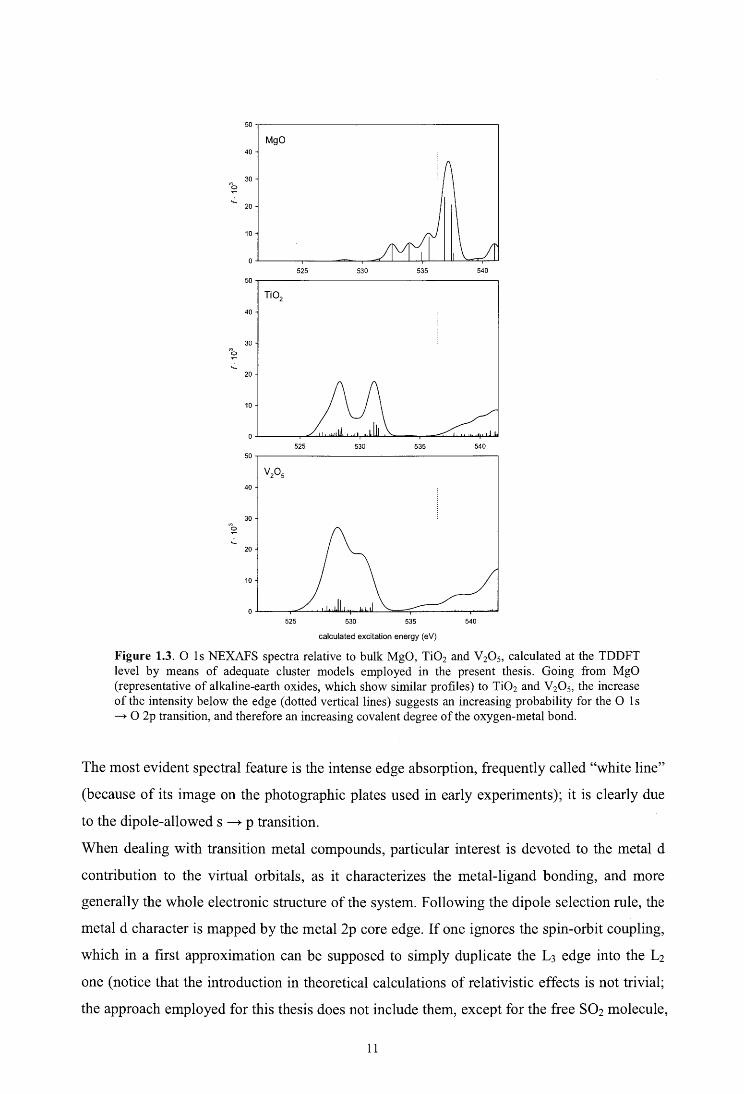
If some O 2p - metal nd mixing (hybridization) occurs, an intense peak will be observed in
this region. This can provide an interesting evaluation of the ionicity I covalency degree of a
metal-oxygen bond: in an ideally perfect ionie picture, the O 2p is completely filled, so the O
1 s ---+ O 2p transiti on is not accessible; this allows the establishment of a relationship between
the O ls pre-edge intensity and the ionic/covalent character of the bond (see Figure 1.3): the
higher the intensity, the higher the p-d oxygen-metal mixing, the higher the covalent character
of the metal-oxygen bond [ 1.21].
10
50
Mg O 40
30 o
20
10
525 530 535 540 50
Ti02 40
30 'b
20
10
525 530 535 540 50
V20s 40
30
~ ...:..
20
10
525 530 535 540
calculated excitation energy (eV)
Figure 1.3. O ls NEXAFS spectra relative to bulk MgO, Ti02 and V20 5, calculated at the TDDFT level by means of adequate cluster models employed in the present thesis. Going from MgO (representative of alkaline-earth oxides, which show similar profiles) to Ti02 and V20 5, the increase of the intensity below the edge ( dotted vertical lines) suggests an increasing probability for the O 1 s ---+-O 2p transition, and therefore an increasing covalent degree ofthe oxygen-metal bond.
The most evident spectral feature is the intense edge absorption, frequently called "white line"
(because of its image on the photographic plates used in early experiments); it is clearly due
to the dipole-allowed s ----+ p transition.
When dealing with transition metal compounds, particular interest is devoted to the metal d
contribution to the virtual orbitals, as it characterizes the metal-ligand bonding, and more
generally the whole electronic structure of the system. Following the dipole selection rule, the
metal d character is mapped by the metal 2p core edge. If one ignores the spin-orbit coupling,
which in a first approximation can be supposed to simply duplicate the L 3 edge into the L1
one (notice that the introduction in theoretical calculations of relativistic effects is not triviai;
the approach employed for this thesis does not include them, except for the free S02 molecule,
11
see Chapters 2.6 and 8), and selects - as common - the lower L3 edge, a white line is also
expected, due to the strong dipole-allowed p ---+ d transition. Such spectral feature is clearly
dependent on the degree of metal-ligand hybridization, similarly to what described above for
O 1 s spectra. Furthermore, the availability of virtual orbitals with prevalent d character is
predicted by the metal 2p core spectmm. A finer characterization of the electronic stmcture
can be provided if one considers the crystal-field splitting of d orbitals. In a perfect octahedral
symmetry, they lose their spherical-field degeneracy andare split into t1g and eg subgroups, so
two main features are expected to emerge in the corresponding metal 2p core spectmm,
separated by an energy that can be roughly estimate the crystal-field splitting. For lower
symmetry systems ( e.g. Ti02, V 20 5) further splitting of d orbitals occurs, and accurate Partial
of Density of States (PDOS) calculations (see Chapter 2.4) are required to obtain a non-
ambiguous assignment of the different spectral features.
1.5. ANGULAR RESOL VED NEXAFS
A very forceful typology of NEXAFS spectra is represented by angular resolved NEXAFS,
which consists of studying the absorption by the system under analysis of polarized x-rays.
The use of the polarization dependence of the absorption cross section in the NEXAFS
spectra of anisotropie sites allows to select the multiple-scattering contributions due to a set of
atoms placed in a particular direction or on a particular plane; consequently, the orientation
and angular distribution of neighboring atoms can be easily determined by changing the
relative position of the incident beam and the sample.
In a MO approach the polarization dependence of the resonance intensities can be correlated
to the spatial displacement of the final orbital [1.2]: the resonance intensity associated with a
specific molecular orbi tal final state is largest if the electric field vector points in the direction
of that molecular orbital, and the intensity vanishes if the electric field vector is perpendicular
to that direction.
Although the main application of these simple considerations lie in the determination of the
orientation of molecules chemisorbed on surfaces (vide infra), angle-resolved NEXAFS has
more general importance; an example in this sense is represented by polarized x-ray
absorption of V205 [1.22-24], that due to its highly layered anisotropie stmcture shows a
strong dependence on the polarization direction of incident x-rays, in particular on whether
the polarization direction is parallel or perpendicular to the V 20 5 layers constituting the
12
crystal structure. Results obtained by means of a theoretical approach which does not include
such polarization effects can only be compared to angle-averaged spectra, even if angle-
resolved NEXAFS calculations exist and are ab le to reproduce experimental data [ 1.25].
1.6. NEXAFS OF CHEMISORBED MOLECULES
NEXAFS has been extensively used to study the adsorbate structure on surfaces, and the
application of this technique to the determination of the molecular orientation is particularly
well-established, especially by means of the polarized x-ray absorption spectroscopy.
The starting point is the observation that NEXAFS characteristic resonances are associated to
particular intra-molecular bonds; this results in a clear overall similarity between the
excitation spectra of chemisorbed and free molecules, since the extra-molecular interaction
established between the molecule and the surface upon chemisorption ( and all the more so for
the weaker physisorption) does not affect dramatically the general absorption profile. The
resonance dependence on intra-molecular bonds makes NEXAFS capable to distinguish
whether a molecule remains intact or dissociates on the surface ( e.g. a clear fingerprinting is
claimed by Rodriguez et al. [ 1.26] when assigning specific absorption features to the different
species formed after the adsorption of S02 upon the MgO(l 00) surface, see Chapter 9). The
spectral features associated to the free molecule are sensitive to extra-molecular surface-
molecule interactions [ 1.27] and depend on the interaction itself:
for physisorbed molecules the surface-molecule interaction is weak and only a small
variation is expected with respect to the free molecule spectrum; in fact the overlap
between adsorbate and substrate orbitals is small and the electronic structure of the
free molecule is preserved;
for chemisorbed molecules the surface-molecule interaction is stronger and can
became comparable to intra-molecular bonds; an orbital mixing occurs between
adsorbate and substrate: valence levels formerly not occupied may be partially
populated and shifted in energy, with the consequence of a modified XAS spectrum
with respect to the free molecule; this effect is not limited to the valence but can
involve also Rydberg states.
Nevertheless, a deeper inspection of NEXAFS spectra of chemisorbed molecules, by means
of detailed theoretical calculations, can evidence the slight variations caused in the electronic
structure, and therefore in the core spectrum, by the presence of the substrate, even if no new
13
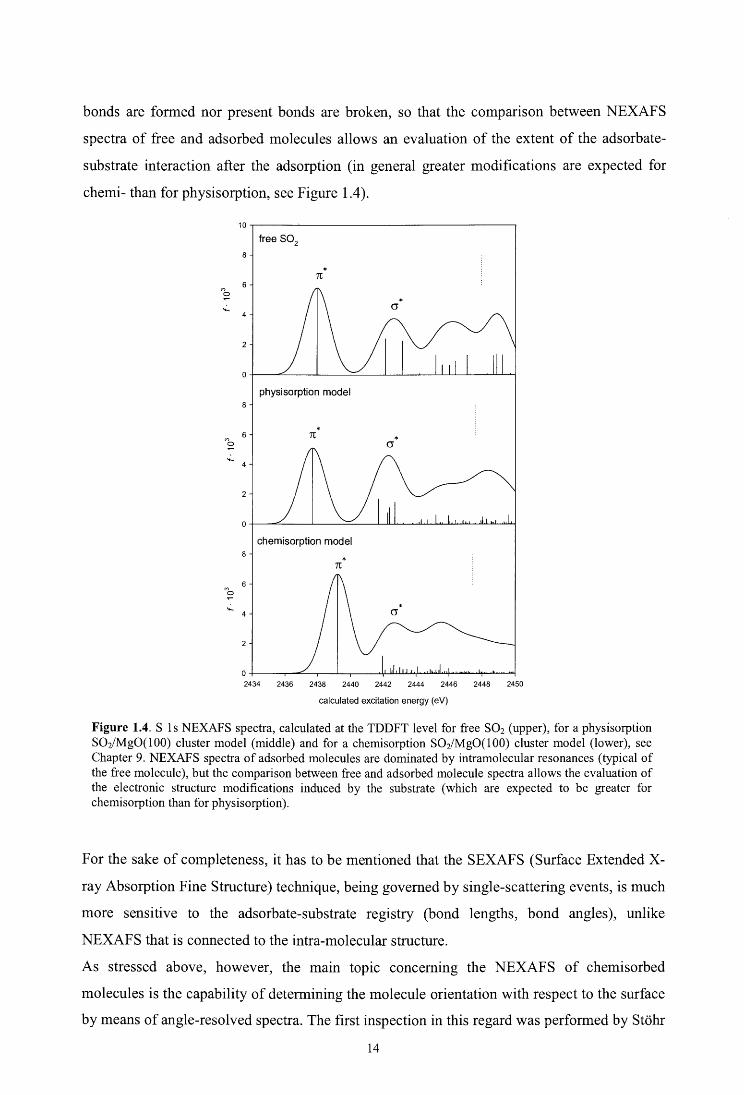
bonds are formed nor present bonds are broken, so that the comparison between NEXAFS
spectra of free and adsorbed molecules allows an evaluation of the extent of the adsorbate-
substrate interaction after the adsorption (in general greater modifications are expected for
chemi- than for physisorption, see Figure 1.4).
"' o
"' o
"' o
free so2
* 7t
physisorption model
* 7t * a
chemisorption model
* 7t
2434 2436 2438 2440 2442 2444 2446 2448 2450
calculated excitation energy (eV)
Figure 1.4. S 1 s NEXAFS spectra, calculated at the TDDFT level for free S02 (upper), for a physisorption S02/MgO(lOO) cluster model (middle) and for a chemisorption S02/Mg0(100) cluster model (lower), see Chapter 9. NEXAFS spectra of adsorbed molecules are dominated by intramolecular resonances (typical of the free molecule), but the comparison between free and adsorbed molecule spectra allows the evaluation of the electronic structure modifications induced by the sub stra te ( which are expected to be greater for chemisorption than for physisorption).
For the sake of completeness, it has to be mentioned that the SEXAFS (Surface Extended X-
ray Absorption Fine Structure) technique, being govemed by single-scattering events, is much
more sensitive to the adsorbate-substrate registry (bond lengths, bond angles), unlike
NEXAFS that is connected to the intra-molecular structure.
As stressed above, however, the main topic conceming the NEXAFS of chemisorbed
molecules is the capability of determining the molecule orientation with respect to the surface
by means of angle-resolved spectra. The first inspection in this regard was performed by St6hr
14

et al. [1.28] on the CO/Ni(IOO) and NO/Ni(IOO) systems, and after that hundreds of works
have been focused on this important NEXAFS application. It is essentially based upon the
simple observations presented in Chapter 1.5, stating that the resonance intensity associated to
the transition to a specific final orbital is maximized when the electric field vector is parallel
to that orbital direction, and vanishing if perpendicular. The following simple rule is used,
based on the opposi te behaviors of the cr* and the n* resonances:
when the molecular plane is parallel to the surface, the n* intensity is largest for
normal incidence and the cr* intensity is largest for grazing incidence;
when the molecular plane is perpendicular to the surface, the n* intensity is largest
for grazing incidence and the cr* intensity is largest for normal incidence.
Particular care has to be taken when the cr* resonance is in its minimum condition, because it
is likely to be confused with other weak features (the n* suffers much less this problem as it
generally falls in an otherwise "empty" photon energy range) so that the use of its posi ti on for
the determination ofbond length (see Chapter 1.3.3) becomes extremely ticklish.
15
2. THEORETICAL METHOD
2.1. DFT-KS APPROACH
2.1.1. Generai remarks
The Density Functional Theory (DFT) represents a very popular quantomechanical method
for the solution of the Schrodinger equation, given the good compromise it provides between
accuracy of the results and computational request. Since it is largely well-established and
many extensive descriptions of the method are available in literature, only fundamental
equations are here outlined. DFT provides a variational principle which can be rigorously
employed to describe the Ground State (GS) of electronic systems such as atoms, molecules
and solids [2.1-3]. The well-known Kohn-Sham (KS) equations are to be solved:
(2.1)
occ spin
p(r) = :L:Lnilcri (r,s)l2 (2.2)
i s
where p(r) is the density as a function of r and the KS Hamiltonian is the following local
operator:
" 1 2 nuclei zi ' p(r') -HKS =--V - L-1--1 + f dr -1--·1 + vxc(p(r)) 2 i ri-r r-r
(2.3)
It is composed of, respectively, the kinetic energy, the nucleus-electron attraction, the
Coulomb electron-electron classic repulsi on ( expressed in terms of the density p(r)) and the
exchange-correlation potential, which includes all the contributions that cannot be exactly
calculated, due to non-classica! interactions, and that must be approximated; the accuracy of
DFT lies in the relatively small amount of the exchange-correlation term with respect to the
16
other contributions. The KS equations are iteratively solved to obtain the molecular orbitals <j)i
and the corresponding eigenvalues Ei, representing the orbital energies.
Following the Amsterdam Density Functional (ADF) implementation [2.4], employed for the
present thesis, a fitting on the electronic density is performed through an auxiliary basis set
spin nuclei
p(r) = L Ll<pi c-r,s)l 2 ~ iJcn = Lk aJk c-r) (2.4)
i
The ADF implementation is based on the use of Slater-Type-Orbital (STO) functions and on
numerica! integral calculations.
2.1.2. Relaxation effects, excitation energies and oscillator strengths
The DFT method is rigorous only for the GS configuration, therefore in principle the
treatment of electronic excited states is not justified but in some particular cases [2.1];
however the KS scheme is suitable also for the description of excited states, in fact the
occupation numbers (ni) defining the density (see equation 2.1) can be opportunely selected to
represent whichever mono-determinant electronic configuration, different from the GS.
Although the theoretical validation of this theory has not been reached yet, the remarkable
accuracy of the results represents a good reason for employing this theoretical scheme.
The simplest approach is the neglect of relaxation effects by means of a frozen-orbital
Koopmans-type assumption: excitation energies are simply calculated as the differences
between the energy eigenvalues relative to the initial occupied core level and the final virtual
level:
(2.5)
while the IP is directly obtained following Koopmans' theorem as the opposi te eigenvalue of
the initial core level:
IP(i) =-si (2.6)
17
in other words this approximation assumes that, upon remo val of an electron from some (core)
orbi tal <pi, none of the other cpk' s change, i. e. they remain frozen.
The oscillator strengths, representing the transition intensities, are calculated using the dipole
integrals between the eigenfunctions corresponding respectively to the initial ( cpin) and the
final ( (j)fin) state:
(2.7)
being nin the occupati on number of the initial state.
The ~SCF scheme, as suggested by the name itself, consists in performing two different SCF
calculations, one for the N-electron GS and on for the ion, that is for the (N-1)-electron
configuration obtained by properly fixing the occupation numbers; the corresponding
excitation energy is obtained as the difference in total energy between the ground state and the
excited state:
~Ein~fin = EGS - Ecore-1 virt+l
(2.8)
It clearly follows that such procedure for the calculation of excitation energ1es 1s rather
cumbersome, as it requires a different calculation for each unoccupied final orbitai.
The Transition State (TS) method, proposed by Slater [2.5], consists in performing one SCF
calculation for the electronic configuration in which half an electron is promoted from the
initial to the final level; the difference in total energy between these two states represents a
good approximation of the excitation energy, which accounts for relaxation to second order.
In fact, one can expand in Taylor series the total energy E as a function of occupation
numbers, around the TS configuration:
8E 1 2 a 2 E 1 3 a 3 E E(ni +~ni)=E(ni)+~ni-+l(~nJ --2 +-,(~nJ - 3 + ...
ani. 2. an. 3. an. I I
(2.9)
i 1 8E 1 1 a 2 E 1 1 a 3 E E. =E +--+-·---+-·---+
m TS 28n1. 2 48n. 2 6 88n. 3 ...
I I
(2.1 O)
18

i 1 8E 1 1 a 2 E 1 1 a 3 E E =E ---+-·-----·---+ fin TS 2 00
1. 2 4 00. 2 6 8 00. 3 ...
1 1
By application of Janak's theorem [2.6]:
8E f:. =-
1 an. 1
and taking the difference between (2.11) and (2.1 O), one obtains:
1 83E ~E -E -E -e _e ----+
in~fin - fin in - 0 fin °in 3 ... 24 ani
(2.11)
(2.12)
(2.13)
The TS formalism is computationally easier and numerically more accurate than the ~SCF
scheme; the choice of the former is more convenient due to the description of initial and final
states with the same set of orbitals which makes easier the calculation of the transition
moment. The TS procedure has been applied for the Mg K edge of MgO, as it will be
addressed in Chapter 4, giving quite different results from the GS; however, in the theoretical
model employed for the present thesis, relaxation effects have been opportunely ignored
thanks to the use of the LB94 potential, which gives good results compared to the
experimental spectra, probablybecause ofits strongly attractive nature (see Chapter 2.5.1).
2.2. TDDFT: STANDART METHOD AND EXTENTION TO THE CORE
EXCITATION TREATMENT
DFT furnishes a rigorous electronic structure description only for the GS of a given system,
even if a great development is in progress to confer more formai validation to a DFT
treatment of excited states [2.7-8]. Therefore, when dealing with electronic transitions, the
most accurate theoretical approach has proven to be the Time-Dependent Density Functional
Theory (TDDFT); in particular, the application of the TDDFT method to the calculation of
electronic excitations and its implementation in the ADF code is by now well-consolidated
and largely described in the literature [2.9-10], so the main goal of this discussion is an
19
overview of its fundamentals and a deeper insight into the TDDFT extension to the core
excitation treatment [2.11], which has been recently inserted into the distributed ADF code
(release 2005.01).
The crucial point is the resolution ofthe eigenvalue equation [2.9]:
!!F. = m. 2F. I I I (2.14)
where the eigenvalues m? are the squared excitation energies, while the oscillator strengths
(transition intensities) are properly extracted from the eigenvectors Fi. The n matrix, defined
within the lh-1 p space, is a four-index matrix of elements niacr,jb•, in which the indexes i and j
refer to KS occupi ed orbitals, a and b to KS virtual ( unoccupied) orbitals~ cr and T to the spin;
these matrix elements can be expressed in terms of the KS eigenvalues (e):
(2.15)
where the elements of the coupling matrix K are defined through the KS orbitals ( cp):
(2.16)
being f:Ci: (r, r', ru) the exchange-correlation kemel, which is commonly approximated in the
ALDA (Adiabatic Local Density Approximation) [2.12].
The monoexcited (lh-lp) configuration space is described by occupied-virtual couples of
indexes (like ia or jb ); since core excitations are to a very large extent decoupled from valence
excitations, if the occupied index i is allowed to span only core orbitals, while no limitations
are set for the virtual index a, all and only the core excitations are included. The restriction of
the initial functions to only core orbitals brings a drastic reduction of the n matrix dimensions,
through the suppression of rows and columns referring to non-core orbitals (thus obtaining a
considerable computational save, see Figure 2.1 ). Such an implementation allows the
calculation of excitation energies as the lowest eigenvalues of a given matrix, so that very
efficient iterative procedures for the !! matrix diagonalization (like the Davidson algorithm
[2.13]) can be opportunely employed.
20
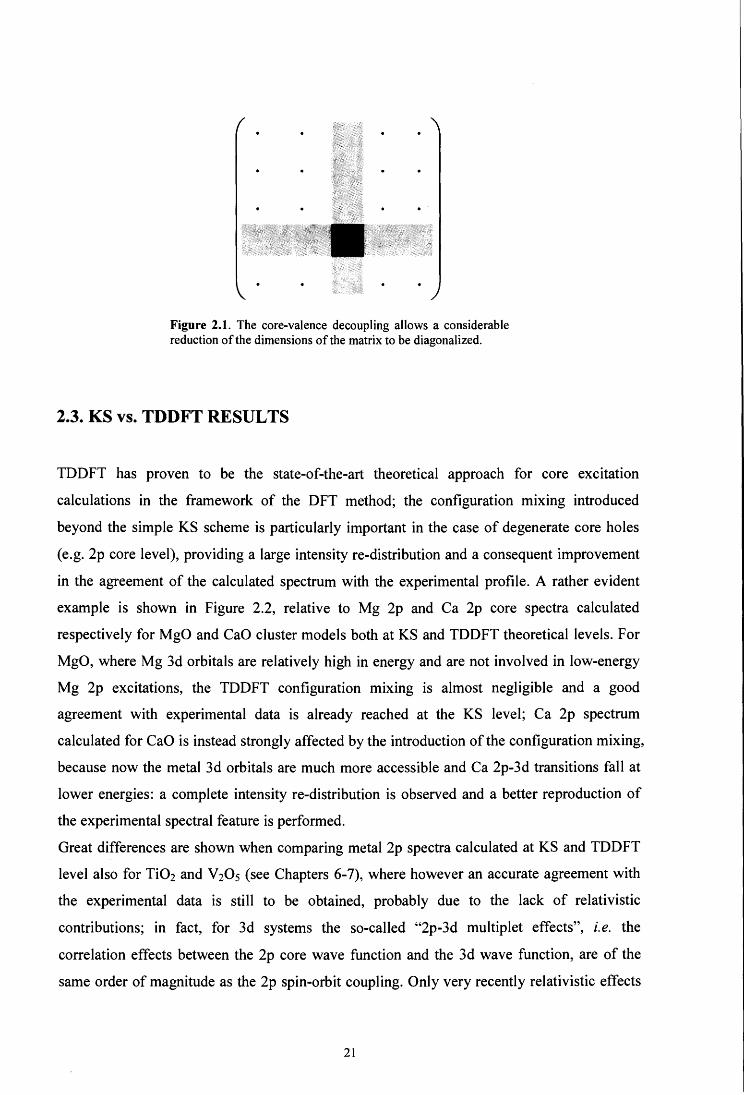
Figure 2.1. The core-valence decoupling allows a considerable reduction of the dimensions of the matrix to be diagonalized.
2.3. KS vs. TDDFT RESUL TS
TDDFT has proven to be the state-of-the-art theoretical approach for core excitation
calculations in the framework of the DFT method; the configuration mixing introduced
beyond the simple KS scheme is particularly important in the case of degenerate core holes
( e.g. 2p core level), providing a large intensity re-distribution and a consequent improvement
in the agreement of the calculated spectrum with the experimental profile. A rather evident
example is shown in Figure 2.2, relative to Mg 2p and Ca 2p core spectra calculated
respectively for MgO and CaO cluster models both at KS and TDDFT theoretical levels. For
MgO, where Mg 3d orbitals are relatively high in energy and are not involved in low-energy
Mg 2p excitations, the TDDFT configuration mixing is almost negligible and a good
agreement with experimental data is already reached at the KS level; Ca 2p spectrum
calculated for CaO is instead strongly affected by the introduction of the configurati on mixing,
because now the metal 3d orbitals are much more accessible and Ca 2p-3d transitions fall at
lower energies: a complete intensity re-distribution is observed and a better reproduction of
the experimental spectral feature is performed.
Great differences are shown when comparing metal 2p spectra calculated at KS and TDDFT
level also for Ti02 and V20 5 (see Chapters 6-7), where however an accurate agreement with
the experimental data is stili to be obtained, probably due to the lack of relativistic
contributions; in fact, for 3d systems the so-called "2p-3d multiplet effects", i.e. the
correlation effects between the 2p core wave function and the 3d wave function, are of the
same order of magnitude as the 2p spin-orbit coupling. Only very recently relativistic effects
21

have been implemented in the ADF code for the core treatment [2.17] and are among the most
important steps to be made in the future for a further improvement of such calculations.
25
20
o ..-- 15
10
25
20
o ..-- 15
10
25
20
o ..-- 15
10
Mg 2p KS
Mg 2p TDDFT
i ~exp.1 I \ ----- exp. 2 /( ~ .--- .....
~ /1 '\\ ~ _,..--/~ :.::-/\ I ·v--..'\..._ ,,r.;:;_-./ I \~~I ""'--::/ _,------
50
345
55 60 65 70
Ca 2p TDDFT ft
1\----exp. L2 I\
\ I \ 11 I\ I\ I I I\ I I I \I I I " \ I \
) ' ...................
350 355 360
calculated excitation energy (eV)
365
Figure 2.2. Metal 2p core excitation spectra calculated for bulk MgO and CaO at both KS and TDDFT levels by means of adequate cluster models. MgO experimental profiles: [2.14] = exp. 1, [2.15] = exp. 2; CaO experimental profile: [2.16]. The Mg 2p spectrum is well reproduced already at the KS level and almost unaffected by the TDDFT approach, while for the Ca 2p spectrum the TDDFT configuration mixing determines relevant modifications and a better matching to experimental data.
KS and TDDFT results are instead very similar each other as regards non-degenerate core
edges, as proven by Metal 1 s and Oxygen 1 s spectra calculated in the present thesis for metal
oxides.
22
Within the present theoretical approach, the comparison of calculated spectra to experimental
features is mainly interested in the correct reproduction not of the absolute energy values but
of the relative energy differences; in other words, the calculated profiles are usually shifted by
opportune values in order to obtain the best match with the experimental data, and similarly
along the oscillator strength (intensity) axis the calculated profile is opportunely amplified or
reduces, obviously maintaining the relative intensities of the various peaks. Convolutions by
Gaussian or Lorentzian functions of suitable FWHM (Full Width at Half Maximum) values
are usually performed in order to fumish a rough reproduction of the natural band width of the
experimental spectrum, even if such a procedure gives only a best exterior look to the
theoretical profile and does not add any "physical" information.
2.4. DOS CALCULATIONS
Density Of States (DOS) calculations are commonly performed in condensed matter physics
and chemistry. The Total DOS (TDOS) N(E) is a well-known concept, useful to describe how
closely packed energy levels are in a certain system; the quantity N(E) dE expresses the
number of electronic levels in the infinitesima! energy range dE between E and E + dE. The
TDOS at energy E is usually written as:
(2.17)
where Si are the one-electron energies. Following this definition, the number of one-electron
states in the energy range [E1,E2] is given by:
E,
NE,,E2 = JN(E)dE (2.18) E,
The 8-functions are usually broadened to make possible a graphical representation. When they
are weighted by proper coefficients describing some properties of the level (j)i at the energy Si,
various DOS typologies are built; Partial Density Of States (PDOS) calculations are
extremely useful when dealing with cluster models simulating solid state systems, as they
provide a pictorial representation of Mulliken populations relative to the cluster virtual
orbitals. In particular, to find out ifa given atomic function Xµ (relative to the absorbing atom)
23

contributes strongly to molecular orbitals at certain energies, the different one-electron levels
may be weighted by using the percentage Xµ character; if the latter is determined by the gross
populations, the Gross Populations Density of States (GPDOS) [2.18] is obtained:
(2.19)
where the index i runs over the one-electron energy levels, Ei is the energy of the i-th level,
L(E- EJ is a proper Lorentzian function (0.5 eV is a commonly used FWHM value) and
GPi,µ is the gross population of the Xµ function in a specific orbi tal density Ieri cn1 2' expressed
in terms of the density matrices Pi:
GP. = ~ P. s = ~ e .e .s 1,µ L...,;v 1,µv µv L...,;v µ1 v1 µv (2.20)
where Sµv is the overlap matrix element between the Xµ and the Xv basis functions, and Cµi are
the coefficients of the Xµ function in the i-th molecular orbital <pi:
(2.21)
In this way, GPi,µ is associated to the fraction of the orbital density belonging to that function
(percentage Xµ character of the molecular orbi tal cpi).
PDOS calculations allow an accurate atomic-like characterization of the virtual orbitals in the
calculated electronic structure; in a single particle approximation it can be assumed that the
core excitations are related to the unoccupied selected atom PDOS that is allowed by the
electric dipole selection rule, as addressed in Chapter 1.1. Figure 2.3 shows the comparison
between KS calculated spectrum and calculated PDOS for the Ba absorbing atom in the Ba 2p
core spectrum of BaO. If one considers simple Ba s- and d-PDOS, a strong overestimation of
the s character of virtual orbitals is obtained with respect to the KS calculated spectrum; but if
"weighted" PDOS profiles are taken into account, where the weight coefficients are the
corresponding 2p ~ ns and 2p ~ nd oscillator strengths calculated for the Ba2+ ion (5d/6s >
200), an excellent matching with the KS spectrum comes to light. A similar behavior is shown
by calculations relative to many other metal oxides.
24

"' o
10
5
Ba (s+d)-PDOS (weighted)
Ba s-PDOS (not weighted)
/ \,
o-1---~=c:::~~b:::l.;:t.tt.::r.LD:.tL.L:JL.L.....J:...l.ll:..:..~!!:::m:i~:a.:.:.t11:.11..L;.w.w.lll.i.Jl..LL.J
5195 5200 5205 5210 5215
calculated excitation energy (eV)
Figure 2.3. Ba 2p core excitation spectra calculated for bulk BaO at the level, compared to PDOS calculated profiles. "Not weighted" PDOS profiles overestimate the s character of virtual orbitals, while "weighted" PDOS profiles match very well the KS spectrum because d and s characters are correctly accounted for (2p ~ nd transitions are much more intense than 2p ~ ns).
PDOS calculations provide a powerful characterization of the electronic structure in terms of
atomic-like contributions to the molecular virtual orbitals; an example of the detail reachable
by such an approach is shown in Figure 2.4, where the different V 3d contributions to the
virtual orbitals of a large cluster simulating bulk V 20 5 characterize to a deep extent the
calculated electronic structure; t2g-like and eg-like characters are easily distinguishable, thus
allowing to obtain a rough estimate of the crystal-field splitting even in a lower-than-
octahedron (C2v) symmetry.
1.5 ~----------------------.
(/) o 0.5 o Il..
-1 o
....... V 3d
2 3 4
calculated orbitai energy (eV) LUMO energy is set equal to O
"' 5
V 3d x2-y2
V 3d z2
V3d xz V3d xy V3d yz
6 7
Figure 2.4. V 3d PDOS calculated fora large V20 5 bulk cluster model. The different components are separated, allowing a detailed characterization of the calculated electronic structure in the conduction band (atomic-like composition of virtual orbitals).
25

2.5. COMPUTATIONAL ASPECTS
2.5.1. Exchange-correlation potentials
When dealing with the simulation of x-ray absorption spectra, a mandatory aspect for
obtaining correct results, especially for high energy valence virtual orbitals and Rydberg
states, is the so-called "Coulombic tail", that is the correct asymptotic behavior of the
potential at large distances ( decay as -1/r for r ---+ oo ). The Local Density Approximations
(LDA) potentials do not possess this property, and the same stands for most Generalized
Gradient Approximations (GGA) ones, except for the LB94 [2.19] and the SAOP [2.20]
potentials. LB94 and SAOP give very similar results [2.11 ], apart from a large shift in the
absolute energy scale suffered by SAOP, which strongly underestimates the excitation
energies with respect to the experimental values; for this reason the LB94 potential has been
preferred in the present approach. The VWN potential [2.21], which constitutes the most
common choice within the LDA scheme, has been tested in a preliminary work on MgO (see
Chapter 4) in the Transition State (TS) approach, in arder to assess the importance of the core
hole relaxation which is not accounted for with the Ground State (GS) configuration adopted
for both LB94 and SAOP potentials; some differences with respect to the LB94 GS
calculations have been observed, principally in the lower energy region (where the VWN-TS
approach predicts higher pre-edge intensities ). However, the inclusion of response effects
through the TDDFT formalism appears decisive for the quality of the results, as discussed
above; furthermore, relaxation effects are somehow actually recovered by the strong attractive
power of the LB94 potential, which is therefore the best choice for the present computational
scheme.
2.5.2. Basis sets
For the simulati on of NEXAFS spectra of solid state metal oxides, relatively poor (DZP) basis
sets ha ve proven to be enough adequate for a proper reproduction of the experimental pro fil es.
Above all, the inclusion of polarization functions has come out to be important, in particular
in presence of transition metals systems, in which d orbitals play a significant role ( even if,
for reasons of computational effort, calculations on V 20 5 have been performed at the simple
DZ level, after testing that no dramatic changes occur with or without the use of polarized
basis sets). The Frozen Core (FC) computational fashion has been extensively used, bringing
26

a considerable computational cost decrease against strictly convergent results: it consists in
keeping the core orbitals of "spectator" (non-absorbing) atoms frozen, treating explicitly the
core orbitals only for the excited atom(s).
For a correct treatment of small molecules, as in the present work S02 (see Chapters 8-9), the
need of diffuse functions is well-known in order to reproduce in particular high-energy
(Rydberg) transitions; as customary in many cases, a rich basis set can be employed only for
the absorbing atom, while the other atoms can be treated at a considerably lower accuracy
level, avoiding at the same time linear dependence problems occurring when too rich sets are
employed in a small spatial extent.
2.6. RELATIVISTIC EFFECTS
Two kinds of relativistic effects are expected to affect calculated excitation energ1es and
transiti on intensi ti es: (a) scalar-relativistic corrections; (b) spin-orbit coupling.
initial state non-relativistic TDDFT scalar-ZORA TDDFT differences
E (eV) f· 102 E (e V) f" 102 E (eV) f (%)
S ls 2438.07 0.581 2446.18 0.575 8.11 -1% 2442.34 0.220 2450.43 0.241 8.09 10% 2443.29 0.211 2451.44 0.228 8.15 8%
O ls 526.75 4.331 527.09 4.367 0.34 1% 531.11 1.821 531.43 2.116 0.32 16% 532.06 1.733 532.44 1.796 0.38 4%
s 2p 164.28 0.162 164.25 0.145 -0.03 -10% 165.13 0.109 165.09 0.101 -0.04 -7% 168.95 2.421 168.86 2.406 -0.09 -1% 169.66 1.066 169.66 1.046 0.00 -2% 170.04 0.999 170.07 0.962 0.03 -4%
Table 2.1. Excitation energies and oscillator strengths calculated for the core-to-valence excitations in S 1 s, S 2p and O 1 s core spectra of S02, at both non-relativistic and scalar-relativisti e TDDFT levels ( see Chapter 8). A rather constant shift of the calculated excitation energies is observed, that is more pronounced for heavier atoms and deeper edges, while oscillator strengths are only slightly affected.
(a) Scalar-relativistic corrections present the general trend of increasing the excitation
energies calculated at non-relativistic level, determining a better agreement with the
experimental values [2.17]; this behavior is particularly enhanced for heavier atoms and
27

deeper core edges (see Table 2.1). However it is to be stressed again that the main interest is
not in the reproduction of absolute experimental energies, but of the relative energy shifts
among the various spectral features, so this effect comes out to be of secondary importance,
especially for low-Z compounds.
(b) As concems the Spin-Orbit (SO) coupling, electronic excitations starting from a non-s
(1=0) core orbital generate doubly-split states. Depending on this spin-orbit splitting value,
calculated core excitation spectra undergo more or less pronounced complications: for
instance, in Ti 2p core spectrum of TiC14 the calculated SO value is more than 5 eV [2.17],
while for S 2p in S02 (see Figure 2.5) it is 1.3 eV, sensibly smaller (see Chapter 8), so the two
spectral pattems, respectively associated to L3 (2p312) and L2 (2p112) edges, strongly overlap
and the consequent assignment of the calculated peaks is rather cumbersome, and further
complicated by a detectable "crystal-field" splitting (0.13 eV) between the 6e112 and the 7e112
spinors originated from the 2p3;2 (L3) core orbital.
Energy
2p . /
------... ·~\~
·· ...
/ / .
·,_
SPIN-ORBIT SPLITTING
6e112
···· ... ____ <::'····'' .. _-_-___ ..... --· __ ·=r:RYSTAL FIELD 2p312 ·-,_ SPLITTING
-~ ..... ,
Figure 2.5. The splitting of S 2p levels in S02 after the introduction of the spin-orbit coupling and of the further crystal-field C2v splitting. The calculated spin-orbit splitting is 1.3 eV and is one order of magnitude greater than the calculated crystal-field splitting (0.13 e V), that is however detectable; this scheme results in a complicated overlap of the single spectral patterns.
The relativistic two-component Zero-Order Regular Approximation (ZORA), included in the
TDDFT formalism, is extensively described by Wang et al. [2.22]; only a short outline of the
28

method is proposed here, underlining the modifications which have been implemented in
order to apply it to core excitations.
The following equation is to be solved (the same shown in formula 2.14):
!lF. = co. zF. I I I
(2.22)
Excitation energies and oscillator strengths are obtained according to the standard TDDFT
method [2.9] as described in Chapter 2.2; the !l matrix elements are given by:
(2.23)
where the indexes i and j refer to occupied spinors, a and b to virtual spinors, a and -r to the
spin, e are molecular spinor energies, and Fia and Pjb are elements of the Fock matrix and of
the density matrix, respectively. The elements of the coupling matrix 8Fia / 8Pjb are calculated
as exposed in [2.22], while eigenvalues and eigenvectors of the !l matrix are obtained by
employing the Davidson iterative algorithm [2.13], provided that an effective core-valence
decoupling is still valid, as described in Chapter 2.2, so that the indexes i and j can span only
the core shell under study and consequently excitation energies are obtained as the lowest
eigenvalues.
A fundamental aspect of the implementation is the full use of molecular symmetry, which
produces an important computational economy if the system is highly symmetric. All the
details of the double-group symmetry implementation with all advantages, such as block
diagonal !l matrix and reduction of numerica! integrals to symmetry-unique part of the
integration grid by virtue of the Wigner-Eckart theorem, are addressed in [2.22].
29
3. CLUSTER MODELING OF SOLID STATE SYSTEMS
3.1. INTRODUCTION
The cluster modeling represent a widely used theoretical approach in arder to study solid state
systems, as they allow an efficient treatment of crystalline solids, characterized by a long-
range arder [3 .1]. This method consists in cutting out, from the crystal infinite lattice of a
solid, a proper set of atoms of adequate size and shape, which can be actually treated as an
isolated molecule simulating the solid, therefore by means of a Molecular Orbitai (MO)
scheme, very familiar to theoretical chemists. The cluster modeling is the most common
alternative way with respect to the typical physicists' periodic calculations, mainly based on
band-structure calculations including the boundary conditions of the wavefunction build by
means of piane waves. In principle, band-structure periodic methods are intrinsically
formulated to describe properly crystal systems, and should therefore constitute the best
computational choice for such calculations; on the contrary, cluster models could be strictly
seen as a mere expedient for extending the use of a MO treatment, conceived for isolated
molecules, also to periodic systems. However, it is to be considered that periodic calculations
are not able to treat core orbitals accurately and therefore avoid this problem by replacing core
orbitals with pseudopotentials; consequently, for the description of core excitations, periodic
methods are not appropriate since they crudely approximate core orbitals, which must be
instead carefully included in the computational scheme. Furthermore, as largely stressed in
the previous chapters, x-ray absorption is a strongly localized phenomenon, so an adequate
cluster modeling can provide a detailed simulation of XAS spectra because it is particularly
suitable for the description of a relatively small environment of the absorbing atom, being
moreover extremely flexible for the simulation of both bulk and surface properties (provided
that clusters of the correct shape are built).
The main drawbacks of the cluster model approach are the treatment of boundary effects, due
to atoms at faces, edges and comers with incomplete coordination (this aspect will be
addressed to in Chapter 3.2.3 when treating embedding techniques), and the lack of long-
range Coulombic interactions that are not included in the cluster model.
It seems to be quite difficult to outline generai precepts for a correct design of cluster models,
since such an approach depends largely on the properties of interest in the specific system
30
under analysis; nevertheless, as this thesis mainly deals with metal oxides, some generai basic
rules can be drawn, which one should follow when designing cluster models with this purpose.
3.2. CLUSTER MODELING OF METAL OXIDES
3.2.1. Cutting out clusters
The first important aspect is how to cut the most adeguate set of atoms out of the infinite
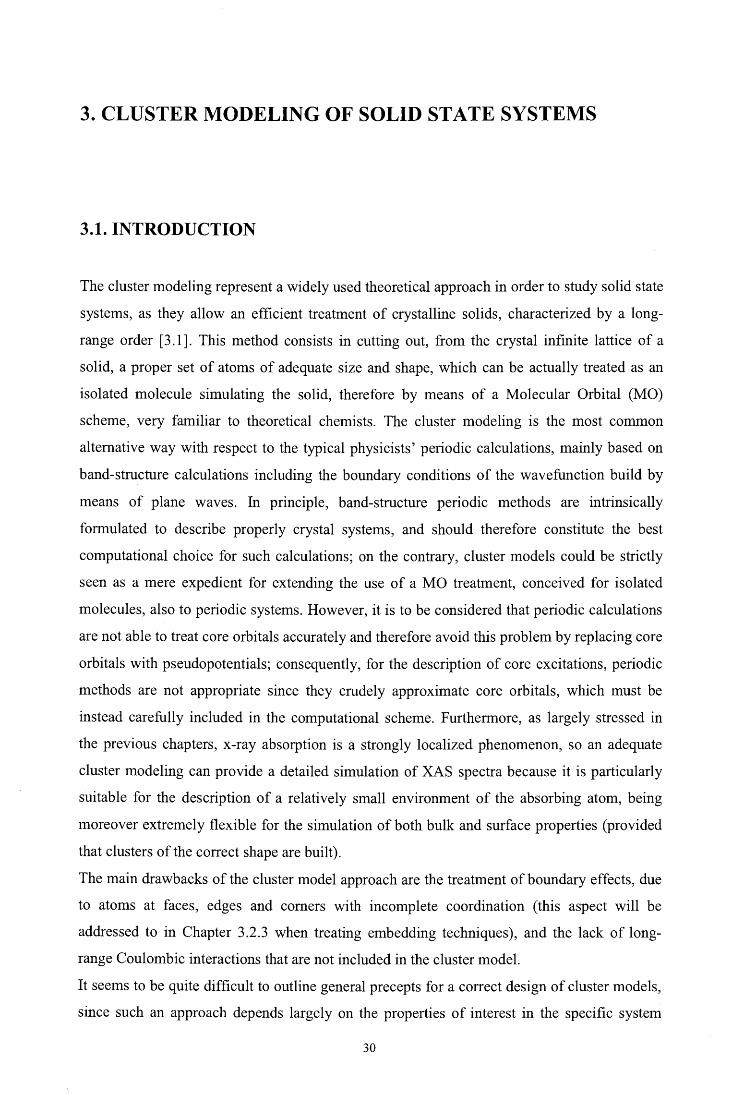
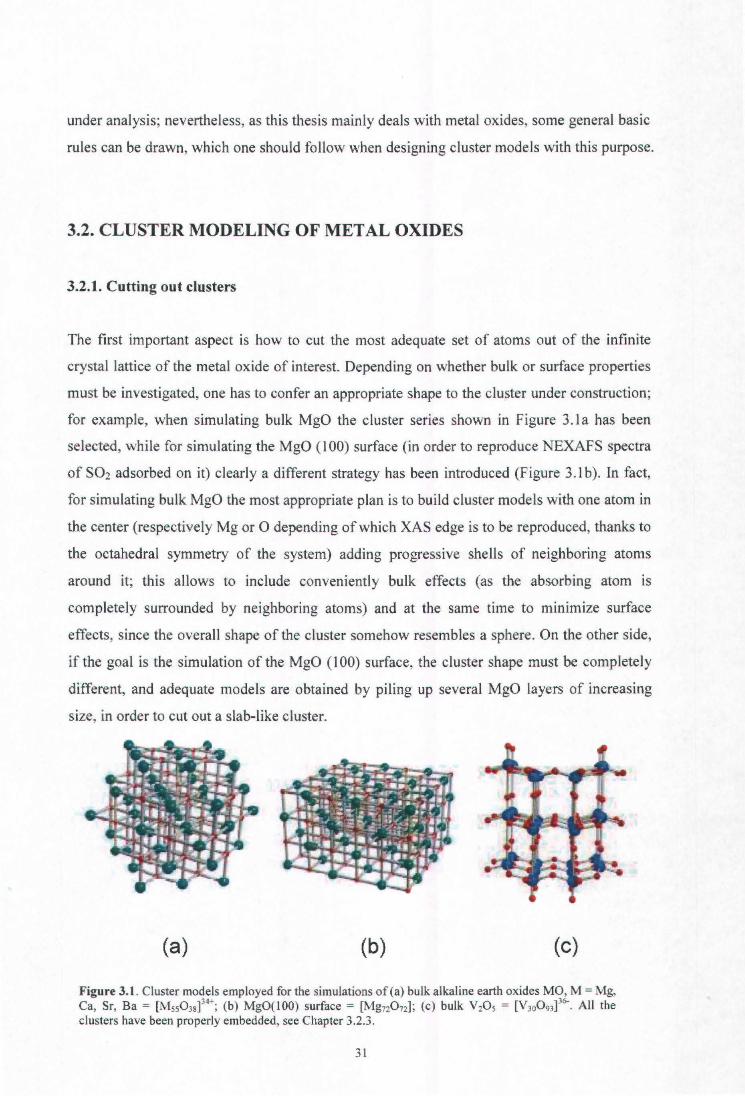
crystal lattice of the metal oxide of interest. Depending on whether bulk or surface properties
must be investigated, one has to confer an appropriate shape to the cluster under construction;
for example, when simulating bulk MgO the cluster series shown in Figure 3.1 a has been
selected, while for simulating the MgO (100) surface (in order to reproduce NEXAFS spectra
of S02 adsorbed on it) clearly a different strategy has been introduced (Figure 3. l b). In fact,
for simulating bulk MgO the most appropriate pian is to build cluster models with one atom in
the center (respectively Mg or O depending of which XAS edge is to be reproduced, thanks to
the octahedral symmetry of the system) adding progressive shells of neighboring atoms
around it; this allows to include conveniently bulk effects (as the absorbing atom is
completely surrounded by neighboring atoms) and at the same time to minimize surface
effects, since the overall shape of the cluster somehow resembles a sphere. On the other side,
if the goal is the simulation of the MgO (100) surface, the cluster shape must be completely
different, and adequate models are obtained by piling up severa! MgO layers of increasing
size, in order to cut out a slab-like cluster.
(a) (b) (e)
Figure 3.1 . Cluster models employed for the simulations of (a) bulk alkaline earth oxides MO, M =Mg, Ca, Sr, Ba = [M550 38] 34+; (b) MgO(lOO) surface = [Mg720 72] ; (e) bulk V 20 5 = [V300 93]
36-. Ali the
clusters have been properly embedded, see Chapter 3.2.3.
31

The cluster design however must take into account the intrinsic shape of the crystal lattice in
terms of its spatial symmetry; for example, in the case of V20s one cannot ignore that its
crystal structure is formed by altemating layers containing V and three kinds of O atoms
(vanadyl, chain, bridge oxygens), spatially arranged to form distorted pyramids sharing edges
and comers; it is much more straightforward, for such a crystal lattice, to describe surface
than bulk properties, so in order to design bulk clusters with minimized surface effects at least
a three-layer cluster (Figure 3.lc) has to be chosen, thus increasing considerably the cluster
size and consequently the computational cost; a "concentric" cluster growth, similar to that
discussed above for bulk MgO, with an incorrect cut of V=O bonds (that must be absolutely
avoided) would bring to completely wrong results.
Xu et al. [3.2] outline three generai principles which cluster models should follow:
the stoichiometric principle: cluster models should be preferred which obey the
stoichiometric ratios of the systems to be mode led;
the coordination principle: the average coordination number of the cluster atoms
should be as close as possible to the effective coordination number of the real system
atoms;
the neutrality principle: it is the most important rule, stating that neutra! clusters
should be preferred to charged clusters because unrealistic electronic effects are
introduced by using non-neutral clusters (for example, a negative-charge model would
possess too enhanced donor properties, while a positive-charge one would present too
much acceptor power). Being the model made up of cluster and surroundings, the
overall neutrality may be accomplished with both neutra! cluster and surroundings or
with charged cluster and opposite-charged surroundings; the former choice is expected
to be better than the latter, for severa! reasons: minimization of the cluster-
surroundings interactions, difficulties in fixing the correct number of electrons for an
artificially charged cluster, intrinsic impossibility of charged clusters to fulfill the
stoichiometric principle.
3.2.2. Cluster size convergence
Cluster model studies must usually involve preliminary convergence tests: a series of clusters
of increasing size must be tested in order to choose the correct "target" for which to perform
the final calculations, since generally speaking the cluster behavior tends to the infinite
(periodic) system behavior as the cluster size increases (provided that a correct cluster design
32
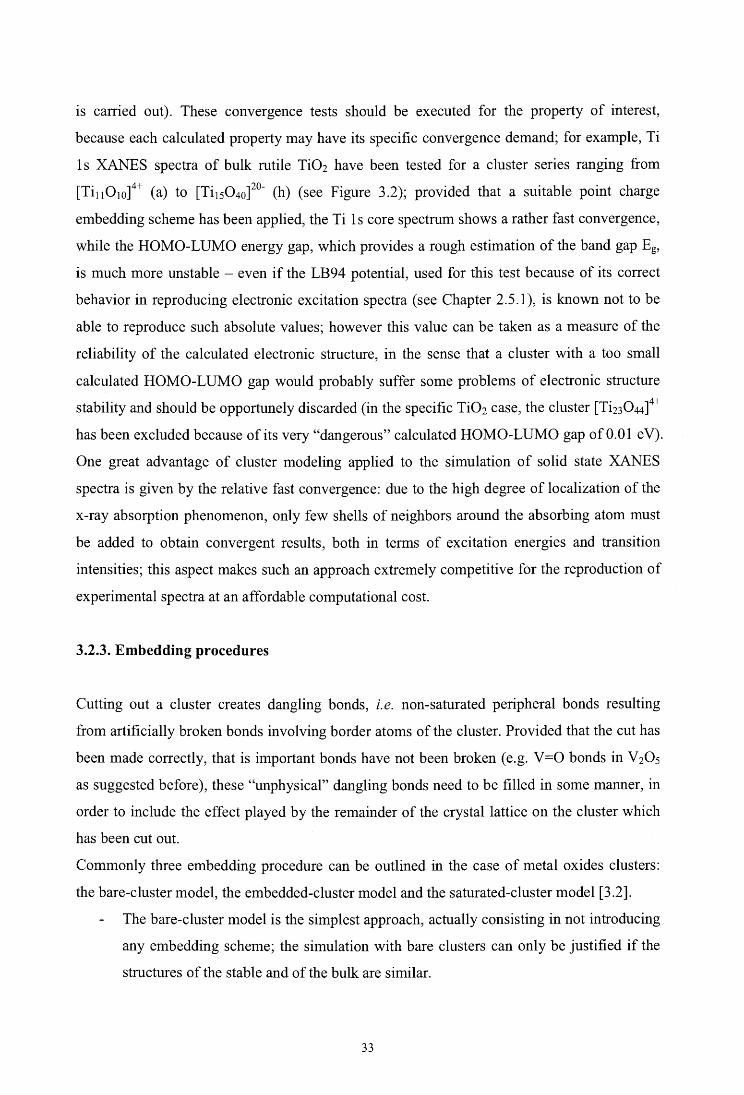
is carried out). These convergence tests should be executed for the property of interest,
because each calculated property may have its specific convergence demand; for example, Ti
1 s XANES spectra of bulk rutile Ti02 have been tested for a cluster series ranging from
[Th 10 10]4+ (a) to [Th50 40]20- (h) (see Figure 3.2); provided that a suitable point charge
embedding scheme has been applied, the Ti 1 s core spectrum shows a rather fast convergence,
while the HOMO-LUMO energy gap, which provides a rough estimation of the band gap Eg,
is much more unstable - even if the LB94 potential, used for this test because of its correct
behavior in reproducing electronic excitation spectra (see Chapter 2.5.1), is known not to be
able to reproduce such absolute values; however this value can be taken as a measure of the
reliability of the calculated electronic structure, in the sense that a cluster with a too small
calculated HOMO-LUMO gap would probably suffer some problems of electronic structure
stability and should be opportunely discarded (in the specific Ti02 case, the cluster [Ti23044]4+
has been excluded because of its very "dangerous" calculated HOMO-LUMO gap of 0.01 e V).
One great advantage of cluster modeling applied to the simulation of solid state XANES
spectra is given by the relative fast convergence: due to the high degree of localization of the
x-ray absorption phenomenon, only few shells of neighbors around the absorbing atom must
be added to obtain convergent results, both in terms of excitation energies and transition
intensities; this aspect makes such an approach extremely competitive for the reproduction of
experimental spectra at an affordable computational cost.
3.2.3. Embedding procedures
Cutting out a cluster creates dangling bonds, i.e. non-saturated peripheral bonds resulting
from artificially broken bonds involving border atoms of the cluster. Provided that the cut has
been made correctly, that is important bonds have not been broken (e.g. V=O bonds in V20s
as suggested before ), these "unphysical" dangling bonds need to be filled in some manner, in
order to include the effect played by the remainder of the crystal lattice on the cluster which
has been cut out.
Commonly three embedding procedure can be outlined in the case of metal oxides clusters:
the bare-cluster model, the embedded-cluster model and the saturated-cluster model [3.2].
The bare-cluster model is the simplest approach, actually consisting in not introducing
any embedding scheme; the simulation with bare clusters can only be justified if the
structures of the stable and of the bulk are similar.
33

calculated t:.E 20 HOMO-LU MO 15 (eV)
ò a [Ti, ,0 rn124+ .....- 10 0.26 .;_
'lf • 20
15 b [Ti1P14]16+ ..,.
1.91 o .....- 10 .;_
20
15 ò 1.23 10 .;_
20
15 ò
10 1.28 .;_
20
15 ò .....- 10 1.64 .;_
20
15 f [Ti150d4-..,. o
10 1.68 .;_
5
20
15 g [Ti1P35]12-..,. o 1.59 10 .;_
5
15 ..,. o 1.11 .....- 10 .;_
4880 4890 4900 4910 4920 4930
calculated excitation energy (eV)
Figure 3.2. Ti 1 s core excitation spectra calculated at the TDDFT level for a cluster series ranging from [Tiu010]
24+ to [Ti150 40]
20-. The calculated spectra show a faster convergence than the calculated
HOMO-LUMO gap values, which give a qualitative measure of the reliability of the cluster calculation.
In the embedded-cluster model, high-level methods are applied to the cluster while its
surroundings are treated at a lower level; various sophisticated schemes have been
developed, among which: the QM/MM (Quantum Mechanics I Molecular Mechanics)
scheme [3.4-5], where the surroundings are described by means of MM; the AIMP
(Ab Initio Model Potential) scheme [3.6-8], where the quantum effects from the
crystalline environment are approximated by spherical model potentials; however the
most common embedding technique for metal o xi de clusters is the use of Point Charge
34

(PC) arrays, placed at the lattice positions of the bulk solid [3. 9-1 O] in order to
reproduce the Madelung potential acting on the bare cluster due to the rest of the
crystal lattice.
In the saturated-cluster model the dangling bonds are saturated by hydrogens, pseudo-
atoms [3.11] or, less commonly, by other kind of atoms in order to fill the free
valencies at those sites of the bare cluster which are not supposed to represent the real
solid (typically, boundary peripheral cluster atoms). Clearly, the introduction of new
"unphysical" atoms creates new molecular orbitals affecting the calculated electronic
structure, however if the cluster size if large enough, such artificial effects should tum
out to be negligible, since the x-ray absorption is strongly localized and involves a
relatively small environment around the excited atom.
It is generally accepted that a PC embedding scheme is more adequate for cluster models
simulating highly ionie oxides, while saturated clusters should be preferred in the case of
covalent oxides. This generai statement has been followed in the present thesis, so for
alkaline-earth oxides and Ti02 the embedding scheme has been adopted ( even if probably
Ti02 represents a delicate border-line situation), while for simulating V205 hydrogen-
saturated clusters have been used. In particular, an optimized PC scheme [3.9] has been
adopted to embed the cluster [Mg550 38]34+; the whole model results to be neutra!, being the
cluster charge +34 and the sum of the 250 optimized PCs equal to -34. On the other side, the
cluster [V 300 93]36- for the simulati on of bulk V 20 5 has been saturated by H atoms: all the
dangling bonds have been filled in order to guarantee the total cluster neutrality, namely 12
oxygens per V 20 5 layer.
Clearly, PC embedding arrays must comply with the global shape of the cluster and with the
geometry of the system under examination: for example, PCs surrounding MgO bulk clusters
are placed all around the cluster in a spherical-like displacement, while in the case of MgO
(100) surface clusters PCs are placed at both cluster sides and below it, but the regi on above
the surface is left embedding-free to allow a proper adsorption modeling.
The importance of the PC embedding is assessed in the case of MgO, when comparing the
calculated electronic structure for the smallest cluster [Mg06] 10
- with an increasing PC
number; in Figure 3.3 the calculated HOMO-LUMO gap is reported towards the PC number,
showing that only with more than 100 PCs the calculated value is practically constant, so that
the calculated electronic structure tums out to be somehow reliable.
35
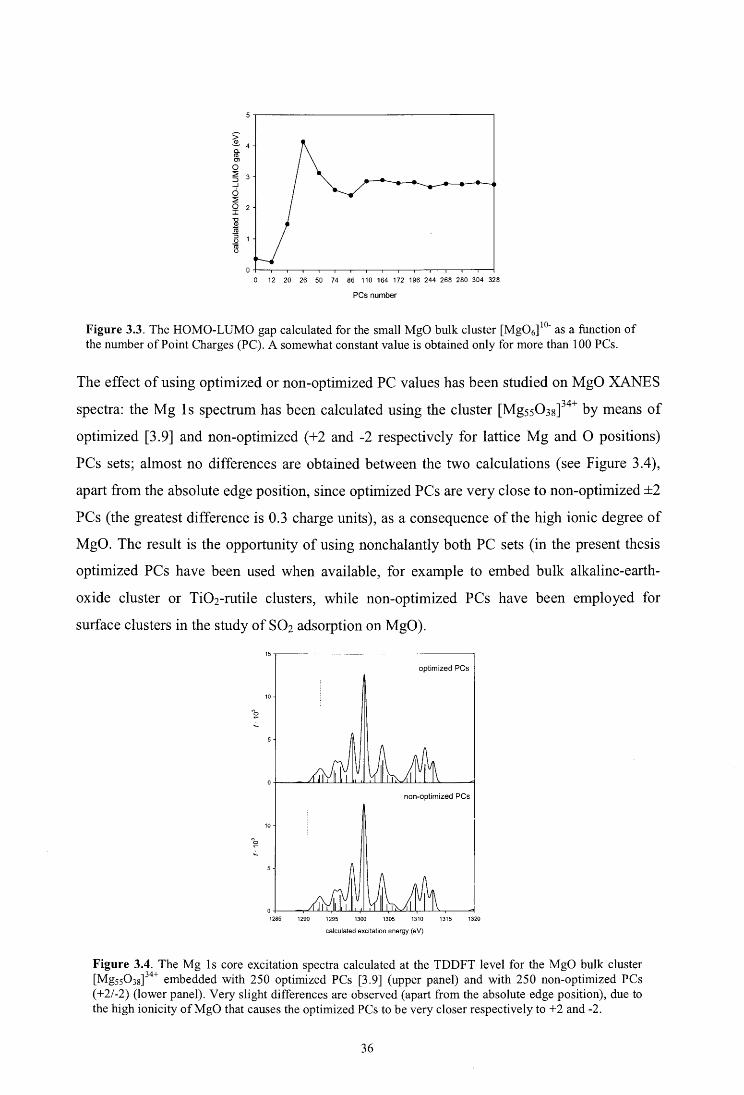
o 12 20 26 50 74 86 110 164 172 196 244 268 280 304 328
PCs number
Figure 3.3. The HOMO-LUMO gap calculated for the small MgO bulk cluster [Mg06]10
- as a function of the number of Point Charges (PC). A somewhat constant value is obtained only for more than 100 PCs.
The effect of using optimized or non-optimized PC values has been studi ed on MgO XANES
spectra: the Mg 1 s spectrum has been calculated using the cluster [Mgss03s]34+ by means of
optimized [3.9] and non-optimized (+2 and -2 respectively for lattice Mg and O positions)
PCs sets; almost no differences are obtained between the two calculations (see Figure 3.4),
apart from the absolute edge position, since optimized PCs are very close to non-optimized ±2
PCs (the greatest difference is 0.3 charge units), as a consequence of the high ionie degree of
MgO. The result is the opportunity of using nonchalantly both PC sets (in the present thesis
optimized PCs have been used when available, for example to embed bulk alkaline-earth-
oxide cluster or TiOrrutile clusters, while non-optimized PCs have been employed for
surface clusters in the study of S02 adsorption on MgO).
15~------------------,
optimized PCs
10
non-optimized PCs
10
1285 1290 1295 1300 1305 1310 1315 1320
calculated excitation energy (eV)
Figure 3.4. The Mg ls core excitation spectra calculated at the TDDFT level for the MgO bulk cluster [Mgs50 38]
34+ embedded with 250 optimized PCs [3.9] (upper panel) and with 250 non-optimized PCs
(+2/-2) (lower panel). Very slight differences are observed (apart from the absolute edge position), due to the high ionicity ofMgO that causes the optimized PCs to be very closer respectively to +2 and -2.
36
4. CORE EXCITATIONS IN MgO: A DFT STUDY WITH
CLUSTER MODELS
Stener M., Fronzoni G., De Francesco R.., Chem. Phys. 309, 49 (2005).
The time dependent density functional theory has been employed to calculate the absorption
spectra relative to core excitation of Mg ls, Mg 2p and O ls orbitals of solid MgO. Cluster
models of various size and shape are considered, embedded within an array of point charges
to simulate the Madelung potential. Comparison with experimental data and previous
theoretical calculations allows a precise assessment of the performances of the present method,
which is competitive and promising for further application to more complex systems, like
transition metal oxides.
4.1. INTRODUCTION
In recent years, the electron microscopy techniques and the related devices have experienced
a very fast development, due to their capability to study solid samples at the nanoscale level.
In particular, the integration between an electron-energy-loss spectrometer (EELS) and a
transmission electron microscope (TEM) has proved a very powerful equipment to study
condensed matter not only at its geometrica! structural level but even extracting information
on the electronic structure of the probed system [ 4.1]. In particular, EELS pro bes the
electronic levels which lie near the ionization limit of a specific core state, and in this energy
region, which is in practice 20-30 e V wide, are present interesting spectral structures. These
are generated by the promotion of the core electron to unoccupied-virtual electronic. states.
The intensity of such observed spectrum is related to the electric dipole transition moment
between the initial core state and the final virtual state. Since the initial core orbital is well
localized due to its conserved atomic nature, it follows that observed spectral features can be
directly ascribed to that specific atomic site: the intensity maps the dipole-allowed atomic site
component of the virtual states.
The increasing interest and availability of EELS experimental data of condensed systems has
renewed the attention on the theoretical models suited to reproduce the measurement, in arder
37

to rationalize the experimental finding and create a more solid connection between the
electronic structure of the sample and the observed spectral pattern. Though early attempts to
reproduce EELS spectra by first principles calculations are rather dated [ 4.2], up to now a
standard and robust generai method has not yet emerged clearly, since it remains very difficult
to reproduce the spectra at a quantitative level [ 4.3-1 O].
In this work we apply for the first time the time dependent density functional theory (TDDFT)
for the calculations of excitation spectra of core electrons, employing a series of cluster
models to mimic the bulk of MgO. W e have selected MgO because it is one of the simplest
and most studied solid state systems (both theoretically [ 4.11-18] and experimentally [ 4.19-
23]) so it is particularly suited to assess the performances of the method. On the other hand,
TDDFT is an interesting method since it formally includes coupling between one-electron
excited configurations, and therefore it should be able to overcome to the limitations of
simpler methods based on independent particles approximation, like for example the Hartree-
F ock (HF) approximation and conventional Kohn-Sham (KS) methods within the density
functional theory (DFT). Conventional TDDFT is usually employed to describe only valence
electron excitations, however a scheme to extend the applicability of TDDFT to core electron
excitations has been recently proposed [4.24]. This method is formulated entirely within
TDDFT, while similar previous approaches have been formulated in terms of the
configuration interaction (CI) method at lh-1 p level employing KS orbitals [ 4.25].
It is now well understood that such effects beyond the independent particle approximation
which may induce relevant configurational mixing, in certain instances are mandatory to be
included in the calculations for a realistic theoretical description of the spectrum. A well
known case pertains the Ti 2p core excitation of TiC14, which can be properly described only
including single excitation at CI lh-lp level [4.26] and at TDDFT level [4.24], while single
channel HF and KS calculations give completely unrealistic spectra. This breakdown of the
independent particle approach has been easily rationalized in terms of coupling between
different configurations, which arise when the core state is degenerate like in 2p orbitals and
also degenerate final atomic nd contributions are accessible, in a similar fashion to atomic
multiplet terms which are described by a multiplicity of excited configurations. Therefore it is
expected that the present method would be completely general and particularly competitive to
study more complex transition metal materials.
Finally it is worth noting that, although the natural choice for the description of a solid would
be in terms of crystal Bloch functions with proper treatment of periodic boundary conditions,
there is a series of reasons which suggest that a finite size cluster model would be more suited
38

to study core excitations. In fact, a core excitation is well localized on a specific atomic site,
so it is reasonable to assume that the description of a limited region would be sufficient to
describe it accurately; on the other hand periodic calculations based on plane-waves
expansions do not include core orbitals (in order to improve convergence by mean of
pseudopotentials) and therefore cannot deal with multiplet effects which may be treated at the
TDDFT level. In this work we have addressed both basis set requirements and cluster model
best choices in order to suggest a general strategy for the design of TDDFT calculations of
core electron excitations in bulk materials, supported by comparison with experimental data
and previous calculations on solid MgO.
4.2. THEORETICAL METHOD
The TDDFT approach for electron excitations and its implementation in the ADF code has
been described in detail in the literature [ 4.27,28], so here we just recall the salient steps and
describe the new features. The genera! problem is cast in the following eigenvalue equation:
!lF. = co. 2F. I I l (4.1)
where !l is a four indexes matrix with elements Qiacr,jbt, the indexes consist of products of
occupied-virtual (ia and jb) KS orbitals, while cr and -r refer to the spin variable. The
eigenvalues correspond to squared excitation energies while the oscillator strengths are
extracted from the eigenvectors Fi [27]. The !l-matrix elements can be expressed in terms of
KS eigenvalues (e) and the coupling matrix K:
(4.2)
The elements of the coupling matrix K are given by:
(4.3)
39
where cp are the KS orbitals and f:C" (r,f', ro) is the exchange-correlation kemel. In this work
the kemel is approximated according to the adiabatic local density approximation (ALDA)
[ 4.29].
The space spanned by the solutions of the eigenvalue Eq. ( 4.1) corresponds to the lh-1 p
excited configurations, so it is possible to approximate this space operating a selection over
the configurations, keeping only those necessary for an accurate description of the
phenomenon, as it is customary in ab initio CI calculations. So, in practice, according to the
method in [ 4.24] the indexes which span the occupied orbitals space (i and j) are limited to
run only over the core shell.
For comparison, also KS results have been considered in preliminary test calculations. In the
KS scheme the oscillator strength is calculated directly as the dipole transition moments
between the KS one-electron eigenfunctions, and the excitation energies as eigenvalue
differences.
4.3. COMPUTATIONAL DETAILS
The calculations have been performed with the ADF program (version 2003.01) [4.30,31]
modified accordingly to the previous section. Basis sets of various size consisting of STO
functions have been employed with the aim to assess with confidence the requirements for
core excitations TDDFT calculations and numerica! stability. In particular we have considered,
in addition to standard DZP (Mg: 6s3pld, O: 4s2pld) and TZP (Mg: 7s4pld, O: 5s3pld) all
electron basis and fit sets, the even tempered optimized basis and fit sets of the ADF database,
which are designated with the following acronyms: QZ3P (Mg: 9s7p2dlf, O: 6s4p2dlf),
QZ3P- lDIF (Mg: 10s8p3d2f, O: 7s5p3d2f). Particular care has been devoted to the choice of
the best cluster model to mimic bulk spectra, for such purpose a cluster series of increasing
size is considered, and the convergence to the bulk limit is considered in terms of both cluster
size and shape.
The LB94 [ 4.32] exchange-correlation potential with the ground state (GS) electron
configuration has been employed. It has been chosen because of its correct asymptotic
behavior, which is a necessary condition for a good description of virtual orbitals.
For comparison we have also tested the VWN potential [ 4.33] (which has not the correct
asymptotic behavior) but with the transition state (TS) configuration, which consists to
remove half an electron from the core orbi tal, and it is helpful to assess the importance of core
40

hole relaxation, which is not accounted for with GS configurations. In the VWN-TS case the
calculations are performed only at KS level.
The exchange-correlation kemel is approximated within the usual ALDA scheme, and only
excitations with singlet spin symmetry have been considered, since all the clusters have a
closed shell electronic structure.
The cluster models are built extracting a proper set of atoms from the MgO experimental
cubie lattice of NaCl-type, with the experimental Mg-O distance of 2.106 A. The procedure
to build the clusters is described in detail in Section 4.4.1.
The calculated spectra have been convoluted with gaussian functions with a FWHM of 1.0 e V,
in arder to facilitate the comparison with the experiments.
4.4. RESUL TS AND DISCUSSI ON
The main goal of the present work is to suggest a general strategy to design properly a
calculation at TDDFT level for the core excitations of bulk materials employing cluster
models of finite size. Therefore, for sake of clarity, we have organized this section starting
with the problem of cluster design in terms of size and shape, the convergence of the optical
spectra to the bulk limit and basis set requirements, then the results obtained with the
proposed method are compared with the experimental results and other theoretical
calculations.
4.4.1. Cluster design
The clusters have been built with the following rule: the central atom which lies on the origin
is the atom which is excited, successive shells of Mg and O atoms are then added keeping an
octahedral symmetry for computational economy. The cluster charge is chosen assuming a
formal ionie configuration, so in general the charge of the cluster MgmOn will be 2(m-n). In
arder to better simulate the bulk situation, the clusters have been embedded within an array of
point charges (PCs ), which are optimized for the clusters which have the Mg atom in the
center [4.34]. For clusters centered on the O atom, the embedding PCs are not optimized, so
they are set to + 2 and -2 for Mg and O atom positions, respectively.
PCs are mandatory to obtain the proper closed shell electronic structure, in fact clusters in
absence of embedding in general give rise to open shells structures, which are not suitable to
41
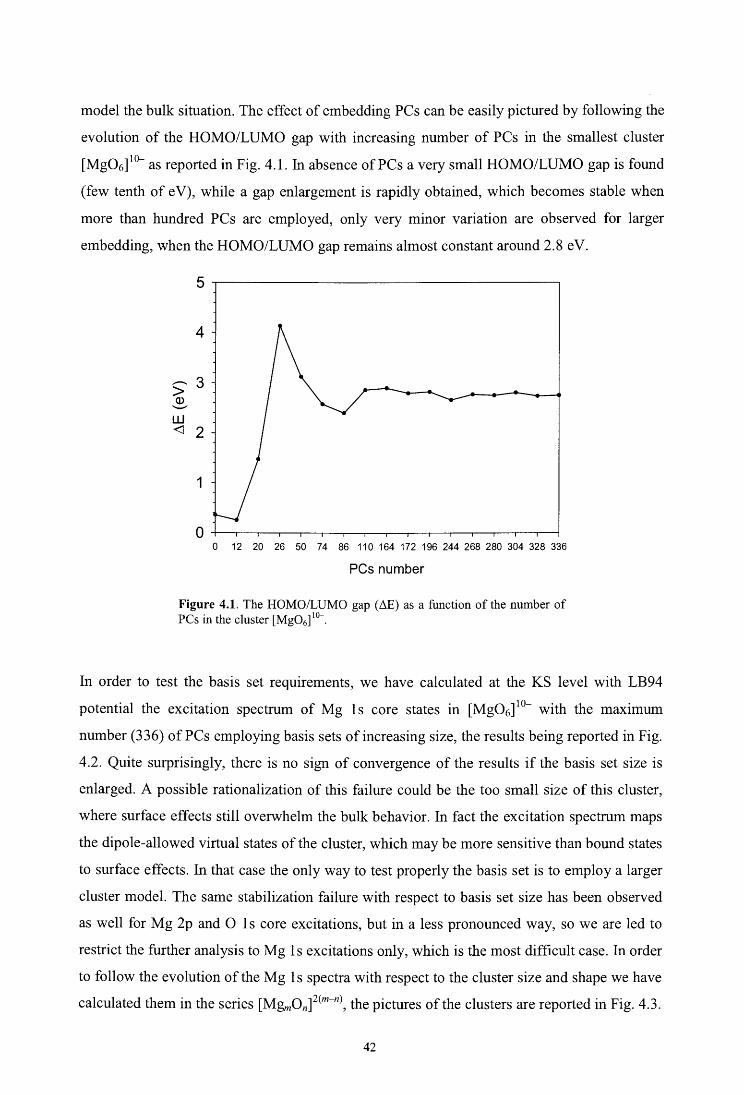
model the bulk situation. The effect of embedding PCs can be easily pictured by following the
evolution of the HOMO/LUMO gap with increasing number of PCs in the smallest cluster
[Mg06]10- as reported in Fig. 4.1. In absence of PCs a very small HOMO/LUMO gap is found
(few tenth of e V), while a gap enlargement is rapidly obtained, which becomes stable when
more than hundred PCs are employed, only very minor variation are observed for larger
embedding, when the HOMO/LUMO gap remains almost constant around 2.8 eV.
4
-3 > Q) ..__.... w <l 2
1
o 12 20 26 50 74 86 110 164 172 196 244 268 280 304 328 336
PCs number
Figure 4.1. The HOMO/LUMO gap (~E) as a function of the number of PCs in the cluster [Mg06]
10-.
In arder to test the basis set requirements, we have calculated at the KS level with LB94
potential the excitation spectrum of Mg 1 s core states in [Mg06] 10
- with the maximum
number (336) of PCs employing basis sets of increasing size, the results being reported in Fig.
4.2. Quite surprisingly, there is no sign of convergence of the results if the basis set size is
enlarged. A possible rationalization of this failure could be the too small size of this cluster,
where surface effects still overwhelm the bulk behavior. In fact the excitation spectrum maps
the dipole-allowed virtual states of the cluster, which may be more sensitive than bound states
to surface effects. In that case the only way to test properly the basis set is to employ a larger
cluster model. The same stabilization failure with respect to basis set size has been observed
as well for Mg 2p and O 1 s core excitations, but in a less pronounced way, so we are led to
restrict the further analysis to Mg 1 s excitations only, which is the most difficult case. In arder
to follow the evolution of the Mg 1 s spectra with respect to the cluster size and shape we ha ve
calculated them in the series [Mgm0n] 2(m-n), the pictures of the clusters are reported in Fig. 4.3.
42
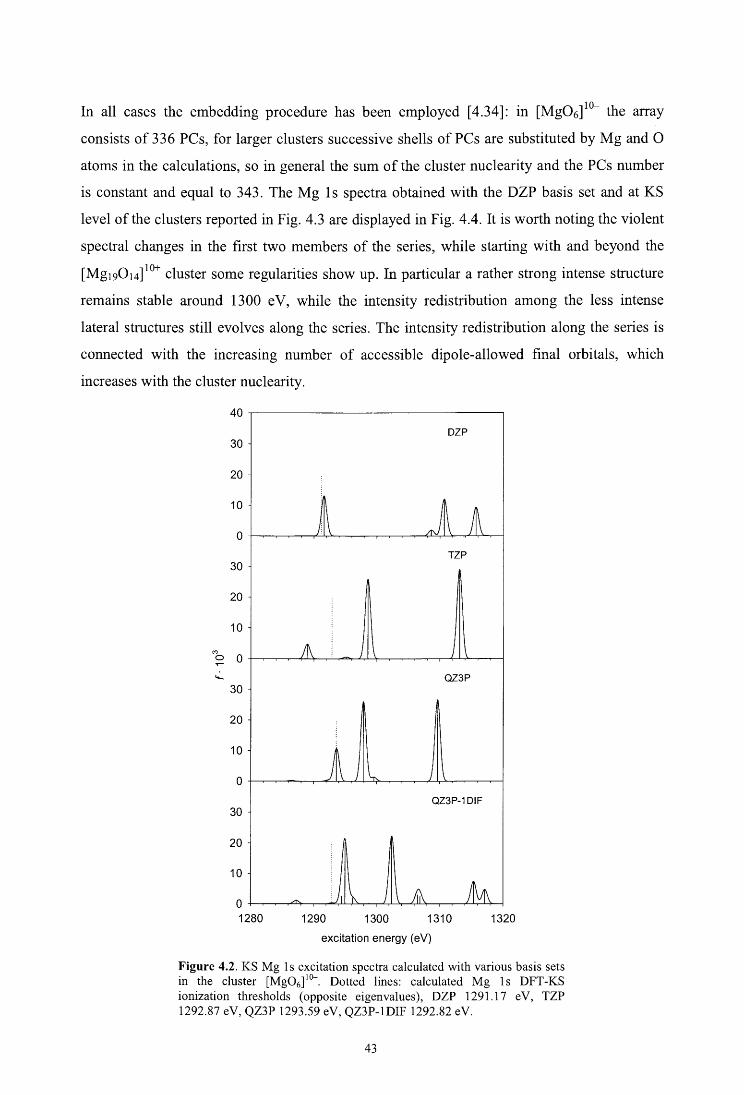
In all cases the embedding procedure has been employed [4.34]: in [Mg06] 10- the array
consists of 336 PCs, for larger clusters successive shells of PCs are substituted by Mg and O
atoms in the calculations, so in generai the sum of the cluster nuclearity and the PCs number
is constant and equal to 343. The Mg ls spectra obtained with the DZP basis set and at KS
level of the clusters reported in Fig. 4.3 are displayed in Fig. 4.4. It is worth noting the violent
spectral changes in the first two members of the series, while starting with and beyond the
[Mg190 14] io+ cluster some regularities show up. In particular a rather strong intense structure
remains stable around 1300 eV, while the intensity redistribution among the less intense
lateral structures still evolves along the series. The intensity redistribution along the series is
connected with the increasing number of accessible dipole-allowed final orbitals, which
increases with the cluster nuclearity.
DZP 30
20
TZP 30
20
10
30
20
QZ3P-1 DIF 30
20
10
o +-.~-.-<-J+-.---"""-.."-1~~--'-.-L~<,..LJ....>,~~_,L-L,--J--l----l 1280 1290 1300 1310 1320
excitation energy (eV)
Figure 4.2. KS Mg 1 s excitation spectra calculated with various basis sets in the cluster [Mg06]
10-. Dotted lines: calculated Mg ls DFT-KS
ionization thresholds (apposite eigenvalues), DZP 1291.17 eV, TZP 1292.87 eV, QZ3P 1293.59 eV, QZ3P-1DIF 1292.82 eV.
43
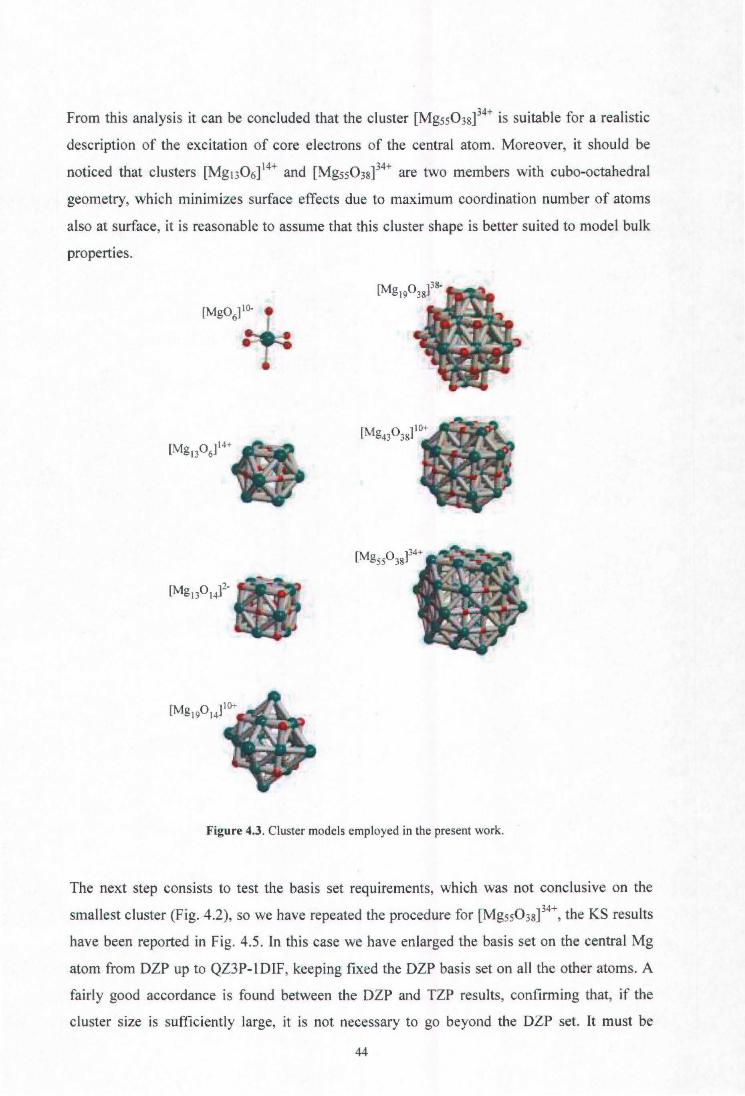
From this analysis it can be concluded that the cluster [Mg550 38] 34+ is suitable for a realistic
description of the excitation of core electrons of the centrai atom. Moreover, it should be
noticed that clusters [Mg130 6] 14+ and [Mg550 38] 34+ are two members with cubo-octahedral
geometry, which minimizes surface effects due to maximum coordination number of atoms
also at surface, it is reasonable to assume that this cluster shape is better suited to model bulk
properties.
[MgOJ 10-
Figure 4.3. Cluster models employed in the present work.
The next step consists to test the basis set requirements, which was not conclusive on the
smallest cluster (Fig. 4.2), so we have repeated the procedure for [Mg550 3s]34+, the KS results
have been reported in Fig. 4.5. In this case we have enlarged the basis set on the centrai Mg
atom from DZP up to QZ3P-1DIF, keeping fixed the DZP basis set on ali the other atoms. A
fairly good accordance is found between the DZP and TZP results, confirming that, if the
cluster size is sufficiently large, it is not necessary to go beyond the DZP set. lt must be
44
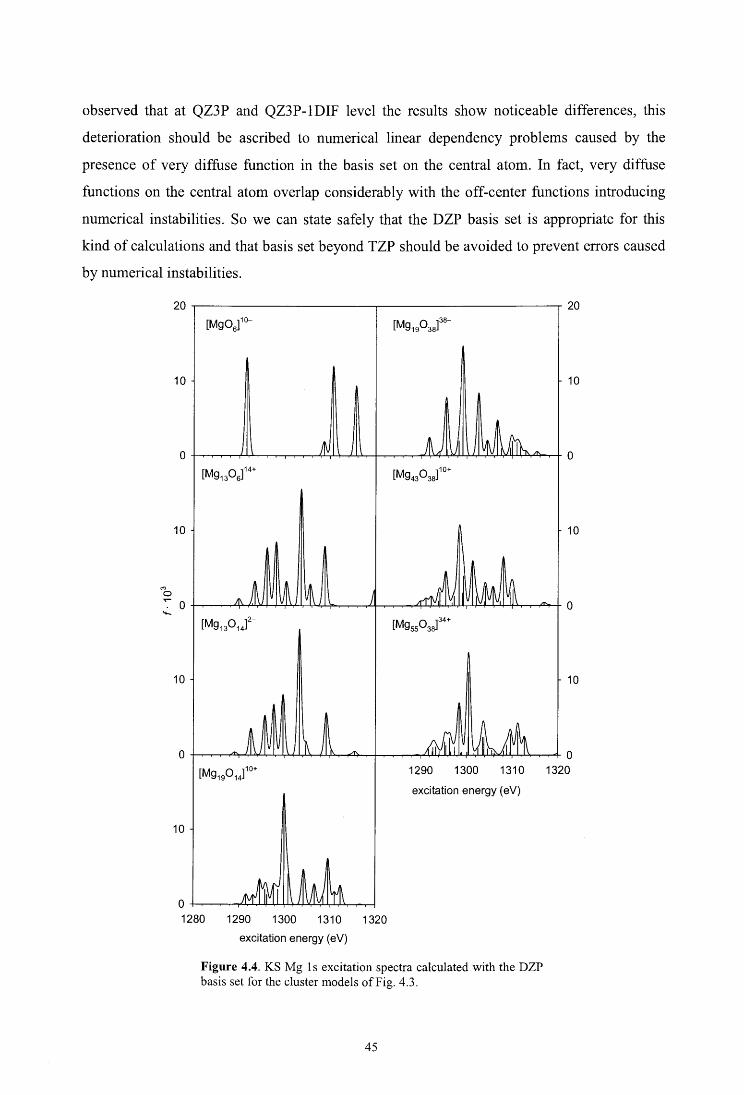
observed that at QZ3P and QZ3P-1DIF level the results show noticeable differences, this
deterioration should be ascribed to numerical linear dependency problems caused by the
presence of very diffuse function in the basis set on the central atom. In fact, very diffuse
functions on the central atom overlap considerably with the off-center functions introducing
numerical instabilities. So we can state safely that the DZP basis set is appropriate for this
kind of calculations and that basis set beyond TZP should be avoided to prevent errors caused
by numerical instabilities.
10 10
10 10
"' o ~o +-r--.--.__,,.....T>-+'..........+__.,,.....,....,.._._..,_,...........,___,~..-L+-~__,......,...-......,.__.,_........,.UL,-Ll-+-+""'+__....--.--.,....,,._o
10 10
o +...,.-....,......,___,....,.,.....,.....,,.._.,_.....,__.,-'+-'-......,,,_+4,._,_,~......+-..,.......,......,......,-,..<-i,.u.+-........... JL/1-1, ............. ~ ............ ,_,,_~ o 1290 1300 1310 1320
excitation energy (eV)
10
o +-r--.--.--.----~~..;,..u,.............,,......_......-1
1280 1290 1300 1310 1320 excitation energy (eV)
Figure 4.4. KS Mg 1 s excitation spectra calculated with the DZP basis set for the cluster models ofFig. 4.3.
45

In conclusion for Mg 1 s and 2p excitations we have employed the Mg centered [Mg550 38]34
+
cluster model with DZP basis set and optimized PCs. On the other hand, to study O 1 s
excitations it is natural to employ the corresponding [Mg380 55]34-, obtained exchanging Mg
and O ions each other in order to have an O atom on the origin. However for this cluster the
values of the optimized PCs are not available, so we have employed the same embedding
procedure but with fixed values of +2 and -2 charges in Mg and O positions. To test the
accuracy of this procedure we have recalculated the [Mg550 38]34+ cluster with non-optimized
charge values, and compared the results obtained with optimized values. The results were in
practice identica!, so we argued that it is not necessary to employ optimized PCs values to
obtain accurate core excitation spectra and this validates the choice of the model employed to
calculate O 1 s excitations.
15 DZP
10
15 TZP/DZP
10
5
"' o o ...:...
15 QZ3P/DZP
10
5
o
15 QZ3P-1 DIF/DZP
10
5
o 1280 1290 1300 1310 1320
excitation energy (eV)
Figure 4.5. KS Mg 1 s excitation spectra calculated with various basis sets in the cluster [Mg550 38]
34+. Dotted lines: calculated Mg 1 s DFT-KS ionization thresholds
(apposite eigenvalues), DZP 1293.29 eV, TZP/DZP 1293.29 eV, QZ3P/DZP 1290.73 eV, QZ3P-1DIF/DZP 1291.30 eV.
46
4.4.2. Mg 1s
The Mg ls excitation is considered in Fig. 4.6: in the upper panel the present theoretical
TDDFT spectrum calculated on the [Mg550 38]34+ cluster is compared with the experiment
[ 4.3], while in the other boxes previous theoretical results are reported as well for comparison.
To discuss the spectrum it is more convenient to consider the relative energy shifts between
the features than the absolute scale, so to facilitate this task we have shifted all the calculated
profiles on the experimental energy scale. The present TDDFT calculation is able to
reproduce correctly the most important spectral feature: in particular the intensity absolute
maximum at 1317 e V is well reproduced by the calculation, as well as the feature at 1315 e V.
The feature at low energy around 1309.5 eV is underestimated in intensity, although in good
agreement in terms of relative energy position, while the calculated structure around 1313 e V
should likely be ascribed to the shoulder observed just above the first experimental peak, but
shifted a couple of e Vs to higher energy. In the high energy part of the experimental spectrum
a very smooth maximum is found at 1330 eV, whose position is in good agreement with a
series of calculated discrete transitions. In the calculated results a too intense structure is
found around 1321 e V, while only a just sketched feature appears in the experiment. In
summary, we can say that the theory is able to reproduce the experimental features and the
most evident disagreement are the underestimate of the intensity at low energy and minor
shifts in the energy positions of some calculated structures with respect to the measure. It is
important to consider that, although the resolution in the energy scale of the experiment is
around 0.5 eV [4.3], the experimental profile shows much wider structures which therefore
are not the result of a low resolution effect, on the other hand the theoretical results
(convoluted with a FWHM of 1.0 eV) are much less smooth. To explain this discrepancy, it
must be considered that most of the spectral features are above the Mg 1 s ionization limit and
therefore the virtual final orbitals are actually unbound states. These latter, in principle,
cannot be properly described with conventional basis set consisting, for example, of STO
functions like in the present work, but rather should be employed basis functions with correct
asymptotic oscillating behavior typical of the continuum spectrum of photoelectrons. This
problem can be circumvented with conventional basis set employing the Stieltjes Imaging
technique, as already performed recently for O ls excitation ofMgO [4.35], however in that
work it has been shown that the Stieltjes Imaging technique is not useful since it tends to
smear out all the important features, giving too smooth calculated spectra, and it is suggested
that the most practical strategy to obtain the spectrum above threshold is actually to employ a
47
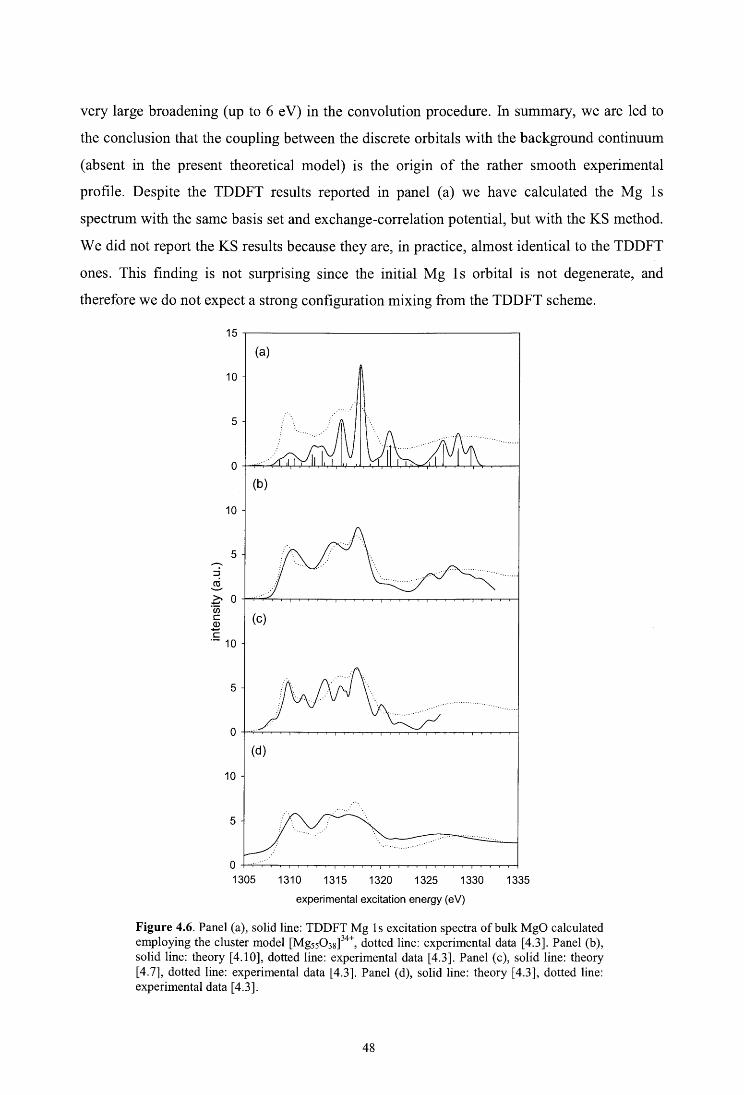
very large broadening (up to 6 eV) in the convolution procedure. In summary, we are led to
the conclusion that the coupling between the discrete orbitals with the background continuum
( absent in the present theoretical model) is the origin of the rather smooth experimental
profile. Despite the TDDFT results reported in panel (a) we have calculated the Mg ls
spectrum with the same basis set and exchange-correlation potential, but with the KS method.
We did not report the KS results because they are, in practice, almost identica! to the TDDFT
ones. This finding is not surprising since the initial Mg I s orbi tal is not degenerate, and
therefore we do not expect a strong configuration mixing from the TDDFT scheme.
15
(a)
10
5
o (b)
10
5 ........... ::i ················· ....... .
~ Z' o ·u;
(e) e Q)
e: ·- 10
5 ..................•.....
o (d)
10
5
O+.-.r~~~~~~~~~~~~~~~~~
1305 1310 1315 1320 1325 1330 1335
experimental excitation energy (eV)
Figure 4.6. Panel (a), solid line: TDDFT Mg ls excitation spectra ofbulk MgO calculated employing the cluster model [Mg550 38]
34+, dotted line: experimental data [4.3]. Panel (b), solid line: theory [4.10], dotted line: experimental data [4.3]. Panel (e), solid line: theory [4.7], dotted line: experimental data [4.3]. Panel (d), solid line: theory [4.3], dotted line: experimental data [4.3].
48

In the panel (b) of Fig. 4.6 the experimental profile is compared with the pseudopotential
supercell results of [ 4.1 O]: it is worth noting that in this case the theory reproduces correctly
all the spectral features, and in particular the first maximum at low energy.
In the panel (c) of Fig. 4.6 we have reported the theoretical results from [4.7], calculated with
a cluster model employing the TS electron configuration obtained promoting one half of
electron from the centrai Mg 1 s to the LUMO orbi tal with a minimal basis set. In this case an
improvement of the low energy spectral feature is obtained, suggesting that the relaxation
effects may play a crucial role in this energy range. W e ha ve performed a calculation with TS
configuration with VWN exchange-correlation potential [ 4.33] and DZP basis set, the results
being very similar to those of [4.7] (panel (c)), so we did not report them in the figure. Apart
relaxation effects, the difficulty of simulati on of the low energy spectrum feature may also be
attributed to surface effects. In fact in a recent work [35] on O 1 s excitation of MgO it has
been shown that strong pre-edge features can be ascribed to core excitons at surface, and the
same effect could be likely present in Mg 1 s excitation as well. Present cluster models are not
suitable for this task, in fact we deliberately excite only 1 s electrons of the centrai Mg atom,
embedding the cluster within PCs arrays, in order to minimize surface effects and to optimize
the description of the bulk. On the other hand the issue regarding surface core excitons may
be considered as well as with our TDDFT method, but with neutral cluster models without PC
embedding, with selective excitation of Mg 1 s orbitals at surface. We will consider proper
cluster design for this task in a future work and by now we limit to observe that both
relaxation or surface core excitons may be involved in the low energy features. To conclude
our analysis on Mg ls excitation, the MS-Xa results of [4.3] are reported in panel (d):
obtained with a cluster model where the relaxation has been introduced with the crude Z + 1
approximation, that is Mg has been substituted with Al in order to simulate the core hole
relaxation. Despite the simplicity of the approach, this is the theoretical result which shows
the best agreement with the experiment. In summary, the Mg 1 s absorption profile seems to
be rather sensitive to the relaxation schemes employed in the calculation, however to assess
with more confidence the origin of the low energy structures which are sensitive to the
computational scheme employed, it seems necessary to analyse in more details surface effects.
4.4.3. Mg 2p
Present TDDFT results conceming the Mg 2p excitation are reported in Fig. 4.7, panel (a),
together with the experimental data [4.3]. The agreement between theory and experiment is
49
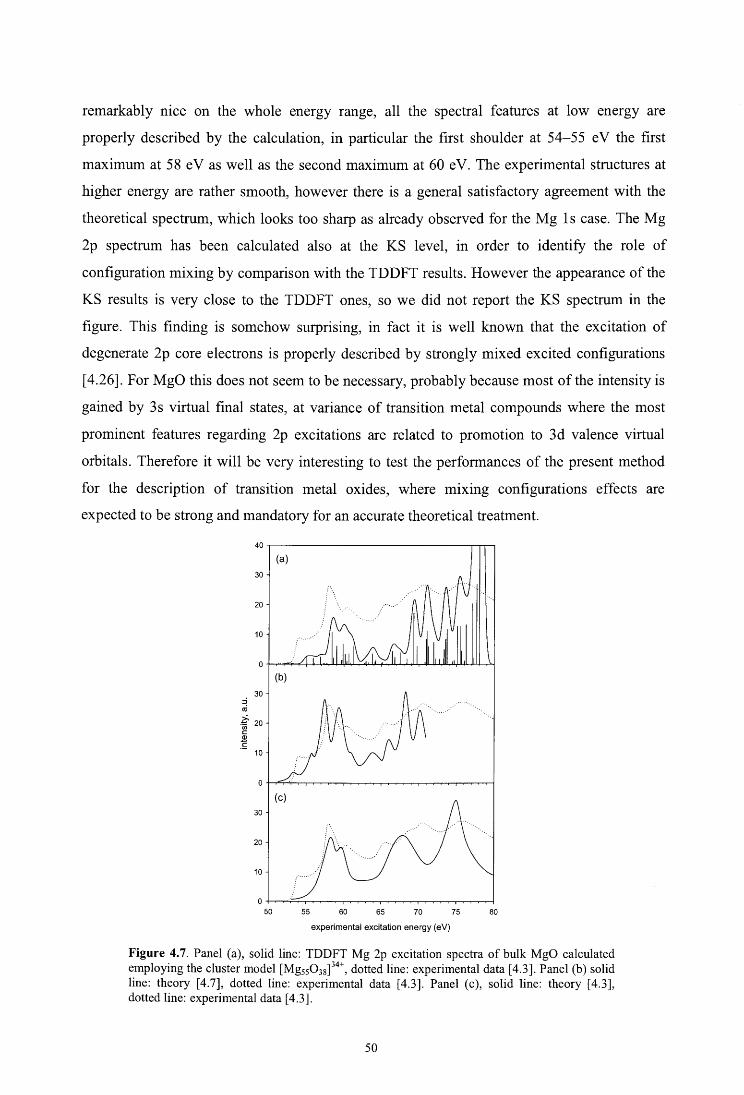
remarkably nice on the whole energy range, all the spectral features at low energy are
properly described by the calculation, in particular the first shoulder at 54-55 eV the first
maximum at 5 8 e V as well as the second maximum at 60 e V. The experimental structures at
higher energy are rather smooth, however there is a general satisfactory agreement with the
theoretical spectrum, which looks too sharp as already observed for the Mg 1 s case. The Mg
2p spectrum has been calculated also at the KS level, in order to identify the role of
configuration mixing by comparison with the TDDFT results. However the appearance of the
KS results is very close to the TDDFT ones, so we did not report the KS spectrum in the
figure. This finding is somehow surprising, in fact it is well known that the excitation of
degenerate 2p core electrons is properly described by strongly mixed excited configurations
[ 4.26]. For MgO this does not seem to be necessary, probably because most of the intensity is
gained by 3s virtual final states, at variance of transition metal compounds where the most
prominent features regarding 2p excitations are related to promotion to 3d valence virtual
orbitals. Therefore it will be very interesting to test the performances of the present method
for the description of transition metal oxides, where mixing configurations effects are
expected to be strong and mandatory for an accurate theoretical treatment.
(a) 30
20
10
(b) 30
::i cci
~ 20 e 2 .S
10
o (e)
30
20
10
o 50 55 60 65 70 75 80
experimental excitation energy (eV)
Figure 4.7. Panel (a), solid line: TDDFT Mg 2p excitation spectra of bulk MgO calculated employing the cluster model [Mg550 38]
34+, dotted line: experimental data [ 4.3]. Panel (b) solid
line: theory [4.7], dotted line: experimental data [4.3]. Panel (e), solid line: theory [4.3], dotted line: experimental data [ 4.3].
50
In panel (b) the theoretical results from [4.7] are reported for comparison, calculated with a
cluster model employing the ground state electron configuration with a minimal basis set. The
profile resembles closely the present TDDFT one, the main difference being a slight intensity
redistribution towards the low energy regi on. In [ 4. 7] additional TS calculations have been
performed to address core hole effects, in the present case the differences in the calculated
spectrum were much weaker than for Mg 1 s, as reasonably expected due to the less inner
nature of the 2p orbi tal.
Finally in the panel (c) of Fig. 4.7, the MS-Xa results of [4.3] are reported: the agreement is
remarkably good despite the crudity of the numerica! approach, as already found in Mg 1 s, so
we are led to consider the good performances of the MS-Xa approach to the inclusion of the
continuum boundary conditions, which prevent the discretization of the states above the
ionization threshold. More accurate approaches than MS-Xa method to treat the continuum
are now available, in particular at DFT level with B-spline basis sets [ 4.36], however they are
much more computationally demanding than present method, so we plan to consider them
when a more clear assessment of the theoretical requirement will be gained.
4.4.4. o 1s
The present TDDFT results conceming O ls excitation are presented in Fig. 4.8, panel (a),
together with the experimental data [ 4.3]. The experimental spectrum is characterized by three
smooth structures, the most intense centered at 535 eV, the less intense at 544 eV and a
maximum with intermediate intensity around 554 eV. The theoretical results mimic properly
the experiment: the first experimental structure is assigned to a group of excitations with a
strong contribution from a single line, the second is attributed to three different transitions of
weaker intensity, the last one to a group of lines well separated from the previous ones. It is
interesting to compare the performance of the TDDFT method with previous calculations, in
Fig. 4.8 in panel (b), (c) and (d) we have reported plane-waves results [4.6], minimal basis
cluster model results [4.7] and MS-Xa [4.3] results, respectively. The first experimental
intense structure at 535 eV is very well reproduced with all methods, in all cases the
maximum follows a series of weaker features which are well evident in the TDDFT, panel (a),
and in the minimal basis cluster calculations, panel ( c ), while only a shoulder is found in the
plane-waves results, panel (b ), and a double maximum is obtained with the MS-Xa approach,
panel ( d). The structures at higher energy are also very well reproduced by all the methods, in
particular the plane-waves results are in excellent agreement with the experiment. For O ls
51

the MS-Xa approach seems to perform worse than in Mg ls and Mg 2p, since it overestimates
the intensity at high energy, in particular the maximum at 555 eV. In general we can say that
the O 1 s absorption spectrum is the easiest to be described at the theoretical level, and the
present TDDFT method gives performances comparable to the other ones presently
considered for comparison.
30
20
10 ::J ctl
>. o -'(j) e Q) - 30 e
20
10
o (d)
30
530 535 540 545 550 555 560 experimental excitation energy (eV)
Figure 4.8. Panel (a), solid line: TDDFT O ls excitation spectra ofbulk MgO calculated employing the cluster model [Mg380 55]
34-, dotted line: experimental data [ 4.3]. Panel (b ), solid line: theory
[4.6], dotted line: experimental data [4.3]. Panel (e), solid line: theory [4.7], dotted line: experimental data [4.3]. Panel (d), solid line: theory [4.3], dotted line: experimental data [4.3].
52

In a recent work [4.35] the O ls excitation ofMgO has been addressed in a more general way,
in particular it has been discriminated the contributi on of bulk O 1 s excitation with respect to
the contributi on of the excitation of the O 1 s core orbitals from the (1 O O) surface, employing
cluster models of different shapes. From that analysis it emerges clearly that both bulk and
surface contributions have a counterpart in the experimental spectrum. Therefore we believe
that for a robust assessment of the performances of the present and other theoretical methods
it would be very useful to consider not only the bulk contribution but also surface effects. In
the present work we have optimized all the model parameters, namely the cluster size and
shape as well as the embedding PCs, in arder to obtain reliable description of the bulk
contribution. Since our method is general, it would be suitable to assess with confidence the
surface contributions arising from surface atoms, not only for O 1 s but also for Mg 1 s and 2p.
However for this goal a different strategy for proper cluster design is necessary which is under
consideration at the moment and will be addressed in a fut~re work.
4.4.5. CONCLUSIONS
Cluster models of various s1ze and shape have been considered, in arder to test the
performances of the TDDFT method for the description of Mg 1 s, Mg 2p and O 1 s excitation
of bulk MgO. From the preliminary analysis it has been shown that the DZP basis set is a
proper choice and that the [Mg550 38]34+ cubo-octahedral cluster is able to reproduce the
relevant spectral features. PCs are mandatory to obtain the closed shell electronic structure
typical of an ionie crystal. The comparison with the available experimental data and previous
theoretical studies shows that the present method is competitive for an accurate description of
the spectra. The most relevant differences between theory and experiment are found in the
low energy region of the spectra, and may be attributed to relaxation or surface effects.
Further efforts, especially devoted to study surface effects with different cluster models, may
spread more light on the origin of the observed deterioration. Although in the Mg 2p
excitation spectra of MgO the configuration mixing explicitly present in the TDDFT model
does not play an important role, it is expected that for transition metal oxides it could become
predominant, making the TDDFT particularly suitable to study more complex systems.
53

5. TIME DEPENDENT DENSITY FUNCTIONAL THEORY OF
X-RAY ABSORPTION SPECTROSCOPY OF ALKALINE-
EARTH OXIDES
Fronzoni G., De Francesco R., Stener M., J Phys. Chem. B 109, 10332 (2005).
The time dependent density functional theory (TDDFT) has been employed to calculate the
X-ray absorption spectra of the alkaline-earth oxides at the metal K and L and oxygen K
edges. Cluster models to mimic the bulk are considered, embedded within an array of point
charges to simulate the Madelung potential. Comparison with experimental data allows a
precise assessment of the performances of the method, which appears competitive and
suitable to reproduce the measurements. The configuration mixing explicitly included in the
TDDFT scheme appears mandatory for a correct reproduction of the oscillator strength
distribution in the metal 2p spectra. The origin of the theoretical spectral features is
investigated with the help of the partial density of the virtual states (PDOS) calculated for
each core ho le considered. The trends of the spectral features along the series are discussed in
terms of the nature of the virtual final states and related to the presence of the empty nd
orbitals of the metal cations. The trend of the below-edge features in the O 1 s excitation
spectra is discussed in terms of the metal-oxygen bonding interaction.
5.1. INTRODUCTION
It is well established that the X-ray absorption structures near the ionization threshold
(NEXAFS region) are closely related to the local electronic structure around the atom in
which the excitation takes place and contain the most significant information on the low-lying
unoccupied states of the systems. From an experimental point of view, the most recent
integration between the electron energy loss techniques (EELS) and the transmission electron
microscope (TEM) [ 5 .1,2] has improved the studi es in condensed matter also at the nanoscale
level. The EELS structures involve transitions from a core orbital strongly localized on a
particular atom to the unoccupied electronic states which lie near the ionization limit of this
specific core state and extend over an energy range of about 20-30 e V. The relevant excitation
54

energies give an indication of the ordering of the unoccupied levels, while the associated
intensity is related to the electric dipole transition moment between the initial core state and
the virtual final state. Therefore, the intensity maps the dipole-allowed atomic site component
of the virtual states. The fine structure around the K absorption edge has been extensively
studied for structural determinati on due to the quite simple interpretati on of the spectra which
are govemed by the s ~ p dipole transitions. Potentially richer are however the L-edge
structures, in particular of transition metals, since they are associated with the p ~ d dipole
transitions which directly probe the metal d participation in the virtual orbitals, and therefore
details of the d involvement in the bonding.
The interpretation of the EELS experimental data of condensed systems reqmres first
principle calculations, and although many efforts have been spent to reproduce the spectra, a
standard and robust method has not yet emerged clearly [5.3-10]. Recently, the time
dependent density functional theory (TDDFT) has been extended to the treatment of the core
electron excitations [5.11,12] and its application to calculate the core excitation spectra of
solid MgO using a cluster model to mimic the bulk [ 5 .13] has been tested. The agreement
with the experimental data indicates the reliability of the TDDFT approach also in the case of
solid samples which may be twofold. One reason is that a finite cluster model should be
advantageous for the calculation of core excitations, since the excited electron is localized
near the core hole so the description of a limited region would be sufficient to describe it
accurately as compared with the band-structure method unless a sufficiently large supercell is
chosen to include core hole effects. The second one is the potentiality of the TDDFT method
which formally includes the coupling between the single excited configurations, therefore
overcoming the limitations of the single particle approaches in terms of coupling between
different configurations, which arise when the core state is degenerate like in 2p orbitals and
also degenerate final atomic nd contributions are accessible.
W e thought it would be important to verify the capability of the computational strategy
employed for MgO, extending the study of core excitations to other members of the series of
alkaline-earth oxides. In this work, we apply the TDDFT to the calculations of the core
excitation spectra of CaO, SrO, and BaO at the metal K and L and the oxygen K edges and
compare them with analogous theoretical results for MgO. This represents the first theoretical
study which considers all the possible core edges for the series of alkaline-earth oxides at the
same level of accuracy, allowing spectral trends to be analyzed across a number of
compounds with the same rocksalt structure. Very interesting is the possibility to correlate the
spectral features, in particular at the metal L and oxygen K edges, with the presence of the
55
empty nd orbitals of the metal cations which are expected to decrease in energy upon going
from MgO to BaO with a consequent increasing participation in the bonding with the oxygen
atom [5.14,15].
5.2. THEORETICAL METHOD
The TDDFT approach for electron excitations and its implementation in the ADF code have
been described in detail in the literature [ 5.16,1 7], so here, we just recall the salient steps and
describe the new features. The generai problem is cast in the following eigenvalue equation:
!1F. = ro. 2F. 1 I 1 (5.1)
where n is a four-index matrix with elements nìacrJbt; the indexes consist of products of
occupied-virtual (ia and jb) Kohn-Sham (KS) orbitals, while cr and 't refer to the spin variable.
The eigenvalues correspond to squared excitation energies, while the oscillator strengths are
extracted from the eigenvectors Fì [5.16]. The n -matrix elements can be expressed in terms
of KS eigenvalues e and the coupling matrix K:
(5.2)
The elements of the coupling matrix K are given by:
(5.3)
where cp are the KS orbitals and (~' (r, r', ro) is the exchange-correlation kemel. In this work,
the kemel is approximated according to the adiabatic local density approximation (ALDA)
[5.18].
The space spanned by the solutions ofthe eigenvalue equation (eq. 5.1) corresponds to the lh-
1 p excited configurations, so it is possible to approximate this space operating a selection
over the configurations, keeping only those necessary for an accurate description of the
phenomenon, as it is customary in ab initio CI calculations. Thus, in practice, according to the
56
method in ref. (5.11], the indexes which span the occupied orbitai space (i andj) are limited to
run only over the core shell.
KS calculations have also been performed, to evaluate the effect of configuration mixing
introduced at the TDDFT level. In the KS scheme, the oscillator strength is calculated directly
as the dipole transition moments between the KS one-electron eigenfunctions and the
excitation energies as eigenvalue differences.
The partial density of states (PDOS) calculations have been performed in order to provide a
pictorial representation of Mulliken populations related to the virtual molecular orbitals of the
clusters. In particular, to find out if a given atomic function Xµ contributes strongly to
molecular orbitals at certain energies, one may weigh the different one-electron levels by
using the percentage Xµ character. If the Xµ character is determined by the gross populations,
the Gross population density of states form of the PDOS is then obtained:
(5.4)
where the index i runs over the one-electron energy levels, ci is the energy of the ith level,
L(E - e J is a Lorentzian function of O. 5 e V fwhm and GP i,µ is the gross population of the Xµ
function in a specific orbitai density lcpi (r)j2:
(5.5)
where Sµv is the overlap matrix between the Xµ and Xv basis functions and Cµi are the
coefficients of the Xµ function in the ith molecular orbitai (MO). In this way, GPi,µ is
associated with the fraction of the orbitai density belonging to that function (percentage Xµ
character of the MO <pi).
5.3. COMPUTATIONAL DETAILS
The calculations have been performed with the ADF program (version 2003.01) (5.19,20]
modified according to the previous section. Basis sets of the DZP type, consisting of STO
functions, have been employed, recovering the experience of the previous work which has
demonstrated the adequacy of the DZP basis set size if the cluster size is sufficiently large
57
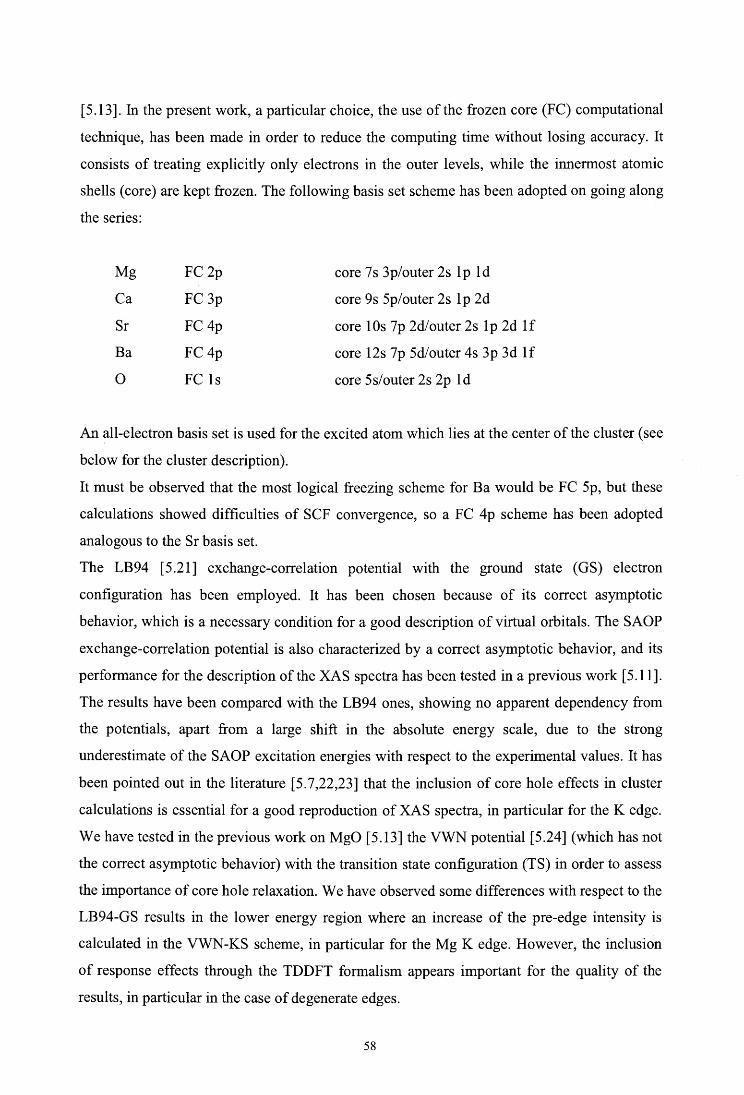
[5.13]. In the present work, a particular choice, the use of the frozen core (FC) computational
technique, has been made in order to reduce the computing time without losing accuracy. It
consists of treating explicitly only electrons in the outer levels, while the innermost atomic
shells (core) are kept frozen. The following basis set scheme has been adopted on going along
the series:
Mg FC2p core 7s 3p/outer 2s lp Id
Ca FC 3p core 9s 5p/outer 2s I p 2d
Sr FC4p core IOs 7p 2d/outer 2s lp 2d lf
Ba FC4p core 12s 7p 5d/outer 4s 3p 3d I f
o FC ls core 5s/outer 2s 2p Id
An all-electron basis set is used for the excited atom which lies at the center of the cluster (see
below for the cluster description).
It must be observed that the most logica! freezing scheme for Ba would be FC 5p, but these
calculations showed difficulties of SCF convergence, so a FC 4p scheme has been adopted
analogous to the Sr basis set.
The LB94 [5.21] exchange-correlation potential with the ground state (GS) electron
configuration has been employed. It has been chosen because of its correct asymptotic
behavior, which is a necessary condition for a good description of virtual orbitals. The SAOP
exchange-correlation potential is also characterized by a correct asymptotic behavior, and its
performance for the description of the XAS spectra has been tested in a previous work [ 5 .11].
The results have been compared with the LB94 ones, showing no apparent dependency from
the potentials, apart from a large shift in the absolute energy scale, due to the strong
underestimate of the SAOP excitation energies with respect to the experimental values. It has
been pointed out in the literature [ 5. 7 ,22,23] that the inclusi on of core ho le effects in cluster
calculations is essential for a good reproduction of XAS spectra, in particular for the K edge.
We have tested in the previous work on MgO [5.13] the VWN potential [5.24] (which has not
the correct asymptotic behavior) with the transition state configuration (TS) in order to assess
the importance of core ho le relaxation. W e have observed some differences with respect to the
LB94-GS results in the lower energy region where an increase of the pre-edge intensity is
calculated in the VWN-KS scheme, in particular for the Mg K edge. However, the inclusi on
of response effects through the TDDFT formalism appears important for the quality of the
results, in particular in the case of degenerate edges.
58

The exchange-correlation kernel is approxirnated within the usual ALDA scheme, and only
excitations with singlet spin symrnetry have been considered, since ali the clusters have a
closed shell electronic structure.
Figure 5.1. Cluster model [M550 38]34+ employed in the present work.
The cluster models employed for ali the oxides are built extracting a proper set of atoms from
the experimental cubie lattice of the NaCl type, that is fulfilled by ali the oxides, using
experimental M-0 distances of 2.106, 2.399, 2.572, and 2.762 A for MgO, CaO, SrO, and
BaO, respectively. The clusters have been built putting at the center the atom which is excited;
successive shells of metal and oxygen atoms have been added, keeping an octahedral
symmetry for computational economy. The cluster charge is chosen assuming a formai ionie
configuration. This choice is related to the availability in the literature of optimized point
charges (PCs) to represent the Madelung potential in cluster models for ionie systems [5.25].
The importance of using PCs has been already observed as decisive in our previous work on
MgO oxide [ 5 .13]. The final generai formula adopted for the cluster with the metal atom at
the center is [M550 38] 34+ (M = Mg, Ca, Sr, Ba) (see Figure 5.1) which has been embedded
within an array of 250 PCs. lt has to be noted that the shape of this cluster with cubo-
octahedral geometry allows surface effects to be minimized due to the maximum coordination
number of atoms also at the surface and appears therefore to be suitable to describe the bulk
properties. The [M550 38] 34+ cluster has been employed for studying metal l s and 2p
thresholds. For studying the oxygen 1 s threshold, we have employed the complementary
[055M38] 34• cluster obtained exchanging metal and oxygen ions with each other in order to
have an O atom at the origin. For this cluster, the optimized PCs are not available, so they are
set to +2 and -2 for the M and O atom positions, respectively. This procedure has been
previously tested [5.13] giving results completely in accord with those obtained with the
optimized PCs. For BaO oxide, we have been forced to use the cluster [05sM62]14+ to calculate
59

the O 1 s spectrum because of serious problems of convergence during SCF calculations,
probably due to the large negative charge of the [055Ba38]34
- cluster.
The calculated spectra have been convoluted with Gaussian functions with a fwhm of 1.0 e V,
to facilitate the comparison with the experiments.
5.4. RESULTS AND DISCUSSION
In the following discussion, the calculated TDDFT spectra will be compared with the
available experimental data. For this purpose, it is more convenient to consider the relative
energy shifts among the features than the absolute scale; therefore, in the figures, we have
shifted the experimental profiles to the calculated ones so as to make the best matches.
Furthermore, to find possible trends along the series in the spectral features relative to the
various core states (metal K and L edges), the calculated spectra are aligned with respect to
the calculated ionization thresholds. This also allows one to have direct evidence of the
spectral features lying above the ionization limit which have to be considered with caution. In
this energy region, one expects to find a smooth background with some shape resonances;
however, the LCAO-MO approach in a finite basis set is not capable of properly treating the
continuum absorption above the edge. The effect of using a conventional basis set generates
discrete states above threshold which are in part just an artifact of the calculations and
represent a discretization of the nonresonant continuum. The antibonding virtual orbitals are
instead closely associated with shape resonances observed in the cross section, and if the
interaction with the nonresonant continuum is rather weak, it can be assumed that the high
intensity discrete transitions calculated above edge may afford a qualitative estimate of the
resonant features at least in the lower energy range. For these reasons, we consider the
theoretical results relative to an energy range extending up to about 20 eV above the
calculated ionization limit.
In the present work, we have also calculated the partial density of the unoccupied states
(PDOS) of the oxides relative to each core hole analyzed. In fact, in a single particle
approximation, it can be assumed that the core excitation spectrum is related to the
unoccupied partial density of the states of the selected atom that is allowed by the electric
dipole selection rule; therefore, we can compare it with the corresponding core excitation
spectrum calculated at the KS level. The main purpose is to find a more clear interpretation of
the calculated spectral features in terms of the dominant contributions of the atomic orbitals
60

(AOs) to the final molecular orbital (MO). In fact, the nature of the excited orbitals is very
difficult to characterize, in particular in big systems with a high density of states, being a
mixture of many atomic components. The partial density of states can provide a pictorial
representation of the Mulliken populations employing a weight factor which is related to the
orbital character determined by means of a Mulliken population analysis per orbital,
particularly useful when there are many one-electron levels as in cluster calculations.
"' o ......
..,. o ...... .;_
'°o
20
10
60
...... 40
.;_
20
30
20
Mg1s
1290 1295 1300 1305 1310
Ca1s 1~\
3975
Sr1s
15705
Ba 1s
f.· ··. \ /" . \
} \ .·I \
.··. I \.. ··········· ······ I \ ,....----
.' / .. \ .... · Il ,_...~---\ / ,_/
3980 3985
15710 15715
3990 3995 4000
15720 15725 15730
35705 35710 35715 35720 35725 35730
excitation energy (eV)
1315
Figure 5.2. TDDFT metal ls excitation spectra (solid line). Experimental data: MgO, dotted line [5.3]; CaO, dotted line [5.26] and dashed line [5.27]. Vertical dashed lines: calculated metal ls DFT-KS ionization thresholds (opposite eigenvalues): MgO, 1293.01 eV; CaO, 3981.61 eV; SrO, 15709.98 eV; BaO, 35711.57 eV.
61

"' o ..... ..:...
... o
o
10
60
..... 40
..:...
"' o
20
Mg1s
1290
Ca1s
3975 3980
Sr1s
15705 15710
Ba 1s
35705 35710
1295 1300 1305 1310 1315
3985 3990 3995 4000
15715 15720 15725 15730
35715 35720 35725 35730
excitation energy (eV)
Figure 5.3. KS metal ls excitation spectra (solid line) and metal p-PDOS profiles (dashed line ). The DOS profiles are amplified for best fitting calculated spectra, using the following coefficients: MgO, 35; CaO, 100; SrO, 150; BaO, 130. Vertical dashed lines: calculated metal ls DFT-KS ionization thresholds (opposite eigenvalues): MgO, 1293.01 eV; CaO, 3981.61
5.4.1. Metal K-edge spectra
Figure 5.2 displays the TDDFT theoretical spectra of the metal K edge of the alkaline-earth
oxides in comparison with the available experimental spectra [5.3,26,27]. A very low
intensity is calculated for all the spectra in the region below the edge. A similar sequence of
62

structures in the first 1 O e V ab ove the absorption edge is present in the MgO, CaO, and SrO
spectra: a series of low intensity features are followed by a sharp structure at around 8 e V
above edge, which dominates the spectra. This peak reproduces correctly the maximum
observed in the experimental spectra of the first two oxides [5.3,26,27], with the resolution of
the SrO experimental spectrum being too low for making any significant comparison with the
theoretical data [5.28]. The main deficiency of the calculations is the underestimate of the
intensity of the lower energy experimental features, in both the MgO and CaO spectra, while
there is a good agreement in terms of the relative energy position of the main resolved
structures. At the higher energy side of the main structure, the calculations describe correctly
the quite rapid intensity drops observed in the MgO spectrum and the very smooth maximum
at higher energy. In the case of the CaO spectrum, a second intense peak is calculated at the
higher energy side of the main peak, in accord with the large absolute maximum observed in
the experiment, while the calculated intensity of the high energy part appears underestimated
by the calculations. In summary, we can say that the theory is able to fairly reproduce the
experimental features with a main deficiency associated with an underestimate of the intensity
at lower energy. It is important to note that the discrepancy between the wider structures of
the experimental profile with respect to the calculated ones does not depend on low resolution
in the experiment (in the case of MgO, this is 0.5 eV and the calculated profiles are
convoluted with Gaussians of I.O e V). The origin of this discrepancy can be associated with
the coupling between the discrete orbitals and the resonant continuum, not included in the
present theoretical approach as discussed before, which is responsible for the rather smooth
experimental profiles observed in both the MgO and CaO spectra. Furthermore, it has to be
considered as a further source of energy broadening which arises from the lifetime of the final
state [ 5 .2]. As concems the calculated spectrum of the BaO oxide, a qui te different spectral
shape is apparent with respect to the lighter oxides. In particular, the shift of the main peak
toward higher energy represents a deviation from the trend observed for the other members of
the series.
To correlate the calculated spectral features with the electronic structure of the series of
oxides, it is useful to analyze the theoretical results collected in Figure 5 .3. Here, we compare
the metal K-edge spectrum calculated at the one-electron KS level with the partial density of
virtual states (PDOS). It has to be noted that the KS results for the metal 1 s spectra are almost
identica! to the TDDFT ones (Figure 5.2), not surprisingly since the initial metal ls orbital is
not degenerate so only a small configuration mixing from the TDDFT scheme is expected.
The electric dipole selection rule allows transitions from the metal 1 s core orbi tal to the
63

unoccupied p orbitals of the central metal atom of the cluster. The calculated oscillator
strengths f map the contribution to the final state of the atomic orbital carrying most of the
transiti on moment, namely, the metal np atomic components in the metal 1 s excitations. The
calculated PDOS of p states (p-PDOS) gives a graphical representation of the weight of the
central metal p atomic character in the virtual levels; therefore, the p-PDOS can be
qualitatively considered proportional to the oscillator strength calculated at the KS level. As
we can see in Figure 5.3, there is in general a correspondence between the p-DOS and the
peaks of the KS spectra, although some discrepancies are apparent. The reported p-DOS
refers to the sum of all the metal np components provided by the basis set employed. The
analysis of the single np components (not reported in Figure 5.3) shows that the total p-DOS
within about 10 eV from threshold is contributed by the lowest metal np component (namely,
3p, 4p, 5p, and 6p for MgO, CaO, SrO, and BaO, respectively). The higher np components
give a not negligible contribution only in the higher energy range. As concems the trends of
the spectra along the series, a first observation concems the significant decrease of the
calculated oscillator strength f along the seri es; in particular, the intensity reduces by a factor
of 5 upon going from MgO to CaO and by 1 arder of magnitude upon going from CaO to
BaO. This can be correlated to both initial and final state effects. The initial metal ls orbital
becomes more compact along the series, reducing the dipole overlap with the np final state
and therefore the corresponding calculated f value. The effect of the virtual final orbitals can
be instead analyzed if we consider the results of Figure 5.4. Here, the metal ns, np, and nd
partial DOS of the [M550 38]34+ clusters are reported, which allow a complete representation of
these atomic contributions in the virtual levels to be obtained. The distribution of the p
character in the virtual levels changes along the series. In particular, it significantly
contributes to the low-lying virtual MOs of MgO while it appears strongly suppressed in CaO,
where the 3d orbital becomes the major component ofthe Ca PDOS in the lower energy range.
This situation is quite similar in SrO, where a further significant contribution from the ns
components at lower energy is present while the p character contributes also to states at higher
energy. This could be related to the intense peak of the KS spectrum calculated at the higher
energy side of the main peak. Finally, in BaO, a general shift of the p-PDOS toward higher
energy is observed which correlates with the intensity decrease around the edge and the shift
of the main structures at higher energies observed in the KS spectrum. In summary, the p
component carrying the most calculated transition moments is 3p in MgO, 4p in CaO, 5p in
SrO, and 6p in BaO. The highest intensity peak calculated in the same energy range in the
MgO, CaO, and SrO spectra is associated with the metal ls transitions toward states
64

dominated by these p components; also, in the case of BaO, the main peak, although shifted at
higher energy, corresponds to the 1 s ~ 6p transiti on. The decrease of the calculated oscillator
strength along the series can be essentially associated with an increasing mixing of several
AO components in the low-lying virtual states with a consequent reduction of the p character
and its progressive shift toward virtual levels at higher energies.
(/) o o Cii
60
40
20
~ 60 o.
40
20
60
40
o
o
o
-- sPDOS pPDOS
--- d PDOS
~ r\
5
5
5
10
10
10
,, '11.1\ rl I\/ I
[1 {1 I V \ I I /I /\ t~ I I .I'" I I\ "'
\.)
15
15
15
energy (eV)
20
20
20
Mg O
25 30
SrO
25 30
Ba O
25 30
Figure 5.4. Partial DOS (s-, p-, and d-PDOS) profiles toward the energy of the calculated electronic levels of the cluster [M550 38]
34+. Energies are rescaled with respect to the LUMO KS energy value of each cluster, which is taken as zero. Absolute LUMO energies (in e V): MgO, -4.7757; CaO, -6.4548; SrO, -5.2014; BaO, -4.8624.
65
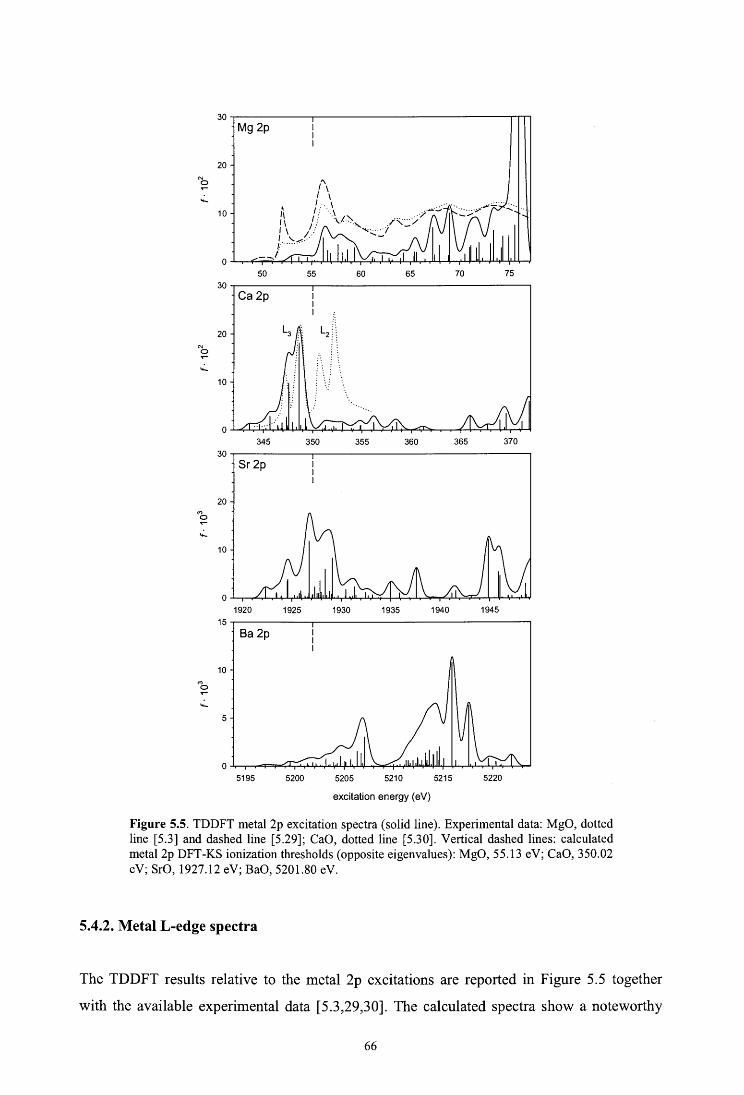
N o ..--
N o
"' o .;_
20
20
10
20
10
o
15
10
5
Mg 2p
50
Ca2p
345
Sr2p
1920 1925
Ba2p
5195 5200
55 60 65 70 75
L2n .. .
350 355 360 365 370
1930 1935 1940 1945
5205 5210 5215 5220
excitation energy (eV)
Figure 5.5. TDDFT metal 2p excitation spectra (solid line). Experimental data: MgO, dotted line [5.3] and dashed line [5.29]; CaO, dotted line [5.30]. Vertical dashed lines: calculated metal 2p DFT-KS ionization thresholds (apposite eigenvalues): MgO, 55.13 eV; CaO, 350.02 eV; SrO, 1927.12 eV; BaO, 5201.80 eV.
5.4.2. Metal L-edge spectra
The TDDFT results relative to the metal 2p excitations are reported in Figure 5.5 together
with the available experimental data [5.3,29,30]. The calculated spectra show a noteworthy
66

change in the near-edge structures upon going along the series in particular in the pre-edge
region where the features strongly increase their intensity from MgO to CaO, then decrease in
SrO (see the oscillator strength f scale in the figure), and become very low in the BaO
spectrum. Also, in the case of the L edge, the BaO spectrum differs significantly from the
other members of the series. The agreement between theory and experiment is nice for MgO:
all the spectral structures at low energy are correctly reproduced, and also at higher energies, a
generai agreement is apparent, although the theoretical spectrum looks too sharp with respect
to the smooth experimental profile. The CaO experimental spectrum [5.30] shows two very
sharp structures corresponding to the 2p312 (L3) and 2p112 (L2) edges, which are well separated
in energy. It is important to underline that the present approach does not allow the treatment
of the spin-orbit effect, so it is not possible to distinguish between the L1 and L3 edges;
therefore, the TDDFT results have to be compared with the experimental features converging
to a single ionization threshold (generally Ca 2p312). Good agreement with the experiment in
the L3 region is found, as concems both the energy separation and the intensity distribution of
the two low energy structures. Very low intensity is instead calculated above threshold. Also,
in the SrO theoretical spectrum, most of the intensity is concentrated in the structures around
the edge, while, in BaO, there is a drop of the intensity at lower energy and the appearance of
most important features at about 15 e V from threshold.
Consider now the calculated PDOS useful for the attribution of the calculated spectral features.
The metal 2p electron has dipole-allowed transitions into s and d like final states; therefore,
both the contributions of metal ns and nd PDOSs are considered in Figure 5.6, in the
comparison with the theoretical spectra obtained at the KS level. A close inspection of the
results reported in Figure 5.6 (left panel) shows that the calculated KS oscillator strengths are
not properly approximated by the ns and nd contributions (we do not report their sum in the
left panel). This means that the contributions of the metal ns and np components to the
oscillator strengths are different, in agreement with the conclusion in the literature [5.31,32]
regarding the different contributi on of the transitions toward nd and (n + 1 )s orbitals to the L-
edge absorption spectra of heavier atoms. We have explicitly calculated the 2p ~ ns and 2p
~ nd oscillator strengths of the metal dications M2+ (M = Mg, Ca, Sr, and Ba), finding that
the transitions to ns states are much less intense compared to the transitions to nd states and
follow a well definite trend along the series from Mg2+ to Ba2+. In particular, the calculated
ratio between the nd and ns oscillator strengths is the smallest for Mg2+ (3d/3s = 11.4), while
it increases significantly in Ca2+ (3d/4s = 62.4), Sr2+ ( 4d/5s = 51.2), and Ba2+ (5d/6s = 235.6).
This behavior can be correlated with the more compact nature of the nd wave function with
67

respect to the (n + 1 )s wave function, resulting m a stronger overlap with the 2p wave
function. In the case of the Mg dication, the 3s and 3d orbitals have the same principal
quantum number, so their spatial distribution is expected to be less different, resulting in a
lower ratio between the intensity of the two p-s and p-d channels. This analysis points out that
the L spectrum of these oxides is dominated by the d absorption channel.
N o
N o
..:..
..:..
..:..
20
10
10
Mg 2p
50 55
.......... sDOS ------- d DOS not weighted
60 65
345 350 355 360
1920 1925 1930 1935
Ba2p
5195 5200 5205 5210
excitation energy (eV)
..:..
N o
..:..
..:..
"' o
..:..
20
10
10
Mg 2p ------- weighted s+d DOS
50 55 60 65 70 75
345 350 355 360 365
1920 1925 1930 1935 1940
Ba2p
5195 5200 5205 5210 5215
excitation energy (eV)
Figure 5.6. (left panel) KS metal 2p excitation spectra (solid line) and metal s- (dotted line) and d- (dashed line) PDOS profiles. The DOS profiles are amplified (for best fitting calculated spectra) using the following coefficients: MgO, 50; CaO, 25; SrO, 20; BaO, 10. (right panel) KS metal 2p excitation spectra (solid line) and sum of s- and d-PDOS weighted profiles; the weight coefficients are the respective 2p --+ ns and 2p --+ nd oscillator strengths relative to the calculated transitions in M2+ ions; the DOS profiles are reduced (for best fitting calculated spectra) using the same coefficient (2) for ali the profiles. Vertical dashed lines: calculated metal 2p DFT-KS ionization thresholds (opposite eigenvalues): MgO, 55.13 eV; CaO, 350.02 eV; SrO, 1927.12 eV; BaO, 5201.80 eV.
68

If each metal ns and nd PDOS ofthe oxides is weighted for (multiplied by) the corresponding
2p ~ ns and 2p ~ nd computed oscillator strengths of the metal dications, the total PDOS
reported in the right panel of Figure 5.6 is obtained. As we can see, the calculated KS
oscillator strength is now found to be well approximated by the "weighted" (ns + nd) PDOSs.
Figure 5.4 shows that in MgO the 3d orbitai component dominates at higher energy and the 3s
one at lower energy. In CaO and SrO, the 3d and the 4d orbitals are instead the major
components of the unoccupied PDOS around the ionization threshold, although strong
contributions from essentially 4s (for CaO) and 5s (for SrO) metal orbitals are also present. In
BaO, the 5d component gives increasing contributions upon going toward higher energies,
while the 6s component is important around threshold.
The previous investigation of the PDOS diagrams can be useful to analyze the trends of the
spectral features along the series (see Figure 5.5). In MgO, most of the intensity around the
edge is gained by the 3s virtual states and therefore the spectral features are very low. Upon
going toward higher energy, the spectral intensity increases with the increase of the 3d Mg
character of the final states. The high intensity of the pre-edge features of the CaO spectrum is
associated with the presence of low-lying virtual states with a strong 3d metal contribution;
the main s character of the higher energy states is responsible for the drop of the intensity
calculated above the ionization limit. A quite similar behavior is found for the SrO spectrum,
although the intensity of the transitions around the edge is lowered by about 1 arder of
magnitude with respect to the CaO. In fact, the maximum/value calculated for CaO is 0.1811,
while for SrO it is 0.0119. Closely connected to this is the lower d metal (4d) character of the
low-lying virtual states with respect to that found in CaO together with a less effective overlap
between the 2p wave function and the 4d one with respect to the 3d wave function. Finally,
the different shape of the BaO spectrum reflects the energy increase of the virtual levels with
5d metal character which give rise to intense structure far away from threshold.
It is interesting to compare the TDDFT and KS 2p metal spectra (Figures 5.5 and 5.6,
respectively), to identify the role of the configuration mixing which is expected to be
important in the case of the degenerate core hole, like the 2p core electrons [5.33]. The most
significant difference between the two levels of calculations is observed in the cases of the
CaO and SrO spectra: the TDDFT approach significantly redistributes the intensity of the
transitions near the edge, bringing them in a better accord with the experiment in the case of
CaO. Here, in particular, the mixing of the configurations tends to concentrate the intensity on
two main lines (at 347.6 and 348.6 eV in Figure 5.5) which are associated with transitions
toward final states with 3d dominant character and give rise to the two well distinct peaks of
69
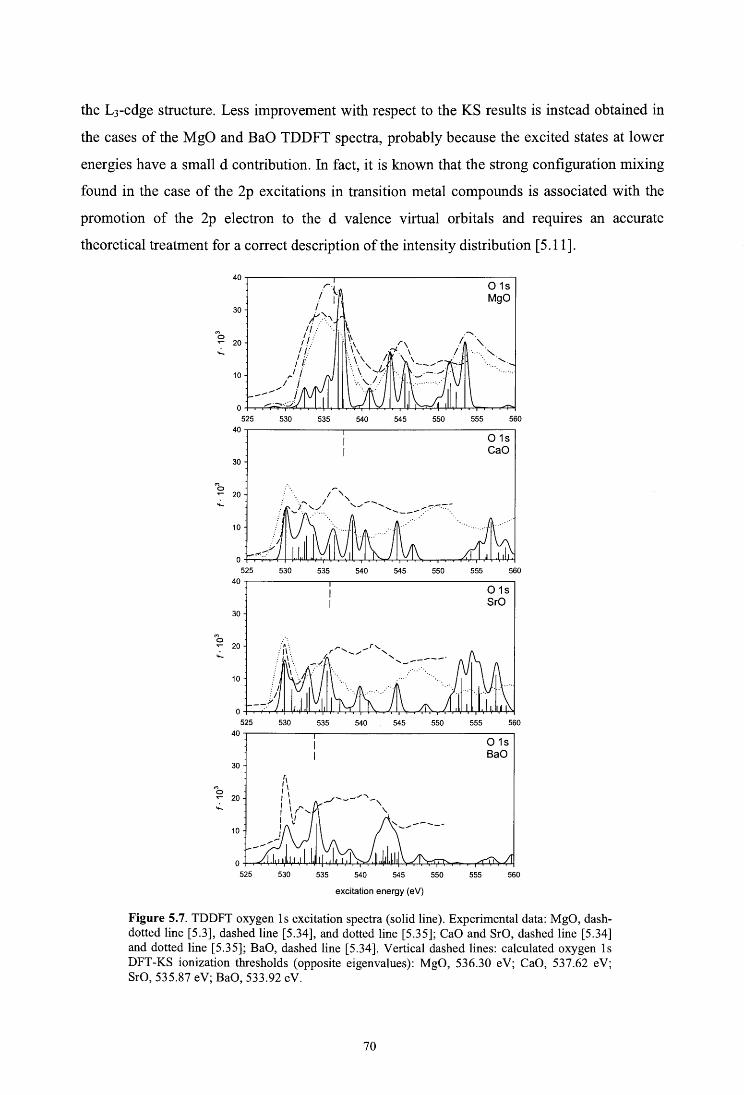
the L3-edge structure. Less improvement with respect to the KS results is instead obtained in
the cases of the MgO and BaO TDDFT spectra, probably because the excited states at lower
energies have a small d contribution. In fact, it is known that the strong configuration mixing
found in the case of the 2p excitations in transition metal compounds is associated with the
promotion of the 2p electron to the d valence virtual orbitals and requires an accurate
theoretical treatment for a correct description of the intensity distribution [ 5 .11].
"' o
"'o
30
20
10
525
30
20
10
525
30
20
10
525
30
20
10
--525
530
530
530
'1 ,, f I I I
I'!'' I I/ I ~ I ,,,.-
530
535
535
535
535
540 545 550
540 545 550
540 545 550
540 545 550
excitation energy (eV)
555
555
555
555
O 1s Mg O
560
O 1s Ca O
560
O 1s SrO
560
O 1s Ba O
560
Figure 5.7. TDDFT oxygen ls excitation spectra (solid line). Experimental data: MgO, dash-dotted line [5.3], dashed line [5.34], and dotted line [5.35]; CaO and SrO, dashed line [5.34] and dotted line [5.35]; BaO, dashed line [5.34]. Vertical dashed lines: calculated oxygen ls DFT-KS ionization thresholds (opposite eigenvalues): MgO, 536.30 eV; CaO, 537.62 eV; SrO, 535.87 eV; BaO, 533.92 eV.
70
5.4.3. Oxygen K-edge spectra
The theoretical TDDFT results relative to the O K edge of the oxides are compared in Figure
5. 7 with the experimental spectra in the same way as in previous figures. In the experiments
[5.3,34,35] significant changes in the near-edge structure are observed; in particular, the
intensity of the first peak increases when the atomic number Z increases from Mg to Ca;
furthermore, the shape of the first peak changes when one goes from CaO to BaO, while its
energy position remains essentially the same. In the theoretical spectra, only a very small peak
is calculated around 530 e V in the MgO spectrum which could correspond to the low energy
shoulder of the main experimental peak, while in the other oxides this peak gains intensity
and maintains its energy position (530 e V), in good accord with the experimental trend. It is
important to point out that a recent theoretical work [ 5 .36] on the O 1 s excitations in MgO has
evidenced that the small discrete peak should be ascribed to surface effects; therefore, it can
be characterized by only employing surface clusters and it does not appear in calculated
spectra of bulk clusters. This suggests that a complete theoretical reproduction of the O 1 s
spectra would require the surface effects to be considered also, employing different cluster
designs to simulate the bulk and the surface. Figure 5. 7 shows that there are some
discrepancies between the experimental data relative to the CaO and SrO spectra [5.34,35]; in
particular, a different intensity trend is provided by the two experiments for both oxides in the
region just above the threshold. The theoretical results resemble more closely the
experimental profiles of ref. [5.35] in this region, while a good match with both sets of
experimental data is obtained for the structures calculated below the edge. For the BaO
spectrum, only the experimental pro file of ref. [ 5 .34] is available; also, in this case, the
spectral features below the edge are fairly well reproduced by the calculation, while a quite
different intensity distribution is apparent at higher energies. As concems the spectral trend, a
clear change of the pre-edge features upon going along the series is apparent, in particular
from MgO to CaO; this change reflects the different compositions of the low-lying virtual
orbitals and can be connected to the metal-oxygen interaction in these oxides. If we considera
purely ionie model for the oxide, the transitions from O( 1 s) to 0(2p) are not allowed because
the divalent oxygen ion has the 2p shell fully occupied; however, they are possible if covalent
M-0 interaction reduces the 2p shell occupati on. In this respect, the O 1 s ---+ 02p transition
intensity can be a probe of the covalent character of the M-0 bond, which has been proposed
to increase from MgO to BaO [ 5 .14] in contrast with chemical arguments based on the
electronegativity scale.
71

30
M o ...... 20 ..:...
10
30
'""o ...... 20 ..:...
10
O 1s MgO
525 530
O 1s CaO
\ \
525
, __ 530
535 540 545 550 555 560
535 540 545 550 555 560 4o-.-~~~~~"""T'""-~~~~~~~~~~~~----,
M o
O 1s SrO
30
525 530 535 540 545 550 555 560 40-.-~~~~-.-~~~~~~~~~~~~~---.
O 1s BaO
30
525 530 535 540 545 550 555 560
excitation energy (eV)
Figure 5.8. KS oxygen ls excitation spectra (solid line) and oxygen p-PDOS profiles (dashed line ). The latter are amplified for best fitting calculated spectra, using the coefficient 1000 for MgO and the coefficient 500 for the other profiles. Vertical dashed lines: calculated oxygen ls DFT-KS ionization thresholds (opposite eigenvalues): MgO, 536.30 eV; CaO, 537.62 eV; SrO, 535.87 eV; BaO, 533.92 eV.
The oxygen 2p character of the virtual states in the oxides can be inferred by the analysis of
Figure 5.8, which reports the oxygen np PDOS (2p and 3p components) for the clusters
centered on an oxygen atom compared with the O I s theoretical spectra at the KS level. It has
to be noted that the KS results for the O I s excitations are in practice very similar to the
72
TDDFT ones, as already observed for the metal K edges. For all the oxides, it is apparent that
the below-edge structures are in agreement with the partial locai density of states. We see that
the O np components of the below-edge final orbitals are much lower in MgO than in the
other oxides (note that the PDOS scale in MgO is amplified by a factor of 2 with respect to
the other PDOS plots in Figure 5.8). This is consistent with the low intensity calculated for
the below-edge O I s transitions of MgO, confirming the more ionie character attributed to this
oxide with respect to the other members of the series. The PDOS of the CaO shows the
increase of the O 2p contribution to the lowest virtual states which is responsible for the
increase of the intensity calculated for the below-edge structures. The participation of the O
3p component in the low energy range is very small and becomes important only at higher
energy above threshold. Analogous behavior is also observed for the oxygen np PDOS in the
case of SrO and BaO; the features below edge again derive from transitions toward virtual
orbitals with significant 02p contribution. In SrO, the 3p contribution is important only for
the structures at high energy, as in CaO, while, in BaO, these levels are lower in energy,
giving rise to the structure around 543 e V. The intensity trend of the 02p structures below the
edge would therefore support the hypothesis that the ionie character is larger in MgO than in
CaO, but their differences in the CaO, SrO, and BaO spectra are not so significant to represent
a definite measure of the covalent mixing. It is however important to note that also the
presence of the empty d levels of the metal cation are expected to play an important role in the
metal-oxygen bonding interaction. Theoretical calculations [5.14,37] have proven that the 3d
levels in MgO are too high in energy to directly participate in the bonding, while in the
heaviest alkaline-earth oxides the covalent interaction is increased by the availability of metal
d functions. These results agree with the intensity trend observed in the metal 2p spectra in the
below-edge region previously discussed. This has been in fact associated with the presence of
low-lying metal d virtual orbitals in CaO, SrO, and BaO available for direct participation in
the M-0 interaction. In MgO, no structures associated with 2p ---+ 3d transitions are apparent
in the spectrum in the near-edge region.
5.5. CONCLUSIONS
TDDFT calculations using cluster models have been performed to describe the NEXAFS
absorption spectra of bulk MgO, CaO, SrO, and BaO oxides. The metal ls and 2p edges and
the O 1 s edge ha ve been considered. The companson of the theoretical results with the
73

available experimental data shows that the present method is reliable for an affordable
description of the spectra. The configurati on mixing explicitly included in the TDDFT scheme
appears mandatory for a correct reproduction of the oscillator strength distribution in the
metal 2p spectra.
The origin of the calculated spectral features is investigated with the help of the partial density
of the virtual states (PDOS) calculated for each core hole considered. The PDOS gives a
graphical representation of the character of the virtual orbitals and can be qualitatively
compared with the theoretical spectra calculated at the one-electron KS level.
The trend in the calculated core spectra strongly depends on the energy posi ti on of the virtual
levels with nd dominant character which influences the electronic structure along the series.
The cation K-edge spectra reflect the p character of the virtual states around the metal atom
and therefore are not significantly influenced by the change in the nd density of states near the
Fermi level and the spectra are rather similar. In the case of the 2p metal spectra, noteworthy
differences are instead observed in the below-edge spectral features upon going from MgO to
BaO. The trends of the below-edge features in the Ols excitation spectra are tentatively
discussed in terms of the metal-oxygen bonding interaction.
74
6. X-RAY ABSORPTION SPECTROSCOPY OF TITANIUM
OXIDE BY TIME DEPENDENT DENSITY FUNCTIONAL
CALCULATIONS
Fronzoni G., De Francesco R., Stener M., Causà M., J Phys. Chem. B 110, 9899 (2006).
The potentiality of the time dependent density functional theory (TDDFT) for the description
of core excitation spectra (XAS) in transition metal oxides is analyzed, considering the rutile
form of Ti02 as a test case. Cluster models are adopted to mimic the bulk, embedded within
an array of point charges to simulate the Madelung potential. All of the edges, titanium and
oxygen K and titanium L edges, are considered, and the TDDFT results are compared with the
experimental data in order to assess the performance of the theoretical approach in dealing
with this complex class of compounds. Satisfactory results have been obtained for the Ti and
O K edges, while in the case of the Ti L edge some discrepancies with the experiment are still
present. The configuration mixing explicitly included in the TDDFT model strongly
influences the distribution of the 2p metal oscillator strength. The origin of the spectral
features is investigated with the help of the partial density of the virtual states (PDOS)
calculated for each core hole considered, which can be qualitatively compared with the
theoretical spectra calculated in the Kohn-Sham one-electron approach.
6.1. INTRODUCTION
X-ray absorption spectroscopy (XAS) is a locai process in which a core electron is promoted
to an excited electronic state; therefore, the observed spectral structures near the ionization
threshold (NEXAFS region) are closely related to the locai electronic structure around the
atom in which the excitation takes piace and contain significant information on the low-lying
unoccupied states of the systems. The intensity of the excitation process is related to the
coupling between the initial core state and the excited state by the electric dipole selection
rule; therefore, it maps the dipole-allowed atomic site component of the final virtual state.
From an experimental point of view, the most recent integration between the electron energy
loss (EELS) techniques and the transmission electron microscope (TEM) [ 6.1,2] has
75
improved the studies in condensed matter also at the nanoscale level and has renewed the
attention on theoretical approaches suited for the reproduction and interpretation of the
experimental data in terms of the electronic structure of the sample. The interpretation of the
EELS spectra of condensed systems requires first principle calculations, and although many
efforts have been spent to reproduce the spectra, a robust and general method has not yet
emerged clearly. It has been verified that a single particle description of the XAS spectra
generally works well for the K edges and several dedicated computer codes exist [6.3]; for
other edges, in particular the transition metal L edge, coupling between configurations has to
be included in the computational scheme for a realistic description of the core spectrum. In
this respect, the time dependent density functional theory (TDDFT) represents an essential
improvement over the single particle approaches and appears therefore to be a suitable
compromise between accuracy and computational economy needed to treat large systems.
Current TDDFT implementations allow valence electron excitations to be described,
providing a good accuracy for molecular systems. Only more recently it has been applied also
to the treatment of the optical transitions of defects in solids using suitable cluster model
approaches [6.4-7]. The recent extension of the TDDFT method for the treatment of the core
electron excitations has proven to be reliable to reproduce and give interpretation of core
absorption spectra both in simple and in more complex molecules [6.8,9]. Furthermore, it has
also been applied to the calculations of core excitations of the series of alkaline-earth oxides
(from MgO to BaO) [6.10,11], using a cluster model to mimic the bulk of the oxides. All of
the edges (metal ls and 2p and oxygen ls) have been considered, obtaining good agreement
with the available experimental data. The reliability of the TDDFT computational method
employed in ref. [ 6.11] to describe the XAS spectra of solid samples may be twofold. One
reason is that a finite cluster model should be advantageous for the calculation of core
excitations, since the excited electron is localized near the core hole; therefore, the description
of a limited region would be sufficient to describe it accurately. The second one is the
potentiality of the TDDFT approach, which formally includes the coupling between single
configurations and therefore overcomes the limitations of single particle approaches. It allows
to describe in particular situations in which the core state is degenerate, like in 2p orbitals, and
also degenerate final atomic nd contributions are accessible.
It would be particularly meaningful to extend the study to transition metal oxides which
remain one of the most difficult classes of solids on which to perform spectroscopic property
predictions through ab initio calculations. In fact, while a single particle description of the X-
ray absorption generally works well for the metal and oxygen K edges, the agreement is poor
76

for the metal L edge, due to the strong overlap of the 2p core ho le with the 3d electrons which
requires the inclusion of configuration mixing in the theoretical approach. The L edge is
particularly rich in information and for transition metal compounds is associated with the p ~
d dipole transitions which directly probe the metal d participation to the virtual states,
therefore detailing the d involvement in the bonding.
In this work, the TDDFT is applied to the calculations of the core excitation spectra of the
bulk titanium dioxide (Ti02) in its most common polymorphic form, the rutile structure. In
the rutile structure, each Ti atom is surrounded by a slightly distorted octahedron of O atoms.
Its electronic structure has been extensively investigated experimentally by core level
spectroscopies such as electron energy loss spectroscopy (EELS) and X-ray absorption
spectroscopy (XAS) [6.12-20]. Several theoretical calculations, in particular on the Ti and O
K edges, have been performed, both adopting a band structure and cluster methods [ 6.21-27];
however, only in the study of ref. [ 6.17] are all of the edges investigated using the same
computational approach. Therefore, Ti02 represents an interesting test case to assess the
performance of the TDDFT scheme for the reproduction of core excitation spectra in the
complex case of transition metal oxides. The present study considers all of the possible core
edges, namely, the Ti K edge, the Ti L edge, and the OK edge which are investigated at the
same level of accuracy and compared with the experimental measurements. Also, the partial
density of unoccupied states relative to the each core hole is considered, to find a clearer
interpretation of the calculated spectral features in terms of the dominant contribution of the
atomic orbitals to the final virtual molecular orbitals.
6.2. THEORETICAL METHOD
The TDDFT approach for electron excitations and its implementation in the ADF code have
been described in detail in the literature [6.28,29], so here, we just recall the salient steps and
describe the new features. The genera! problem is cast in the following eigenvalue equation:
(6.1)
where .Q is a four-index matrix with elements .QiacrJb•; the indexes consist of products of
occupied-virtual (ia and jb) Kohn-Sham (KS) orbitals, while cr and T referto the spin variable.
The eigenvalues correspond to squared excitation energies, while the oscillator strengths are
77
extracted from the eigenvectors Fi [ 6.28]. The !1-matrix elements can be expressed in terms
of KS eigenvalues (e) and the coupling matrix K:
(6.2)
The elements of the coupling matrix K are given by:
(6.3)
where cp are the KS orbitals and f :C' (i:, r', co) is the exchange-correlation kemel. In this work,
the kemel is approximated according to the adiabatic locai density approximation (ALDA)
[6.30].
The space spanned by the solutions ofthe eigenvalue equation (eq. 6.1) corresponds to the lh-
1 p excited configurations, so it is possible to approximate this space operating a selection
over the configurations, keeping only those necessary for an accurate description of the
phenomenon, as is customary in ab initio CI (Configuration Interaction) calculations. Thus, in
practice, according to the method in ref. [6.8], the indexes which span the occupied orbitai
space (i and j) are limited to run only over the core shell.
KS calculations have also been performed, to evaluate the effect of configuration mixing
introduced at the TDDFT level. In the KS scheme, the oscillator strengths are calculated
directly as the dipole transition moments between the KS one-electron eigenfunctions and the
excitation energies as eigenvalue differences.
The partial density of states (PDOS) calculations have been performed in order to provide a
pictorial representation of Mulliken populations related to the virtual molecular orbitals of the
clusters. In particular, to find out if a given atomic function Xµ contributes strongly to
molecular orbitals at certain energies, one may weight the different one-electron levels by
using the percentage Xµ character. If the Xµ character is determined by the gross populations,
the gross population density of states form of the PDOS is then obtained:
(6.4)
78
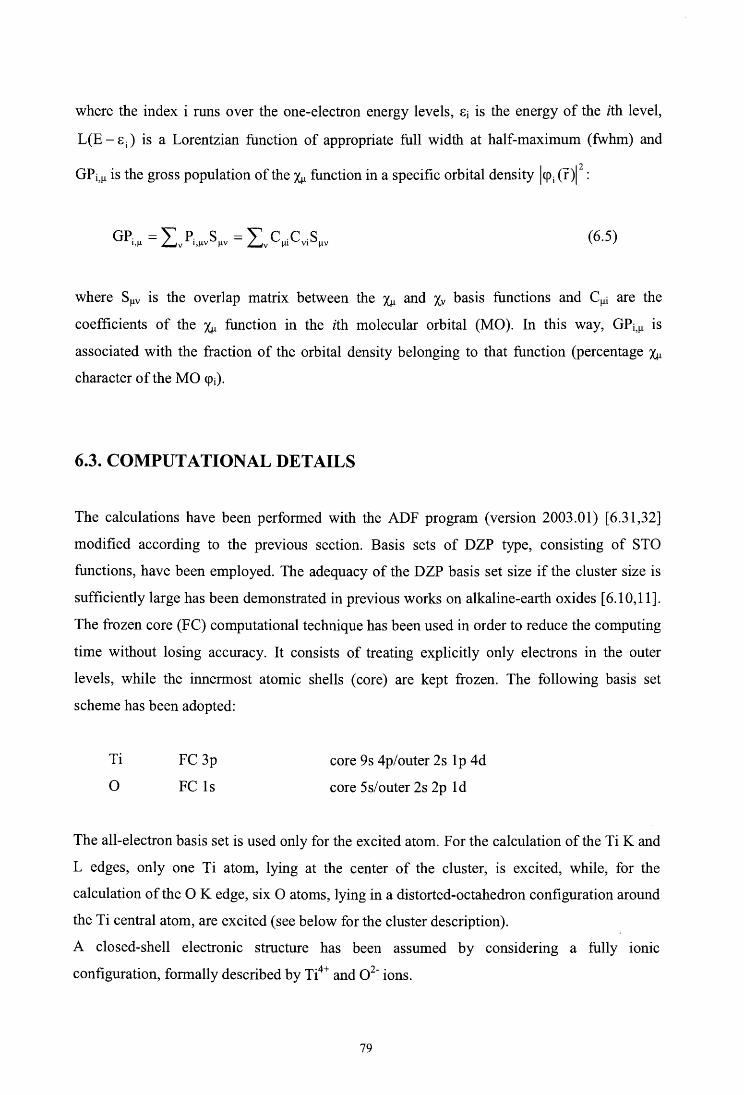
where the index i runs over the one-electron energy levels, Ei is the energy of the ith level,
L(E- Ei) is a Lorentzian function of appropriate full width at half-maximum (fwhm) and
GPi,µ is the gross population ofthe Xµ function in a specific orbitai density lcpi o=)j1:
(6.5)
where Sµv is the overlap matrix between the Xµ and Xv basis functions and Cµi are the
coefficients of the Xµ function in the ith molecular orbitai (MO). In this way, GPi,µ is
associated with the fraction of the orbitai density belonging to that function (percentage Xµ
character of the MO cpi).
6.3. COMPUTATIONAL DETAILS
The calculations have been performed with the ADF program (version 2003.01) [6.31,32]
modified according to the previous section. Basis sets of DZP type, consisting of STO
functions, have been employed. The adequacy of the DZP basis set size if the cluster size is
sufficiently large has been demonstrated in previous works on alkaline-earth oxides [ 6.1O,11].
The frozen core (FC) computational technique has been used in order to reduce the computing
time without losing accuracy. It consists of treating explicitly only electrons in the outer
levels, while the innermost atomic shells (core) are kept frozen. The following basis set
scheme has been adopted:
Ti
o FC 3p
FC ls
core 9s 4p/outer 2s 1 p 4d
core 5s/outer 2s 2p ld
The all-electron basis set is used only for the excited atom. For the calculation of the Ti K and
L edges, only one Ti atom, lying at the center of the cluster, is excited, while, for the
calculation of the O K edge, six O atoms, lying in a distorted-octahedron configurati on around
the Ti centrai atom, are excited (see below for the cluster description).
A closed-shell electronic structure has been assumed by considering a fully 10mc
configuration, formally described by Ti4+ and 0 2- ions.
79

The LB94 [6.33] exchange-correlation potential with the ground state (GS) electron
configuration has been employed. It has been chosen because of its correct asymptotic
behavior, which is a necessary condition for a good description of virtual orbitals. The SAOP
exchange-correlation potential is also characterized by a correct asymptotic behavior, and its
performance for the description of the XAS spectra has been tested in a previous work [6.8];
the comparison with the LB94 results has not revealed apparent dependency from the
potentials, apart from a large shift in the absolute energy scale, due to the strong
underestimate of the SAOP excitation energies with respect to the experimental values. It has
been pointed out in the literature [6.34,35] that the inclusion of core hole effects in cluster
calculations is essential for a good reproduction of XAS spectra, in particular for the K edge,
to account for the charge rearrangement occurring in the response of core hole formation.
These are final state effects associated with the many-body character of the wave function,
and they can be introduced in the calculation both explicitly through the use of relaxed
orbitals to describe the final states, as in the i1SCF scheme, and through the configuration
mixing. In the case of the TDDFT formalism, the configuration mixing is explicitly included
only at one-hole one-particle (lh-lp) level, although higher excitation levels can be in
principle included indirectly within the exchange-correlation response kemel [6.28]. In the
present case, we are confident that the ALDA employed to represent the exchange-correlation
kemel is not actually able to recover relaxation effects via higher-energy order excitations. On
the other hand, previous experience on core hole ionization, where relaxation is even more
important than in the core excitations [6.36,37], has indicated the good performances of the
LB94 exchange-correlation potential both at the KS [6.36] and TDDFT [6.37] levels.
Moreover, we have tested in our previous work on MgO [6.10] the VWN potential [6.38] with
the transition state (TS) configuration, which consists of removing half an electron from the
core orbitai, to assess the importance of core hole relaxation, which is not accounted for with
the GS configuration of the LB94 potential. Only minor differences with respect to the LB94-
GS results have been observed in the lower-energy regi on, in particular an increase of the pre-
edge intensity at the Mg K edge using the VWN-KS scheme. However, the inclusion of
response effects through the TDDFT formalism appears more important for the quality of the
results, in particular in the case of degenerate edges.
The exchange-correlation kemel is approximated within the usual ALDA scheme, and only
excitations with singlet spin symmetry have been considered, since all of the clusters have a
closed-shell electronic structure.
80
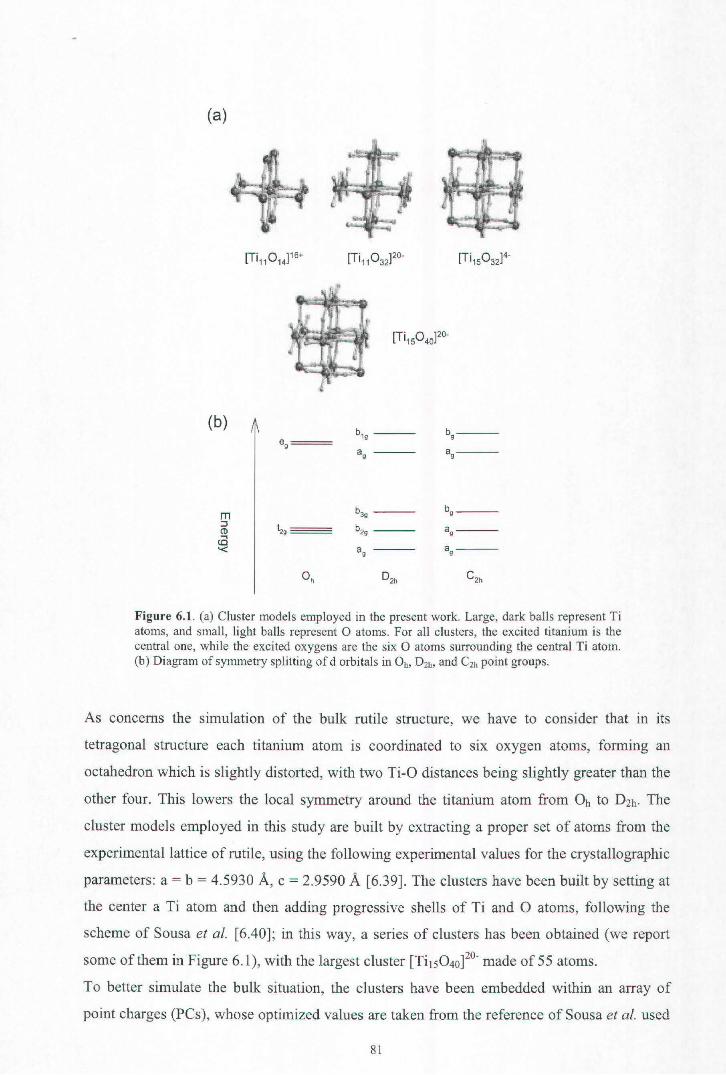
(a)
(b)
m b3g bg :i
Ì:!g b2g ag Cl> ..... CO '< ag ag
oh 02h c2h
Figure 6.1. (a) Cluster models employed in the present work. Large, dark balls represent Ti atoms, and small, light balls represent O atoms. For all clusters, the excited titanium is the centrai one, while the excited oxygens are the six O atoms surrounding the centrai Ti atom. (b) Diagram of synunetry splitting of d orbitals in Oh, D2h, and C2h point groups.
As concems the simulation of the bulle rutile structure, we have to consider that in its
tetragona! structure each titanium atom is coordinated to six oxygen atoms, forming an
octahedron which is slightly distorted, with two Ti-O distances being slightly greater than the
other four. This lowers the loca! symmetry around the titanium atom from Oh to D2h· The
cluster models employed in this study are built by extracting a proper set of atoms from the
experimental lattice of rutile, using the following experimental values for the crystallographic
parameters: a = b = 4.5930 A, c = 2.9590 A [6.39]. The clusters have been built by setting at
the center a Ti atom and then adding progressive shells of Ti and O atoms, following the
scheme of Sousa et al. [6.40]; in this way, a series of clusters has been obtained (we report
some ofthem in Figure 6.1), with the largest cluster [Ti150 40]2°- made of 55 atoms.
To better simulate the bulle situation, the clusters bave been embedded within an array of
point charges (PCs), whose optimized values are taken from the reference of Sousa et al. used
81
also to obtain the atomic coordinates [ 6.40]. Following that scheme, the cluster [Ti06]8- is
embedded within an array of 4 70 PCs, and for larger clusters, successive shells of PCs are
substituted by Ti and O atoms, respectively, so that the cluster [Tii 50 40]20- is embedded within
an array of 422 PCs; the sum of the cluster nuclearity and the PCs number is constant and
equal to 477. The cluster charge plus PCs makes substantially a neutral object with deviations
less than 0.23 au for the largest cluster. The use of this set of PCs forces the symmetry of the
system to lower from D2h (the real symmetry of rutile) to C2h, because of the presence of PCs
that are equivalent for their positions but not for their absolute values.
The use of embedding in terms of PCs is a simple but efficient way to describe the Madelung
potential in ionie materials. It has been discussed for surface cluster models in ref. 6.41 and
analyzed for various phenomena with respect to the size of the cluster. In particular, the study
suggests that the inclusion of the long range Coulombic interactions is essential when the
clusters are small. The importance of using PCs to describe cluster models which simulate the
bulk of alkaline-earth oxides has been observed as decisive in our previous works [ 6.1O,11] in
particular, the clusters in the absence of embedding in generai give rise to unphysical open-
shell structures which are not suitable to model the bulk situation. The use of PCs could be
less obvious for materials in which the bonding has a mixed ionic-covalent character, like in
Ti02 [6.41], and may depend on the properties of interest. The series of clusters designed to
represent the Ti02 bulk has allowed the evolution of the calculated XAS spectra with the size
of the cluster to be followed (both Ti 1 s and Ti 2p spectra have been calculated for the series ),
and therefore with the long range effect of the extemal potential. This analysis has shown that
the [Ths040]20- cluster is suitable for a realistic description of the core excitation of the Ti
centrai metal atom. When the convergence of the spectral features is reached, the dimension
of the cluster is considered sufficiently large to ensure a substantial independency of the
calculated spectroscopic properties on the extemal potential represented with PCs.
The cluster [Ths040]20- is built up by setting three shells of Ti atoms and eight shells of O
atoms around the centrai Ti atom. The calculation of Ti 1 s and 2p core excitations is
straightforward, because only the centrai Ti atom of the cluster has to be excited. The
calculation of the O K edge spectrum requires instead the excitation of the core electrons of
the six oxygen atoms surrounding the centrai Ti (see Figure 6.1 ). These six atoms are grouped
into four equivalent "equatorial" atoms (distance Ti-O= 1.93 A) and two equivalent "apical"
atoms (distance Ti-O = 2.01 A). For the sake of computational efficiency, the most
convenient choice is to excite the four equatorial and two apical oxygens separately and then
superimpose the two excitation spectra ( equatorial and apical), obtaining the final O K edge
82

spectra. This procedure is correct only if there is no coupling between the nonequivalent
oxygen atoms. This has been verified performing a calculation of the O K edge spectrum
obtained by promoting the excitation of the six O atoms in the same step. These test
calculations have been performed using the intermediate [Ti11 0 14]16+ cluster (see Figure 6.1 ),
and the results obtained show that the spectra obtained with the two different procedures are
substantially equivalent.
The calculated spectra have been convoluted with Gaussian functions in order to facilitate the
comparison with the experiments, while the calculated DOS profiles have been convoluted
employing Lorentzian functions. The fwhm values employed are reported in the captions of
the figures.
6.4. RESULTS AND DISCUSSION
The Ti02 oxide has a nominally 3d0 ground state configuration which would correspond to a
fully ionie limit. However, as a result of the Ti-O covalent interaction, the Ti 3d band contains
a contribution from the O 2p orbitals (usually referred to as the O 2p band at lower energy)
and, at the same time, a small contribution of Ti 3d orbitals is present in the O 2p bonding
states. If we consider the simplest cluster representation of a titanium atom surrounded by six
oxygen nearest neighbors [Ti06]8-, then we obtain a schematic diagram of the lowest
unoccupied MOs, as reported in Figure 6.1 (panel b ). In octahedral Oh symmetry, the crystal
field splitting separates the two lowest unoccupied levels (mostly Ti 3d with some O 2p
character) into two groups: the 3-fold t2g and 2-fold eg. The lowering of the symmetry to D2h
causes both of these levels to split as shown. Higher in energy are the a1g and t1u antibonding
orbitals which represent the virtual counterpart of the completely filled bonding combination
between the Ti 4sp states and the O 2p states. When considering the cluster model [Tii 5040]20
-
employed in the present work, it is convenient to refer to the partial density of the unoccupied
states (PDOS) in order to analyze the nature of the virtual states. Figure 6.2 (panel a) reports
the PDOS (ns, np, and nd for Ti and np for O) for this cluster; the PDOS refers to the sum of
all n orbitai components provided by the basis set employed, therefore allowing a clear
representation of the various contributions of the atomic orbitals (AOs) to the virtual
molecular orbitals (MOs). As we can see, the nature of the virtual orbitals agrees with the
previous description of the electronic structure: the low-lying virtual MOs are dominated by
the Ti 3d component with a significant O 2p participation, confirming the mixing of the Ti 3d
83
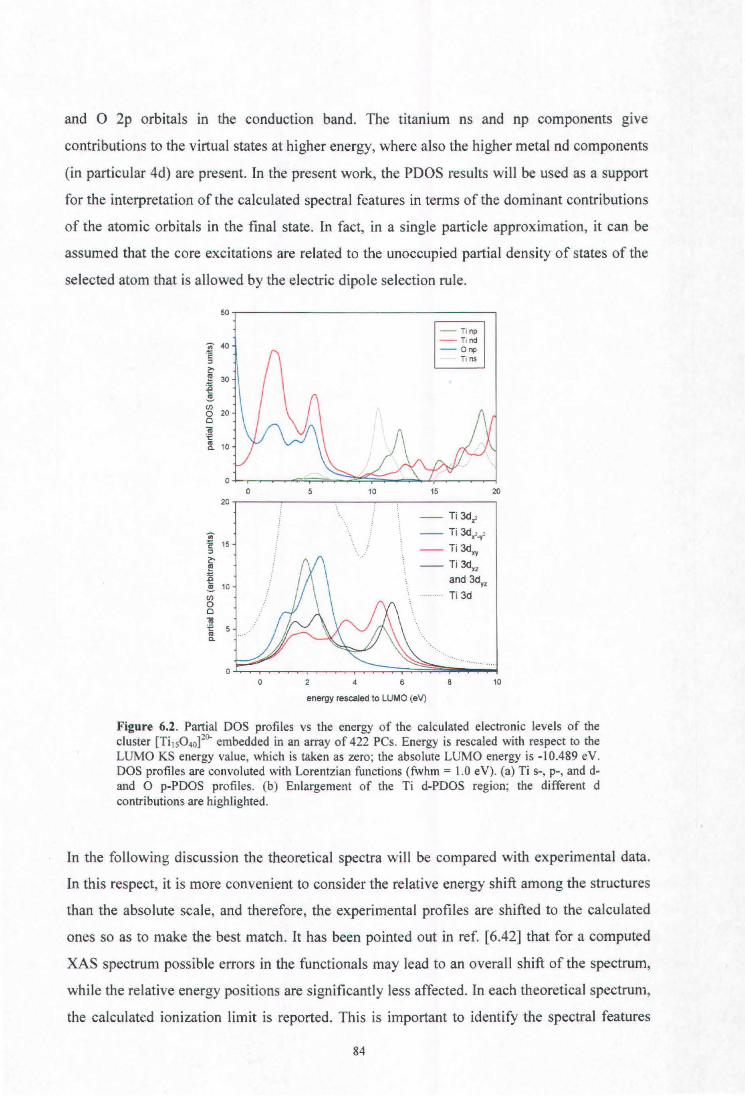
and O 2p orbitals in the conduction band. The titanium ns and np components give
contributions to the virtual states at higher energy, where also the higher metal nd components
(in particular 4d) are present. In the present work, the PDOS results will be used as a support
for the interpretati on of the calculated spectral features in terms of the dominant contributions
of the atomic orbitals in the final state. In fact, in a single particle approximation, it can be
assumed that the core excitations are related to the unoccupied partial density of states of the
selected atom that is allowed by the electric dipole selection rule.
50
'iiì 40 ~ " ~ !'! ~
30
~ cn o 20 o «i :;:: .. Q. 10
o o
20
~ 15 ·;: " ~ !'! :e ~ 10 cn o o «i :;:: 5 .. Q.
o o
'
5 10
- Ti np - T1nd - Onp
T1 ns
15
- Ti 3dt - Ti 3dx'-1' - Ti 3dl<Y -Ti3d.,
and 3dyz ······· · Ti 3d
4 6
energy rescaled to LUMO (eV)
8
20
10
Figure 6.2. Partial DOS profiles vs the energy of the calculated electronic levels of the cluster [Ti150 40]20- embedded in an array of 422 PCs. Energy is rescaled with respect to the LUMO KS energy value, which is taken as zero; the absolute LUMO energy is - I 0.489 e V. DOS profiles are convoluted with Lorentzian functions (fwhm = I .O e V). (a) Ti s-, p-, and d-and O p-PDOS profiles. (b) Enlargement of the Ti d-PDOS region; the different d contributions are highlighted.
In the following discussion the theoretical spectra will be compared with experimental data.
In this respect, it is more convenient to consider the relative energy shift among the structures
than the absolute scale, and therefore, the experimental profiles are shifted to the calculated
ones so as to make the best match. lt has been pointed out in ref. [6.42] that fora computed
XAS spectrum possible errors in the functionals may lead to an overall shift of the spectrum,
while the relative energy positions are significantly less affected. In each theoretical spectrum,
the calculated ionization limit is reported. This is important to identify the spectral features
84

lying above the threshold which have to be considered with caution. In fact, the virtual final
orbitals above edge are unbound and the LCAO-MO approach in a finite basis set is not
capable of properly describing them. Only when the coupling between the discrete virtual
orbitals generated by the present approach and the nonresonant continuum, not included, is
weak it can be assumed that the discrete transitions calculated above edge may afford a
qualitative estimate of the shape resonances observed in the cross section, at least in the
lower-energy range. For this reason, we consider only the theoretical results relative to an
energy range extending up to about 20 e V above the calculated ionization limit.
15
ò ..- 10 ..:..
5
15
ò 10 ..:..
5
(b)
82 d'-....L...o••r-r-....
/! B1_,/·/ ( /
/ _,/ I -
A2. A3 · / ·""'· ....... J I .._. ·-· I
A.!.,·,...-, --·'/ _...-:
4880 4885 4890 4895 4900 4905 4910 4915 4920
ò
2.0 ....--------------~..--------..----.
(e)
1.5
A3
1.0
0.5
!/ /I .,
1, /I ., ,,
f 4 -~ ;i ~"-e-I
O.O +-.--....-=:,.;._,,_~-.--J...,..1L1.J.µ...u.,..L.....,LL..,.--L.+-..::;:r::::-i--F~...U.-~ 4880 4885 4890 4895 4900
calculated excitation energy (eV)
Figure 6.3. Ti ls excitation spectra for the cluster [Ti150 40]20
- embedded in an array of 422 PCs. Vertical dotted line: DFT-KS ionization threshold (opposite eigenvalue): 4896.961 eV. Excitation profiles are convoluted with Gaussian functions (fwhm = 1.5 eV). (a) Solid line, KS spectrum. (b) Solid line, TDDFT spectrum; dash-dotted line, experiment [6.17]; dashed line, experiment [6.43]. (e) solid line, TDDFT spectrum, pre-edge region; experimental profiles, see panel b.
85

6.4.1. Metal K edge spectrum
Several experimental investigations of the Ti K edge spectrum by X-ray absorption
spectroscopy and electron energy loss spectroscopy are present in the literature; we report
only the experimental data from refs. [ 6.17] and [ 6.43] in Figure 6.3 for comparison with the
TDDFT calculated spectrum (lower panel). The experimental spectrum [6.17] shows well
resolved structures: three weak pre-edge peaks (labeled Al, A2, and A3) followed by features
(labeled Bl, B2, B3, and B4) on the higher-energy part of the rising edge. The origin of the
three pre-edge features has been largely debated, and different explanations have been
proposed in the literature [6.14,15,17,21,25,44,45]. Experimental studies based on the angular
dependence of the XAS spectrum of the Ti K edge [6.15,46] have indicated the sensitivity of
the Al peak, and to a lesser extent of the A2 peak, to the orientation in a way characteristic of
a quadrupolar transition. The parallel absence of any angular dependence of the A3 peak has
been assigned to a purely dipolar origin. This analysis is supported by a recent experimental
study of the resonant Auger spectrum taken at the Ti K edge [ 6.4 7] which allows the dipolar
and quadrupolar contributions in the pre-edge region to be resolved as being distinct Auger
peaks. The experimental data have been reproduced by different theoretical approaches which
consider both dipolar and quadrupolar transitions in the calculations as well as the
polarization dependence of the spectra [6.23,48,49]. These studies explain that the Al peak is
only quadrupolar (ls ---+ 3d (t2g)), the A2 peak is dipolar in nature but includes also a little
quadrupolar component (ls---+ 3d (eg)), while the A3 peak is a pure dipolar component.
The present calculated TDDFT spectrum models correctly the major spectral features, both in
the below edge region and above the ionization limit. Our calculations do not consider the
treatment of the quadrupole transitions; therefore, the present interpretation is based on the
dipole selection rule. This allows transitions from the Ti 1 s core orbi tal to unoccupied orbitals
with contribution from p atomic components ofthe centrai metal atom which is expected to be
mapped by the calculated oscillator strength/ The partial density of virtual states reported in
Figure 6.2 shows that the Ti p contribution to the low-lying final states, of mainly Ti 3d
character, is very low, and this can be related to the small intensity of the pre-edge features
calculated at the TDDFT level. The TDDFT features are associated to transitions toward
orbitals with mainly metal 3d character of the higher shell Ti atoms which can mix with the
4p orbitals of the absorbing atom, on the basis of symmetry consideration, in agreement with
previous attributions [6.21]. In particular, the 3d orbitals of the Ti atoms are split by the
crystal field essentially into two manifolds, often indicated as t2g- and eg-like molecular
86

orbitals, which are substantially maintained in the lowest D2h and C2h symmetry, as suggested
by the orbitai diagram sketched in Figure 6.1. This accounts for the calculated double-peaked
structure which correctly describes the A2 and A3 experimental features, in particular as
concems its energy width, which is about 3.6 eV in the calculation (3.1 e V in the experiment
[6.17]).
The weak Al lower-energy peak observed in the experiment, and attributed to the ls ~ 3d
(t2g) quadrupolar transition as before emphasized, is absent in our calculated spectrum. Since
the present computational scheme includes only dipolar transitions, the TDDFT results could
indirectly support such a hypothesis. As concems the structures above the ionization threshold,
a qualitative agreement between the TDDFT results and the experimental data is found,
although the theoretical features tend to be too sharp with respect to the experimental profile,
due to an artifact of the continuum discretization explained in the previous paragraph. A slight
overestimate of the energy separation between the features calculated below and above the
ionization threshold is also observed with respect to the experimental profile. The calculated
transitions are toward final states of p character from the neighboring Ti atoms with important
contributions also from the 4p orbitai of the centrai Ti atom, and this is responsible for the
increase of the intensity of these transitions with respect to the below edge ones. The
distribution of the p components relative to the centrai Ti atom in the PDOS of Figure 6.2
accordingly shows the increase of the metal p contribution at the higher-energy side of the 3d
metal regi on. In particular, the first two small peaks calculated around 4900 e V (labeled B 1
and B2 as in the experiment [ 6.17]) are assigned to Ti 4p states, while the two main peaks at
higher energy are associated with transitions to higher-lying states with contribution also from
the 5p component of Ti centrai atom. Finally, we will comment on the results reported in
panel a of Figure 6.3 relative to the calculation performed with the same basis set and
exchange-correlation potential but at the one-electron Kohn-Sham (KS) level. As we can see,
there is no substantial difference with respect to the results obtained at the correlated TDDFT
leve I. This finding is however not surprising, since the initial Ti 1 s orbi tal is not degenerate so
only a small configuration mixing is expected from the TDDFT scheme and the simpler KS
approach is suitable to properly model the K edge spectrum.
6.4.2. Metal L edge spectrum
The theoretical results conceming the Ti 2p excitations are reported in Figure 6.4 together
with the experimental data from refs. [6.17] and [6.50]. In generai, for the metal L edge, the
87
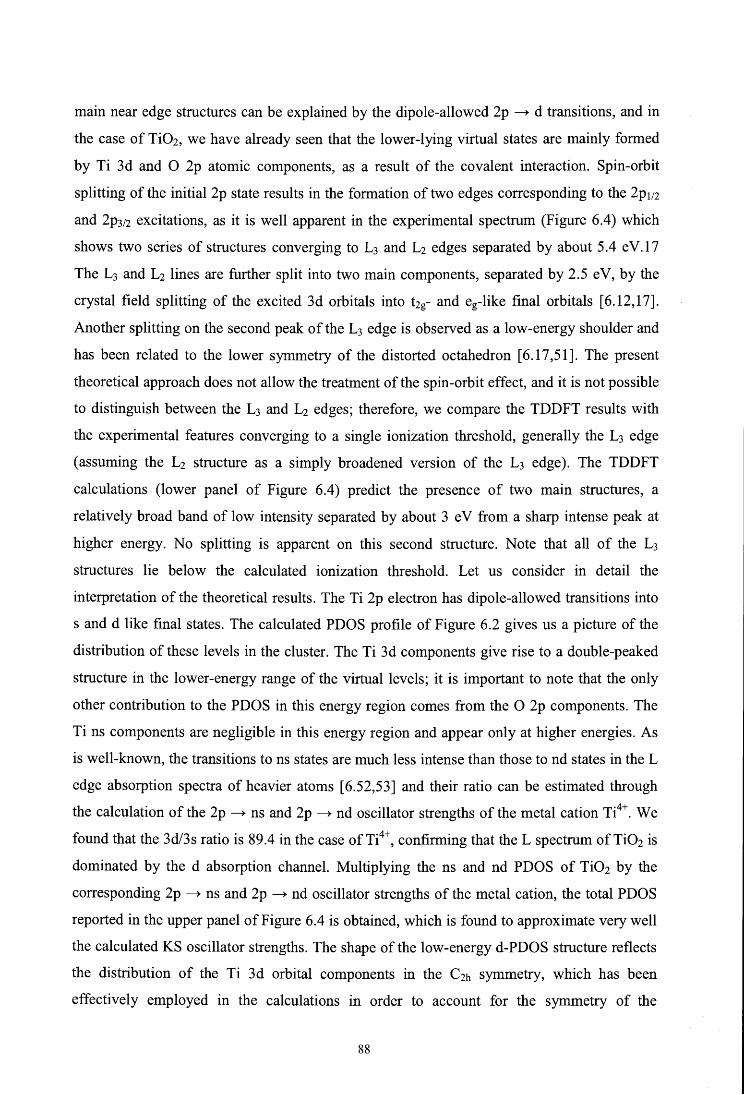
main near edge structures can be explained by the dipole-allowed 2p ~ d transitions, and in
the case of Ti02, we bave already seen that the lower-lying virtual states are mainly formed
by Ti 3d and O 2p atomic components, as a result of the covalent interaction. Spin-orbit
splitting of the initial 2p state results in the formation of two edges corresponding to the 2p112
and 2p3;2 excitations, as it is well apparent in the experimental spectrum (Figure 6.4) which
shows two series of structures converging to L3 and L2 edges separated by about 5 .4 e V .1 7
The L3 and L1 lines are further split into two main components, separated by 2.5 eV, by the
crystal field splitting of the excited 3d orbitals into hg- and eg-like final orbitals [6.12,17].
Another splitting on the second peak of the L3 edge is observed as a low-energy shoulder and
has been related to the lower symmetry of the distorted octahedron [ 6.17 ,51]. The present
theoretical approach does not allow the treatment of the spin-orbit effect, and it is not possible
to distinguish between the L3 and L2 edges; therefore, we compare the TDDFT results with
the experimental features converging to a single ionization threshold, generally the L3 edge
(assuming the L1 structure as a simply broadened version of the L3 edge). The TDDFT
calculations (lower panel of Figure 6.4) predict the presence of two main structures, a
relatively broad band of low intensity separated by about 3 e V from a sharp intense peak at
higher energy. No splitting is apparent on this second structure. Note that all of the L3 structures lie below the calculated ionization threshold. Let us consider in detail the
interpretation of the theoretical results. The Ti 2p electron has dipole-allowed transitions into
s and d like final states. The calculated PDOS profile of Figure 6.2 gives us a picture of the
distribution of these levels in the cluster. The Ti 3d components give rise to a double-peaked
structure in the lower-energy range of the virtual levels; it is important to note that the only
other contribution to the PDOS in this energy region comes from the O 2p components. The
Ti ns components are negligible in this energy region and appear only at higher energies. As
is well-known, the transitions to ns states are much less intense than those to nd states in the L
edge absorption spectra of heavier atoms [6.52,53] and their ratio can be estimated through
the calculation of the 2p ~ ns and 2p ~ nd oscillator strengths of the metal cation Ti4+. We
found that the 3d/3s ratio is 89.4 in the case ofTi4+, confirming that the L spectrum ofTi02 is
dominated by the d absorption channel. Multiplying the ns and nd PDOS of Ti02 by the
corresponding 2p ~ ns and 2p ~ nd oscillator strengths of the metal cation, the total PDOS
reported in the upper panel of Figure 6.4 is obtained, which is found to approximate very well
the calculated KS oscillator strengths. The shape of the low-energy d-PDOS structure reflects
the distribution of the Ti 3d orbita! components in the C2h symmetry, which has been
effectively employed in the calculations in order to account for the symmetry of the
88
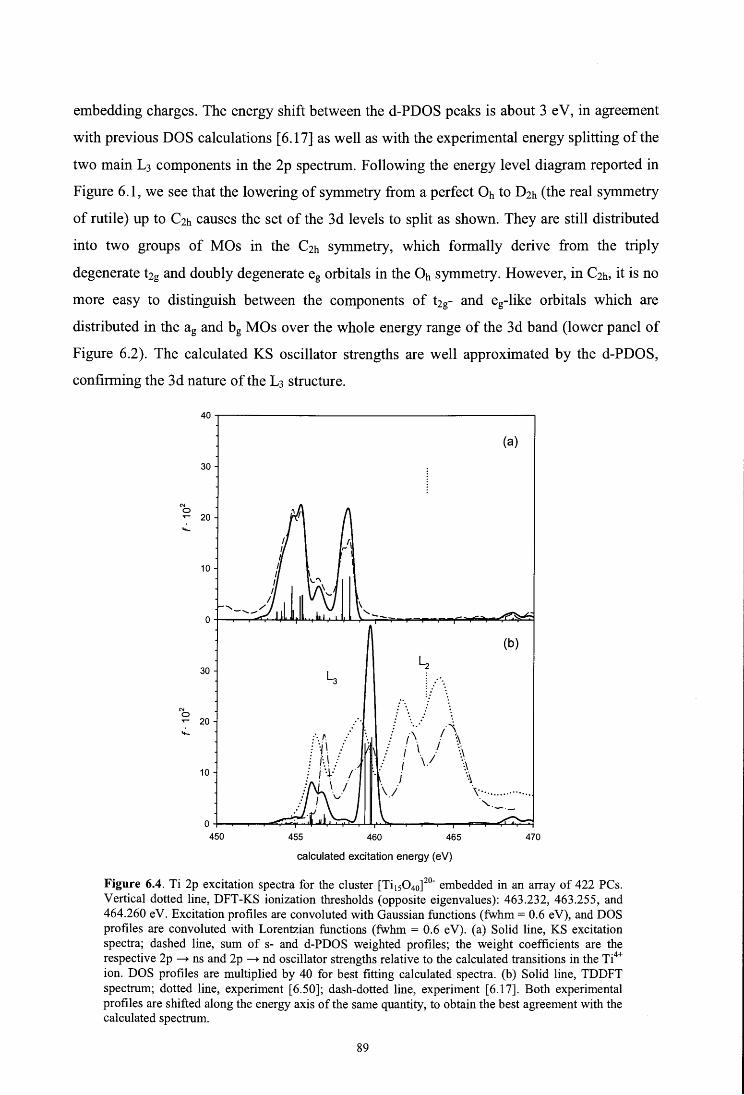
embedding charges. The energy shift between the d-PDOS peaks is about 3 e V, in agreement
with previous DOS calculations [ 6 .1 7] as well as with the experimental energy splitting of the
two main L3 components in the 2p spectrum. Following the energy level diagram reported in
Figure 6.1, we see that the lowering of symmetry from a perfect Oh to D2h (the real symmetry
of rutile) up to C2h causes the set of the 3d levels to split as shown. They are still distributed
into two groups of MOs in the C2h symmetry, which formally derive from the triply
degenerate t1g and doubly degenerate eg orbitals in the Oh symmetry. However, in C2h, it is no
more easy to distinguish between the components of t2g- and eg-like orbitals which are
distributed in the ag and hg MOs over the whole energy range of the 3d band (lower panel of
Figure 6.2). The calculated KS oscillator strengths are well approximated by the d-PDOS,
confirming the 3d nature of the L3 structure.
N o
30
..- 20
..:...
N o
10
30
20
10
450
:'-,f'.
j/· .. ·· .. \
! ........ ., : ·\ I ,
.: I . I ·~ ... i \. . \\ / i \.! \\
i \
(a)
(b)
\ ;' \·················
455 460 465 470
calculated excitation energy (eV)
Figure 6.4. Ti 2p excitation spectra for the cluster [Ti150 40]2°- embedded in an array of 422 PCs. Vertical dotted line, DFT-KS ionization thresholds (opposite eigenvalues): 463.232, 463.255, and 464.260 e V. Excitation profiles are convoluted with Gaussian functions (fwhm = 0.6 e V), and DOS profiles are convoluted with Lorentzian functions (fwhm = 0.6 eV). (a) Solid line, KS excitation spectra; dashed line, sum of s- and d-PDOS weighted profiles; the weight coefficients are the respective 2p ~ ns and 2p ~ nd oscillator strengths relative to the calculated transitions in the Ti4+ ion. DOS profiles are multiplied by 40 for best fitting calculated spectra. (b) Solid line, TDDFT spectrum; dotted line, experiment [6.50]; dash-dotted line, experiment [6.17]. Both experimental profiles are shifted along the energy axis of the same quantity, to obtain the best agreement with the calculated spectrum.
89
It is interesting to compare the KS and TDDFT 2p spectra (Figure 6.4) in order to valuate the
role of the configuration mixing. In fact, it is known that a reliable description of the 2p XAS
spectrum requires the inclusion of the coupling between different excitation channels which
are present in the case of 2p degenerate core holes as well as the 2p core-hole 3d electron
interaction. This is correctly accounted for in the TDDFT calculations and has provento be
important in the theoretical description of the L edge [6.54]. There are significant differences
between KS and TDDFT spectra, in particular as concems the intensity distribution between
the two main structures; at the TDDFT level, we observe a strong reduction of the oscillator
strength for the transitions contributing to the first peak and a parallel increase of the second
peak, whose intensity concentrates on three main lines. The analysis of the TDDFT final
states allows this behavior to be interpreted. Every final state of the first peak is described by
a significant mixing of several configurations associated to transitions toward the low-lying
virtual orbitals which are mainly contributed by 3d orbitals of the higher shell of Ti neighbors.
The calculated oscillator strength, which directly maps the contribution to the final MOs of
the 3d orbitals centered on the centrai Ti atom, is therefore low and is furthermore distributed
over a great number of final states by the configuration mixing. Also, the small bump
appearing as a higher-energy tail of the first peak can be characterized in an analogous way.
This is consistent with an analysis on the electronic structure of the Ti02 cluster in ref. [ 6.21]
which shows that the shells of higher shell of neighboring atoms (successive Ti shells plus
surrounding oxygen atoms) strongly interact with each other and cause MOs to overlap,
forming extended energy bands made up of 3d metal orbitals and 2p oxygen orbitals. The
three higher-energy states of the second high structure have instead a different
characterization: they are dominated by the configuration associated to the transition toward
final MOs with prevalent contribution from the 3d orbitals of the Ti centrai atom and
therefore acquire a stronger oscillator strength than the lower-energy transitions. The
comparison of TDDFT results with the experiment is not quantitative, in particular as
concems the underestimate of the intensity of the first structure. W e are led to ascribe this
discrepancy in part to the lack of relativistic effects in the calculation; in fact, although the
two components L3 and L1 are quite well separated, the crystal field splitting of the two main
peaks (3 eV) is not very different from the spin-orbit splitting (5.4 eV). Therefore, it is
expected that the spin-orbit coupling redistributes the spectral intensity over the two series of
L3 and L2 transitions.
In summary, the configuration m1xmg provided by the TDDFT approach significantly
redistributes the intensity of the below edge 2p transitions over fewer main lines. This
90

behavior has also been found for the 2p metal spectra of alkaline-earth oxides [ 6.11]. The
discrepancy with the experiment still present in the TDDFT results can probably be ascribed
to the lack of an explicit treatment of the spin-orbit effects. For 3d systems, the L1 and L3
edges are in fact quite different, principally due to the coupling of the 2p core wave function
and the 3d valence wave function. These effects (the so-called "multiplet effects") have the
same order of magnitude of the 2p spin-orbit coupling; therefore, mixing and reordering of the
L1,3 edges occur [6.55]. The inclusion of the spin-orbit coupling is responsible for a
redistribution of the spectral intensity over the two L2 and L3 series of transitions, as has been
proven in the case of the TiC4 molecule for which the TDDFT approach extended to the
relativistic two-component zero-order relativistic approximation (ZORA) has been employed
[6.56]. The application of the ZORA TDDFT approach to the treatment of the 2p edge of
transition metal oxides can be addressed as a future fundamental step toward a quantitative
description of their XAS spectra.
W e would finally comment on the further splitting ( of about 1 e V) on the higher-energy peak
ofthe L3 edge which appears as a low-energy shoulder in the experiment [6.17]. In terms of a
MO picture, it could represent a splitting of the eg band due to the lowering of symmetry from
Oh to D2h in rutile. However, no significant splitting is discemible in our calculations nor in
previous theoretical results [ 6.17 ,57]. Such a splitting could affect the orbi tal energies by less
than 0.1 eV, compared with those ofa perfect octahedron [6.57] which is too small ofa value
to explain the experimental result. This is in agreement with our calculations which provide a
maximum splitting of 0.4 e V for the lines contributing to the higher-energy L3 peak. Optical
absorption measurements on related systems have been used to explain the "eg splitting" in
terms of a dynamic J ahn-Teller splitting, that is, the coupling of the electronic and vibrational
states due to the excited state [ 6.17, 18].
6.4.3. Oxygen K edge spectrum
The KS and TDDFT theoretical results relative to the O K edge of Ti02 are compared in
Figure 6.5 with the experimental spectra [6.17,50], in the same way as in previous figures.
The experimental spectrum can be divided into two regions: the below edge one, split into
two components with comparable intensities, and the above threshold region, separated by a
deep minimum from the first region and extending over about 15 eV. The theoretical results
reproduce correctly the two pre-edge peaks as well as the absorption profile in the higher-
energy region. It has to be noted that the KS and TDDFT results are very similar; this
91

emphasizes that the interaction of the oxygen core hole with the oxygen or titanium valence
electrons can be neglected and a simple single particle scheme can be already effective for the
description of the O 1 s spectrum, in contrast with the Ti 2p XAS absorption. As concems the
attribution of the structures provided by the calculations, it is worth mentioning that for the
oxygen 1 s edge the dipole selection rule states that only oxygen p character can be reached. In
a purely ionie model for the oxide, the configuration of the oxygen is ls22s22p6 and the ls---+
2p channel would be closed in the XAS. The covalent Ti-O interaction reduces the O 2p
character in the filled states so that the strength of the O 1 s signal in the spectrum can be
related to the degree of covalency, which is known to be quite considerable in the case of
transition metal oxides. The two peaks of the pre-edge region are related to the dipole
transitions to band states dominated by titanium 3d states of t2g-eg symmetry separated by the
"ligand field" splitting [6.20]. We have already emphasized the nature of these low-lying
virtual orbitals discussing the Ti 2p transitions, which map the Ti 3d contribution of the
conduction band, while the O 1 s transitions map the O p contributi on to the same virtual
levels. The present calculated splitting between these two peaks is around 2.6 eV which is
roughly the same value observed between the t2g- and eg-like bands in the corresponding Ti L
edge spectrum. This value also closely fits the experimental one [ 6.17]. The oxygen p
character of the virtual states can be inferred by the analysis of the np PDOS (2p and 3p
components) reported in Figure 6.5 (upper panel). The np partial DOS is compared with the
KS spectrum, which can be envisaged in a first approximation as an image of the oxygen p
projected unoccupied density of states. As we can see, the partial DOS for the oxygen site
shows a significant O 2p contribution in the energy region of the conduction band. A
significantly lower oxygen 3p contribution is present in this energy region. The envelope of
the oxygen partial DOS results in two main peaks of equal height separated by about 2.5 e V,
in agreement with the KS calculated O K edge spectrum. Therefore, although the transitions
involve oxygen orbitals, the below edge structure of the O 1 s spectrum is determined by the
electronic structure of the 3d titanium ion. The calculated intensities for the two peaks are
very similar, in accord with the measured spectrum and the partial DOS. This result agrees
also with the analysis of the peak intensity ratio in terms of the different hybridization of the
O 2p orbitals with the t1g- and eg-like Ti d orbitals [6.16,19], in particular considering the
distortion of the octahedral geometry and the dispersion of the 3d titanium character over the
valence band.
The second region above the threshold is characterized by a structure extending between 535
and 550 eV in our calculations which agrees well with the experimental profile, apart from an
92
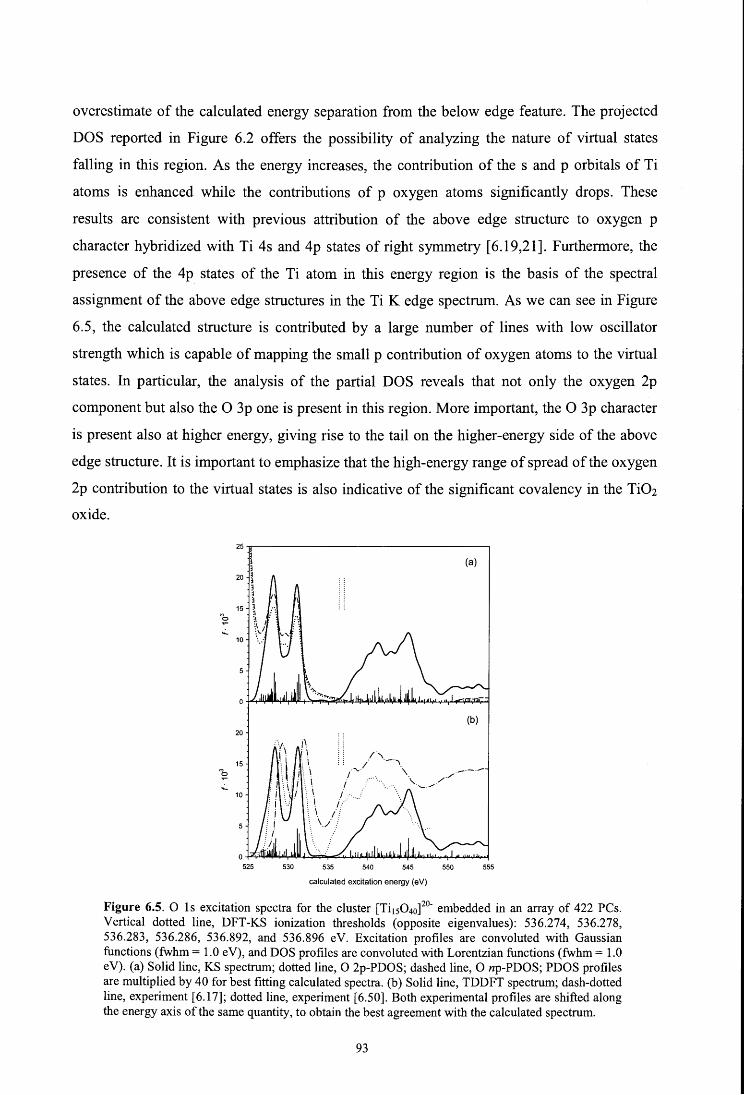
overestimate of the calculated energy separation from the below edge feature. The projected
DOS reported in Figure 6.2 offers the possibility of analyzing the nature of virtual states
falling in this region. As the energy increases, the contribution of the s and p orbitals of Ti
atoms is enhanced while the contributions of p oxygen atoms significantly drops. These
results are consistent with previous attribution of the above edge structure to oxygen p
character hybridized with Ti 4s and 4p states of right symmetry [ 6.19 ,21]. Furthermore, the
presence of the 4p states of the Ti atom in this energy region is the basis of the spectral
assignment of the above edge structures in the Ti K edge spectrum. As we can see in Figure
6.5, the calculated structure is contributed by a large number of lines with low oscillator
strength which is capable of mapping the small p contribution of oxygen atoms to the virtual
states. In particular, the analysis of the partial DOS reveals that not only the oxygen 2p
component but also the O 3p one is present in this region. More important, the O 3p character
is present also at higher energy, giving rise to the tail on the higher-energy side of the above
edge structure. It is important to emphasize that the high-energy range of spread of the oxygen
2p contribution to the virtual states is also indicative of the significant covalency in the Ti02
o xi de.
(b) 20
/''\ 15 . . / ._.,\.
/....... \. i \.
i.
"'o
..:.. 10
/.:"
525 530 535 540 545 550 555
calculated excitation energy (eV)
Figure 6.5. O 1 s excitation spectra for the cluster [Ti150 40]2°- embedded in an array of 422 PCs. Vertical dotted line, DFT-KS ionization thresholds (opposite eigenvalues): 536.274, 536.278, 536.283, 536.286, 536.892, and 536.896 eV. Excitation profiles are convoluted with Gaussian functions (fwhm = 1.0 e V), and DOS profiles are convoluted with Lorentzian functions (fwhm = 1.0 eV). (a) Solid line, KS spectrum; dotted line, O 2p-PDOS; dashed line, O np-PDOS; PDOS profiles are multiplied by 40 for best fitting calculated spectra. (b) Solid line, TDDFT spectrum; dash-dotted line, experiment [6.17]; dotted line, experiment [6.50]. Both experimental profiles are shifted along the energy axis ofthe same quantity, to obtain the best agreement with the calculated spectrum.
93

Finally, it is remarkable to note that the final states in all three transitions (ls, 2p, and O ls)
are the same, namely, the t2g- and eg-like antibonding orbitals. These two MOs are a
combination of Ti 3d and O 2p orbitals probed by the Ti L2,3 and O K edges, respectively;
therefore, the strong calculated transition strengths account for the nature of these final states,
while the relative weakness of the peaks in the Ti K edge is explained by the absence of p
character in these molecular orbitals near the metal atom. The virtual states above edge also
have their counterparts both in the O K edge spectrum and in the Ti K edge whose transitions
map the amount of p symmetry present.
6.5. CONCLUSIONS
We applied the TDDFT method to the description of core excitation spectra of rutile using a
cluster model to mimic the Ti02 bulk. The Ti K and L edges and O K edge have been
considered. Good agreement with experimental data has been obtained for the Ti and O K
edges. The Ti K pre-edge features are discussed only in terms of dipole-allowed transitions,
with the quadrupolar transitions not being included in the computational scheme; therefore,
the weak Al pre-edge structure, assigned in the literature as being quadrupolar in nature, is
not present in the calculated Ti K spectrum. As concems the Ti L edge spectrum, the
configuration mixing explicitly included in the TDDFT scheme allows the metal 2p
excitations for which the interaction between the degenerate 2p core states as well as the
coupling of the 2p core function and the 3d valence function strongly influences the
distribution of the calculated oscillator strength to be described. The discrepancies with the
experiment still present in the Ti 2p TDDFT results may be associated to the lack of spin-orbit
effects in the computational model.
The agreement between the TDDFT and KS results for the Ti and O K edges emphasizes
instead that these edges can be correctly treated also within a simpler single particle
approximation.
The spectral assignment of the various absorption features is proposed with the help of the
partial density of the virtual states (PDOS) calculated for each core hole considered. The
PDOS gives a graphical representation of the character of the virtual states and can be
qualitatively compared with the one-electron KS spectrum.
All peaks appearing in the Ti and O K edges correspond to transitions to states which have
some amount of p character mixed with 3d metal orbitals. In the case of Ti, symmetry
94
considerations show that the 4p orbitals of the central atom can mix with d orbitals of the
higher neighboring Ti in the cluster and this accounts for the low oscillator strength calculated
for these transitions. In the case of the O K edge, the oxygen 2p orbitals mix with the 3d Ti
orbitals and the 1 s transitions are significantly higher. Then, the differences in the Ti and O
spectra should arise from the outer lying atomic shells, indicating that the long range effects
play an important role in the near edge structures. The Ti 2p and O 1 s spectra map the content
of Ti 3d and O 2p contributions, respectively, which are mixed in the low-lying virtual levels
characterizing the conduction band. The relatively high oscillator strength calculated for the
spectra reflects the covalent nature of the Ti-O bond in the oxide.
The present computational approach appears suitable for a realistic description of the XAS
spectra of transition metal oxides. Further improvements can be addressed for the inclusion of
second-order quadrupolar transitions in the computational scheme, to account for weak
intensity pre-K-edge features often observed in the case of 3d compounds, as well as for the
treatment of the spin-orbit coupling in the 2p spectra of transition metals. In this way, a
complete description of both L2 and L3 edges can be reached which represents a fundamental
step toward a quantitative description of the XAS spectra. This task can be reached through
the application of the ZORA TDDFT approach to the transition metal oxide clusters and is
expected to require significant computational effort that we deserve for future studies.
95
7. TIME DEPENDENT DENSITY FUNCTIONAL INVESTIGA-
TION OF THE NEAR-EDGE ABSORPTION SPECTRA OF
V20s
De Francesco R., Stener M., Causà M., Toffoli D., Fronzoni G., Phys. Chem. Chem. Phys. 8, 4300 (2006).
We have performed Time Dependent Density Functional Theory (TDDFT) calculations
employing a cluster model of the core excitation spectra of vanadium pentoxide, V20s. The
excitation energies and dipole transition moments are determined for all the core edges,
vanadium and oxygen K- and vanadium L-edges, treating them at the same level of accuracy.
The agreement between the TDDFT theoretical spectra and the experimental data is rather
good, particularly at the V and O K-edges. A quantitative reproduction of the fine pre-edge
structures appears more difficult for the V L-edge. The comparison between the TDDFT
results and the results obtained at the simpler one electron Kohn-Sham (KS) level indicates
that the V and O K edges can be correctly described within a single particle approximation
(KS), while the strong modification of the V L-edge structures from the KS to the TDDFT
description emphasizes the importance of configuration mixing to treat the metal 2p
excitations. The origin of the calculated pre-edge features is analyzed in detail with the help
of the atom-projected density-of-states ofthe unoccupied levels. This analysis emphasizes the
V 3d dominant character of the final states in the conduction band, probed by the V L-
absorption. The strong octahedral distorti on of the V 20 5 structure allows the mixing of the 3d
state with the V 4p components, which are mapped by the oscillator strength in the V K-edge
spectrum. The high intensity of the O 1 s transitions reflects the presence of a significant O 2p
component in the conduction band.
7.1. INTRODUCTION
Near-Edge X-ray Absorption Fine Structure (NEXAFS) spectroscopy is a valuable
spectroscopic tool for investigating both the electronic and geometrie structure of condensed
matter. The spectral features arise from the promotion of a core electron into the unoccupied
electronic states of the material that lie near the ionization limit of the specific core state. The
96

relevant excitation processes are govemed by the dipole selection rule, therefore the dominant
structures around the K-absorption edge can be simply interpreted in terms of s -----+- p dipole
transitions, while the L-edge structures are associated to the p -----+- s and the more relevant p --+-
d dipole transitions. Core excitations become particularly interesting for studying transition
metal-based systems because they directly probe the metal d participation in the virtual
orbitals, and therefore details of the d involvement in the bonding [7.1-4]. However, the
NEXAFS structures associated with the d states are often difficult to interpret due to the intra-
atomic correlation responsible for the high number of allowed transitions; furthermore, there
are solid state effects so the resulting spectra often comprise many overlapping structures. In
this respect, a conclusive interpretation of the experimental spectra relies significantly on
theoretical support, however the calculations of spectroscopic properties of transition metal-
based condensed systems constitute a major challenge for any theoretical method, and
although much effort has gone into reproducing the core absorption spectra, a clear, robust
and general method has not yet emerged [7.5-13]. Generally, most experimental spectra at the
K edges can be reproduced reasonably well by one-electron theory and several calculating
techniques exist [7.5]. Challenges instead persist in the description of other edges, in
particular the transition metal L-edge, due to the 3d-3d as well as 2p-3d two particle
interactions, which require the inclusi on of many body effects in the computational scheme.
The Time Dependent Density Functional Theory (TDDFT) represents an essential
improvement over single particle approaches as well as a suitable compromise between
accuracy and computational economy needed to treat large systems. Current TDDFT
implementations can describe valence electron excitations in molecular systems and, more
recently, in solids [7.14-17], however, a computational scheme to extend the applicability of
TDDFT to the core electron excitations has been recently proposed [7.18]. It has been applied
to the simulation of core excitation spectra of both molecules [7.18,19] and condensed
systems, particularly metal oxides [7 .20,21]. In these calculations, the bulk of the metal
oxides were represented through cluster models; this choice has appeared suitable for the
calculations of core excitations that are well localized on a specific atomic site, and therefore
it is reasonable to assume that the description of a limited region of the solid through a cluster
would be sufficient to describe them accurately. The TDDFT scheme employed has fumished
good results for the core excitation spectra of the alkaline-earth oxides [7.20], while some
discrepancies with the experiment, in particular for the metal L-edge spectra, are still present
in the case of Ti02 [7 .21]. On the other hand, the transiti on metal oxides represent the most
difficult class of solids to perform spectroscopic predictions through theoretical calculations;
97

the ionie picture does not adequately describe their electronic structure due to the significant
mixing between the transition-metal d state and the oxygen p state and, furthermore, the
electron-electron interaction has to be correctly accounted for.
In this work, we present a theoretical study of the core excitation spectra of vanadium
pentoxide, V20 5. This is a member of the widely studied vanadium oxide family, whose
geometrie and electronic properties are quite different and extremely interesting both from
basic research and technological points of view [7.22-25]. In particular, V205 has enormous
importance as a catalyst and many microscopie details of its catalytic behaviour are still under
debate, therefore there have been numerous detailed theoretical studies of its electronic
structure [7.26-30]. Spectroscopic techniques involving core excitations can be very useful in
determining the electronic structure and have been the object of more recent research activity,
from both experimental and theoretical points of view [7.31-37]. For example, the V205
surface contains oxygen sites with different geometries and coordinations and their
identification is important for distinguishing the different reaction sites; core level
spectroscopy can provide significant information for identifying the various oxygen sites
[7.35,37]. The crystal structure of V20 5 can be represented as altemating layers containing
either vanadium and bridging oxygen atoms or, altematively, vanadyl oxygen atoms. There
are three differently coordinated oxygen species and each vanadium atom is placed in a highly
distorted environment. The symmetry distorti on of V 20 5 represents a crucial point for the
description and the interpretation of the pre-edge region of the core absorption spectra,
therefore this oxide provides the opportunity to assess the reliability of the computational
approaches. Among the many theoretical works dealing with the simulations of NEXAFS
spectra of V 205, a systematic investigati on of all the possible core edges at the same level of
accuracy is still missing. In this respect, the purpose of this paper is to apply the TDDFT
method with finite cluster models to the calculation of the core excitation spectra of the bulk
V205 at the vanadium K- and L-edges and the oxygen K-edge. It is interesting to compare the
spectral features relative to the three different edges in an attempt to better elucidate the
correlation between the electronic structure and the NEXAFS spectra. The calculated features
are interpreted in terms of the dominant contributi on of the atomi e orbitals to the final virtual
molecular orbitals through the analysis of the unoccupied Partial Density Of States (PDOS)
relative to each core hole considered. The comparison between theoretical and experimental
data allows to test the performance of the computational scheme employed.
98
7.2. THEORETICAL
The TDDFT approach for electron excitations and its implementation in the ADF code have
been described in detail in the literature [7.38,39], so here we just recall the salient steps and
describe the new features. The generai problem is cast in the following eigenvalue equation:
(7.1)
where n is a four-index matrix with elements niacr,jbi;; the indexes consist of products of
occupied-virtual (ia and jb) Kohn-Sham (KS) orbitals, while cr and T refer to the spin variable.
The eigenvalues correspond to squared excitation energies, while the oscillator strengths are
extracted from the eigenvectors Fi [7.38]. The !l-matrix elements can be expressed in terms
ofKS eigenvalues (e) and the coupling matrix K:
(7.2)
The elements of the coupling matrix K are given by:
(7.3)
where cp are the KS orbitals and f :C't (r, r', co) is the exchange-correlation kemel. In this work,
the kemel is approximated according to the Adiabatic Locai Density Approximation (ALDA)
[7.40].
The space spanned by the solutions of the eigenvalue eqn. (7.1) corresponds to the lh-lp
excited configurations, so it is possible to approximate this space by selecting configurations,
keeping only those necessary for an accurate description of the phenomenon, as is customary
in ab initio CI calculations. Thus, in practice, according to the method in ref. [7 .18], the
indexes spanning the occupied orbitals space (i and j) are limited to run only over the core
shell.
Calculations of the spectra at the simpler KS independent particle level have also been
performed. In the KS scheme, the calculation of the dipole transition moment is reduced to a
single integrai between space orbitals in a closed shell system:
99
(7.4)
where Ili is the ground state occupation number of the initial orbital <pi, and <pf is the final
orbital. The relative excitation energies are calculated as differences between the respective ci
and cf KS eigenvalues. The comparison of the results obtained at the single configuration KS
level and at the TDDFT level allows an evaluation of the effect on the spectra of the coupling
between the one electron (lh-lp) configurations included in the TDDFT scheme.
PDOS calculations have been performed in order to provide a pictorial representation of
Mulliken populations related to the virtual molecular orbitals of the clusters. In particular, to
find out ifa given atomic function Xµ contributes strongly to molecular orbitals at certain
energies, one may weigh the different one-electron levels by using the percentage Xµ character.
If the Xµ character is determined by the gross populations, the gross population density of
states form of the PDOS is then obtained:
(7.5)
where the index i runs over the one-electron energy levels, ci is the energy of the ith level;
L(E - ci) is a Lorentzian function of appropriate FWHM and GPi,µ is the gross population of
the Xµ function in a specific orbital density lcpi (r)l 2:
(7.6)
where Sµv is the overlap matrix between the Xµ and Xv basis functions and Cµi are the
coefficients of the Xµ function in the ith molecular orbital (MO). In this way, GPi,µ is
associated with the fraction of the orbital density belonging to that function (percentage Xµ
character ofthe MO cpi).
7.3. COMPUTATIONAL DETAILS
V 20s is characterized by simple orthorhombic lattice structure, with lattice constants a =
11.512 A, b = 3.564 A and e= 4.368 A [7.41]. The primitive cell contains four V atoms and
100
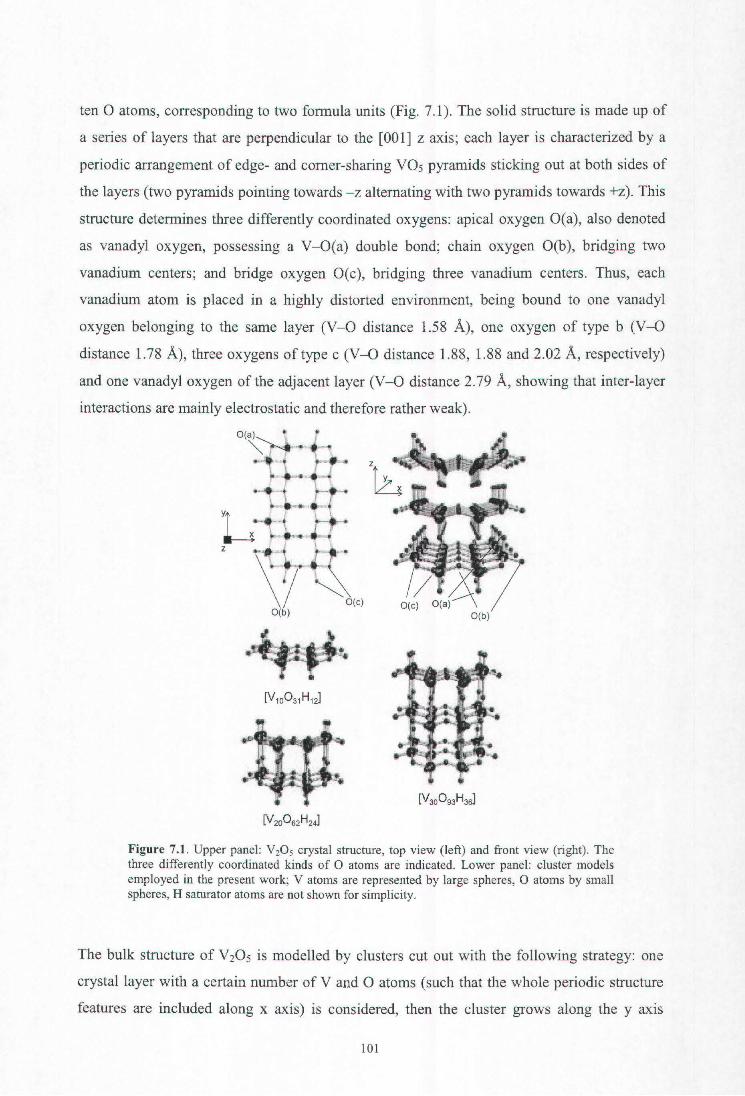
ten O atoms, corresponding to two formula units (Fig. 7 .1 ). The solid structure is made up of
a series of layers that are perpendicular to the [001] z axis; each layer is characterized by a
periodic arrangement of edge- and corner-sharing V05 pyramids sticking out at both sides of
the layers (two pyramids pointing towards - z alternating with two pyramids towards +z). This
structure determines three differently coordinated oxygens: apical oxygen O(a), also denoted
as vanadyl oxygen, possessing a V-O(a) double band; chain oxygen O(b), bridging two
vanadium centers; and bridge oxygen O(c), bridging three vanadium centers. Thus, each
vanadium atom is placed in a highly distorted environment, being bound to one vanadyl
oxygen belonging to the same layer (V-O distance 1.58 A), one oxygen of type b (V-O
distance 1.78 A), three oxygens of type e (V-O distance 1.88, 1.88 and 2.02 A, respectively)
and one vanadyl oxygen of the adjacent layer (V-O distance 2.79 A, showing that inter-layer
interactions are mainly electrostatic and therefore rather weak).
==~ ..... \ .. .--· •
Figure 7.1. Upper pane!: V20 5 crystal structure, top view (left) and front view (rigbt). Tbe three differently coordinated kinds of O atoms are indicated. Lower pane!: cluster models employed in the present work; V atoms are represented by large spheres, O atoms by small spheres, H saturator atoms are not shown for simplicity.
The bulk structure of V 20 5 is modelled by clusters cut out with the following strategy: one
crystal layer with a certain number of V and O atoms (such that the whole periodic structure
features are included along x axis) is considered, then the cluster grows along the y axis
101
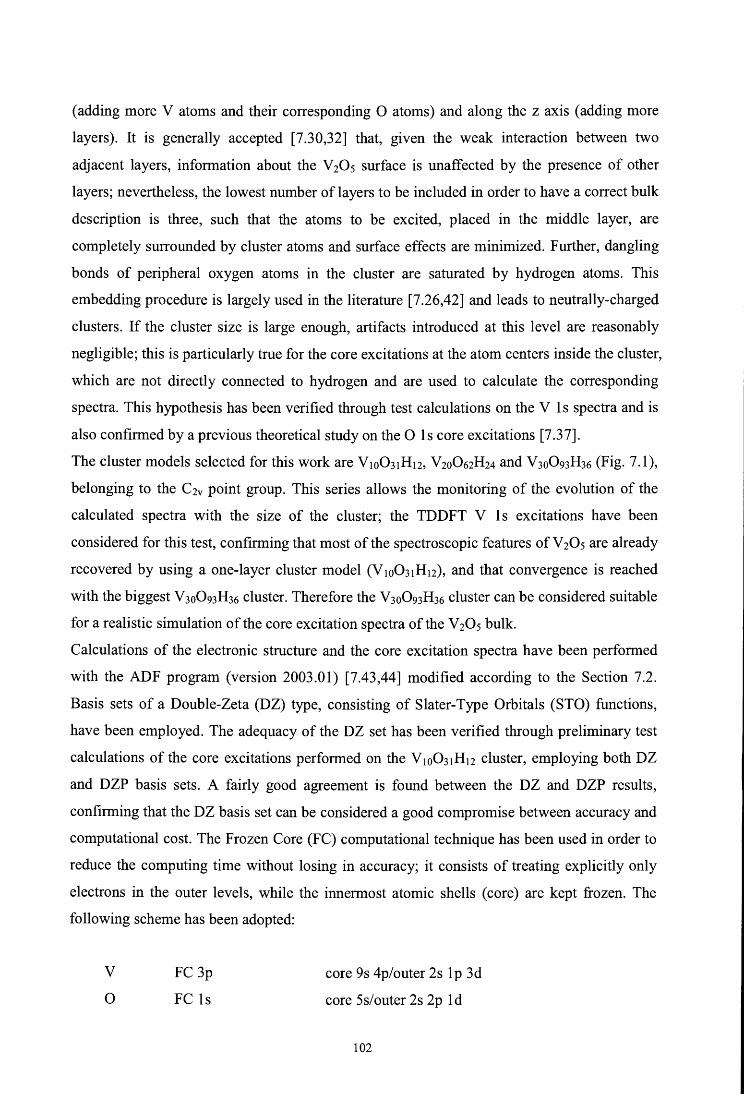
( adding more V atoms and their corresponding O atoms) and along the z axis ( adding more
layers). It is generally accepted [7.30,32] that, given the weak interaction between two
adjacent layers, information about the V20 5 surface is unaffected by the presence of other
layers; nevertheless, the lowest number of layers to be included in order to have a correct bulk
description is three, such that the atoms to be excited, placed in the middle layer, are
completely surrounded by cluster atoms and surface effects are minimized. Further, dangling
bonds of peripheral oxygen atoms in the cluster are saturated by hydrogen atoms. This
embedding procedure is largely used in the literature [7.26,42] and leads to neutrally-charged
clusters. If the cluster size is large enough, artifacts introduced at this level are reasonably
negligible; this is particularly true for the core excitations at the atom centers inside the cluster,
which are not directly connected to hydrogen and are used to calculate the corresponding
spectra. This hypothesis has been verified through test calculations on the V 1 s spectra and is
also confirmed by a previous theoretical study on the O 1 s core excitations [7 .3 7].
The cluster models selected for this work are V100 31H12, V200 62H24 and V30093H36 (Fig. 7.1),
belonging to the C2v point group. This series allows the monitoring of the evolution of the
calculated spectra with the size of the cluster; the TDDFT V ls excitations have been
considered for this test, confirming that most of the spectroscopic features of V 20 5 are already
recovered by using a one-layer cluster model (V100 31H12), and that convergence is reached
with the biggest V 30093H36 cluster. Therefore the V 300 93H36 cluster can be considered suitable
for a realistic simulati on of the core excitation spectra of the V 20 5 bulk.
Calculations of the electronic structure and the core excitation spectra have been performed
with the ADF program (version 2003.01) [7.43,44] modified according to the Section 7.2.
Basis sets of a Double-Zeta (DZ) type, consisting of Slater-Type Orbitals (STO) functions,
have been employed. The adequacy of the DZ set has been verified through preliminary test
calculations of the core excitations performed on the V100 31H12 cluster, employing both DZ
and DZP basis sets. A fairly good agreement is found between the DZ and DZP results,
confirming that the DZ basis set can be considered a good compromise between accuracy and
computational cost. The Frozen Core (FC) computational technique has been used in order to
reduce the computing time without losing in accuracy; it consists of treating explicitly only
electrons in the outer levels, while the innermost atomic shells (core) are kept frozen. The
following scheme has been adopted:
V
o FC 3p
FC ls
core 9s 4p/outer 2s 1 p 3d
core 5s/outer 2s 2p ld
102

The AH-Electron (AE) basis set is used to describe the atom center where the excitation takes
place. Note that the V300 93H36 cluster has two symmetry equivalent V atoms, so calculated
spectra and PDOS profiles have been evaluated for both atoms and finally averaged; there are
also two equivalent O(a) centers, one equivalent O(b) center and four equivalent O(c) centers,
therefore the O 1 s core spectrum has been calculated for each non-equivalent group of oxygen
centers. Finally, the total O 1 s spectrum has been obtained by combining the three O 1 s
spectra using the stoichiometric reciproca! ratios of O(a) : 2 = O(b) : 1 = O(c) : 2. The same
procedure has also been adopted to produce the PDOS profiles.
Conceming the eXchange Correlation (XC) potential, the most appropriate approximation
functionals for calculations of electron excitations are the LB94 [7.45] and the SAOP [7.46]
with the Ground State (GS) electron configuration. These potentials have a correct asymptotic
behaviour, which is a necessary condition for a good description of virtual orbitals. Previous
theoretical calculations of XAS spectra [7.18] have shown that the TDDFT results are not
very sensitive to the choice of these two XC potentials, apart from a large underestimate of
the absolute excitation energies provided by the SAOP potential. In the present work, the
LB94 exchange correlation potential is applied in the Self-Consistent Field (SCF) calculations.
It has been pointed out in the literature [7.4 7 ,48] that the inclusi on of core ho le effects in
cluster calculations is essential fora good reproduction of XAS spectra, in particular for the
K-edge, in order to take into account the charge rearrangement occurring in the response of
core hole formation. In a previous work on MgO [7.49], we tested the VWN potential [7.50]
(which does not have the correct asymptotic behavior) with the Transition State (TS)
configuration, which consists of removing half an electron from the core orbital, in order to
assess the importance of core hole relaxation. Only minor differences with respect to the
LB94-GS results have been observed in the lower energy region of the Mg K-edge spectrum.
Furthermore, previous experience of core hole ionizations, where relaxation is even more
important than in the core excitations [7 .51,52] has indicated the good performances of the
LB94 exchange potential both at KS [7.51] and TDDFT [7.52] levels. Finally, the inclusion of
response effects through the TDDFT formalism appears more important for the quality of the
results, in particular in the case of degenerate edges.
In the present work, the exchange-correlation kernel is approximated within the usual ALDA
scheme, and only excitations with singlet spin symmetry have been considered, since all the
clusters have a closed shell electronic structure.
The calculated spectra have been convoluted with Gaussian functions in order to facilitate the
comparison to the experiments. The calculated PDOS profiles have instead been convoluted
103

with Lorentzian functions. The appropriate FWHM values employed for Gaussian and
Lorentzian functions are reported in the captions of the figures.
1.5
(a) ---- Vnp ............... Vns Vnd
2 -·-·-·- O(a) np ·e: 1.0 O(b) np ::::i ------~ -··-··-··- O(c) np jg --- O(tot) np :.o ~
~ (/) o 0.5 o a..
/\ r I\ .... . \/ \.J V-
·· ... .;_/· ... O.O
o 2 4 6 8 10 12 14 1.5
(b) V 3d x2-y2
--- V 3d z2
------ V3dxz 2 -·-·-·- V3dxy ·e: 1.0 ::::i -··-··-··· V3dyz ~ ............... V3d jg ~ ~ .· . (/)
.... o 0.5 :··. o a..
-1 o 2 3 4 5 6 7
energy rescaled to LUMO (eV)
Figure 7.2. PDOS profiles vs. calculated electronic energy levels of the [V300 93H36] cluster model. Energy is rescaled with respect to the LUMO KS energy value, which is taken as zero; absolute LUMO energy is -11.21 eV. Panel (a): Vs-, p-, d- and differently coordinated O p-PDOS profiles in the CB region. Panel (b): Enlargement of the V 3d-PDOS profiles in the CB regi on; the different 3 d contributions are highlighted. DOS pro fil es are broadened by Lorentzian functions (FWHM = 0.5 e V).
7.4. RESULTS AND DISCUSSION
Fig. 7 .2 shows the PDOS profiles of the V 300 93H36 cluster, calculated at the V site (ns-, np-
and nd-PDOS) and at the three O sites (np-PDOS). The PDOS refers to the sum of all n
orbital components provided by the basis set employed and therefore allows a useful
representation of the various atomi e orbi tal contributions to the virtual molecular orbitals. In a
104
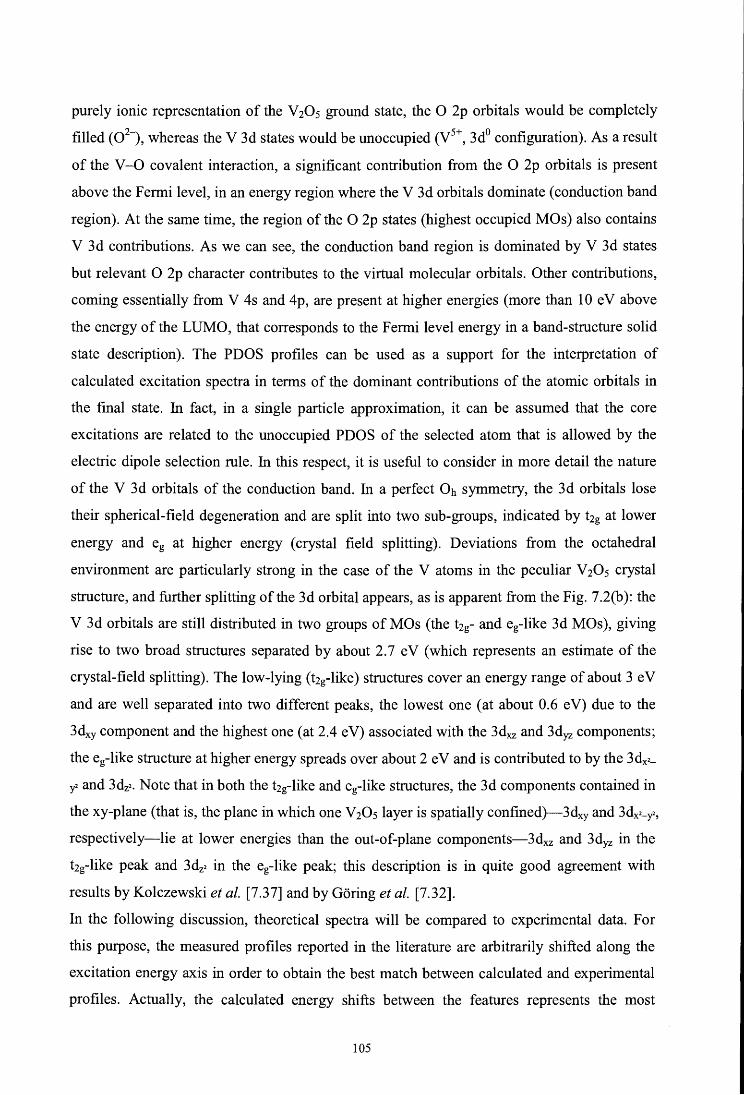
purely ionie representation of the V 20 5 ground state, the O 2p orbitals would be completely
filled (02-), whereas the V 3d states would be unoccupied (V5+, 3d0 configuration). As a result
of the V-O covalent interaction, a significant contribution from the O 2p orbitals is present
above the Fermi level, in an energy region where the V 3d orbitals dominate (conduction band
region). At the same time, the region of the O 2p states (highest occupied MOs) also contains
V 3d contributions. As we can see, the conduction band region is dominated by V 3d states
but relevant O 2p character contributes to the virtual molecular orbitals. Other contributions,
coming essentially from V 4s and 4p, are present at higher energies (more than 10 e V above
the energy of the LUMO, that corresponds to the Fermi level energy in a band-structure solid
state description). The PDOS profiles can be used as a support for the interpretation of
calculated excitation spectra in terms of the dominant contributions of the atomic orbitals in
the final state. In fact, in a single particle approximation, it can be assumed that the core
excitations are related to the unoccupied PDOS of the selected atom that is allowed by the
electric dipole selection rule. In this respect, it is useful to consider in more detail the nature
of the V 3d orbitals of the conduction band. In a perfect Oh symmetry, the 3d orbitals lose
their spherical-field degeneration andare split into two sub-groups, indicated by t2g at lower
energy and eg at higher energy (crystal field splitting). Deviations from the octahedral
environment are particularly strong in the case of the V atoms in the peculiar V 20 5 crystal
structure, and further splitting ofthe 3d orbital appears, as is apparent from the Fig. 7.2(b): the
V 3d orbitals are still distributed in two groups of MOs (the t2g- and eg-like 3d MOs), giving
rise to two broad structures separated by about 2.7 eV (which represents an estimate of the
crystal-field splitting). The low-lying (t2g-like) structures cover an energy range of about 3 e V
and are well separated into two different peaks, the lowest one (at about 0.6 eV) due to the
3dxy component and the highest one (at 2.4 eV) associated with the 3dxz and 3dyz components;
the eg-like structure at higher energy spreads over about 2 e V and is contributed to by the 3dx2-
y2 and 3dz2. Note that in both the t2g-like and eg-like structures, the 3d components contained in
the xy-plane (that is, the plane in which one V20 5 layer is spatially confined)-3dxy and 3dx2-y2,
respectively-lie at lower energies than the out-of-plane components-3dxz and 3dyz in the
t1g-like peak and 3dz2 in the eg-like peak; this description is in quite good agreement with
results by Kolczewski et al. [7.37] and by Goring et al. [7.32].
In the following discussion, theoretical spectra will be compared to experimental data. For
this purpose, the measured profiles reported in the literature are arbitrarily shifted along the
excitation energy axis in arder to obtain the best match between calculated and experimental
profiles. Actually, the calculated energy shifts between the features represents the most
105

significant theoretical result to compare to the experimental measurements. In each theoretical
spectrum, we also report the calculated ionization threshold in order to identify the spectral
features lying below and above the threshold; this is important because the virtual final
orbitals above edge are unbound and the LCAO-MO approach in a finite basis set is not
capable of properly describing them. Only when the coupling between the discrete virtual
orbitals generated by the present approach and the nonresonant continuum-which is not
included-is weak can it be assumed that the discrete transitions calculated above edge will
afford a qualitative estimate of the shape resonances observed in the cross section, at least in
the lower energy range. For this reason, we report only the theoretical results extending up to
about 20 e V above the calculated threshold.
7.4.1. V ls spectrum
The calculated V ls spectra are reported in Fig. 7.3 and the TDDFT results are compared with
experimental data [7.36]. Several polarized experimental spectra are present in the literature
[7.36,53,54], however, our results do not include polarization dependence of the spectra,
therefore they can be compared only to the angle-averaged experimental data. As can be seen
in Fig. 7.3(b) the generai profile of the V K-edge spectrum can be divided into two main
regions: the pre-peak region, containing quite a narrow peak with a calculated maximum at
about 5382 e V, followed by a broader structure on the higher energy side of the rising edge.
The TDDFT spectrum correctly models the main experimental features in both regions and, in
particular, the energy separation between the pre-edge peak and the structure above edge. The
V K-edge arises primarily from the dipole allowed ls ~ 4p transitions, although the ls ~ 3d
quadrupolar transitions can also contribute to the features below threshold. The matter of the
quadrupolar contributions to the metal K-edge absorption spectrum of transition metal oxides
has been quite vigorously debated [7.36,55,56] and for the rutile form of Ti02 oxide several
experimental studies have evidenced a significant participation of the quadrupolar transitions
to the pre-edge structures. This question has also been analysed in the case of V20s by
investigating polarized spectra at the V K-edge [7.36,54]. The authors found evidence that the
pre-edge fine structures are influenced by quadrupolar transitions, although the dipole
components dominate this region. The present computational approach does not include the
treatment of the quadrupolar transitions, therefore the following spectral interpretation is
based on the di po le selection rule. This allows only transitions from the V 1 s core orbi tal to
virtual states with metal p contributions, which are mapped by the oscillator strength. The V
106

p-PDOS profile (Fig. 7.3(a)) fumishes a pictorial representation of the V p atomic-like
character of the virtual states and can therefore support the interpretation of the calculated V
1 s spectrum. As previously discussed, the 4p states lie high in energy, falling several e V
above the ionization threshold together with the V 4s components. This picture is correctly
reflected in the V ls excitation spectrum (Fig. 7.3), where the most intense features are
situated in the above-edge region although, significant intensity is also calculated for the
below edge lines. These are attributed to transitions towards virtual MOs of mainly 3d
character, which can mix with the V 4p orbitals of the absorbing atoms as a consequence of
the strongly distorted symmetry of the oxide with respect to an ideal Oh symmetry, where the
ls ~ 3d transitions are dipole-forbidden. This attribution is consistent with those previously
presented in the literature [7.31,53]. The detail ofthe calculated pre-edge structure is shown in
Fig. 7.3(c) and is compared with the PDOS profiles ofthe three separate 4p components (4px,
4py and 4pz). Following the TDDFT results, the small peak around 5378 e V represents a final
state described by a single configuration from the initial V 1 s orbital to a final MO of a1
symmetry, which has a mainly V (3dxy, 3dyz) character. In general, in the cluster model of C2v
symmetry, the conditions for the interaction of these 3d orbitals (belonging to the a1 and b1
irreducible representations) with the V 4p orbitals are such that only the V 4py component can
admix, therefore the 4py states contribute to this peak as well as to the following two small
peaks. The dominant line that gives intensity to the shoulder at the lower energy side (5380.9
e V) of the main peak is instead associated with a final MO where contributions from both the
4pz and, to a minor extent, 4px components are present. These 4p states belong to the ai and bi
irreducible representations, to which the 3dx2-y2 and 3dz2 orbitals also belong. Finally, the main
peak around 5382 e Vis composed of several transitions mostly towards final states of 3dx2-y2
and 3dz2 main character, whose symmetry representations (a1 and b1) are again compatible
with the V 4pz and 4px components. Therefore, the analysis of the calculated pre-edge
structures in terms of the V 4p components indicates that significant contributions to the pre-
edge spectral features comes from the V 4pz and 4px components, while the 4py component is
comparatively small. This conclusion contradicts the V p-PDOS distribution, which instead
shows a local density of 4py states significantly higher than the other two 4p components at
the V site. However the d-PDOS profiles previously analyzed have revealed that the 3d tig-like orbitals contribute to the lower energy part of the conduction band while the 3d eg-like
orbitals (3dx2-y2, 3dz2) are present at higher energies of the conduction band. They cannot
interact with the 4py states due to symmetry restrictions, therefore the V 4py component,
107
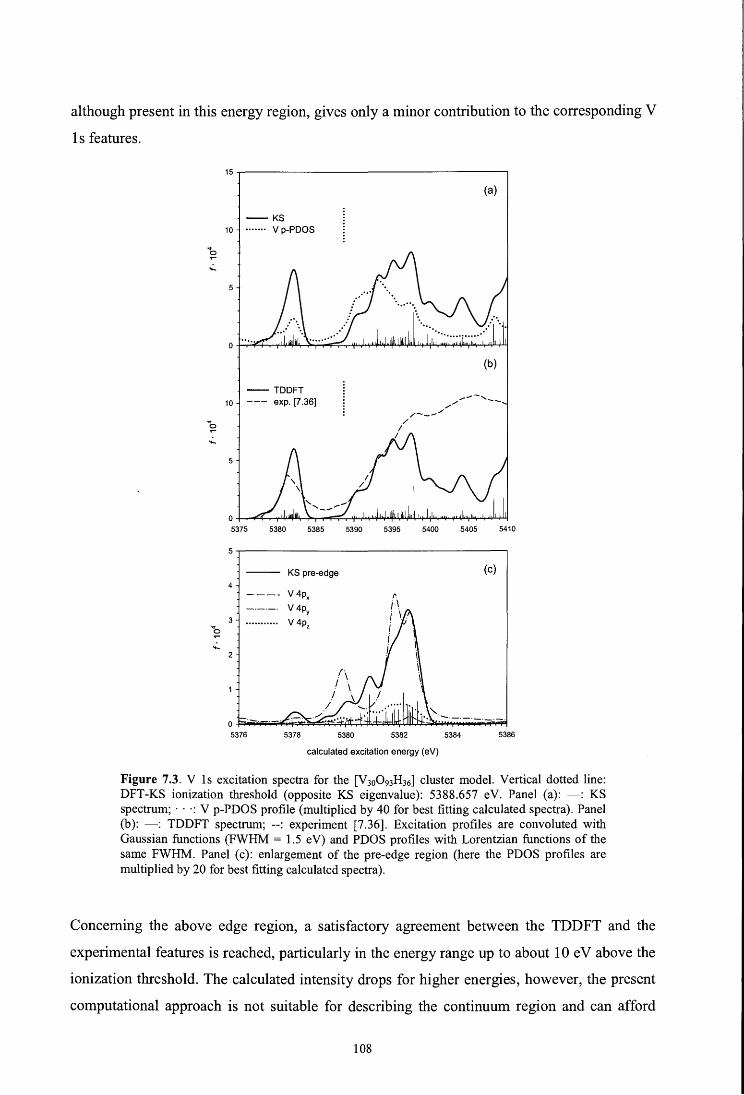
although present in this energy region, gives only a minor contribution to the corresponding V
1 s features.
.., o
b .;_
(a)
- KS 10 •·••·•• V p-PDOS
(b)
-- TDDFT 10 --- exp. [7.36]
o 5375 5380 5385 5390 5395 5400 5405 5410
5
KS pre-edge (e) 4
V 4px V 4py
V 4pz
2
o-t::;:.il~~~~~~#'Jl:~~#IJ:d;;JI;..lJJl.,:qi,,;~~_...~~
5376 5378 5380 5382 5384 5386
calculated excitation energy (eV)
Figure 7.3. V ls excitation spectra for the [V300 93H36] cluster model. Vertical dotted line: DFT-KS ionization threshold (opposite KS eigenvalue): 5388.657 eV. Panel (a): -: KS spectrum; · · ·: V p-PDOS profile (multiplied by 40 for best fitting calculated spectra). Panel (b ): -: TDDFT spectrum; --: experiment [7.36]. Excitation profiles are convoluted with Gaussian functions (FWHM = 1.5 e V) and PDOS profiles with Lorentzian functions of the same FWHM. Panel (e): enlargement of the pre-edge region (here the PDOS profiles are multiplied by 20 for best fitting calculated spectra).
Conceming the above edge region, a satisfactory agreement between the TDDFT and the
experimental features is reached, particularly in the energy range up to about 1 O e V above the
ionization threshold. The calculated intensity drops for higher energies, however, the present
computational approach is not suitable for describing the continuum region and can afford
108
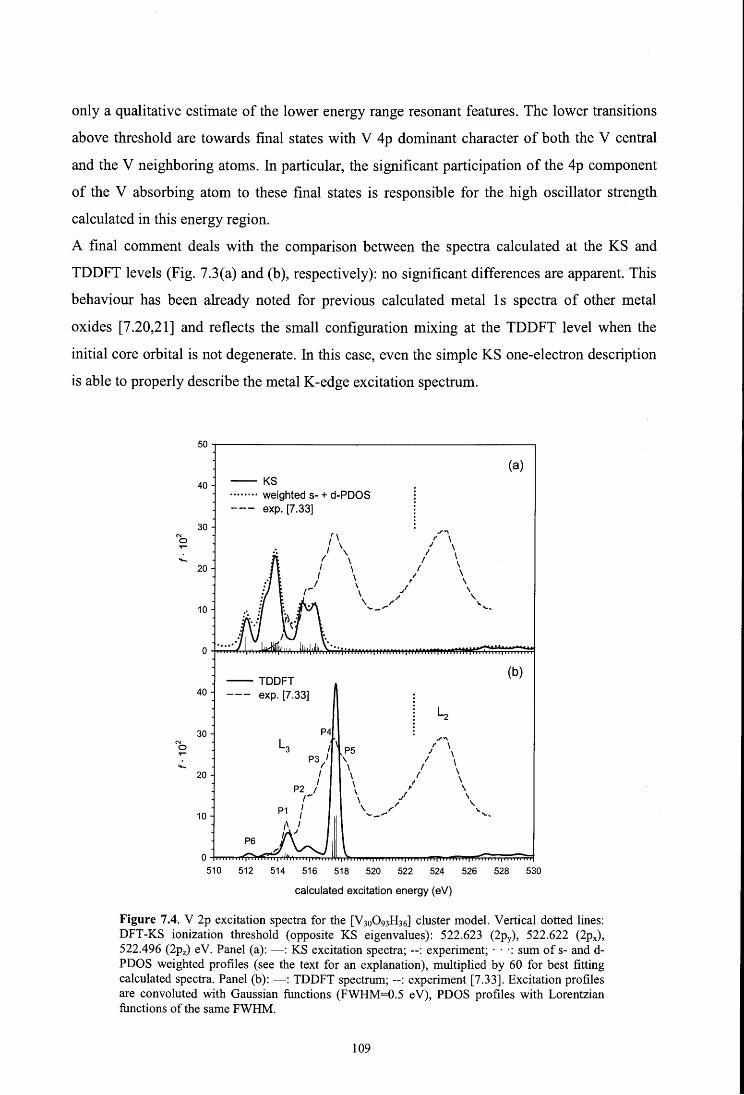
only a qualitative estimate of the lower energy range resonant features. The lower transitions
above threshold are towards final states with V 4p dominant character of both the V central
and the V neighboring atoms. In particular, the significant participation of the 4p component
of the V absorbing atom to these final states is responsible for the high oscillator strength
calculated in this energy region.
A final comment deals with the comparison between the spectra calculated at the KS and
TDDFT levels (Fig. 7.3(a) and (b), respectively): no significant differences are apparent. This
behaviour has been already noted for previous calculated metal 1 s spectra of other metal
oxides [7.20,21] and reflects the small configuration mixing at the TDDFT level when the
initial core orbital is not degenerate. In this case, even the simple KS one-electron description
is able to properly describe the metal K-edge excitation spectrum.
50
(a) 40 --KS
· •· · · · · · weighted s- + d-PDOS --- exp. [7.33]
30 _,...., N r\ I' \ o I \ I \ .;_ .. I \ I \ I \ I
20 I \ I \ I \ I \
I \ ,. ' ,,,.. \ ./ \
;' \ \ t' " 10 ..__,,. '-•
o
-- TDDFT (b)
40 --- exp. [7.33]
L2 30 P4
N L3 _,....,
o I P5 I' \ I \
.;_ P3/ \ I \ \ I \ 20 I \ I I \ I \
P2 I ,. ' \ Jt \ ,,,..
\ I \ ;' \
P1 t' " 10 I ... _,,. '-• ,, I I I
o 510 512 514 516 518 520 522 524 526 528 530
calculated excitation energy (eV)
Figure 7.4. V 2p excitation spectra for the [V300 93H36] cluster model. Vertical dotted lines: DFT-KS ionization threshold (opposite KS eigenvalues): 522.623 (2py), 522.622 (2px), 522.496 (2pz) e V. Panel (a): -: KS excitation spectra; --: experiment; · · ·: sum of s- and d-PDOS weighted profiles (see the text for an explanation), multiplied by 60 for best fitting calculated spectra. Panel (b): -: TDDFT spectrum; --: experiment [7.33]. Excitation profiles are convoluted with Gaussian functions (FWHM=0.5 e V), PDOS profiles with Lorentzian functions of the same FWHM.
109
7 .4.2. V 2p spectrum
Fig. 7.4 summarizes the calculated KS and TDDFT V 2p excitation spectra; the high energy
resolution experimental results [7.33] are also reported for comparison. In the energy region
between 512 and 529 eV, the experimental V 2p spectrum shows two broad structures with
the edge maxima separated by about 7 e V, which are assigned to the series of transitions
converging to the 2p3;2 (L3)- and 2p112 (L2)-edges generated by the spin-orbit splitting of the
initial vanadium 2p state. Most fine spectral features are clearly observable at the V L3-edge,
which are indicated with the Pl-P6 labels in Fig. 7.4. The present theoretical approach does
not take into account the spin-orbit effect and it is not possible to distinguish between L3- and
L1-edges, so the TDDFT results (Fig. 7.4(b )) are compared to the experimental features
converging to a single ionization threshold, in particular the L3-edge assuming the L2-
structure as a simply broadened version of L3-edge. The TDDFT calculated profile shows
broad weak structures in the low-energy region, from 512 eV and 516 eV, followed by a sharp,
intense peak which dominates the L3 absorption around 517 eV. Note that the whole
calculated spectrum is substantially confined in the below-edge region. The comparison with
the experimental pattems is satisfactory; in particular, the energy separati on ( about 3 e V)
between the two most prominent peaks, labelled Pl and P4 in the experiment, is correctly
reproduced. Let us consider in detail the interpretation provided by the theoretical results. The
V 2p electron has dipole-allowed transitions into s and d like virtual orbitals, and the
calculated PDOS pro file (Fig. 7 .2) can give a picture of the distribution of these levels in the
cluster. The low-energy virtual states are largely dominated by V 3d contributions while the V
ns components are negligible in this energy range and are present only in the higher virtual
levels. It is well known that transitions to ns states are much less intense than those to nd
states in the L-edge absorption spectra for heavy atoms [7.57,58] and their relative transition
intensities can be estimated through the calculation of the 2p --+ ns and 2p --+ nd oscillator
strengths for the metal cation V5+. In this way, we obtain a 3d/4s ratio equal to 18.9, which
confirms that the L-edge spectrum of vanadium is dominated by the d absorption channel.
Multiplying the ns and nd PDOS by the corresponding 2p --+ ns and 2p --+ nd oscillator
strengths of the metal cation, we obtain the total (s + d) PDOS profile reported in Fig. 7.2.
Comparing the PDOS with the spectrum calculated at the single-particle approximation (KS
spectrum, Fig. 7.4(a)), a good match is obtained confirming the 3d nature of the L3 structure.
In the KS spectrum, we observe severa! peaks deriving from the strong octahedral
deformation ofthe V20s structure, which additionally splits the two main 3d levels (t2g- and eg
110
-like MOs), as described in Section 7.3. In particular, the lower energy t2g-like orbitals (3dxy,
3dxz and 3dyz) give rise to two peaks at 512 eV (essentially the 3dxy component) and a
prominent one at 514 e V (3dxz and 3dyz components), which precede a double-peak structure
around 516 eV deriving from the eg-like orbitals (3dx2-y2 and 3d22 components). Prominent
differences are apparent ifwe compare the TDDFT V 2p spectrum (Fig. 7.4(b)) to the KS one.
This emphasizes the importance of the configuration mixing, whose inclusion significantly
redistributes the calculated oscillator strengths among the final states. In fact, it is known that
the coupling between different excitation channels plays an important role in describing
electron excitations from degenerate core holes, such as 2p, as well as the interaction between
the 2p core hole and 3d electron. This is correctly accounted for in the TDDFT calculations
and has proven to be important in the theoretical treatment of the L-edge [7.59]. A similar
behaviour has been also found in previous TDDFT calculations of the metal 2p absorption
spectra of Ti02 [7.21]. In the V 2p TDDFT spectrum, the intensities of the low energy lines
are sensibly reduced while the transitions to higher energy states gain intensity, so that two
main features are recognizable: at lower energy a seri es of broad and weak structures, peaking
at 514.6 and 516 e V, followed by a sharp and intense peak around 517.5 e V. These results can
be interpreted by analyzing the composition ofthe TDDFT excited states. The very weak lines
in the lower energy range are described by significant mixing of several configurations
relative to transitions towards virtual orbitals largely dominated by 3d contributions of the V
neighbors lying in the middle layer. The calculated oscillator strength, which directly maps
the contribution to the final MOs of the 3d orbitals centered on the central V atoms, is
therefore low and is, furthermore, distributed over a great number of final states by the
configuration mixing introduced at the TDDFT level. Also, the small bumps calculated at the
lower energy side of the peak at 514.6 e V can be characterized in an analogous manner, in
particular, the transitions involve the 3dxy component of the V central atom. On this basis, we
attribute the peaks labelled P6 and P 1 in the experiment to the excited states made up of
mixed central V 3d orbitals (the t2g-like components, as previously discussed) with 3d orbitals
on the neighboring V atoms, which predominantly characterize the low lying virtual orbitals.
This attribution does not confirm the hypothesis reported in ref. [7.33], which tentatively
ascribes the P6 feature to surface effects on the basis of band structure calculations. The two
remaining features of the TDDFT spectrum are associated with the V 3d eg-like components,
mainly deriving from the central V atoms. The participation of 3d components from the V
neighbor atoms is reduced with respect to the lower lying MOs, and this different composition
explains the higher oscillator strength calculated for these transitions with respect to the lower
111

energy ones. We associate the small eg-like bump to the P2 experimental feature; it is
important to consider that the estimated P 1 and P2 energy separati on is about 1.2 e V (ELNES
experiment [7.33]), in good agreement with the energy split of about 1.4 eV for the
corresponding calculated peaks; furthermore, this value reflects the energy separation between
the main t2g-like peak and the first shoulder of the eg-like peak provided by the PDOS. The
strongest calculated peak corresponds to the P4 experimental feature, therefore our
calculations do not explain the nature of the P3 observed feature. Probably the TDDFT results
tend to overestimate the intensity of the main peak at the expense of the lower energy eg-like
structure, rendering the comparison with the experiment unquantitative. This discrepancy
could in part be ascribable to the lack of relativistic effects in the present computational
scheme; in fact, for 3d systems, the so-called "2p-3d multiplet effects", i.e. the correlation
effects between the 2p core wave function and the 3d wave function, are of the same order of
magnitude as the 2p spin-orbit coupling [7.60]. The result is a significant mixing and
reordering of the L3 and L2 edges. Therefore, it is expected that the inclusion of the spin-orbit
coupling in the calculation redistributes the intensity over the two series of L3 and L2
transitions, as has been recently proven in the case of Ti 2p core spectrum of TiC14 molecules,
which has been treated with the TDDFT approach extended to the two-component Zero-
Order Relativistic Approximation (ZORA) [7.61].
7.4.3. O 1s spectrum
The V 20s crystal structure is characterized by the presence of three differently coordinated
oxygens: vanadyl oxygens O(a), chain oxygens O(b) and bridging oxygens O(c), as
previously illustrated (Fig. 7.1). It is therefore possible to compute the O ls excitation spectra
for each of the three different centers O( a-e), following the procedure described in Section
7.3; and then to obtain the combined (total) O ls spectrum as a stoichiometric superposition
of the three atom-resolved spectra. The KS and TDDFT theoretical spectra are reported in
Figs. 7.5 and 7.6, respectively. Fig. 7.5 collects the spectra calculated at the KS level together
with the PDOS profiles for the oxygen centers (O 2Px,y,z contributions), while the combined
TDDFT spectrum in Fig. 7.6 is compared with the experimental data from ref. [7.34].
The only dipole-allowed transitions from the O 1 s orbi tal are the O 1 s ~ np transitions; in a
purely ionie model for the oxide, with fully occupied O 2p orbitals, the 1 s ~ 2p channel
would be closed. The presence of the O K-absorption signal in the experimental spectrum (Fig.
7.6) therefore indicates the presence of significant O 2p contributions in the low-lying excited
112
states deriving from the pronounced hybridization between the O 2p states with the V 3d
states. Our previous analysis of the low-lying excited states has emphasized their large V 3d
character, which has also been evidenced by the V 2p absorption spectrum; the O ls
excitation spectrum reflects the local O 2p contributions of the different oxygen atoms to the
same low-lying excited states. The experimental spectrum, reported in Fig. 7.6(a) [7.34]
shows two main features that are well separated in energy: a two-peak feature in the below-
edge energy range and a broad, less intense structure above edge extending over more than 20
eV. Note that the measured profile shows a low-energy tail that arises from the V 2p
absorption; in fact, the O ls transitions start to contribute (with a maximum edge at above 530
e V) just above the structure associated with the absorption at the V L2 threshold ( at about
528.5 eV). The agreement between the experimental spectrum and the calculated TDDFT
spectrum is excellent in both the below and above threshold regions. It is interesting to note
that no variations in the calculated O 1 s spectrum are apparent on going from the TDDFT to
the KS results reported in Fig. 7.5(d). This means that the interaction between the excited ls
electron and the valence shell electrons can be neglected and, therefore, the KS single particle
scheme is ab le to describe the O 1 s excitations.
A large low-energy peak with a high energy shoulder characterizes the pre-edge structure,
which can be associated with dipole transitions to band states dominated by the V 3d levels,
namely, the t1g- and eg-like levels separated by the ligand-field splitting: the energy separation
between these two features is about 2 e V, a value close to that obtained as a rough estimate of
the crystal-field splitting from the V 3d PDOS in Fig. 7.2 (2.5 e V). The interpretation of the
structure in terms of the O 1 s contributions can be supported by the characterization of the
excitation spectra of the three oxygen species, reported in Fig. 7.5. As can be seen, each
spectrum reveals a two peak structure associated with transitions to the t2g- and eg-like states;
the positions of the two peaks are strictly conserved along the spectra while their relative
intensities change significantly. In the spectrum of the singly coordinated O(a) center (panel
a), the t1g-peak intensity is about twice that of the eg-peak, according to the oxygen derived p
PDOS reported in the figure for comparison. The lower peak is essentially due to O 2px and
2py contributions to the t2g-like final state, while the higher eg-like peak is due to orbitals
containing O 2pz character; this picture is consistent with the local geometry of vanadyl
oxygens, which directly point out from the xy-plane in which the cluster model is confined.
The two peaks have approximately equal intensities in the spectrum of the doubly coordinated
O(b) center (panel b ); the different binding geometry at the O(b) center with respect to the
O(a) center is reflected by the different contributions of the local O 2p components: 2py in the
113

lower peak and 2px in the higher peak, while the 2p2 component is much less intense and is
equally distributed between the two peaks, as the chain oxygens are strictly located in the
layer plane. The intensity of the first peak further decreases in the spectrum of the O( e) center
(panel e), becoming a low-energy shoulder of the main eg-like peak. Tue different shape of the
below-edge peak originates from the different local geometry at the three-fold coordinated
O( e) center; in this case both the 2px and 2py orbitals equally interact with the metal center in
the layer and are therefore equivalently distributed over the two structures, which appear as a
single peak. The final virtual orbitals contain only minor O 2p2 character quite uniformly
spread over the peak.
525 530 535 540 545 550 555 560
calculated excitation energy (eV)
Figure 7.5. O ls excitation spectra, calculated at the KS level, for the [V300 93H36] cluster model. Vertical dotted lines: DFT-KS ionization thresholds ( opposite KS eigenvalues). Panel (a): O(a) ls spectrum (KS eigenvalue: 537.572 eV). Panel (b): O(b) ls spectrum (KS eigenvalue: 537.246 eV). Panel (e): O(c) ls spectrum (KS eigenvalue: 537.090 eV). Panel (d): O ls total spectrum. The O p-PDOS profiles are also reported in all panels. Excitation profiles are convoluted with Gaussian functions (FWHM = 1.5 eV), PDOS profiles with Lorentzian functions of the same FWHM. PDOS profiles are multiplied by 200 for best fitting calculated spectra.
114
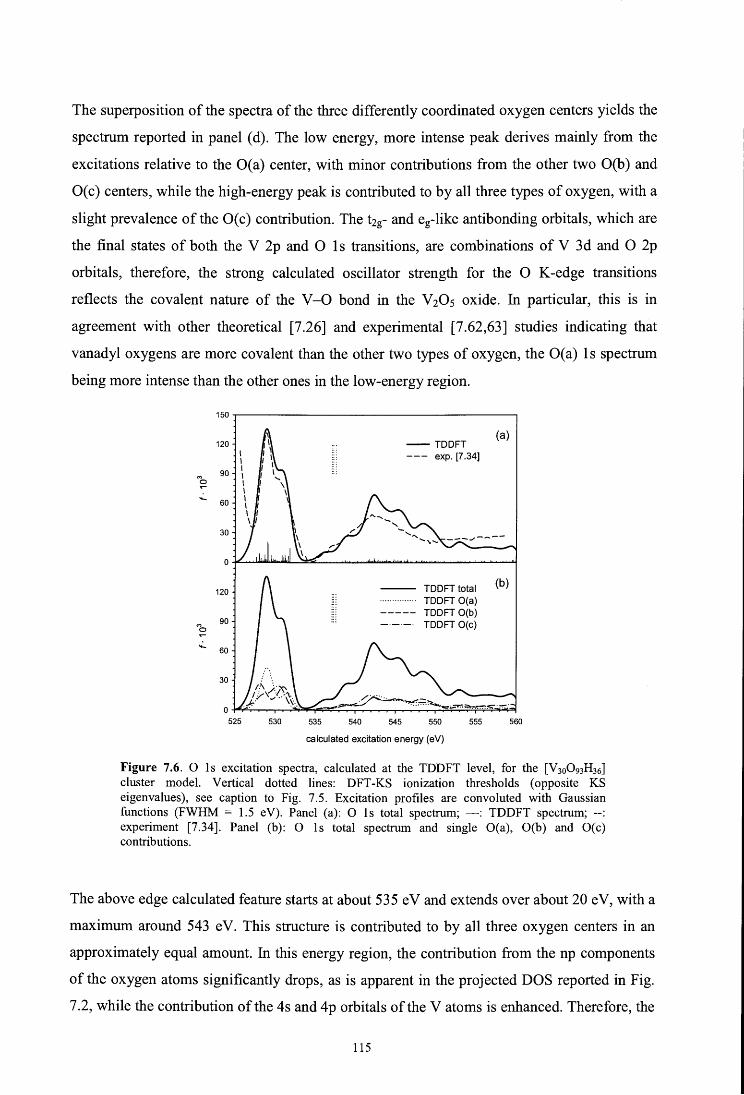
The superposition of the spectra of the three differently coordinated oxygen centers yields the
spectrum reported in panel (d). The low energy, more intense peak derives mainly from the
excitations relative to the O(a) center, with minor contributions from the other two O(b) and
O( e) centers, while the high-energy peak is contributed to by all three types of oxygen, with a
slight prevalence of the O( e) contribution. The t2g- and eg-like antibonding orbitals, which are
the final states of both the V 2p and O ls transitions, are combinations of V 3d and O 2p
orbitals, therefore, the strong calculated oscillator strength for the O K-edge transitions
reflects the covalent nature of the V-O bond in the V20 5 oxide. In particular, this is in
agreement with other theoretical [7.26] and experimental [7.62,63] studies indicating that
vanadyl oxygens are more covalent than the other two types of oxygen, the O(a) ls spectrum
being more intense than the other ones in the low-energy region.
150
120
"' 90 o ..;._
60
30
o
120
"'o 90
..;._ 60
30
o 525 530 535 540
-TDDFT --- exp. [7.34]
-- TDDFT total TDDFT O(a) TDDFT O(b)
-·-·-· TDDFT O(c)
545 550 555
calculated excitation energy (eV)
(a)
(b)
560
Figure 7.6. O ls excitation spectra, calculated at the TDDFT level, for the [V300 93H36]
cluster model. Vertical dotted lines: DFT-KS ionization thresholds (opposite KS eigenvalues), see caption to Fig. 7.5. Excitation profiles are convoluted with Gaussian functions (FWHM = 1.5 eV). Panel (a): O ls total spectrum; -: TDDFT spectrum; --: experiment [7.34]. Panel (b): O ls total spectrum and single O(a), O(b) and O(c) contributions.
The above edge calculated feature starts at about 535 eV and extends over about 20 eV, with a
maximum around 543 eV. This structure is contributed to by all three oxygen centers in an
approximately equal amount. In this energy region, the contribution from the np components
of the oxygen atoms significantly drops, as is apparent in the projected DOS reported in Fig.
7 .2, while the contributi on of the 4s and 4p orbitals of the V atoms is enhanced. Therefore, the
115

above edge structure can be attributed to final states with small oxygen 3p character
hybridized with V 4s and 4p orbitals of the right symmetry. The presence of V 4p states in
this energy region is also the basis for the spectral assignment of the above edge structure of
the V K-edge spectrum. Very similar results, in particular in the pre-edge region, have been
obtained in ref. [7.37] through DFT calculations performed on a surface cluster model. This
similarity can indicate that most of the information about electronic structure and
spectroscopic features about V 20 5 can be recovered using a single-slab model, due to the
highly layered geometrie structure ofthe crystal.
7.5. CONCLUSIONS
In this work, we present the core absorption spectra for V 1 s and 2p and O 1 s excitation of the
V20s bulk using a TDDFT cluster approach. A detailed analysis ofthe spectral features, based
on the character of the corresponding final states, is performed with the help of the Partial
Density of the virtual States (PDOS) calculated for each core hole considered. Furthermore,
the peak intensities for a given excitation energy depend on the details of the orbi tal mixing in
the final state. The V 3d components dominate the conduction band region, however, the
oscillator strengths are ab le to map the minor components of the final states, such as V 4p and
O 2p components, due to the locai character of the excitations. In particular, the peaks in the
V K-edge spectrum derive from the V 4p components, which can mix with the V 3d
components as a consequence of the strongly distorted symmetry of the oxide with respect to
an ideai Oh symmetry. In the case ofthe O K-edge, the mixing ofO 2p and V 3d contributions
gives rise to the below edge structures, which appear quite intense. This reflects the covalent
nature of the V-O bond in the V20 5 oxide. The V 2p spectrum directly maps the V 3d
character of the low-lying virtual states; the shape of the 3d spectral features reflects the
distribution of the 3d components in the symmetry environment deriving from the strong
octahedral deformati on of the V 20 5 structure.
The calculations allow the O 1 s excitation spectra to be obtained separately relative to the
three differently coordinated oxygen species. The binding geometry at the O centers
determines the contributi on of the 2px, 2py and 2p2 components to the final states, which is in
tum responsible for the different shape of the excitation spectrum of the three-fold
coordinated O(c) center compared to those of the two surface oxygen atoms (O(a) and O(b))
centers. The peak assignment of the total O 1 s spectrum in terms of the contribution of the
116

different coordinated oxygen atoms can be used to identify in the experiment the different
oxygen sites.
The agreement between the TDDFT and the KS results for the V and O K-edges demonstrates
that these transitions can also be correctly described using a simple single particle
approximation. The strong modificati on of the V L-edge spectrum from the KS to the TDDFT
description indicates the importance of the inclusion of configuration mixing to treat the
interaction between the 2p degenerate core holes as well as the coupling of the 2p core
function and the 3d valence function in the metal 2p excitations.
The comparison of the TDDFT spectra with the measurements is satisfactory, therefore
confirming the suitability of the present computational approach for an adequate interpretati on
of the experimental spectra. Only in the case of the V L-edge are some discrepancies between
theory and experiment still present, which may be associated to the lack of spin-orbit effects
in the present computational model. Furthermore, a full comparison with the angular resolved
measurements available will require an extension of the theoretical treatment to evaluate the
polarization dependency of the calculated spectra. Also, the inclusion of second-order
quadrupolar transitions is important to account for the weak intensity pre-edge often observed
in the metal K-edge spectra of 3d compounds. Theoretical improvements in these areas are
currently under way.
117

8. SPIN-ORBIT RELATIVISTIC CALCULATIONS OF THE
CORE EXCITATION SPECTRA OF S02
Fronzoni G., De Francesco R., Stener M., Decleva P., J. Chem. Phys., in press.
The Time Dependent Density Functional Theory approach within the two component Zero
Order Relativistic Approximation has been applied to the calculation of the core excitation
spectra of S02 molecule. The results obtained reproduce correctly the high resolution
experimental spectra and allow the assignment of the spectral features both of the valence and
Rydberg regions in the S ls and O ls spectra. For the S 2p threshold a correct description of
the spin-orbit coupling as well as of the molecular field splitting appears mandatory for a
reliable description of the spectrum and a detailed attribution of the complex Rydberg
manifold of core excited states.
8.1. INTRODUCTION
Advances in synchrotron radiation photoabsorption measurements have made it possible to
resolve fine structures in the inner-shell spectra of molecules. The high resolution XAS
spectra show great complexity especially below edge, where two kinds of features dominate:
the lowest energy and often most intense features associated to excitations of the core
electrons to the unoccupied valence molecular orbitals (MO) and the sharper higher energy
structures deriving from excitations into Rydberg orbitals, which in principle form a series
converging to the ionization limit. The distinction between valence and Rydberg transitions is
often complex because of their possible mixing in the final excited states. The relative
importance of the valence and Rydberg structures depends on the bonding nature of the
absorbing atom with its neighbor atoms and on the extent of the mixing between virtual
valence and Rydberg final orbitals. Theoretical calculations represent an important support to
determine the nature of the electronic transitions and to assign the pre-edge features in terms
of both the transition energies and the respective oscillator strengths which also give
important information about the composition and localization of the virtual levels.
Furthermore the comparison of theoretical results with the experimental data provi de a deeper
118
insight conceming what level of approximation is needed to obtain an adequate description of
the spectral structures. For closed shell molecules, in the X-ray absorption process the excited
system is well described as a single electron outside a closed shell core coupled to a highly
localized and well isolated core hole. A single particle description of the XAS spectra
generally works well for core excitation from non degenerate core states (K edge spectrum);
when a core ho le other than a 1 s ho le is present in the initial or final orbi tal, coupling effects
become important and influence the spectral shape and the intensity distribution. The coupling
between different excitation channels, when degenerate core holes are considered, like 2p
orbitals, requires the inclusion of configuration mixing in the calculations; therefore a proper
description of the L edge needs theoretical approaches beyond a single determinant level
[8.1,2]. Furthermore the 2p photoabsorption spectra of heavy elements, starting from the
second row elements such as P, S and Cl, are also affected by the Spin-Orbit (SO) splitting of
the core orbitals. The SO splitting gives rise to distinct spectral features converging to the two
different ionization threshold 2p312 (Lm) and 2p112 (L11). The 2p SO splitting of third-row and
heavier elements is large and the L2 and L3 structures are well separated, while in the second-
row elements such as sulfur and phosphorous, 2p SO is quite difficult to analyze due to the
partial overlap of the two manifold of excited states.
The availability of a general and accurate method including both configuration mixing and SO
coupling is therefore of significant importance for a quantitative description of the XAS
spectra of molecules at the different absorption edges. In this respect, the recent formalism
based on the relativistic two-component zero-order regular approximation (ZORA) and Time
Dependent Density Functional theory (TD-DFT) extended to the treatment of the core
electron excitations, is expected to satisfy the desired requirements. This method,
implemented in the ADF code [8.3], has been recently applied to the calculations of Ti 2p
(Ln,Lm) core excitations in TiC14 [8.4] giving very satisfactory results in the case of a
transition metal compound where the correlation effects are important and the spin-orbit
coupling large.
In this work the ZORA TD-DFT approach is employed to calculate the XAS spectra of the
S02 molecule at the S 1 s and 2p and O 1 s core edges. The core excitations in S02 provide a
good test for the theory because the inner shell spectra relative to the three core edges S 1 s, S
2p and O 1 s have been the object of numerous experimental investigations some of them at
high level of resolution [8.5-11]. In particular for the S 2p threshold the experiment [8.10] has
allowed to resolve a variety ofRydberg states in a region where the spin-orbit splitting as well
as the molecular field splitting are responsible for a high level of complexity in the attribution
119
of the excited states. Also the assignments of the S 1 s and O 1 s excitations are not complete in
the higher energy region below threshold. Relatively little work has been done from a
theoretical point of view and only a few calculations exists [8.8,11] and different theoretical
approaches are used for the different edges. A direct comparison of the relative energies and
intensities of the transitions obtained at the same level of accuracy for the different core edges
appears instructive to better characterize the core excited states which are expected to be
present in all the spectra with different oscillator strengths according to the dipole selection
rules and symmetry properties.
8.2. THEORETICAL METHOD
In this work the core electron excitation spectra have been calculated by means of the
relativistic two-component zeroth-order regular approximation (ZORA) and time-dependent
density functional theory formalism [8.3], properly modified in order to treat core electron
excitations. In this section we briefly recall the method, which is extensively described in [8.3]
to which we refer the reader for further details, and then we outline the modifications which
bave been implemented in order to apply the formalism to core excitation.
This method allows the calculation of excitation energies and intensities for closed shell
molecules, including spin-orbit coupling and with full use of symmetry. The equation which
is actually solved is the eigenvalue equation:
(8.1)
(8.2)
in (2) indices i and j indicate occupied spinors and indices a and b indicate virtual spinors, ci
and ca are molecular spinar energies, while F and P are F ock matrix and density matrix
respectively.
In equation (8.1) the eigenvalues col correspond to the squared of the excitation energies,
while from the eigenvectors F 1 the oscillator strengths can be extracted according to standard
TDDFT method [8.12]. The elements ofthe coupling matrix K are calculated by means ofthe
120

expression reported in ref. [8.3], while eigenvalues and eigenvectors of n matrix are obtained
employing Davidson's iterative algorithm [8.13].
A fundamental aspect of the implementation is the full use of molecular symmetry, which
produces important computational economy if the molecule is highly symmetric. All the
details of the double-group symmetry implementation with all advantages such as block
diagonal n matrix and reduction of numerica! integrals to symmetry-unique part of the
integration grid by virtue ofthe Wigner-Eckart theorem are addressed in [8.3].
As concems the extension to treat the core electron excitations, the space spanned by the
solutions of the eigenvalue equation (8.1) corresponds to the lh-1 p excited configurations. In
this configuration space the core excitation energies correspond to the highest eigenvalues of
the n matrix therefore it is not easy to extract them with Davidson's iterative algorithm. It is
however possible to reduce the lh-1 p space by carefully selecting a subset of configurations,
keeping only those necessary for an accurate description of the phenomenon, as it is
customary in ab initio CI calculations. So, in practice the indexes which span the occupied
spinors (i and j) can be limited to run only over the core shell under study. For example, in the
case of 2p excitations the indexes are limited to run over the two subshells 2p112 and 2p3;2
allowing therefore a mixing of the initial states. Therefore equation (8.1) is actually solved for
a submatrix of the originai n matrix, which is much smaller than the latter and Davidson's
algorithm can be effectively used because now core excitations correspond to the lowest states
of the submatrix. With this approximation the coupling between core excitations and valence
excitations to the continuum is neglected and the computational scheme does not need the
treatment of the continuum states. Moreover the coupling between core excitations and
valence ionizations is expected to be very small because similar schemes employed in ab
initio calculations [8.1] fumished excellent results with respect to the experiment. Scaled
ZORA spinar eigenvalues are used in the calculations of core excitation energies.
8.3. COMPUTATIONAL DETAILS
The basis set employed for the sulfur and oxygen atoms is the all-electron ZORA basis set for
relativistic calculations from the ADF database named QZ4P [8.14]. This consists of STO
functions and it corresponds to the [ 11 s, 7p, 3d, 4f] set for S atom and [8s, 4p, 2d, 2f] set for
O atom. For the excited atom (sulfur in the S ls and S 2p spectra and oxygen in the O ls
spectrum) an enlarged basis set is employed adding two shells of s, p, d and f diffuse
121

functions to the QZ4P set with exponents obtained with the even tempered criterion (p = 1.7).
Since the Rydberg excited states are involved, the inclusion of diffuse functions in the basis
set is necessary to describe the transitions towards such states. The final basis set for the
excited atom is therefore the [13s, 9p, 5d, 6f] set for S and the [lOs, 6p, 4d, 4f] set for O,
which is indicated as (ET-QZ4P-2diff) set.
The adiabatic local density approximation (ALDA) has been employed to approximate the
XC kemel. For the XC potential applied in the Self Consistent Field (SCF) calculations the
the LB94 [8.15] XC potential has been used with the Ground State (GS) electron
configuration. The LB94 potential has been chosen for its correct asymptotic behaviour,
which is a necessary condition for a good description of the high energy valence virtual
orbitals and Rydberg states. The SAOP exchange correlation potential [8.16] is also
characterized by a correct asymptotic behaviour and its performance for the description of the
XAS spectra within the two component ZORA TDDFT approach has been tested in a
previous work [8.4]. The comparison of the SAOP and LB94 results has not revealed
significant dependency from the potentials apart from a large shift in the absolute energy scale,
due to the strong underestimate of the SAOP excitation energies with respect to the
experimental data. Furthermore a better overall description of the intensity distribution, in
particular in the Rydberg region, has been obtained with the LB94 potential, which has been
therefore considered more suitable also for the present calculations.
F or the calculation of the O 1 s excitations the symmetry-adapted soluti on is adopted due to
the GS electron configuration employed for the LB94 XC potential. Experience has shown
that the employment of the LB94 potential gives best results for core excitations with GS
orbitals without the need of relaxation. In general, at TDDFT level the use of relaxed scheme
does not imply a significant improvement of the results both in the valence [8.17] and in the
core region [8.2].
The experimental geometry of S02 has been employed in all calculations.
8.4. RESUL TS AND DISCUSSI ON
The S02 molecule (C2v symmetry) has three unoccupied valence orbitals: 3b1, 9a1 and 6b2.
According to the molecular electron configuration in the ground state, the LUMO (3b1) is a n*
antibonding orbital while the next two 9a1 and 6b2 orbitals represent cr* type molecular
antibonding orbitals. These three MOs are dominated by the 3p S component; a significant O
122

2p contribution is present in the LUMO, as a result of the S-0 covalent interaction, which
decreases in the two following cr* orbitals at the expense of other sulfur atomic components
(in particular 3d). The remaining virtual orbitals obtained in the extended basis set correspond
to Rydberg orbitals most centered on the centrai S atom. Within this molecular orbitai scheme,
below the core ionization threshold the lowest features in the XAS spectra can be interpreted
in terms of transitions from the particular core level to the three virtual valence orbitals;
according to the dipole selection rules the transitions from each core level of the ground state
of S02 (la1) to all the virtual valence orbitals are allowed. In the higher energy region of the
spectra less intense structures are present which involve transitions towards Rydberg orbitals.
The discrete calculated structures for the three S 1 s, S 2p and O 1 s spectra are discussed in
detail below.
Initial state Non-relativistic Scalar-ZORA Final state/MO TDDFT results TDDFT results
E (eV) J- 102 (a) E (e V) J- 102 (a)
S ls 2438.07 0.581 2446.18 0.575 1B1I3b1 2442.34 0.220 2450.43 0.241 lA1 I 9a1 2443.29 0.211 2451.44 0.228 1B2 I 6b2
O ls 526.75 4.331 527.09 4.367 1B1I3b1 531.11 1.821 531.43 2.116 lB2 I 9a1 532.06 1.733 532.44 1.796 2A1 I 6b2
s 2p 164.28 0.162 164.25 0.145 1B1 I 3b1 165.13 0.109 165.09 0.101 lA1 I 3b1 168.95 2.421 168.86 2.406 2B1 I 9a1 169.66 1.066 169.66 1.046 2B2 I 6b2 170.04 0.999 170.07 0.962 3A1 I 6b2
Table 8.1. Excitation energies (e V) and oscillator strengths f for the three valence transitions in the S 1 s, O 1 s and S 2p calculated spectra in the non-relativistic and scalar-Zora TDDFT approaches (ET-QZ4P-2diffbasis set). (a) Only the transitions withf" 102 > 0.100 are reported.
123
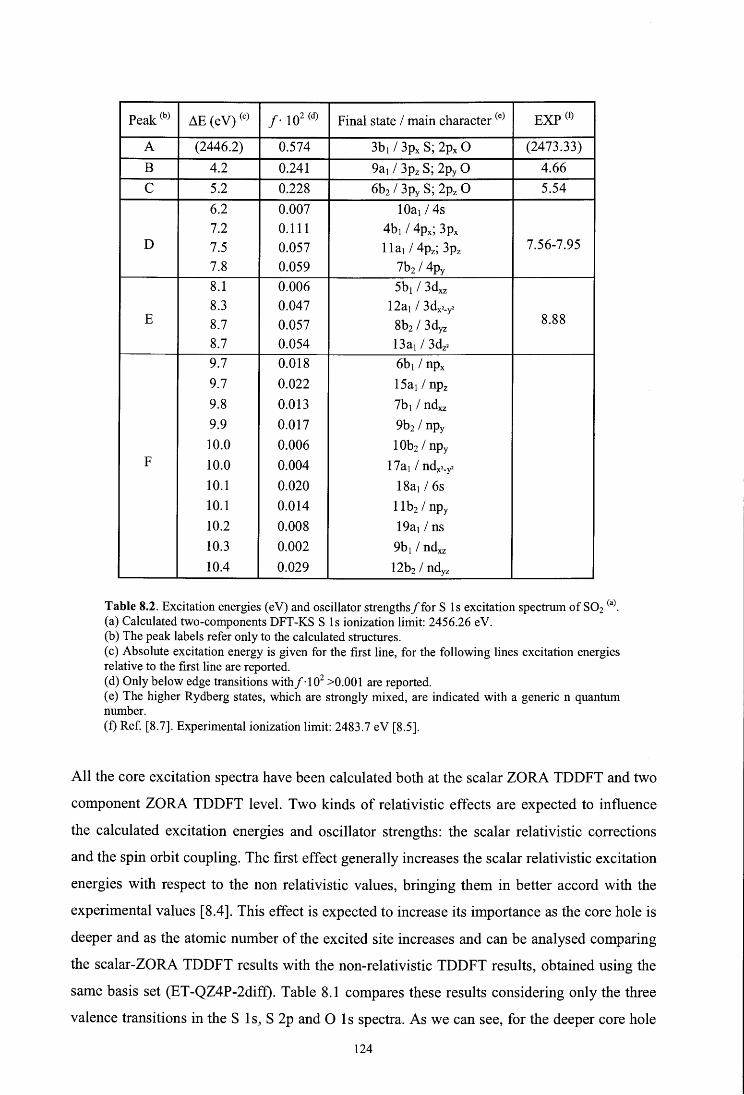
Peak (b) ~E (eV) (e) f' 102 (d) Final state I main character (e) EXP (f)
A (2446.2) 0.574 3b1 / 3px S; 2px O (2473.33) B 4.2 0.241 9a1 I 3pz S; 2py O 4.66 e 5.2 0.228 6b2 I 3py S; 2pz O 5.54
6.2 0.007 l0a1 I 4s 7.2 0.111 4b1 / 4px; 3px
D 7.5 0.057 l la1 I 4pz; 3pz 7.56-7.95 7.8 0.059 7b2 I 4py 8.1 0.006 5b1 I 3dxz 8.3 0.047 12a1 I 3dx2-y2
E 8.7 0.057 8b2 I 3dyz 8.88
8.7 0.054 13a1 I 3dz2 9.7 0.018 6b1 I npx 9.7 0.022 15a1 I npz 9.8 0.013 7b1 I ndxz 9.9 0.017 9b2 I npy 10.0 0.006 10b2 I npy
F 10.0 0.004 17a1 I ndx2-y2 10.1 0.020 l8a1/6s 10.1 0.014 llb2 I npy 10.2 0.008 19a1 I ns 10.3 0.002 9b1 I ndxz 10.4 0.029 12b2 I ndyz
Table 8.2. Excitation energies (e V) and oscillator strengthsffor S ls excitation spectrum of S02 (a)_ (a) Calculated two-components DFT-KS S ls ionization limit: 2456.26 eV. (b) The peak labels refer only to the calculated structures. (e) Absolute excitation energy is given for the first line, for the following lines excitation energies relative to the first line are reported. ( d) Only below edge transitions withf · 102 >0.001 are reported. (e) The higher Rydberg states, which are strongly mixed, are indicated with a generic n quantum number. (f) Ref. [8.7]. Experimental ionization limit: 2483.7 e V [8.5].
Ali the core excitation spectra bave been calculated both at the scalar ZORA TDDFT and two
component ZORA TDDFT level. Two kinds of relativistic effects are expected to influence
the calculated excitation energies and oscillator strengths: the scalar relativistic corrections
and the spin orbit coupling. The first effect generally increases the scalar relativistic excitation
energies with respect to the non relativistic values, bringing them in better accord with the
experimental values [8.4]. This effect is expected to increase its importance as the core hole is
deeper and as the atomic number of the excited site increases and can be analysed comparing
the scalar-ZORA TDDFT results with the non-relativistic TDDFT results, obtained using the
same basis set (ET-QZ4P-2dift). Table 8.1 compares these results considering only the three
valence transitions in the S 1 s, S 2p and O 1 s spectra. As we can see, for the deeper core ho le
124
S 1 s the effect of the scalar relativistic correction on the excitation energies is qui te important,
with an increase of about 8 e V towards the experimental values (reported in Table 8.2 for the
S ls spectrum). In the case of the O ls excitation energies, such an effect is significantly
smaller and the increase is reduced to about 0.35 eV, while for the S 2p energies no
significant variations between the non-relativistic and scalar relativistic results is observed.
Analogous trends are observed also for the higher Rydberg excited states. The fact that the
excitation energies appear underestimated in both calculations is generally ascribed to
deficiencies of the XC potential. If we consider the relative energy shift between the
calculated transitions, which actually represent the most significant data in comparing
calculated and experimental spectra, a good agreement is obtained between the scalar
relativistic and non relativistic results. As concerns the oscillator strengths, the two
computational schemes previde very close values. It appears therefore that the inclusi on of the
scalar relativistic correction in the TDDFT scheme does not give substantial improvement on
the description of core excitation spectra of S02.
As concerns the second relativistic effect, the electronic excitation from a core orbitai
generates doubly split states due to the spin-orbit coupling except for the s initial orbitai. The
SO effect is an important point in the calculations of the excitations from the 2p initial orbitals,
while it does not influence the S 1 s and O 1 s core excitation spectra. Therefore in the
following discussion we compare the results obtained at the relativistic two component ZORA
TD-DFT and scalar-ZORA levels only for the S 2p excitation spectrum. For the S ls and O ls
spectra only the two component ZORA TD-DFT results are reported and illustrated.
8.4.1. S 1s spectrum
The two component ZORA TD-DFT S ls excitation energies and oscillator strength are
reported in Table 8.2 and in Figure 8.1 and compared with the experimental data [8.6,7]. The
experimental spectrum below edge presents two well separated and intense features at lower
energy associated to the valence transitions followed by weaker peaks ascribed to Rydberg
excitations which are however still subject to some uncertainties due to an incomplete
resolution even in the high-resolution photoabsorption spectra [8.6]. The calculated spectrum
compares very well with the experiment and shows that the Rydberg region is contribute by a
large number of lines very close in energy on going towards the ionization limit. The dipole
allowed excitations are possible from the S ls (a1) orbitai to final orbitals with a1, b1 and b2
symmetry and the calculated oscillator strength/ maps the sulfur p content ofthe final orbitals.
125

The strongest intensity of the lowest valence transition (S ls ~ 3b1, peak A) reflects the
dominant S 3p character of the LUMO, in particular S 3px out of plane 1t*, in accord with the
experimental assignment based on high resolution angle-resolved ion-yield spectrum [8. 7].
The second and third calculated lines give rise to the second feature in the spectrum (peaks B
and C) whose energies appear slightly underestimated (about 0.3 and 0.4 e V) with respect to
the experimental values (see Table 8.2). Peaks B and C are assigned to the transitions to the
two a* antibonding orbitals 9a1 and 6b2, which have contribution from sulfur 3pz and 3py,
respectively. This agrees with previous theoretical [8.8] and experimental predictions [8.7].
The decrease of the oscillator strength values with respect to the first 3b1 line maps the
decrease of the S 3p contribution in the 9a1 and 6b2 final orbitals, where not negligible sulfur
3d components are present.
N o
0,5
0,4
T"" 0,3
0,2
0,1
2440 2445
S 1s
2450 2455 2460 2465
Excitation Energy (eV)
Figure 8.1. Two-component ZORA TDDFT S ls excitation spectrum of S02. Solid line: theoretical results. Convoluted profiles are obtained with a Gaussian broadening of 1.0 eV of FWHM. The peak labels refer only to the calculated structures. Dashed line: experimental spectrum from ref. [8.6]. The experimental profile has been shifted on the calculated energy scale. The vertical dashed line shows the calculated ionization limit.
At higher energy the Rydberg structures are present. The experiment by Adachi et al. [8.7]
resolves two weak peaks (denoted as D ad E in the experiment) split by about 0.4 eV which
126

are assigned to S ls ~ 4p Rydberg transitions, on the basis of a molecular field splitting of
the S 4p orbitals similar to the splitting of the lowest three S 3p virtual valence orbitals.
Following our theoretical results, the Rydberg states have a quite mixed character, the low
lying contain also some contribution from the valence S 3p atomic component; this valence-
Rydberg mixing is responsible for the quite high oscillator strength carried by the Rydberg
structures. A part from the first Rydberg state, which has an essentially sulfur s Rydberg
character (mainly S 4s) and therefore a negligible oscillator strength, the following 4bi, lla1
and 7b2 orbitals have a predominant S 4p Rydberg character. Their energy splitting is 0.3 e V
both between the 4b1 (4px) and lla1 (4p2 ) orbitals and the 1 la1 and the 7b2 (4py) orbitals, as
reported in Table 8.2. This description confirms therefore the experimental attribution of ref.
[8.7]. The S ls ~ S 4p Rydberg transitions contribute to the peak labeled D in the theoretical
spectrum of Figure 8.1. The following calculated lines contribute to the theoretical peak E
which is attributed to the transitions towards Rydberg excited states with S 3d main character,
as indicated in Table 8.2. This confirms the suggestions of Adachi et al. [8.7], which
tentatively attributed the corresponding experimental feature F to 3d Rydberg transitions. The
relative oscillator strengths are quite low according to the forbidden nature of the ls ~ 3d
transition and reflect the mixed character of the Rydberg excited states. The next theoretical
structure (labeled F in Figure 8.1) is calculated around the ionization threshold and is
contributed by several lines of very low intensity. As we can see in Table 8.2 these are
associated to transitions to Rydberg states contributed also by higher quantum numbers
components (5p, 4d, 5d). It is worth noting that the large difference of the calculated
ionization energy from the experimental value (see Table 8.2) can be ascribed to the too
attractive character of the LB94 potential, as already highlighted in the case of the theoretical
absolute excitation energies. Peak (b) E (eV) f' 102 (e) Transition (d) I Final state (e) EXP(f) EXP (g)
163.73 0.006 6e112 ~ 3bi I Bi a 163.80 0.085 7e112 ~ 3bi I B1 164.8 (h)
164.18 0.033 6e112 ~ 3bi I Ai
b 165.06 0.054 5e112 ~ 3b1 I Bi 166.0 (h) 165.49 0.066 5e112 ~ 3bi I A1 168.01 0.047 7 e112 ~ 9ai /B1
e 168.24 0.053 6e112 ~ 9a1 + 7e112 ~ 9a1 I B2 169.22 168.28 1.249 6e112 ~ 9a1 I B1 169.15 0.251 7e112 ~ 6b2 + 6e112 ~ 6b2 I B2 169.16 0.025 7e112 ~ 6b2 + 6e112 ~ 6b2 I Ai d 170.31 169.27 0.366 6e112 ~ 6b2 + 7 e112 ~ 6b2 I B2 169.39 0.341 6e112 ~ 6b2 + 7e112 ~ 6b2 I Ai
(to be continued)
127

169.46 0.122 5e112 4 9a1 e 169.49 1.112 5e112 4 9a1 170.55
169.63 0.155 5e112 4 9a1 + 6e112 4 6b2 170.15 0.040 7e112 4 l0a1 (S 4s) 170.19 0.155 7e112 4 l0a1 171.30
A 170.26 0.065 6e112 4 lOa1 171.31
170.30 0.131 6e112 4 l0a1 170.31 0.496 6e112 4 l0a1 171.39
170.51 B
0.307 5e112 4 6b2 171.69 170.65 0.500 5e112 4 6b2 171.22 0.068 7e112 4 4b1 (S 4px) 172.41 171.40 0.023 6e112 4 4b1 171.53 0.153 5e112 4 lOa1 (S 4s)
F 171.54 0.308 5e112 4 lOa1 172.54 172.48
171.53 0.038 7e112 4 lla1 (S 4pz) 172.02 171.67 0.046 6e112 4 l la1 171.78 - 171.91 171.68 0.122 6e112 4 l la1 172.10
171.86 0.223 7e112 4 7b2 (S 4py) 171.87 0.075 7e112 4 7b2 172.66 - 172.71 171.97 0.052 6e112 4 7b2 172.68 172.03 0.305 6e112 4 7b2 172.13 0.275 7e112 4 5b1 (S 3dxz) 172.72
G 172.23 0.035 6e112 4 5b1 172.26 0.099 6e112 4 5b1 172.81 172.30 0.278 7e112 4 12a1 (S 3dx,-y,) 173.32 173.31
172.37 0.130 6e112 4 12a1 173.41 172.39 0.056 6e112 4 12a1 172.69 0.046 7e112 4 8b2 (S 3dyz) 172.70 0.022 6e112 4 2a2 (S 3dxy) 172.98
K 172.78 0.075 7e112 4 13a1 (S 3dz2) 173.08 172.91 0.056 5e112 4 l la1 (S 4pz) 172.92 0.107 5e112 4 lla1 173.24 173.22 0.109 5e112 4 7b2 (S 4py) 173.26 0.139 5e112 4 7b2 173.90 173.48 0.215 6e112 4 14a1 (S 5s) 173.12 173.04
N 173.48 0.171 5e112 4 5b1 (S 3dxz) 173.94
173.49 0.111 5e112 4 5b1 173.62 0.066 5e112 4 12a1 (S 3dx2-y2) 174.58 173.63 0.164 5e112 4 12a1 173.82 0.195 7e112 4 7b1 (S ndxz) 173.89 0.020 7e112 4 9b2 (S 5py)
o 173.90 0.053 7e112 4 3a2 (S nd) 173.90 0.042 6e112 4 15a1 (S 5pz) 173.91 0.068 7e112 4 l6a1 (S ns)
( to be contmued)
128
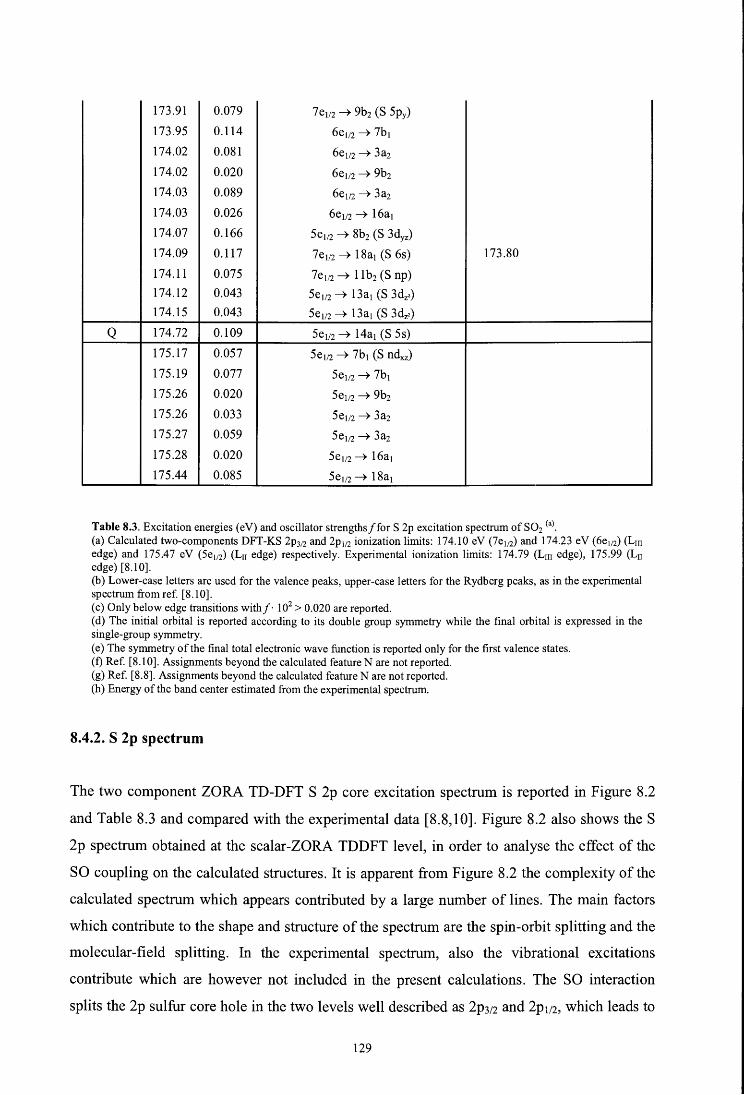
173.91 0.079 7e112--+ 9b2 (S 5py) 173.95 0.114 6e112--+ 7b1 174.02 0.081 6e112 --+ 3a2 174.02 0.020 6e112--+ 9b2 174.03 0.089 6e112 --+ 3a2 174.03 0.026 6e112 --+ 16a 1 174.07 0.166 5e112 --+ 8b2 (S 3dyz) 174.09 0.117 7e 112 --+ 18a1 (S 6s) 173.80 174.11 0.075 7e112--+ llb2 (S np) 174.12 0.043 5e112--+ 13a1 (S 3dz2) 174.15 0.043 5e112 --+ l3a1 (S 3dz2)
Q 174.72 0.109 5e112--+ 14a1 (S 5s) 175.17 0.057 5e112 --+ 7b1 (S ndxz) 175.19 0.077 5e112 --+ 7b1 175.26 0.020 5e112--+ 9b2 175.26 0.033 5e112--+ 3a2 175.27 0.059 5e112 --+ 3a2 175.28 0.020 5e112--+ l6a1 175.44 0.085 5e112 --+ 18a1
Table 8.3. Excitation energies (e V) and oscilla tor strengths f for S 2p excitation spectrum of S02 (a)_ (a) Calculated two-components DFT-KS 2p312 and 2p112 ionization limits: 174.10 eV (7e112) and 174.23 eV (6e112) (Lm edge) and 175.47 eV (5e112) (Ln edge) respectively. Experimental ionization limits: 174.79 (Lm edge), 175.99 (Ln edge) [8.10]. (b) Lower-case letters are used for the valence peak:s, upper-case letters for the Rydberg peaks, as in the experimental spectrum from ref. [8.10]. (e) Only below edge transitions withf" 102 > 0.020 are reported. (d) The initial orbital is reported according to its double group symmetry while the final orbital is expressed in the single-group symmetry. (e) The symmetry of the final total electronic wave function is reported only for the first valence states. (f) Ref. [8.1 O]. Assignments beyond the calculated feature N are not reported. (g) Ref. [8.8]. Assignments beyond the calculated feature N are not reported. (h) Energy of the band center estimated from the experimental spectrum.
8.4.2. S 2p spectrum
The two component ZORA TD-DFT S 2p core excitation spectrum is reported in Figure 8.2
and Table 8.3 and compared with the experimental data [8.8,10]. Figure 8.2 also shows the S
2p spectrum obtained at the scalar-ZORA TDDFT level, in arder to analyse the effect of the
SO coupling on the calculated structures. It is apparent from Figure 8.2 the complexity of the
calculated spectrum which appears contributed by a large number of lines. The main factors
which contribute to the shape and structure of the spectrum are the spin-orbit splitting and the
molecular-field splitting. In the experimental spectrum, also the vibrational excitations
contribute which are however not included in the present calculations. The SO interaction
splits the 2p sulfur core hole in the two levels well described as 2p312 and 2p112, which leads to
129
the existence of spin-orbit partner states responsible for distinct spectral features converging
to Lm and Lu ionization thresholds. Furthermore, the molecular field splits the degenerate 2p
orbitals into ai, bi and b2 orbitals in the C2v symmetry, removing the degeneracy of the 2p312
level. W e would note that in the relativistic spin-orbit description the 2p orbitals correspond
to the 7e112, 6e112 (Lm components, split by the crystal field) and 5e112 (Lu component) spinors,
each of them is described as a mixing of the 2px (bi), 2py (b2) and 2pz (ai) non relativistic
single group components. Three final excited states are possible from each of the three 2p
spinors; namely three states each of Ai, Bi and B2 symmetry of the total electronic wave
function (being the A2 states dipole forbidden). The excited states converge therefore towards
three ionization thresholds, two S 2p312 thresholds (7 e112 and 6e112, Lm components) and one S
2p112 threshold (5e112, Lu component). The intensity distribution among the final excited states
is also modulated by the configuration mixing included in the TDDFT scheme. An assessment
of the generai quality of the present two component results can be carried out comparing the
following data: the calculated molecular field splitting ( energy separati on between the 7 e112
and 6e112 spinors) is 0.13 eV and the experimental value estimated in ref. [8.10] from the two
Lm ionization thresholds is 0.113 e V. For the spin-orbit splitting of Lm edge and the Lu
thresholds the calculated value is 1.3 e V, using the mean value of the two Lm components, in
excellent agreement with the experimental XPS measurements (1.3 e V) [8.18] and the 1.2 e V
value of ref. [8.1 O]. These results compare well with previous theoretical analysis of the
molecular field and spin-orbit effects [8.19,20].
When comparing the two component ZORA TD-DFT results with the experimental spectrum
(Figure 8.2), a good reproduction of the features is apparent. The calculated absolute energies
are generally underestimated by about 1 eV (see Table 8.3) however the energy separation
between the main features is correctly described. Only the shift between the last two
calculated structures just before threshold appear larger than the experimental pattern.
Consider in detail the theoretical results and the assignments of the spectral features reported
in Table 8.3. The lowest energy region (from 164 to 166 e V) includes only the S 2p excitation
to the lowest unoccupied n* orbitai (3bi) which is spin-orbit split into two main components
(labeled a and b) relative to the 2p312 and 2p112 edges. These structures appear very weak
although they are clearly discemible both in the experiment and in the calculations. As
concems the 2p312 edge, the lines with not negligible intensity associated to the initial spinor
7e112 and 6e112 correspond to the 6e112 ~ 3bi (final state of Bi symmetry), 7e112 ~ 3bi (final
state of B1 symmetry) and 6e112 ~ 3b1 (final state of A1 symmetry) transitions. For the
corresponding 2p112 component, two calculated 5e112 ~ 3bi transitions (final excited states of
130

Bi and Ai symmetry) are apparent. Therefore the order of the calculated final excited states
agrees with the experimental attribution [8.10]. The energy separation between the Lm and Lu
3bi calculated structures is about 1.3 e V which compares well with the experimental value of
about 1.2 eV [8.10], although this comparison can be only qualitative being the experimental
structures vibrationally resolved. The low calculated oscillator strength of the 3bi valence
transitions reflects the dominant sulfur 2p character of the 3bi LUMO orbitai, already
evidenced in the S 1 s spectrum where a high intensity is calculated for this transiti on. It is
interesting to underline that the sum of the calculated oscillator strengths for the transitions
from the 7ev2 and 6e112 spinors is almost equal to that from the 5e112 alone, therefore deviating
from the statistica! ratio 2: 1 in good agreement with the experimental data; this can be
explained by large exchange interaction between sulfur 2p hole and excited electron [8.21].
The following intense valence peak (peak c, at 168.3 eV) is assigned to the 2p3;2 ---+ 9ai
excitation, while the highest valence 2p312 ---+ 6b2 excitation is described by a series of less
intense lines indicated as d in Table 8.3 and in Figure 8.2. The main line in this energy region
corresponds to the 2p112 component (at 169.49 e V) of the 9ai excitation which gives rise to
peak e; note that the SO separation between the two 9ai spin-orbit components is 1.2 eV,
again in excellent agreement with the experimental data [8.8]. The intensity ratio of the 2p312
and 2p112 oscillator strengths for the 9ai transitions is substantially equal to 1, as found also
for the lowest valence 3bi excitation. The appearance of the 2p312 ---+ 6b2 excitations under the
same peak as the 2p112 ---+ 9ai is substantiated by its significantly higher intensity in
comparison to the 2p3;2 ---+ 9ai one, found experimentally. The higher intensity of the 9ai
transition is associated with the presence of significant sulfur 3d component in this MO,
which is mixed with the S 3p component and is mapped by the oscillator strength.
In the energy region above 170 e V the core excitations to Rydberg states are calculated. As
we can see in Figure 8.2 the energy separation between the valence and Rydberg transitions is
very small with a consequent partial overlap of the relative spectral features. In particular the
2p112 component of the 6b2 valence transition gives rise to structure B around 170.6 e V while
the lower energy lines contributing to the peak A ( around 170.3 e V) are relative to the first
Rydberg excitation towards the sulfur 4s orbitai (10a1). Therefore in our calculation the
feature A-B around 170.5 e Vis a superposition of the very sharp Rydberg excitation 2p312---+
1 Oai and the valence 2pv2 ---+ 6b2 components, broadened by strong vibrational excitations.
This agrees with the attribution in ref. [8.8], while in ref. [8.1 O] the corresponding sharp peak
is attributed the 2p312 ---+ 4s ai transitions split by the molecular-field effect responsible for the
peak asymmetry. In our calculation the molecular field splitting for the 4s a1 state (difference
131
of the main values of the 7e112 and 6e112 transitions) is 0.10, in excellent agreement with the
experimental one (0.09 e V, see Table 8.3), however it is too low to influence the shape of the
peak in the convolution used for the spectral profiles. The corresponding transitions leading to
the 2p112 edge give rise to peak F around 171.5 eV, following the previous attributions
[8.8,10]. In this region start also the transitions towards the Rydberg sulfur p states. The
assignment of the p series is complex due to the orbital symmetry which increases the
numbers of possible final states, as we can see in Table 8.3. The calculated oscillator strengths
for the np lines are low, as expected from the di po le selection rule for the core transitions, and
decrease on going towards the ionization thresholds. In Table 8.3 we report only the main
character of the final orbital, for simplicity. Following the sequence of the np orbital
components provided by the present calculation the np bi (px) state is the lowest, and the np ai
(pz) and np b2 (py) states are the second and third, as found also in the calculated S ls
spectrum and confirmed by the experimental angle-resolved ion yield experiment [8.7]. This
ordering is different from that proposed in ref. [8.10] (np ai, np bi and np b2) also based on a
multi-channel quantum defect theory (MQDT) calculations from ref. [8.8]. The 4p transitions
extend over an energy range of about 1 e V therefore contribute to the lower energy side of
peak F and to peak G of the calculated spectrum. In this energy region also the 2p3;2
transitions towards the nd Rydberg states appear which give intensity contribution to both the
peak G and the following small peak K. The calculated F-G structures correspond therefore to
the features labeled F, G, H, I in the experiment [8.10]. It has to be noted that the sequence of
nd series in our calculations is nd bi ( dxz), nd ai ( dx2-y2), nd a2 ( dxy), nd b2 ( dyz) and nd ai ( dz2);
however several nd transitions have too low oscillator strength and are not reported in Table
8.3. The calculated peak K includes also the 4p ai transition relative to the 2p112 threshold and
can be correspond to the J, K, L small experimental features on the basis of the attributions
proposed in [8.10]. The following N, O and Q calculated structures include a large number of
lines very close in energy, often there are energy degenerations among different excited states
therefore their separation on the basis of the transitions nature is not possible. In this region it
is therefore hard to search for a close correspondence with the attribution proposed in ref.
[8.1 O]. We can only observe that the N calculated feature consists principally of the 2p312
transition to the 5s Rydberg orbital and ofthe 2p112 components of 3d transitions which extend
to the next structure O around the 2p312 threshold. The calculated peak O includes also the
2p3;2 transition to the 6s Rydberg state as well as towards 5p Rydberg states. The last lines
reported in Table 8.3 represent the corresponding transitions leading to the 2pi12 edge.
132

C\I o
..:...
C\I o
........
"O a; >= e: o ~ N ·e: o :g o ..e: a..
2,0
1,5
1,0
0,5
0,0
2,5
2,0
1,5
1,0
0,5
0,0
162
EXP
164 166
two-component ZORA TDDFT
scalar-ZORA TDDFT
164 166
A-B
F
168 170 172
Photon Energy (eV)
e
e
168 170 172
Excitation Energy (eV)
174
Il Il Il Il
o
174
176
lii lii lii lii lii
176
178
178
Figure 8.2. TDDFT S 2p excitation spectra of S02 from two-component ZORA TDDFT and scalar-ZORA TDDFT calculations. Convoluted profiles are obtained with a Gaussian broadening of 0.25 e V ofFWHM. Upper panel: experimental spectrum from ref. [8.10]. The vertical dashed lines show the calculated ionization limits.
133
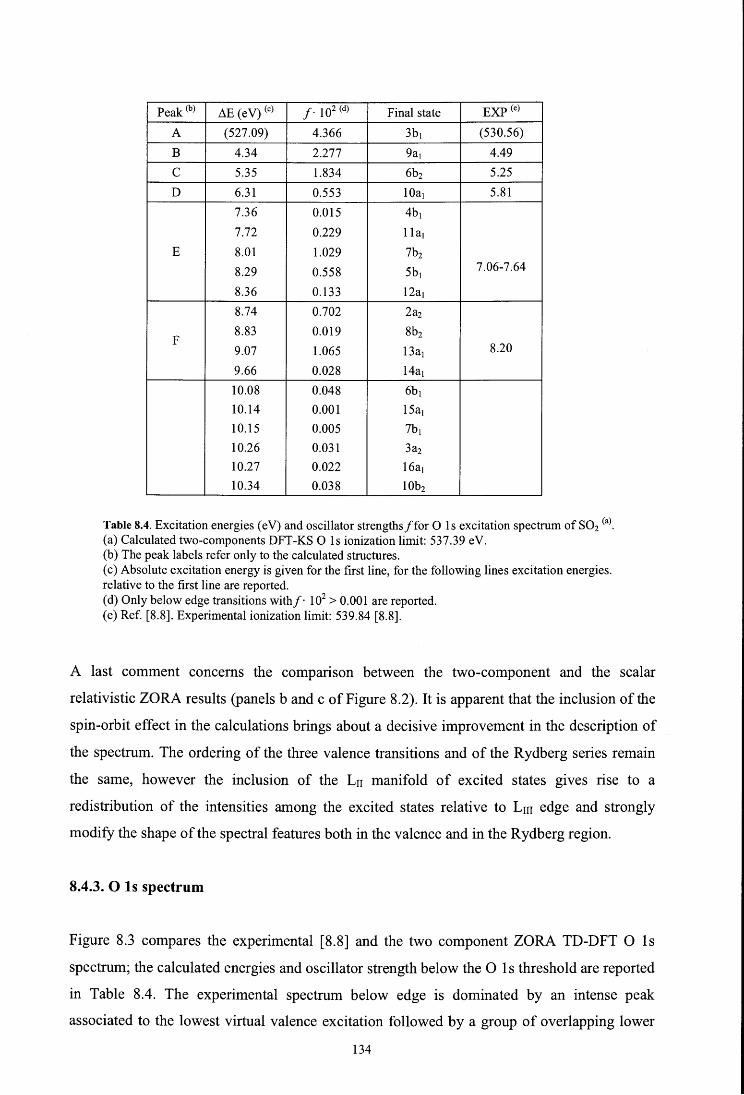
Peak (b) ~E (eV) (e) /" 102 (d) Final state EXP(e)
A (527.09) 4.366 3br (530.56)
B 4.34 2.277 9a1 4.49 e 5.35 1.834 6b2 5.25
D 6.31 0.553 lOa1 5.81
7.36 0.015 4b1 7.72 0.229 lla1
E 8.01 1.029 7b2 8.29 0.558 5br 7.06-7.64
8.36 0.133 12a1 8.74 0.702 2a2 8.83 0.019 8b2
F 8.20 9.07 1.065 l3a1 9.66 0.028 14a1 10.08 0.048 6b1 10.14 0.001 15a1 10.15 0.005 7b1 10.26 0.031 3a2 10.27 0.022 l6a1 10.34 0.038 lOb2
Table 8.4. Excitation energies (e V) and oscillator strengths f for O 1 s excitation spectrum of S02 (a).
(a) Calculated two-components DFT-KS O ls ionization limit: 537.39 eV. (b) The peak labels refer only to the calculated structures. (e) Absolute excitation energy is given for the first line, for the following lines excitation energies. relative to the first line are reported. (d) Only below edge transitions with/ · 102 > 0.001 are reported. (e) Ref. [8.8]. Experimental ionization limit: 539.84 [8.8].
A last comment concems the companson between the two-component and the scalar
relativistic ZORA results (panels b and c of Figure 8.2). It is apparent that the inclusion of the
spin-orbit effect in the calculations brings about a decisive improvement in the description of
the spectrum. The ordering of the three valence transitions and of the Rydberg series remain
the same, however the inclusion of the L11 manifold of excited states gives rise to a
redistribution of the intensities among the excited states relative to Lm edge and strongly
modify the shape ofthe spectral features both in the valence and in the Rydberg region.
8.4.3. O 1s spectrum
Figure 8.3 compares the experimental [8.8] and the two component ZORA TD-DFT O ls
spectrum; the calculated energies and oscillator strength below the O 1 s threshold are reported
in Table 8.4. The experimental spectrum below edge is dominated by an intense peak
associated to the lowest virtual valence excitation followed by a group of overlapping lower
134

intensity features corresponding to the a* valence and Rydberg transitions. A clear separation
between the valence and Rydberg excited states is not apparent in the spectrum and there are
still some uncertainties in the attribution of the Rydberg structures leading up to the ionization
edge. Figure 8.3 shows the good agreement between the theoretical and experimental
spectrum both as concems the energy separation and the intensity distribution, apart from a
slight overestimate of the energy separation between the D and E calculated features with
respect to the experiment (see Figure 8.3). Following the angular momentum selection rule,
the oscillator strength/for the excitations starting from the O ls initial state maps the oxygen
p content of the final states. The oxygen ls orbitals have ai and b2 symmetry and the dipole
selection rules require the Ai, Bi and B2 symmetry for the electronic wave function. Due to
the quasi degeneracy of the initial O ls orbitals, the Ai and B2 final excited states are almost
degenerate therefore, in practice, the number of lines present in the calculated spectrum is
lower than it could be expected. Let us consider in detail the theoretical results. The absolute
energy values are underestimated, as already mentioned, however the energy shifts correctly
reproduce the experimental pattern. The high intensity of the first 3bi (n*) valence transition
(peak A) reflects the significant O 2p character ofthe final orbital in particular with respect to
the two higher a* valence transitions (9ai and 6b2) which give rise to the peaks B an C in the
calculated spectrum. The dominant p character (both O 2p and S 3p atomic components) of
the 3bi valence orbital is mapped by the large relative oscillator strength of the transition from
the s type core orbi tal (S 1 s and O 1 s) and the weak oscillator strength from the S 2p orbi tal.
The energy separations between the three valence transitions are consistent with those found
in the S 1 s spectrum as well as in the S 2p spectrum, considering the Lm edge excited states.
Such similarity, which is also confirmed by the experimental data, suggests that the energies
of the virtual valence orbitals in S02 are not strongly dependent on the particular hole state
involved in the transitions, therefore the correlation effects can be considered approximately
the same for various core holes. The first Rydberg transition (towards lOai orbital) is
separated by the highest valence transition of about 1 e V, which is also the value found for the
analogous energy shift in the S 1 s and S 2p spectra. In the S 1 s spectrum such transiti on has a
very low intensity (see Table 8.2) and it dominates instead the Rydberg region in the S 2p
spectrum, due to the dipole forbidden and allowed characters of the relative transitions
respectively. At variance with excitation from the S 1 s orbi tal, O p orbitals can participate to
the nominally "4s" 1 O ai Rydberg orbi tal, and this is detected by the oscillator strength giving
rise to peak D in the O 1 s spectrum. The next calculated transitions below edge follow the
same order found in the S 1 s spectrum and contribute to the feature labeled E-F in the
135

theoretical spectrum. The 4b1, lla1 and 7b2 final MOs mainly describe the Px, Pz and py
Rydberg orbitals; the most intense transition is towards the 7b2 orbitai which contains a more
significant Op Rydberg character and mainly contributes to the feature E. This also includes
the next transition towards the 5b1 MO which is the first of the series of the 3d Rydberg
orbitals. The calculated feature E corresponds to the experimental peaks labeled E-F in ref.
[8.22], which are assigned to the transitions towards the 4p orbitals and 3d bi orbitai, in
agreement with the present TDDFT results. The following calculated 3d Rydberg transitions
give rise to the calculated feature F. This assignment ofthe Rydberg sequence is in substantial
agreement with that proposed in the experimental work of Sze et al. [8.8] while there are
some differences with respect to the assignment in ref. [8.11] based on Xa calculation. The
rest of the calculated transitions leading to the ionization threshold have very low intensity
and correspond to np and nd Rydberg states.
N o
6
T'"" 4
2
O 1s
""""" o --t-"""T""'"-r----..---~---,...---+--T..........,--.,....-,......_-r-..1..-........... ~.....-................................................. '""'+'...__,.."""'-T-.,.--.---I
520 525 530 535 540 545
Excitation Energy (e V)
Figure 8.3. Two-component ZORA TDDFT O ls excitation spectrum of S02. Solid line: theoretical results. Convoluted profiles are obtained with a Gaussian broadening of 0.8 eV of FWHM. The peak labels refer only to the calculated structures. Dashed line: experimental spectrum from ref. [8.8]. The experimental profile has been shifted on the calculated energy scale. The vertical dashed line shows the calculated ionization limit.
136
8.5. CONCLUSIONS
The core excitation spectra of S02 molecule have been calculated by means of the TDDFT
formalism within the two component relativistic ZORA approximation. The method is able to
treat the core electron excitations and to accurately describe the fine-structure splitting of the
core excited states experimentally resolved in high-resolution measurements.
The S 1 s and O 1 s excitation spectra are not significantly influenced by the relativistic
treatment because the scalar relativistic contribution only shifts the absolute transition
energies without changing the energy separation among the spectral features and the intensity
distribution. The theoretical results are in excellent agreement with the experimental data and
allow to assign all the spectral features observed in the higher energy region below threshold.
The description of the S 2p photoabsorption spectrum is strongly affected by the spin-orbit
relativistic contribution. Both valence and Rydberg excitations are found to be spin-orbit split
of about 1.3 e V and a further splitting of the 2p312 level is introduced by the molecular field
effect, determining three ionization thresholds for the sulfur 2p excitations. The calculated
spectrum compares well with the high resolution experimental data and allows the assignment
ofthe very complex pattern ofthe Rydberg excited states below edge.
The relative computational economy of the present relativistic approach, together with its
level of accuracy, shows promise in the calculations of core excitation spectra of larger
systems also containing transition metal atoms, for which the relativistic spin-orbit treatment
appears mandatory for a complete simulati on of the L edge spectra.
137

9. TDDFT CALCULATIONS OF NEXAFS SPECTRA OF
MODEL SYSTEMS FOR S02 ADSORBED ON THE MgO (100)
SURF ACE
Fronzoni G., De Francesco R.., Stener M., J Chem. Phys. A, submitted.
The Time Dependent Density Functional Theory approach has been employed to simulate the
core excitation spectra of model systems for the absorption of S02 on MgO (100) regular
surface. All the edges, sulfur K- and L-edges and oxygen K-edge have been considered in the
calculations. Cluster models are adopted to describe the different interaction modes of S02
with the acid and basic sites of the surface. The main aspects of the MgO surface modeling
have been considered and their influence on the calculated spectra of the adsorbed molecule
has been analyzed. The results show that the method provides a viable tool for obtaining
excitation energies and oscillator strengths in this big systems and allows to investigate the
origin of the spectral features. The comparison between the spectra calculated for the
adsorbate models and the spectrum of the free S02 allows to discuss the nature of the
adsorbate-substrate interaction (physi- or chemisorption) in terms of the differences in their
excitation spectra.
9.1. INTRODUCTION
Near-Edge X-ray Absorption Spectroscopy (NEXAFS) has proven to be a powerful locai
probe technique for the investigati on of both electronic and geometrie structure of condensed
matter. The spectral features lie near the ionization limit of a specific core state and are
generated by the excitation of that atomi e core-orbi tal electron into the unoccupied electronic
states of the system. The excitation process is govemed by dipole selection rules and the
intensity of the spectral features maps the atomi e site component of the virtual states which is
dipole allowed; therefore K-edge spectra can be essentially interpreted in terms of s ~ p
transitions, while L-edge profiles arise from p ~ s and p ~ d transitions. NEXAFS
spectroscopy has been shown to be a spectroscopy well suited for obtaining atom-specific and
symmetry selective electronic structure information due to the highly localized nature of the
138
core hole in the final state which makes the spectra very sensitive to the locai environment of
the absorbing atom. For these reasons NEXAFS is a very important probe of materials and it
has been widely used to study the adsorbate structure on surfaces and to characterize the
extent and the typology of the adsorption process [9 .1]. In particular, the nature of the
adsorbate-substrate interaction (physi- or chemisorption) can be discussed in terms of the
differences in spectral features between the free molecule and the adsorbate excitation spectra.
In physisorption the adsorbate interacts very weakly with the substrate so the overlap between
the adsorbate and substrate valence orbitals is very small, preserving the electronic structure
of the free species. In chemisorption the orbitai overlap leads to a re-hybridization of the
valence levels leading to changes in the excitation spectra. The NEXAFS spectrum for a
chemisorbed phase is still dominated by intramolecular excitations [9.2], however the
modifications induced by the substrate can affect both the positions and the intensities of the
spectral features thus reflecting the influence that the surface plays in determining the
electronic structure of the system. A deeper analysis of the core-to-valence transitions and of
the corresponding final orbitals through theoretical calculations can be therefore useful to give
interpretation of the spectral features also in terms of the interaction between the molecule
and the surface.
From the computational point of view, the description of electronic excited states of
condensed systems needs theoretical methods capable to fulfill requirements of accuracy and
computational economy. In this respect, recent applications of the Time Dependent Density
Functional Theory (TDDFT) approach to the simulation ofthe core excitation spectra ofmetal
oxides [9.3-5] have demonstrated the potentiality of the method to describe the discrete
transitions in solid systems. The TDDFT method formally includes the coupling between the
single excitations therefore it overcomes the limitations of simpler approaches based on
independent particle approximation, allowing to describe interchannel interactions such as the
coupling between degenerate core hole state (like in 2p orbitals).
It seems relevant to explore the adequacy of the TDDFT approach to describe the core
excitation spectra of an interesting class of "large systems", namely molecular adsorbates,
employing a cluster model to simulate the surface. In this work we consider the S02 molecule
adsorbed on MgO. This system represents a model particularly suited for the calibration of the
computational strategy due to the large number of experimental and theoretical investigations
on the adsorption of S02 at oxide surfaces. The study of the complex chemistry of S02 on
oxide surfaces [9.6-14] is of great importance because metal oxides offer a potential route for
removing or destroying S02, which is one of the most dangerous components of the
139

atmospheric pollution. MgO is frequently used in industry as scrubber to reduce S02 emission
and we have chosen it as substrate for the adsorption because the MgO surface has been
widely studied and well characterized both experimentally [9.15-17] and computationally
[9 .18-21 ], including several specific studies of S02 adsorption [9 .22,23]. Spectroscopic
techniques, such as infrared IR [9.23,24], X-ray photoemission XPS [9.9-12] and NEXAFS
spectroscopies [9.9-13], also give a substantial contribution to understand the molecular
aspects of the interaction of S02 with the adsorption sites of the MgO surface and to
characterize the SOx species formed after dosing S02 to the surface. The adsorption of S02 on
MgO (100) surface can occur in several typologies [9.10,11,22]: the interaction with Mg2+
( acid) sites is mainly electrostatic, so that the S02 molecule remains almost unperturbed after
the interaction with MgO substrate (physisorption); low-coordinated (four- or even three-
coordinated) 0 2- surface sites like steps, kinks or comers, as well as defective sites, are very
reactive and originate SO{ chemisorbed spécies; surface regular (five-coordinated) basic 0 2-
anions are instead less reactive [9 .11,23]. Another controversia! aspect is the formati on of
sulfate species (S04), that seems to be strongly dependent on experimental conditions
[9.10,11,24,25].
Here we present TDDFT calculations of core excitation spectra of S02 adsorbed on a regular
non-defective MgO (100) surface, considering all S02 core edges (S ls, S 2p and O ls). To
this purpose we have used a cluster-model approach which has been successfully applied to
the study of core excitations ofbulk metal oxides [9.3-5]. The interaction ofthe S02 molecule
with the surface cluster has been described through three adsorption models to represent the
S02 physisorption at the acid sites and the S02 chemisorption to the basic sites to form S03-
like and S04-like species. Some experimental aspects ofthe S K-edge of S02 on MgO are not
completely clarified; while the lower energy structure in the spectra is associated to the
formation of S03 on the MgO (100) surface, some uncertainties remain for the attribution of
the following peaks in particular as concems the presence of S04 species. Possible
information on the origin of the spectral features can be provided by the analysis of the
calculated spectra and particularly useful to this end can be the comparison of the calculated
spectrum of the adsorbate with the analogous spectrum of the free S02, in order to discuss the
nature of the interaction molecule-surface in terms of the spectral changes and their
correlation with the electronic structure.
140
9.2. THEORETICAL METHOD
The TDDFT approach for electron excitations and its implementation in the ADF code have
been described in detail in [9 .26,27] to which we refer the reader for the details, so here we
just recall the salient steps and outline the modifications needed to apply the formalism to
core excitations. The equation which is actually solved is the eigenvalue equation:
(9.1)
(9.2)
in (9.2) the indexes i, j and a, b indicate occupied and virtual Kohn-Sham (KS) orbitals
respectively, while cr and T referto the spin variable; Ei and Ea are the KS molecular orbitai
energ1es.
The elements of the coupling matrix K are given by:
(9.3)
where cp are the KS orbitals and (:'(r,r',ro) is the exchange-correlation kemel.
In Eq. (9.1) the eigenvalues ro? correspond to squared excitation energies, while the oscillator
strengths can be extracted from the eigenvectors Fi according to standard TDDFT method
[9 .26]. Eq. (9 .1) is solved employing the Davidson iterative algorithm.
In Eq. (9 .3) the exchange-correlation kemel is approximated according to the Adiabatic Locai
Density Approximation (ALDA) [9.28].
Eq. (9.1) is in principle correct to treat both valence and core excitations. However, the core
excitation energies lie very high in the excitation spectrum, therefore it is not easy to extract
them with the Davidson algorithm which is very efficient to obtain the lowest states. To
overcome this problem it is possible to approximate the configuration space spanned by the
solutions of Eq. (9 .1 ), which corresponds to the 1 h-1 p excited configurations; the reduction of
this space is achieved by operating a proper selection over the configurations, keeping only
those necessary for an accurate description of the phenomenon, as it is customary in ab initio
CI calculations. For the core excitations, in practice, the indexes spanning the occupied
141
orbitals space (i andj) can be limited to run only aver the core shell under study [9.29]. In this
way Eq. (9 .1) is solved far a smaller Q matrix than the originai one and the core excited states
are the lowest states of this submatrix, therefare allowing an effective use of the Davidson
algorithm. Similar computational schemes employed in ab initio calculations have fumished
excellent results far the core excitation spectra [9.30 and refs. therein].
9.3. COMPUTATIONAL DETAILS
The calculations have been perfarmed with the ADF program [version 2005.01]. Two
different basis sets consisting of Slater-Type-Orbital (STO) functions have been used, in
particular the DZP basis set (Mg: 6s, 3p, ld; O: 4s, 2p, ld; S: 6s, 4p, ld) and the even
tempered basis set QZ3P-1DIF (S: 9s, 7p, 4d, 2f; O: 7s, 5p, 3d, 2f) taken from the ADF
database.
Far the calculation of the excitation spectra of free and adsorbed S02 the QZ3P-1DIF set has
been employed, because the presence of diffuse functions in the basis set is necessary to
describe the transitions towards Rydberg states. The DZP basis set has been used to describe
the MgO surface clusters. Furthermore, the Frozen Core (FC) computational technique has
been used far Mg and O cluster atoms in arder to reduce the computational effort without
losing in accuracy; it consists of treating explicitly only outer level electrons, while the
innermost (core) atomic shells are kept frozen. The fallowing FC scheme has been adopted:
Mg
o FC2p
FC ls
core 7s 3p I outer 2s lp ld
core 5s I outer 2s 2p ld
The DZP basis set has been employed far all atoms in the geometry optimizations, treating all
core shells at FC level; the FC scheme far the S atom at the DZP level is the fallowing:
s FC2p core 7s 5p I outer 2s 2p ld
Particular care has been devoted to design the cluster models far the simulation of the MgO
(100) regular surface; in particular the number of atomic layers and of Mg and O atoms of
each layer, this aspect will be discussed in detail in the next section (Section 9.4.1). Here we
just point out that all cluster models have been embedded in appropriate arrays of Point
142
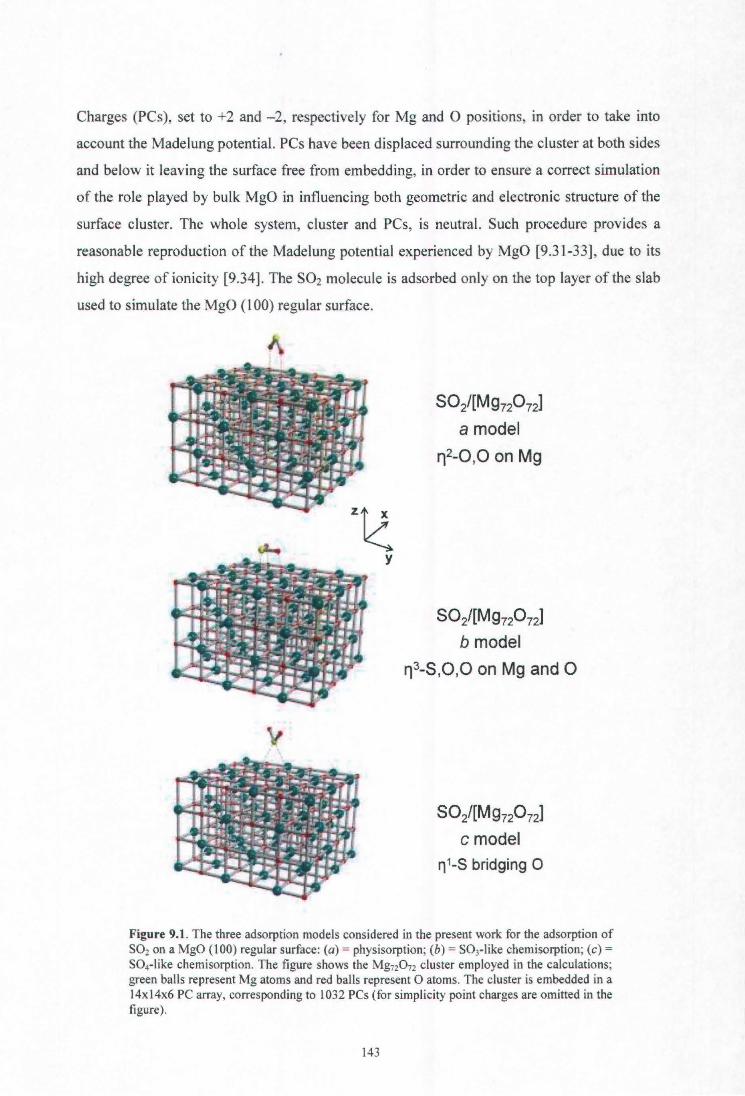
Charges (PCs), set to +2 and -2, respectively for Mg and O positions, in order to take into
account the Madelung potential. PCs have been displaced surrounding the cluster at both sides
and below it leaving the surface free from embedding, in order to ensure a correct simulation
of the role played by bulk MgO in influencing both geometrie and electronic structure of the
surface cluster. The whole system, cluster and PCs, is neutra!. Such procedure provides a
reasonable reproduction of the Madelung potential experienced by MgO [9.31-33], due to its
high degree of ionicity [9 .34]. The S02 molecule is adsorbed only on the top layer of the slab
used to simulate the MgO (100) regular surface.
SOif[Mg720 72]
a model
ri2-0,0 on Mg
S02/[Mg720 72]
b model
ri3-S,O,O on Mg and O
S02/[Mg720 72]
e model 111-s bridging o
Figure 9.1. The three adsorption models considered in the present work for the adsorption of S02 on a MgO (100) regular surface: (a)= physisorption; (b) = S03-like chemisorption; (e)= S04-like chemisorption. The figure shows the Mg720 72 cluster employed in the calculations; green balls represent Mg atoms and red balls represent O atoms. The cluster is embedded in a 14xl4x6 PC array, corresponding to 1032 PCs (for simplicity point charges are omitted in the figure) .
143
Three typologies of S02 adsorption have been considered (see Figure 9.1), namely:
physisorbed S02, which involves bonding of S02 to two Mg sites via the O atoms (1ro,o coordination in a model); chemisorbed S03-like, in which the three atoms ofthe molecule are
bonded to the surface leading to formation of a S03-like species (113 -S,0,0 coordination on
Mg and O in b model); chemisorbed S04-like, in which the tetrahedral S04 group is formed
by interaction of the S atom with two oxygen atoms of the surface (11 1-S bridging O
coordination in e model). Geometries a and e fulfill C2v symmetry group, while geometry b
has a lower symmetry (C8). Geometry Optimizations have been carried out employing the
VWN [9.35] potential. In all cases only the S02 geometry has been optimized, leaving the
underneath MgO cluster fixed in its position; this procedure gets its rightfulness from the
generally accepted observation that the MgO regular (100) surface undergoes almost no
reconstruction or relaxation [9.33,36-39].
The adiabatic locai density approximation (ALDA) has been employed to approximate the
XC kernel. For the XC potential applied in the Self Consistent Field (SCF) calculations the
LB94 [9.40] XC potential has been used with the Ground State (GS) electron configuration;
this potential shows the correct asymptotic behavior required for a good description of virtual
orbitals. The SAOP exchange correlation potential [9.41] is also characterized by a correct
asymptotic behaviour and its performance for the description of the XAS spectra has been
also valuated in some preliminary test calculations carried on for the smallest MgO cluster
model: the comparison of the LB94 and SAOP TDDFT results do not reveal significant
dependency from the two XC potentials, apart from a large and well-known underestimate of
the absolute excitation energies provided by the SAOP potential. As concerns the problem of
the core hole relaxation, experience has shown that the employment of the LB94 potential
gives best results for core excitations with GS orbitals without the need of relaxation. In
generai, at the TDDFT level the use of a relaxed scheme does not imply a significant
improvement ofthe results both in the valence [9.42] and in the core region [9.29].
For each spectrum the theoretical ionization threshold value is also given; it is calculated as
the opposite eigenvalue relative to the corresponding core orbitai, and is useful mainly to
characterize the spectrum in order to distinguish the below-edge region, where a discrete
orbitai description is absolutely adequate, from the above-edge region, where such an
approach determines a discretization of the non-resonant continuum that is in part an artifact
of the calculation, so that only qualitative information can be extracted above the ionization
threshold. The calculated spectra bave been convoluted by means of Gaussian functions with
144

appropriate FWHM values (specified in the captions of the figures), in order to facilitate the
comparison with the experimental data.
.., o ...... .;._
.., o
.., o
8
7
6
5
4
3
2
7
6
5
7t*
A
7t*
A
Mg360 36 = 6x6x2
...... 4
3
2
o.+-,.....,...;-.,.-.J.-...-~~--~-1-J.1...p....,.i..,..:::;:::;;:;::;:::;:~.....,.u...,1,JJJ.µ.iJuµ.4.IJ\J...,I...~
2436 2438 2440 2442 2444 2446 2448 2450 2452 2454
excitation energy (eV)
Figure 9.2. TDDFT S ls excitation spectra, relative to geometry (a), calculated for testing the MgO cluster shape and size convergence. Vertical dashed lines: DFT-KS calculated thresholds (opposite S ls eigenvalues), respectively 2448.38, 2448.39, 2448.38 eV. The calculated lines are convoluted using Gaussian functions with FWHM = I.O eV.
145
9.4. RESUL TS AND DISCUSSI ON
The main goal of the present study is to design a computational strategy to calculate at
TDDFT level the core excitation spectra of a molecule adsorbed on a surface modeled by a
cluster of finite size. Therefore we start the discussion with the problem of the surface cluster
design in terms of shape and size and their influence on the spectra of the adsorbed molecule.
Then the spectroscopic results relative to the three different S02 adsorption typologies on the
"convergent" MgO surface cluster are discussed and compared with the calculated spectrum
of the free S02 molecule and the experimental results.
9.4.1. Cluster design
All the cluster models employed to simulate regular MgO (100) surface are built extracting a
proper set of Mg and O atoms from the MgO cubie lattice (NaCl-type ), with the experimental
Mg-O distance of 2.106 A, and embedded in adequate arrays of Point Charges (PCs), which
values are fixed at +2 and -2 respectively, in order to take into account the stabilizing effect
of the rest of the crystal and a proper description of the Madelung potential. All the clusters
are neutral, since they are built by piled-up MgO layers, each layer consisting of the same
number of Mg and O atoms, assumed as Mg2+ and 0 2- ions, respectively, given the highly
ionie character of the oxide.
The clusters have been built considering the number of Mg and O atoms defining the size of
each MgO layer and the number of MgO layers in the slab; we have to consider the evolution
of the calculated spectra with respect to these two cluster dimensions. The analysis has been
carri ed out considering the S 1 s XANES spectrum of S02 relative to the adsorption geometry
a, which has a C2v symmetry, therefore computationally more convenient. The calculations of
the spectra have been performed employing the all electron DZP basis set for the S02
adsorbed molecule, again for the sake of computational economy. The most significant results
are collected in Figure 9 .2. The smallest cluster we have considered consists of two MgO
layers each constituted by a grid of 8 Mg and 8 O atoms [Mg160 16] (upper panel) which is
embedded in a (14x14x4) grid of PCs corresponding to 752 point charges. The influence of
the size of the MgO layer on the spectra can be evaluated building up a second cluster,
[Mg36036], in which each layer is made by a grid of 18 Mg and 18 O atoms (middle panel);
the same PCs array is employed for the embedding. Note that a larger embedding with a
(14x14x6) grid has been also tested for these two clusters, showing in practice no differences
146
as concems the calculated spectral results. As we can see in Figure 9 .2, the generai profiles of
the calculated spectra of S02 adsorbed on these two clusters are not significantly different, in
particular the first peak, labeled A, corresponding to the transition towards the n* antibonding
MO of S02 (LUMO), remains substantially unperturbed. However if we consider in detail the
transitions contributing to the second peak in the below-edge spectrum quite important
differences in the two spectra are apparent, both as concems the number of lines contributing
to the peak and their intensity. In the free S02, this peak is generated by to the two transitions
towards the two cr* molecular antibonding orbitals. In the spectrum of the smallest [Mg16016]
cluster the two main lines, labeled B and C, correspond to the transitions towards two final
states with mainly S 3p character, which substantially maintain the same nature as in the free
S02, with negligible contribution from the MgO surface atomic orbitals. Going to the
[Mg36036] cluster these two lines have completely different intensities and severa! other lines
appear; all the final states have significant contribution from the surface MgO orbitals and the
S 3p atomic contribution spread over these virtual MOs with a different percentage which is
mapped by the oscillator strength. The consequence is a redistribution of the "cr* intensity"
over a larger number oflines.
The effect of the number of MgO layers on the S 1 s spectrum can be analysed by comparing
the results relative to the previous (4x4x2) [Mg160 16] cluster and to the (4x4x4) [Mg32032]
cluster (upper and lower panels of Figure 9.2). In this case the size of each layer is kept
constant (a grid of 8 Mg and 8 O atoms) and the number of layers is increased from 2 to 4.
The [Mg32032] cluster has been embedded in a grid of (14x14x6) PCs. The overall profile of
the S K-edge spectra is very similar, and also the B-C transitions of the second peak maintain
very similar intensity in the two spectra as a consequence of the similar nature of the relative
final MOs. The increase of the cluster nuclearity produced by the inclusion of more MgO
layers is responsible for the increasing number of transitions in this regi on towards final states
ofmainly MgO character.
This analysis suggests that the enlargement of the surface layer brings more relevant
variations in the nature of the final states than the increase of the number of layers. In any
case we think that a better description of the MgO surface for the absorption of S02 can be
provided by the four-layer slab [Mg720 72] where each layer is made by a (6x6) grid ofMg and
O atoms respectively, embedded in an array of (14xl4x6) PCs.
As concems the three different S02 adsorption geometry considered (Figure 9 .1) - namely
S02 physisorption (a model), S03-like chemisorption (b model) and S04-like chemisorption
(e model) - the optimized geometrie parameters relative to the final [Mg720 72] surface cluster
147

are reported in Table 9.1. We also report the corresponding values for the free S02 useful for
comparison. Some informati on about the typology and the extent of the S02 adsorption can be
extracted from these data. In all cases the differences of the geometrica! parameters between
adsorbed and free S02 are small, thus indicating that the interaction with the surface perturbs
only weakly the adsorbed molecule. The largest variation is observed for geometry of b model,
where the S-0 bond distance is lengthened by 0.027 A with respect to the optimized free S02,
and the a(OSO) bond angle is reduced by 4.8°. The bonding interaction of S02 on Mg sites
(geometry of a model) is of electrostatic nature [9.22] and despite the rather strong bonding
found in previous calculations for this conformation, in this adsorption geometry the S02
molecule shows only small deviations from the geometrica! parameters of the free molecule
(see Table 9.1). Also the calculated distance of S02 from the MgO surface in the a and b
adsorption geometri es (Mg8-0 distance) confirms that geometry b provides a stronger
interaction between S02 and MgO surface, being this distance more than 0.1 A shorter in b
conformation than in a conformation, again confirming the results of refs. [9.11,22]. As
concems the e adsorption geometry the S02 geometrie parameters that are much closer to free
S02 than in the two previous conformations, furthermore the SOr MgO distance, represented
by the 0 8-S distance, gives a value that overcomes 3 A, which indicates that the interaction of
S02 with two oxygen atoms of the regular MgO surface does not form S04, as already
predicted by calculations in refs. [9 .11,22]. We have nonetheless decided to calculated
XANES spectra also for this adsorption typology to explore the response of the spectra to
different interaction molecule-surface and also to provide other information about the problem
of sulfate formation on five-coordinated oxygen MgO surface sites.
d (S-0) (À) a (OSO) (0) d (Mgs-0) (À) d (Os-S) (À)
free S02 1.449 119.6
a: physisorption 112-0,0 on Mg 1.472 118.0 2.338
b: S03-like chemisorption 113 -S,0,0 on O and Mg 1.476 114.8 2.236 2.107
e: S04-like chemisorption 11 1-S bridging O 1.458 118.8 3.038
Table 9.1. Optimized geometrie parameters, calculated at the VWN DZP level, for the free S02 and the S02/MgO a, b, e adsorption models with the Mg720 72 cluster.
148
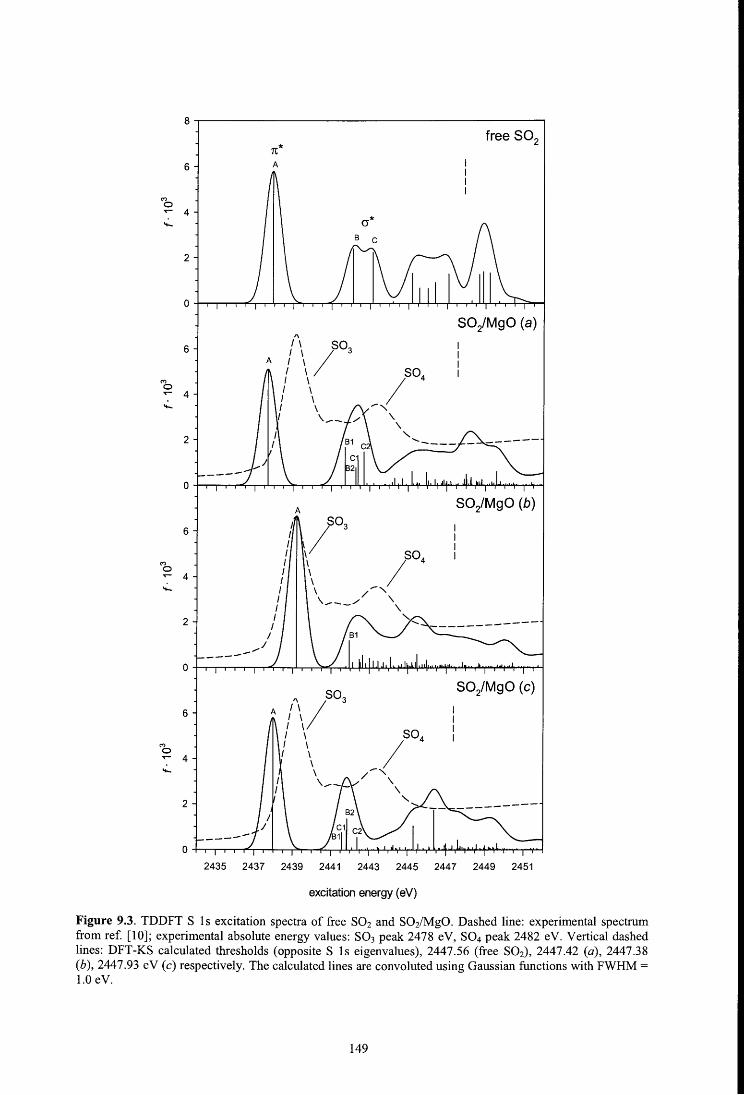
8
n* free so2
6 A
(") o ...-- 4 ..:...
2
o SO/MgO (a)
6 A
S04 (")
~I o ...-- 4 ..:...
\. \.
2 ' ....... ..._ ___ -----o
A SO/MgO (b)
6 ~ /o, I I I \ S04 (") I \ ;- I o I \ ...-- 4 I \ ..:... I \
/ ' I '---- / \ I
2 I -----I I
----___ , J
o SO/MgO (e)
6
(") o ...-- 4 ..:...
2
2435 2437 2439 2441 2443 2445 2447 2449 2451
excitation energy (e V)
Figure 9.3. TDDFT S ls excitation spectra of free S02 and S02/Mg0. Dashed line: experimental spectrum from ref. [10]; experimental absolute energy values: S03 peak 2478 eV, S04 peak 2482 eV. Vertical dashed lines: DFT-KS calculated thresholds (opposite S ls eigenvalues), 2447.56 (free S02), 2447.42 (a), 2447.38 (b), 2447.93 eV (e) respectively. The calculated lines are convoluted using Gaussian functions with FWHM = 1.0 eV.
149
9.4.2. Sulfur K-edge
It is convenient to start the discussion with the analysis of the calculated spectrum of the free
S02, in arder to analyze with more confidence the spectral variations in terms of the nature of
the final states associated to the interaction between the molecule and the surface for the
proposed models. The TDDFT S ls spectrum for the free S02 molecule is reported in the first
panel of Figure 9.3. The S02 molecule belongs to the C2v point group and there are three
unoccupied valence orbitals: b1 * of S 3pn character, which is the LUMO, and a1 * and b2* of S
3pcr character. The two well separated features in the lower energy region of the spectrum
(labeled n* and cr*) are associated to the three core-to-valence transitions andare followed by
a series of weaker lines which give rise to the Rydberg structure before threshold. The first
peak around 2438 e Vis contributed by only one line (A) corresponding to the S ls transition
towards the LUMO n* orbital while the second and third calculated lines (B and C,
respectively around 2442 and 2443 eV) are assigned to the transitions to the two following
antibonding cr* orbitals. This picture agrees with previous theoretical [9 .43] and experimental
[9.44] predictions. The calculated oscillator strength of the S K-edge spectrum maps the S p
character of the final virtual orbitals: the strongest intensity of the lowest n* transition reflects
the dominant S 3p content ofthe LUMO, in particular the S 3px out-of-plane n*. The decrease
of the oscillator strength of the B and C lines with respect to the A line maps the decrease of
the S 3p contribution (S 3py and S 3p2) in the cr* final orbitals, where non-negligible S 3d
components are present. At higher energy the Rydberg structures are present. According to
the dipole selection rule, the most intense transitions involve S 4p Rydberg orbitals, other
transitions towards Rydberg states with mainly S 3d character acquire not negligible intensity
due to the mixing with S np component in the relative final states. A more detailed discussion
of this region is reported in ref. [9.43]; the following discussion concentrates only on the core-
to-valence transitions and their modification in the adsorbed S02 systems.
The TDDFT S K-edge spectra for the three S02 adsorption geometries are presented in Figure
9.3 together with the experimental measurements relative to the adsorption of S02 on a MgO
( 100) crystal at 3 00 K [ 9 .1 O]. Actuall y to discuss the differences among the calculated spectra
of the various geometri es and with the experimental data it is more convenient to consider the
relative energy shifts between the spectral features than the absolute scale, so to facilitate this
task the experimental spectrum has been arbitrarily shifted on the theoretical energy axis. The
experimental spectrum shows a strong peak at 2478 e V which is attributed to the presence of
S03 species on the surface of MgO, on the basis of the energy position which is characteristic
150
of the S K-edge spectra of compounds with the S03 group [9.7,10]. A less intense feature is
present around 2482 eV (S04 peak in the experiment of Figure 9.3) that could in part
correspond to the presence of some sulfate on the surface [9 .1O,11]. This attributi on is made
on the basis of the comparison with the S K-edge spectra of compounds with the S04 group
which exhibit a strong transitions near 2482 e V [9 .11,45]; however the formati on of S04
species is strictly dependent on the experimental conditions [9 .1O,11]. The small experimental
bump in the intermediate regi on ( around 2481 e V) is expected to contain some contributi on
from the S03 transitions [9 .11].
The calculated S K-edge spectrum for the a adsorption model (second panel in Figure 9.3)
does not show significant differences with respect to the spectrum of the free S02. In
particular, the n* peak in the physisorbed state falls at the same energy as in the free S02 peak
while its intensity appears slightly suppressed. Also the energy position of the cr* feature
remains unchanged therefore the energy separation between the n*- cr* structures maintains
constant with respect to the free S02 (about 4.6 eV). It is interesting to analyze the
composition of the cr* transitions of adsorbed S02 which is now contributed by four main
transitions; the first two (labeled Bl and B2) are towards virtual orbitals where S 3pz
contributi on is present while the C 1 and C2 transitions involve virtual orbitals with S 3py
contribution. The nature of the Bl and Cl final MOs is similar to the corresponding Band C
transitions in the free S02 with only a small contribution from the MgO orbitals while
transitions B2 and C2 occur to final orbitals with predominant MgO character. The Rydberg
states are instead more affected by the presence of the surface; in fact the large size of these
orbitals makes them hybridize with the substrate orbitals to form new Rydberg-derived states
which are spread out towards higher energy. The analysis of the final states highlights that the
molecular character of the valence states is substantially preserved in the physisorbate and the
hybridization with the substrate is only slight. The calculated spectral response for the weak
electrostatic interaction between the S02 molecule and the surface is to leave almost
unaffected the energy and intensities of the valence excited states. The comparison with the
experimental profile is not particularly meaningful, as no features are precisely associated to
physisorbed S02. The calculations do not provide any peak in the region of the chemisorbed
S02 where the signal relative to the formation of S03 group is present (around 2473.5 eV
[9.10], as indicated in Figure 9.3).
The most significant changes with respect to the free S02 are apparent in the calculated
spectrum for the b adsorption model; the n* peak appears shifted by 1.3 eV towards high
energy reducing its energy separation from the cr* feature in agreement with the general
151

observation [9 .1] that for a chemisorbed species the energy difference between n* and cr*
features decreases with respect to the free molecule. In particular, we find a ~E (n*-cr*) of 3.4
eV for the b model, to be compared to 4.7 eV for free S02 and 4.5 eV for the a physisorption
model. The cr* feature does not change its energy position; in line with the not significant
elongation of the S-0 bond following the interaction with the surface. In fact a lower energy
shift of the cr* resonance is known to be strongly correlated to the corresponding bond length:
as the bond length is longer, the energy position is getting lower [9.1]. However in the cr*
feature we observe a strong redistribution of the intensity among a large number of weak
transitions compared to the free S02 and the a physisorbate model; here only the B 1 transition
collects a relatively high oscillator strength being the relative excited state mainly contributed
by S 3py component. The other lines in this energy region are associated to excited states with
an essential MgO nature which therefore lose their molecular character. There is also a
parallel broadening of the Rydberg-derived states which tend to overlap with the lowest cr*
feature as a consequence of the adsorbate-substrate hybridization. The shape of the calculated
spectrum in the valence regi on can be consistent with the hypothesis of the formati on of a S03
species on the MgO surface through the formation of a S-08 bond. In the b adsorption model
the S02 molecule lies in a plane that is almost parallel to the MgO surface (xy plane, see
Figure 9 .1) so the n* orbi tal is directed along the adsorption axis z (perpendicular to the
surface) which is the direction of the developing S-08 bond. Therefore a more significant
interaction with the substrate is expected with respect to the other two a and e adsorption
models, which is responsible for the shift to higher energy found for the n* transition. The
experimental S K-edge spectrum of Na2S03 shows the electronic transitions within the S03
group (C3v symmetry) which involve two types of unoccupied valence orbitals: e* of S 3pn
character andai* of S 3s plus S 3pcr character [9.45]. The most intense lower energy peak is
assigned to the n* transition (e* orbital) which falls around 2478 eV [9.10], therefore at
higher energy with respect to the n* transition in free S02 (2473.3 eV, experimental value
from ref. [9.44]); the cr* peak is less intense and separated by about 3 eV [9.11] from the n*
transition, a value close to that found for the spectrum of b model and significantly lower than
the corresponding separation in S02 molecule. Furthermore, the comparison of the spectrum
of b model with the experimental spectrum of S02/Mg0 (third panel ofFigure 9.3) shows that
if we align the experimental and theoretical n* peaks, the calculated cr* feature could partially
account for the experimental bump at the higher energy side of the n* peak, in particular the
most intense valence transiti on B 1 occurs in this energy range. Finally, the calculated
spectrum does not show any peak corresponding to transitions within the hypothetic
152

formation of the S04 group (around 2482 eV, in the experiment), as expected from the
interaction molecule-substrate described by the b model which not includes a possibility of
forming a S04 species.
Finally we discuss the S04-like chemisorption e model: the n* peak is unperturbed with
respect to the free S02 both as concems the energy position and the intensity; the n* orbitai is
in fact parallel to the surface in this adsorption geometry and is not affected by the presence of
the MgO cluster. The cr* feature is calculated at about 3.9 eV higher than the n* peak,
therefore in line with the energy separation found in the free S02. The spectral response
therefore shows that the molecular character of S02 is preserved in this adsorption model, as
it can be also expected from the very large optimized S02-Mg0 distance calculated for this
adsorption typology. The presence of the substrate modifies the compositi on of the final states
contributing to the a* feature compared to free S02 with a splitting of the B and C transitions
in the free S02 into four transitions towards final orbitals in which the S 3p2 and S 3py
character distributes and the contribution from the MgO orbitals is also present and increases
on going towards high energy. The comparison with the experimental profile highlights the
lack of a calculated peak in the region of the absorption of the S04 group as indicated in
Figure 9.3 [9.10,45]. This is expected on the basis of the calculated geometrie parameters for
the e adsorption model, which indicate that the interaction of S02 with two oxygen atoms of
the regular MgO surface does not form S04, as previously discussed; furthermore it is also in
line with the experimental observations which associate the presence of a small amount of
S04 species on the MgO surface only in well precise experimental conditions [9 .1O,11].
9.4.2. Sulfur L2,3-edge
The S 2p spectra calculated for the free S02 molecule and for the three S02/Mg0 adsorption
models are reported in Figure 9 .4. W e show the experimental spectrum of the free S02, in
order to give an assessment of the quality of the theoretical results, while neither theoretical
nor experimental XANES S 2p spectra exist for the S02/Mg0(100) system, to our knowledge.
Let us consider first the results relative to free S02. As we can see in Figure 9.4 the S 2p
spectrum is quite complex due to the large number of lines contributing to the calculated
structures. In fact the molecular field splits the degenerate S 2p core holes into three non
degenerate ai, bi and b2 orbitals in C2v symmetry therefore from each initial orbitai three
dipole allowed transitions can start; the oscillator strength of these transitions maps the sulfur
ns and nd contents of the final states. A complete description of the S 2p spectrum would
153
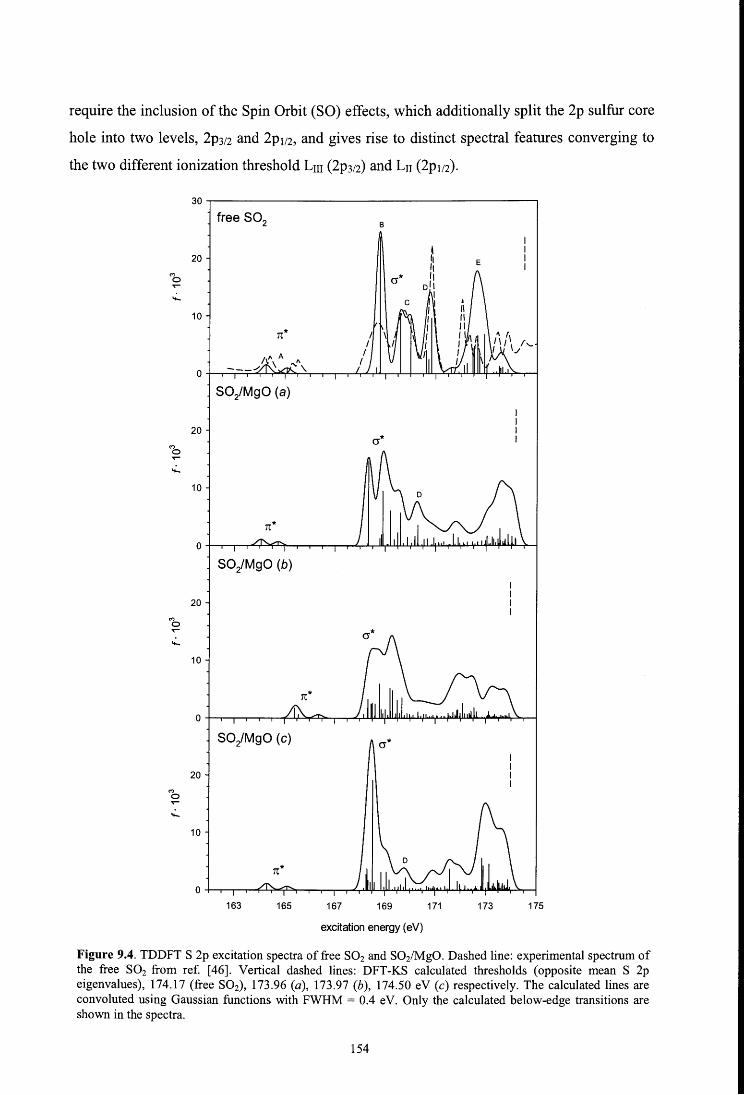
require the inclusion of the Spin Orbit (SO) effects, which additionally split the 2p sulfur core
hole into two levels, 2p312 and 2p112, and gives rise to distinct spectral features converging to
the two different ionization threshold Lm (2p312) and Lu (2p112).
30
free 802 B
20 E
"' o ~
10
o SOiMgO (a)
20 cr*
"' o ~
10
rr* o
SOiMgO (b)
20
"' o ~
10
SOiMgO (e) cr*
20
"' o
163 165 167 169 171 173 175
excitation energy (e V)
Figure 9.4. TDDFT S 2p excitation spectra of free S02 and S02/Mg0. Dashed line: experimental spectrum of the free S02 from ref. [46]. Vertical dashed lines: DFT-KS calculated thresholds (opposite mean S 2p eigenvalues), 174.17 (free S02), 173.96 (a), 173.97 (b), 174.50 eV (e) respectively. The calculated lines are convoluted using Gaussian functions with FWHM = 0.4 eV. Only the calculated below-edge transitions are shown in the spectra.
154
The spin orbit relativistic S 2p spectrum of S02 has been recently calculated [9.43], and we
refer to this work for a detailed discussion. The present calculations do not include the
treatment of the SO coupling, however the main goal of the work is the comparison between
the main spectral features of the free molecule and the adsorbed S02, which can provide the
most important informati on on the S02/Mg0 system even if the relativistic fine details are not
included in the description of the spectra.
The weak lower energy structure (labeled A) of the free S02 spectrum is ascribed to the S 2p
transitions to the lowest unoccupied n* orbitai (b1 *); the low calculated oscillator strength
reflects the dominant S 2p character of the n* MO. The following cr* feature (Band C peaks)
is separated by 4.7 eV from the n* structure, in good accord with the experiment; peaks Band
Care relative to the S 2p transitions into the two a* MOs (a1 * and b2*); the higher intensity of
the cr* transitions with respect to the n* ones is associated with the presence of significant
sulfur d components in these MOs, which mix with the S 2p component. At higher energies
the core excitations to Rydberg states are calculated: the intense D peak is contributed by lines
relative to the first Rydberg excitations towards the sulfur 4s orbitai [9.43,46,47]. The last
feature below the ionization threshold (labeled E) is quite complex and for its complete
assignment we refer to ref. [9.43]. Here we observe that in this energy region start first the
transitions towards the Rydberg sulfur 4p states whose calculated oscillator strengths are low,
as expected from the dipole selection rule. The following most intense lines correspond to
Rydberg sulfur 3d states which give rise to the main peak of the calculated Rydberg feature
and to its higher energy tail.
The spectrum calculated for the a adsorption model resembles that of the free molecule as
concems the energy posi ti on of the main structure, in particular the energy separati on between
the n* and a* features (~E is 4.6 eV). Note that this value is also close to that calculated for
the corresponding n*-cr* energy separation (4.5 eV) in the S K-edge spectrum of the
adsorption model a. The electrostatic interaction with the surface described by this model
does not affect significantly the energy of the valence excited states, confirming the
spectroscopic response found for the S 1 s spectrum. However a qui te significant difference
with the free S02 is apparent in the intensity distribution among the lines contributing to the
a* structure as well as in the Rydberg region, which appears the most affected by the presence
of the surface, as already observed in the S 1 s spectra. The energy closeness between the cr*
valence and Rydberg transitions in S02 allows a certain valence-Rydberg mixing in the final
MOs; the calculated oscillator strength now maps the not negligible sulfur s and d character of
the virtual orbitals, in particular the small percentage of S 4s content, therefore this mixing is
155
responsible for the intensity decrease of the Rydberg S 4s transitions (peak D) with respect to
free S02• The MgO character of the lower energy cr* MO (Bl peak) is small, while it
increases for the next virtual MOs mapped by the oscillator strength; starting from
approximately 170 e V the final states are essentially MgO states. Therefore the S 2p spectrum
shows that the molecular character of the valence states is substantially preserved, in analogy
with the response of the S 1 s spectrum, and that the main spectral differences with the free
S02 can be ascribed to the hybridization of the Rydberg orbitals with the substrate whose
contribution to the final MOs is mapped by the S 2p transitions leading to an intensity
redistribution.
The S 2p spectrum of the b adsorption model shows the most significant variations with
respect to the free S02 spectrum, as observed also in the S 1 s corresponding spectrum. In
particular, the n*-cr* energy difference is sensibly reduced with respect to the free S02 (from
4.7 to 3.0 e V) due to the shift of the n* feature to higher energy by about 1.2 e V; the position
of the cr* resonance remains unchanged although the feature appears broader than in free S02
and spreads over the higher energy side so a clear separation between valence and Rydberg
region is no more visible. The variations occurring with respect to the free S02 spectrum are
even more relevant than for the S K-edge, because of the configuration mixing effect, which
is known to be relevant for degenerate core holes [9 .29]. Furthermore it has to be noted that
the b adsorption model belongs to the Cs symmetry group according to which all virtual levels
can be reached starting from the S 2p core orbitals of a' and a'' irreducible representations;
this is responsible for the higher number of lines contributing to the calculated features and
the higher complexity of the calculated spectral pattern.
As concems the e adsorption model, the spectral response indicates a preservation of the
molecular character of S02, again in line with the response obtained from the S 1 s spectrum.
The energy positions of both n* and cr* features remain unperturbed with respect to the free
S02 and the presence of the substrate is mainly reflected by the compositi on of the final states
contributing to the cr* feature. Here the intensity is concentrated on a strong transition towards
a cr* state where the contribution from sulfur d and s content is more relevant; at the higher
energy side of the cr* feature the peak relative to the S 4s Rydberg transition (labeled D) is
apparent in a region where the contribution from the MgO orbitals to the final states is
relevant. Also in this case the most relevant variations with respect to free S02 are observed
for the Rydberg orbitals which can mix with the substrate orbitals.
156
The analysis of the excitations of the S 2p spectra confirm therefore what suggested by the S
K-edge calculations, even if the interpretation ofthe calculated features appears more difficult
due to the higher number of transitions starting from the non-degenerate sulfur 2p core holes.
9.4.4. Oxygen K-edge
Figure 9.5 shows the O ls spectra calculated for the three a, b and e adsorption models and
for the free S02. Also the experimental spectrum ofthe free S02 is reported [9.46], in order to
assess the quality of the calculated results. No experimental O ls NEXAFS spectra exist for
the S02 adsorbed on MgO. The free S02 spectrum is characterized by a strong low-energy
peak corresponding to the n* transition (b1 *MO) followed by a broader feature contributed
by three lines, the first two relative to the transitions to valence cr* MOs (a1 * and b2*), while
the third represents the transition to the Rydberg S 4s MO. At variance with the excitation
from the S I s orbi tal, the O p orbitals can mix with the nominally "4s" Rydberg orbita! and
their contribution is mapped by the oscillator strength. The next calculated below-edge
transitions describe the other Rydberg states which follow the same order found in the S ls
spectrum (mainly 4p and 3d Rydberg MOs). A good accord with the experimental spectrum is
provided by the TDDFT results. A detailed assignment of the Rydberg region in the O ls
spectrum can be found in ref. [9.46]. Following the angular momentum selection rule, the
oscillator strength calculated for the O K-edge maps the oxygen p content of the final
unoccupied states. The high intensity of the first peak is due to the relevant contributi on given
by O 2p to the LUMO orbita!, in particular with respect to the following cr* valence
transitions, as a result of the S-0 covalent interaction. The energy separation between the
three valence transitions are consistent with the values obtained for S 1 s and S 2p spectra;
such similarity suggest that the calculated energies of virtual valence orbitals in S02 are not
strongly dependent on the particular hole state involved by the excitations.
In the O K-edge spectrum calculated for the a adsorption model the n* and cr* features do not
change their energy position compared to the free S02. The most relevant variations are
associated to the number of transitions contributing to the cr* feature, as in the previous
spectra of a model. This is due to a distribution of the cr* character (S 3p and O 2p atomic
contributions) over a larger number of final orbitals which derive from the presence of surface
MOs. The intensity of these "cr* transitions" map the O 2p content of the final MOs. The
MgO character increases on going towards higher energy and becomes predominant in the
Rydberg region, where many transitions with very low intensity appear. The weak
157
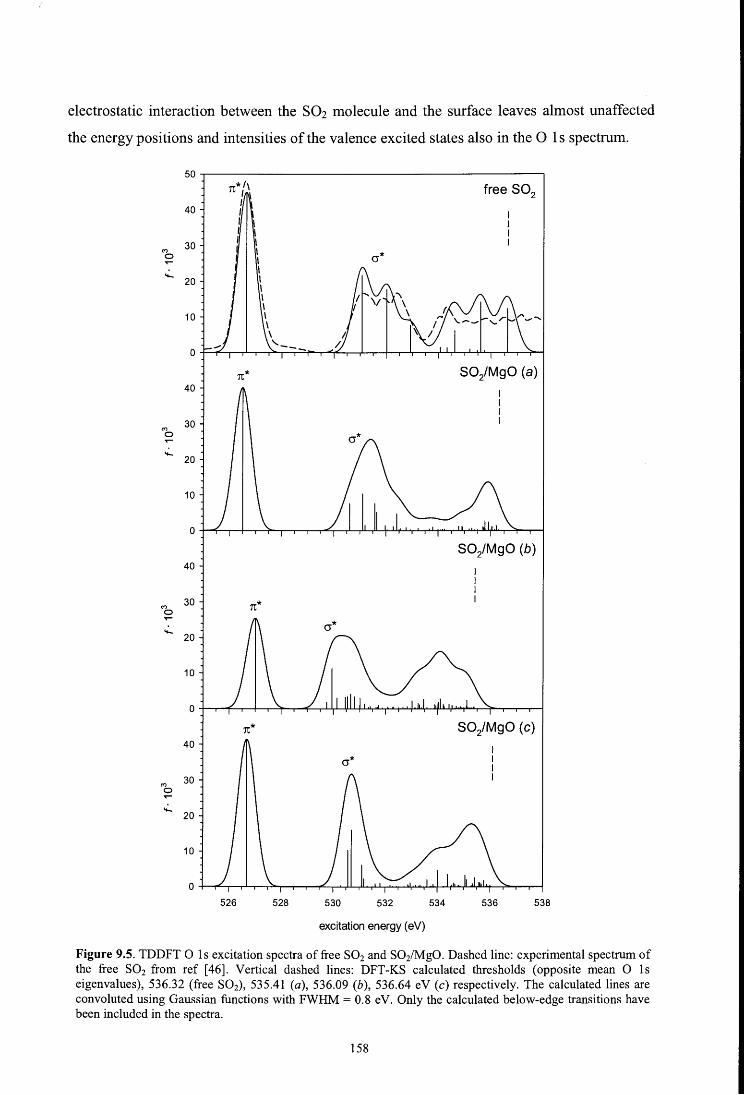
electrostatic interaction between the S02 molecule and the surface leaves almost unaffected
the energy positions and intensi ti es of the valence excited states also in the O 1 s spectrum.
(")
o
.;_
(")
o
.;_
(") o .;_
(")
o
.;_
40
30
20
10
40
30
20
10
40
30
20
10
40
30
20
10
free so2
cr*
n* SO/MgO (a)
SO/MgO (b)
n*
n* SO/MgO (e)
526 528 530 532 534 536 538
excitation energy (e V)
Figure 9.5. TDDFT O ls excitation spectra of free S02 and S02/Mg0. Dashed line: experimental spectrum of the free S02 from ref [46]. Vertical dashed lines: DFT-KS calculated thresholds (opposite mean O ls eigenvalues), 536.32 (free S02), 535.41 (a), 536.09 (b), 536.64 eV (e) respectively. The calculated lines are convoluted using Gaussian functions with FWHM = 0.8 eV. Only the calculated below-edge transitions bave been included in the spectra.
158
The O 1 s spectrum of the b adsorption model shows the most significant variations as
compared to the free S02. There is a small shift to higher energy of the n* peak, less marked
than in the S 1 s and S 2p spectra, and a parallel shift to lower energy of the cr* feature so that
their energy separation (about 3.5 eV) appears reduced with respect to free S02 and similar to
that found in S 1 s and S 2p spectra. The suppression of the n* intensity is consistent with the
generai assumption that fora chemisorbed species the n* peak undergoes a relevant intensity
reduction [9 .48]. This can be explained observing that the n* orbi tal is directed approximately
along the adsorption axis z which is the direction of the of the molecule-surface interaction,
therefore it is expected that the n* peak results modified with respect to the free S02, as
observed also in the S K-edge spectrum. The minor extent of this variation with respect to the
S 1 s case can be interpreted observing that the S-Os distance is significantly shorter than the
two 0-Mgs ones (see Table 9.1), so the O atoms are less affected by the interaction with the
surface than the centrai S atom.
Finally, the O ls spectrum relative to the e model shows an energy separation between the n*
and the cr* features of 4.1 e V, in agreement with the values obtained for the other two core
spectra, thus confirming what argued about the extent of the adsorbate-substrate interaction
when discussing the S K-edge. The n* feature is almost unperturbed with respect to the free
S02, in accord with the considerations already made in the discussi on of the S 1 s results. The
cr* feature appears contributed by two main cr* transitions closer in energy than the
corresponding ones in the free S02, towards final states with the highest O 2p contents and a
relatively low MgO character. The other transitions under the cr* peak involve final MOs of
mainly 4s Rydberg character of S02 mixed with orbital contribution of the MgO surface. It
could be expected that the differences between the O 1 s spectra for free and adsorbed S02
would be smaller than in the case of the S 1 s spectra, since in the e model the O atoms are
more distant from the surface than the S atoms and are therefore expected to be less
influenced by the presence of the substrate. The calculations do not indicate such a trend and
the spectral response of the adsorption model studied in the present work seems to be very
similar for the various core holes considered.
9.5. CONCLUSIONS
In the present work the results from TDDFT calculations of near-edge X-ray-absorption
spectra of S02 free and adsorbed on MgO surface have been presented and analyzed. The
159
interaction of the S02 molecule with the surface cluster has been described by means of three
adsorption models which can be classified as S02 physisorbed at the acid sites (a model) and
S02 chemisorbed to the basic sites to form a S03-like (b model) species and a S04-like (e
model) species.
The regular, non-defective MgO(lOO) surface has been simulated by a cluster model. The
main aspects of the MgO surface modeling have been considered using cluster models in
which both the number of MgO layers and the size of each MgO layer have been increased;
the role played by the two effects on the calculated spectra of the adsorbed molecule has been
analyzed showing that a larger size of each layer is more important to correctly describe the
absorption spectra of the adsorbed molecule.
The NEXAFS spectra ha ve been calculated for the three absorption edges, S 1 s and 2p and O
1 s and for the S K-edge the theoretical results have been compared with the experimental data.
It is shown that this kind of calculations can reproduce the spectral profiles and can provide
an interpretation of calculated features. Particularly useful to this purpose is the comparison of
the calculated spectrum of the adsorbate with the spectrum of the free molecule, which allows
to discuss the nature of the adsorbate-substrate interaction (physi- or chemisorption) in terms
of the differences in their excitation spectra. The calculations have shown that the spectral
features in the valence region of the physisorption model are slightly modified with respect to
the free S02, in accord with the weak interaction between the molecule and the surface
described by the a model. Significant variations are instead provided for the S03-like
chemisorption b model where the modifications induced by the substrate affect both the
position and the intensities of the valence profiles thus reflecting the adsorbate-substrate
hybridization. For the S04-like chemisorption e model the calculated spectral response
indicates that the molecular character of S02 is preserved and supports the hypothesis, largely
debated in literature, that S04 species are not formed on a regular, non-defective MgO(lOO)
surface. It is worthy of remark that all the calculated spectra of the adsorbates appear
considerably less structured than those of the free S02 in the Rydberg region; the large size of
the Rydberg orbitals support the hybridization with the substrate orbitals spreading the
oscillator strength over a large number of Rydberg-derived states.
The theoretical results relative to the different core holes (S 1 s, S 2p and O 1 s) do not indicate
a stronger sensitivity of a particular edge to the nature of the adsorbate-substrate interaction;
analogous spectral trends for the three edges have been observed along the series of the
adsorbate models for S02 on the MgO surface.
160
BIBLIOGRAPHY
Chapter 1
[1.1] Bianconi A., in X-ray absorption: principles, applications, techniques of EXAFS, SEXAFS
and XANES, Koningsberger D. C., Prins R. (Eds.), John Wiley, New York, 1988, p. 573.
[1.2] StOhr J., NEXAFS spectroscopy, Springer Series in Surface Sciences, Vol. 25, Springer-
Verlag, Berlin - New York, 1992.
[1.3] Bianconi A., Appl. Surf. Sci. 6, 392 (1980).
[1.4] Bianconi A., Garcia J., Benfatto M., in Synchrotron radiation in chemistry and biology. 1,
Topics in Current Chemistry, Vol. 145, Mandelkow E., Bazin D. (Eds.), Springer-Verlag,
Berlin Heidelberg, 1988, p. 29.
[1.5] Durham P. J., in X-ray absorption: principles, applications, techniques of EXAFS, SEXAFS
andXANES, Koningsberger D. C., Prins R. (Eds.), John Wiley, New York, 1988, p. 53.
[1.6] Fink J., in Unoccupied electronic states: fundamentals for XANES, EELS, IPS, and BIS,
Topics in applied physics, Vol. 69, Fuggle J. C., Inglesfield J. E., Andrews P. T. (Eds.),
Springer-Verlag, Berlin, 1992, p. 203.
[1.7] Egerton R. F., Electron Energy-Loss Spectroscopy in the Electron Microscope, Plenum Press,
New York- London, 1996.
[1.8] Egerton R. F., Malac M., J Electron Spectrosc. Relat. Phenom. 143, 43 (2005).
[1.9] Dehmer J. L., Dill D., in Electron-molecule and photon-molecule collisions, Rescigno T. N.,
McKoy B. V., Schneider B. (Eds.), Plenum Press, New York, 1979, p. 225.
[1.10] Sheehy J. A., Gill T. J., Winstead C. L., Farren R. E., Langhoff P. W., J Chem. Phys. 91,
1796 (1989).
[1.11] Langhoff P. W., in Electron-molecule and photon-molecule collisions, Rescigno T. N.,
McKoy B. V., Schneider B. (Eds.), Plenum Press, New York, 1979, p. 183.
[1.12] Kosugi N., in X-ray absorption fine structure for catalysts and surfaces, Y. Iwasawa (Ed.),
World Scientific, Singapore, 1996, p. 60.
[1.13] Natoli C. R., in EXAFS and near edge structure, A. Bianconi, L. Incoccia;S. Stiptich (Eds.),
Springer-Verlag, Berlin, 1982, p. 43.
161

[1.14] Sette F., Stahr J., in ~XAFS and near edge structure, Springer Proceedings in Physics, Vol.
2, Hodgson K. O., Hedman B., Penner-Hahn J. E. (Eds.), Springer-Verlag, Berlin, 1984, p.
250.
[1.15] Hitchcock A. P., Wen A. T., Ruhl E., Chem. Phys. 147, 51 (1990).
[1.16] Decleva P., Fronzoni G., Lisini A., Chem. Phys. 168, 51 (1992).
[1.17] de Groot F. M. F., Fuggle J. C., Thole B. T., Sawatzky G. A., Phys. Rev. B 41, 928 (1990).
[1.18] Yoshida S., Tanaka T., in X-ray absarptian fine structure far catalysts and surfaces,
Iwasawa Y. (Ed.), World Scientific, Singapore, 1996, p. 304.
[1.19] Vvedensky D. D., in Unaccupied electranic states: fundamentals far XANES, EELS, IPS,
and BIS, Topics in applied physics, Vol. 69, Fuggle J. C., Inglesfield J. E., Andrews P. T.
(Eds.), Springer-Verlag, Berlin, 1992, p. 139.
[1.20] Sousa C., de Graaf C., Illas F., Phys. Rev. B 62, 10013 (2000).
[1.21] Pacchioni G., Sousa C., Illas F., Parmigiani F., Bagus P. S., Phys. Rev. B 48, 11573 (1993).
[1.22] Sipr O., Simunek A., Bocharov S., Kirchner Th., Drager G., Phys. Rev. B 60, 14115 (1999).
[1.23] Cherkashenko V. M., Dolgikh V. E., Volkov V. L., Sav. Phys. Salid State 30, 220 (1988).
[1.24] Poumellec B., Cortes R., Sanchez C., Berthon J., Fretigny C., J. Phys. Chem. Salids 54, 751
(1993).
[1.25] Kolczewski C., Hermann K., Surf Sci. 552, 98 (2004).
[1.26] Rodriguez J. A., Jirsak T., Sambasivan S., Fischer D., Malti A., J. Chem. Phys. 112, 9929
(2000).
[1.27] Somers J., in Unaccupied electranic states: fundamentals far XANES, EELS, IPS, and BIS,
Topics in applied physics, Vol. 69, Fuggle J. C., Inglesfield J. E., Andrews P. T. (Eds.),
Springer-Verlag, Berlin, 1992, p. 177.
[1.28] Stohr J., Baberschke K., Jaeger R., Treichler T., Brennan S., Phys. Rev. Lett. 47, 381 (1981).
Chapter 2
[2.1] Parr R. G., Yang W., Density-functianal theary af atams and malecules, Oxford University
Press, New York, 1989.
[2.2] Hohenberg P ., Kohn W., Phis. Rev. 136, B864 (1964).
[2.3] Levy M., Prac. Natl. Acad. USA 76, 6062 (1979).
[2.4] Fonseca Guerra C., Snijders J. G., te Velde G., Baerends E. J., Thear. Chem. Ace. 99, 391
(1998).
162
[2.5] Slater J. C., The Self Consistent Field far Molecules and Solids: Quantum Theory of
Molecules and Solids, Vol. 4, McGraw-Hill, New York, 1974.
[2.6] Janak J. F., Phys. Rev. B 18, 7165 (1978).
[2.7] Gorling A., Phys. Rev. A 54, 3912 (1996).
[2.8] Gorling A., Phys. Rev. Lett. 85, 4229 (2000).
[2.9] Casida M. E., in Recent Advances in Density-Functional Methods, Chong D. P. (Ed.), World
Scientific, Singapore, 1995, p. 155.
[2.10] van Gisbergen S. J. A., Snijders J. G., Baerends E. J., Comput. Phys. Commun. 118, 119
(1999).
[2.11] Stener M., Fronzoni G., de Simone M., Chem. Phys. Lett. 373, 115 (2003).
[2.12] Gross E. K. U., Kohn W., Adv. Quantum Chem. 21, 255 (1990).
[2.13] Davidson E. R., J. Comput. Phys. 17, 87 (1975).
[2.14] Lindner T., Sauer H., Engel W., Kambe K., Phys. Rev. B 33, 22 (1986).
[2.15] O'Brien W. L., Jia J., Dong Q.-Y., Callcott T. A., Phys. Rev. B 47, 15482 (1993).
[2.16] Himpsel F. J., Karlsson U. O., McLean A. B., Terminello L. J., de Groot F. M. F., Abbate
M., Fuggle J. C., Yarmoff J. A., Thole B. T., Sawatzky G. A., Phys. Rev. B 43, 6899 (1991).
[2.17] Fronzoni G., Stener M., Decleva P., Wang F., Ziegler T., van Lenthe E., Baerends E. J.,
Chem. Phys. Lett. 416, 56 (2005).
[2.18] SCM - Scientific Computing & Modelling, User's Guide Analysis programs - ADF
program system (release 2005.01), http://www.scm.com.
[2.19] van Leeuwen R., Baerends E. J., Phys. Rev. A 49, 2421 (1994).
[2.20] Gritsenko O. V., Schipper P. R. T., Baerends E. J., Chem. Phys. Lett. 302, 199 (1999).
[2.21] Vosko S. H., Wilk L., Nusair M., Can. J. Phys. 58, 1200 (1980).
[2.22] Wang F., Ziegler T., van Lenthe E., van Gisbergen S., Baerends E. J., J. Chem. Phys. 122,
204103 (2005).
Chapter 3
[3.1] Pacchioni G., Bagus S., Parmigiani F. (Eds.), Cluster models far surface and bulk
phenomena, NATO Asi Series B, Vol. 283, Plenum Press, New York- London, 1992.
[3.2] Xu X., Nakatsuji H., Lu X., Ehara M., Cai Y., Wang N. Q., Zhang Q. E., Theor. Chem. Ace.
102, 170 (1999).
[3.3] Vos K., Krusemeyer H. J., So/id State Comm. 15, 949 (1974).
163
[3.4] Maseras F., Morokuma K., J. Comput Chem. 16, 1170 (1995).
[3.5] Field M. J., Bash P. A., Karplus M., J. Comput. Chem. 11, 700 (1990).
[3.6] Mejias J. A., Femandez-Sanz J., J. Chem. Phys. 102, 327 (1995).
[3.7] Eichler U., Kolmel C. K., Sauer J., J. Comput. Chem. 18, 463 (1996).
[3.8] Barandiaran Z., Seijo L., J. Chem. Phys. 89, 5739 (1988).
[3.9] Sousa C., Casanovas J., Rubio J., Illas F., J. Comput. Chem. 14, 680 (1993).
[3.10] Dungsrikaew V., Limtrakul J., Hermansson K., Probst M., lnt. J. Quantum Chem. 96, 17
(2004).
[3.11] Bredow T., Geudtner G., Jug K., J. Chem. Phys. 105, 6395 (1996).
Chapter 4
[4.1] Batson P. E., Ultramicroscopy 78, 33 (1999).
[4.2] Unoccupied electronic states: fundamentals far XANES, EELS, IPS, and BIS, Topics in
applied physics, Vol. 69, Fuggle J. C., Inglesfield J. E., Andrews P. T. (Eds.), Springer-
Verlag, Berlin, 1992.
[4.3] Lindner T., Sauer H., Engel W., Kambe K., Phys. Rev. B 33, 22 (1986).
[4.4] Bagus P. S., Illas F., Sousa C., J. Chem. Phys. 100, 2943 (1994).
[4.5] Sousa C., Illas F., Ricart J. M., Bagus P. S., Chem. Phys. Lett. 239, 263 (1995).
[4.6] Kostlmeier S., Elsasser C., Phys. Rev. B 60, 14025 (1999).
[4.7] Mizoguchi T., Tanaka I., Yoshiya M., Oba F., Ogasawara K., Adachi H., Phys. Rev. B 61,
2180 (2000).
[4.8] Sousa C., de GraafC., Illas F., Phys. Rev. B 62, 10013 (2000).
[4.9] Duscher G., Buczko R., Pennycook S. J., Pantelides S. T., Ultramicroscopy 86, 355 (2001).
[ 4.1 O] Elsasser C., Kostlmeier S., Ultramicroscopy 86, 325 (2001 ).
[4.11] Broughton J. Q., Bagus P. S., Phys. Rev. B 36, 2813 (1987).
[4.12] Bagus P. S., Pacchioni G., Sousa C., Minerva T., Parmigiani F., Chem. Phys. Lett. 196, 641
(1992).
[ 4.13] Pacchioni G., Sousa C., Illas F., Parmigiani F., Bagus P. S., Phys. Rev. B 48, 11573 (1993).
[4.14] Lorda A., Illas F., Rubio J., Torrance J. B., Phys. Rev. B 47, 6207 (1993).
[4.15] Sousa C., Minerva T., Pacchioni G., Bagus P. S., Parmigiani F., J. Electron Spectrosc.
Relat. Phenom. 63, 189 (1993).
[4.16] Pacchioni G., Bagus P. S., Phys. Rev. B 50, 2576 (1994).
164
[4.17] Sousa C., Illas F., J. Chem. Phys. 115, 1435 (2001).
[4.18] Yamasaki A., Fujiwara T., Phys. Rev. B 66, 245108 (2002).
[4.19] Henrich V. E., Dresselhaus G., Zeiger H. J., Phys. Rev. Lett. 36, 158 (1976).
[4.20] Henrich V. E., Dresselhaus G., Zeiger H. J., Phys. Rev. B 22, 4764 (1980).
[4.21] Nakai S., Mitsuishi T., Sugawara H., Maezawa H., Matsukawa T., Mitani S., Yamasaki K.,
Fujikawa T., Phys. Rev. B 36, 9241 (1987).
[4.22] Di Cieco A., De Crescenzi M., Bemardini R., Mancini G., Phys. Rev. B 49, 2226 (1994).
[4.23] Filipponi A., Di Cieco A., Pianetta P., Kendelewicz T., Phys. Rev. B 53, 15571 (1996).
[4.24] Stener M., Fronzoni G., de Simone M., Chem. Phys. Lett. 373, 115 (2003).
[ 4.25] Engemann C., Kohring G., Pantelouris A., Hormes J., Grimme S., Peyerimhoff S. D., Clade
J., Frick F., Jansen M., Chem. Phys. 221, 189 (1997).
[4.26] Decleva P., Fronzoni G., Lisini A., Stener M., Chem. Phys. 186, 1 (1994).
[4.27] Casida M. E., in Recent Advances in Density-Functional Methods, Chong D. P. (Ed.), World
Scientific, Singapore, 1995, p. 155.
[4.28] van Gisbergen S. J. A., Snijders J. G., Baerends E. J., Comput. Phys. Commun. 118, 119
(1999).
[ 4.29] Gross E. K. U., Kohn W., Adv. Quantum Chem. 21, 255 (1990).
[4.30] Baerends E. J., Ellis D. E., Roos P., Chem. Phys. 2, 41 (1973).
[4.31] Fonseca Guerra C., Snijders J. G., te Velde G., Baerends E. J., Theor. Chem. Ace. 99, 391
(1998).
[4.32] van Leeuwen R., Baerends E. J., Phys. Rev. A 49, 2421 (1994).
[4.33] Vosko S. H., Wilk L., Nusair M., Can. J. Phys. 58, 1200 (1980).
[4.34] Sousa C., Casanovas J., Rubio J., Illas F., J. Comput. Chem. 14, 680 (1993).
[ 4.35] Pascual J. L., Pettersson L. G. M., Mo!. Phys. 101, 255 (2003).
[ 4.36] Toffoli D., Stener M., Fronzoni G., Decleva P., Chem. Phys. 276, 25 (2002).
Chapter 5
[5.1] Batson P. E., Ultramicroscopy 78, 33 (1999).
[5.2] Egerton R. F., Electron Energy-Loss Spectroscopy in the Electron Microscope, Plenum
Press, New York- London, 1996.
[5.3] Lindner T., Sauer H., Engel W., Kambe K., Phys. Rev. B 33, 22 (1986).
[5.4] Bagus P. S., Illas F., Sousa C., J. Chem. Phys. 100, 2943 (1994).
165

[5.5] Kostlmeier S., Elsasser C., Phys. Rev. B 60, 14025 (1999).
[5.6] Sousa C., Illas F., Ricart J. M., Bagus P. S., Chem. Phys. Lett. 239, 263 (1995).
[5.7] Mizoguchi T., Tanaka I., Yoshiya M., Oba F., Ogasawara K., Adachi H., Phys. Rev. B 61,
2180 (2000).
[5.8] Sousa C., de Graaf C., Illas F., Phys. Rev. B 62, 10013 (2000).
[5.9] Duscher G., Buczko R., Pennycook S. J., Pantelides S. T., Ultramicroscopy 86, 355 (2001).
[5.10] Elsasser C., Kostlmeier S., Ultramicroscopy 86, 325 (2001).
[5.11] Stener M., Fronzoni G., de Simone M., Chem. Phys. Lett. 373, 115 (2003).
[5.12] Fronzoni G., Stener M., Reduce A., Decleva P., J. Phys. Chem. A 108, 8467 (2004).
[5.13] Stener M., Fronzoni G., De Francesco R., Chem. Phys. 309, 49 (2005).
[5.14] Pacchioni G., Sousa C., Illas F., Parmigiani F., Bagus P. S., Phys. Rev. B 48, 11573 (1993).
[5.15] Sousa C., Minerva T., Pacchioni G., Bagus P. S., Parmigiani F., J. Electron Spectrosc.
Relat. Phenom. 63, 189 (1993).
[5.16] Casida M. E., in Recent Advances in Density-Functional Methods, Chong D. P. (Ed.), World
Scientific, Singapore, 1995, p. 155.
[5.17] van Gisbergen S. J. A., Snijders J. G., Baerends E. J., Comput. Phys. Commun. 118, 119
(1999).
[5.18] Gross E. K. U., Kohn W., Adv. Quantum Chem. 21, 255 (1990).
[5.19] Baerends E. J., Ellis D. E., Roos P., Chem. Phys. 2, 41 (1973).
[5.20] Fonseca Guerra C., Snijders J. G., te Velde G., Baerends E. J., Theor. Chem. Ace. 99, 391
(1998).
[5.21] van Leeuwen R., Baerends E. J., Phys. Rev. A 49, 2421 (1994).
[5.22] Tanaka I., Adachi H., Phys. Rev. B 54, 4604 (1996).
[5.23] Kanda H., Yoshiya M., Oba F., Ogasawara K., Adachi H., Tanaka I., Phys. Rev. B 58, 9693
(1998).
[5.24] Vosko S. H., Wilk L., Nusair M., Can. J. Phys. 58, 1200 (1980).
[5.25] Sousa C., Casanovas J., Rubio J., Illas F., J. Comput. Chem. 14, 680 (1993).
[5.26] Norman D., Garg K. B., Durham P. J., Solid State Commun. 56, 895 (1985).
[5.27] Modrow H., Bucher S., Rehr J. J., Ankudinov A. L., Phys. Rev. B 67, 35123 (2003).
[5.28] Ubgade R., Sarode P. R., Phys. Status Solidi A 99, 295 (1987).
[5.29] O'Brien W. L., Jia J., Dong Q.-Y., Callcott T. A., Phys. Rev. B 47, 15482 (1993).
[5.30] Himpsel F. J., Karlsson U. O., McLean A. B., Terminello L. J., de Groot F. M. F., Abbate
M., Fuggle J. C., Yarmoff J. A., Thole B. T., Sawatzky G. A., Phys. Rev. B 43, 6899 (1991).
[5.31] Chaboy J., Solid State Commun. 99, 877 (1996).
166
[5.32] Ebert H., StOhr J., Parkin S. S. P., Samant M., Nilsson A., Phys. Rev. B 53, 16067 (1996).
[5.33] Decleva P., Fronzoni G., Lisini A., Stener M., Chem. Phys. 186, 1 (1994).
[5.34] Nakai S., Mitsuishi T., Sugawara H., Maezawa H., Matsukawa T., Mitani S., Yamasaki K.,
Fujikawa T., Phys. Rev. B 36, 9241 (1987).
[5.35] Weng X., Rez P., Phys. Rev. B 39, 7405 (1989).
[5.36] Pascual J. L., Pettersson L. G. M., Mo/. Phys. 101, 255 (2003).
[5.37] Pacchioni G., Bagus P. S., Phys. Rev. B 50, 2576 (1994).
Chapter 6
[6.1] Batson P. E., Ultramicroscopy 78, 33 (1999).
[6.2] Egerton R. F., Electron Energy-Loss Spectroscopy in the Electron Microscope, Plenum
Press, New York - London, 1996.
[6.3] de Groot F. M. F., Coord. Chem. Rev. 249, 31 (2005).
[6.4] Dominguez-Ariza D., Sousa C., Illas F., Ricci D., Pacchioni, G., Phys. Rev. B 68, 54101
(2003).
[6.5] Dominguez-Ariza D., Lopez N., Illas F., Pacchioni G., Madey T. E., Phys. Rev. B 69, 75405
(2004).
[6.6] Carrasco J., Lopez N., Sousa C., Illas F., Phys. Rev. B 72, 54109 (2005).
[6.7] Del Vitto A., Sousa C., Illas F., Pacchioni G., J Chem. Phys. 121, 7457 (2004).
[6.8] Stener M., Fronzoni G., de Simone M., Chem. Phys. Lett. 373, 115 (2003).
[6.9] Fronzoni G., Stener M., Reduce A., Decleva P., J Phys. Chem. A 108, 8467 (2004).
[6.10] Stener M., Fronzoni G., De Francesco R., Chem. Phys. 309, 49 (2005).
[6.11] Fronzoni G., De Francesco R., Stener M., J Phys. Chem. B 109, 10332 (2005).
[6.12] Leapman R. D., Grunes L. A., Fejes P. L., Phys. Rev. B 26, 614 (1982).
[6.13] Mitterbauer C., Kothleitner G., Grogger W., Zandbergen H., Freitag B., Tiemeijer P., Hofer
F., Ultramicroscopy 96, 469 (2003).
[6.14] Farges F., Brown G. E. Jr., Rehr J. J., Phys. Rev. B 56, 1809 (1997).
[6.15] Uozumi T., Okada K., Kotani A., Durmeyer O., Kappler J. P., Beaurepaire E., Parlebas J.
C., Europhys. Lett. 18, 85 (1992).
[6.16] Brydson R., Sauer H., Engel W., Hofer F., J Phys.: Condens. Matter 4, 3429 (1992).
[6.17] Brydson R., Sauer H., Engel W., Thomas J. M., Zeitler E., Kosugi N., Kuroda H., J Phys.:
Condens. Matter 1, 797 (1989).
167
[6.18] Brydson R., Williams B. G., Engel W., Sauer H., Zeitler E., Thomas J. M., Solid State
Commun. 64, 609 (1987).
[6.19] de Groot F. M. F., Faber J., Michiels J. J. M., Czyzyk M. T., Abbate M., Fuggle J. C., Phys.
Rev. B 48, 2074 (1993).
[6.20] de Groot F. M. F., Grioni M., Fuggle J. C., Ghijsen J., Sawatzky G. A., Petersen H., Phys.
Rev. B 40, 5715 (1989).
[6.21] Wu Z. Y., Ouvrard G., Gressier P., Natoli C. R., Phys. Rev. B 55, 10382 (1997).
[6.22] Rez P., MacLaren J. M., Saldin D. K., Phys. Rev. B 57, 2621 (1998).
[6.23] Shirley E. L., J Electron Spectrosc. Relat. Phenom. 136, 77 (2004).
[6.24] Yoshiya M., Tanaka I., Kanako K., Adachi H., J Phys.: Condens. Matter 11, 3217 (1999).
[6.25] Wu Z. Y., Ouvrard G., Natoli C. R., J Phys. IV7 (C2 Vol.1), 199 (1997).
[6.26] Ruiz-L6pez M. F., Mufioz-Paez A., J Phys.: Condens. Matter 3, 8981 (1991).
[6.27] Poumellec B., Durham P. J., Guo G. Y., J Phys.: Condens. Matter 3, 8195 (1991).
[6.28] Casida M. E., in Recent Advances in Density-Functional Methods, Chong D. P. (Ed.), World
Scientific, Singapore, 1995, p. 155.
[6.29] van Gisbergen S. J. A., Snijders J. G., Baerends E. J., Comput. Phys. Commun. 118, 119
(1999).
[6.30] Gross E. K. U., Kohn W., Adv. Quantum Chem. 21, 255 (1990).
[6.31] Baerends E. J., Ellis D. E., Roos P., Chem. Phys. 2, 41 (1973).
[6.32] Fonseca Guerra C., Snijders J. G., te Velde G., Baerends E. J., Theor. Chem. Ace. 99, 391
(1998).
[6.33] van Leeuwen R., Baerends E. J., Phys. Rev. A 49, 2421 (1994).
[6.34] Tanaka I., Adachi H., Phys. Rev. B 54, 4604 (1996).
[6.35] Kanda H., Yoshiya M., Oba F., Ogasawara K., Adachi H., Tanaka I., Phys. Rev. B 58, 9693
(1998).
[6.36] Stener M., Furlan S., Decleva P., Phys. Chem. Chem. Phys. 3, 19 (2001).
[6.37] Stener M., Fronzoni G., Decleva P., Chem. Phys. Lett. 351, 469 (2002).
[6.38] Vosko S. H., Wilk L., Nusair M., Can. J Phys. 58, 1200 (1980).
[6.39] Meagher E. P., George A. L., Can. Minerai. 17, 77 (1979).
[6.40] Sousa C., Casanovas J., Rubio J., Illas F., J Comput. Chem. 14, 680 (1993).
[6.41] Pacchiani G., Ferrari A. M., Marquez A. M., Illas F., J Comput. Chem. 18, 617 (1996).
[6.42] Takahashi O., Pettersson L. G. M., J Chem. Phys. 121, 10339 (2004).
[6.43] Wu Z. Y., Zhang J., Ibrahim K., Xian D. C., Li G., Tao Y., Hu T. D., Bellucci S., Marcelli
A., Zhang Q. H., Gao L., Chen Z. Z., Appl. Phys. Lett. 80, 2973 (2002).
168

[6.44] Beaurepaire E., Lewonczuk S., Ringeissen J., Parlebas J. C., Uozumi T., Okada K., Kotani
A., Europhys. Lett. 22, 463 (1993).
[6.45] Aifa Y., Poumellec B., Jeanne-Rose V., Cortes R., Vendrinskii R. V., Kraizman V. L., J.
Phys. IV1 (C2 Vol.1), 217 (1997).
[6.46] Poumellec B., Cortes R., Tourillon G., Berthon J., Phys. Status Solidi B 164, 319 (1991).
[6.47] Danger J., Le Fèvre P., Magnan H., Chandesris D., Bourgeois S., Jupille J., Eickhoff T.,
Drube W., Phys. Rev. Lett. 88, 243001 (2002).
[6.48] Cabaret D., Joly Y., Renevier H., Natoli C. R., J. Synchrotron Radiat. 6, 258 (1999).
[6.49] Uozumi T., Kotani A., Parlebas J. C., J. Electron Spectrosc. 137, 623 (2004).
[6.50] Potapov P. L., Scryvers D., Ultramicroscopy 99 (2004) 73.
[6.51] Scheu C., Gao M., van Benthem K., Tsukimoto S., Schmidt S., Sigle W., Richter G.,
Thomas J., J. Microsc. 210 (2003).
[6.52] Chaboy J., So/id State Commun. 99, 877 (1996).
[6.53] Ebert H., Stohr J., Parkin S. S. P., Samant M., Nilsson A., Phys. Rev. B 53, 16067 (1996).
[6.54] Decleva P., Fronzoni G., Lisini A., Stener M., Chem. Phys. 186, 1 (1994).
[6.55] de Groot F. M. F., Hu Z. W., Lopez M. F., Kaindl G., Guillot F., Tronc M., J. Chem. Phys.
101, 6570 (1994).
[6.56] Fronzoni G., Stener M., Decleva P., Wang F., Ziegler T., van Lenthe E., Baerends E. J.,
Chem. Phys. Lett. 416, 56 (2005).
[6.57] Grunes L. A., Leapman R. D., Wilker C. N., Hoffmann R., Kunz A. B., Phys. Rev. B 25,
7157 (1982).
Chapter 7
[7.1] de Groot F. M. F., Fuggle J. C., Thole B. T., Sawatzky G. A., Phys. Rev. B 41, 928 (1990).
[7.2] Kurata H., Colliex C., Phys. Rev. B 48, 2102 (1993).
[7.3] Kurata H., Lefevre E., Colliex C., Brydson R., Phys. Rev. B 41, 13763 (1993).
[7.4] Potapov P. L., Jorissen K., Schryvers D., Phys. Rev. B 10, 045106 (2004).
[7.5] de Groot F. M. F., Coord. Chem. Rev. 249, 31 (2005).
[7.6] Lindner T., Sauer H., Engel W., Kambe K., Phys. Rev. B 33, 22 (1986).
[7.7] Bagus P. S., Illas F., Sousa C., J. Chem. Phys. 100, 2943 (1994).
[7.8] Kostlmeier S., Elsasser C., Phys. Rev. B 60, 14025 (1999).
[7.9] Sousa C., Illas F., Ricart J. M., Bagus P. S., Chem. Phys. Lett. 239, 263 (1995).
169
[7.10] Mizoguchi T., Tanaka I., Yoshiya M., Oba F., Ogasawara K., Adachi H., Phys. Rev. B 61,
2180 (2000).
[7.11] Sousa C., de GraafC., Illas F., Phys. Rev. B 62, 10013 (2000).
[7.12] Duscher G., Buczko R., Pennycook S. J., Pantelides S. T., Ultramicroscopy 86, 355 (2001).
[7.13] Elsasser C., Kostlmeier S., Ultramicroscopy 86, 325 (2001).
[7.14] Dominguez-Ariza D., Sousa C., Illas F., Ricci D., Pacchioni, G., Phys. Rev. B 68, 54101
(2003).
[7.15] Dominguez-Ariza D., Lopez N., Illas F., Pacchioni G., Madey T. E., Phys. Rev. B 69, 75405
(2004).
[7.16] Carrasco J., Lopez N., Sousa C., Illas F., Phys. Rev. B 72, 54109 (2005).
[7.17] Del Vitto A., Sousa C., Illas F., Pacchioni G., J. Chem. Phys. 121, 7457 (2004).
[7.18] Stener M., Fronzoni G., de Simone M., Chem. Phys. Lett. 373, 115 (2003).
[7.19] Fronzoni G., Stener M., Reduce A., Decleva P., J. Phys. Chem. A 108, 8467 (2004).
[7.20] Fronzoni G., De Francesco R., Stener M., J. Phys. Chem. B 109, 10332 (2005).
[7.21] Fronzoni G., De Francesco R., Stener M., Causà M., J. Phys. Chem. B 110, 9899 (2006).
[7.22] Grzybowska-Swierkosz B., Trifiro F., Appl. Catai. A 157, 1 (1997), and references therein.
[7.23] Henrich V. E., Cox P. A., The Surface Science of Metal Oxides, Cambridge University
Press, Cambridge, 1994.
[7.24] Kung H. K., in Transition Metal Oxides: Surface Chemistry and Catalysis, Studies in
Surface Science and Catalysis, Vol. 45, Delmon B., Yates J. T. (Eds.), Elsevier, Amsterdam,
1989.
[7.25] Ranea V. A., Vicente J. L., Mola E. E., Amai P., Thomas H., Gambaro L., Surf Sci. 463,
115 (2000).
[7.26] Kempf J. Y., Silvi B., Dietrich A., Catlow C. R. A., Maigret B., Chem. Mater. 5, 641
(1993).
[7.27] Michalak A., Witko M., Hermann K., Surf Sci. 375, 385 (1997).
[7.28] Eyert V., Hock K.-H., Phys. Rev. B 57, 12727 (1998).
[7.29] Chakrabarti A., Hermann K., Druzinic R., Witko M., Wagner F., Petersen M., Phys. Rev. B
59, 10583 (1999).
[7.30] Sayede A. D., Mathieu C., Khelifa B., Aourag H., Mater. Chem. and Phys. 81, 183 (2003).
[7.31] Wong J., Lytle F. W., Messmer R. P., Maylotte D. H., Phys. Rev. B 30, 5596 (1984).
[7.32] Goring E., Mtiller O., Klemm M., den Boer M. L., Horn S., Philos. Mag. B 75, 229 (1997).
[7.33] Su D. S., Zandbergen H. W., Tiemeijer P. C., Kothleitner G., Havecker M., Hébert C.,
Knop-Gericke A., Freitag B. H., Hofer F., SchlOgl R., Micron 34, 235 (2003).
170
[7.34] Hebert C., Willinger M., Su D. S., Pongratz P., Schattschneider P., Schogl R., Eur. Phys. J
B 28, 407 (2002).
[7.35] Kolczewski C., Hermann K., Surf Sci. 552, 98 (2004).
[7.36] Sipr O., Simunek A., Bocharov S., Kirchner T., Drager G., Phys. Rev. B 60, 14115 (1999).
[7.37] Kolczewski C., Hermann K., J Chem. Phys. 118, 7599 (2003).
[7.38] Casida M. E., in Recent Advances in Density-Functional Methods, Chong D. P. (Ed.), World
Scientific, Singapore, 1995, p. 155.
[7.39] van Gisbergen S. J. A., Snijders J. G., Baerends E. J., Comput. Phys. Commun. 118, 119
(1999).
[7.40] Gross E. K. U., Kohn W., Adv. Quantum Chem. 21, 255 (1990).
[7.41] Enjalbert R., Galy J., Acta Crystallogr. C 42, 1467 (1986).
[7.42] Bredow T., Geudtner G., Jug K., J Chem. Phys. 105, 6395 (1996).
[7.43] Baerends E. J., Ellis D. E., Roos P., Chem. Phys. 2, 41 (1973).
[7.44] Fonseca Guerra C., Snijders J. G., te Velde G., Baerends E. J., Theor. Chem. Ace. 99, 391
(1998).
[7.45] van Leeuwen R., Baerends E. J., Phys. Rev. A 49, 2421 (1994).
[7.46] Schipper P. R. T., Gritsenko O. V., van Gisbergen S. J. A., Baerends E. J., J Chem. Phys.
112, 1344 (2000).
[7.47] Tanaka I., Adachi H., Phys. Rev. B 54, 4604 (1996).
[7.48] Kanda H., Yoshiya M., Oba F., Ogasawara K., Adachi H., Tanaka I., Phys. Rev. B 58, 9693
(1998).
[7.49] Stener M., Fronzoni G., De Francesco R., Chem. Phys. 309, 49 (2005).
[7.50] Vosko S. H., Wilk L., Nusair M., Can. J Phys. 58, 1200 (1980).
[7.51] Stener M., Furlan S., Decleva P., Phys. Chem. Chem. Phys. 3, 19 (2001).
[7.52] Stener M., Fronzoni G., Decleva P., Chem. Phys. Lett. 351, 469 (2002).
[7.53] Cherkashenko V. M., Dolgikh V. E., Volkov V. L., Sov. Phys. So/id State 30, 220 (1988).
[7.54] Poumellec B., Cortes R., Sanchez C., Berthon J., Fretigny C., J Phys. Chem. Solids 54, 751
(1993).
[7.55] Uozumi T., Okada K., Kotani A., Durmeyer O. Kappler J. P., Beaurepaire E., Parlebas J. C.,
Europhys. Lett. 18, 85 (1992).
[7.56] Wu Z. Y., Ouvrard G., Natoli C. R., J Phys. JV1 (C2 Vol.1), 199 (1997).
[7.57] Chaboy J., So/id State Commun. 99, 877 (1996).
[7.58] Ebert H., StOhr J., Parkin S. S. P., Samant M., Nilsson A., Phys. Rev. B 53, 16067 (1996).
[7.59] Decleva P., Fronzoni G., Lisini A., Stener M., Chem. Phys. 186, 1 (1994).
171

[7.60] de Groot F. M. F., Hu Z. W., Lopez M. F., Kaindl G., Guillot F., Tronc M., J. Chem. Phys.
101, 6570 (1994).
[7.61] Fronzoni G., Stener M., Decleva P., Wang F., Ziegler T., van Lenthe E., Baerends E. J.,
Chem. Phys. Lett. 416, 56 (2005).
[7.62] Farcy J., Messina R., Perichon J., J. Electrochem. Soc. 137, 1337 (1990).
[7.63] Clauws P., Broeckx J., Vennik J., Phys. Status Solidi B 131, 459 (1985).
Chapter 8
[8.1] Decleva P., Fronzoni G., Lisini A., Stener M., Chem. Phys. 186, 1 (1994).
[8.2] Stener M., Fronzoni G., de Simone M., Chem. Phys. Lett. 373, 115 (2003).
[8.3] Wang F., Ziegler T., van Lenthe E., van Gisbergen S., Baerends E. J., J. Chem. Phys. 122,
204103 (2005).
[8.4] Fronzoni G., Stener M., Decleva P., Wang F., Ziegler T., van Lenthe E., Baerends E. J.,
Chem. Phys. Lett. 416, 56 (2005).
[8.5] Bodeur S., Esteva J. M., Chem. Phys. 100, 415 (1985).
[8.6] Reynaud C., Gaveau M., Bisson K., Millie P., Nenner I., Bodeur S., Archirel P., Levy B., J.
Phys. B 29, 5403 (1996).
[8.7] Adachi J., Takata Y., Kosugi N., Shigemasa E., Yagishita A., Kitajima Y., Chem. Phys. Lett.
294, 559 (1998).
[8.8] Sze K., Brion C. E., Tong X., Li J., Chem. Phys. 115, 433 (1987).
[8.9] Feng R., Cooper G., Burton G. R., Brion C. E., Avaldi L., Chem. Phys. 240, 371 (1999).
[8.10] Gedat E., Puttner R., Domke M., Kaindl G., J. Chem. Phys. 109, 4471 (1998).
[8.11] Jilrgensen A., Cavell R. G., Chem. Phys. 257, 123 (2000).
[8.12] Casida M. E., in Recent Advances in Density-Functional Methods, Chong D. P. (Ed.), World
Scientific, Singapore, 1995, p. 155.
[8.13] Davidson E. R., J. Comput. Phys. 17, 87 (1975).
[8.14] van Lenthe E., Baerends E. J., J. Comput. Chem. 24, 1142 (2003).
[8.15] van Leeuwen R., Baerends E. J., Phys. Rev. A 49, 2421 (1994).
[8.16] Schipper P. R. T., Gritsenko O. V., van Gisbergen S. J. A., Baerends E. J., J. Chem. Phys.
112, 1344 (2000).
[8.17] Zangwill A., Soven P., Phys. Rev. A 21, 1561 (1980).
172

[8.18] Siegbahn K., Nordling C., Johansson G., Hedman J., Heden P. F., Hamrin K., Gelius U.,
Bergmark T., Werme L. O., Manne R., Baer Y., ESCA applied to free molecules, North-
Holland, Amsterdam, 1969, p. 128.
[8.19] Kosugi N., Ishida T., Chem. Phys. Lett. 329, 138 (2000).
[8.20] B0rve K. J., Chem. Phys. Lett. 262, 801 (1996).
[8.21] Kosugi N., J. Electron Spectrosc. Relat. Phenom.131, 335 (2004).
[8.22] Gejo T., Takata Y., Hatsui T., Nagasono M., Oji H., Kosugi N., Shigemasa E., Chem. Phys.
289, 15 (2003).
Chapter 9
[9.1] StOhr J., NEXAFS spectroscopy, Springer Series in Surface Sciences, Voi. 25, Springer-
Verlag, Berlin-New York, 1992.
[9.2] Sette F., StOhr J., in EXAFS and near edge structure, Springer Proceedings in Physics, Voi.
2, Hodgson K. O., Hedman B., Penner-Hahn J. E. (Eds.), Springer-Verlag, Berlin, 1984, p.
250.
[9.3] Fronzoni G., De Francesco R., Stener M., J. Phys. Chem. B 109, 10332 (2005).
[9.4] Fronzoni G., De Francesco R., Stener M., Causà M., J. Phys. Chem. B 110, 9899 (2006).
[9.5] De Francesco R., Stener M., Causà M., Toffoli D., Fronzoni G., Phys. Chem. Chem. Phys. 8,
4300 (2006).
[9.6] Thomton G., J. Phys. Condens. Matt. 1, SBl 11 (1989).
[9.7] Warburton D. R., Purdie D., Muryn C. A., Prabhakaran K., Wincott P. L., Thomton G., Surf
Sci. 269-270, 305 (1992).
[9.8] Muryn C. A., Purdie D., Hardman P., Johnson A. L., Prakash N. S., Raiker G. N., Thomton
G., Faraday Discuss. Chem. Soc. 89, 77 (1990).
[9.9] Rodriguez J. A., Pérez M., Jirsak T., Gonzalez L., Maiti A., Surf. Sci. 477, L279 (2001).
[9.10] Rodriguez J. A., Jirsak T., Gonzalez L., Evans J., Pérez M., Maiti A., J. Chem. Phys. 115,
10914 (2001).
[9.11] Rodriguez J. A., Jirsak T., Freitag A., Larese J. Z., Maiti A., J. Phys. Chem. B 104, 7439
(2000).
[9.12] Rodriguez J. A., Jirsak T., Pérez M., Chaturvedi S., Kuhn M., Gonzalez L., Maiti A., J. Am.
Chem. Soc. 122, 12362 (2000).
[9.13] Freitag A., Rodriguez J. A., Larese J. Z., Mat. Res. Soc. Symp. Proc. 590, 189 (2000).
173
[9.14] Waqif M., Saad A. M., Bensitel M., Bachelier J., Saur O., Lavalley J.-C., J. Chem. Soc.
Faraday Trans. 88, 2931 (1992).
[9.15] Santoni A., Tran Thoai D. B., Urban J., Solid State Comm. 68, 1039 (1988).
[9.16] Oshima C., Mod. Phys. Lett. B 5, 381 (1991).
[9.17] Cox P. A., Williams A. A., J. Electron Spectrosc. Relat. Phenom. 39, 45 (1986).
[9.18] Ferrari A. M., Pacchioni G., Int. J. Quantum Chem. 58, 241 (1996).
[9.19] Pascual J. L., Pettersson L. G. M., Chem. Phys. Lett. 270, 351 (1997).
[9.20] Almeida A. L., Martins J. B. L., Longo E., Furtado N. C., Taft C. A., Sembrano J. R., Lester
W. A. Jr.,lnt. J. Quantum Chem. 84, 705 (2001).
[9.21] Geneste G., Morillo J., Finocchi F., Surf Sci. 532, 508 (2003).
[9.22] Pacchioni G., Clotet A., Ricart J. M., Surf Sci. 315, 337 (1994).
[9.23] Schneider W. F., Li J., Hass K. C., J. Phys. Chem. B 105, 6972 (2001).
[9.24] Bensitel M., WaqifM., Saur O., Lavalley J.-C., J. Phys. Chem. 93, 6581 (1989).
[9.25] Jirsak T., Rodriguez J. A., Langmuir 16, 10287 (2000).
[9.26] Casida M. E., in Recent Advances in Density-Functional Methods, Chong D. P. (Ed.),
World Scientific, Singapore, 1995, p. 155.
[9.27] van Gisbergen S. J. A., Snijders J. G., Baerends E. J., Comput. Phys. Commun. 118, 119
(1999).
[9.28] Gross E. K. U., Kohn W., Adv. Quant. Chem. 21, 255 (1990).
[9.29] Stener M., Fronzoni G., de Simone M., Chem. Phys. Lett. 373, 115 (2003).
[9.30] Decleva P., Fronzoni G., Lisini A., Stener M., Chem. Phys. 186, 1 (1994).
[9.31] Stener M., Fronzoni G., De Francesco R., Chem. Phys. 309, 49 (2005).
[9.32] Pacchioni G., Cogliandro G., Bagus P. S., Surf. Sci. 255, 344 (1991).
[9.33] Pacchioni G., Minerva T., Bagus P. S., Surf. Sci. 275, 450 (1992).
[9.34] Pacchioni G., Sousa C., Illas F., Parmigiani F., Bagus P. S., Phys. Rev. B 48, 11573 (1993).
[9.35] Vosko S. H., Wilk L., Nusair M., Can. J. Phys. 58, 1200 (1980).
[9.36] Pacchioni G., Surf Sci. 281, 207 (1993).
[9.37] Chen L., Wu R., Kioussis N., Zhang Q., Chem. Phys. Lett. 290, 255 (1998).
[9.38] Ferro Y., Allouche A., Corà F., Pisani C., Girardet C., Surf Sci. 325, 139 (1995).
[9.39] Rodriguez J. A., Maiti A., J. Phys. Chem. B 104, 3630 (2000).
[9.40] van Leeuwen R., Baerends E. J., Phys. Rev. A 49, 2421 (1994).
[9.41] Gritsenko O. V., Schipper P. R. T., Baerends E. J., Chem. Phys. Lett. 302, 199 (1999).
[9.42] Zangwill A., Soven P., Phys. Rev. A 21, 1561 (1980).
[9.43] Fronzoni G., De Francesco R., Stener M., Decleva P., J. Chem. Phys., in press.
174

[9.44] Adachi J., Takata Y., Kosugi N., Shigemasa E., Yagishita A., Kitajima Y., Chem. Phys. Lett.
294, 559 (1998).
[9.45] Sekiyama H., Kosugi N., Kuroda H., Ohta T., Bull. Chem. Soc. Jpn. 59, 575 (1986).
[9.46] Sze K., Brion C. E., Tong X., Li J., Chem. Phys. 115, 433 (1987).
[9.47] Gedat E., Puttner R., Domke M., Kaindl G., J. Chem. Phys. 109, 4471 (1998).
[9.48] Triguero L., Pettersson L. G. M., Agren H., Phys. Rev. B 58, 8097 (1998).
175

Ringraziamenti
"Considerate la vostra semenza:
fatti non foste a viver come bruti,
ma per seguir virtute e canoscenza"
Dante Alighieri, Commedia, Inferno, XXVI, 118.
"Come xé Renato? Cos ' te fa ne/a vita? "
"Fazo el dotorato de ricerca all'università"
"Ah, mi inveze lavoro"
Un sentito ringraziamento va alla mia relatrice, prof. Giovanna Fronzoni, per il supporto
puntuale e costante che mi ha fornito durante la mia attività di dottorato, e al prof. Mauro
Stener, prezioso ed insostituibile punto di riferimento in ogni situazione.
Un grazie di cuore alla mia famiglia che sempre mi ha sostenuto lungo il mio cammino.
Un pensiero speciale ai colleghi di stanza che si sono "passati il testimone" durante i miei tre
anni di dottorato, Devis e Alessia (in rigoroso ordine temporale).
Un saluto particolare ai miei "colleghi della pausa pranzo" in terzo piano, non ct provo
nemmeno a ricordarli tutti perché sicuramente ne dimenticherei qualcuno.
Un pensiero ai compagni della Mappets, che hanno contribuito a farmi "scaricare la tensione"
in campo e soprattutto nel dopopartita.
Un ricordo a parte merita la "banda" di Sion, dagli amici della "vecchia guardia" di SMM alle
più recenti conoscenze.
Grazie anche a Ezio e Rocco, che da "allievi" sono divenuti miei fidati amici. E poi, come
dimenticare Massi, da sempre mio amico fraterno e compagno di avventure?
E un immenso grazie (anzi, molto di più) alla mia correttrice di bozze preferita ...
Trieste, marzo 2007