closing the gap in a generation - epi2008.com.br 23_09_11h45_pdf... · social protection health...
TRANSCRIPT
Closing the gap in a Closing the gap in a
generationgenerationMichael MarmotMichael Marmot
UCLUCL
Chair of WHO Commission on Social Chair of WHO Commission on Social Determinants of HealthDeterminants of Health
World Congress of Epidemiology
Porto Alegre, Brazil
Keynote lecture
September 2008

OutlineOutline
Inequities and the social gradientInequities and the social gradient
Convergence of challenges;Convergence of challenges;
Addressing the challenges Addressing the challenges –– taking action taking action
on the social determinants of health on the social determinants of health

Between country inequitiesBetween country inequities……
Life expectancy 43 years shorter for women in Life expectancy 43 years shorter for women in
Zambia (43) than for women in Japan (86) Zambia (43) than for women in Japan (86) (WHO (WHO
2008)2008)
The lifetime risk of maternal death is one in The lifetime risk of maternal death is one in
eight in Afghanistan; it is only 1 in 17 400 in eight in Afghanistan; it is only 1 in 17 400 in
Sweden Sweden (WHO et al 2007)(WHO et al 2007)

Within country inequitiesWithin country inequities……
Life expectancy 17 years shorter for black Life expectancy 17 years shorter for black
men Washington DC than for white men in men Washington DC than for white men in
nearly Montgomery County.nearly Montgomery County.
Maternal mortality 3Maternal mortality 3--4 times higher among 4 times higher among
the poor compared to the rich in Indonesia.the poor compared to the rich in Indonesia.
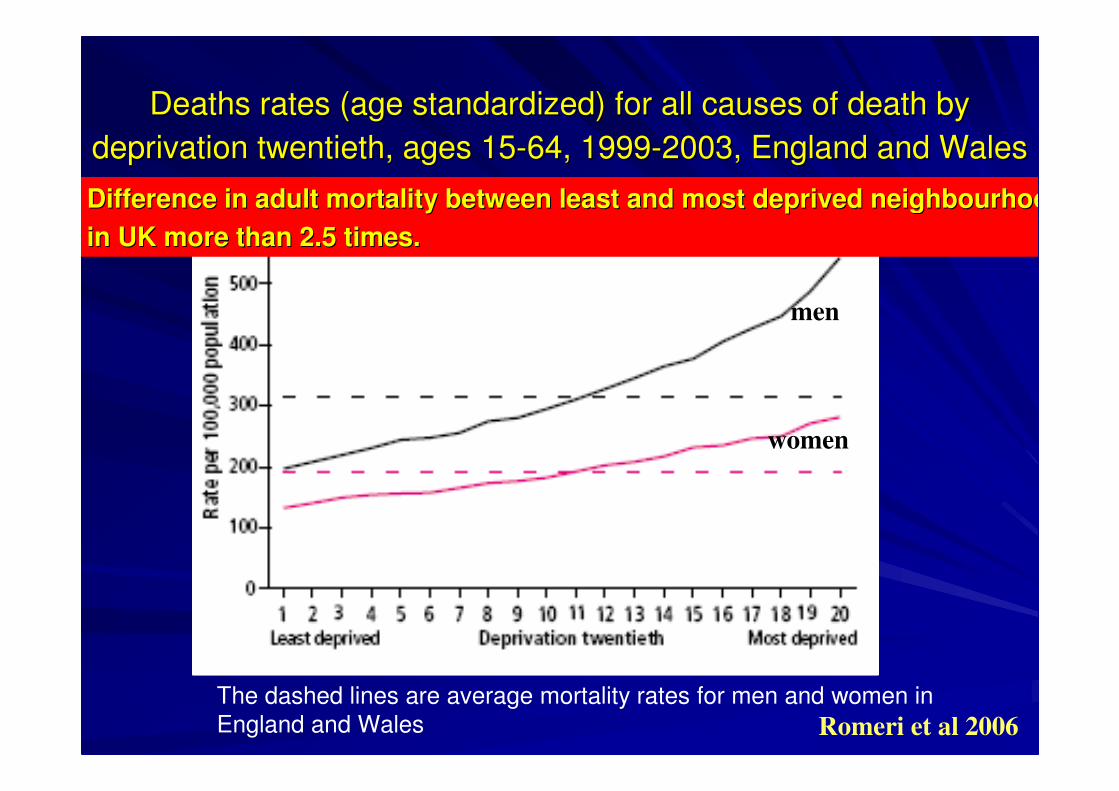
Deaths rates (age standardized) for all causes of death by Deaths rates (age standardized) for all causes of death by
deprivation twentieth, ages 15deprivation twentieth, ages 15--64, 199964, 1999--2003, England and Wales2003, England and Wales
males
females
The dashed lines are average mortality rates for men and women inEngland and Wales
women
men
Romeri et al 2006
Difference in adult mortality between least and most deprived neDifference in adult mortality between least and most deprived neighbourhooighbourhoo
in UK more than 2.5 times.in UK more than 2.5 times.
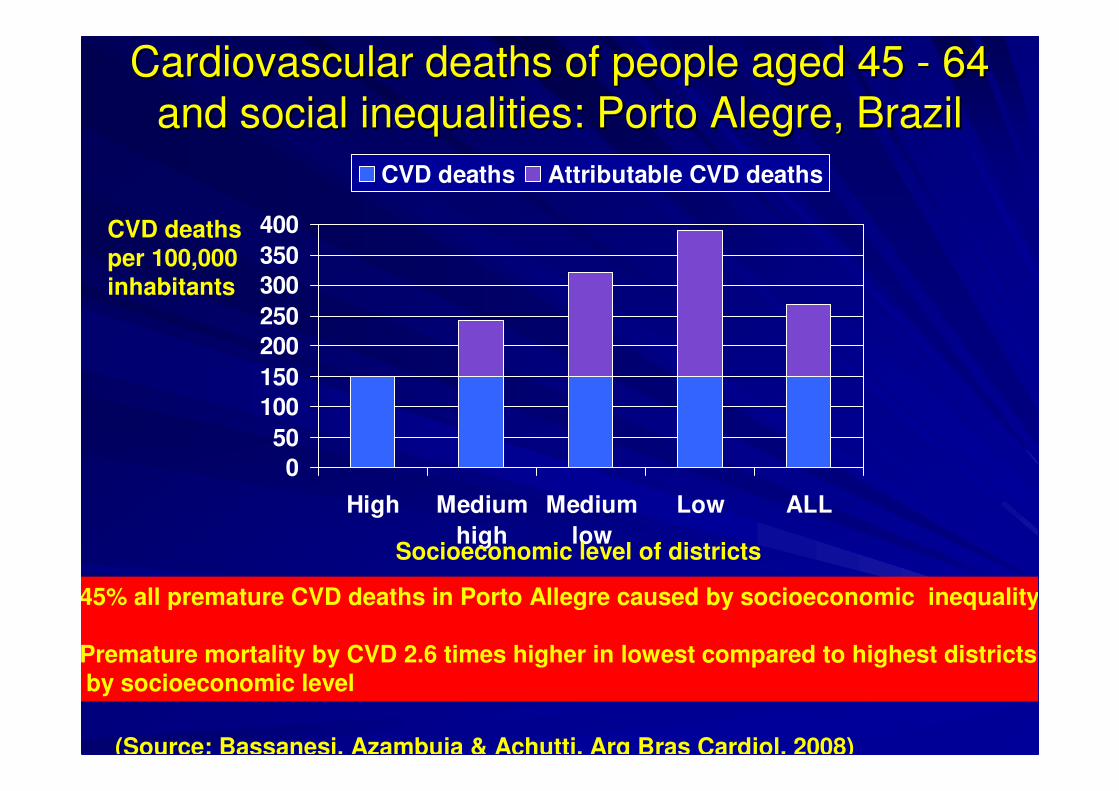
Cardiovascular deaths of people aged 45 Cardiovascular deaths of people aged 45 -- 64 64
and social inequalities: Porto Alegre, Braziland social inequalities: Porto Alegre, Brazil
0
50
100
150
200
250
300
350
400
High Medium
high
Medium
low
Low ALL
CVD deaths Attributable CVD deaths
CVD deathsper 100,000
inhabitants
Socioeconomic level of districts
45% all premature CVD deaths in Porto Allegre caused by socioeconomic inequality
Premature mortality by CVD 2.6 times higher in lowest compared to highest districtsby socioeconomic level
(Source: Bassanesi, Azambuja & Achutti, Arq Bras Cardiol, 2008)
Dramatic inequalities dominate global Dramatic inequalities dominate global
health health
A social gradient in health exists in all A social gradient in health exists in all
countries and within citiescountries and within cities
0
50
100
150
200
Uganda
2000/01
India
1998/99
Turkmenistan
2000
Peru 2000 Morocco
2003/04
Poorest Less poor Middle Less rich Richest
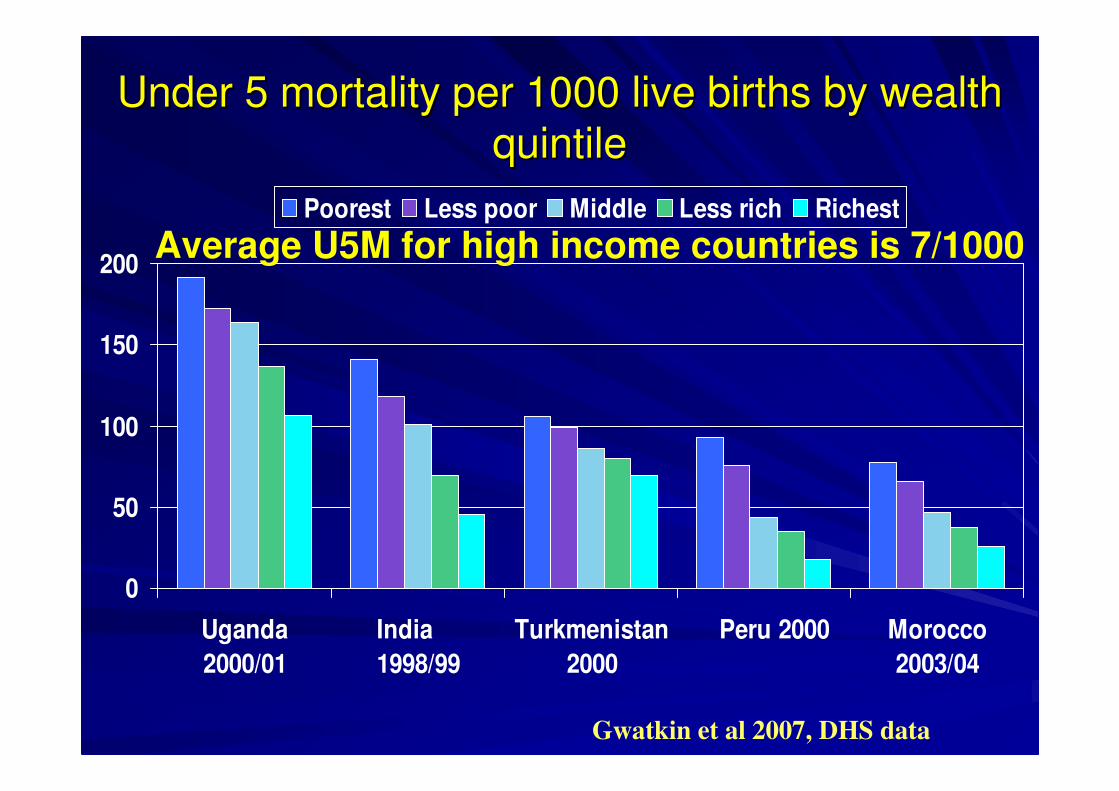
Under 5 mortality per 1000 live births by wealth Under 5 mortality per 1000 live births by wealth
quintilequintile
Gwatkin et al 2007, DHS data
Average U5M for high income countries is 7/1000
OutlineOutline
Inequities and the social gradientInequities and the social gradient
Convergence of challenges;Convergence of challenges;
Addressing the challenges Addressing the challenges –– taking action taking action
on the social determinants of health on the social determinants of health
Double burden of diseaseDouble burden of disease
-- communicable and noncommunicable and non--
communicablecommunicable
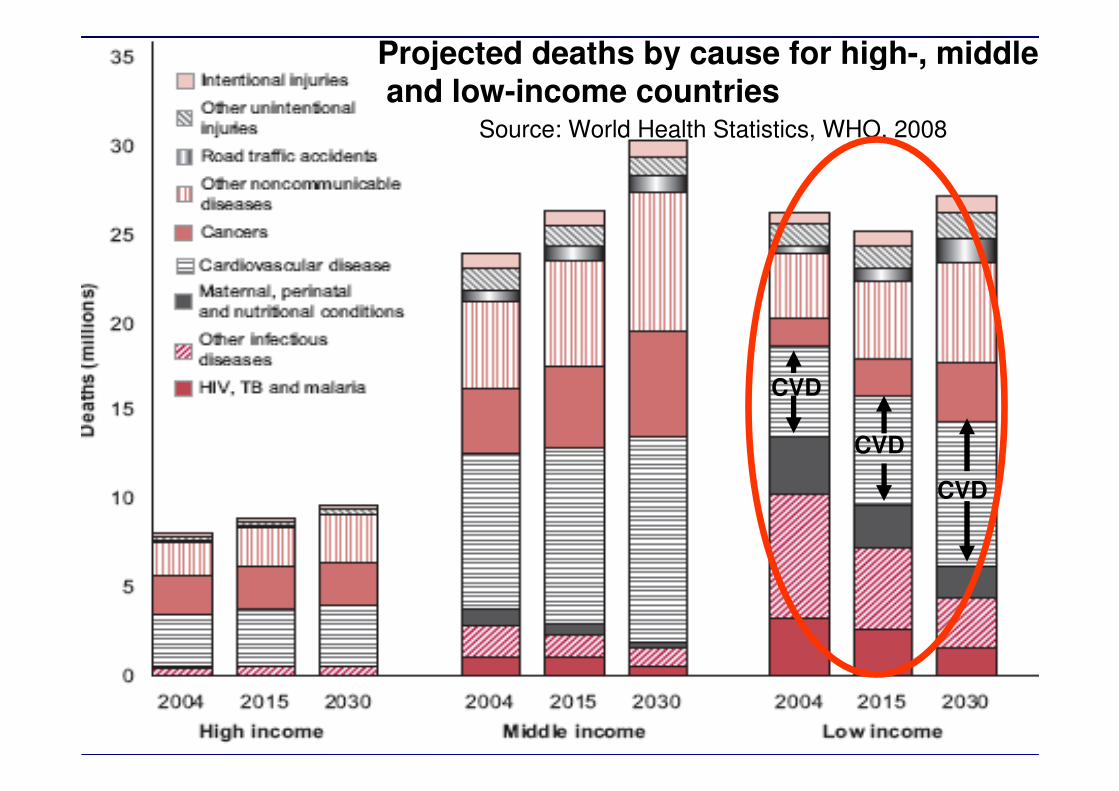
Source: World Health Statistics, WHO, 2008
Projected deaths by cause for high-, middle,and low-income countries
CVD
CVD
CVD
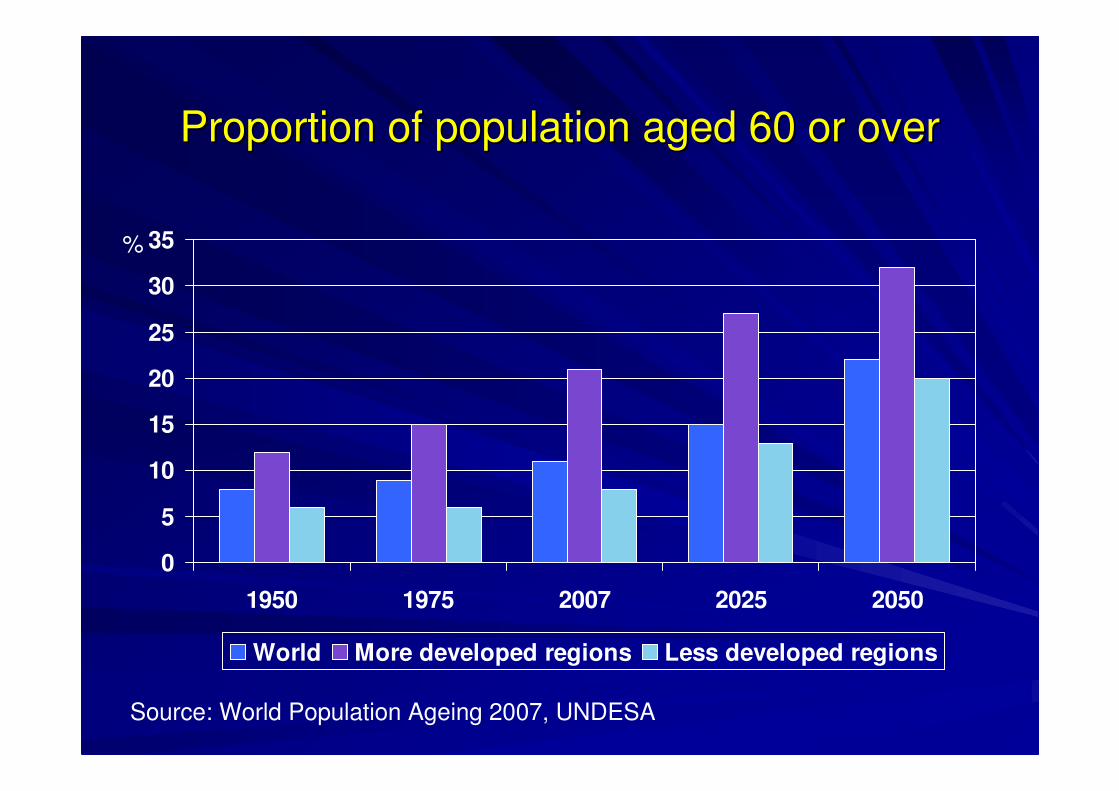
Proportion of population aged 60 or overProportion of population aged 60 or over
0
5
10
15
20
25
30
35
1950 1975 2007 2025 2050
World More developed regions Less developed regions
%
Source: World Population Ageing 2007, UNDESA
Climate change Climate change –– adds urgency to take adds urgency to take
action on SDHaction on SDH

OutlineOutline
So whatSo what’’s news new……??
Convergence of challenges;Convergence of challenges;
Addressing the challenges Addressing the challenges –– taking action taking action
on the social determinants of healthon the social determinants of health

Economic and social policies Economic and social policies
matter for health and health matter for health and health
equityequity

Health Equity as a Development Outcome
Participation
Voice
Agency
Empowerment
PsychosocialMaterial
Political
Health Equity
Daily Living Conditions Early life
Physical and social environments
Working conditionsSocial Protection
Health Care
Structural Drivers
Societal norms and valuesSocial Inequities
Governance and FinancingEconomic Growth and Social Policy
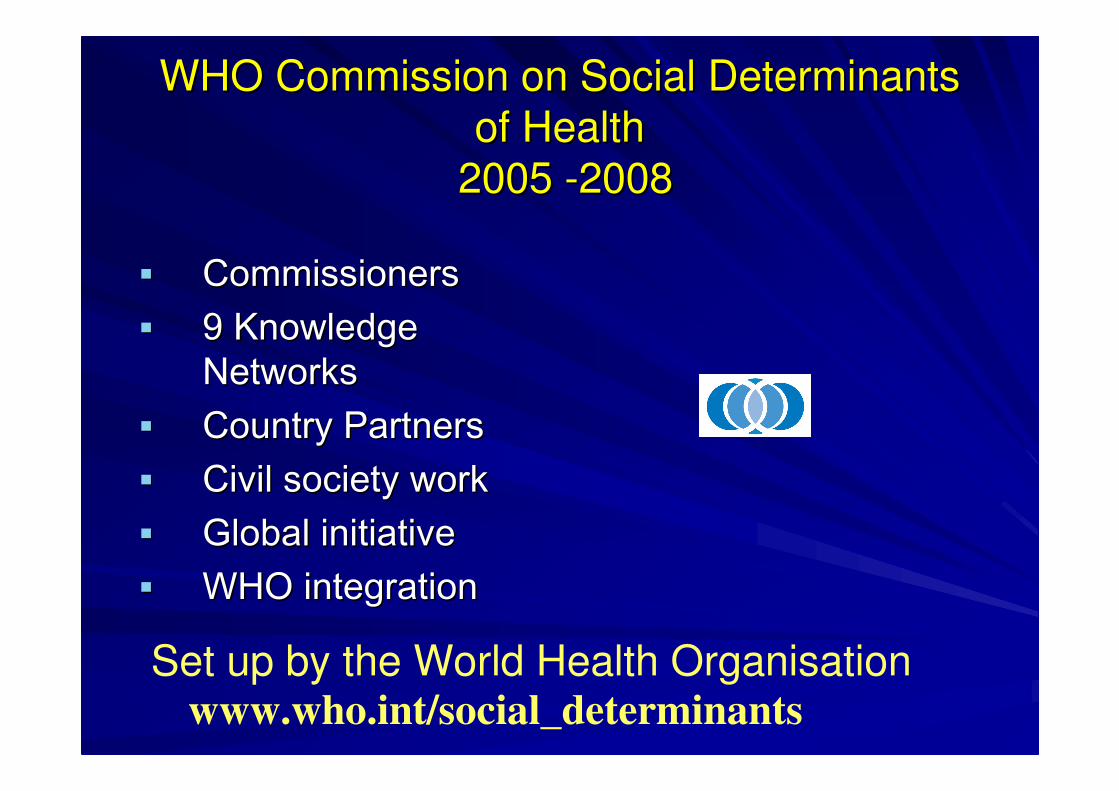
WHO Commission on Social Determinants WHO Commission on Social Determinants
of Healthof Health
2005 2005 --20082008
�� CommissionersCommissioners�� 9 Knowledge 9 Knowledge
NetworksNetworks�� Country PartnersCountry Partners�� Civil society workCivil society work�� Global initiativeGlobal initiative�� WHO integration WHO integration Set up by the World Health Organisation
www.who.int/social_determinants

Conditions in which people are
born, grow, live, work and age
Structural drivers of those conditions
at global, national and local level
CSDH CSDH –– Areas for ActionAreas for Action
Monitoring, Training, Research

Early child development and
education
Healthy Places
Fair Employment
Social Protection
Universal Health Care
Health Equity in all Policies
Fair Financing Good Global
Governance
Market
Responsibility
Gender Equity
Political empowerment
– inclusion and voice
CSDH CSDH –– Areas for ActionAreas for Action

Proportion relatively poor pre and Proportion relatively poor pre and
post welfare state redistributionpost welfare state redistribution
05
1015202530354045
Finla
ndNorw
aySw
eden
Belgiu
mG
erm
any
Netherla
nds
Italy
Spain
Canada
UK US
poverty rates post tax & transfers poverty reduction by income redistribution
71% 71% 72%
Source: Fritzell & Ritakallio 2004 using Luxembourg Income Study data,
CSDH Nordic Network
62% 63% 59%
54%49%
44%50%
24%
Po
ver
ty %

Taxation in East Asia (left) and subTaxation in East Asia (left) and sub--Saharan Saharan
Africa (right), 1970Africa (right), 1970––79, 198079, 1980––89, and 199089, and 1990––9999
Cobham 2005
direct
sales
trade
East Asia sub Saharan Africa

0
20
40
60
80
100
S Asia Latin
America and
Caribbean
E Asia and
Pacif ic
Sub-
Saharan
Africa
Mid-east and
N Africa
Europe and
C Asia
Industrialised
economies
%
1980-85
1986-90
1991-95
1996-98
Proportion of tariffs in total revenue by region,1980-1998
Source: GKN 2007
Low income countries are relatively more reliant on import tariffs for public revenue. Trade liberalization has reduced the availability of tariff revenues since 1970s

Trends in development assistance, G7 and Trends in development assistance, G7 and
selected comparison countries,1985 selected comparison countries,1985 -- 20062006
0
0.2
0.4
0.6
0.8
1
1.2
1.4
1985
1987
1989
1991
1993
1995
1997
1999
2001
2003
2005
UK
USA
Japan
Italy
Germany
Canada
France
Denmark
Sweden
Norway
Netherlands
Source: OECD, Development database on Aid from DAC Members
0.7
% GNI

Early child development and
education
Healthy Places
Fair Employment
Social Protection
Universal Health Care
Health Equity in all Policies
Fair Financing Good Global
Governance
Market
Responsibility
Gender Equity
Political empowerment
– inclusion and voice
CSDH CSDH –– Areas for ActionAreas for Action

Child survival and early child developmentChild survival and early child development
Physical, cognitive/language, Physical, cognitive/language,
social/emotionalsocial/emotional

Poor selfPoor self--rated health at age 50+ and accumulation of rated health at age 50+ and accumulation of
sociosocio--economic risk factors over life course economic risk factors over life course –– Russian Russian
menmen
0
0.5
1
1.5
2
2.5
3
3.5
4
4.5
5
MEN WOMEN
O 1 2 3No. of risk factors
Risk factors:
•Ever hungry to bed aged 15 yr
•Elementary /vocational education
•Adult household income below median
Odd
s R
atio
fo
r P
oor
Hea
lth
(Nicholson et al 2005)

Early child development and
education
Healthy Places
Fair Employment
Social Protection
Universal Health Care
Health Equity in all Policies
Fair Financing Good Global
Governance
Market
Responsibility
Gender Equity
Political empowerment
– inclusion and voice
CSDH CSDH –– Areas for ActionAreas for Action

Early child development and
education
Healthy PlacesFair Employment
Social Protection
Universal Health Care
Health Equity in all Policies
Fair Financing Good Global
Governance
Market
Responsibility
Gender Equity
Political empowerment
– inclusion and voice
CSDH CSDH –– Areas for ActionAreas for Action

Global slum upgradingGlobal slum upgrading
Cost estimate: less than US$ 100 billion.Cost estimate: less than US$ 100 billion.
Finance on shared basis, for instance byFinance on shared basis, for instance by
–– international agencies and donors (45%),international agencies and donors (45%),
–– national and local governments (45%), andnational and local governments (45%), and
–– households themselves (10%), helped by households themselves (10%), helped by
micromicro--credit schemes. credit schemes.

Slum upgrading in IndiaSlum upgrading in India
Slum upgrading in Ahmadabad, India, cost only Slum upgrading in Ahmadabad, India, cost only
US$ 500/household. US$ 500/household.
community contributions of US$ 50/household.community contributions of US$ 50/household.
Following the investment in these slums, there Following the investment in these slums, there
was improvement in healthwas improvement in health
–– decline in waterborne diseases, decline in waterborne diseases,
–– children started going to school, children started going to school,
–– women were able to take paid work, no longer having women were able to take paid work, no longer having
to stand in long lines to collect water.to stand in long lines to collect water.

Early child development and
education
Healthy Places
Fair Employment
Social Protection
Universal Health Care
Health Equity in all Policies
Fair Financing Good Global
Governance
Market
Responsibility
Gender Equity
Political empowerment
– inclusion and voice
CSDH CSDH –– Areas for ActionAreas for Action

Early child development and
education
Healthy Places
Fair Employment Social Protection
Universal Health Care
Health Equity in all Policies
Fair Financing Good Global
Governance
Market
Responsibility
Gender Equity
Political empowerment
– inclusion and voice
CSDH CSDH –– Areas for ActionAreas for Action

Regional variation in the percentage of people in Regional variation in the percentage of people in
work living on US$ 2/day or lesswork living on US$ 2/day or less
0
10
20
30
40
50
60
70
80
90
100
1997 2002 2007
World
Central & South EastEurope & CIS
East Asia
South East Asia &Pacific
South Asia
Latin America &Caribbean
Middle East
North Africa
Sub-Saharan Africa
2007 figures are preliminary estimateILO 2008

Gender inequities in labour conditions: lost pay or lost job promotions or difficulty retaining jobs
36
4349
25
36
28
0
20
40
60
Unable to get paid leave Did not have access tohealth insurance through
job
Job difficulties* because ofneed to care for sick
children
women men
% o
f pare
nts
* Job difficulties: lost pay or lost job promotions or difficulty retaining jobs. Adapted from Heymann (2006), Forgotten Families. Average percentages basedon selected countries.

Early child development and
education
Healthy Places
Fair Employment
Social Protection
Universal Health Care
Health Equity in all Policies
Fair Financing Good Global
Governance
Market
Responsibility
Gender Equity
Political empowerment
– inclusion and voice
CSDH CSDH –– Areas for ActionAreas for Action

Early child development and
education
Healthy Places
Fair Employment
Social Protection Universal Health Care
Health Equity in all Policies
Fair Financing Good Global
Governance
Market
Responsibility
Gender Equity
Political empowerment
– inclusion and voice
CSDH CSDH –– Areas for ActionAreas for Action

Building social protection for the elderlyBuilding social protection for the elderly
–– materialmaterial
–– psychosocialpsychosocial

Minimum income for healthy living Minimum income for healthy living –– Morris et al.Morris et al.
–– DietDiet
–– Physical activity/body and mindPhysical activity/body and mind
–– Psychosocial relations/social connections/activePsychosocial relations/social connections/active
mindsminds
–– Getting aboutGetting about
–– Medical careMedical care
–– HygieneHygiene
–– HousingHousing

Psychosocial relations/social connections/active mindsPsychosocial relations/social connections/active minds
TelephoneTelephone
Stationery, stampsStationery, stamps
Gifts to Gifts to
grandchildren/othersgrandchildren/others
Cinema, sports, etcCinema, sports, etc
Meeting friends, Meeting friends,
entertainingentertaining
TV set and licenceTV set and licence
NewspapersNewspapers
Holidays (UK)Holidays (UK)
Miscellaneous, Miscellaneous,
hobbies, gardening hobbies, gardening
etcetc
Morris et al 2007

Weekly disposable incomes for Weekly disposable incomes for
people over 65, England 2007people over 65, England 2007
State State
pensionpensionPension Pension
credit credit
guarantee*guarantee*
Minimum Minimum
income for income for
healthy healthy
living **living **
Single Single
personperson££87.3087.30 ££119.05119.05 ££131.00131.00
CoupleCouple ££139.60139.60 ££181.70181.70 ££208.00208.00
*Rent, mortgage and council tax may be paid after further means testing** people 65+ living independently in the community; excludes rent, mortgageand council tax
Morris et al 2007 IJE

Social pensions in selected low and Social pensions in selected low and
middle income countriesmiddle income countries
CountryCountry Age Age eligibleeligible
Universal Universal or means or means testedtested
Monthly Monthly
amountamount
(US$)(US$)
% of % of
pop 60+pop 60+
% of % of people people
60+ 60+
receivingreceiving
BangladeshBangladesh 57+57+ MM US$ 2US$ 2 6%6% 16% 16% (age 57+)(age 57+)
IndiaIndia 65+65+ MM US$ 4US$ 4 8%8% 13%13%
ThailandThailand 60+60+ MM US$ 8US$ 8 11%11% 16%16%
BotswanaBotswana 65+65+ UU US$ 27US$ 27 5%5% 85%85%

Lesotho Lesotho
Since 2004 universal social pension Since 2004 universal social pension
scheme for all aged 70+ years scheme for all aged 70+ years
costs 1.43% of GDPcosts 1.43% of GDP
benefit level is about the same as the benefit level is about the same as the
national poverty line (about US$ national poverty line (about US$
21/month). 21/month).
Monthly disbursement through post office Monthly disbursement through post office
network in rural and urban areas network in rural and urban areas
(McKinnon, 2007)

Early child development and
education
Healthy Places
Fair Employment
Social Protection
Universal Health Care
Health Equity in all Policies
Fair Financing Good Global
Governance
Market
Responsibility
Gender Equity
Political empowerment
– inclusion and voice
CSDH CSDH –– Areas for ActionAreas for Action

Early child development and
education
Healthy Places
Fair Employment
Social Protection
Universal Health Care
Health Equity in all Policies
Fair Financing Good Global
Governance
Market
Responsibility
Gender Equity
Political empowerment
– inclusion and voice
CSDH CSDH –– Areas for ActionAreas for Action

Universal Primary Health Care Universal Primary Health Care
Community basedCommunity based
Disease preventionDisease prevention
Health promotion Health promotion –– using social using social
determinants frameworkdeterminants framework

EMPOWERMENTEMPOWERMENT
–– MATERIALMATERIAL
–– PSYCHOSOCIALPSYCHOSOCIAL
–– POLITICALPOLITICAL

WhatWhat’’s next?s next?
WHO taking the leadWHO taking the lead
Building capacityBuilding capacity
AdvocacyAdvocacy
ResearchResearch
TrainingTraining

OptimismOptimism

Under 5 mortality rate: change 1990 Under 5 mortality rate: change 1990 --
20062006
6
27
27
29
83
46
160
10
53
55
55
123
79
187
0 50 100 150 200
Industrialized countries
CEE/CIS
Latin America & Caribbean
East Asia & Pacific
South Asia
Middle East & North Africa
Sub-Saharan Africa
Reduction 40%
Least
reduction
14%
UNICEF
Reduction 42%
Reduction 33%
Reduction 47%
Reduction 51%
Reduction 49%

Trends in U5M by wealth quintile: Trends in U5M by wealth quintile:
BangladeshBangladesh
128
110
97
76 72 72
122
85 81
135
10697
147
127
98
141 140
121
50
70
90
110
130
150
1996/97 1999/2000 2004
Average Richest 4th 3rd 2nd Poorest
Relative inequ: 1.86 1.93 1.69
Absolute inequ: 65 67 50(DHS data)

www.who.int/social_determinants/en
A world
where social
justice is
taken
seriously