closet indexation - true & fair campaign 3 1 active share and mutual fund performance antti...
TRANSCRIPT

Closet Indexation The UK Epidemic Continues
February 2015
OUR MARK OF
COMMITMENT
Report produced by SCM Direct, which is a trading name of SCM Private LLP. February 2015
The UK fund management industry closet indexing epidemic continues to be ignored by the regulator and condoned by industry trade bodies. With no sign of action to eradicate this deception, which amounts to fraud, the British public should consider legal action against UK fund groups.
• New research by SCM Direct finds the 10 worst offending UK funds cost investors £346m in terms of under-performance when compared to similar index funds during 2014 alone
• More than a third of the UK funds (36%) are no more than expensive copies of index funds
• Rolled out across the retail industry, based on these worst 10, this wide spread deceptive practice could have cost investors £803m in 2014
• Rather than the purported charge of c. 1.5 - 1.6% pa, the real cost of the genuinely active part of the fund was over 7% pa in the worst two cases
• The average ‘implied’ annual management cost (AMC) of the active part of a UK equities fund was 2.5% pa on average rather than 1.5% pa
• The FCA Chief Executive has been aware of this anti-consumer practice since at least September 2012, but there is no evidence that the FCA has properly investigated these contemptible practices
• In sharp contrast, the Dutch regulator has taken action
• Investors in Europe (Sweden) are undertaking class actions where similar closet indexing practices have been found
• SCM Direct is offering its services, as an expert witness, on a pro-bono basis, to investors wishing to pursue any class action against a UK based investment group due to losses arising from closet indexation.
2
Report produced by SCM Direct, which is a trading name of SCM Private LLP. February 2015

Background 3
1 Active Share and Mutual Fund Performance Antti Petajisto December 15, 20102 H. K. J. Martijn Cremers and Antti Petajisto, “How Active Is Your Fund Manager? A New Measure That Predicts
Performance, Working Paper, Yale School of Management, March 31, 2009. They define potential ‘closet indexers’ as those funds with 60% or less active share
For decades the UK fund management industry has been promoting and selling active funds purporting to beat the market, known as the index, and charging significant fees based on this objective.
Whilst it is fairly common knowledge that some funds are truly doing as they purport and some are not, this updated research of the Closet Indexing Report SCM produced in September 2013 has found that of the funds analysed, an average 36% of active funds are guilty of cloning the index.
SCM Direct’s analysis is one of the most comprehensive undertaken, covering £137b of UK funds.
If UK investors had chosen a low cost index fund over the most serious closet indexers analysed (the 10 worst), they could have saved an estimated £346m in UK equities funds in 2014, and an estimated £457m within other retail equities funds, amounting to £803m overall.
The conundrum as to whether or not investors should be paying a full active fee if, for example, only 35% of the fund they are invested in is actually different to the index, was summarised by one of the original inventors of ‘active share’1 as:
‘The problem is that closet indexers are very expensive relative to what they offer. A closet indexer charges active management fees on all the assets in the mutual fund, even when some of the assets are simply invested in the benchmark index. If a fund has an Active Share of 33%, this means that fund-level annual expenses of 1.5% amount to 4.5% as a fraction of the active positions of the fund. Since only the active positions of the fund can possibly outperform the benchmark, in the long run it is very difficult for a closet indexer to overcome such fees and beat its index net of all expenses.’
This new study reveals that more than a third (36%) of UK Equities funds analysed were shown to be closet index trackers, according to the academic definition2. When you consider these funds purport to ‘beat the market’, the result of high charges and low real difference to the market make this claim almost statistically impossible to achieve. In fact when one calculates the implied cost of the minority part of the fund that was actually different to the market for the two worst offenders - the Halifax UK Growth Fund and the Scottish Widows UK Growth Fund - this implies the fee for the truly active part of these funds was over 7% pa.
These latest research findings of SCM Direct confirms its previous findings in 2013, namely that UK investors appear to have been mis-sold on a grand scale and that the UK regulator can no longer turn a complete blind eye. The fact that 36% of UK retail funds have been sold to investors under false pretences not only breaches the Financial Conduct Authority’s (FCA) over-riding principles for fund management companies that ‘firms must conduct their business with integrity, and communicate information in a way that is clear, fair and not misleading’, it is also nothing short of fraudulent.
Report produced by SCM Direct, which is a trading name of SCM Private LLP. February 2015

4
3 http://europe.etf.com/europe/features-a-news/10372-esma-on-the-hunt-for-closet-trackers.html4 Speech by FCA CEO, Martin Wheatley http://www.fsa.gov.uk/library/communication/speeches/2012/0925-mw.shtml5 http://www.fs-cp.org.uk/publications/pdf/investment_discussion_paper_investment_cost_and_charges.pdf6 http://www.scmprivate.com/content/file/knowledge/research/closet-indexation-report-full-sept-13.pdf
Shockingly, SCM Direct found that in 2014 every single one of the 10 funds with the lowest active share analysed i.e. greatest degree of closet indexation, underperformed the market by an averge of 2.8%. Had the investors in these 10 funds, totaling £136b under management, been aware that their fund was a closet tracker, they might have chosen a low cost index fund instead, and saved £346m in these UK equity funds alone, and an estimated £803m in funds including overseas equity funds based on the same levels of closet indexation.
It is surprising that the Serious Fraud Office (SFO) does not step in since this seems to suggest wide scale fraud.
In sharp contrast to the UK regulator, the Danish regulator investigated closet indexation in September 2014 and found that 56 of their 188 active equity mutual funds were not really active. Similarly the European Regulator, the European Securities and Markets Authority (ESMA), announced in October 2014 that it might take action against offenders and entered into discussions with the 28 national regulators, including the FCA, to assess whether closet tracking is a bigger problem at a single country level or is a Europe-wide concern3.
There has been a shameful lack of investigation into closet index tracking in the UK although the FCA Chief Executive, Martin Wheatley, said in September 2012 “Should I be concerned if the tracker fund I invest in is lending shares to short sellers, or that the managed fund I buy charges five times as much as that same tracker, but its holdings seem to be broadly the same?” 4 It seems that until the FCA was recently contacted by ESMA, they have chosen to turn a blind eye to the contemptible practice of closet indexation.
The UK’s Financial Services Consumer Panel (FSCP), an influential body that advises the FCA on consumer protection, said in its 2014 report on investment costs and charges that ‘Frequent monitoring of short-term performance combined with inadequate scrutiny of costs encourages the practice of “closet indexation”, also known as “closet tracking”: funds that charge for active portfolio management, typically of company stocks, but which in practice do little more than mimic the composition of a relevant index….To help consumers and their representatives assess value for money, the regulator could usefully consider a requirement for fund managers to justify that their management of index constituents was active management, rather than closet index tracking. This would probably require trading disclosure for active managers, that is, to disclose what proportion of their trading was on index constituents.” 5
The authors of this report find it simply astonishing that the FCA chose to ignore completely their September 2013 SCM report on closet indexation.6 It is even more astonishing when European regulators are taking this issue seriously with class actions against fund groups now starting. The Swedish Shareholders’ Association – the largest network of retail investors in the world – has seen more than 2,000 people sign up to a class action in 2014 against one of Scandinavia’s largest mutual fund managers for alleged closet indexing.
SCM believes that the only way to protect UK investors, and curtail closet indexing, is for a similar class action to take place in the UK and is prepared to offer their services as expert witnesses, on a pro-bono basis, to any law firm/ investors wanting to commence such an action against any of the large UK fund managers.
Report produced by SCM Direct, which is a trading name of SCM Private LLP. February 2015
5
7 BBC Money Box interview with IMA CEO, Mr. Godfrey http://www.bbc.co.uk/programmes/b03bd2448 http://www.betterfinance.eu/fileadmin/user_upload/documents/Press_Releases/en/_Closet_index_trackers__must_be_
outed__regulators_urged_-_Financial_News.pdf9 SEC Adopts Enhanced Mutual Fund Expense and Portfolio Disclosure; Proposes Improved Disclosure of Board Approval
of Investment Advisory Contracts and Prohibition on the Use of Brokerage Commissions to Finance Distribution, Washington, D.C. Feb. 11, 2004
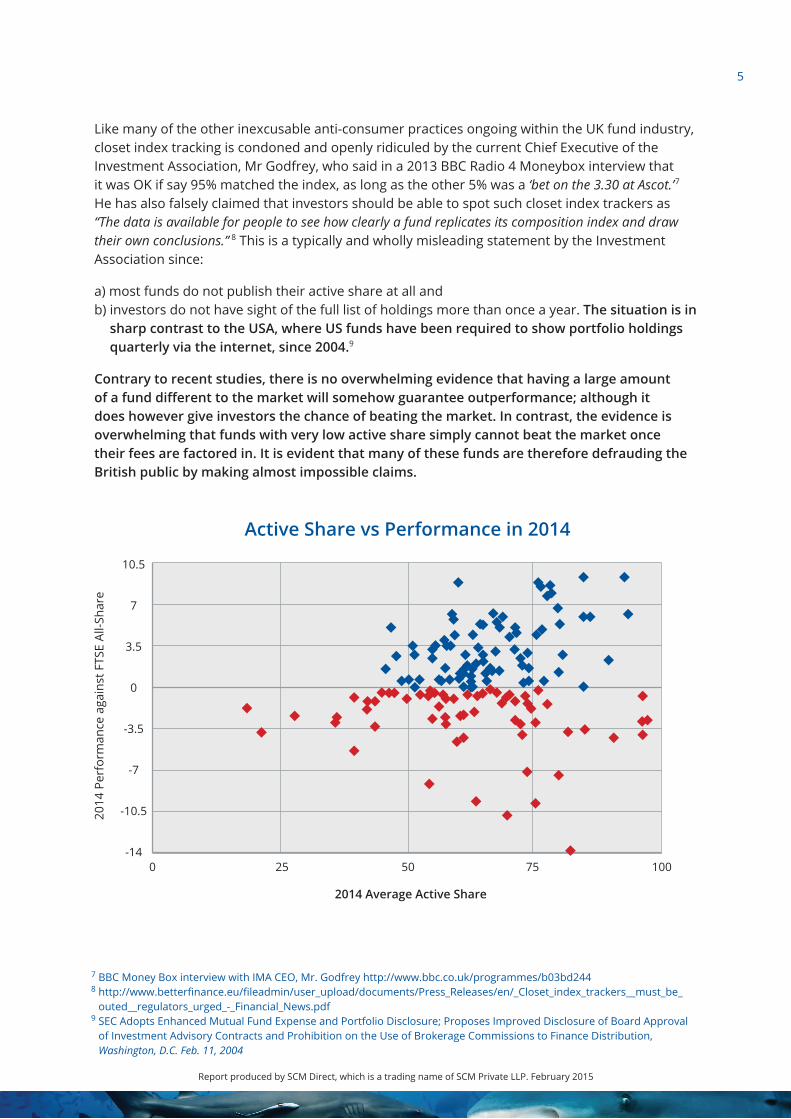
Like many of the other inexcusable anti-consumer practices ongoing within the UK fund industry, closet index tracking is condoned and openly ridiculed by the current Chief Executive of the Investment Association, Mr Godfrey, who said in a 2013 BBC Radio 4 Moneybox interview that it was OK if say 95% matched the index, as long as the other 5% was a ‘bet on the 3.30 at Ascot.’7 He has also falsely claimed that investors should be able to spot such closet index trackers as “The data is available for people to see how clearly a fund replicates its composition index and draw their own conclusions.” 8 This is a typically and wholly misleading statement by the Investment Association since:
a) most funds do not publish their active share at all and b) investors do not have sight of the full list of holdings more than once a year. The situation is in
sharp contrast to the USA, where US funds have been required to show portfolio holdings quarterly via the internet, since 2004.9
Contrary to recent studies, there is no overwhelming evidence that having a large amount of a fund different to the market will somehow guarantee outperformance; although it does however give investors the chance of beating the market. In contrast, the evidence is overwhelming that funds with very low active share simply cannot beat the market once their fees are factored in. It is evident that many of these funds are therefore defrauding the British public by making almost impossible claims.
10.5
7
3.5
0
-3.5
-7
-10.5
-14
2014
Per
form
ance
aga
inst
FTS
E Al
l-Sha
re
0 25 50 75 100
2014 Average Active Share
Active Share vs Performance in 2014
Report produced by SCM Direct, which is a trading name of SCM Private LLP. February 2015

6Conclusion
This report illustrates that precious little has changed since our original report into Closet Indexing in September 2013. In view of the inexcusable inactivity around promoting higher standards of disclosure and transparency of holdings, SCM Direct urges mis-sold investors to consider taking class actions to recover the millions stolen. To assist investors, SCM Direct is offering to act as an expert witness in any such proceeding free of charge.
Through its True and Fair Campaign, SCM Direct has been tirelessly campaigning for 100% transparency of holdings since January 2012. We believe the FCA should be working towards 100% transparency of fund holdings, and mandate that fund factsheets include Active Share. This would afford UK investors significantly higher levels of protection by exposing and shaming deceptive closet index trackers.
The FCA should mandate the following:
1. Funds to reveal 100% of their holdings on-line at least quarterly (the US rule since 2004).
2. Any fund closely resembling an index fund should clearly state this within their marketing materials.
3. Funds should be forced to disclose their Active Share on their factsheets.
4. Fees should more fairly reflect the Active Share within a fund.
Report produced by SCM Direct, which is a trading name of SCM Private LLP. February 2015
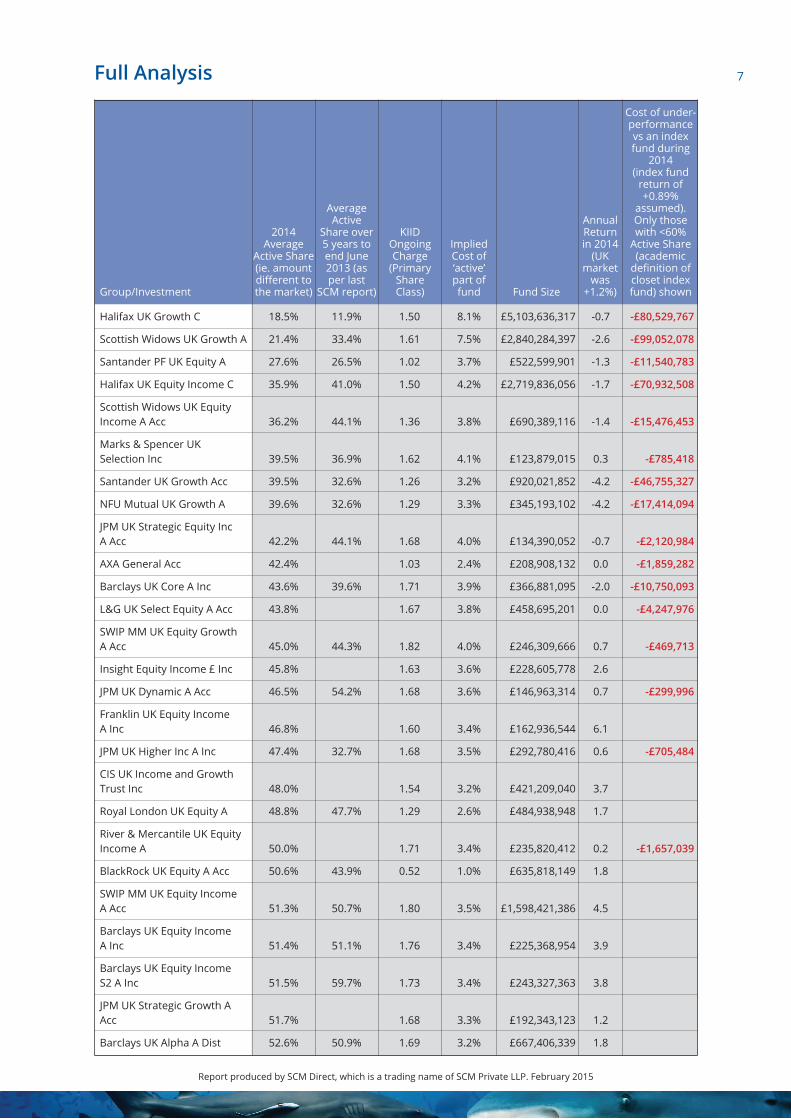
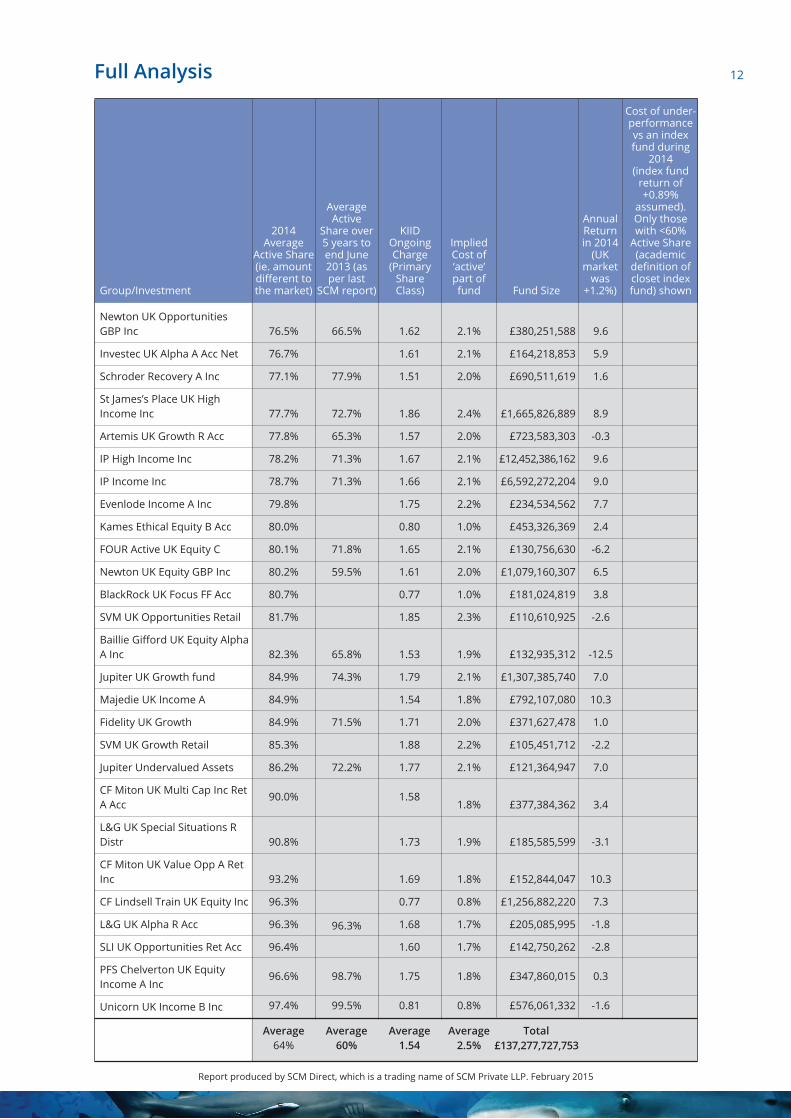
7Full Analysis
Cost of under-performance vs an index fund during
2014 (index fund
return of +0.89%
assumed).Only those with <60%
Active Share (academic
definition of closet index fund) shown
Annual Return in 2014
(UK market
was +1.2%)Fund Size
Implied Cost of ‘active’ part of fund
KIID Ongoing Charge
(Primary Share Class)
Average Active
Share over 5 years to end June 2013 (as per last
SCM report)
Halifax UK Growth C
Scottish Widows UK Growth A
Santander PF UK Equity A
Halifax UK Equity Income C
Scottish Widows UK Equity Income A Acc
Marks & Spencer UK Selection Inc
Santander UK Growth Acc
NFU Mutual UK Growth A
JPM UK Strategic Equity Inc A Acc
AXA General Acc
Barclays UK Core A Inc
L&G UK Select Equity A Acc
SWIP MM UK Equity Growth A Acc
Insight Equity Income £ Inc
JPM UK Dynamic A Acc
Franklin UK Equity Income A Inc
JPM UK Higher Inc A Inc
CIS UK Income and Growth Trust Inc
Royal London UK Equity A
River & Mercantile UK Equity Income A
BlackRock UK Equity A Acc
SWIP MM UK Equity Income A Acc
Barclays UK Equity Income A Inc
Barclays UK Equity Income S2 A Inc
JPM UK Strategic Growth A Acc
Barclays UK Alpha A Dist
18.5%
21.4%
27.6%
35.9%
36.2%
39.5%
39.5%
39.6%
42.2%
42.4%
43.6%
43.8%
45.0%
45.8%
46.5%
46.8%
47.4%
48.0%
48.8%
50.0%
50.6%
51.3%
51.4%
51.5%
51.7%
52.6%
11.9%
33.4%
26.5%
41.0%
44.1%
36.9%
32.6%
32.6%
44.1%
39.6%
44.3%
54.2%
32.7%
47.7%
43.9%
50.7%
51.1%
59.7%
50.9%
1.50
1.61
1.02
1.50
1.36
1.62
1.26
1.29
1.68
1.03
1.71
1.67
1.82
1.63
1.68
1.60
1.68
1.54
1.29
1.71
0.52
1.80
1.76
1.73
1.68
1.69
8.1%
7.5%
3.7%
4.2%
3.8%
4.1%
3.2%
3.3%
4.0%
2.4%
3.9%
3.8%
4.0%
3.6%
3.6%
3.4%
3.5%
3.2%
2.6%
3.4%
1.0%
3.5%
3.4%
3.4%
3.3%
3.2%
£5,103,636,317
£2,840,284,397
£522,599,901
£2,719,836,056
£690,389,116
£123,879,015
£920,021,852
£345,193,102
£134,390,052
£208,908,132
£366,881,095
£458,695,201
£246,309,666
£228,605,778
£146,963,314
£162,936,544
£292,780,416
£421,209,040
£484,938,948
£235,820,412
£635,818,149
£1,598,421,386
£225,368,954
£243,327,363
£192,343,123
£667,406,339
-0.7
-2.6
-1.3
-1.7
-1.4
0.3
-4.2
-4.2
-0.7
0.0
-2.0
0.0
0.7
2.6
0.7
6.1
0.6
3.7
1.7
0.2
1.8
4.5
3.9
3.8
1.2
1.8
-£80,529,767
-£99,052,078
-£11,540,783
-£70,932,508
-£15,476,453
-£785,418
-£46,755,327
-£17,414,094
-£2,120,984
-£1,859,282
-£10,750,093
-£4,247,976
-£469,713
-£299,996
-£705,484
-£1,657,039
2014 Average
Active Share (ie. amount different to the market)Group/Investment
Report produced by SCM Direct, which is a trading name of SCM Private LLP. February 2015

8Full Analysis
Cost of under-performance vs an index fund during
2014 (index fund
return of +0.89%
assumed).Only those with <60%
Active Share (academic
definition of closet index fund) shown
Annual Return in 2014
(UK market
was +1.2%)Fund Size
Implied Cost of ‘active’ part of fund
KIID Ongoing Charge
(Primary Share Class)
Average Active
Share over 5 years to end June 2013 (as per last
SCM report)
Schroder Prime UK Equity l Acc
HSBC Income Retail Income
Schroder Core UK Equity A Acc
Milton Income Acc
AXA Framlington UK Growth R GBP Acc
Schroder UK Alpha Plus Acc
Artemis Income Inc
CIS UK Growth
HSBC UK Growth & Income Retail Inc
Old Mutual Artemis Income A Inc
BlackRock UK A Inc
HSBC Freestyle Retail Inc
Schroder UK Equity Acc
Aviva Investors UK Opportunities 1
St James’s Place UK Growth Acc
Threadneedle UK Select Ret Net GBX
SWIP MM UK Equity Focus A Acc
River & Mercantile UK Eq Hi Alpha A
Aberdeen UK Equity Income A Inc
Threadneedle UK Fund Retail
Santander Equity Income
HSBC UK Focus R Inc
Majedie UK Equity A Acc
Old Mutual UK Equity Income Acc
BlackRock UK Income A Inc
52.6%
54.5%
54.5%
54.9%
55.0%
55.0%
55.0%
55.6%
55.6%
55.7%
56.4%
56.4%
56.4%
56.9%
57.3%
57.5%
57.6%
57.6%
57.6%
57.6%
57.7%
57.8%
58.4%
58.5%
59.2%
40.2%
62.4%
70.8%
55.8%
53.9%
35.7%
50.3%
63.6%
51.2%
65.4%
75.2%
52.9%
54.6%
55.7%
54.5%
52.6%
49.6%
60.7%
52.8%
58.5%
0.51
1.65
1.41
1.68
1.59
1.65
1.54
1.53
1.64
1.54
1.67
1.65
1.66
1.53
2.13
1.70
1.81
1.59
1.61
1.68
1.28
1.02
1.53
1.65
1.67
1.0%
3.0%
2.6%
3.1%
2.9%
3.0%
2.8%
2.8%
2.9%
2.8%
3.0%
2.9%
2.9%
2.7%
3.7%
3.0%
3.1%
2.8%
2.8%
2.9%
2.2%
1.8%
2.6%
2.8%
2.8%
£402,624,671
£237,612,435
£249,792,643
£221,920,706
£269,834,746
£1,423,699,774
£7,009,185,694
£1,196,199,882
£923,656,166
£131,437,979
£699,341,540
£152,616,298
£635,218,811
£170,592,100
£311,213,240
£201,025,693
£1,368,457,460
£363,976,613
£153,701,725
£2,344,129,617
£161,997,586
£206,335,904
£3,115,191,224
£164,100,001
£341,947,083
0.6
0.5
-7.0
4.3
0.8
-1.5
3.5
0.7
0.7
4.5
-0.4
-0.6
1.8
1.7
0.5
5.0
-1.4
-1.8
-1.5
2.8
4.8
0.2
1.8
4.7
7.2
-£1,311,872
-£888,148
-£19,704,993
-£252,295
-£34,121,812
-£2,218,233
-£1,567,537
-£8,942,760
-£2,222,490
-£1,195,744
-£31,339,181
-£9,904,313
-£3,725,976
-£1,416,950
2014 Average
Active Share (ie. amount different to the market)Group/Investment
Report produced by SCM Direct, which is a trading name of SCM Private LLP. February 2015

9Full Analysis
Cost of under-performance vs an index fund during
2014 (index fund
return of +0.89%
assumed).Only those with <60%
Active Share (academic
definition of closet index fund) shown
Annual Return in 2014
(UK market
was +1.2%)Fund Size
Implied Cost of ‘active’ part of fund
KIID Ongoing Charge
(Primary Share Class)
Average Active
Share over 5 years to end June 2013 (as per last
SCM report)
Jupiter Growth & Income
Fidelity MoneyBuilder Dividend
Threadneedle UK Monthly Inc RN GBP
L&G UK Equity Income R Acc
Troy Trojan Income O Acc
Fidelity MoneyBuilder Growth
Old Mutual UK Equity Acc
Investec UK Special Situations A Acc Net
Ignis Balanced Growth Inc
Aberdeen UK Equity A Inc
Schroder UK Alpha Income A Inc
Neptune Income A Acc
Royal London UK Growth Fund A
Aviva Investors UK Equity Income SC1
F&C Responsible UK Equity Growth 1 Inc
CF Canlife UK Equity Income B Inc GBP
Aviva Investors UK Equity SC1
M&G UK Growth A Acc
Old Mutual UK Alpha R Acc
RBS Growth 1
Threadneedle UK Overseas Earnings IN Inc
Newton Higher Income GBP
JOHCM UK Dynamic B Acc
Schroder Specialist Value UK Eq I Acc
St James’s Place Allshare Income Inc
Halifax Special Situations C
59.2%
59.3%
59.5%
59.9%
60.2%
60.3%
60.5%
60.7%
61.1%
61.1%
61.1%
61.2%
61.3%
61.3%
61.5%
62.0%
62.2%
62.7%
62.7%
62.9%
63.0%
63.1%
63.1%
63.4%
63.4%
63.7%
55.0%
59.8%
51.1%
60.1%
54.3%
61.0%
56.3%
50.8%
55.1%
62.5%
55.6%
68.5%
45.9%
67.9%
59.3%
58.2%
54.2%
61.7%
49.1%
1.76
1.20
1.62
1.68
1.03
1.20
1.65
1.59
1.59
1.60
1.66
1.66
1.29
1.00
1.60
1.16
1.00
1.67
0.90
1.28
1.57
1.61
1.48
0.76
1.82
1.51
3.0%
2.0%
2.7%
2.8%
1.7%
2.0%
2.7%
2.6%
2.6%
2.6%
2.7%
2.7%
2.1%
1.6%
2.6%
1.9%
1.6%
2.7%
1.4%
2.0%
2.5%
2.6%
2.3%
1.2%
2.9%
2.4%
£305,196,173
£1,036,894,830
£642,792,658
£540,207,022
£2,025,577,447
£685,775,281
£485,360,000
£1,387,315,746
£127,055,238
£179,700,506
£694,055,095
£334,425,112
£466,733,850
£944,075,500
£379,936,509
£108,618,227
£262,584,799
£763,062,670
£1,881,207,466
£195,564,553
£115,843,459
£1,938,290,471
£295,892,228
£119,615,487
£1,178,918,384
£168,528,328
0.1
6.9
5.5
-3.4
10.0
1.9
2.3
-1.2
-1.2
-3.1
1.2
1.2
2.3
2.7
3.8
3.0
0.5
1.6
1.2
2.5
2.1
5.5
2.7
-0.9
1.0
-8.5
-£2,263,335
-£23,223,122
2014 Average
Active Share (ie. amount different to the market)Group/Investment
Report produced by SCM Direct, which is a trading name of SCM Private LLP. February 2015
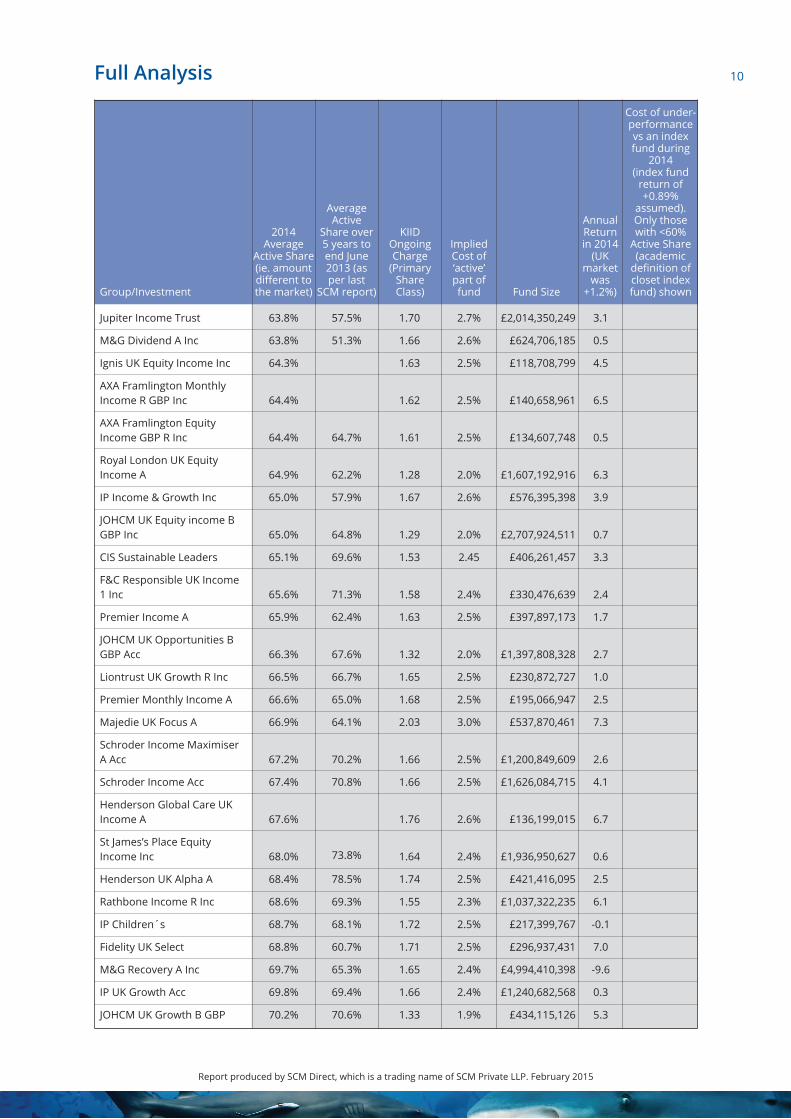
10Full Analysis
Cost of under-performance vs an index fund during
2014 (index fund
return of +0.89%
assumed).Only those with <60%
Active Share (academic
definition of closet index fund) shown
Annual Return in 2014
(UK market
was +1.2%)Fund Size
Implied Cost of ‘active’ part of fund
KIID Ongoing Charge
(Primary Share Class)
Average Active
Share over 5 years to end June 2013 (as per last
SCM report)
Jupiter Income Trust
M&G Dividend A Inc
Ignis UK Equity Income Inc
AXA Framlington Monthly Income R GBP Inc
AXA Framlington Equity Income GBP R Inc
Royal London UK Equity Income A
IP Income & Growth Inc
JOHCM UK Equity income B GBP Inc
CIS Sustainable Leaders
F&C Responsible UK Income 1 Inc
Premier Income A
JOHCM UK Opportunities B GBP Acc
Liontrust UK Growth R Inc
Premier Monthly Income A
Majedie UK Focus A
Schroder Income Maximiser A Acc
Schroder Income Acc
Henderson Global Care UK Income A
St James’s Place Equity Income Inc
Henderson UK Alpha A
Rathbone Income R Inc
IP Children´s
Fidelity UK Select
M&G Recovery A Inc
IP UK Growth Acc
JOHCM UK Growth B GBP
63.8%
63.8%
64.3%
64.4%
64.4%
64.9%
65.0%
65.0%
65.1%
65.6%
65.9%
66.3%
66.5%
66.6%
66.9%
67.2%
67.4%
67.6%
68.0%
68.4%
68.6%
68.7%
68.8%
69.7%
69.8%
70.2%
57.5%
51.3%
64.7%
62.2%
57.9%
64.8%
69.6%
71.3%
62.4%
67.6%
66.7%
65.0%
64.1%
70.2%
70.8%
73.8%
78.5%
69.3%
68.1%
60.7%
65.3%
69.4%
70.6%
1.70
1.66
1.63
1.62
1.61
1.28
1.67
1.29
1.53
1.58
1.63
1.32
1.65
1.68
2.03
1.66
1.66
1.76
1.64
1.74
1.55
1.72
1.71
1.65
1.66
1.33
2.7%
2.6%
2.5%
2.5%
2.5%
2.0%
2.6%
2.0%
2.45
2.4%
2.5%
2.0%
2.5%
2.5%
3.0%
2.5%
2.5%
2.6%
2.4%
2.5%
2.3%
2.5%
2.5%
2.4%
2.4%
1.9%
£2,014,350,249
£624,706,185
£118,708,799
£140,658,961
£134,607,748
£1,607,192,916
£576,395,398
£2,707,924,511
£406,261,457
£330,476,639
£397,897,173
£1,397,808,328
£230,872,727
£195,066,947
£537,870,461
£1,200,849,609
£1,626,084,715
£136,199,015
£1,936,950,627
£421,416,095
£1,037,322,235
£217,399,767
£296,937,431
£4,994,410,398
£1,240,682,568
£434,115,126
3.1
0.5
4.5
6.5
0.5
6.3
3.9
0.7
3.3
2.4
1.7
2.7
1.0
2.5
7.3
2.6
4.1
6.7
0.6
2.5
6.1
-0.1
7.0
-9.6
0.3
5.3
2014 Average
Active Share (ie. amount different to the market)Group/Investment
Report produced by SCM Direct, which is a trading name of SCM Private LLP. February 2015

11Full Analysis
Cost of under-performance vs an index fund during
2014 (index fund
return of +0.89%
assumed).Only those with <60%
Active Share (academic
definition of closet index fund) shown
Annual Return in 2014
(UK market
was +1.2%)Fund Size
Implied Cost of ‘active’ part of fund
KIID Ongoing Charge
(Primary Share Class)
Average Active
Share over 5 years to end June 2013 (as per last
SCM report)
Royal London UK Opportunities
Fidelity Enhanced Income Inc
Threadneedle UK Eq Income (ex LV) Retl
AXA Framlington UK Select Opps R Acc
Threadneedle UK Eq Inc Ret Net GBP
Fidelity Special Situations
Threadneedle UK Gr & Inc Ret Net GBP
L&G Growth E Distr
IP UK Aggressive Acc
CF Canlife UK Equity B Acc
Ecclesiastical Amity UK A
Ecclesiastical UK Equity Growth A
River & Mercantile UK Eq L/T Rec B
Henderson UK Equity Inc & Gr A
Premier UK Growth A Net Income
GAM UK Diversified Acc
Jupiter UK Special Situations
Artemis UK Special Situations
Artemis Capital
Schroder UK Opportunities A Acc
Aviva Investors UK Growth SC1 Acc
Threadneedle UK Eq Alpha Inc RN GBP
Liontrust Special Situations R Inc
IP UK Strategic Income Acc
70.4%
71.3%
71.4%
71.4%
71.5%
71.5%
72.4%
72.5%
72.8%
72.9%
73.3%
73.4%
73.7%
73.9%
74.0%
74.1%
74.1%
74.4%
74.5%
75.3%
75.4%
75.7%
76.0%
76.0%
66.9%
69.6%
61.7%
72.0%
60.6%
75.6%
72.3%
74.7%
65.0%
77.9%
64.6%
71.3%
67.9%
68.6%
80.7%
70.4%
1.42
1.72
1.08
1.58
1.62
1.69
1.63
1.68
1.67
1.04
1.61
1.59
1.24
1.75
1.87
1.59
1.76
1.56
1.63
1.66
1.00
1.62
1.86
1.67
2.0%
2.4%
1.5%
2.2%
2.3%
2.4%
2.3%
2.3%
2.3%
1.4%
2.2%
2.2%
1.7%
2.4%
2.5%
2.1%
2.4%
2.1%
2.2%
2.2%
1.3%
2.1%
2.4%
2.2%
£570,809,494
£296,751,242
£285,562,279
£4,553,547,355
£3,223,496,637
£2,683,951,907
£304,088,012
£138,093,900
£243,989,900
£561,529,777
£128,480,863
£186,057,219
£108,363,821
£583,239,387
£121,241,700
£274,990,000
£1,317,641,657
£1,215,669,920
£338,704,111
£878,368,460
£177,419,100
£833,538,223
£1,437,130,797
£982,105,278
0.5
4.3
6.2
0.0
5.7
-1.7
3.5
-2.0
-2.9
3.0
1.5
0.4
-6.0
-0.2
4.0
1.7
2.7
-0.7
-0.6
-8.6
-1.7
5.6
0.9
9.9
2014 Average
Active Share (ie. amount different to the market)Group/Investment
Report produced by SCM Direct, which is a trading name of SCM Private LLP. February 2015
12Full Analysis
Cost of under-performance vs an index fund during
2014 (index fund
return of +0.89%
assumed).Only those with <60%
Active Share (academic
definition of closet index fund) shown
Annual Return in 2014
(UK market
was +1.2%)Fund Size
Implied Cost of ‘active’ part of fund
KIID Ongoing Charge
(Primary Share Class)
Average Active
Share over 5 years to end June 2013 (as per last
SCM report)
Newton UK Opportunities GBP Inc
Investec UK Alpha A Acc Net
Schroder Recovery A Inc
St James’s Place UK High Income Inc
Artemis UK Growth R Acc
IP High Income Inc
IP Income Inc
Evenlode Income A Inc
Kames Ethical Equity B Acc
FOUR Active UK Equity C
Newton UK Equity GBP Inc
BlackRock UK Focus FF Acc
SVM UK Opportunities Retail
Baillie Gifford UK Equity Alpha A Inc
Jupiter UK Growth fund
Majedie UK Income A
Fidelity UK Growth
SVM UK Growth Retail
Jupiter Undervalued Assets
CF Miton UK Multi Cap Inc Ret A Acc
L&G UK Special Situations R Distr
CF Miton UK Value Opp A Ret Inc
CF Lindsell Train UK Equity Inc
L&G UK Alpha R Acc
SLI UK Opportunities Ret Acc
PFS Chelverton UK Equity Income A Inc
Unicorn UK Income B Inc
76.5%
76.7%
77.1%
77.7%
77.8%
78.2%
78.7%
79.8%
80.0%
80.1%
80.2%
80.7%
81.7%
82.3%
84.9%
84.9%
84.9%
85.3%
86.2%
90.0%
90.8%
93.2%
96.3%
96.3%
96.4%
96.6%
97.4%
Average64%
66.5%
77.9%
72.7%
65.3%
71.3%
71.3%
71.8%
59.5%
65.8%
74.3%
71.5%
72.2%
96.3%
98.7%
99.5%
Average60%
1.62
1.61
1.51
1.86
1.57
1.67
1.66
1.75
0.80
1.65
1.61
0.77
1.85
1.53
1.79
1.54
1.71
1.88
1.77
1.58
1.73
1.69
0.77
1.68
1.60
1.75
0.81
Average1.54
2.1%
2.1%
2.0%
2.4%
2.0%
2.1%
2.1%
2.2%
1.0%
2.1%
2.0%
1.0%
2.3%
1.9%
2.1%
1.8%
2.0%
2.2%
2.1%
1.8%
1.9%
1.8%
0.8%
1.7%
1.7%
1.8%
0.8%
Average2.5%
£380,251,588
£164,218,853
£690,511,619
£1,665,826,889
£723,583,303
£12,452,386,162
£6,592,272,204
£234,534,562
£453,326,369
£130,756,630
£1,079,160,307
£181,024,819
£110,610,925
£132,935,312
£1,307,385,740
£792,107,080
£371,627,478
£105,451,712
£121,364,947
£377,384,362
£185,585,599
£152,844,047
£1,256,882,220
£205,085,995
£142,750,262
£347,860,015
£576,061,332
Total
9.6
5.9
1.6
8.9
-0.3
9.6
9.0
7.7
2.4
-6.2
6.5
3.8
-2.6
-12.5
7.0
10.3
1.0
-2.2
7.0
3.4
-3.1
10.3
7.3
-1.8
-2.8
0.3
-1.6
2014 Average
Active Share (ie. amount different to the market)Group/Investment
£137,277,727,753
Report produced by SCM Direct, which is a trading name of SCM Private LLP. February 2015
13
SCM Direct’s research interrogated the ‘active share’ of funds based on the 2009 definition of ‘active share’ from Yale Professors, Martijn Cremers and Antti Petajisto10 - ‘active share is defined as the fraction of a portfolio or fund that is invested differently from its benchmark’.
SCM Direct analysed retail (non-institutional), active (non-index) UK equity funds within the leading Investment Management Association (IMA) equity sectors of UK Equity Income and UK All Companies in which most UK equity funds can be found.
Research Sample Criteria
• Funds that benchmarked themselves against the most widely used UK equities benchmark, the FTSE All-Share Index
• The primary share class according to Morningstar was analysed for each fund• To represent funds typically sold and bought by retail investors, only those funds managing
over £100m of assets were analysed • All the funds were required to have active share data available via Morningstar and charge a
KIID ongoing charge of 0.5% or more to screen out any index or quasi-index funds • The active share (where available) was calculated at the start, middle and end of 2014 and the
average figure taken.
Sample size
UK - 154 retail UK equity funds, managing a combined £137b were analysed.
Research Conducted By SCM Direct.com
SCM Direct.com is an innovative on-line wealth manager, offering investors low cost access to high end investment management. The team are respected for their integrity and thrive on their passion for delivering the best possible investment outcomes for clients. This is achieved through a winning combination of expertise, evidence and ethics, all at 100% transparent fair fees and with 100% transparency of holdings. The founders believe actions speak louder than words and invest significant amounts of their wealth alongside clients, on exactly the same terms and fees.
In January 2012 SCM launched the True and Fair Campaign - www.trueandfaircampaign.com - calling for 100% transparency on fees and holdings, believing this would lead to significantly higher levels of consumer protection for UK investors. Having achieved major successes in their fight for total cost transparency via two European Directives, SCM and its campaign is now focusing on transparency of holdings.
Telephone 020 7838 8650
www.scmdirect.comwww.trueandfaircampaign.com
Contact details:
Gina Miller – [email protected]
Research Methodology
Report produced by SCM Direct, which is a trading name of SCM Private LLP. February 2015