clinical trial design. research question testable hypothesis research design intervention endpoints...
TRANSCRIPT

Clinical Trial DesignClinical Trial Design
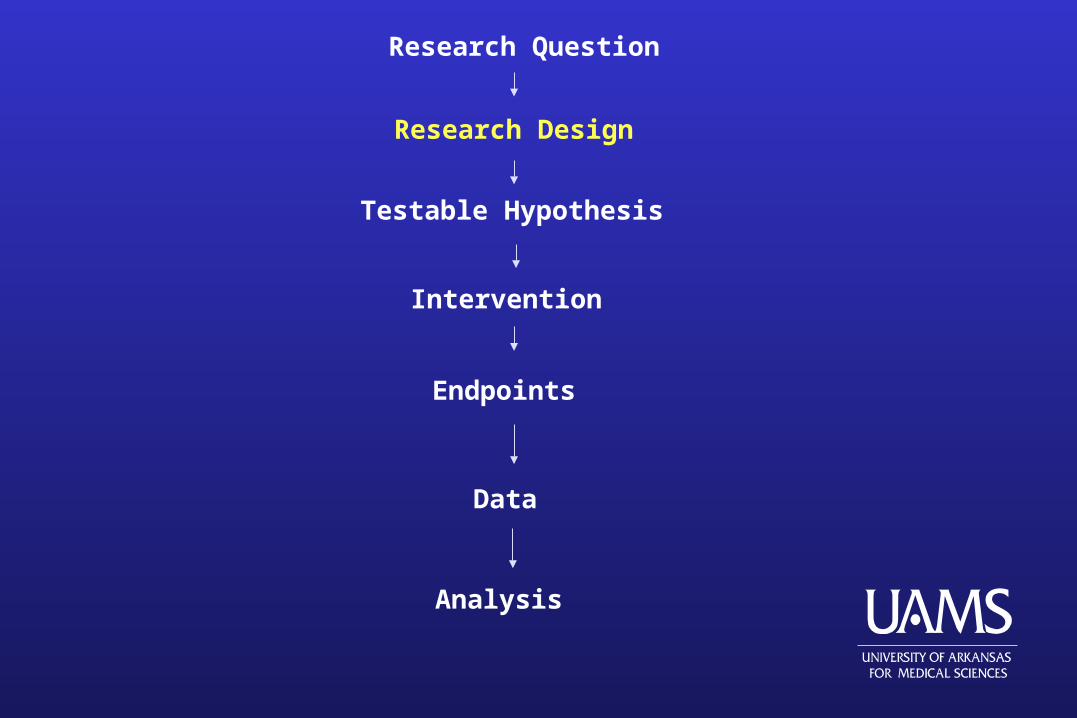
Research Question
Testable Hypothesis
Research Design
Intervention
Endpoints
Data
Analysis
Evolution of DesignsEvolution of Designs
Experimental design started mainly in agricultural research and influenced laboratory and industrial research before finally reaching pharmaceuticals trials in humans.
The roots of clinical design steams from classical experimental design with additional features of not able to control many sources of variability through design as laboratory experiment.
Lengthy periods for patient accrual and follow-up.
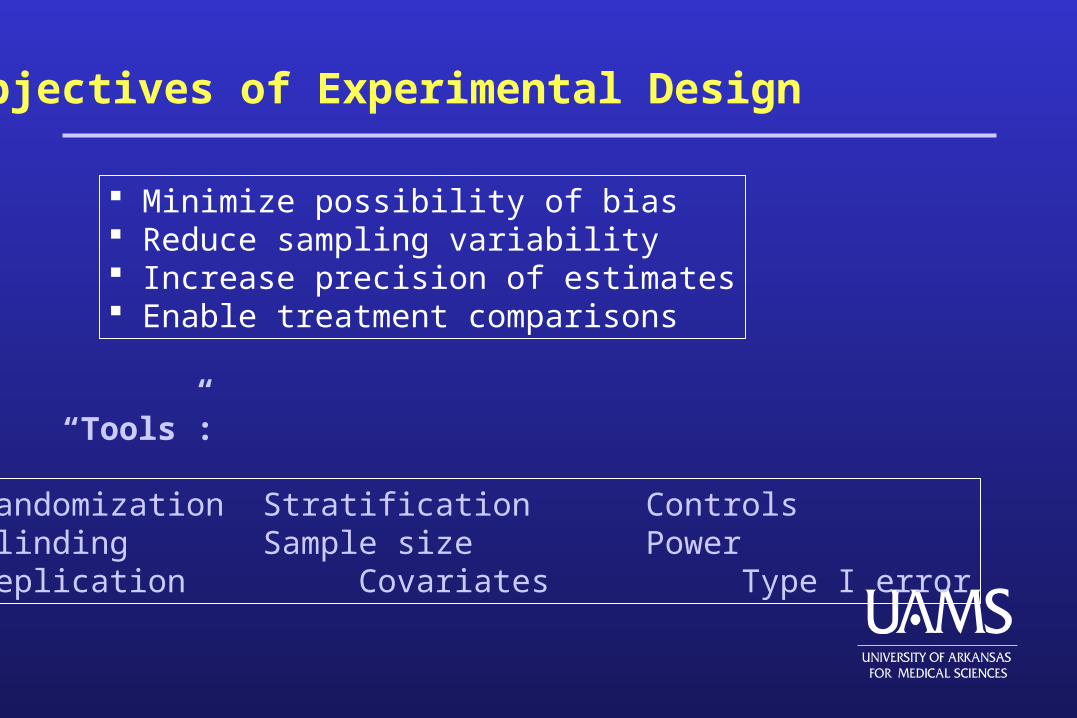
Objectives of Experimental Design
Minimize possibility of bias Reduce sampling variability Increase precision of estimates Enable treatment comparisons
Randomization Stratification ControlsBlinding Sample size PowerReplication Covariates Type I error
“Tools”:
Advantages of Proper Design (1)Advantages of Proper Design (1)
Good trial design and conduct is more important than selecting the correct statistical analysis.
Skillful statistical analysis CANNOT overcome basic design flaws.
Two major shortcomings of poorly design trial: Inaccuracy (bias) Imprecision (large variability) in estimating treatment effect
Advantages of Proper Design (2)Advantages of Proper Design (2)
Piantadosi (2005) Allows investigators to satisfy ethical constraints Permits efficient use of scarce resources Isolates the treatment effect of interest from confounders Controls precision Reduces selection bias and observer bias Minimizes and quantifies random error or uncertainty Simplifies and validates the analysis Increases the external validity of the trial
Clinical Trial ObjectivesClinical Trial Objectives Estimate the magnitude of treatment effects or estimate differences
in treatment effects.
Clinical trial design should accomplish the following (Piantadosi 2005):
Quantify and reduce errors due to chance Reduce or eliminate bias Yield clinically relevant estimates of effects and precision Be simple in design and analysis Provide a high degree of credibility, reproducibility, and external validity Influence future clinical practice
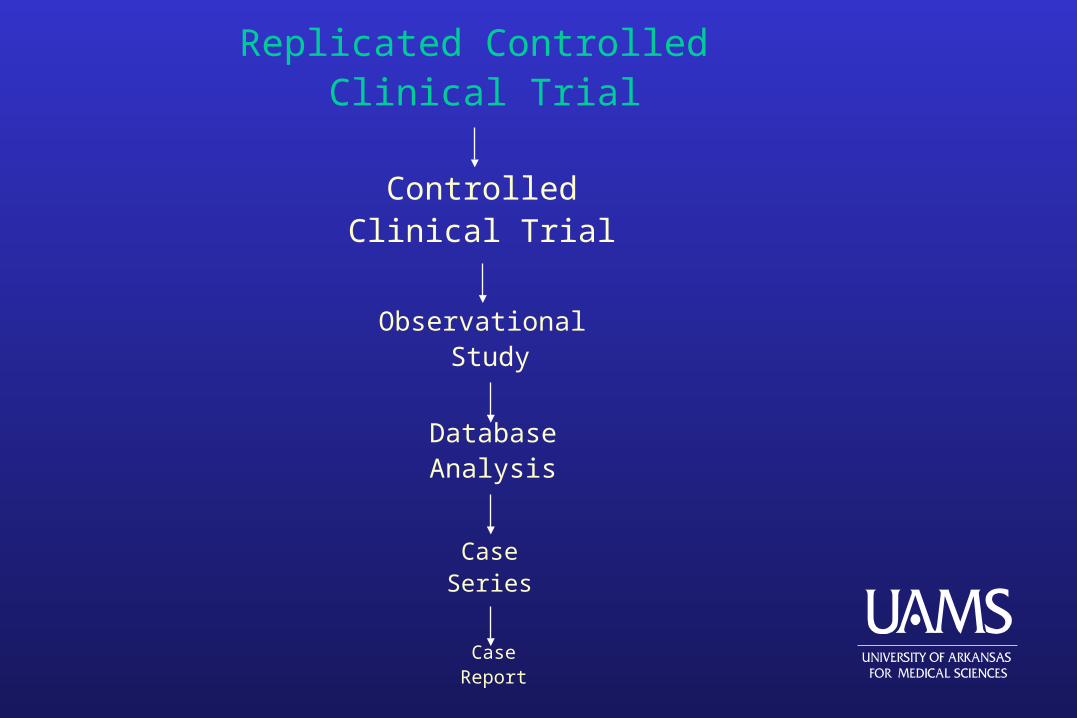
Replicated Controlled Clinical Trial
ControlledClinical Trial
Observational Study
DatabaseAnalysis
CaseSeries
CaseReport
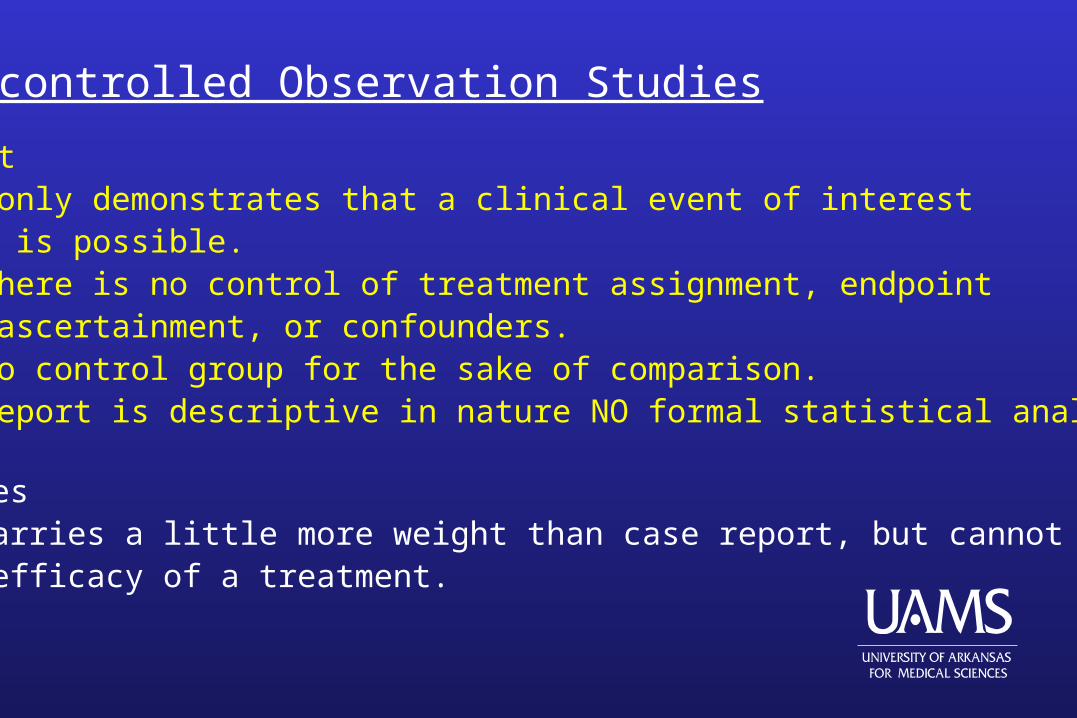
Uncontrolled Observation Studies
Case Report 1. only demonstrates that a clinical event of interest is possible. 2. There is no control of treatment assignment, endpoint ascertainment, or confounders. 3. No control group for the sake of comparison. 4. Report is descriptive in nature NO formal statistical analysis.
Case Series Carries a little more weight than case report, but cannot prove efficacy of a treatment.
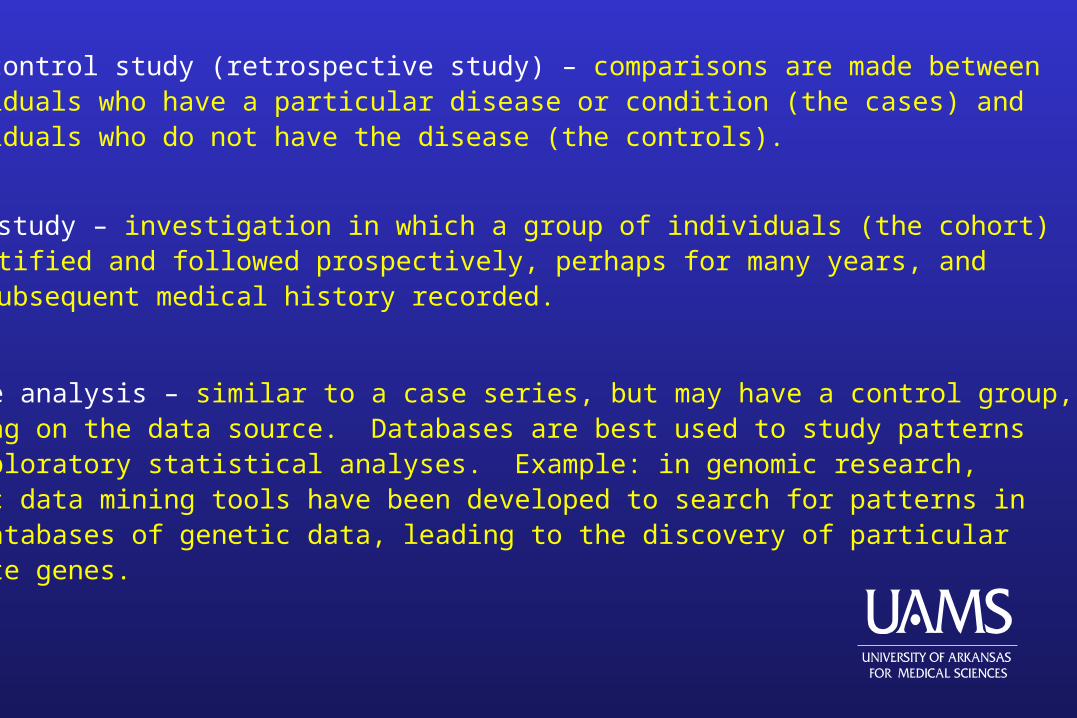
Case-control study (retrospective study) – comparisons are made betweenindividuals who have a particular disease or condition (the cases) andindividuals who do not have the disease (the controls).
Cohort study – investigation in which a group of individuals (the cohort)is identified and followed prospectively, perhaps for many years, andtheir subsequent medical history recorded.
Database analysis – similar to a case series, but may have a control group,depending on the data source. Databases are best used to study patternswith exploratory statistical analyses. Example: in genomic research, specific data mining tools have been developed to search for patterns inlarge databases of genetic data, leading to the discovery of particular candidate genes.
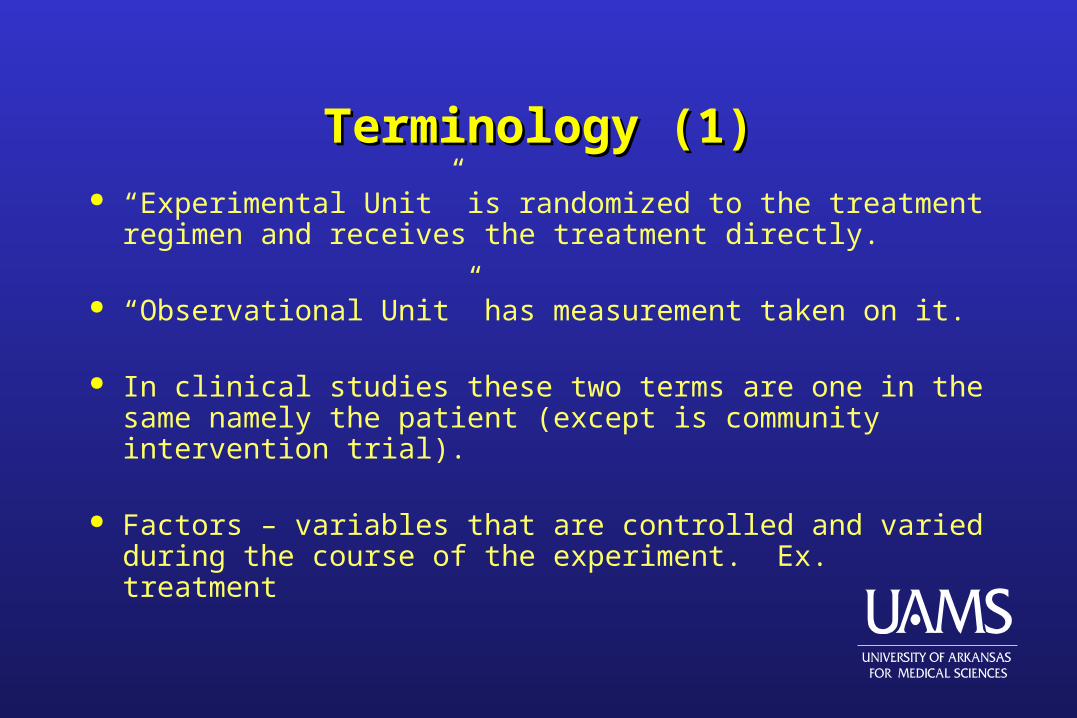
Terminology (1)Terminology (1) “Experimental Unit” is randomized to the treatment regimen and
receives the treatment directly.
“Observational Unit” has measurement taken on it.
In clinical studies these two terms are one in the same namely the patient (except is community intervention trial).
Factors – variables that are controlled and varied during the course of the experiment. Ex. treatment
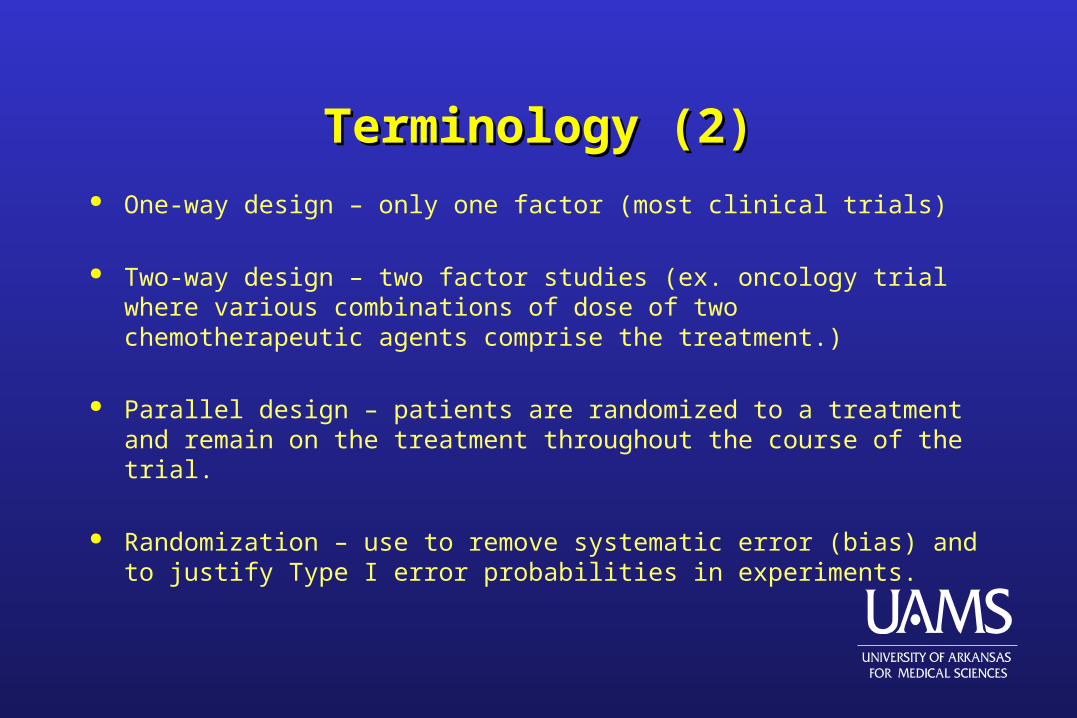
Terminology (2)Terminology (2) One-way design – only one factor (most clinical trials)
Two-way design – two factor studies (ex. oncology trial where various combinations of dose of two chemotherapeutic agents comprise the treatment.)
Parallel design – patients are randomized to a treatment and remain on the treatment throughout the course of the trial.
Randomization – use to remove systematic error (bias) and to justify Type I error probabilities in experiments.
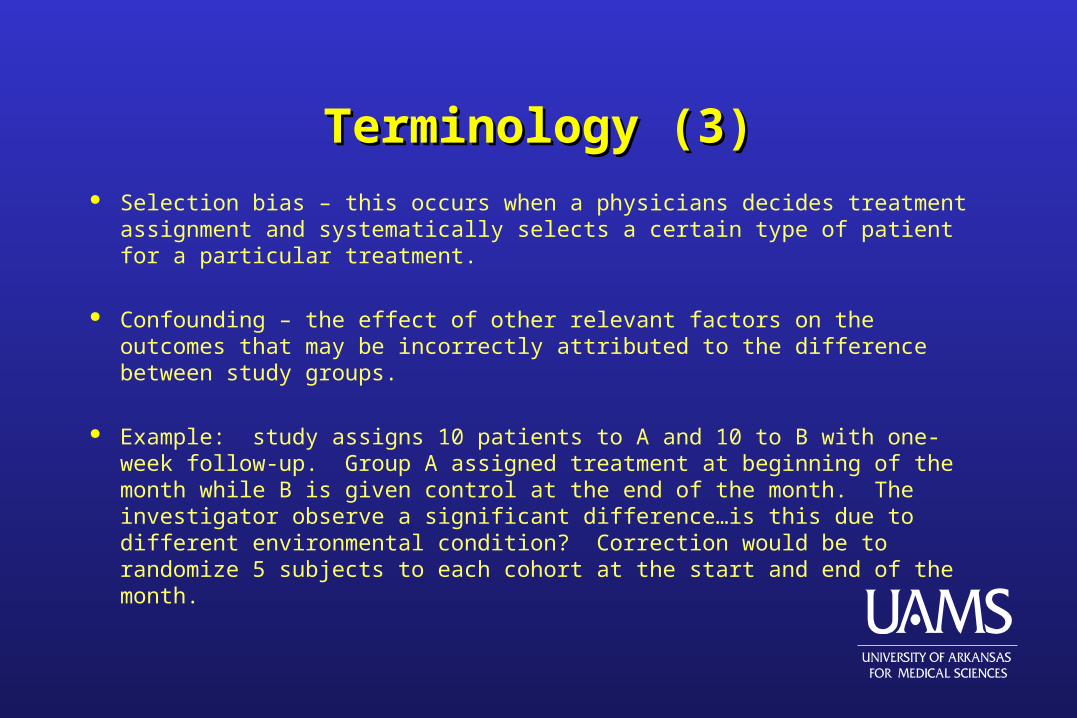
Terminology (3)Terminology (3) Selection bias – this occurs when a physicians decides treatment assignment and
systematically selects a certain type of patient for a particular treatment.
Confounding – the effect of other relevant factors on the outcomes that may be incorrectly attributed to the difference between study groups.
Example: study assigns 10 patients to A and 10 to B with one-week follow-up. Group A assigned treatment at beginning of the month while B is given control at the end of the month. The investigator observe a significant difference…is this due to different environmental condition? Correction would be to randomize 5 subjects to each cohort at the start and end of the month.
Terminology (4)Terminology (4)
Internal validity – if the observed difference in outcome between the study groups is real and not due to bias, chance, or confounding.
Randomized placebo-controlled, double-blinded clinical trials have high levels of internal validity.
External validity – with human trials refers to how well study results can be generalized to the population.
Terminology (5)Terminology (5)
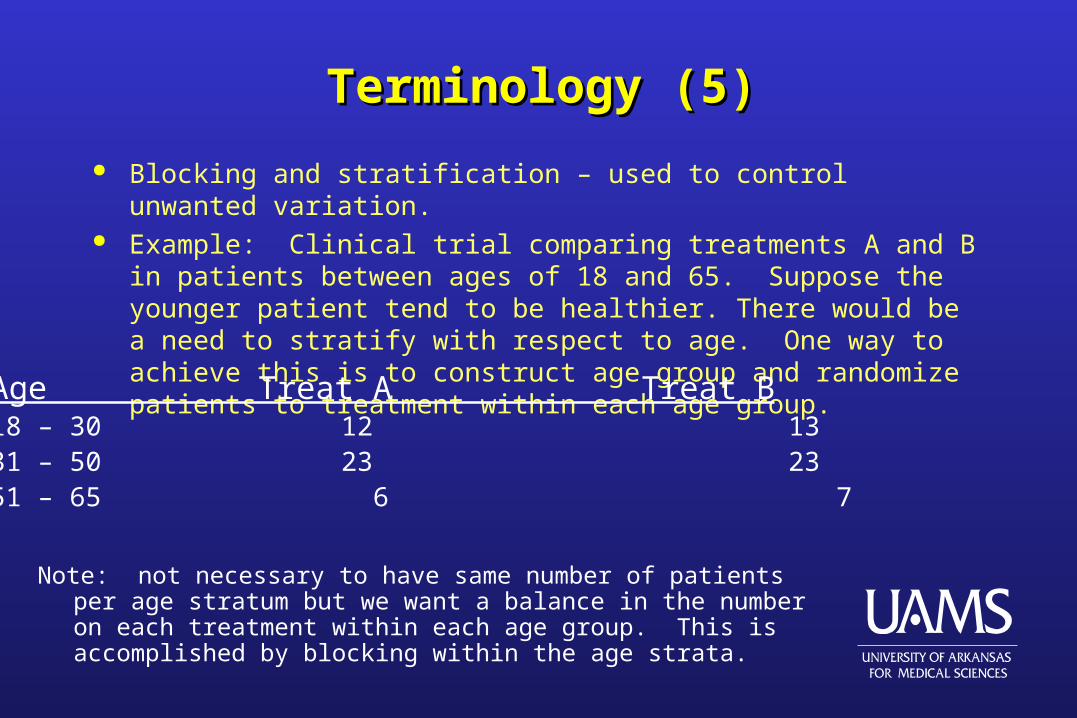
Blocking and stratification – used to control unwanted variation. Example: Clinical trial comparing treatments A and B in patients between ages
of 18 and 65. Suppose the younger patient tend to be healthier. There would be a need to stratify with respect to age. One way to achieve this is to construct age group and randomize patients to treatment within each age group.
Age Treat A Treat B18 – 30 12 1331 – 50 23 2351 – 65 6 7
Note: not necessary to have same number of patients per age stratum but we want a balance in the number on each treatment within each age group. This is accomplished by blocking within the age strata.
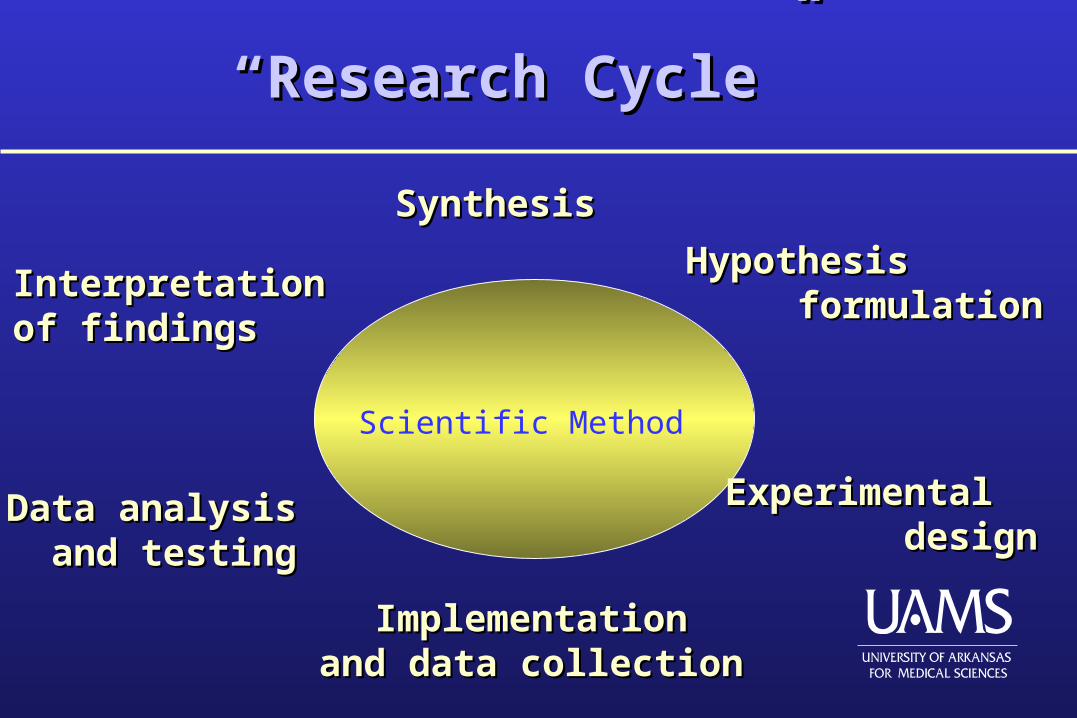
““Research Cycle”Research Cycle”
SynthesisSynthesis
Interpretation Interpretation of findingsof findings
Data analysisData analysis and testingand testing
ImplementationImplementationand data collectionand data collection
ExperimentalExperimental designdesign
HypothesisHypothesis formulationformulation
Scientific Method
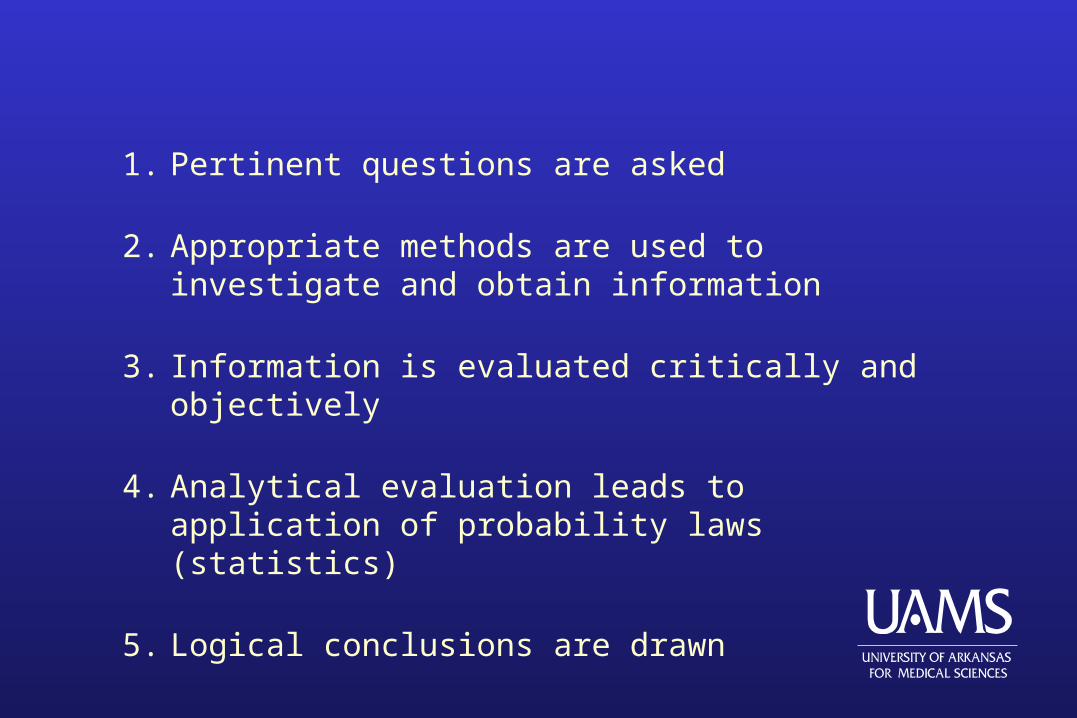
1. Pertinent questions are asked
2. Appropriate methods are used to investigate and obtain information
3. Information is evaluated critically and objectively
4. Analytical evaluation leads to application of probability laws (statistics)
5. Logical conclusions are drawn
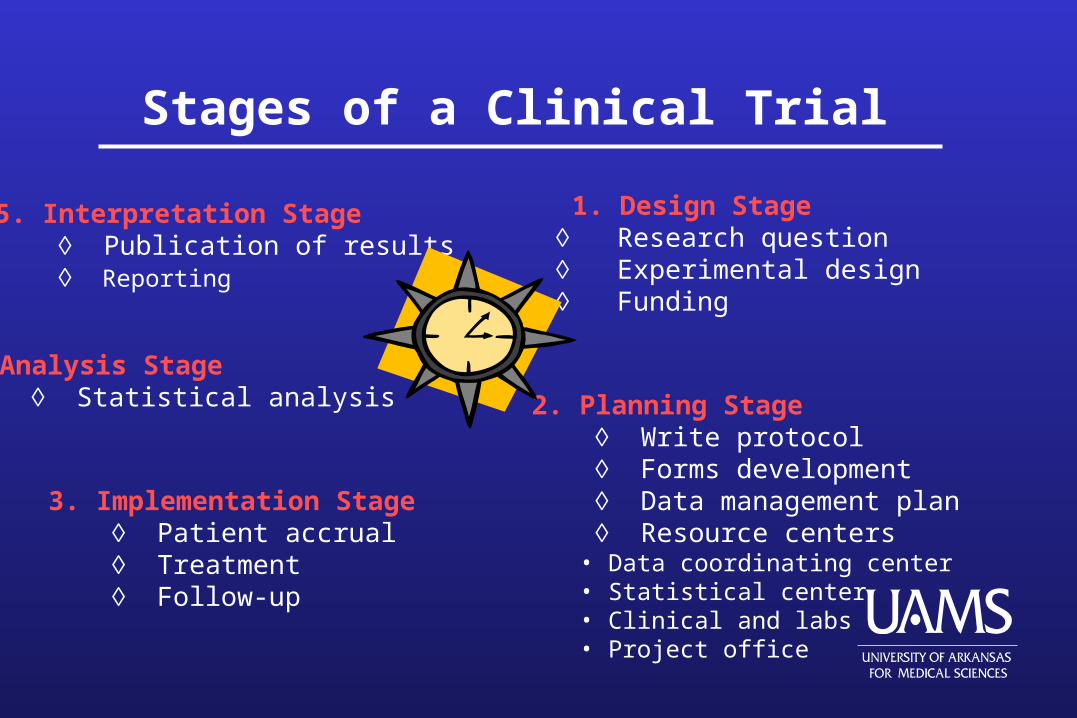
Stages of a Clinical Trial
5. Interpretation Stage Publication of results Reporting
1. Design Stage Research question Experimental design Funding
4. Analysis Stage Statistical analysis 2. Planning Stage
Write protocol Forms development Data management plan Resource centers
• Data coordinating center• Statistical center• Clinical and labs• Project office
3. Implementation Stage Patient accrual Treatment Follow-up
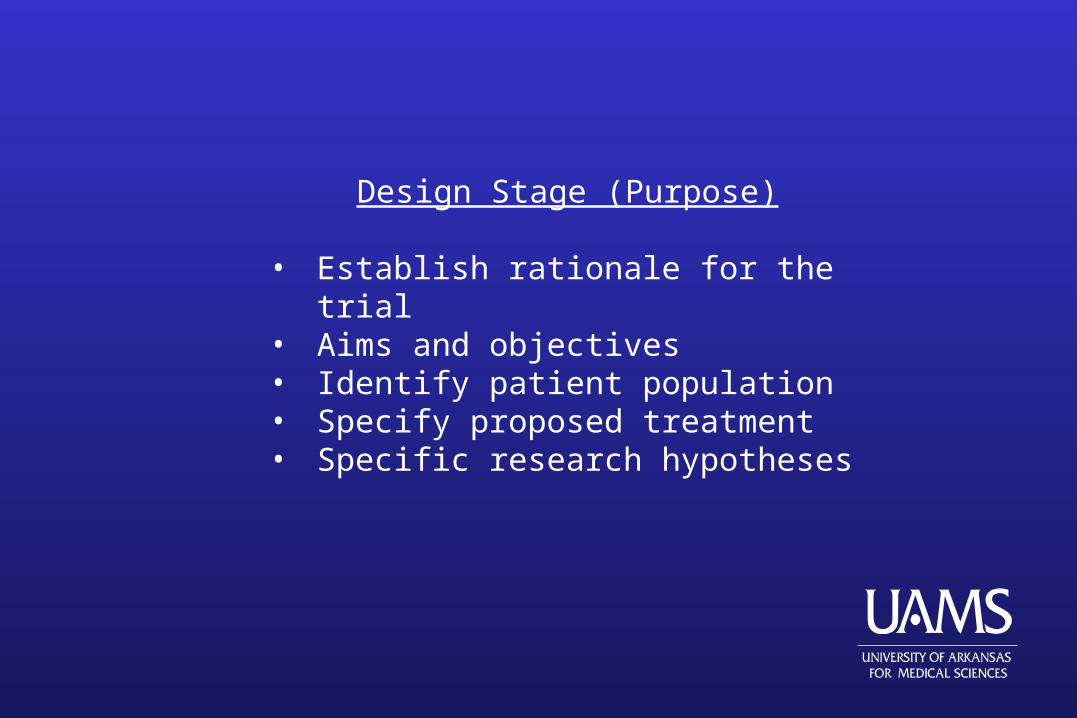
Design Stage (Purpose)
• Establish rationale for the trial• Aims and objectives• Identify patient population• Specify proposed treatment• Specific research hypotheses
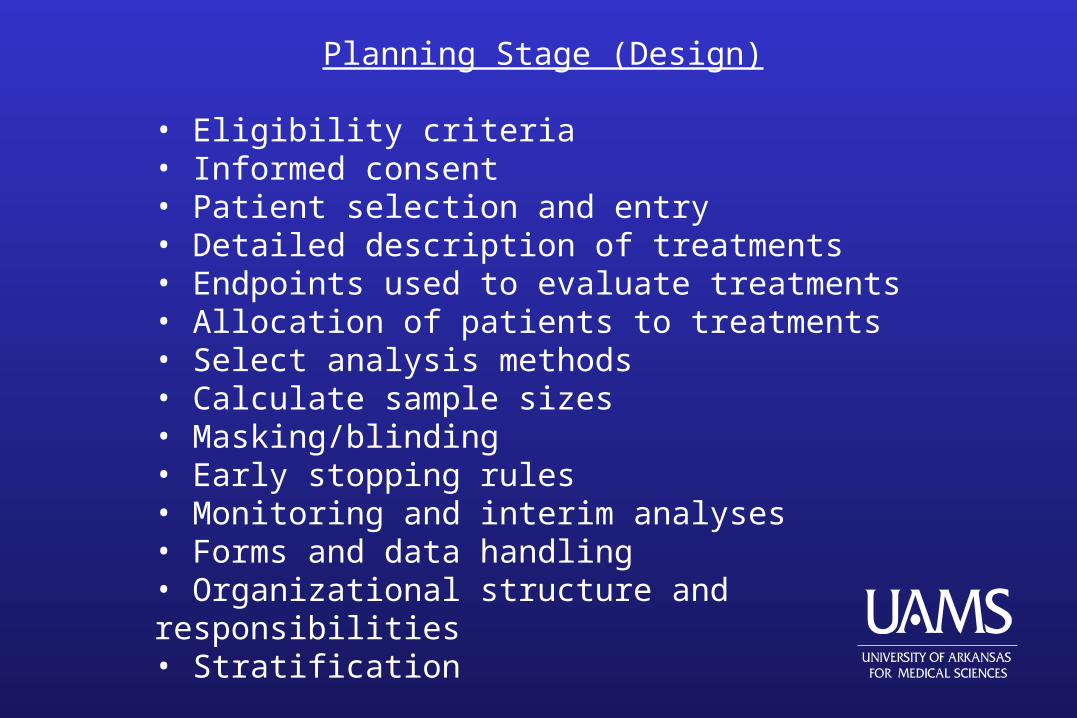
Planning Stage (Design)
• Eligibility criteria• Informed consent • Patient selection and entry• Detailed description of treatments• Endpoints used to evaluate treatments• Allocation of patients to treatments• Select analysis methods• Calculate sample sizes• Masking/blinding• Early stopping rules• Monitoring and interim analyses• Forms and data handling• Organizational structure and responsibilities• Stratification
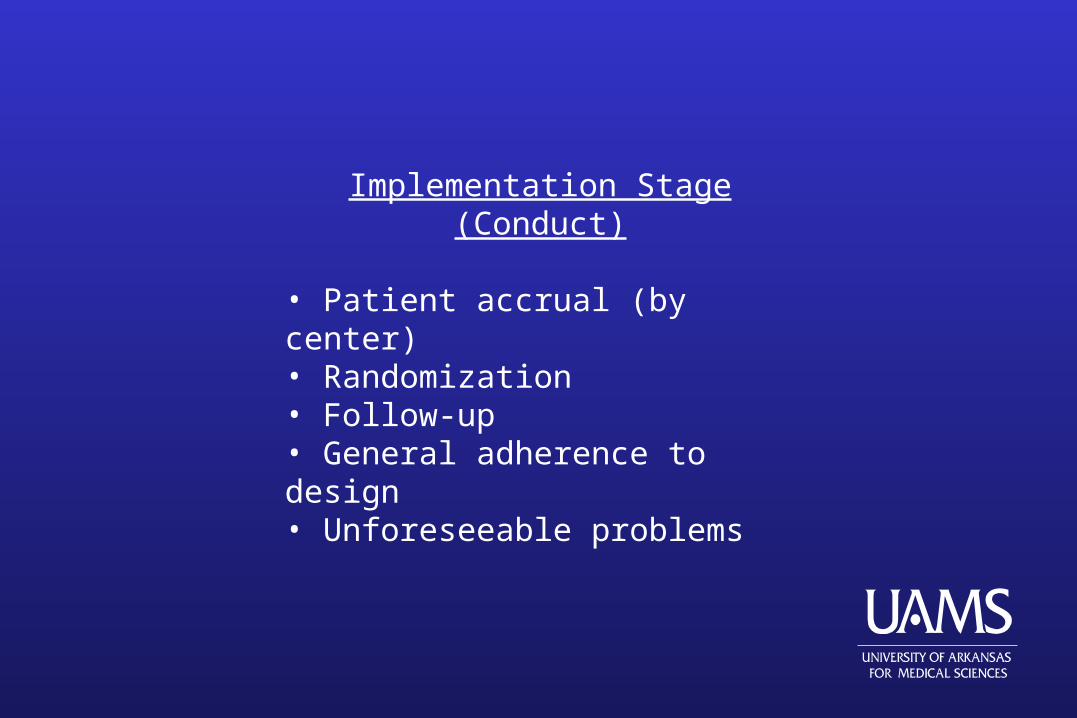
Implementation Stage (Conduct)
• Patient accrual (by center)• Randomization • Follow-up• General adherence to design• Unforeseeable problems
Analysis Stage
• Test hypotheses• Make inferences• Investigate prognostic value of variables• Summarize accrual and treatment numbers• Assess adequacy of design• Evaluate toxicities
Interpretation Stage
• Ensure proper interpretation of results• Gauge reasonableness of conclusions
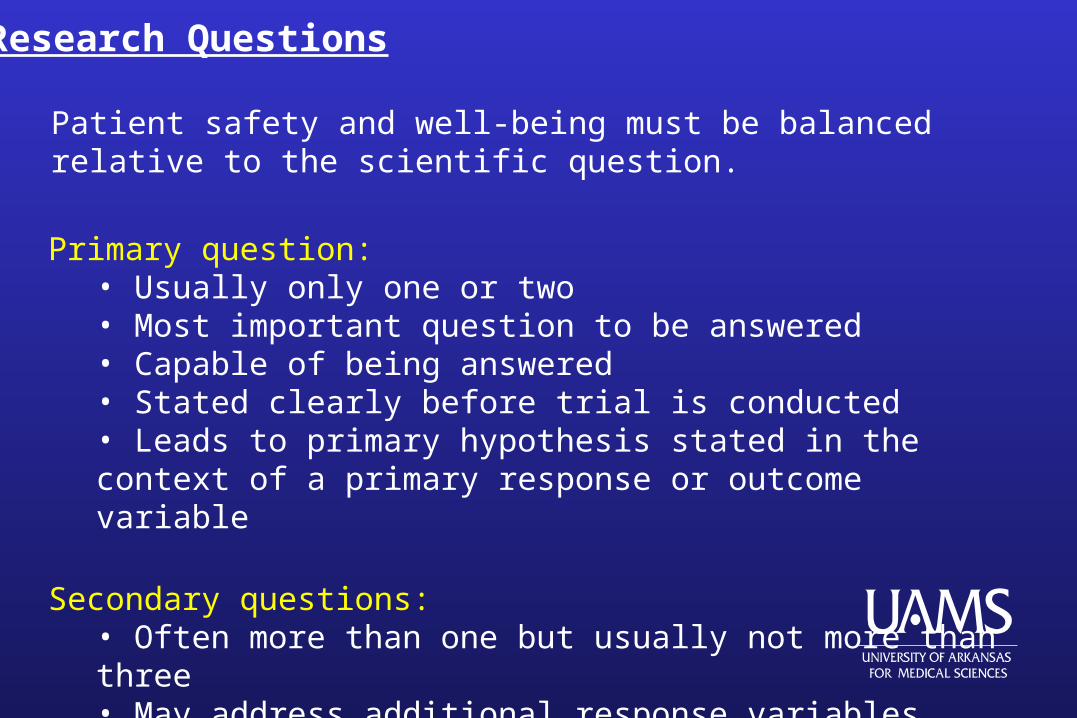
Research Questions
Primary question:• Usually only one or two• Most important question to be answered • Capable of being answered• Stated clearly before trial is conducted• Leads to primary hypothesis stated in the context of a primary response or outcome variable
Secondary questions:• Often more than one but usually not more than three• May address additional response variables• May address subgroups of subjects
Patient safety and well-being must be balanced relative to the scientific question.
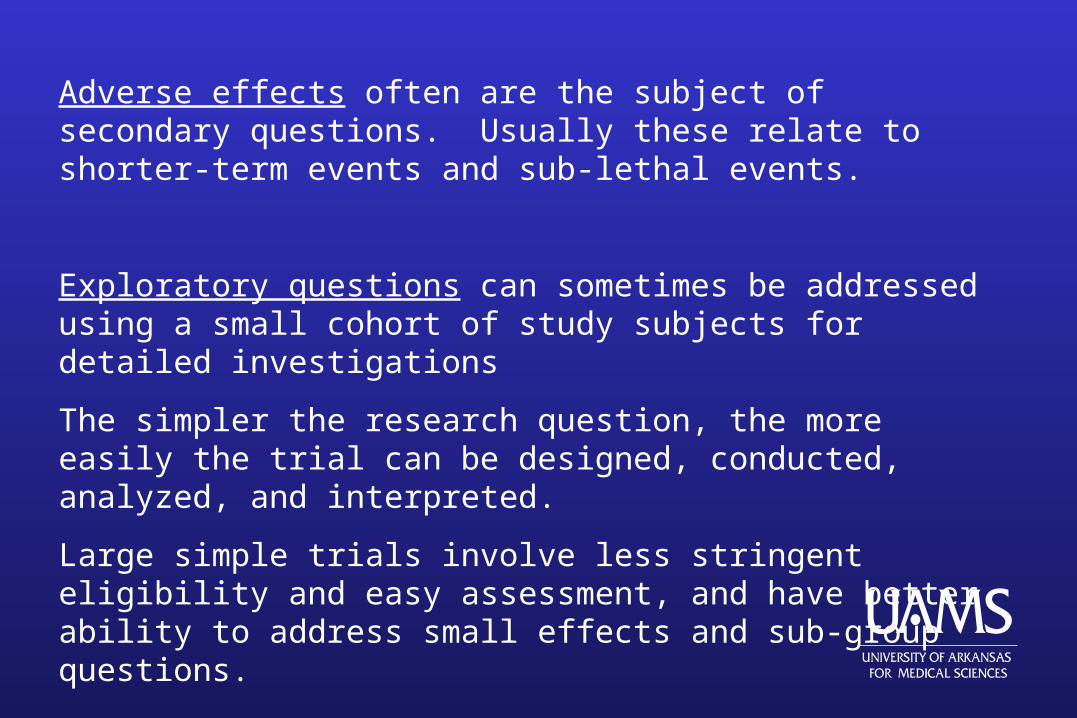
Adverse effects often are the subject of secondary questions. Usually these relate to shorter-term events and sub-lethal events.
Exploratory questions can sometimes be addressed using a small cohort of study subjects for detailed investigations
The simpler the research question, the more easily the trial can be designed, conducted, analyzed, and interpreted.
Large simple trials involve less stringent eligibility and easy assessment, and have better ability to address small effects and sub-group questions.
Intervention
• Must be well defined
• Must have favorable benefit-to-toxicity ratio
Study Population
Intimately tied to the research question.
The study population is “the subset of the population having the condition or characteristics of interest defined by the eligibility criteria (inclusion/exclusion)”. This is the population to which an inference is desired to be made.
Eligibility criteria, together with the characteristics of the subjects that actually are enrolled, define the study sample, and the population to which the inference may truly be valid [external validity].
Subjects:
• should have the potential to benefit from the intervention
• should be selected (via eligibility) so that the intervention will produce a measurable effect of reasonably high magnitude if successful.
• who are likely to be harmed should be deemed ineligible before being enrolled rather than being removed from the study later.
• should be at low risk of experiencing competing events or causes of toxicity, to ensure that subjects remain in the study and are evaluated rather than becoming dropouts.
• should be considered likely to adhere to the protocol (patient compliance).
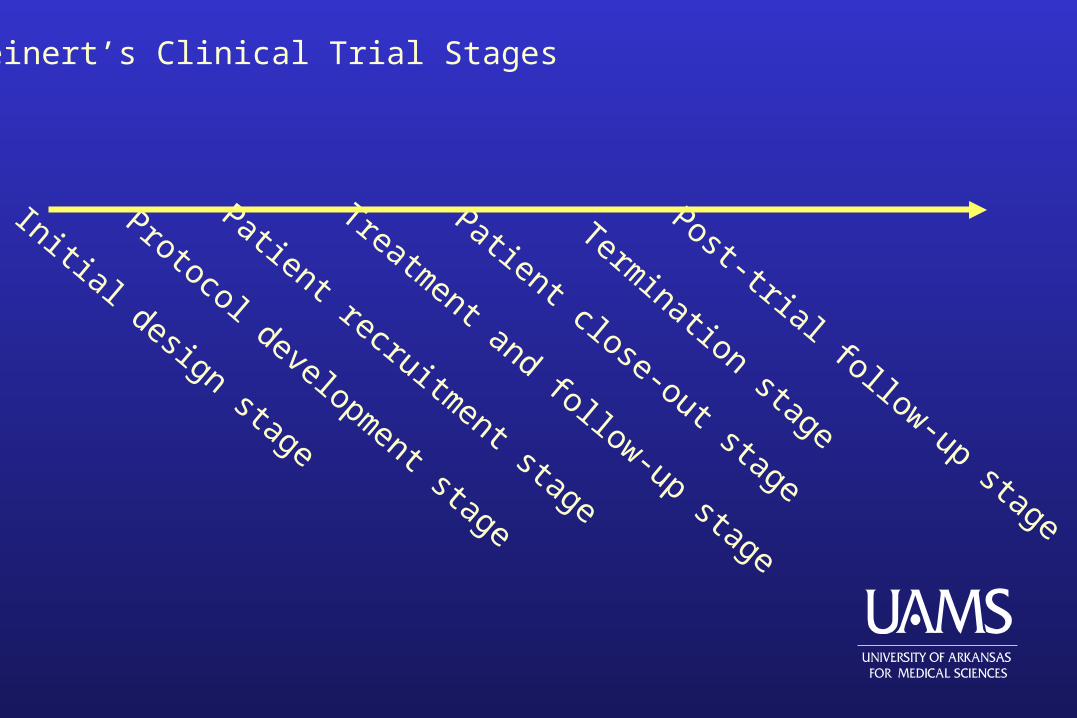
Initial design stage
Protocol development stage
Patient recruitment stage
Treatment and follow-up stage
Patient close-out stage
Termination stage
Post-trial follow-up stage
Meinert’s Clinical Trial Stages
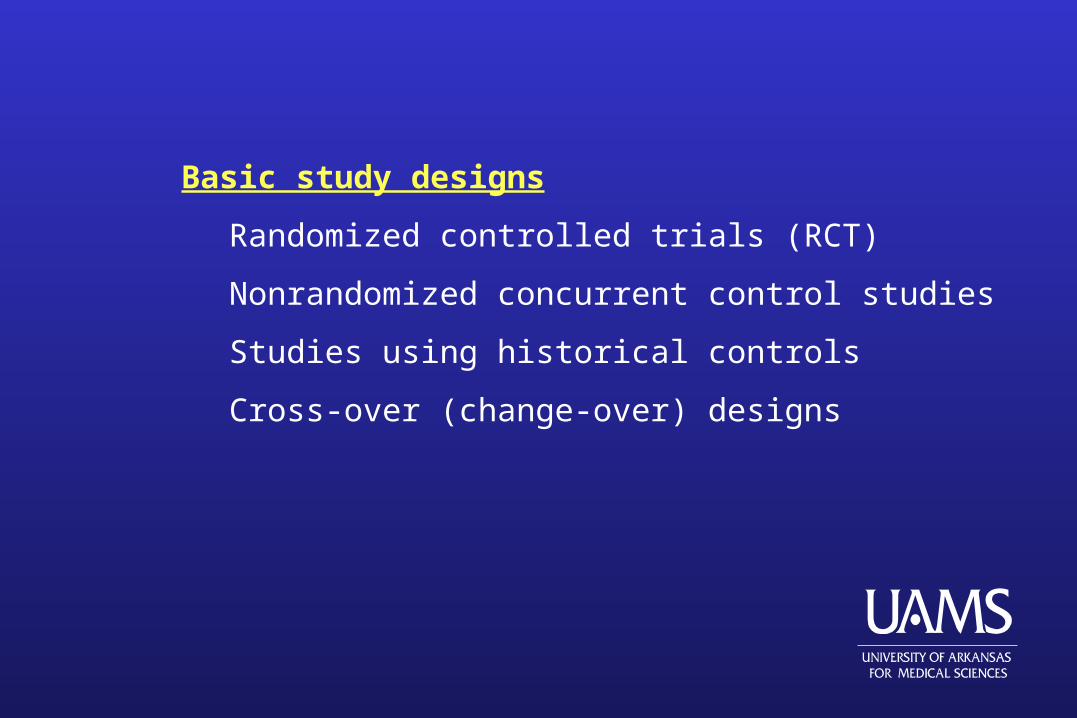
Basic study designs
Randomized controlled trials (RCT)
Nonrandomized concurrent control studies
Studies using historical controls
Cross-over (change-over) designs
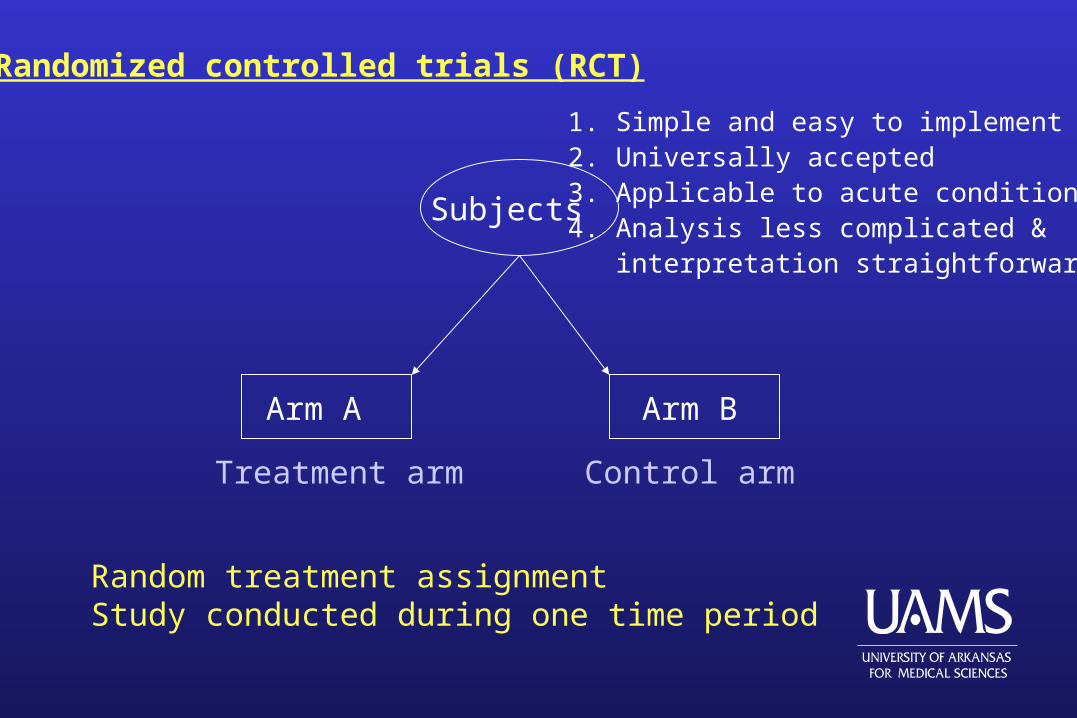
Randomized controlled trials (RCT)
Arm A Arm B
Subjects
Random treatment assignmentStudy conducted during one time period
Control armTreatment arm
1. Simple and easy to implement2. Universally accepted3. Applicable to acute conditions4. Analysis less complicated & interpretation straightforward
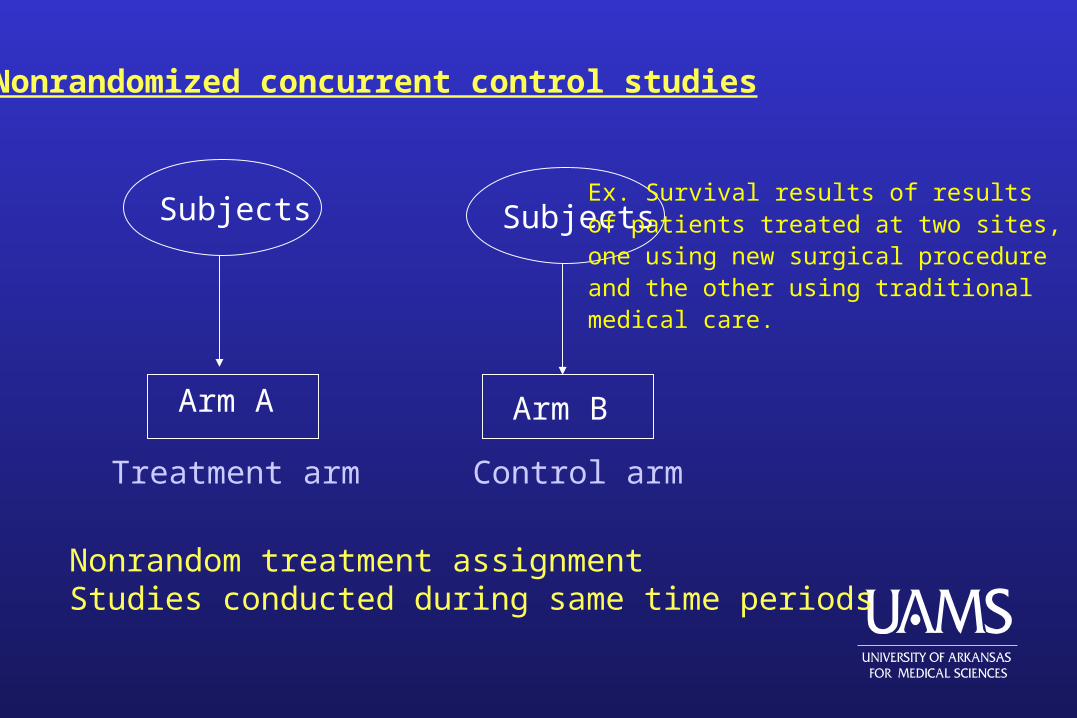
Nonrandomized concurrent control studies
Arm A Arm B
Subjects
Nonrandom treatment assignmentStudies conducted during same time periods
Control armTreatment arm
SubjectsEx. Survival results of resultsof patients treated at two sites,one using new surgical procedureand the other using traditionalmedical care.
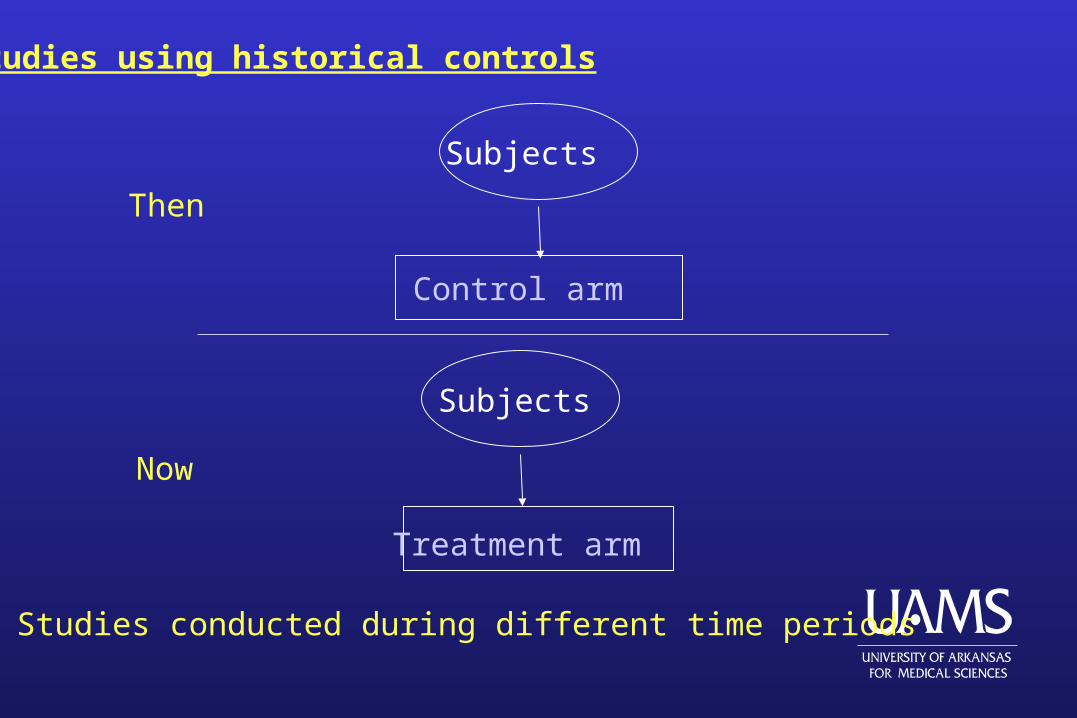
Studies using historical controls
Control arm
Subjects
Treatment arm
Studies conducted during different time periods
Subjects
Then
Now
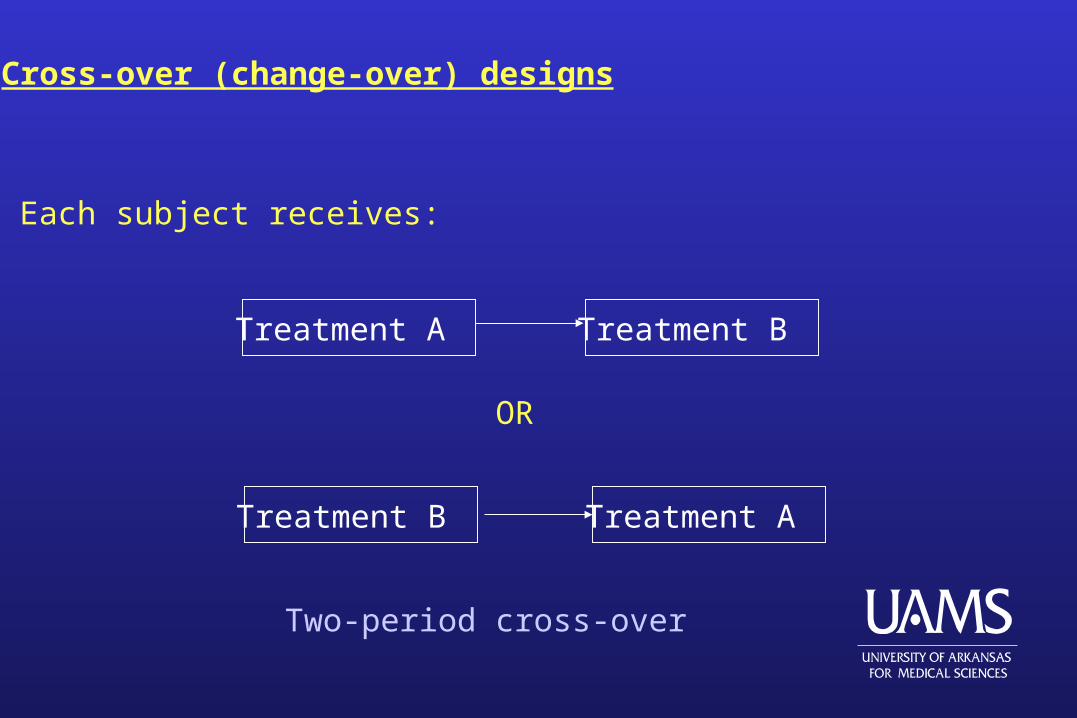
Cross-over (change-over) designs
Treatment A
Treatment A
Treatment B
Treatment B
OR
Each subject receives:
Two-period cross-over
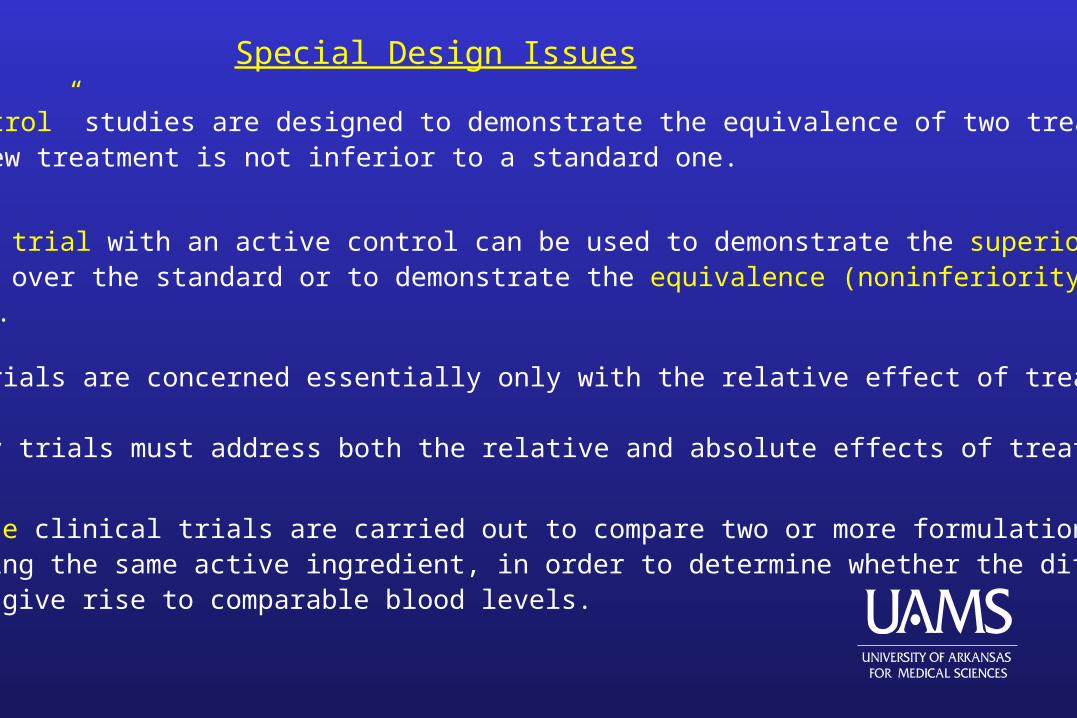
Bioequivalence clinical trials are carried out to compare two or more formulations of a drug containing the same active ingredient, in order to determine whether the differentformulations give rise to comparable blood levels.
“Active Control” studies are designed to demonstrate the equivalence of two treatmentsor show a new treatment is not inferior to a standard one.
Special Design Issues
A comparative trial with an active control can be used to demonstrate the superiority of anew treatment over the standard or to demonstrate the equivalence (noninferiority) of thenew treatment.
Superiority trials are concerned essentially only with the relative effect of treatment.
Noninferiority trials must address both the relative and absolute effects of treatment.

Protocol Document
Bias and Random ErrorBias and Random Error
Parameter
A well-defined characteristic of an individual subject (experimental unit) or group of subjects that is unknown and unknowable in truth, but which may be measured, observed, or estimated (albeit with random error).
Random Error
Also known as variability, random variation, or “noise in the system”.The heterogeneity in the human population leads to relatively largerandom variation in clinical trials.
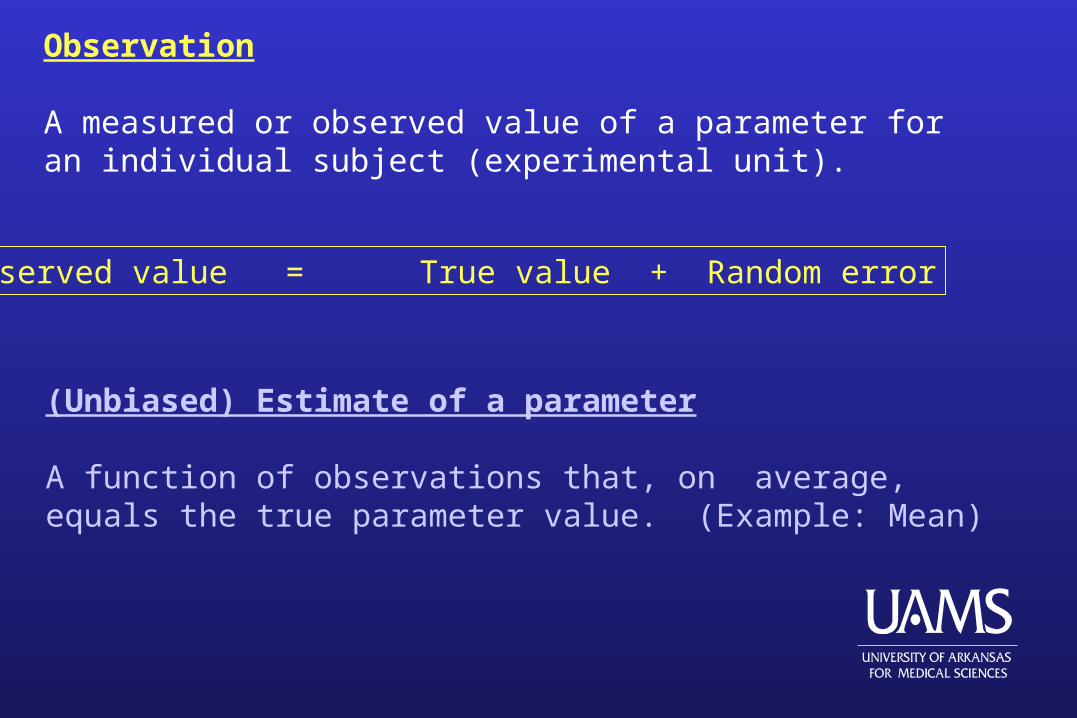
Observation
A measured or observed value of a parameter for an individual subject (experimental unit).
Observed value = True value + Random error
(Unbiased) Estimate of a parameter
A function of observations that, on average, equals the true parameter value. (Example: Mean)
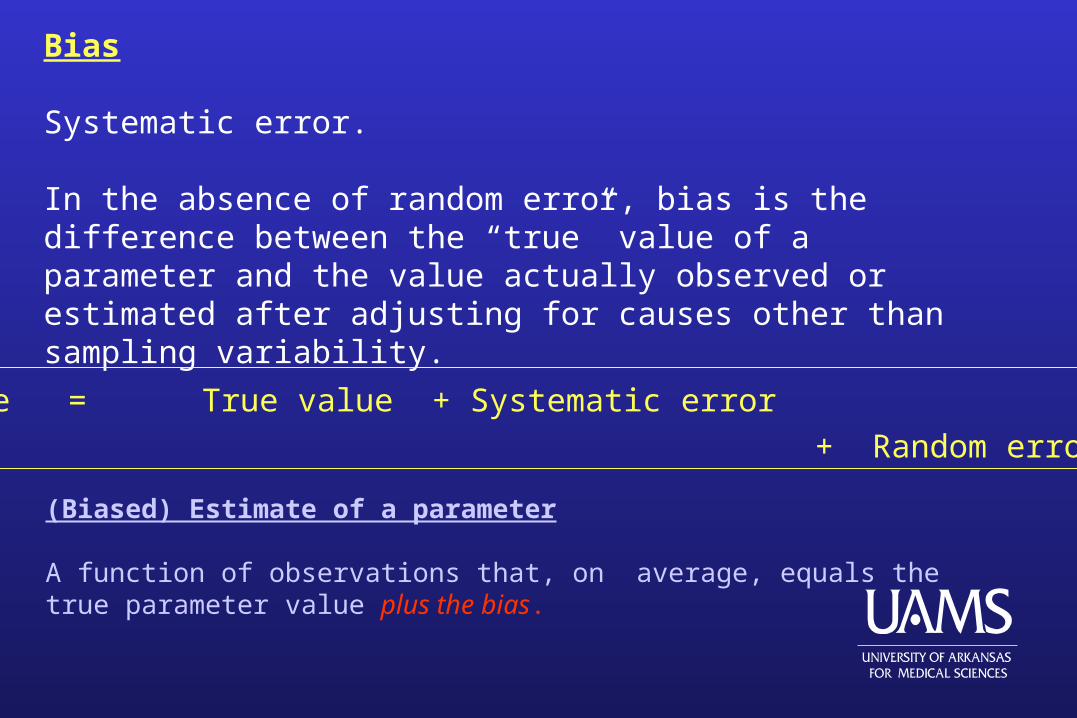
Bias
Systematic error.
In the absence of random error, bias is the difference between the “true” value of a parameter and the value actually observed or estimated after adjusting for causes other than sampling variability.
Observed value = True value + Systematic error
+ Random error
(Biased) Estimate of a parameter
A function of observations that, on average, equals the true parameter value plus the bias.
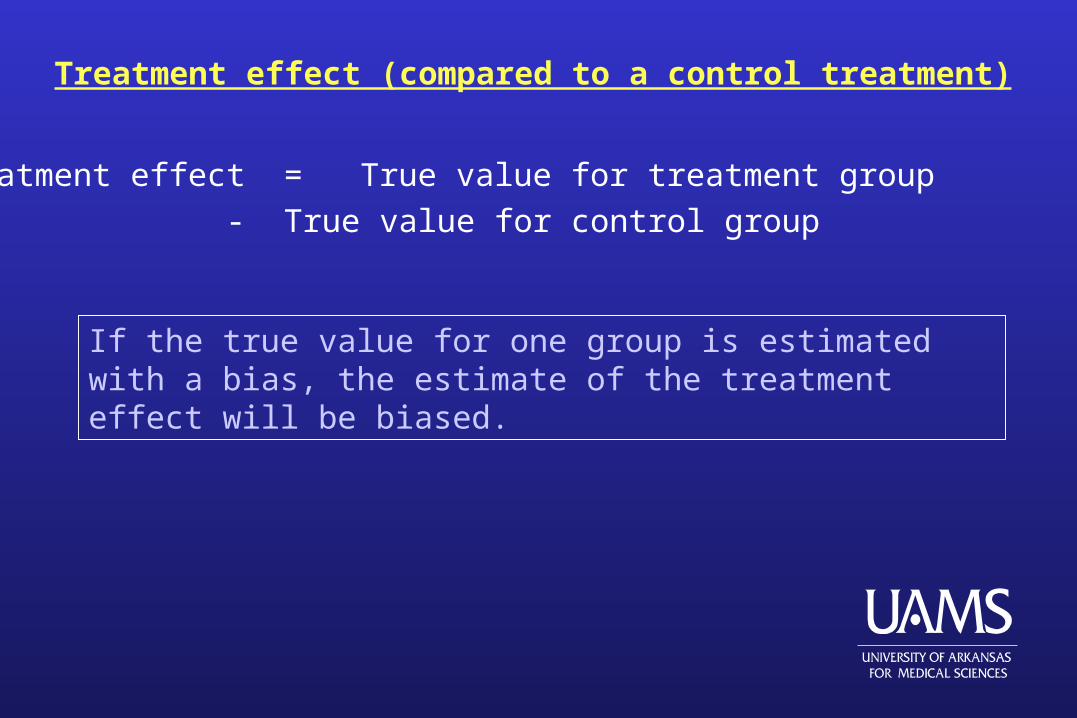
Treatment effect (compared to a control treatment)
Treatment effect = True value for treatment group
- True value for control group
If the true value for one group is estimated with a bias, the estimate of the treatment effect will be biased.
Random Error vs. Bias (1)Random Error vs. Bias (1)
Random error has no preferred direction, so we expect that averaging over a large number of observations will yield a net effect of zero.
The estimate may be imprecise, but not inaccurate (minimized with large sample sizes).
Bias has a net direction and magnitude so that averaging over a large number of observations does not eliminate its effect.
Bias can be large enough to invalidate any conclusions.
In human studies, bias can be difficult to detect and the suspicion of bias can render judgment that a study is invalid.
Random Error vs. Bias (2)Random Error vs. Bias (2)
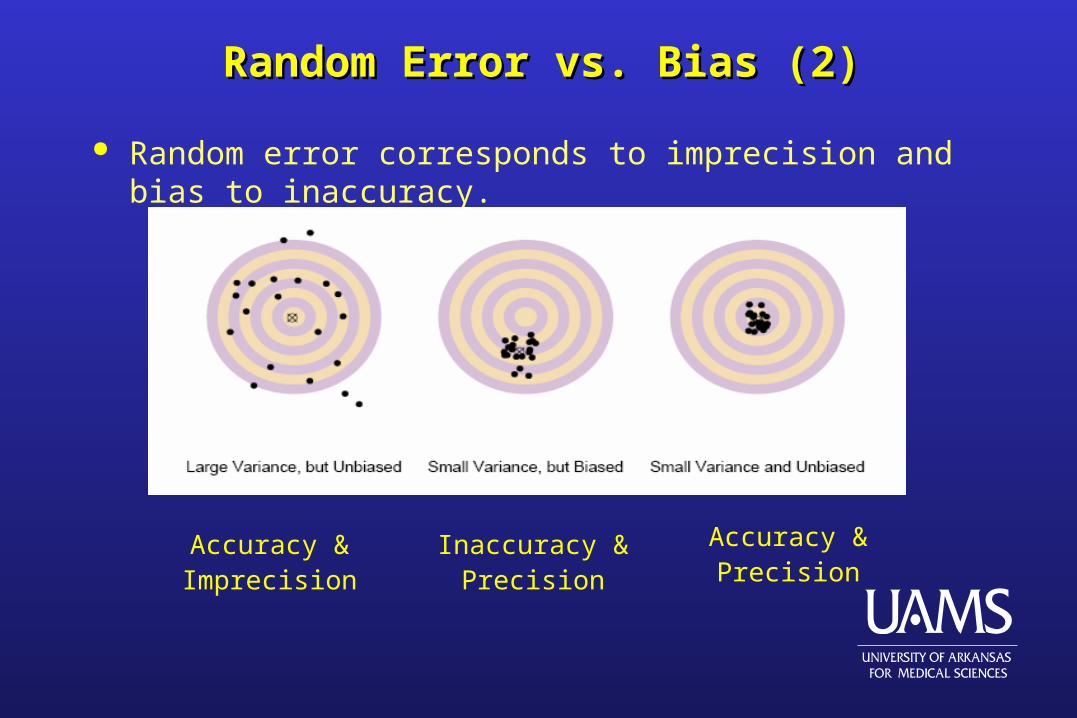
Random error corresponds to imprecision and bias to inaccuracy.
Accuracy &Precision
Inaccuracy &Precision
Accuracy &Imprecision
Random ErrorRandom Error
Variability, imprecision can be overcome by increasing the sample size.
This will be illustrated via hypothesis testing and confidence intervals, twoaccepted forms of statistical inference.
Review of Hypothesis Testing (1)Review of Hypothesis Testing (1)
Null hypothesis – reflects the lack of an effect.
Alternative hypothesis – reflects the presence of an effect (supporting the research hypothesis).
The investigator needs to have sufficient evidence, based on the data collected in a study, to reject the null hypothesis in favor of the alternative hypothesis.
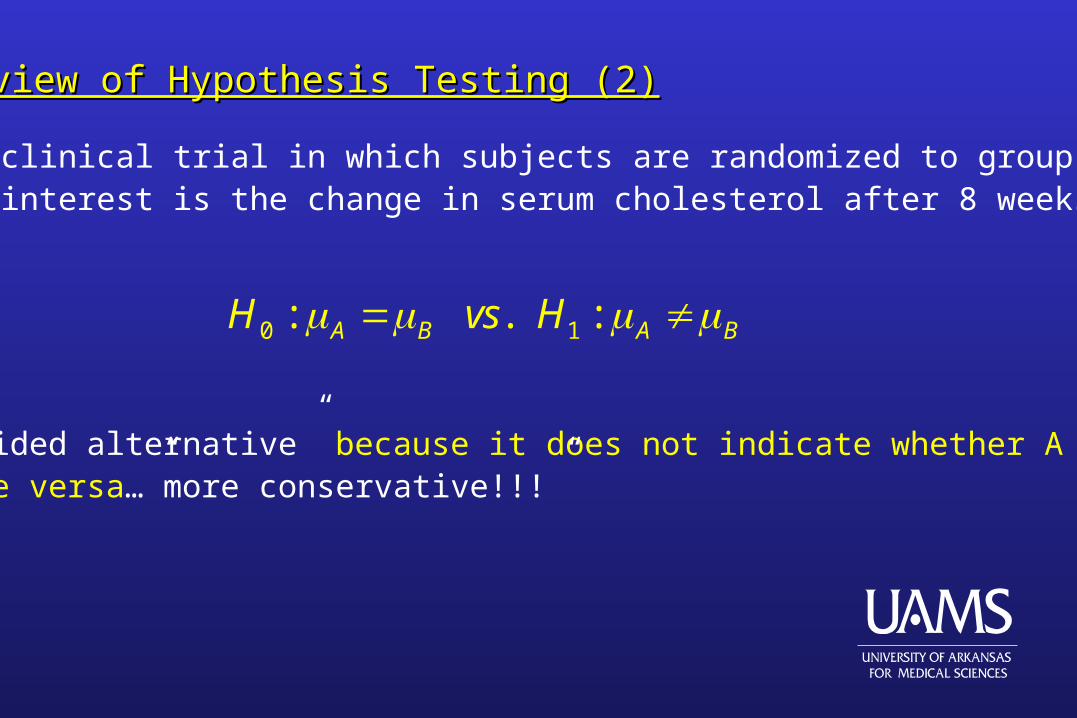
Review of Hypothesis Testing (2)Review of Hypothesis Testing (2)
Ex. 2-arm clinical trial in which subjects are randomized to group A or B.Outcome of interest is the change in serum cholesterol after 8 weeks.
0 1: . :A B A BH vs H
Note: “two-sided alternative” because it does not indicate whether A is betterthan B or vice versa…”more conservative!!!”
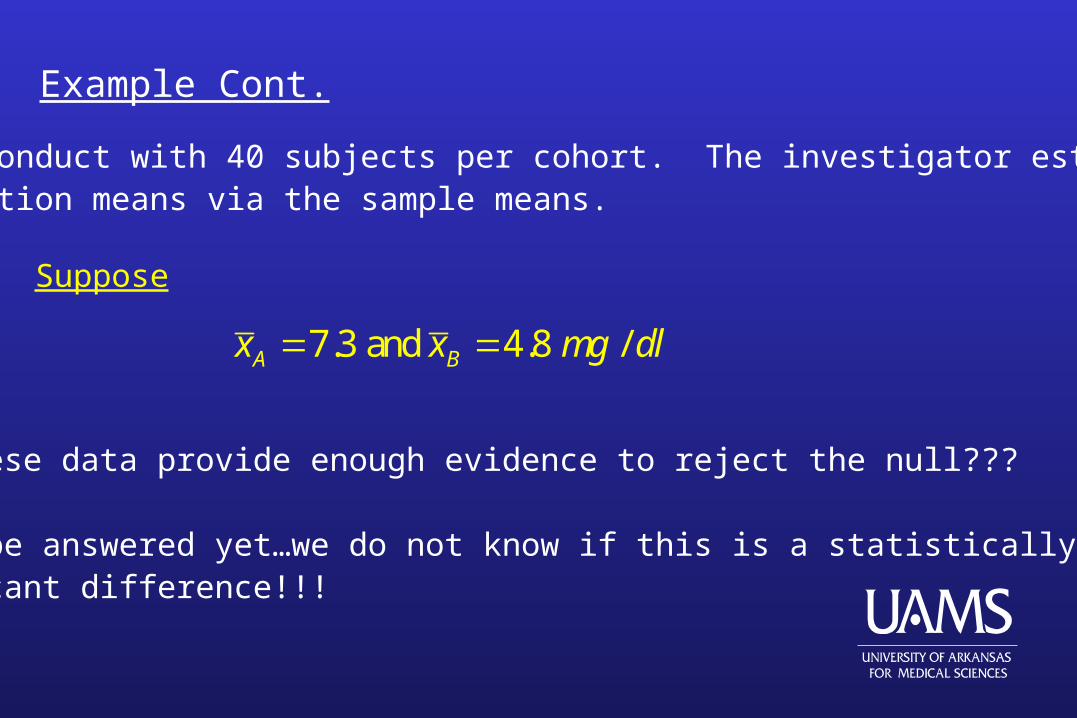
Example Cont.
Study is conduct with 40 subjects per cohort. The investigator estimatesthe population means via the sample means.
Suppose
7.3 and 4.8 /A Bx x mg dl
Does these data provide enough evidence to reject the null???
Cannot be answered yet…we do not know if this is a statisticallysignificant difference!!!
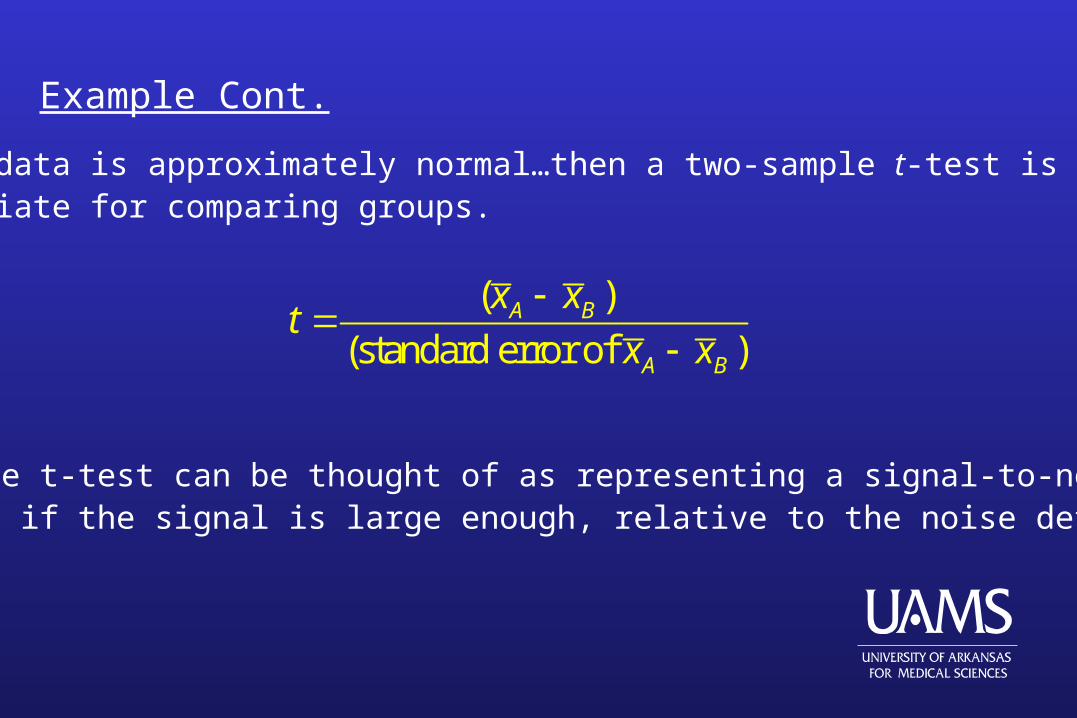
Example Cont.
Assume data is approximately normal…then a two-sample t-test is appropriate for comparing groups.
( )
(standard error of )A B
A B
x xt
x x
The two-sample t-test can be thought of as representing a signal-to-noiseratio and ask if the signal is large enough, relative to the noise detected?
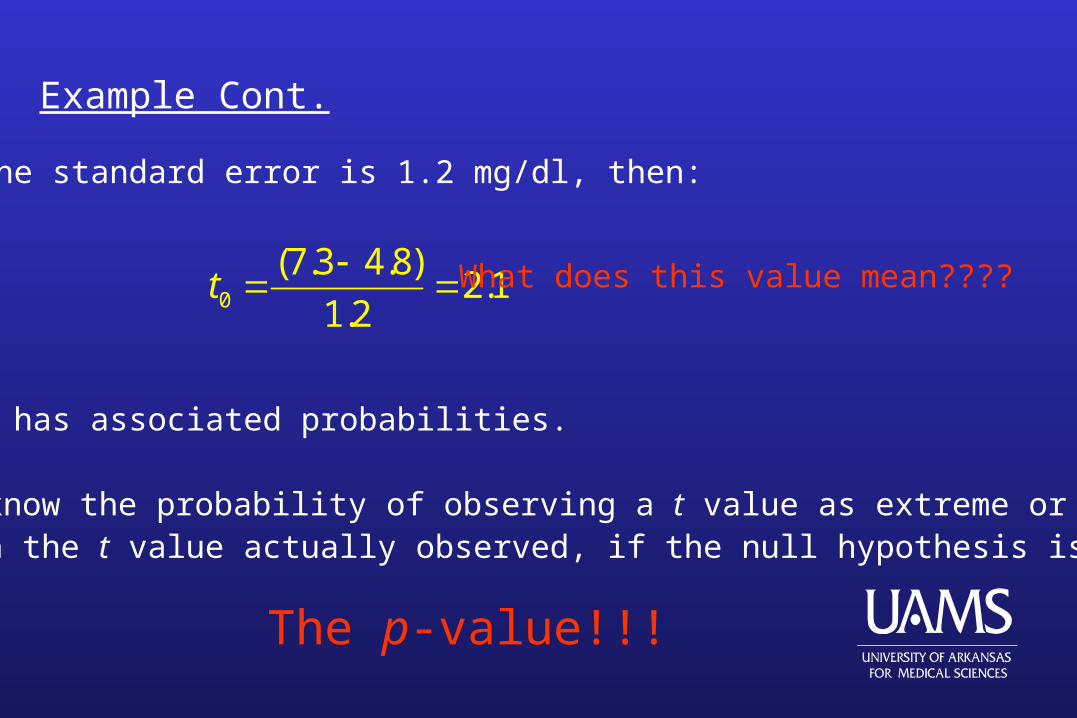
Example Cont.
If the standard error is 1.2 mg/dl, then:
0
(7.3 4.8)2.1
1.2t
What does this value mean????
Each t value has associated probabilities.
We want to know the probability of observing a t value as extreme or moreextreme than the t value actually observed, if the null hypothesis is true.
The p-value!!!
Example Cont.
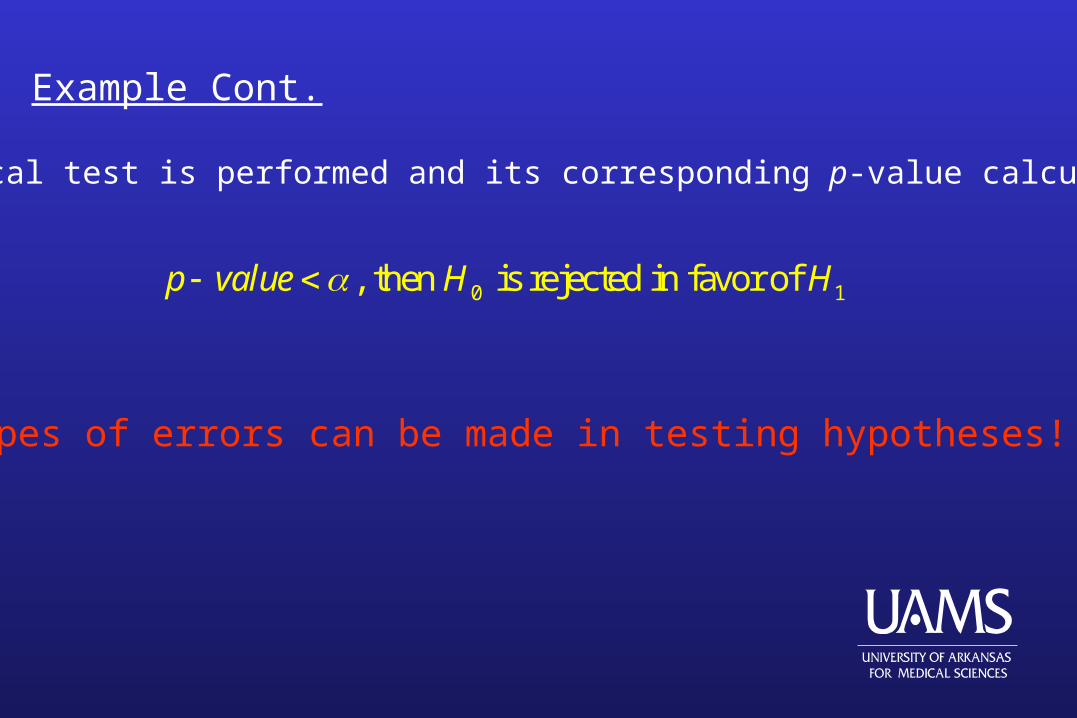
A statistical test is performed and its corresponding p-value calculated.
0 1, then is rejected in favor of p value H H
Two types of errors can be made in testing hypotheses!!!
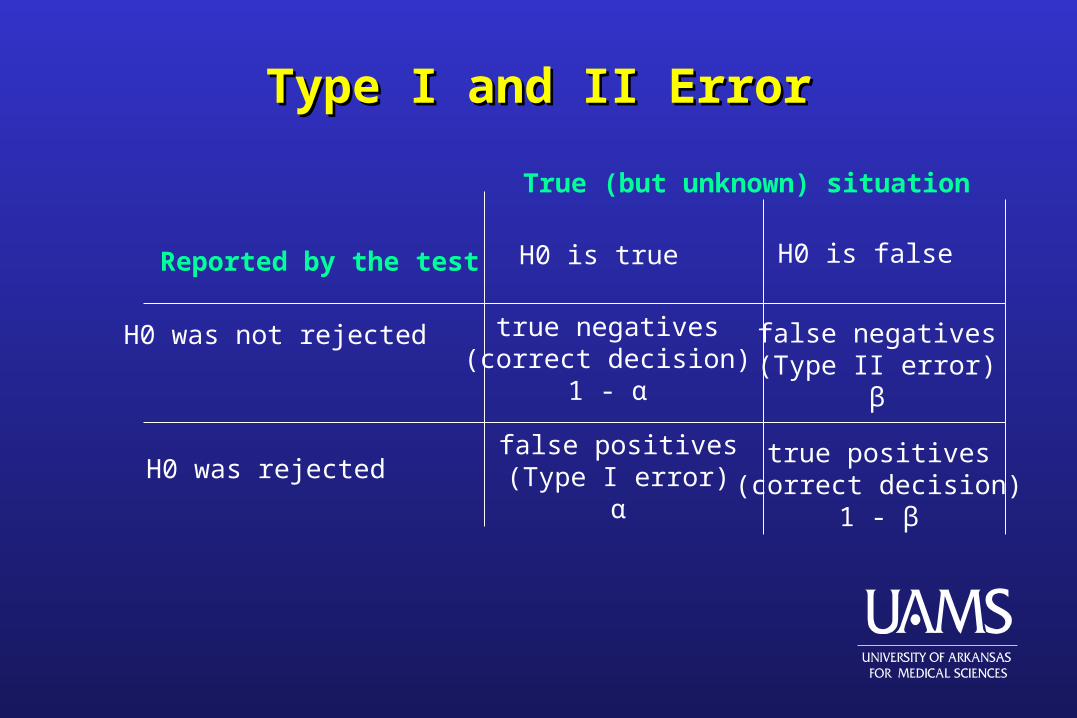
Type I and II ErrorType I and II Error
Reported by the test
H0 was not rejected
H0 was rejected
True (but unknown) situation
H0 is true H0 is false
true negatives(correct decision)
1 - α
true positives(correct decision)
1 - β
false positives(Type I error)
α
false negatives(Type II error)
β
Error and PowerError and Power
The probability of avoiding a Type II error corresponds to correctly rejecting the null when in fact the null hypothesis is false.
This probability is called the power of the test and can be calculated as 1 – β.
Sensitive – refers to a test yielding few false negatives.
Specific – refers to a test yielding few false positives.
For most public health screening programs, sensitive tests are desirable in order to avoid missing any individual with a serious disease who could be helped by the invention.
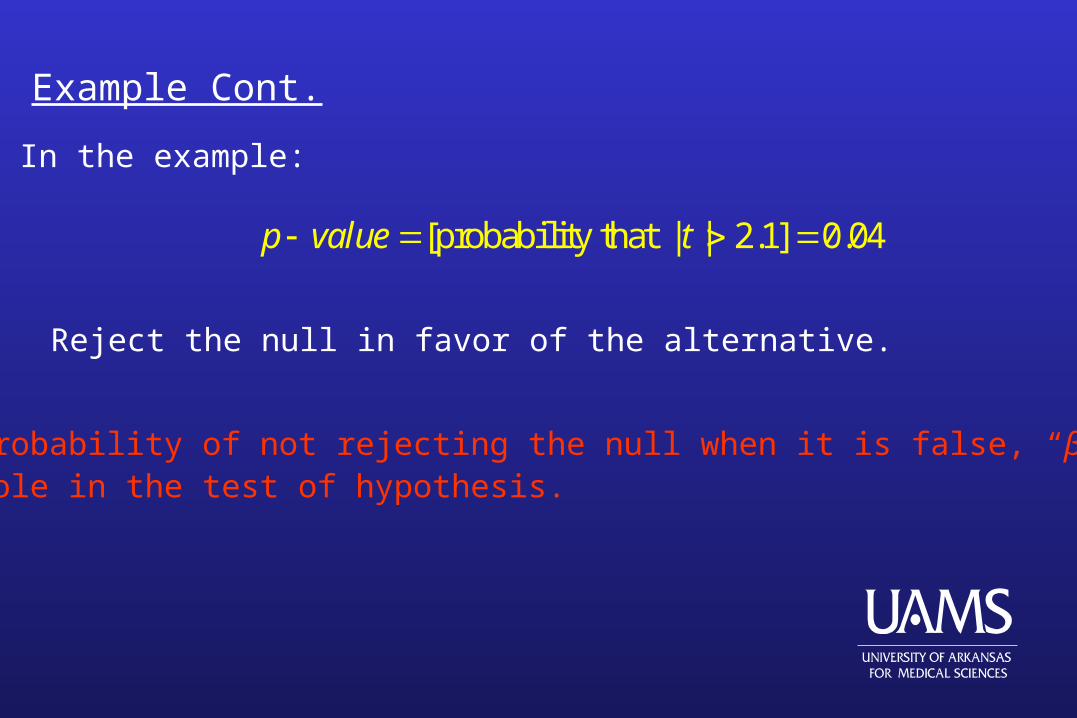
Example Cont.
In the example:
[probability that | | 2.1] 0.04p value t
Reject the null in favor of the alternative.
Note: The probability of not rejecting the null when it is false, “β”, didnot play a role in the test of hypothesis.
““Importance of Importance of ββ””
It is important during the design phase to determine an appropriate sample size for the study.
The investigator has to decide an “effect size” of interest (a clinically meaningful difference between groups A and B in average change in cholesterol at 8 weeks).
The effect size is NOT determine by the statistician.
The statistician can help the researcher decide whether he has the resources to have a reasonable chance of observing the desired effect or should rethink his proposed study design.
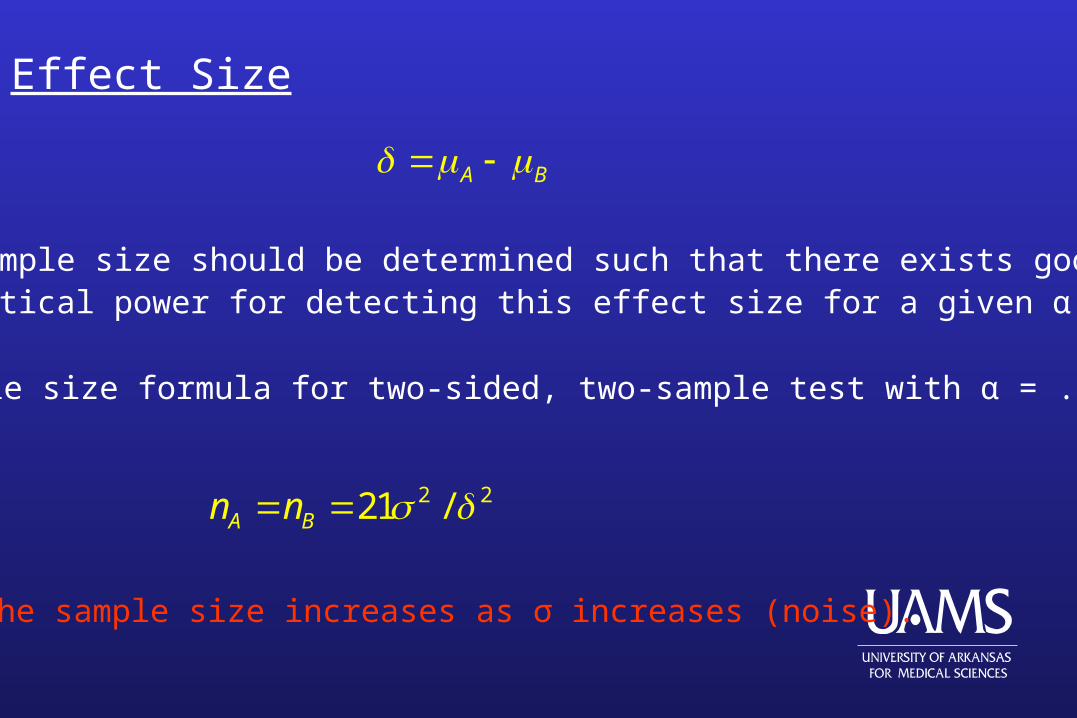
Effect Size
A B
The sample size should be determined such that there exists goodstatistical power for detecting this effect size for a given α.
Basic sample size formula for two-sided, two-sample test with α = .05 andβ = 0.1 is:
2 221 /A Bn n
Note: the sample size increases as σ increases (noise).
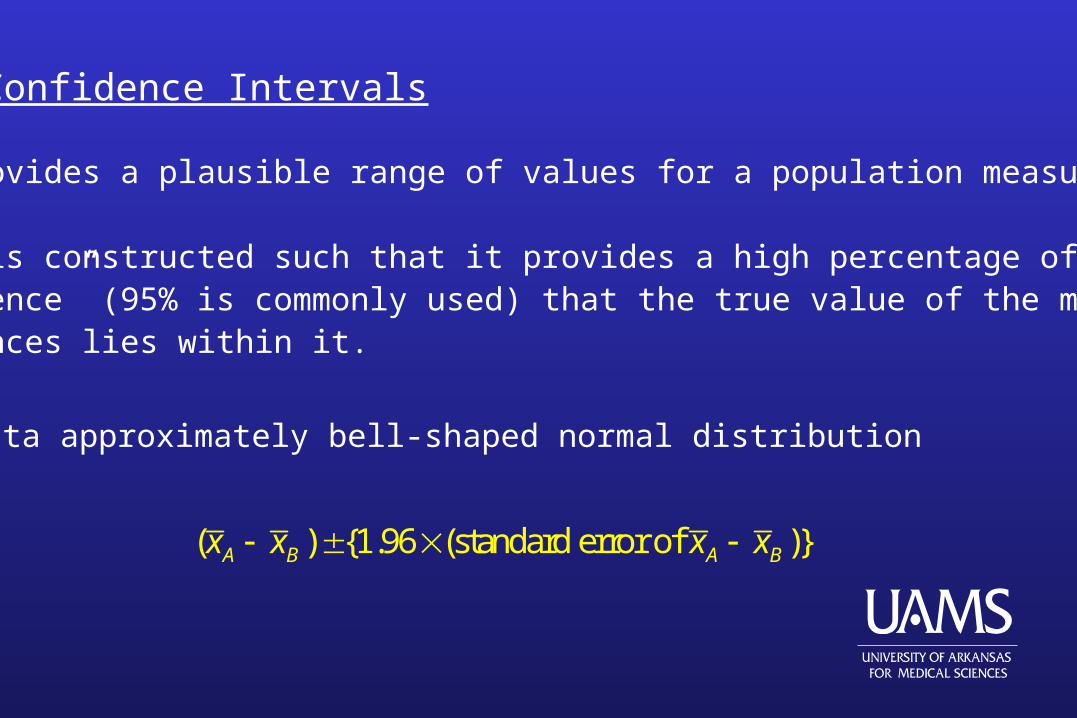
Confidence Intervals
A CI provides a plausible range of values for a population measure.
The CI is constructed such that it provides a high percentage of “confidence” (95% is commonly used) that the true value of the meandifferences lies within it.
For data approximately bell-shaped normal distribution
( ) {1.96 (standard error of )}A B A Bx x x x
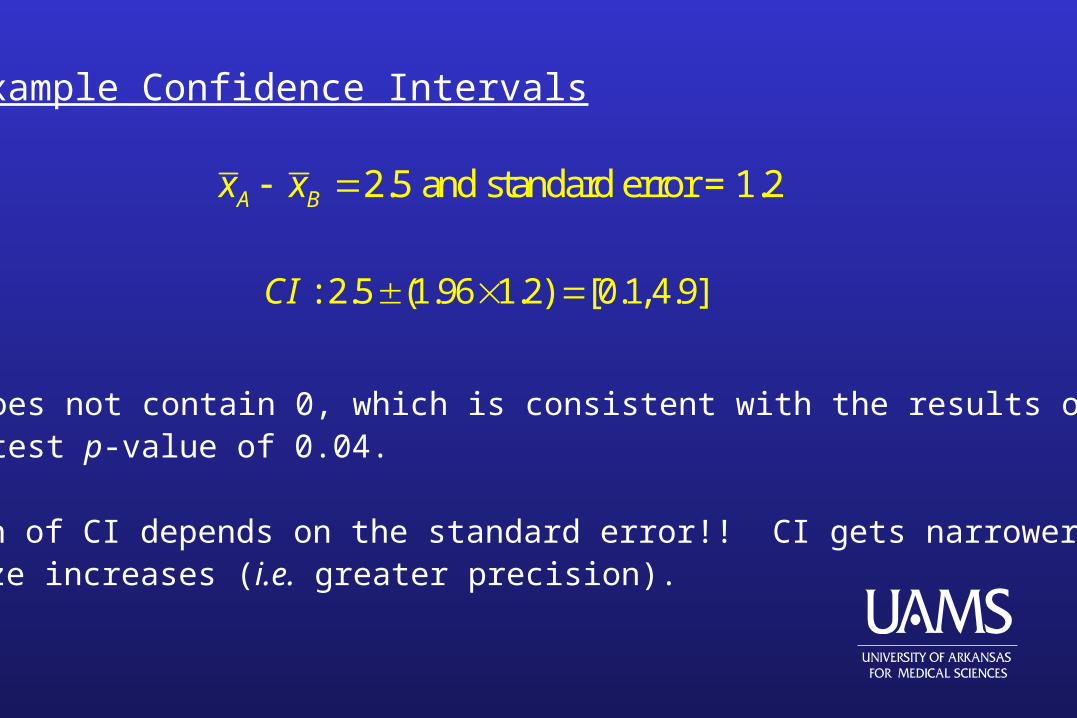
Example Confidence Intervals
2.5 and standard error = 1.2A Bx x
: 2.5 (1.96 1.2) [0.1,4.9]CI
Note: CI does not contain 0, which is consistent with the results of thehypothesis test p-value of 0.04.
The length of CI depends on the standard error!! CI gets narrower assample size increases (i.e. greater precision).
Clinical BiasesClinical Biases
If a bias is small relative to the random error, then we do not expect it to be a large component of the total error.
A strong bias can yield a point estimate that is very distant from the true value.
Investigators seldom know the direction and magnitude of bias, so adjustments to the estimators are not possible.
Common Types of Bias
Selection Bias
Procedure Selection Bias
Post-Entry Exclusion Bias
Bias due to selective loss of data
Assessment Bias
Common Sources of Bias
Assessment method (trained observer / self reporting)
Measurement techniques or devices
Improper assignment of subjects to treatments
Classification of subjects
Selection Bias (1)Selection Bias (1)
Selecting a sample that is not representative of the population because of the method used to select the sample.
In the study cohort this can diminish the external validity of the study findings.
Randomized controls increase internal validity of a study.
Randomization can also provide external validity for treatment group differences.
Selection bias should affect all randomized groups equally, so in taking differences between treatment groups, the bias is removed via subtraction.
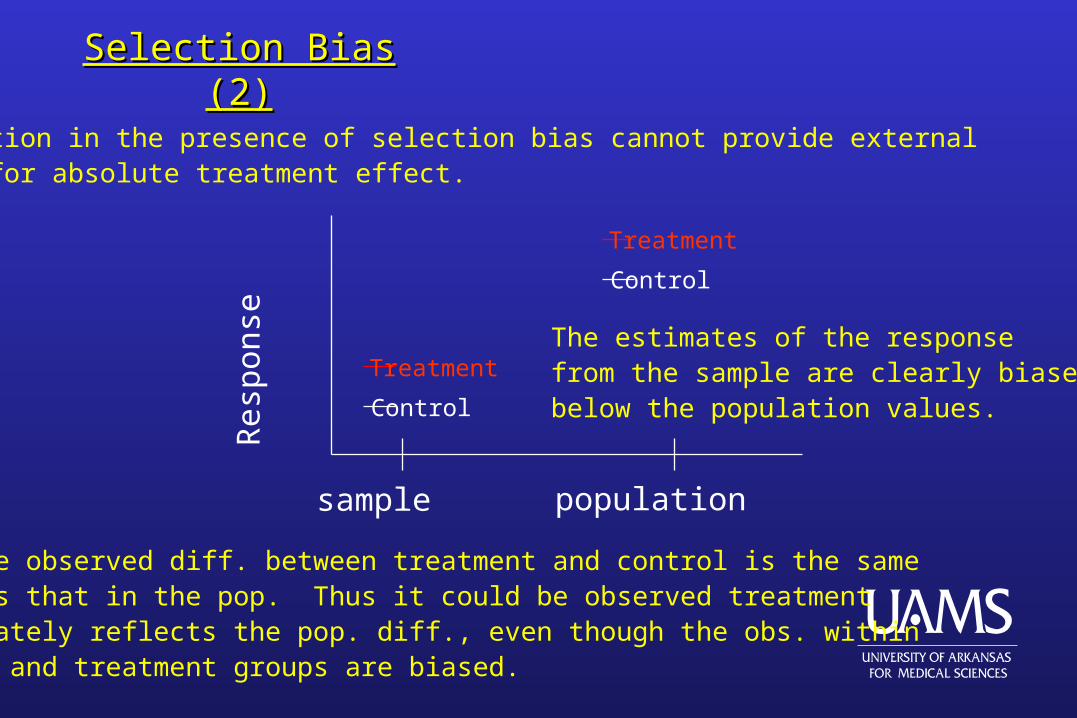
Selection Bias (2)Selection Bias (2)
Randomization in the presence of selection bias cannot provide external validity for absolute treatment effect.
Res
pons
e
Control
Treatment
Control
Treatment
sample population
The estimates of the responsefrom the sample are clearly biasedbelow the population values.
However, the observed diff. between treatment and control is the samemagnitude as that in the pop. Thus it could be observed treatmentdiff. accurately reflects the pop. diff., even though the obs. withinthe control and treatment groups are biased.
Procedure Selection Bias
Likely result when patients or investigators decide on treatment assignment, can lead to extremely large biases.
The investigator may consciously or subconsciously assign particular treatments to specific types of patients.
Randomization is the primary design feature that removes this bias.
Post-Entry Exclusion Bias
Can occur when the exclusion criteria for subjects are modified after examination of some or all of the data.
Some enrolled subjects may be recategorized as ineligible and removed from the study.
Unethical practice.
Bias due to selective loss of data
Related to post-entry exclusion bias. Data from selected subjects are eliminated from the statistical
analyses. Protocol violations may cause an investigator to request an
analysis using only the data with patients who adhered to the protocol.
Statisticians prefer that intention-to-treat analyses be performed as the main statistical analysis.
Statistical Biases
Statistical bias for a point estimator is defined as the difference betweenthe parameter to be estimated and the mathematical expectation of theestimator.
Not accounting for important prognostic factors can bias estimated treatment effects.
Statistical biases can be corrected BUT design flaws lead to biases thatCANNOT be corrected!!!
Statistical Biases
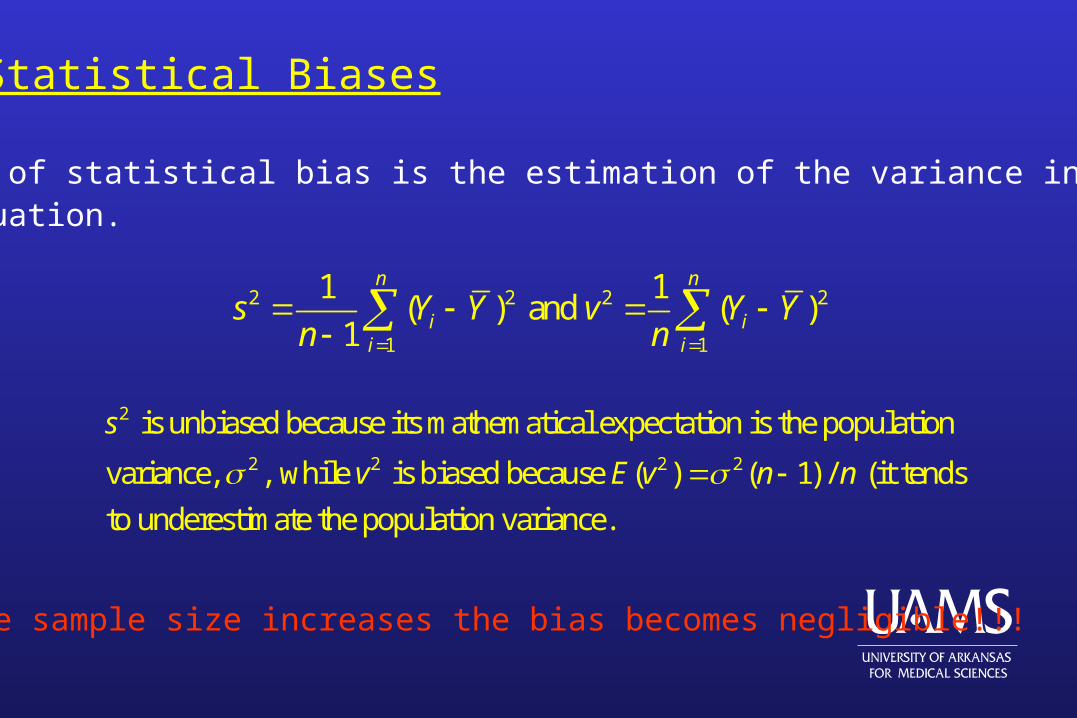
An example of statistical bias is the estimation of the variance in the one-sample situation.
2 2 2 2
1 1
1 1( ) and ( )
1
n n
i ii i
s Y Y v Y Yn n
2
2 2 2 2
is unbiased because its mathematical expectation is the population
variance, , while is biased because ( ) ( 1) / (it tends
to underestimate the population variance.
s
v E v n n
Note: As the sample size increases the bias becomes negligible!!!
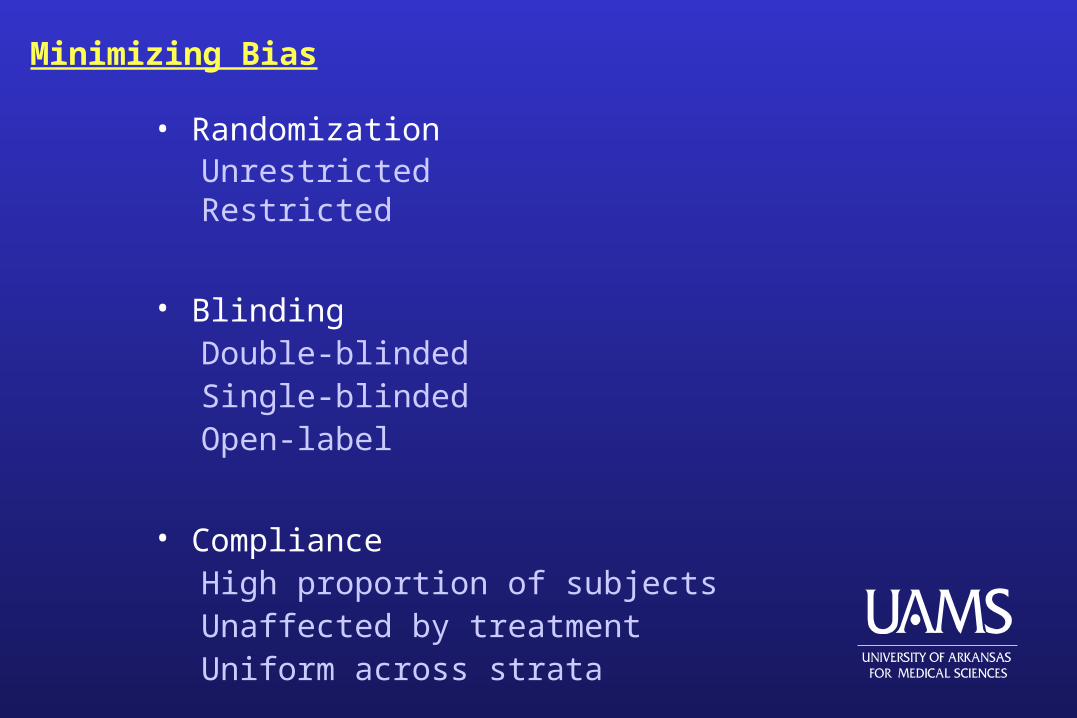
Minimizing Bias
• RandomizationUnrestricted Restricted
• BlindingDouble-blindedSingle-blindedOpen-label
• ComplianceHigh proportion of subjectsUnaffected by treatmentUniform across strata